OCAP BA Appendix D August 2008 D-1 Appendix D CalSim-II Model CalSim-II Software CalSim-II was developed using the Water Resources Integrated Modeling Software (WRIMS), which is an optimization linear programming (LP)/mixed integer linear programming (MILP) solver that determines an optimal set of decisions for each time period given a set of weights and system constraints. The physical description of the system is expressed through a user interface with tables outlining the system characteristics. The priority weights and basic constraints are also entered in the system tables. The programming language used, Water Resources Engineering Simulation Language (WRESL), serves as an interface between the user and the LP/MILP solver, time-series database, and relational database. Specialized operating criteria are expressed in WRESL. Key Processes CalSim-II is a planning model developed by the Department of Water Resources (DWR) and the U.S. Bureau of Reclamation (Reclamation). It simulates the State Water Project (SWP) and the Central Valley Project (CVP) and areas tributary to the Sacramento-San Joaquin Delta. CalSim- II provides quantitative hydrologic-based information to those responsible for planning, managing and operating the State Water Project (SWP) and the federal CVP. As the official model of those projects, CalSim-II is typically the system model that is used for any inter- regional or statewide analysis in California. CalSim-II uses described optimization techniques to route water through a CVP-SWP system network representation. The network includes over 300 nodes and over 900 arcs, representing 24 surface reservoirs and the interconnected flow system. The model operates on a monthly time step from water year 1992 through 2003. Using historical rainfall and runoff data, which has been adjusted for changes in water and land use that have occurred or may occur in the future, the model simulates the operation of the water resources infrastructure in the Sacramento and San Joaquin river basins on a month-to-month basis during this 82-year period. In the model, the reservoirs and pumping facilities of the SWP and CVP are operated to assure the flow and water quality requirements for these systems are met. The model assumes that facilities, land use, water supply contracts, and regulatory requirements are constant over 82 years from 1922 to 2003, representing a fixed level of development. The model operates in six or seven steps to simulate the different regulatory regimes: D1485, D1641, B2, Joint Point of Diversion (JPOD), EWA, and EWA2 if needed. OCAP Study 7.0 is a 6-step study, incorporating a full EWA representation with the same set of assets and actions developed for the Common Assumptions Model Common Model Package. OCAP Studies 7.1 and 8.0 use a 7-step limited EWA representation where the only purchase is from the Yuba Basin, export actions are confined to the VAMP- and possibly post-VAMP May shoulder periods, and the size of the actions are tailored to the available asset so as to discourage any occurrence of carry over storage debt at San Luis.
Transcript
OCAP BA Appendix D
August 2008 D-1
Appendix D CalSim-II Model
CalSim-II Software CalSim-II was developed using the Water Resources Integrated Modeling Software (WRIMS), which is an optimization linear programming (LP)/mixed integer linear programming (MILP) solver that determines an optimal set of decisions for each time period given a set of weights and system constraints. The physical description of the system is expressed through a user interface with tables outlining the system characteristics. The priority weights and basic constraints are also entered in the system tables. The programming language used, Water Resources Engineering Simulation Language (WRESL), serves as an interface between the user and the LP/MILP solver, time-series database, and relational database. Specialized operating criteria are expressed in WRESL.
Key Processes CalSim-II is a planning model developed by the Department of Water Resources (DWR) and the U.S. Bureau of Reclamation (Reclamation). It simulates the State Water Project (SWP) and the Central Valley Project (CVP) and areas tributary to the Sacramento-San Joaquin Delta. CalSim-II provides quantitative hydrologic-based information to those responsible for planning, managing and operating the State Water Project (SWP) and the federal CVP. As the official model of those projects, CalSim-II is typically the system model that is used for any inter-regional or statewide analysis in California. CalSim-II uses described optimization techniques to route water through a CVP-SWP system network representation. The network includes over 300 nodes and over 900 arcs, representing 24 surface reservoirs and the interconnected flow system.
The model operates on a monthly time step from water year 1992 through 2003. Using historical rainfall and runoff data, which has been adjusted for changes in water and land use that have occurred or may occur in the future, the model simulates the operation of the water resources infrastructure in the Sacramento and San Joaquin river basins on a month-to-month basis during this 82-year period. In the model, the reservoirs and pumping facilities of the SWP and CVP are operated to assure the flow and water quality requirements for these systems are met. The model assumes that facilities, land use, water supply contracts, and regulatory requirements are constant over 82 years from 1922 to 2003, representing a fixed level of development.
The model operates in six or seven steps to simulate the different regulatory regimes: D1485, D1641, B2, Joint Point of Diversion (JPOD), EWA, and EWA2 if needed.
OCAP Study 7.0 is a 6-step study, incorporating a full EWA representation with the same set of assets and actions developed for the Common Assumptions Model Common Model Package. OCAP Studies 7.1 and 8.0 use a 7-step limited EWA representation where the only purchase is from the Yuba Basin, export actions are confined to the VAMP- and possibly post-VAMP May shoulder periods, and the size of the actions are tailored to the available asset so as to discourage any occurrence of carry over storage debt at San Luis.
Appendix D OCAP BA
D-2 August 2008
The results from the final case of the position analysis (EWA or EWA2) is accepted as the end-of-year system state, and serve as the initial conditions for each of the cases in the following year’s analysis. The general modeling procedure is outlined below, and shown in Figure 1:
1. Run the D1641 simulation for Oct-Sep of the current water year.
2. Run the D1485 simulation for Oct-Sep of the current water year and compute annual water costs for implementing D1641 operations relative to D1485 operations (i.e., Water Quality Control Plan [WQCP] costs).
3. Run the B2 simulation for Oct-Sep of the current water year, dynamically accounting for the (b)(2) account balance with knowledge of annual WQCP costs, and implementing fish protection actions according to preferences defined for OCAP.
4. Run the CONV simulation for Oct-Sep of the current water year, repeating B2 actions from Step 3, assessment of JPOD capacity, and simulated CVP usage of 50 percent of JPOD capacity.
5. Run the TXFR simulation for the Oct-Sep of the current year, reflecting transfer operations.
6. Run the EWA simulation for Oct-Sep of the current water year, repeating B2 actions from Step 3, repeating CVP usage of 50 percent of JPOD capacity from Step 4, taking EWA actions, comparing Step 4 and 5 results to assess EWA debt, and managing EWA debt through acquisition and application of assets (e.g., SWP transfer or 50 percent of B2 gains to EWA, EWA usage of 50 percent of JPOD capacity, fixed purchases north and south of Delta).
7. Run the EWA2 simulation to use the limited EWA representation (Study 7.1 and 8.0 only)
8. Accept the state of the system from the end of September in Step 6 or 7 as the initial condition for the following year’s analysis cases (i.e., D1641, D1485, B2, JPOD, and EWA).
Repeat all above steps for every year of the period of record.
OCAP BA Appendix D
August 2008 D-3
Figure 1. CalSim-II Procedure to Simulate EWA Operations (Study 7.0 only uses the first six steps)
Hydrology Reservoir inflows, stream gains, diversion requirements, irrigation efficiencies, return flows and groundwater operation are all components of the hydrology for CalSim-II.
Annual CalSim-II Step Procedure: Oct-Sep
Order of Steps 1 & 2 does not matter
Step 1:
D1641
Step 2:
D1485
Step 3:
B2
Step 4: CONV (JPOD)
Step 5:
TXFR
Step 6:
EWA
Step 7:
EWA2
Initial Conditions
Store end of September conditions for the next year’s initial conditions Limited EWA
Full EWA
Appendix D OCAP BA
D-4 August 2008
The monthly step simulations are conducted over the 82-year period (1922 – 2003) of the adjusted historical rainfall/runoff data. This approach incorporates the over-arching assumption that the next 82 years will have the same rainfall/snowmelt amount and pattern, both within-year and from year to year, as the period 1922 through 2003.
Demands Demands are preprocessed independent of CalSim-II and may vary according to the specified level of development (e.g. 2005, 2030) and according to hydrologic conditions. They are typically input into the model as a monthly time series. Demands are classified as CVP project, SWP project, local project or non-project. CVP and SWP demands are separated into different classes based on contract type.
Table 1. Summary of SWP and CVP Demands (TAF/Year)
Project North Of Delta South of Delta
Existing
CVP Contracts
• Settlement/Exchange 2,194 840
Water Service Contracts
• Agriculture 378 1,927
• M&I1 356 164
• Refuges 157 305
SWP Contracts
• Feather River Service Area 796 0
• Agriculture 0 1,048
• M&I 108 3,008
Future
CVP Contracts
• Settlement/Exchange 2,194 840
Water Service Contracts
• Agriculture 378 1,937
• M&I1 557 164
1 North of Delta CVP M&I demands include Delta demands
OCAP BA Appendix D
August 2008 D-5
• Refuges 189 281
SWP Contracts
• Feather River Service Area 796 0
• Agriculture 0 1,032
• M&I 114 3,024
Agricultural Demands Demands in the Sacramento River Basin (including the Feather and American River basins) and Delta are determined based on land use and vary by month and year according to hydrologic conditions. Land use-based demands are calculated using the Consumptive Use (CU) model. The model simulates soil moisture conditions for 13 different crop types over the historical period.
Irrigation demand is triggered when soil moisture falls below a specified minimum. The CU model calculates the crop consumptive use of applied water. The consumptive use is subsequently multiplied by water use efficiency factors to obtain a regional water requirement to be met from stream diversions or groundwater pumping. Agricultural demands in the Delta are represented more simply as an overall mass balance between precipitation and crop evapotranspiration.
CVP and SWP agricultural demands south of the Delta are based on contract amounts. CVP demands south of the Delta are assumed to be fixed at maximum contract amount and do not vary year to year. SWP agricultural demands in the San Joaquin Valley are capped to the full assigned amount, but are reduced in wetter years using an index developed from annual Kern River inflows to Lake Isabella.
In CalSim-II non-recoverable losses are assumed to be 10 to 15 percent of the crop consumptive use of applied water. Non-recoverable loss factors are used to determine the portion of the supply that will return to the system as surface return flow or as deep percolation to groundwater. Efficiency factors may vary by month and by year.
M&I Demands Indoor urban water use is considered non-consumptive and is ignored by the model. Outdoor urban water use is treated as an irrigation demand and is combined with the agricultural demands. M&I diversions, although not entirely consumptive, can have a large influence on reservoir operations.
However, both indoor and outdoor M&I surface water diversions have therefore been included in CalSim-II for the American and Lower Sacramento River areas because they partially determine the operation of Folsom Lake. Outdoor urban demand is calculated by the CU model, with the
Appendix D OCAP BA
D-6 August 2008
irrigated area computed as a fixed fraction of the total urban area as measured by DWR in land use surveys.
CVP and SWP south of Delta M&I demands are based on contract amounts. CVP demands are assumed to equal contract amounts and do not vary. SWP M&I demands south of the Delta are split into Metropolitan Water District of Southern California (MWDSC) and others. MWDSC demands are either set at full contract amounts or are determined through a process of iteration between CalSim-II and MWDSC’s integrated resource planning simulation (IRPSIM) model, and vary from year to year. Other SWP M&I contractors’ demands are fixed at their full designated amount.
Project/Non-Project Split Demands are disaggregated in CalSim-II into project demands and non-project demands. Project demands are subject to reduced water allocations based on CVP and SWP contract provisions, while non-project demands are satisfied from sources other than project storage and project conveyance facilities and are reduced as a function of water availability in the absence of project operations. For each Depletion Study Area (DSA), project demands are calculated as a fixed percentage of the total land use-based demand. The split between project and nonproject demands was determined by comparing project acreage within each DSA to the total crop acreage within the DSA.
Environmental Water Requirements Environmental water requirements such as minimum reservoir storage requirements, minimum in-stream flows and deliveries to national wildlife refuges, and wildlife management areas that are stipulated in current regulatory requirements and discretionary interagency agreements are included in the model where appropriate. See Section g. for a description of regulatory requirements.
Allocation Decisions The water allocation process must consider the various categories of water demands and the contractual amounts and deficiency criteria associated with each. These water demands may be categorized as follows: (1) Water Rights Settlement Agreements; (2) Municipal and Industrial Water Service Contracts; (3) Legislative Mandates; (4) Agricultural Water Service Contracts; and (5) Delivery Losses.
CalSim-II uses allocation logic for determining deliveries to north-of-Delta and south-of-Delta CVP and SWP contractors. The delivery logic uses runoff forecast information, which incorporates uncertainty and standardized rule curves (i.e. Water Supply Index versus Demand Index Curve). The rule curves relate forecasted water supplies to deliverable “demand,” and then use deliverable “demand” to assign subsequent delivery levels to estimate the water available for delivery and carryover storage. Updates of delivery levels occur monthly from January 1 through May 1 for the SWP and March 1 through May 1 for the CVP as runoff forecasts become more certain. The south-of-Delta SWP delivery is determined based on water supply parameters and operational constraints. The CVP system wide delivery and south-of-Delta delivery are
OCAP BA Appendix D
August 2008 D-7
determined similarly upon water supply parameters and operational constraints with specific consideration for export constraints.
Reservoir System Operation The CalSim-II model represents reservoirs and channels as a network of nodes and arcs. Water storage and release decisions are made through arcs. Weights on the decision variables encourage (positive weight) or discourage (negative weight) the solver to allocate water to the specified variable. The weight is a measure of the relative allocation priority for consumptive or non-consumptive uses. Storage arc zones are weighted separately to describe the operation rules of a reservoir in concert with upstream and downstream water uses.
CalSim-II requires operating rules to release flows to meet water demands and water quality standards. Reservoirs are operated through the year using rule curves that represent the desired storage levels according to flood-space filling requirements. The rule curves have been derived from historic hydrologic conditions and hence may not be appropriate if there are significant changes to system operations or changes from the historical reservoir inflow hydrology.
Each reservoir node is divided into five zones representing operational volumes. In general the zones are dead pool, lower conservation pool, intermediate conservation pool, upper conservation pool, and flood control pool. The maximum reservoir release is determined by the hydraulic properties of the outlet works and may be expressed as a piece-wise linear function of storage.
Reservoirs provide flood control space during the winter wet season, when they need to have flood space requirements. This flood control space requirement limits the amount of water stored during the wet season.
CalSim-II sets targets for San Luis storage each month that are dependent on the current South of Delta allocation and upstream reservoir storage. When upstream reservoir storage is high, allocations and San Luis fill targets are increased. During a prolonged drought when upstream storage is low, allocations and fill targets are correspondingly low.
Delta The State Water Resources Control Board (SWRCB) specifies water quality standards for the Delta. Currently the CVP and SWP share the obligation to meet these standards as defined by the Coordinated Operation Agreement. Salinity standards must be translated into flow equivalents to be modeled in CalSim-II. However flow-salinity relationships in the Delta are non-linear. CalSim-II uses DWR’s Artificial Neural Network (ANN) model to simulate the flow-salinity relationships for the Delta by estimating the salinity at water quality stations in the Delta. The ANN model correlates DWR’s Delta Simulation Model (DSM2) model-generated salinity at key locations in the Delta with Delta inflows, Delta exports, and Delta Cross Channel operations by estimating electrical conductivity at the following four locations for the purpose of modeling Delta water quality standards: Old River at Rock Slough, San Joaquin River at Jersey Point, Sacramento River at Emmaton, and Sacramento River at Collinsville. In its estimates, the ANN model considers antecedent conditions up to 148 days, and considers a “carriage-water” type of effect associated with Delta exports.
Appendix D OCAP BA
D-8 August 2008
CalSim-II passes antecedent (previous month) flow conditions and known (or estimated) current month flows to an ANN dynamic link library (DLL). The DLL returns coefficients for a linear constraint that binds Sacramento River Delta inflows to Delta exports based on a piecewise linear approximation of the flow-salinity relationship.
Surface Water/Groundwater Interaction Groundwater has only a limited representation in CalSim-II. Modeling groundwater in CalSim-II has evolved from the simpler Depletion Analysis approach to the current multiple-cell approach used in the Sacramento Valley. Within the Sacramento Valley floor, groundwater is explicitly modeled in CalSim-II using a multiple-cell approach based on depletion study area boundaries. There are a total of 12 groundwater cells. Stream-aquifer interaction, groundwater pumping, recharge from irrigation and sub-surface flow between groundwater cells are calculated dynamically. All other groundwater flow components are preprocessed and represented in CalSim-II as a fixed time series. In areas of high groundwater, CalSim-II calculates groundwater inflow to the stream as a function of the groundwater head and stream stage. In areas of low groundwater elevation where the groundwater table lies below the streambed, CalSim-II assumes a hydraulic disconnect between the stream and aquifer. In this case seepage is only a function of stream stage.
Regulatory Conditions Water Rights The SWRCB Water Quality Control Plan (WQCP) and other applicable water rights decisions, as well as other agreements are important factors in determining the operations of both the Central Valley Project (CVP) and the State Water Project (SWP).
Historically, approximately 90 percent of the CVP water has been delivered to agricultural users, including prior water rights holders. Total annual contracts exceed 9 million acre-feet per year, including over 1 million acre-feet per year of Friant Division Class II supply, which is generally available only in wet years. The CVP also delivers water from the San Joaquin River to CVP contractors and water right holders located along the Madera and Friant Kern canals. Water from New Melones Reservoir is used by water rights holders in the Stanislaus River watershed and CVP contractors located in the northern San Joaquin Valley. In addition, water is conveyed via the Sacramento and American rivers to CVP contractors, water rights holders along the Sacramento and American rivers.
The SWP delivers water to water rights holders in the Feather River Service Area (FRSA) prior to meeting its other contracts. The contract entitlement in CalSim-II for the FRSA water rights holders downstream of Lake Oroville is 948 taf/yr in non-drought years, this can drop to 630 taf/yr when deficiencies of up to 50 percent are imposed in “drought” years on some parts of the contract amount. The historical 24-year average annual SWP deliveries to the FRSA including the senior water rights holders downstream of Lake Oroville are 840 taf/yr. CalSim-II represents this by imposing 50 percent deficiencies in 1977, 1988 and 1991. In non-drought years the land use-based demand is usually significantly less than the contract entitlement.
OCAP BA Appendix D
August 2008 D-9
Water Service Contracts and Deliveries The CVP has 253 water service contracts consisting of settlement contracts, agricultural water service contracts, urban water service contracts, and refuge requirements. CVP contracts south of the Delta consist of exchange contracts, agricultural service contracts, and M&I service contracts.
The SWP has 29 long-term contracts for water supply totaling about 4.2 million acre-feet annually, of which about 4.1 million acre-feet are for contracting agencies with service areas south of the Sacramento-San Joaquin Delta. About 70 percent of this amount is the contract entitlement for urban users and the remaining 30 percent for agricultural users. CalSim-II allocations are set per the Monterey Agreement criteria, which imposes any deficiencies equally between agricultural and M&I requests as a percentage. PDF Attachments D-1 and D-2, provide tables showing CVP and SWP contract amounts for Study 7.0 and Study 8.0 respectively. Study 7.1 assumptions are the same as Study 7.0 with the exception of Freeport Regional Water Project demands.
Coordinated Operations Agreement (COA) The COA is both an operations agreement and a water rights settlement defined by the SWRCB Decision 1485. Decision 1485 ordered the CVP and SWP to guarantee certain conditions for water quality protection for agricultural, M&I, and fish and wildlife use.
The purpose of the COA is to ensure that the CVP and the SWP each obtains its share of water from the Delta and bears its share of obligations to protect the other beneficial uses of water in the Delta and Sacramento Valley. Coordinated operation by agreed-on criteria can increase the efficiency of both the CVP and the SWP.
COA Sharing Formulas are used as constraints in the LP formulation within the model. These formulas or constraints ensure that the COA is maintained in the model. CalSim-II uses mixed integer programming to determine in which of the two possible conditions the model is operating under for the given month: Balanced Water Conditions or Excess Water Conditions.
CVPIA 3406(b)(2) Operations According to the 1992 Central Valley Project Improvement Act (CVPIA), the CVP must “dedicate and manage annually 800,000 acre-feet of Central Valley Project yield for the primary purpose of implementing the fish, wildlife, and habitat restoration purposes and measures authorized by this title; to assist the State of California in its efforts to protect the waters of the San Francisco Bay/Sacramento-San Joaquin Delta Estuary; and to help to meet such obligations as may be legally imposed upon the Central Valley Project under State or Federal law following the date of enactment of this title, including but not limited to additional obligations under the Federal Endangered Species Act.” This dedicated and managed water, or (b)(2) water as it is called, is water that the U.S. Fish and Wildlife Service (FWS), in consultation with Reclamation and other agencies, has at its disposal to use to meet the primary restoration purposes of CVPIA 3406(b)(2), the CVP’s WQCP obligations and any legal requirements imposed on the CVP after
Appendix D OCAP BA
D-10 August 2008
1992. CVPIA 3406 (b)(2) water may be managed to augment river flows and also to curtail pumping in the Delta to supplement the WQCP requirements.
To simulate the 3406 (b)(2) accounting, the model uses metrics calculated in the (b)(2) simulation step. The metrics measure the flow increases and export decreases from D1485 to D1641 WQCP Costs, and from D1485 to (b)(2), total (b)(2) costs. The following assumptions were used to model the May 2003 3406 (b)(2) Department of the Interior decision.
1. Allocation of (b)(2) water is 800,000 acre-feet per year (af/yr), 700,000 af/yr in 40-30-30 Dry Years, and 600,000 af/yr in 40-30-30 Critical years.
2. Upstream flow metrics are calculated at Clear Creek, Keswick, Nimbus, and Goodwin Reservoirs where (b)(2) water can be used to increase flow for fishery purposes. For OCAP BA modeling purposes, CVPIA (b)(2) accounting of Goodwin releases and volumes are independently determined based on Stanislaus River water availablity and New Melones water allocation estimates. The assumptions used in CalSim-II for taking an upstream action at one of the previously mentioned reservoirs are:
• October-January
o Clear Creek Releases: Action is on if Trinity Beginning of Month Storage >600,000 af.
o Keswick Releases: Action is on if Shasta Beginning-of-Month Storage > 1,900,000 af.
o Nimbus Releases: Action is on if Folsom Beginning-of-Month Storage > 300,000 af.
o For all releases, if the 200,000-af target is projected to be violated the model will try to reduce the magnitude of the actions in December and/or January.
• February-September
o Clear Creek Releases: Action is on if Trinity Beginning-of-Month Storage >600,000 af.
o Keswick Releases: Action is on if Shasta Beginning-of-Month Storage > 1,900,000 af and if remaining (b)(2) account > projected coming WQCP costs.
o Nimbus Releases: Action is on if Folsom Beginning-of-Month Storage > 300,000 af and if remaining (b)(2) account > projected coming WQCP costs.
3. The export metric is the change in total CVP pumping (Jones + CVP Banks) from the base case (D1485). Assumptions used in CalSim-II for taking a delta action are:
• Winter Actions (December through February) and Pre-Vernalis Adaptive Management Plan (VAMP) (April Shoulder) actions are off.
• VAMP Actions: Always taken and done at a 2:1 (Vernalis flow to CVP pumping ratio) ratio if non-VAMP Vernalis flows are greater than 8,600 cubic feet per second (cfs).
OCAP BA Appendix D
August 2008 D-11
• May Shoulder: Action turned on if the remaining (b)(2) is greater than or equal to the discounted remaining WQCP cost + anticipated Clear Creek cost (25,000 af). DISCOUNT = If the annual WQCP cost > 500,000 af, the difference is subtracted from the remaining WQCP cost.
• June Ramping: Action turned on if the remaining (b)(2) is greater than or equal to the discounted remaining WQCP cost + anticipated Clear Creek cost (20,000 af).
• Both May Shoulder and June Ramping are further restricted to stay within the remaining (b)(2)account – remaining WQCP costs.
Joint Point of Diversion Joint Point of Diversion (JPOD) is used to describe the ability of SWP to wheel water for the CVP through Banks Pumping Plant when unused capacity exists. In theory, the term is also used for the wheeling of SWP water through CVP facilities, but due to the capacity limitations on Jones Pumping Plant it is rare to find this direction of wheeling. JPOD is available to the CVP under (1) surplus conditions when the SWP has filled San Luis and satisfied it’s Article 21 demand and under (2) balanced conditions when the SWP has satisfied it’s target storage in San Luis and no longer wishes to move Oroville water to San Luis. SWP wheeling for the CVP Cross-Valley Canal users is simulated in all simulations under these conditions. Additional CVP use of Banks Pumping Plant (JPOD) is currently only modeled in the JPOD and EWA simulations.
D-1641 Operations The December 1994 Accord committed the CVP and SWP to a set of Delta habitat protective objectives that were incorporated into the 1995 WQCP and later, along with the Vernalis Adaptive Management Program (VAMP), were implemented by D-1641. The actions the CVP and SWP take in implementing D-1641 significantly reduced the export water supply of both projects. Significant elements in the D-1641 standards include X2 standards, export/inflow (E/I) ratios, real-time Delta Cross Channel operation, San Joaquin flow standards. A discussion of the X2 implementaion is presented in Attachment 3.
Minimum Flow for Navigation – Wilkins Slough Historical commerce on the Sacramento River resulted in the requirement to maintain minimum flows of 5,000 cfs at Chico Landing to support navigation. There is currently no commercial traffic between Sacramento and Chico Landing, and Corps has not dredged this reach to preserve channel depths since 1972. However, long-time water users diverting from the river have set their pump intakes just below this level. Therefore, the CVP is operated to meet the navigation flow requirement of 5,000 cfs to Wilkins Slough (gauging station on the Sacramento River) under all but the most critical water supply conditions to facilitate pumping.
Appendix D OCAP BA
D-12 August 2008
SWRCB Water Rights Order 90-05 and Water Rights Order 91-01 In 1990 and 1991, SWRCB issued Water Rights Orders 90-05 and 91-01 modifying Reclamation’s water rights for the Sacramento River. The orders included a narrative water temperature objective for the Sacramento River and stated that Reclamation shall operate Keswick and Shasta Dams and the Spring Creek Powerplant to meet a daily average water temperature of 56ºF at RBDD in the Sacramento River during periods when higher temperatures would be harmful to fisheries.
Under the orders, the water temperature compliance point may be modified when the objective cannot be met at RBDD. In addition, Order 90-05 modified the minimum flow requirements initially established in the 1960 MOA for the Sacramento River below Keswick Dam.
Flood Control Flood control objectives for Shasta Lake require that releases be restricted to quantities that will not cause downstream flows or stages to exceed specified levels. These include a flow of 79,000 cfs at the tailwater of Keswick Dam, and a stage of 39.2 feet in the Sacramento River at Bend Bridge gauging station, which corresponds to a flow of approximately 100,000 cfs. Maximum flood space reservation is 1.3 million acre-feet, with variable storage space requirements based on an inflow parameter.
Storage in Lake Oroville must be lowered every year to make room for the winter rains and spring snowmelt that could cause flooding. Monthly flood control space requirements are provided by the U. S. Army Corps of Engineers for flood control operation of Lake Oroville. In all but four months (May, June, July, and August) flood control space is provided based on antecedent precipitation and ground wetness conditions.
Flood control requirements and regulating criteria are specified by Corps and described in the Folsom Dam and Lake, American River, California Water Control Manual (Corps, 1987). Flood control objectives for Folsom require that the dam and lake are operated to: (1) reduce flooding along the lower Sacramento River and in the Delta in conjunction with other CVP projects; (2) Provide the maximum amount of water conservation storage without impairing the flood control functions of the reservoir; and (3) Provide the maximum amount of power practicable and be consistent with required flood control operations and the conservation functions of the reservoir.
If the inflow into Folsom Reservoir causes the storage to encroach into the space reserved for flood control, releases from Nimbus Dam are increased. Due to operation strains and to provide additional protection, on 1996 Reclamation operated according to modified flood control criteria, which reserve 400,000 to 670,000 acre-feet of flood control space in Folsom and a combination of upstream reservoirs.
New Melones Reservoir flood control operation is coordinated with the operation of Tulloch Reservoir. The flood control objective is to maintain flood flows at the Orange Blossom Bridge at less than 8,000 cfs. When possible, however, releases from Tulloch Dam are maintained at levels that would not result in downstream flows in excess of 1,250 cfs to 1,500 cfs because of seepage problems associated with flows above this level. Up to 450,000 acre-feet of the 2.4 million acre-foot storage volume in New Melones Reservoir is dedicated for flood control and 10,000 acre-feet of Tulloch Reservoir storage is set aside for flood control.
OCAP BA Appendix D
August 2008 D-13
SWP Monterey Agreement The 1994 Monterey Agreement revised the water management strategy of the SWP and its contractors and eventually led to SWP contract amendments. The Monterey Agreement changed the allocation procedure of SWP deliveries so that cuts would be made proportionally to all SWP contractors, authorized the transfer of 130,000 acre-feet of agricultural contract amounts to M&I contractors, aggregated several contractual obligations for water delivery into one water type (Article 21), and resulted in KCWA assumption of the Kern Water Bank.
Environmental Water Account Three management agencies (FWS, National Oceanic and Atmospheric Administration Fisheries [NMFS], and California Department of Fish and Game [DFG]) and two project agencies (Reclamation and DWR) share responsibility for implementing and managing the Environmental Water Account (EWA). The management agencies manage the EWA assets and exercise the biological judgment to recommend operational changes in the CVP and SWP that are beneficial to the Bay-Delta system. Together, the management and project agencies form an EWA Team, or EWAT.
CalSim-II EWA is meant to illustrate a representative rather than prescriptive imposition of EWA on projects’ operations. CalSim-II’s EWA representation only approximates actual EWA operations. One difference is the time step difference between CalSim-II decisions and actual EWA decisions. Actual EWA operating decisions (especially actions) may apply to multi-day or multi-week periods. In contrast, EWA decisions in CalSim-II are made monthly. Another difference is the basis of initiating EWA actions (i.e. export reductions). In CalSim-II, the absence of simulated biological conditions forces monthly action decisions to be responsive to simulated hydrologic conditions and monthly rules. Actual EWA decisions on actions are cognizant of recent monitoring of system hydrological and biological conditions.
The objective of simulating EWA for OCAP modeling is to represent the functionality of the program in two ways: as it has been implemented by EWAT during WY2001-2007, referred to as Full EWA and as it is foreseen to be implemented in a limited capacity in coming years by CALFED Operations, referred to as Limited EWA. The simulation of EWA in CalSim-II, involves representation of the following fundamental aspects of the EWA program:
• Implementation of EWA actions at project export facilities to protect/restore fisheries,
• Acquiring assets to mitigate action impacts on deliveries,
• Assessment of how action impacts are affecting project deliveries and storage (i.e. causing debt), and
• Application of acquired assets to manage debt.
EWA actions are simulated as SWP/CVP export changes, experienced as either a pumping reduction (i.e. monthly reduction in pumping volume relative to a baseline level) or a pumping restriction (i.e. reduction of pumping down to a target pu mping level, regardless of baseline
Appendix D OCAP BA
D-14 August 2008
level). The action strategy for the Full EWA representation includes six specific actions, while the Limited EWA includes one or two.
The following assumptions are designed for monthly simulation and do not equate to a collection of EWA actions that will be needed in any specific future year. Their complexity represents the extent of export-related fish actions that can be rationalized and simulated in CalSim-II. They are to be interpreted as monthly surrogates for an assumed set of potential fish actions expected to occur on daily to weekly time scales. Development of these assumptions was steered in 2006 in discussions with EWA operations staff from CA Department of Fish and Game, U.S. Fish & Wildlife Service, and NOAA Fisheries.
1. Winter Reductions 1 (December – February):
• Do Action if:
o it’s December or January; or,
o it’s February and the hydrologic year-type is assessed to be Above Normal or Wet according to the Sac 40-30-30 Index.
• Action is:
o a reduction in total Delta exports, equal to 50 TAF in the action month, allocated evenly to total SWP and CVP exports.
• Rationale:
o The intent of Winter Reductions 1 to represent a “seasonal” amount of expected export cuts, and to distribute the cuts among Winter months. Actual EWA operations (i.e. from 2001 to present) have involved implementing multi-day rather than monthly export restrictions during Winter months.
2. Winter Reductions 2 (February – March):
• Do action if:
o it’s February or March,
o “previous summer stress” conditions are met (see Rationale)
o “winter delta mitigating conditions” are not met (see Rationale)
• Action is:
o a reduction in total Delta exports, equal to either 50, 75, or 100 TAF in the action month, allocated evenly to total SWP and CVP exports.
• Rationale:
o It was reasoned that the distribution of winter months’ actions under Winter Reductions 1 was reasonable, but that in some drier February and March months, the EWA management agencies would also be inclined to reduce export to assist emigrating Winter-Run Chinook, Spring-Run Chinook, and Steelhead
OCAP BA Appendix D
August 2008 D-15
populations. The conditions for this action would be based on whether the populations had been stressed during previous summers in upstream tributaries (“previous summer stress”), and also on whether the delta exhibited high flows or low exports during the Feb/Mar emigration period (“delta mitigating conditions”).
o “Previous summer stress” was defined as a function of river temperatures during the previous summer’s spawning and incubation season (i.e. July-September). Water temperature greater than 56 Fahrenheit (F) during this period are assumed to adversely affect reproductive success. An assumption was made that spawning vulnerability in the basin could be indicated by simulated monthly temperature conditions on the Sacramento River at Balls Ferry. A table of “Previous summer stress” classifications was developed (Table 2), where classifications ranging from A to C represent relative levels of higher to lower concern. To implement these assumptions in CalSim-II and determine the triggering of Winter Reductions 2, an annual time series of concern classifications was developed as input to the simulation. This time series was based on simulated Sacramento River temperature at Balls Ferry from the OCAP Future B2 study (OCAP BA, 2004).
Table 2. “Previous Summer Stress” Classifications for Winter Reductions 2
If “Simulated Water Temperature at Ball’s Ferry” exceeds “X” (degrees F), then Level of Concern =:
Month X <= 56 X = 57 X = 58 X = 59 X = 60+
July -- A A A A
August -- B B A A
September -- C C B A
o Given concern levels A, B, or C, corresponding monthly amounts of export reduction were assumed (i.e. 100, 75, 50 TAF/month, respectively, during February and/or March). However, it was assumed that favorable delta conditions during emigration would eliminate the need for action (i.e. “delta mitigating conditions”), regardless of previous summer stress. Two mitigating conditions were assumed to override the need for action: if exports were already relatively low (e.g. <4000 cfs combined), or if Delta inflows were already relatively high (e.g. Freeport >40,000 cfs or total Delta inflow > 50,000 cfs).
o Simulation results show that Winter Reductions 2 compliments Winter Reductions 1 as the occurrence of Winter Reductions 2 is generally during drier February and March months. February occurrence of Winter Reductions 1 is during Wet and Above Normal years only
Appendix D OCAP BA
D-16 August 2008
3. VAMP Export Restriction (April 15 – May 15):
• Do Action if:
o it’s April or May.
• Action is:
o a restriction on total Delta exports to a target level during the VAMP-period, where the target depends on San Joaquin River flow conditions. Action applies only to SWP exports because CVP exports are already restricted to the same target level through the B2 action strategy included in the baseline operation relative to EWA.
• Rationale:
o Historical EWA operations (i.e. from 2001 to present) have involved implementing this VAMP-period restriction.
4. VAMP April-Shoulder Export Restriction (April 1 – April 14):
• Do Action if:
o it’s April
o the hydrologic year-type is assessed to be Dry or Critical according to the Sac 40-30-30 Index
o foreseeable October debt at San Luis does not exceed 100 TAF, considering forecasted asset acquisitions April through September.
• Action is:
o an extension of the VAMP-period export restriction into the April 1-14 period. SWP export is constrained to the target level. CVP exports are similarly restricted unless they were already constrained by the analogous B2 “Pre-VAMP” action.
• Rationale:
o During preparation of the Long-Term EWA studies, the EWA management agencies expressed interest to simulate VAMP April Shoulder as a priority action. Recognizing that an EWA action-asset balance must be maintained, the logic predicating the action on a tolerable level of foreseeable October debt was developed. When determining foreseeable October debt on April 1st, it is assumed that VAMP Export Restriction is implemented.
5. VAMP May-Shoulder Export Restriction (May 16 – May 31):
• Do Action if:
o it’s May
OCAP BA Appendix D
August 2008 D-17
o foreseeable October debt at San Luis does not exceed 100 TAF, compensating for forecast asset acquisitions May through September
• Action is:
o an extension of the VAMP-period export restriction into the May 16-31 period. SWP export is constrained to the target level. CVP exports are similarly restricted unless they were already constrained by the analogous B2 “Post-VAMP” action.
• Rationale:
o The EWA management agencies indicated a preference to implement the “May Shoulder” extension of the VAMP restriction in all years. Recognizing that an EWA action-asset balance must be maintained, the logic predicating the action on a tolerable level of foreseeable October debt was developed. When determining foreseeable October debt on May 1st, it is assumed that VAMP Export Restriction is implemented.
6. June Ramping:
• Do Action if:
o it’s June
o the Post-VAMP action was implemented in the preceding month.
o foreseeable October debt at San Luis does not exceed 50 TAF, given assumed asset acquisitions from May through September.
• Action is:
o A split-month export restriction where total exports from June 1-7 are set equal to the VAMP target level, and total exports from June 8-30 are allowed to be as high as what’s allowed by the June E/I ratio (i.e. ratio of ”allowable exports”-to-“Delta inflow”). The restricted amount is divided evenly between SWP and CVP. However, CVP is constrained by its half share or 3000 cfs, whichever is less, and only if B2-June Ramping was not already implemented in the baseline operation.
• Rationale:
o The EWA management agencies suggested that there may be an interest in implementing this action during any year when “May Shoulder” was implemented. The action is meant to promote gradual changes to Delta hydrologic conditions near the export facilities, transitioning from VAMP-constrained export levels (i.e. May Shoulder) to elevated export conditions constrained by other non-EWA Delta requirements. In recognition of the importance of an asset/action balance, it was proposed the action be predicated on a tolerable level of “foreseeable October debt”.
Appendix D OCAP BA
D-18 August 2008
The action strategy for the Limited EWA includes adaptations of the VAMP and Post-VAMP actions. Both are considered in the context of expected asset acquisition. No other actions are taken.
7. VAMP Export Restriction (April 15 – May 15):
• Do Action if:
o it’s April or May.
• Action is:
o a restriction on total Delta exports to a target level during the VAMP-period, where the target depends on San Joaquin River flow conditions. Action applies only to SWP exports because CVP exports are already restricted to the same target level through the B2 action strategy included in the baseline operation relative to EWA.
o potentially limited by the expected acquisition of purchased asset. If the expected purchase will not cover an export restriction to the full VAMP target level, the restriction is relaxed to whatever level can be supported by the expected purchase.
• Rationale:
o Department of Water Resources guidelines on intended actions.
8. Post-VAMP Export Restriction (May 16-31):
• Do Action if:
o it’s May
o expected acquisition of purchased asset was enough to cover the full VAMP period restriction for SWP exports, and there is additional asset remaining to support further export restrictions.
• Action is:
o an extension of the VAMP-period export restriction of SWP exports into the May 16-31 period, up to the level supportable by assets remaining after the VAMP period action. CVP export restrictions are not increased beyond whatever level was achieved through the Post-VAMP action under B2.
• Rationale:
o Department of Water Resources guidelines on intended actions.
Impacts of EWA actions on storage and delivery are defined as EWA debt. Measurement of debt is performed during simulation by comparing EWA-step project deliveries and storage conditions to regulatory baseline conditions. Debt is not limited during simulation. Instead, debt is a simulated “relief valve” indicating the balance between input strategies for action, asset-acquisition, and asset-application to reduce debt. Debt should occur due to EWA actions, but it
OCAP BA Appendix D
August 2008 D-19
should also be managed using assets so that there is no harm to project deliveries. There should be sufficient assets given the assumed set of actions.
Occurrence of SOD delivery debt triggers immediate payback using any available assets. Failure to address this type of debt in modeling would indicate that EWA program assets are not in balance with the assumed actions. Debt to San Luis storage should generally be managed within each water year, but carryover debt between water years is permitted in the representation of the Full EWA with the program structure encouraging that these carryover amounts at San Luis do not exceed 100 TAF. Under the Limited EWA representation, carryover debt is unlikely due to the deliberate asset/action balance.
EWA assets are water purchases or operational opportunities. One key aspect of assets management involves conveyance of assets from Upstream of Delta (i.e. North-of-Delta, NOD) sources to the Export Service Area (i.e. South-of-Delta area, SOD). This conveyance can involve asset losses associated with cross-delta conveyance (i.e. carriage water costs).
The seasons of EWA asset acquisition and EWA export actions are not coincidental. Moreover, the target amount of purchase acquisitions varies less from year to year compared to the “water costs” of EWA export actions. This creates a need for collection and storage of EWA assets until they are needed. A key storage resource is San Luis, where EWA is allowed to store assets on top of CVP or SWP storage. This lower storage priority puts EWA assets stored in San Luis at risk to be lost to CVP/SWP when the projects operate to fill San Luis.
Other storage resources available to EWA are in upstream-of-Delta reservoirs, depending on criteria conditions for “backing-up” assets into these reservoirs. As with San Luis, EWA assets in upstream-of-Delta reservoirs are stored on top of conservation storage, and are the first amounts of stored water to be spilled when the reservoirs fill to flood-control space requirements. These “backed-up” assets are created when either (a) an EWA Spring action causes export reductions and corresponding upstream release reductions, or (b) an EWA NOD purchase is allowed to exchange with an upstream reservoir release (as permitted by SWP and CVP) given that the purchase cannot be conveyed through Banks during the month of purchase. The first mechanism is simulated to only occur in association with Spring EWA actions because it is reasoned that actual Spring actions would persist for several weeks and could reasonably cause a release reduction. In contrast, actual Winter actions are likely to occur during multi-day periods, and CVP/SWP operators have indicated that they would not adjust upstream release rates for such short periods. Thus, creation of backed-up assets in association with simulated Winter EWA actions is not permitted in the modeling.
Asset Acquisitions – Water Purchases: Modeling of water purchases occurs in three steps: Step 1 total annual purchase targeting, Step 2 definition of NOD/SOD split, and Step 3 identification of NOD and SOD purchase sources.
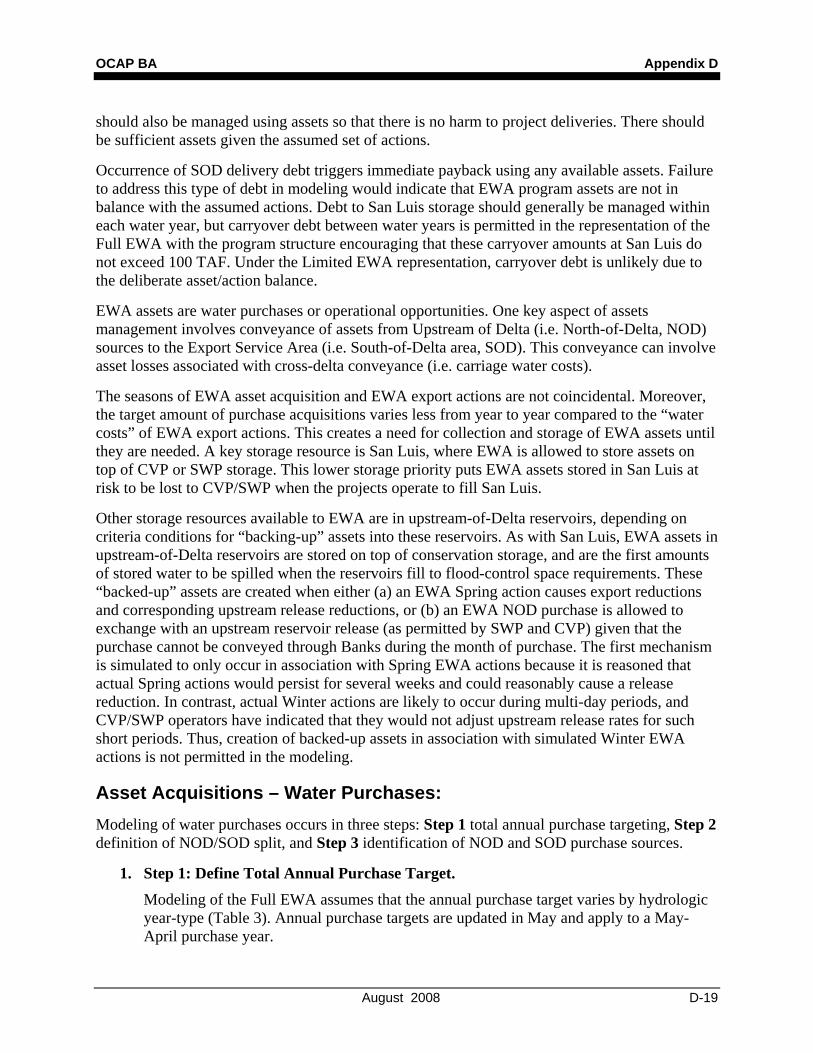
1. Step 1: Define Total Annual Purchase Target.
Modeling of the Full EWA assumes that the annual purchase target varies by hydrologic year-type (Table 3). Annual purchase targets are updated in May and apply to a May-April purchase year.
Appendix D OCAP BA
D-20 August 2008
Table 3. EWA Annual Purchase Target
Sacramento 40-30-30 Index Total Purchase Target (TAF)
Wet 250
Above Normal 250
Below Normal 250
Dry 230
Critical 210
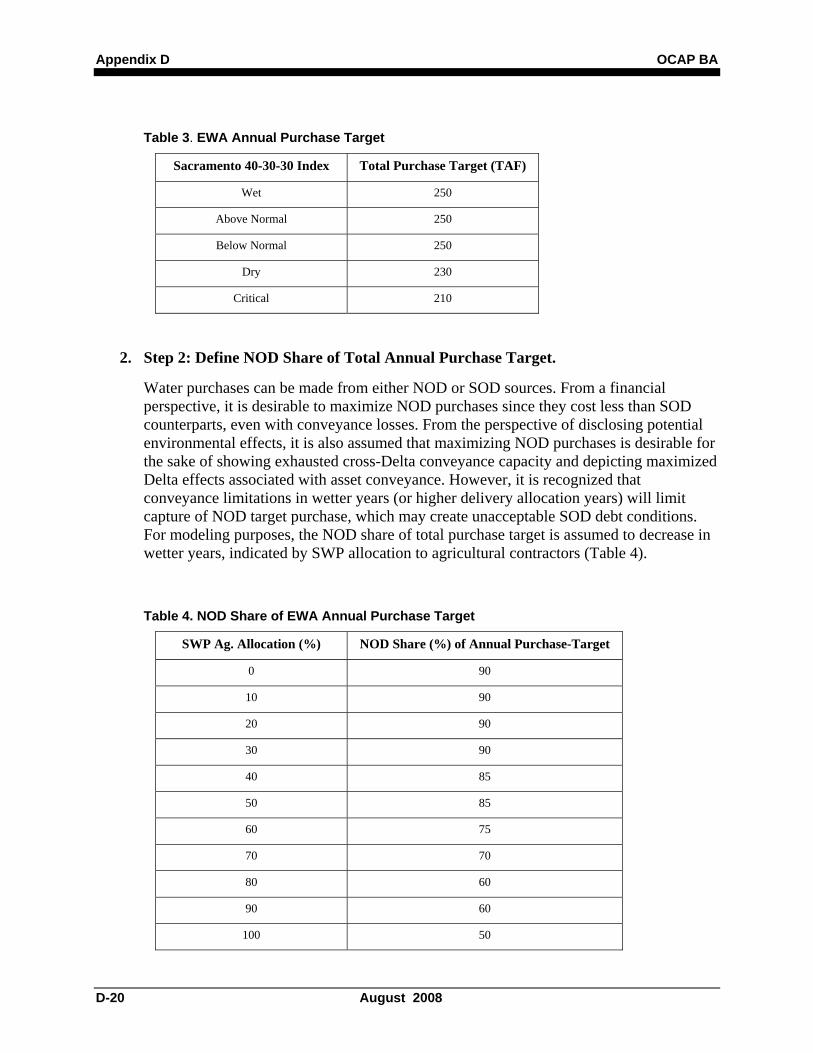
2. Step 2: Define NOD Share of Total Annual Purchase Target.
Water purchases can be made from either NOD or SOD sources. From a financial perspective, it is desirable to maximize NOD purchases since they cost less than SOD counterparts, even with conveyance losses. From the perspective of disclosing potential environmental effects, it is also assumed that maximizing NOD purchases is desirable for the sake of showing exhausted cross-Delta conveyance capacity and depicting maximized Delta effects associated with asset conveyance. However, it is recognized that conveyance limitations in wetter years (or higher delivery allocation years) will limit capture of NOD target purchase, which may create unacceptable SOD debt conditions. For modeling purposes, the NOD share of total purchase target is assumed to decrease in wetter years, indicated by SWP allocation to agricultural contractors (Table 4).
Table 4. NOD Share of EWA Annual Purchase Target
SWP Ag. Allocation (%) NOD Share (%) of Annual Purchase-Target
0 90
10 90
20 90
30 90
40 85
50 85
60 75
70 70
80 60
90 60
100 50
OCAP BA Appendix D
August 2008 D-21
It is understood that some NOD purchases will be lost to Delta outflow during conveyance operation due to carriage water costs. To meet the total purchase target as a capture goal, the simulated NOD share volume is inflated by an anticipated amount of average annual carriage water loss, defined as 20% of NOD share volume. Simulated carriage water losses can be higher or lower than this anticipated value.
Two additional target decisions are made. The first is May addition to the NOD purchase target, representing “put” purchases as part of the Wet-Year/Dry-Year Exchange, discussed later in this section. The second is a June supplement to SOD purchase target responding to perceived supplemental asset need given April and May forecasts of carryover debt and decisions on whether to implement April Shoulder and May Shoulder. This SOD purchase supplement is triggered under either of two cases:
• Doing April Shoulder or May Shoulder without supplement results in a debt forecast between 50 and 100 TAF.
• The debt forecast exceeds 100 TAF even without doing April Shoulder or May Shoulder.
Noting that the simulated debt-forecast is uncertain in April and May and sometimes underestimates the carryover debt result, the SOD purchase supplement is sized to reduce the debt forecast to 50 TAF.
3. Step 3: Allocate NOD and SOD shares to Purchase Sources.
OCAP modeling used the range of EWA purchase options that was developed for the Common Assumptions Common Model Package. Annual purchase limitations can depend on regulatory baseline operations for higher priority water contractor transfers that also use some of the same sources for water supply. The purchase sources are:
North of Delta
• Yuba Basin Transfer – defined by results of Yuba Accord analysis
• Sacramento and Feather basin groundwater substitution (DSAs 69, 12, and 15) – up to 200 taf/yr, limited to 150 taf in consecutive dry years
• Sacramento and Feather basin crop idling (DSAs 69, 12, and 15)
The representation of Full EWA actions used access to all of the above purchase assets. The Limited EWA representation used only the NOD Yuba Basin Transfer as a source of purchased water.
Asset Acquisitions – Operational:
The OCAP modeling has the capability to represent the following specific operational assets:
1. Source Shift due to Low Level of San Luis – This asset is used when San Luis storage falls below 300 TAF due to the presence of high EWA storage debt, thereby threatening water quality conditions in the reservoir. High EWA storage debt is defined to be 100 TAF. When these conditions are met, a source shift of 25 TAF is implemented with Metropolitan Water District (MWD). Delivery is reduced at three MWD diversion locations on the west and east branches. The purchase amount is transferred from SWP San Luis to EWA San Luis. There is no limit on the buildup of the source shift “account”. Payback from EWA to specific MWD locations occurs when EWA has sufficient assets to support payback and when San Luis storage exceeds 300 TAF.
2. Semitropic Groundwater Bank – This asset is used when there is potential for SWP/CVP takeover of EWA assets stored in San Luis. This situation occurs during months when SWP/CVP filling of San Luis is likely to encroach on EWA-occupied space in San Luis. Given this situation, EWA removes EWA assets from San Luis and “puts” them at Semitropic. “Puts” are modeled as additional delivery at Semitropic’s location in the Tulare Basin. These assets are then retrieved, or “called”, when San Luis debt conditions become severe. “Calls” are modeled as delivery reductions at the Semitropic locations.
3. 500 cfs July-Sep Capacity at Banks – This conveyance asset enables EWA wheeling of assets from NOD to SOD locations. The SWP is currently limited to 6680 cfs diversion rate into Clifton Court forebay. Permission has been granted by the U.S. Army Corps of Engineers to increase this diversion limit by 500 cfs during the months of July, August, and September, solely for pumping by the EWA.
4. 50% of JPOD Capacity Assessed at Banks – The SWP will use excess capacity at Banks Pumping Plant to wheel water for the CVP and EWA. This excess capacity is assessed under terms of Joint Point of Diversion (JPOD). This excess capacity is to be shared between CVP and EWA on a 50/50 basis.
5. 50% of B2 releases pumped by SWP – The EWA receives a 50% share of the water gained from CVPIA (b)(2) or Environmental Restoration Program (ERP) upstream releases by SWP through use of their Delta export facilities. The value of this EWA asset varies with the amount of (b)(2) releases in the current year and the SWP’s excess capacity to export additional water.
6. Carried-over debt “spill” at EWA San Luis - Carried-over SOD storage debt is simulated to be managed through either: (1) direct dedication of assets, or (2) debt spilling. Dedication of assets involves transferring the accumulated purchases and variable assets from EWA San Luis into the projects’ shares of San Luis to repay impacts caused by this year’s actions and/or carried-over impacts from last year. The second tool,
OCAP BA Appendix D
August 2008 D-23
debt spilling, involves elimination of carried-over SOD debt through the pumping of surplus water into the debt space under baseline regulatory conditions. Spill of carryover debt to SWP can be done under the following specific conditions:
• There was remaining capacity at Banks
• There was surplus water in the Delta that could have been exported
• The sum of end-of-month debt and stored water at SWP San Luis exceeded the sum of storage capacity and the “Article 21 deficit” (an Article 21 deficit represents demand minus what was delivered)
7. Backed-Up water from Spring EWA Actions - This variable asset emerges in NOD reservoirs when EWA actions to restrict exports during Spring are coincident with NOD reservoir-release reductions. Coincidental release reductions are not permitted unless the Delta is simulated to be “in balance” (i.e. assessed during simulation as the joint occurrence of “No Delta Surplus” and “In Basin Use” conditions controlling CVP-SWP coordinated operations). Given a release reduction, EWA gains control of this upstream storage increase. Release reductions are measured below Keswick, Thermolito, and Nimbus. Reductions at Keswick represent collective back-up at Trinity Reservoir and Lake Shasta, but the backed-up water is situated at Lake Shasta.
The following Operational Asset was not modeled:
8. E/I Relaxation – Under SWRCB Decision 1641 (D1641), there is a restriction on project exports that varies throughout the year as a percentage of Delta inflow (usually 35 percent or 65 percent). This restriction is often referred to as the E/I limit on exports. However, D1641 allows for the E/I limit to be relaxed upon meeting certain requirements. It has been proposed that EWA be allowed to use this flexibility to augment its ability to export Delta Surplus flows with its JPOD capacity and wheel NOD assets to EWA San Luis. The ability to relax the E/I limit varies with daily hydrologic and biological conditions in the Delta. CalSim-II, being a monthly model, is unable to capture the daily subtleties required to simulate E/I relaxation.
OCAP modeling of the Full EWA included all of the above operational assets except for E/I relaxation. Modeling of the Limited EWA operation also excluded source shifting and the semitropic water bank.
Asset Conveyance:
As mentioned, EWA has access to Banks conveyance capacity on an intermittent basis through JPOD and on a dedicated basis during July-September. The priority of EWA asset wheeling through Banks is:
1. Delta Surplus,
2. NOD Purchases without interim storage
Appendix D OCAP BA
D-24 August 2008
3. Interannual DryWet Exchange Puts
4. NOD backed-up assets.
Exercise of this access and operating to convey assets can sometimes involve losing a portion of the NOD asset to delta outflow as carriage water associated with export. Asset conveyance is permitted to occur with carriage water losses permitted up to 35 percent, and encouraged to remain below 20 percent.
Model Mathematics CalSim-II represents California’s water resources system as an interlinked network of nodes and arcs. CalSim-II routes water through the arcs according to a set of user-defined priorities. CalSim-II utilizes optimization techniques to route water through a network. A linear programming (LP)/mixed integer linear programming (MILP) solver determines an optimal set of decisions for each time period given a set of weights and system constraints (DWR 2002). The physical description of the system is expressed through a user interface with tables outlining the system characteristics. The priority weights and basic constraints are also entered in the system tables. The programming language used, Water Resources Engineering Simulation Language (WRESL), serves as an interface between the user and the LP/MILP solver, time-series database, and relational database.
Documentation There are many sources of information documenting the CalSim-II Model. Since the release of the June 30, 2004 OCAP BA, a peer review response and several studies have been conducted regarding CalSim-II. The relevant reports include:
1. An external peer review commissioned by the California Bay-Delta Authority (CALFED); (Close A., Haneman et al, 2003)
2. An analysis of an historical operations simulation; (DWR, 2003b)
3. An analysis of the effect varying selected parameters has upon model results (sensitivity analysis study); (DWR 2005)
4. An analysis of the significance of the simulation time-step to the estimated SWP delivery amounts (DWR 2005).
5. Peer review of San Joaquin River Valley application (Ford et al, 2006)
6. CALFED Common Model Package (CALFED, 2005)
The pertinent information from these reports is included in the following sections on model selection rationale, reliability and acceptability of approach, quality assurance, and assumptions/limitations.
OCAP BA Appendix D
August 2008 D-25
Rationale The OCAP process requires the application of the best available science and engineering to the analysis of water management objectives for the CVP and SWP. The OCAP effort requires the use of a system wide CVP/SWP operations planning model and CalSim-II currently serves that purpose. CalSim-II is the system model for any inter-regional or statewide analysis of water in the Central Valley of California. CalSim-II has important strengths as a systems operations planning model, particularly compared with available alternatives and its predecessors. The primary strengths include:
1. Coordination of Federal and State Interests is unique aspect of CalSim-II which allows a high degree of cooperation between Federal (i.e., U.S. Bureau of Reclamation) and State (i.e. California Department of Water Resources) interests in its development. This kind of cooperation is rare, and in fact this may be the only such example of such coordination for a system of this scale and complexity. This includes a common schematic, hydrologic representation of the system, common set of facility capacities, and common representation of system operating policies.
2. CalSim-II is a data-driven simulation model with an optimization engine. This modeling approach provides: a) much greater flexibility than its predecessors and traditional water resources simulation approaches, and b) a promising framework for improving transparency, data, and model documentation, compared to other approaches.
3. The model and data are substantially in the public domain, facilitating transparency and adaptability for California’s decentralized water system.
4. Model improvements have been steadily pursued since the adoption of CalSim-II as the CVP/SWP operations planning model.
Reliability and Acceptability of Approach As noted above, a number of peer review efforts have been conducted to evaluate the applicability of CalSim-II to the CVP/SWP system and California water management. These peer reviews include the following:
1. The CALFED Science Program invited Dr. Pete Loucks of Cornell University to organize and chair an expert panel for the review of CalSim-II Water Resources Planning Model. In addition to Dr. Loucks as the chairperson, the panel consisted of Drs. A. Close (Murray Darling Basin Commission), W.M. Haneman (University of California, Berkeley), J.W. Labadie (Colorado State University), J.R. Lund (University of California, Davis), D.C. McKinney (University of Texas, Austin), and J.R. Stedinger (Cornell University). The panel published its final report on December 4, 2003, titled: A Strategic Review of CalSim-II and its Use for Water Planning, Management, and Operations in Central California.
2. In response to the short-term and long-term improvements recommended in the December 4, 2003 CalSim-II Panel Review Report, DWR and Reclamation staff
Appendix D OCAP BA
D-26 August 2008
developed a program to implement the major features of those recommendations according to a time line that met agencies priorities and model development goals. The agencies response plan was documented in an August 2004 report, titled: PEER REVIEW RESPONSE: A Report by DWR/Reclamation in Reply to the Peer Review of the CalSim II Model Sponsored by the CALFED Science Program in December 2003.
3. In addition to the above general review of the CalSim-II modeling features and capabilities, the CALFED Science Program and the California Water and Environmental Modeling Forum jointly sponsored and oversaw a review process of the CalSim-II’s updated modeling approach of the San Joaquin River Valley. The panel was chaired by Dr. J.R. Lund (University of California, Davis), and panel members were Dr. David Ford (David Ford Consulting Engineers), Mr. Les Grober (Central Valley Regional Water Quality Control Board), Dr. Thomas Harmon (University of California, Merced), and Dr. Daene McKinney (University of Texas, Austin). The panel published the results of its review in a January 12, 2006 Report, titled: Review Panel Report San Joaquin River Valley CalSim II Model Review.
4. In response to the suggestions and improvements recommended in the San Joaquin River Valley CalSim-II Panel Review Report, Reclamation and DWR developed a response document to implement the recommendations. The agencies response plan was documented in January of 2007, titled CalSim-II San Joaquin River Peer Review Response: In Reply to the Peer Review of the CalSim-II San Joaquin River Model, January 2006.
The central question put to the December 2003 external review panel was whether the CALFED program had adopted an appropriate approach to modeling the Central Valley Project/State Water Project (CVP/SWP) system. The CALFED Science Program commissioned the external review panel to provide an independent analysis and evaluation of the strengths and weaknesses of CalSim-II. The panel considered a variety of CalSim-II issues and addressed how future model development activities could be managed to assure quality results for current and proposed applications. The panel published its results in a strategic review of CalSim-II and its uses for water planning, management, and operations in central California (Close and others 2003).
In general, the panel concluded that the current modeling approach was comparable to other state-of-the-art models and addressed many of the complexities of the CVP/SWP system. To balance the competing needs of those who require greater detail from the model and those who require less detail, the panel recommended steps to achieve a more comprehensive, modular, and flexible approach in modeling practices and tools. To increase user confidence in model results and to provide a basis for gauging the model’s ability to produce absolute predictive results of system behavior, the panel suggested calibration and verification of the model, as well as analyses in sensitivity and uncertainty.
The panel summarized its observation on the accuracy of the model to estimate the delivery capability of both the CVP and SWP systems in the Strategic Review’s Appendix F “Analysis of the November 2003 CalSim-II Validation Report.” In August 2004, DWR and the Reclamation jointly responded to the questions, comments, and recommendations of the review panel in a report, Peer Review Response: A Report by DWR/Reclamation in Reply to the Peer Review of
OCAP BA Appendix D
August 2008 D-27
the CalSim-II Model Sponsored by the CALFED Science Program in December 2003. In their report, the agencies outline current and planned work on model development and the priorities for improving CalSim-II. The Peer Review Response also highlights the ongoing and planned efforts to establish trust in and credibility for the model by improving documentation, conducting sensitivity and uncertainty analyses of the model parameters and results. Other efforts include enhancing the level of detail in the geographic representation of the system, and improving hydrologic input and software development. Many of the elements of model development outlined in the Peer Review Response are in progress and will be implemented in the updated version of the model, CalSim-III.
In 2006 the CALFED Science Program and the California Water and Environmental Modeling Forum jointly sponsored a review of the CalSim-II’s updated modeling approach of the San Joaquin River Valley. The review panel evaluated the model using a high standard commensurate with the important role of CalSim-II in water management decisions. They found significant improvements in the new representation of the San Joaquin River Valley over the previous formulation, making analyses of a broader range of issues possible. The final report also identifies areas of further improvement in the both the immediate future and the longer term. Since CALSIM is undergoing continuous improvement, many of the issues raised by the review have already been addressed.
Quality Assurance and Data Quality Assessment As described in the above section – Reliability and Acceptability of Approach, a number of peer reviews have been conducted to evaluate CalSim-II. In addition, there is on-going model development by Reclamation and DWR to continue to improve the model logic and supporting data. As part of the OCAP process, a quality assurance and independent review of the OCAP CalSim-II code and function will be conducted.
The OCAP review has the following expectations:
1. Provide feedback to OCAP development team on the form and function of OCAP modifications to the CalSim model
2. Provide suggestions for further refinement of the OCAP modifications.
3. Document the review to maintain a record of model quality assurance.
Specific review from operations perspective:
4. Review CVP and SWP export operations results.
5. Provide suggestions/alternatives for further refinement of CVP and SWP operations.
Assumptions/Limitations The CalSim-II model is used to simulate a 82-year period approximating future conditions under assumptions of future levels of development and historic climate conditions. The hydrologic and
Appendix D OCAP BA
D-28 August 2008
operational assumptions and methods are described in DWR (2002), and Draper et al (2004). Like all models, CalSim-II has several limitations:
1. One of the main limitations of the CalSim-II model is the time step of simulation and data input. CalSim-II includes monthly hydrologic data sets and simulates operations and river flows on the same time step. Averaging flows over the monthly time step will obscure daily variations that may occur in the rivers due to dynamic system-routing effects or natural hydrologic variability. The monthly time step also requires averaging (usually day-weighted) to simulate operations for regulatory criteria that are specified for a portion of a month. The averaging process can lead to either under- or over-estimation of water availability or costs associated with the criteria.
2. The CalSim-II model also uses generalized rules to specify the operations of the CVP and SWP systems. These rules have been developed based on significant CVP/SWP operator input and represents coarse estimates of project operations over all hydrologic conditions. The results from a single CalSim-II simulation may not necessarily represent the exact operations for a specific month or year, but should reflect long-term trends.
3. CalSim-II is intended to be used in a comparative mode. The results from a “proposed operation” scenario are compared to the results of a “base” scenario, to determine the incremental effects. The model should be used with caution to prescribe seasonal or to guide real-time operations, predict flows or water deliveries for any real-time operations. The results from a single simulation may not necessarily represent the exact operations for a specific month or year, but should reflect long-term trends.
4. The model assumes that facilities, land-use, water supply contracts and regulatory requirements are constant representing a fixed level of development rather than one that varies in response to hydrologic conditions or changes over time.
5. Groundwater has only limited representation in CalSim-II and groundwater resources are the assumed mass balance “closure term”, i.e., they are infinite; there is no upper limit to groundwater pumping.
6. Water quality boundary conditions in the Delta were used from the CalSim-II Common Assumptions development effort. The sensitivity of boundary conditions pattererns changing to modified assumptions and the impact this has on results has not been explored.
Planned Future Model Development CalSim-II outputs serve as input to numerous economic, hydrodynamic, water quality, operations, and other water planning models at both state and local levels. Therefore, developers need to enhance CalSim-II integration with other models and future development of CalSim-II is expected to focus on the integration of CalSim with models such as Agricultural Production Salinity Irrigation Drainage Economics (APSIDE) Model and DSM2.
The long term projects are summarized as follows (CalSim Joint Agency Roadmap presentation, 2006):
OCAP BA Appendix D
August 2008 D-29
1. Groundwater: Implement groundwater model for SJR valley and improving conjunctive use capabilities.
2. Metadata: Focus on hydrologic and water quality data.
3. West-Side San Joaquin River Demands: model west side SJR demands based on land use and model land use response to water supply allocations.
4. WRIMS 2.1: Enhance WRMIS with interactive schematic and database replication tool.
CalSim-II Application System Boundaries The CalSim-II covers a large area including the drainage area of Sacramento and San Joaquin Rivers, the upper Trinity River, and the San Joaquin Valley, Tulare Basin, and southern California areas served by the Federal Central Valley Project (CVP) and the California State Water Project (SWP) are simulated in CalSim-II. The focus of CalSim-II is on the major CVP and SWP facilities in the Central Valley Basin, but operations of many other facilities are included to varying degrees.
Time and Length Scales The model output includes monthly reservoir releases, channel flows, reservoir storage volumes, and parameters describing SJR and Delta water quality conditions.
The historical flow record October 1922-Septrember 2003, adjusted for the influence of land-use change and upstream flow regulation, is used to represent the possible range of water supply conditions.
CalSim-II models all areas that contribute flow to the San Francisco Bay-Delta. The geographical coverage includes: The Sacramento River Valley; the San Joaquin River Valley; the Sacramento-San Joaquin Delta; the Upper Trinity River and the CVP and SWP service areas. CalSim-II simulates operation of the CVP-SWP system for 82 years using a monthly time step.
System Characteristics The CalSim-II system is composed of the CVP and SWP systems. The CVP is composed of some 20 reservoirs with a combined storage capacity of more than 11 million acre-feet, 11 powerplants, and more than 500 miles of major canals and aqueducts. The major water facilities in the Central Valley include Shasta Lake, Keswick Reservoir, and Red Bluff Diversion Dam on the Sacramento River; Trinity Lake on the Trinity River; Whiskeytown Reservoir on Clear Creek; Lake Oroville and Thermalito Afterbay on the Feather River; Folsom Lake and Folsom South Canal on the American River; New Melones Lake on the Stanislaus River; and Millerton Lake on the San Joaquin River.
Appendix D OCAP BA
D-30 August 2008
The SWP, operated and maintained by DWR, is composed of 17 pumping plants, 8 hydroelectric powerplants, 32 storage facilities, and more than 660 miles of aqueducts and pipelines. The SWP serves more than two-thirds of the State’s population and approximately 600,000 acres of irrigated farmland in the Feather River area, San Francisco Bay Area, San Joaquin Valley, Central California Coast, and Southern California. The managed facilities provide water supply to contracting agencies, flood control, recreation, fish and wildlife enhancement, power generation, and salinity control in the Sacramento-San Joaquin Delta.
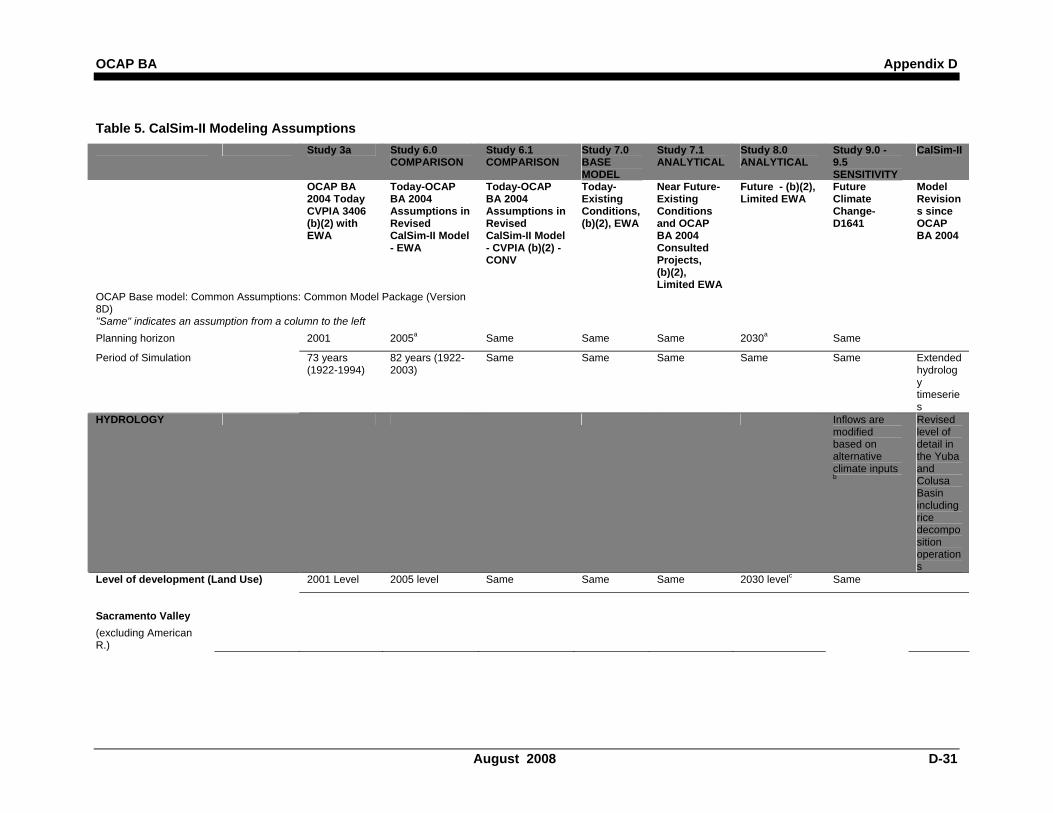
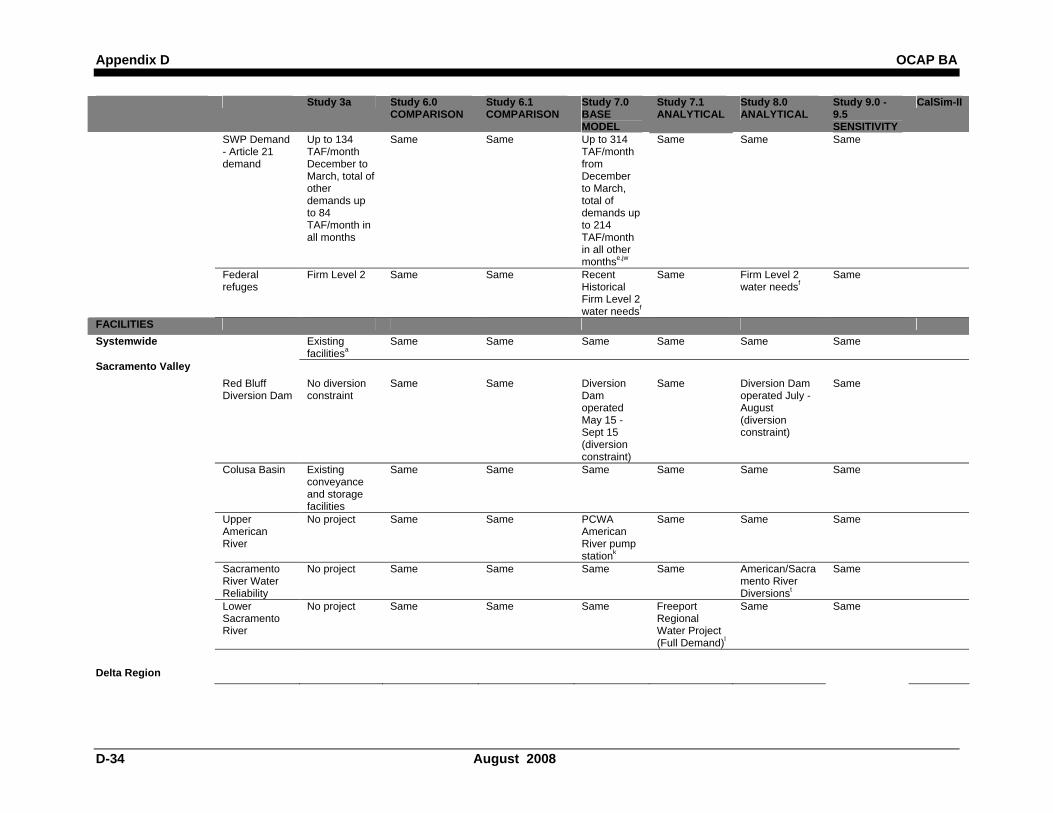
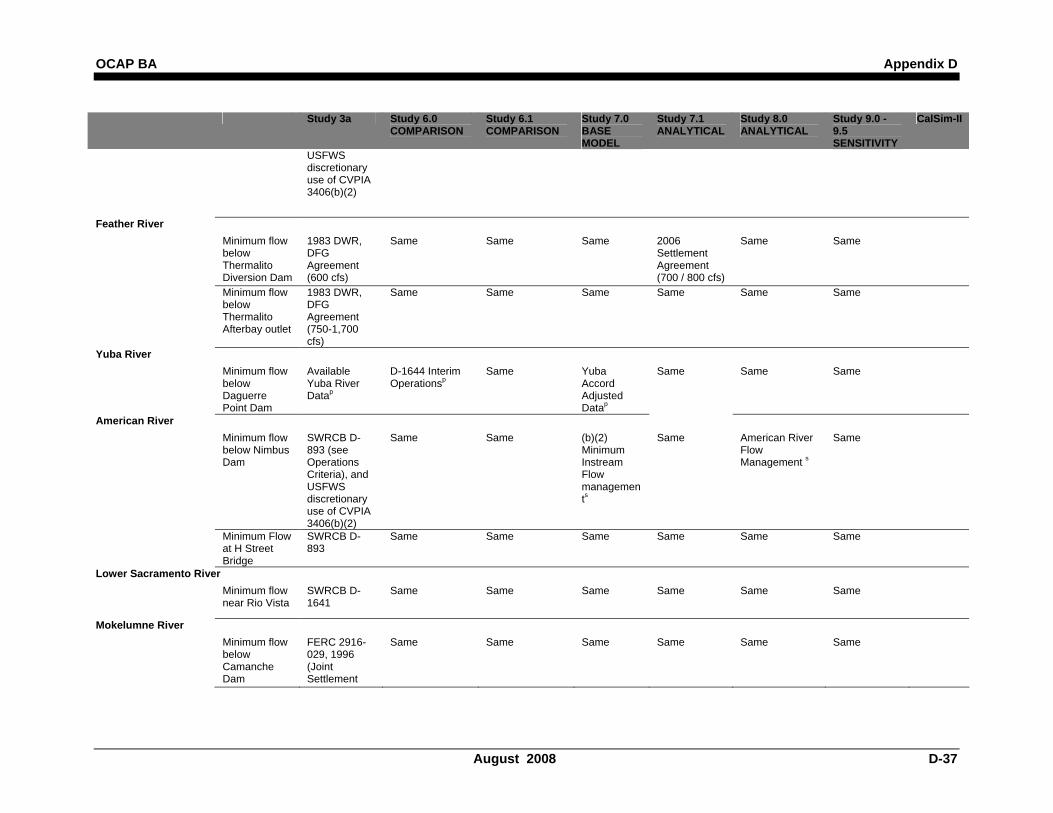
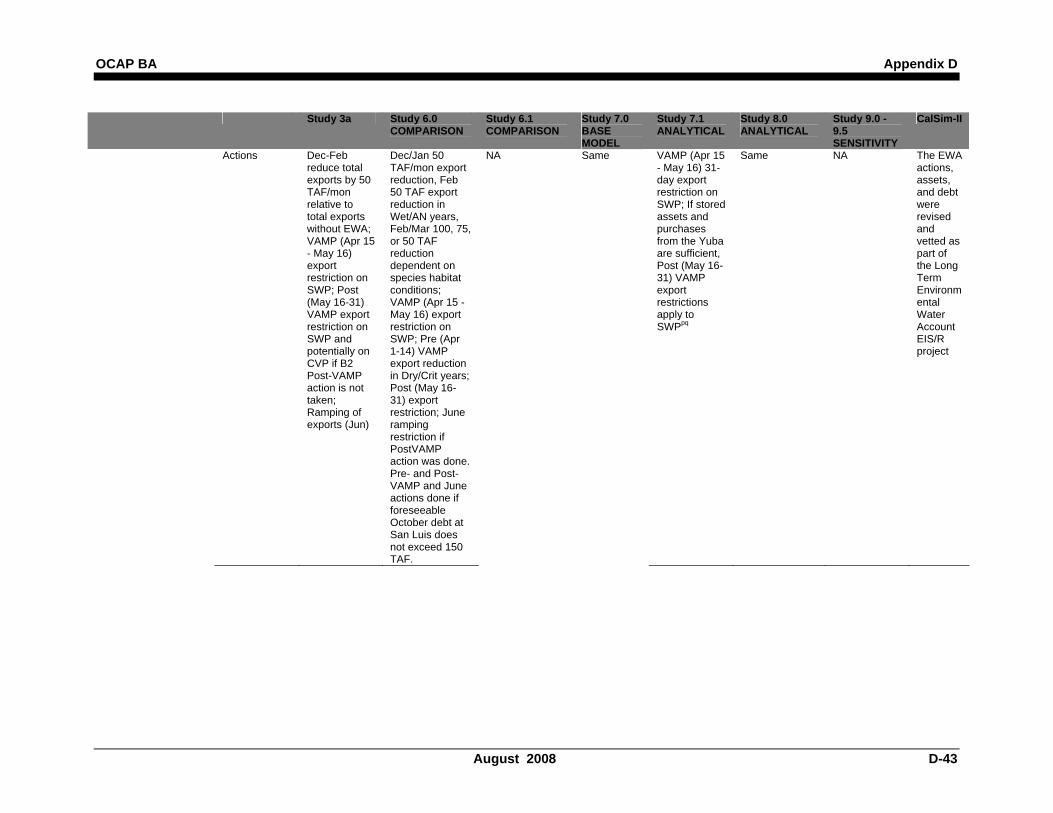
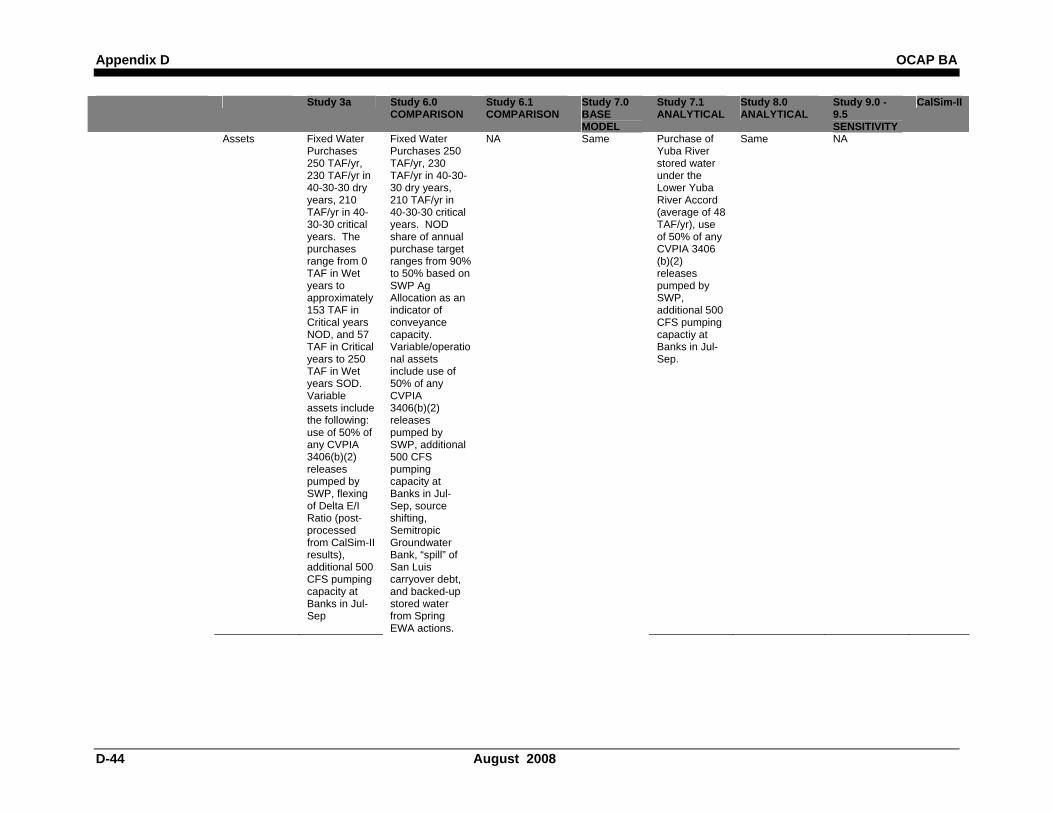
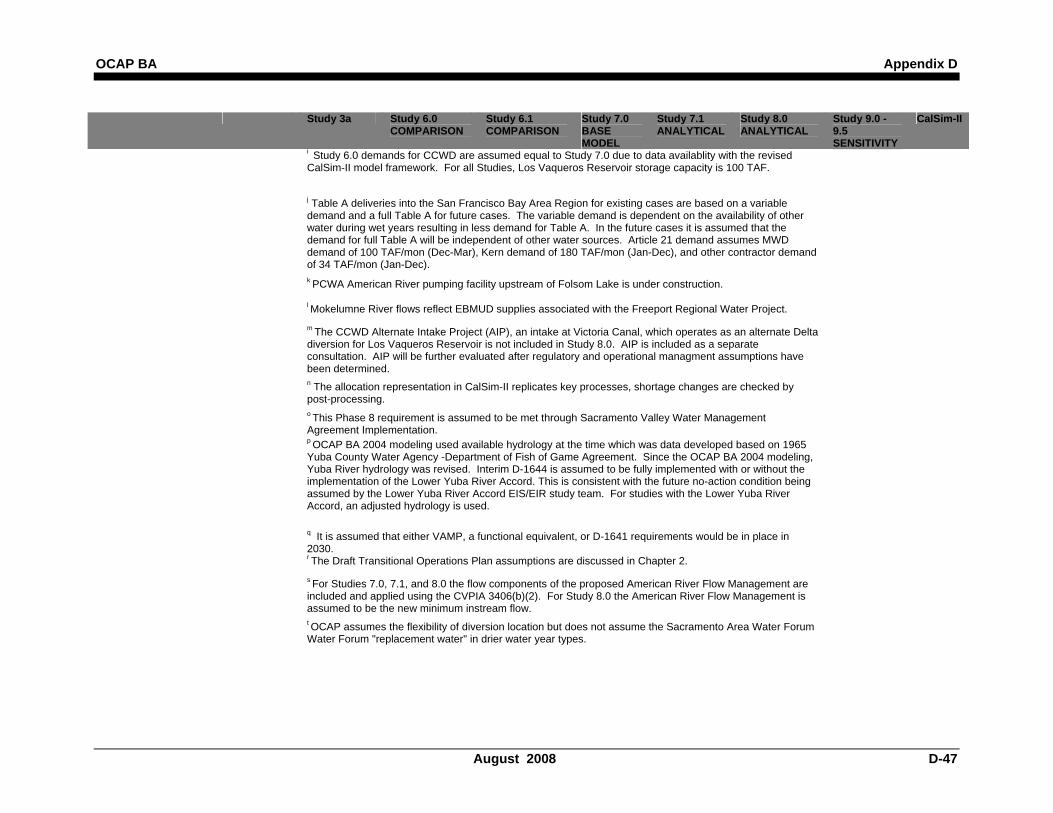
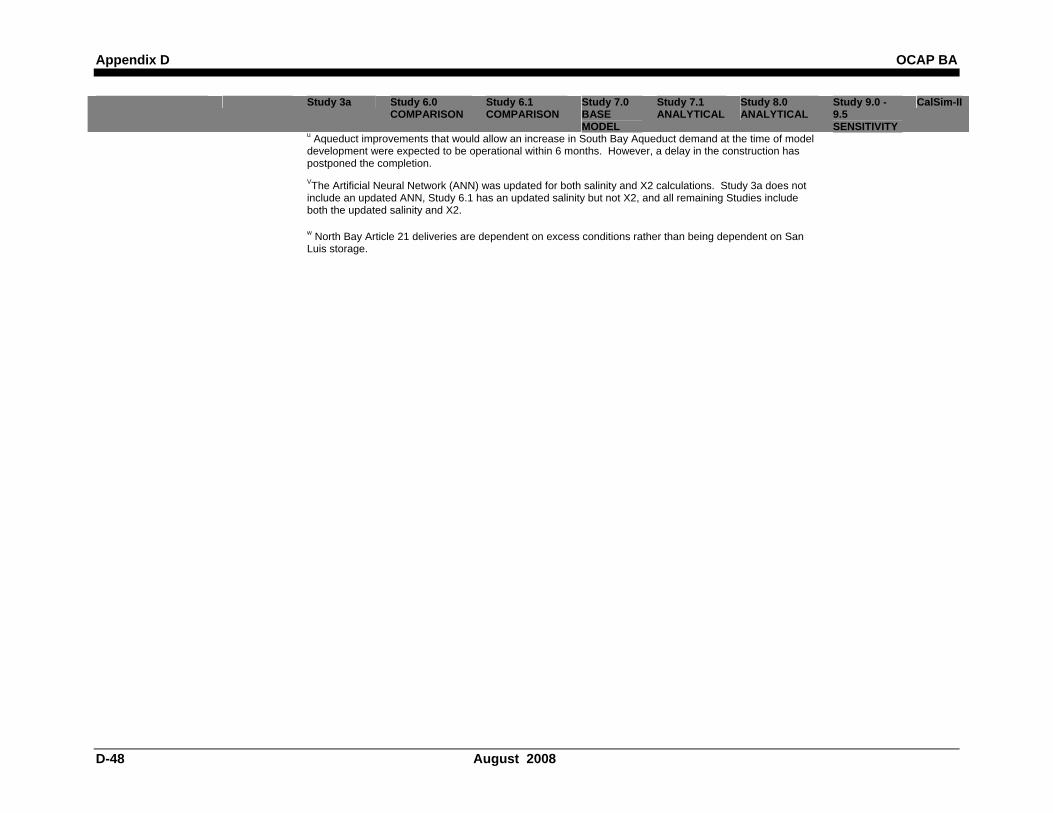
Assumptions The assumptions matrix in Table 5 shows the basic assumptions that are used in CalSim for each of the OCAP BA studies (defined in Chapter 9).
OCAP BA Appendix D
August 2008 D-31
Table 5. CalSim-II Modeling Assumptions
Study 3a Study 6.0 COMPARISON
Study 6.1 COMPARISON
Study 7.0 BASE MODEL
Study 7.1 ANALYTICAL
Study 8.0 ANALYTICAL
Study 9.0 - 9.5 SENSITIVITY
CalSim-II
OCAP BA 2004 Today CVPIA 3406 (b)(2) with EWA
Today-OCAP BA 2004 Assumptions in Revised CalSim-II Model - EWA
Today-OCAP BA 2004 Assumptions in Revised CalSim-II Model - CVPIA (b)(2) - CONV
Today- Existing Conditions, (b)(2), EWA
Near Future- Existing Conditions and OCAP BA 2004 Consulted Projects, (b)(2), Limited EWA
Future - (b)(2), Limited EWA
Future Climate Change- D1641
Model Revisions since OCAP BA 2004
OCAP Base model: Common Assumptions: Common Model Package (Version 8D)
"Same" indicates an assumption from a column to the left Planning horizon 2001 2005a Same Same Same 2030a Same
Period of Simulation 73 years (1922-1994)
82 years (1922-2003)
Same Same Same Same Same Extended hydrology timeseries
HYDROLOGY Inflows are modified based on alternative climate inputs b
Revised level of detail in the Yuba and Colusa Basin including rice decomposition operations
Level of development (Land Use) 2001 Level 2005 level Same Same Same 2030 levelc Same
Sacramento Valley (excluding American R.)
Appendix D OCAP BA
D-32 August 2008
Study 3a Study 6.0 COMPARISON
Study 6.1 COMPARISON
Study 7.0 BASE MODEL
Study 7.1 ANALYTICAL
Study 8.0 ANALYTICAL
Study 9.0 - 9.5 SENSITIVITY
CalSim-II
CVP Land-use based, limited by contract amountsd
Same Same Same Same CVP Land-use based, Full build out of CVP contract amountsd
Same
SWP (FRSA) Land-use based, limited by contract amountse
Same Same Same Same Same Same
Non-project Land-use based
Same Same Same Same Same Same
Federal refuges
Firm Level 2 Same Same Recent Historical Firm Level 2 water needsf
Same Firm Level 2 water needsf
Same
American River Water rights 2001g Same Same 2005g Same 2025g Same
CVP (PCWA American River Pump Station)
No project Same Same CVP (PCWA modified)g
Same Same Same
San Joaquin Riverh
Friant Unit Regression of Historical Demands
Limited by contract amounts, based on current allocation policy
Same Same Same Same Same
Developed land-use based demands, water quality calculations, and revised accretions/depletions in the East-Side San Joaquin Valley
Lower Basin Fixed Annual Demands
Land-use based, based on district level operations and constraints
Same Same Same Same Same
OCAP BA Appendix D
August 2008 D-33
Study 3a Study 6.0 COMPARISON
Study 6.1 COMPARISON
Study 7.0 BASE MODEL
Study 7.1 ANALYTICAL
Study 8.0 ANALYTICAL
Study 9.0 - 9.5 SENSITIVITY
CalSim-II
Stanislaus River
New Melones Interim Operations Plan
Same Same Same Draft Transitional Operations Planr
Same Same Initial storage conditions for New Melones Reservoir were increased.
South of Delta (CVP/SWP
project facilities)
CVP Demand based on contracts amountsd
Same Same Same Same Same Same
Contra Costa Water District
124 TAF/yr annual average
135 TAF/yr annual average CVP contract supply and water rightsi
Same Same Same 195 TAF/yr annual average CVP contract supply and water rightsi
Same
SWP Demand - Table A
Variable 3.1-4.1 MAF/Yr
Same Same Variable 3.1-4.2 MAF/Yr
e,j
Same Full Table A Same Revised SWP delivery logic. Three patterns with Art 56 and more accurately defined Table A / Article 21 split modeled
SWP Demand - North Bay Aqueduct (Table A)
48 TAF/Yr Same Same 71 TAF/Yru Same Same Same
Appendix D OCAP BA
D-34 August 2008
Study 3a Study 6.0 COMPARISON
Study 6.1 COMPARISON
Study 7.0 BASE MODEL
Study 7.1 ANALYTICAL
Study 8.0 ANALYTICAL
Study 9.0 - 9.5 SENSITIVITY
CalSim-II
SWP Demand - Article 21 demand
Up to 134 TAF/month December to March, total of other demands up to 84 TAF/month in all months
Same Same Up to 314 TAF/month from December to March, total of demands up to 214 TAF/month in all other monthse,jw
Same Same Same
Federal refuges
Firm Level 2 Same Same Recent Historical Firm Level 2 water needsf
Same Firm Level 2 water needsf
Same
FACILITIES Systemwide Existing
facilitiesa Same Same Same Same Same Same
Sacramento Valley Red Bluff
Diversion Dam No diversion constraint
Same Same Diversion Dam operated May 15 - Sept 15 (diversion constraint)
Same Diversion Dam operated July - August (diversion constraint)
Same
Colusa Basin Existing conveyance and storage facilities
Same Same Same Same Same Same
Upper American River
No project Same Same PCWA American River pump stationk
Same Same Same
Sacramento River Water Reliability
No project Same Same Same Same American/Sacramento River Diversionst
Same
Lower Sacramento River
No project Same Same Same Freeport Regional Water Project (Full Demand)l
Same Same
Delta Region
OCAP BA Appendix D
August 2008 D-35
Study 3a Study 6.0 COMPARISON
Study 6.1 COMPARISON
Study 7.0 BASE MODEL
Study 7.1 ANALYTICAL
Study 8.0 ANALYTICAL
Study 9.0 - 9.5 SENSITIVITY
CalSim-II
SWP Banks Pumping Plant
South Delta Improvements Program Temporary Barriers, 6,680 cfs capacity in all months and an additional 1/3 of Vernalis flow from Dec 15 through Mar 15a
Same Same Same South Delta Improvements Program Permanent Operable Gates (Stage 1). 6,680 cfs capacity in all months and an additional 1/3 of Vernalis flow from Dec 15 through Mar 15 a
Same Same
CVP C.W. Bill Jones (Tracy) Pumping Plant
4,200 cfs + deliveries upstream of DMC constriction
Same Same Same 4,600 cfs capacity in all months (allowed for by the Delta-Mendota Canal–California Aqueduct Intertie)
Same Same
City of Stockton Delta Water Supply Project (DWSP)
No project Same Same DWSP WTP 0 mgd
Same DWSP WTP 30 mgd
Same
Contra Costa Water District
Existing pump locations
Same Same Same Same Samem Same
South of Delta (CVP/SWP project facilities)
South Bay Aqueduct (SBA)
Existing capacity 300 cfs
Same Same SBA Rehabilitation: 430 cfs capacity from junction with California Aqueduct to Alameda
Same Same Same
Appendix D OCAP BA
D-36 August 2008
Study 3a Study 6.0 COMPARISON
Study 6.1 COMPARISON
Study 7.0 BASE MODEL
Study 7.1 ANALYTICAL
Study 8.0 ANALYTICAL
Study 9.0 - 9.5 SENSITIVITY
CalSim-II
County FC&WSD Zone 7 diversion point
REGULATORY STANDARDS Trinity River Minimum flow
below Lewiston Dam
Trinity EIS Preferred Alternative (369-815 TAF/year)
SWRCB D-1641, and Vernalis Adaptive Management Plan per San Joaquin River Agreement
Same Same Same Same Same Same
Sacramento River–San Joaquin River Delta Delta Outflow
Index (Flow and Salinity)
SWRCB D-1641
Same Same Same Same Same Same Revised Delta ANN (salinity estimation)v
Delta Cross Channel gate operation
SWRCB D-1641
Same Same Same Same Same Same
Delta exports SWRCB D-1641, USFWS discretionary use of CVPIA 3406(b)(2)
Same Same Same Same Same Same
OPERATIONS CRITERIA: RIVER-SPECIFIC Upper Sacramento River Flow objective
for navigation (Wilkins Slough)
3,250 - 5,000 cfs based on CVP water supply condition
Same Same Same Same Same Same
American River Folsom Dam
flood control Variable 400/670 flood control diagram (without outlet modifications)
Same Same Same Same Same Same
Appendix D OCAP BA
D-40 August 2008
Study 3a Study 6.0 COMPARISON
Study 6.1 COMPARISON
Study 7.0 BASE MODEL
Study 7.1 ANALYTICAL
Study 8.0 ANALYTICAL
Study 9.0 - 9.5 SENSITIVITY
CalSim-II
Flow below Nimbus Dam
Discretionary operations criteria corresponding to SWRCB D-893 required minimum flow
Same Same (b)(2) Minimum Instream Flow managements
Same American River Flow Management s
Same
Sacramento Area Water Forum "Replacement" Water
"Replacement" water is not implemented
Same Same Same Same Same Same
Stanislaus River Flow below
Goodwin Dam 1997 New Melones Interim Operations Plan
Same Same Same Draft Transitional Operations Planr
Same Same
San Joaquin River Flow at
Vernalis D1641 Same Same Same Same Sameq Same
OPERATIONS CRITERIA: SYSTEMWIDE CVP water allocation CVP
Settlement and Exchange
100% (75% in Shasta critical years)
Same Same Same Same Same Same
CVP refuges 100% (75% in Shasta critical years)
Same Same Same Same Same Same
CVP agriculture
100%-0% based on supply (South-of-Delta allocations are reduced due to D-1641 and 3406(b)(2) allocation-related export restrictions)
Same Same Same Same Same Same
OCAP BA Appendix D
August 2008 D-41
Study 3a Study 6.0 COMPARISON
Study 6.1 COMPARISON
Study 7.0 BASE MODEL
Study 7.1 ANALYTICAL
Study 8.0 ANALYTICAL
Study 9.0 - 9.5 SENSITIVITY
CalSim-II
CVP municipal & industrial
100%-50% based on supply (South-of-Delta allocations are reduced due to D-1641 and 3406(b)(2) allocation-related export restrictions)
Same Same Same Same Same Same
SWP water allocation North of Delta
(FRSA) Contract specific
Same Same Same Same Same Same
South of Delta (including North Bay Aqueduct)
Based on supply; equal prioritization between Ag and M&I based on Monterey Agreement
Same Same Same Same Same Same
CVP-SWP coordinated operations Sharing of
responsibility for in-basin-use
1986 Coordinated Operations Agreement (FRWP EBMUD and 2/3 of the North Bay Aqueduct diversions are considered as Delta Export, 1/3 of the North Bay Aqueduct diversion is considered as in-basin-use)
Same Same Same Same Same Same
Appendix D OCAP BA
D-42 August 2008
Study 3a Study 6.0 COMPARISON
Study 6.1 COMPARISON
Study 7.0 BASE MODEL
Study 7.1 ANALYTICAL
Study 8.0 ANALYTICAL
Study 9.0 - 9.5 SENSITIVITY
CalSim-II
Sharing of surplus flows
1986 Coordinated Operations Agreement
Same Same Same Same Same Same
Sharing of Export/Inflow Ratio
Equal sharing of export capacity under SWRCB D-1641; use of CVPIA 3406(b)(2) restricts only CVP and/or SWP exports
Same Same Same Same Same Same
Sharing of export capacity for lesser priority and wheeling related pumping
Cross Valley Canal wheeling (max of 128 TAF/year), CALFED ROD defined Joint Point of Diversion (JPOD)
Same Same Same Same Same Same
Study assumptions from above apply Study 6a Study 7a Study 7a Study 7.1a Study 8a NA
CVPIA 3406(b)(2): Per May 2003 Dept. of Interior Decision
Allocation 800 TAF, 700 TAF in 40-30-30 dry years, and 600 TAF in 40-30-30 critical yearsn
Same Same Same Same Same NA
Study assumptions from above apply Study 6b Study 7b Study 7b Study 7.1b Study 8b NA
CALFED Environmental Water Account / Limited Environmental Water Account
OCAP BA Appendix D
August 2008 D-43
Study 3a Study 6.0 COMPARISON
Study 6.1 COMPARISON
Study 7.0 BASE MODEL
Study 7.1 ANALYTICAL
Study 8.0 ANALYTICAL
Study 9.0 - 9.5 SENSITIVITY
CalSim-II
Actions Dec-Feb reduce total exports by 50 TAF/mon relative to total exports without EWA; VAMP (Apr 15 - May 16) export restriction on SWP; Post (May 16-31) VAMP export restriction on SWP and potentially on CVP if B2 Post-VAMP action is not taken; Ramping of exports (Jun)
Dec/Jan 50 TAF/mon export reduction, Feb 50 TAF export reduction in Wet/AN years, Feb/Mar 100, 75, or 50 TAF reduction dependent on species habitat conditions; VAMP (Apr 15 - May 16) export restriction on SWP; Pre (Apr 1-14) VAMP export reduction in Dry/Crit years; Post (May 16-31) export restriction; June ramping restriction if PostVAMP action was done. Pre- and Post- VAMP and June actions done if foreseeable October debt at San Luis does not exceed 150 TAF.
NA Same VAMP (Apr 15 - May 16) 31-day export restriction on SWP; If stored assets and purchases from the Yuba are sufficient, Post (May 16-31) VAMP export restrictions apply to SWPpq
Same NA The EWA actions, assets, and debt were revised and vetted as part of the Long Term Environmental Water Account EIS/R project
Appendix D OCAP BA
D-44 August 2008
Study 3a Study 6.0 COMPARISON
Study 6.1 COMPARISON
Study 7.0 BASE MODEL
Study 7.1 ANALYTICAL
Study 8.0 ANALYTICAL
Study 9.0 - 9.5 SENSITIVITY
CalSim-II
Assets Fixed Water Purchases 250 TAF/yr, 230 TAF/yr in 40-30-30 dry years, 210 TAF/yr in 40-30-30 critical years. The purchases range from 0 TAF in Wet years to approximately 153 TAF in Critical years NOD, and 57 TAF in Critical years to 250 TAF in Wet years SOD. Variable assets include the following: use of 50% of any CVPIA 3406(b)(2) releases pumped by SWP, flexing of Delta E/I Ratio (post-processed from CalSim-II results), additional 500 CFS pumping capacity at Banks in Jul-Sep
Fixed Water Purchases 250 TAF/yr, 230 TAF/yr in 40-30-30 dry years, 210 TAF/yr in 40-30-30 critical years. NOD share of annual purchase target ranges from 90% to 50% based on SWP Ag Allocation as an indicator of conveyance capacity. Variable/operational assets include use of 50% of any CVPIA 3406(b)(2) releases pumped by SWP, additional 500 CFS pumping capacity at Banks in Jul-Sep, source shifting, Semitropic Groundwater Bank, “spill” of San Luis carryover debt, and backed-up stored water from Spring EWA actions.
NA Same Purchase of Yuba River stored water under the Lower Yuba River Accord (average of 48 TAF/yr), use of 50% of any CVPIA 3406 (b)(2) releases pumped by SWP, additional 500 CFS pumping capactiy at Banks in Jul-Sep.
Same NA
OCAP BA Appendix D
August 2008 D-45
Study 3a Study 6.0 COMPARISON
Study 6.1 COMPARISON
Study 7.0 BASE MODEL
Study 7.1 ANALYTICAL
Study 8.0 ANALYTICAL
Study 9.0 - 9.5 SENSITIVITY
CalSim-II
Debt Delivery debt paid back in full upon assessment; Storage debt paid back over time based on asset/action priorities; SOD and NOD debt carryover is explicitly managed or spilled; NOD debt carryover must be spilled; SOD and NOD asset carryover is allowed
Same NA Same No Carryover Debt
Same NA
Post Processing Assumptions WATER MANAGEMENT ACTIONS (CALFED) Water Transfers Water
transfers Acquisitions by SWP contractors are wheeled at priority in Banks Pumping Plant over non-SWP users
Same NA Same Same Same NA
Phase 8o Evaluate available capacity
Same NA Same Same Same
Refuge Level 4 water
Evaluate available
Same NA Same Same Same
Appendix D OCAP BA
D-46 August 2008
Study 3a Study 6.0 COMPARISON
Study 6.1 COMPARISON
Study 7.0 BASE MODEL
Study 7.1 ANALYTICAL
Study 8.0 ANALYTICAL
Study 9.0 - 9.5 SENSITIVITY
CalSim-II
capacity Notes: a The OCAP BA project description is presented in Chapter 2.
bClimate change sensitivity analysis assumptions and documentation are presented in Appendix R.
c The Sacramento Valley hydrology used in the CALSIM II model reflects 2020 land-use assumptions associated with Bulletin 160-98. The San Joaquin Valley hydrology reflects draft 2030 land-use assumptions developed by Reclamation. Development of 2030 land-use assumptions are being coordinated with the California Water Plan Update for future models.
d CVP contract amounts have been reviewed and updated according to existing and amended contracts as appropriate. Assumptions regarding CVP agricultural and M&I service contracts and Settlement Contract amounts are documented in Table 3A (North of Delta) and 5A (South of Delta) of Appendix D: Delivery Specifications section of the Technical Appendix.
e SWP contract amounts have been reviewed and updated as appropriate. Assumptions regarding SWP agricultural and M&I contract amounts are documented in Table 1A (North of Delta) and Table 2A (South of Delta) of Appendix D: Delivery Specifications section.
f Water needs for federal refuges have been reviewed and updated as appropriate. Assumptions regarding firm Level 2 refuge water needs are documented in Table 3A (North of Delta) and 5A (South of Delta) of Appendix D:Delivery Specifications. Incremental Level 4 refuge water needs have been documented as part of the assumptions of future water transfers.
g PCWA demand in the foreseeable existing condition is 8.5 TAF/yr of CVP contract supply diverted at the new American River PCWA Pump Station. In the future scenario, PCWA is allowed 35 TAF/yr. Assumptions regarding American River water rights and CVP contracts are documented in Table 5 of Appendix D: Delivery Specifications section.
h The new CalSim-II representation of the San Joaquin River has been included in this model package (CalSim-II San Joaquin River Model, Reclamation, 2005). Updates to the San Joaquin River have been included since the preliminary model release in August 2005. The model reflects the difficulties of on-going groundwater overdraft problems. The 2030 level of development representation of the San Joaquin River Basin does not make any attempt to offer solutions to on-going groundwater overdraft problems. In addition, a dynamic groundwater simulation is not yet developed for San Joaquin River Valley. Groundwater extraction/ recharge and stream-groundwater interaction are static assumptions and may not accurately reflect a response to simulated actions. These limitations should be considered in the analysis of results.
OCAP BA Appendix D
August 2008 D-47
Study 3a Study 6.0 COMPARISON
Study 6.1 COMPARISON
Study 7.0 BASE MODEL
Study 7.1 ANALYTICAL
Study 8.0 ANALYTICAL
Study 9.0 - 9.5 SENSITIVITY
CalSim-II
i Study 6.0 demands for CCWD are assumed equal to Study 7.0 due to data availablity with the revised CalSim-II model framework. For all Studies, Los Vaqueros Reservoir storage capacity is 100 TAF.
j Table A deliveries into the San Francisco Bay Area Region for existing cases are based on a variable demand and a full Table A for future cases. The variable demand is dependent on the availability of other water during wet years resulting in less demand for Table A. In the future cases it is assumed that the demand for full Table A will be independent of other water sources. Article 21 demand assumes MWD demand of 100 TAF/mon (Dec-Mar), Kern demand of 180 TAF/mon (Jan-Dec), and other contractor demand of 34 TAF/mon (Jan-Dec).
k PCWA American River pumping facility upstream of Folsom Lake is under construction.
l Mokelumne River flows reflect EBMUD supplies associated with the Freeport Regional Water Project.
m The CCWD Alternate Intake Project (AIP), an intake at Victoria Canal, which operates as an alternate Delta diversion for Los Vaqueros Reservoir is not included in Study 8.0. AIP is included as a separate consultation. AIP will be further evaluated after regulatory and operational managment assumptions have been determined.
n The allocation representation in CalSim-II replicates key processes, shortage changes are checked by post-processing.
o This Phase 8 requirement is assumed to be met through Sacramento Valley Water Management Agreement Implementation.
p OCAP BA 2004 modeling used available hydrology at the time which was data developed based on 1965 Yuba County Water Agency -Department of Fish of Game Agreement. Since the OCAP BA 2004 modeling, Yuba River hydrology was revised. Interim D-1644 is assumed to be fully implemented with or without the implementation of the Lower Yuba River Accord. This is consistent with the future no-action condition being assumed by the Lower Yuba River Accord EIS/EIR study team. For studies with the Lower Yuba River Accord, an adjusted hydrology is used.
q It is assumed that either VAMP, a functional equivalent, or D-1641 requirements would be in place in 2030.
r The Draft Transitional Operations Plan assumptions are discussed in Chapter 2.
s For Studies 7.0, 7.1, and 8.0 the flow components of the proposed American River Flow Management are included and applied using the CVPIA 3406(b)(2). For Study 8.0 the American River Flow Management is assumed to be the new minimum instream flow.
t OCAP assumes the flexibility of diversion location but does not assume the Sacramento Area Water Forum Water Forum "replacement water" in drier water year types.
Appendix D OCAP BA
D-48 August 2008
Study 3a Study 6.0 COMPARISON
Study 6.1 COMPARISON
Study 7.0 BASE MODEL
Study 7.1 ANALYTICAL
Study 8.0 ANALYTICAL
Study 9.0 - 9.5 SENSITIVITY
CalSim-II
u Aqueduct improvements that would allow an increase in South Bay Aqueduct demand at the time of model development were expected to be operational within 6 months. However, a delay in the construction has postponed the completion.
VThe Artificial Neural Network (ANN) was updated for both salinity and X2 calculations. Study 3a does not include an updated ANN, Study 6.1 has an updated salinity but not X2, and all remaining Studies include both the updated salinity and X2.
w North Bay Article 21 deliveries are dependent on excess conditions rather than being dependent on San Luis storage.
OCAP BA Appendix D
August 2008 D-49
Historical Comparison Comparison of CalSim-II predictions with observed historical estimates helps establish the credibility of the model and provides estimates of its accuracy by comparing its performance to actual historical operations. A historical comparison was conducted for CVP and SWP operations in the Historical Operations Study of water years 1975 to 1998 (DWR 2003).
The documented comparison of historical and simulated records (from the early 1983 to 2003) for CalSim-II San Joaquin River Basin show the frequency of peaks and troughs coinciding from visual inspection. This information affirms water entering and leaving the system is occurring with approximately the same timing and strengthens confidence of the timing of the operational logic (DWR and Reclamation, 2007).
Sensitivity/Uncertainty in Inputs Sensitivity analysis explores and quantifies the effects of various inputs on the model outputs. In 2005, DWR released a sensitivity study of 21 input parameters under D-1641 regulatory environment that developed a sensitivity index (SI) and elasticity index (EI). Key input parameters that significantly affect SWP operations are discussed to show how the SWP delivery and other operations respond to the changes in model inputs (DWR. 2005).
In 2007, another sensitivity study was released by DWR and Reclamation on CalSim-II San Joaquin River model (DWR and Reclamation, 2007). The study analyzed variables estimated in water budget analysis such as deep percolation, non-recoverable loss, irrigation efficiency, minimum ground water pumping and distribution losses. Other important parameters examined include water quality loads, land use estimates, consumptive use parameters, inflows and accretions.
Reporting Metrics There are many different general categories of CalSim-II model output metrics. A general list of parameters presented in the OCAP BA includes:
• End of September Storage • River Flows • CalSim Delta Parameters • Allocation Percentage • Deliveries • D1641 WQCP parameters • (b)(2)
o Average monthly costs
o Probability Exceedance
o Requested Export Actions vs. Amount used
o Percent of possible actions triggered
Appendix D OCAP BA
D-50 August 2008
• EWA
o Probability Exceedance VAMP expenditures
o Expenditures by water year type
o Expenditures not repaid
o Probability Exceedance carryover debt
o Probability Exceedance Purchases NOD and SOD
o Probability Exceedance Total Acquired Assets
o Annual Carryover Debt spill/SWP San Luis
o Annual Expenditure Targets by water year type
o Annual Assets by water year
o Annual debt
o Total Export reductions by water year
• Delta o X2 position o EI Ratio o Deliveries o Inflow o Outflow o Exports
OCAP BA Appendix D
August 2008 D-51
References CALFED Bay-Delta Program. 2005. Interim Update of the CALFED Bay-Delta Program
Surface Storage Investigations: Interim Common Model Package, Modeling Protocol and Assumptions. Technical Memorandum Report. Availability: http://www.storage.water.ca.gov/docs/Interim_Update_Modeling_TM_050405.pdf
Close A., Haneman W.M., Labadie J.W., Loucks D.P. (chair), Lund J.R., McKinney D.C., Stedinger J.R. 2003. A Strategic Review of CalSim-II and its Use for Water Planning, Management, and Operations in Central California. Oakland, CA: Submitted to the California Bay Delta Authority Science Program, Association of Bay Governments. 4 Dec. Availability: http://science.calwater.ca.gov/pdf/CalSim_Review.pdf.
[DWR] California Department of Water Resources, Bay-Delta Office. 2003b. CalSim-II Simulation of Historical SWP-CVP Operations. Technical Memorandum Report. Nov. Availability: http://science.calwater.ca.gov/pdf/CalSimII_Simulation.pdf.
[DWR] California Department of Water Resources, Bay-Delta Office. 2005. The State Water Project Delivery Reliability Report 2005. Final. http://baydeltaoffice.water.ca.gov/swpreliability/SWPRel05_final.pdf
[DWR and Reclamation] California Department of Water Resources, and US Bureau of Reclamation. 2004. Peer Review Response: A Report by DWR/USBR in Reply to the Peer Review of the CalSim-II Model Sponsored by the CALFED Science Program In December 2003. Jul. Availability: http://baydeltaoffice.water.ca.gov/modeling/hydrology/Peer%20Review%20Response%20(August%202004).pdf
[DWR and Reclamation] California Department of Water Resources, and US Bureau of Reclamation. 2007. Peer Review Response: A Report in Reply to the Peer Review of the CalSim-II San Joaquin River Model January 2006. Availability: http://www.usbr.gov/mp/mp700/modeling/calsim/calsim_rpt.pdf
Ferreira I.C., S. K. Tanaka, S. P. Hollinshhead and J. R. Lund, 2005. Musings on a Model: CalSim-II in California’s Water Community. San Fransisco Estuary and Watershed Science Vol. 3, Issue 1, March
Ford D., Grober L., Harmon T., Lund J., McKinney D., Review Panel Report San Joaquin River Valley CalSim-II Model Review, 2006. January.
Draper, et al. 2004. CalSim: Generalized Model for Reservoir System Analysis. ASCE Journal of Water Resources Planning and Management, November/December 2004.
[DWR] California Department of Water Resources. 2005. CalSim-II Model Sensitivity Analysis Study October 2005. Technical Memorandum Report. Availability: http://baydeltaoffice.water.ca.gov/announcement/SensitivityStudyReport_012406_Web.pdf