35
APPENDIX D MIKE11 Structure Summary

APPENDIX D
MIKE11 Structure Summary
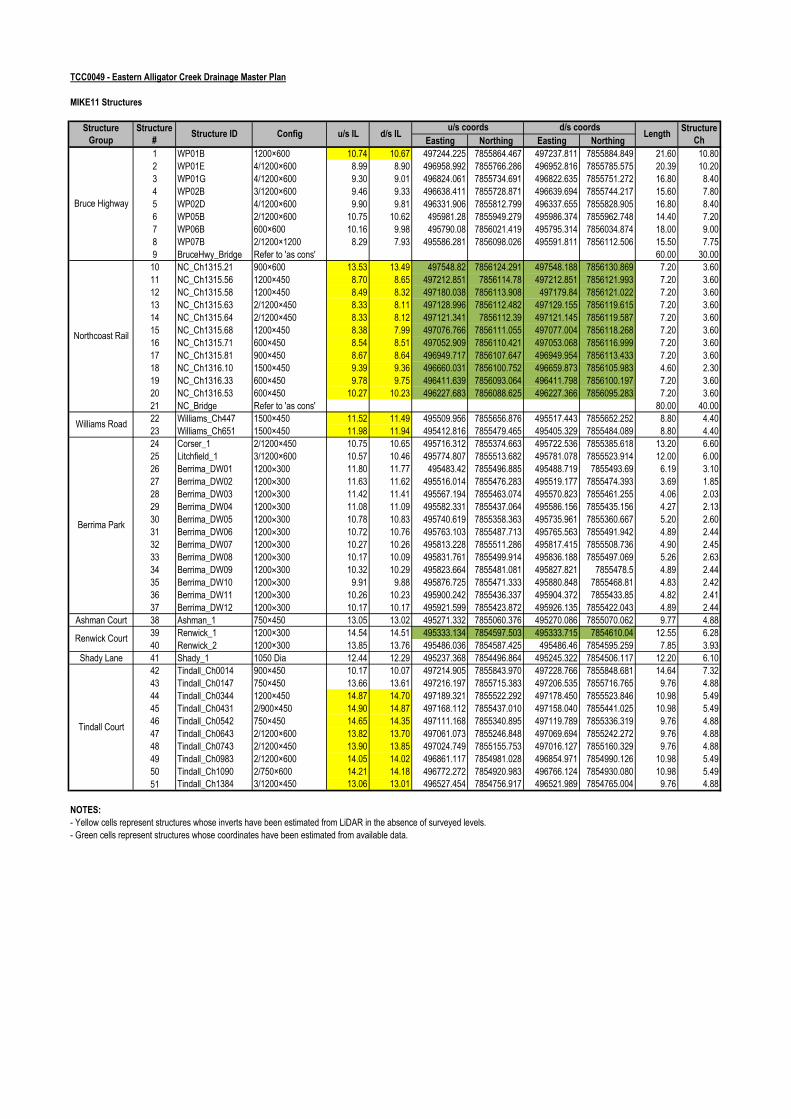
TCC0049 - Eastern Alligator Creek Drainage Master Plan
MIKE11 Structures
Easting Northing Easting Northing
1 WP01B 1200×600 10.74 10.67 497244.225 7855864.467 497237.811 7855884.849 21.60 10.80
2 WP01E 4/1200×600 8.99 8.90 496958.992 7855766.286 496952.816 7855785.575 20.39 10.20
3 WP01G 4/1200×600 9.30 9.01 496824.061 7855734.691 496822.635 7855751.272 16.80 8.40
4 WP02B 3/1200×600 9.46 9.33 496638.411 7855728.871 496639.694 7855744.217 15.60 7.80
5 WP02D 4/1200×600 9.90 9.81 496331.906 7855812.799 496337.655 7855828.905 16.80 8.40
6 WP05B 2/1200×600 10.75 10.62 495981.28 7855949.279 495986.374 7855962.748 14.40 7.20
7 WP06B 600×600 10.16 9.98 495790.08 7856021.419 495795.314 7856034.874 18.00 9.00
8 WP07B 2/1200×1200 8.29 7.93 495586.281 7856098.026 495591.811 7856112.506 15.50 7.75
9 BruceHwy_Bridge Refer to 'as cons' 60.00 30.00
10 NC_Ch1315.21 900×600 13.53 13.49 497548.82 7856124.291 497548.188 7856130.869 7.20 3.60
11 NC_Ch1315.56 1200×450 8.70 8.65 497212.851 7856114.78 497212.851 7856121.993 7.20 3.60
12 NC_Ch1315.58 1200×450 8.49 8.32 497180.038 7856113.908 497179.84 7856121.022 7.20 3.60
13 NC_Ch1315.63 2/1200×450 8.33 8.11 497128.996 7856112.482 497129.155 7856119.615 7.20 3.60
14 NC_Ch1315.64 2/1200×450 8.33 8.12 497121.341 7856112.39 497121.145 7856119.587 7.20 3.60
15 NC_Ch1315.68 1200×450 8.38 7.99 497076.766 7856111.055 497077.004 7856118.268 7.20 3.60
16 NC_Ch1315.71 600×450 8.54 8.51 497052.909 7856110.421 497053.068 7856116.999 7.20 3.60
17 NC_Ch1315.81 900×450 8.67 8.64 496949.717 7856107.647 496949.954 7856113.433 7.20 3.60
18 NC_Ch1316.10 1500×450 9.39 9.36 496660.031 7856100.752 496659.873 7856105.983 4.60 2.30
19 NC_Ch1316.33 600×450 9.78 9.75 496411.639 7856093.064 496411.798 7856100.197 7.20 3.60
20 NC_Ch1316.53 600×450 10.27 10.23 496227.683 7856088.625 496227.366 7856095.283 7.20 3.60
21 NC_Bridge Refer to 'as cons' 80.00 40.00
22 Williams_Ch447 1500×450 11.52 11.49 495509.956 7855656.876 495517.443 7855652.252 8.80 4.40
23 Williams_Ch651 1500×450 11.98 11.94 495412.816 7855479.465 495405.329 7855484.089 8.80 4.40
24 Corser_1 2/1200×450 10.75 10.65 495716.312 7855374.663 495722.536 7855385.618 13.20 6.60
25 Litchfield_1 3/1200×600 10.57 10.46 495774.807 7855513.682 495781.078 7855523.914 12.00 6.00
26 Berrima_DW01 1200×300 11.80 11.77 495483.42 7855496.885 495488.719 7855493.69 6.19 3.10
27 Berrima_DW02 1200×300 11.63 11.62 495516.014 7855476.283 495519.177 7855474.393 3.69 1.85
28 Berrima_DW03 1200×300 11.42 11.41 495567.194 7855463.074 495570.823 7855461.255 4.06 2.03
29 Berrima_DW04 1200×300 11.08 11.09 495582.331 7855437.064 495586.156 7855435.156 4.27 2.13
30 Berrima_DW05 1200×300 10.78 10.83 495740.619 7855358.363 495735.961 7855360.667 5.20 2.60
31 Berrima_DW06 1200×300 10.72 10.76 495763.103 7855487.713 495765.563 7855491.942 4.89 2.44
32 Berrima_DW07 1200×300 10.27 10.26 495813.228 7855511.286 495817.415 7855508.736 4.90 2.45
33 Berrima_DW08 1200×300 10.17 10.09 495831.761 7855499.914 495836.188 7855497.069 5.26 2.63
34 Berrima_DW09 1200×300 10.32 10.29 495823.664 7855481.081 495827.821 7855478.5 4.89 2.44
35 Berrima_DW10 1200×300 9.91 9.88 495876.725 7855471.333 495880.848 7855468.81 4.83 2.42
36 Berrima_DW11 1200×300 10.26 10.23 495900.242 7855436.337 495904.372 7855433.85 4.82 2.41
37 Berrima_DW12 1200×300 10.17 10.17 495921.599 7855423.872 495926.135 7855422.043 4.89 2.44
Ashman Court 38 Ashman_1 750×450 13.05 13.02 495271.332 7855060.376 495270.086 7855070.062 9.77 4.88
39 Renwick_1 1200×300 14.54 14.51 495333.134 7854597.503 495333.715 7854610.04 12.55 6.28
40 Renwick_2 1200×300 13.85 13.76 495486.036 7854587.425 495486.46 7854595.259 7.85 3.93
Shady Lane 41 Shady_1 1050 Dia 12.44 12.29 495237.368 7854496.864 495245.322 7854506.117 12.20 6.10
42 Tindall_Ch0014 900×450 10.17 10.07 497214.905 7855843.970 497228.766 7855848.681 14.64 7.32
43 Tindall_Ch0147 750×450 13.66 13.61 497216.197 7855715.383 497206.535 7855716.765 9.76 4.88
44 Tindall_Ch0344 1200×450 14.87 14.70 497189.321 7855522.292 497178.450 7855523.846 10.98 5.49
45 Tindall_Ch0431 2/900×450 14.90 14.87 497168.112 7855437.010 497158.040 7855441.025 10.98 5.49
46 Tindall_Ch0542 750×450 14.65 14.35 497111.168 7855340.895 497119.789 7855336.319 9.76 4.88
47 Tindall_Ch0643 2/1200×600 13.82 13.70 497061.073 7855246.848 497069.694 7855242.272 9.76 4.88
48 Tindall_Ch0743 2/1200×450 13.90 13.85 497024.749 7855155.753 497016.127 7855160.329 9.76 4.88
49 Tindall_Ch0983 2/1200×600 14.05 14.02 496861.117 7854981.028 496854.971 7854990.126 10.98 5.49
50 Tindall_Ch1090 2/750×600 14.21 14.18 496772.272 7854920.983 496766.124 7854930.080 10.98 5.49
51 Tindall_Ch1384 3/1200×450 13.06 13.01 496527.454 7854756.917 496521.989 7854765.004 9.76 4.88
NOTES:
- Yellow cells represent structures whose inverts have been estimated from LiDAR in the absence of surveyed levels.
- Green cells represent structures whose coordinates have been estimated from available data.
Structure
#
Northcoast Rail
Bruce Highway
Renwick Court
Tindall Court
Structure
Group
Williams Road
Structure
ChStructure ID Config u/s IL d/s IL Length
Berrima Park
d/s coordsu/s coords
APPENDIX E
Berrima Park 13/04/14 Flood Event Photos & Sketch Plan (Residents’ Submission)
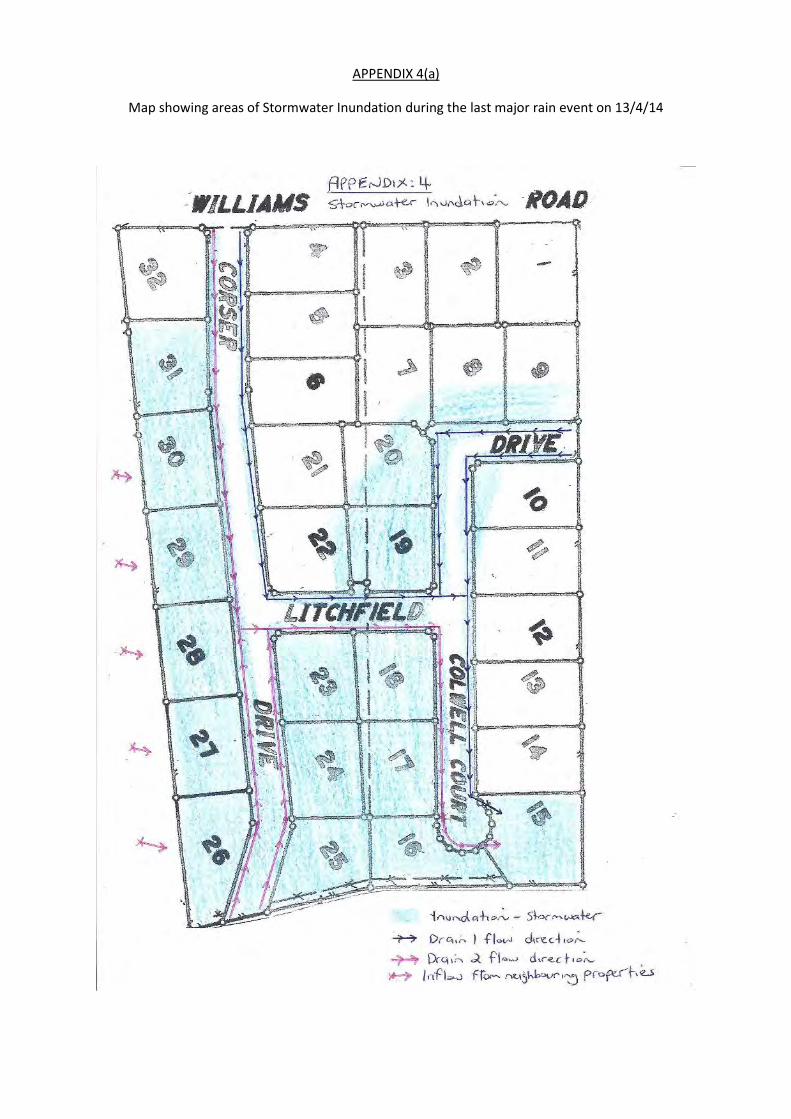
APPENDIX 4(a)
Map showing areas of Stormwater Inundation during the last major rain event on 13/4/14
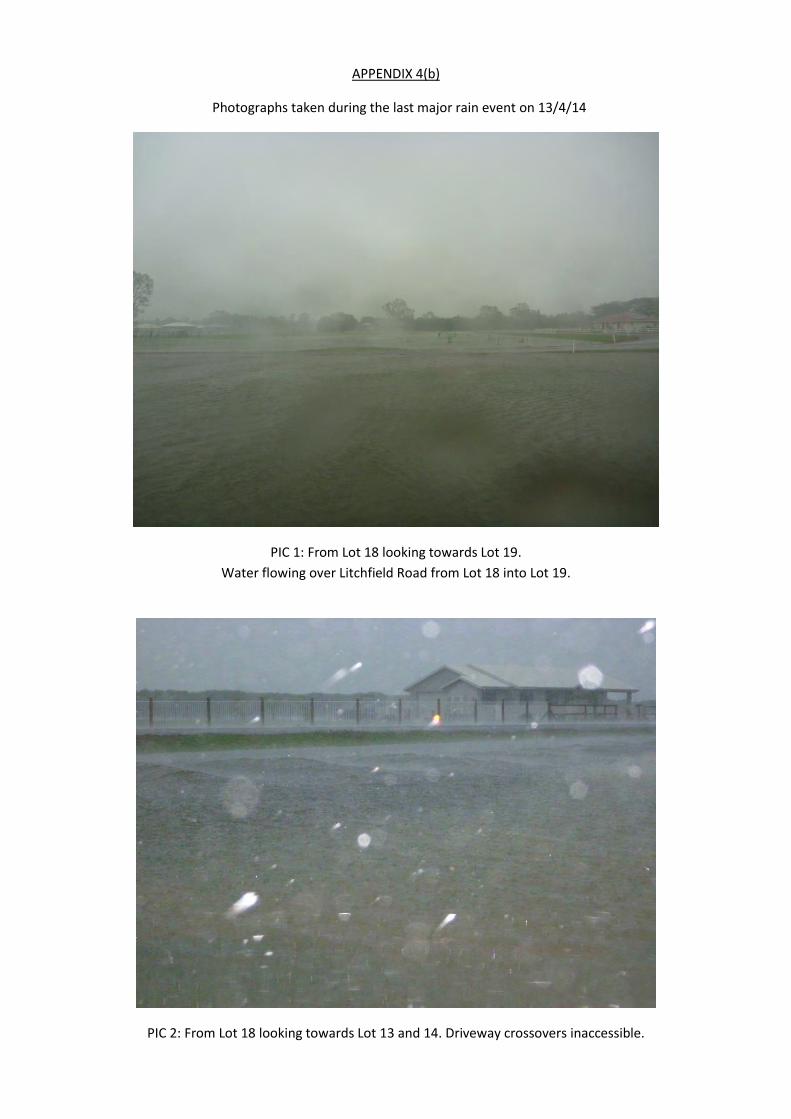
APPENDIX 4(b)
Photographs taken during the last major rain event on 13/4/14
PIC 1: From Lot 18 looking towards Lot 19.
Water flowing over Litchfield Road from Lot 18 into Lot 19.
PIC 2: From Lot 18 looking towards Lot 13 and 14. Driveway crossovers inaccessible.
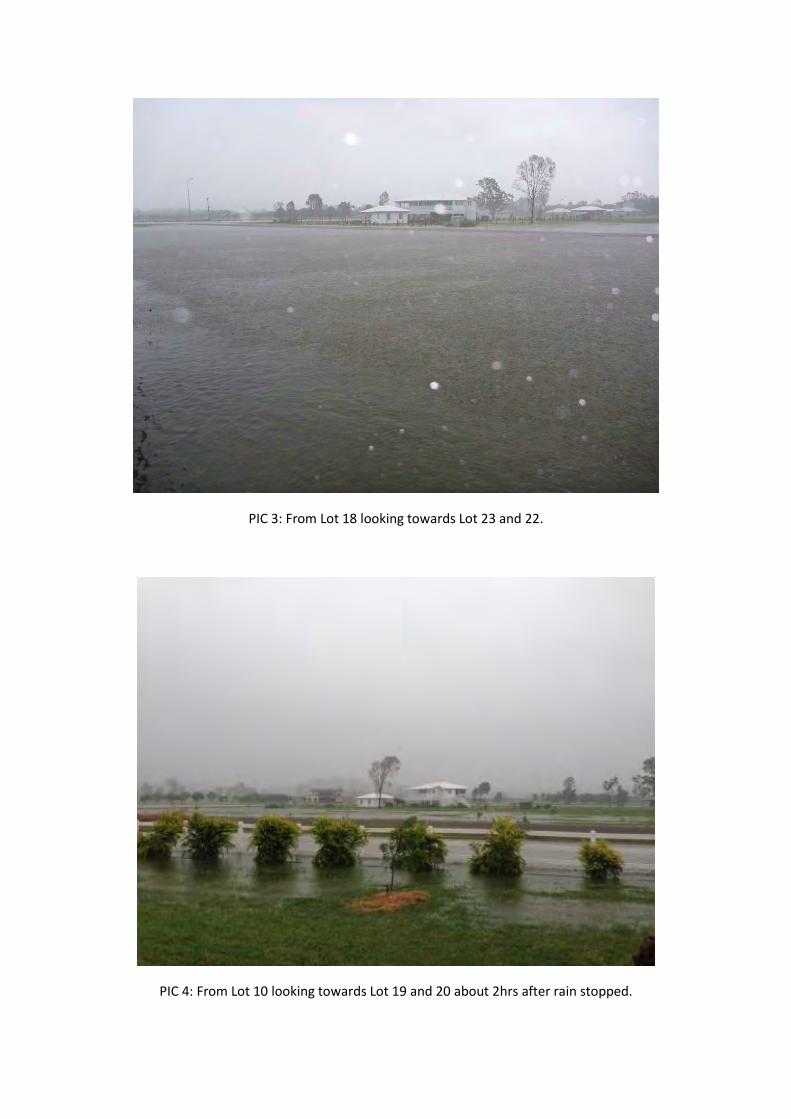
PIC 3: From Lot 18 looking towards Lot 23 and 22.
PIC 4: From Lot 10 looking towards Lot 19 and 20 about 2hrs after rain stopped.
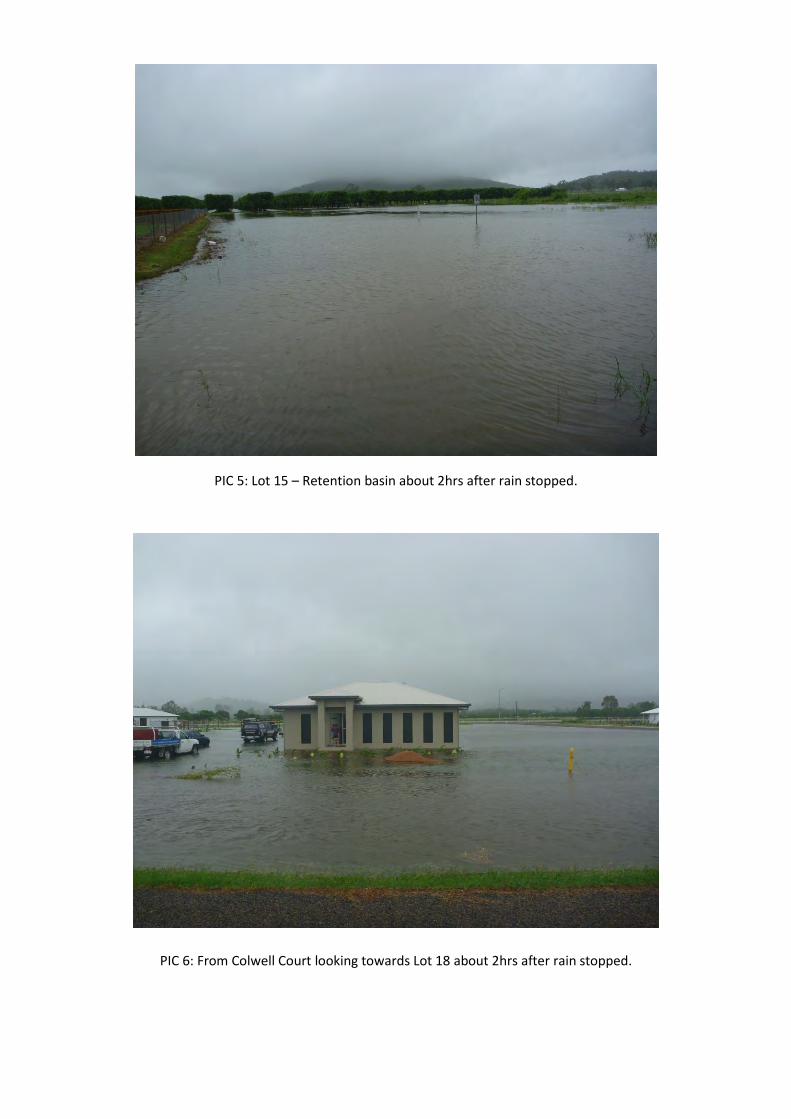
PIC 5: Lot 15 – Retention basin about 2hrs after rain stopped.
PIC 6: From Colwell Court looking towards Lot 18 about 2hrs after rain stopped.
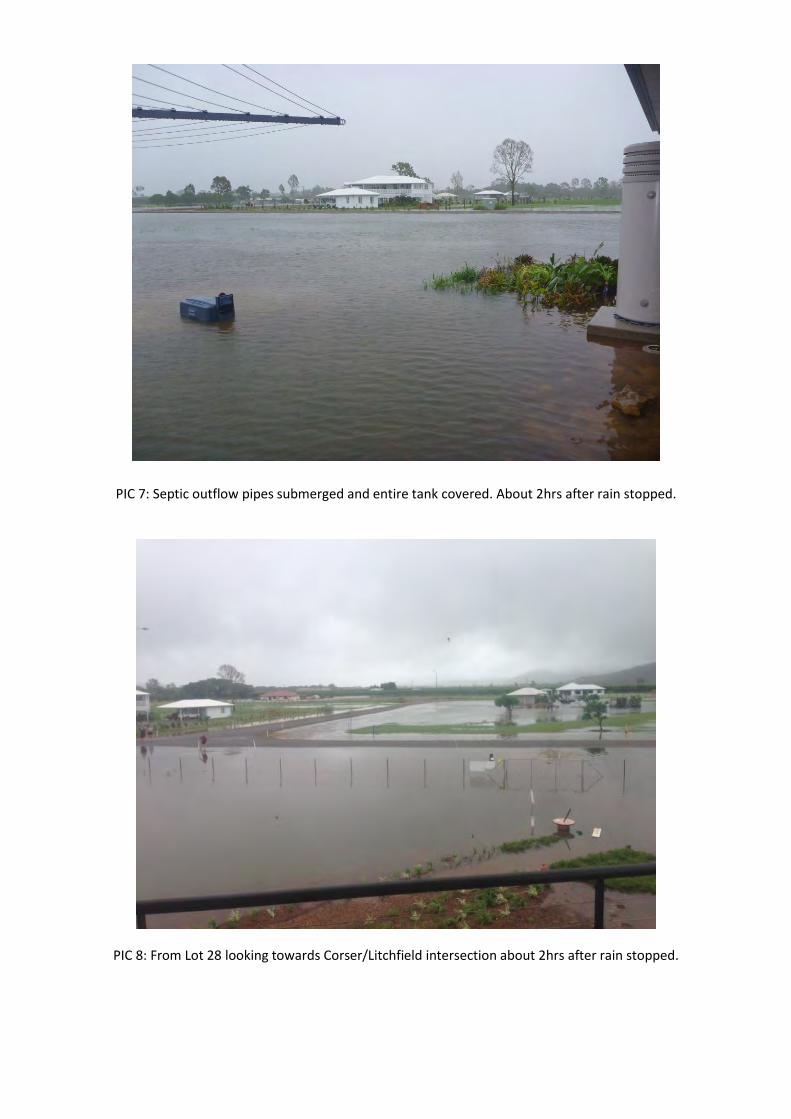
PIC 7: Septic outflow pipes submerged and entire tank covered. About 2hrs after rain stopped.
PIC 8: From Lot 28 looking towards Corser/Litchfield intersection about 2hrs after rain stopped.
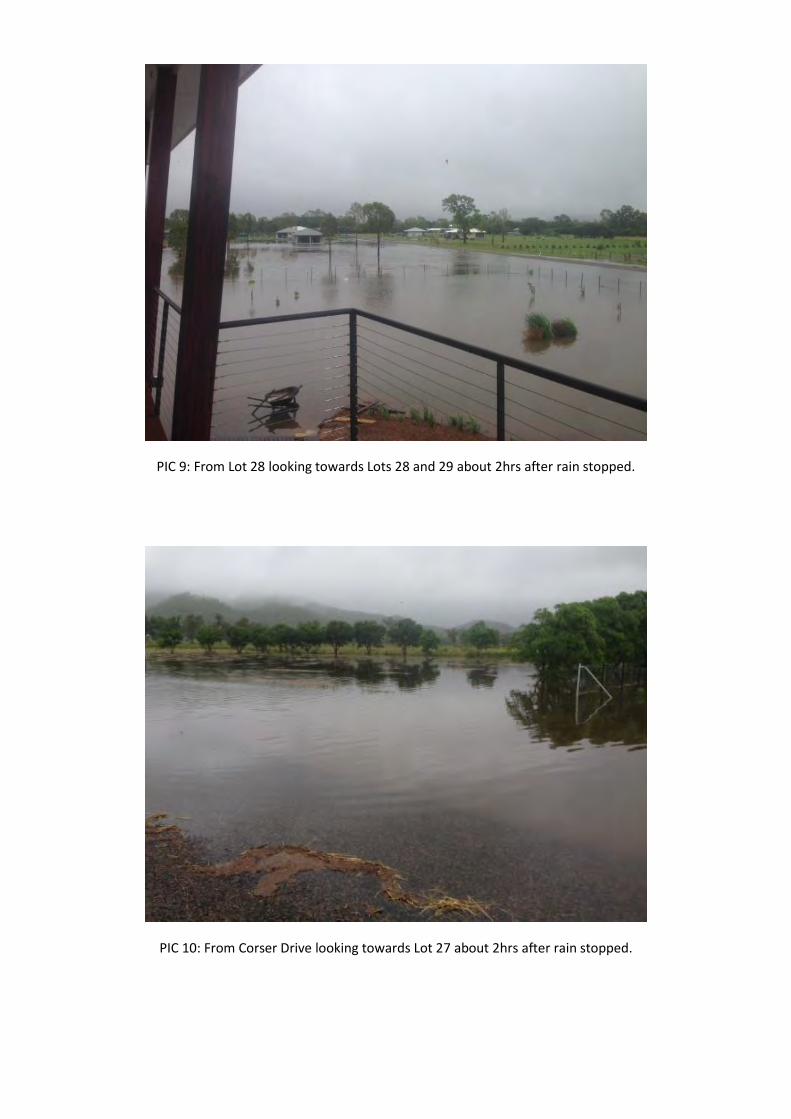
PIC 9: From Lot 28 looking towards Lots 28 and 29 about 2hrs after rain stopped.
PIC 10: From Corser Drive looking towards Lot 27 about 2hrs after rain stopped.
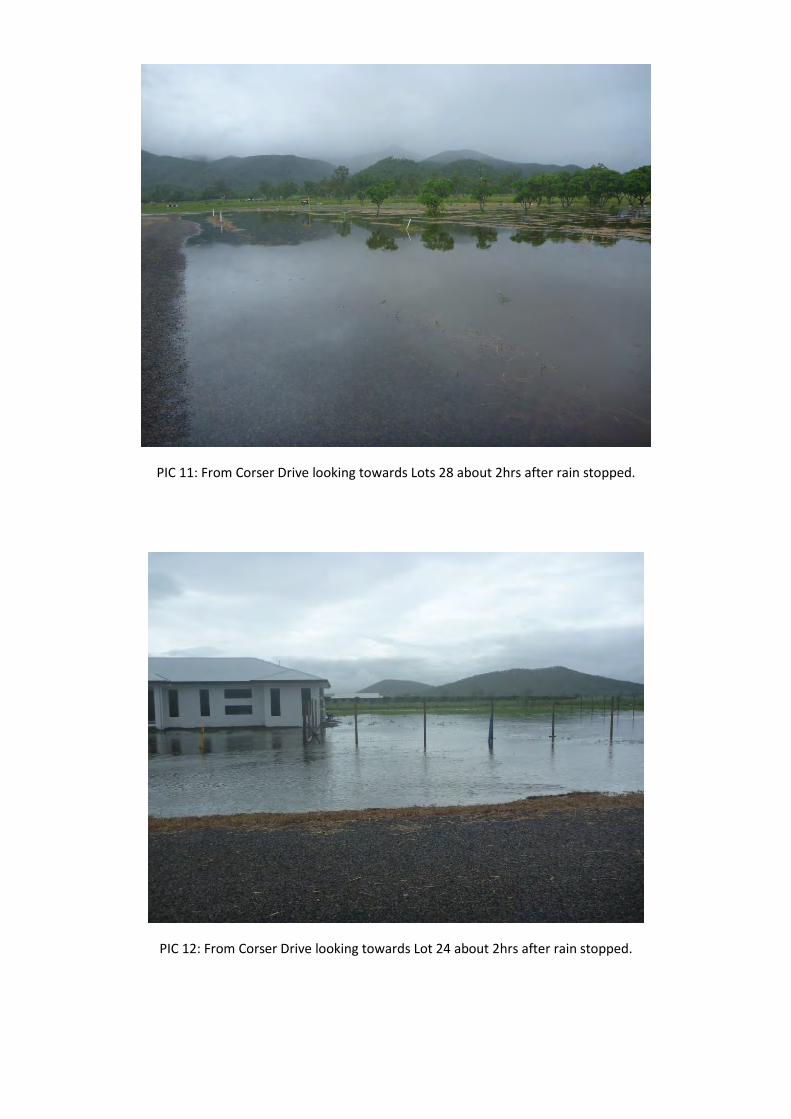
PIC 11: From Corser Drive looking towards Lots 28 about 2hrs after rain stopped.
PIC 12: From Corser Drive looking towards Lot 24 about 2hrs after rain stopped.
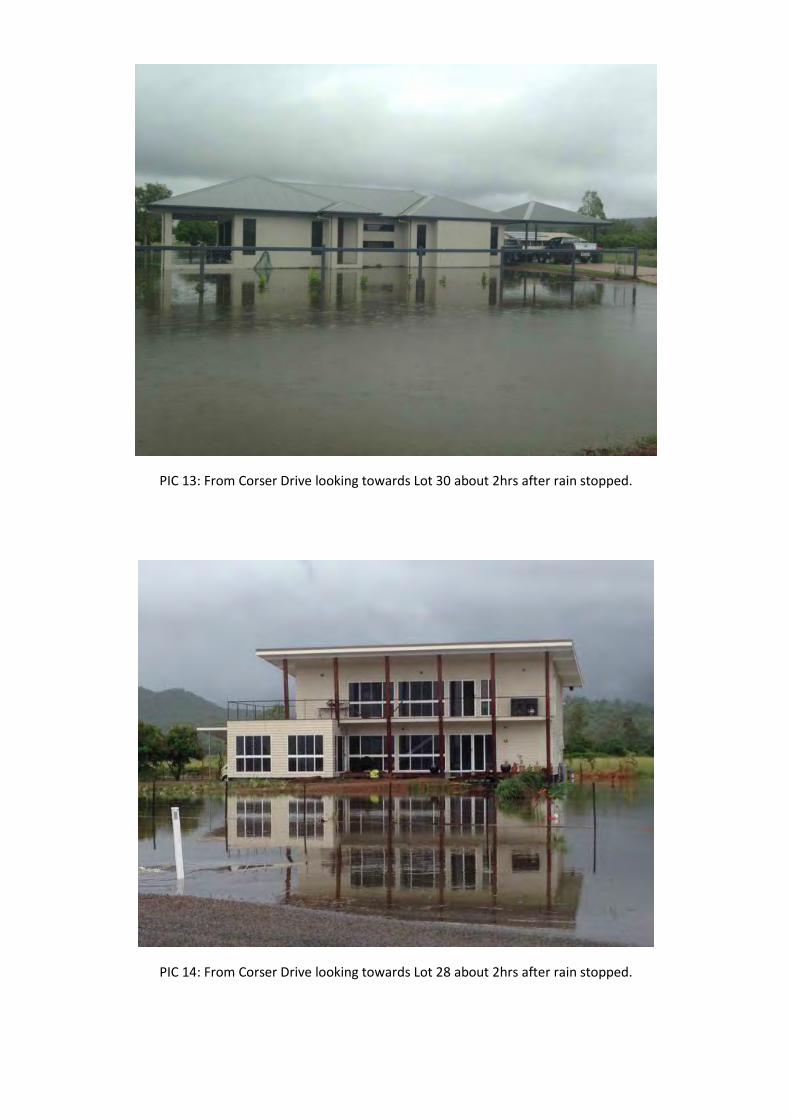
PIC 13: From Corser Drive looking towards Lot 30 about 2hrs after rain stopped.
PIC 14: From Corser Drive looking towards Lot 28 about 2hrs after rain stopped.

APPENDIX F
Flood Frequency Analysis – AMS Data
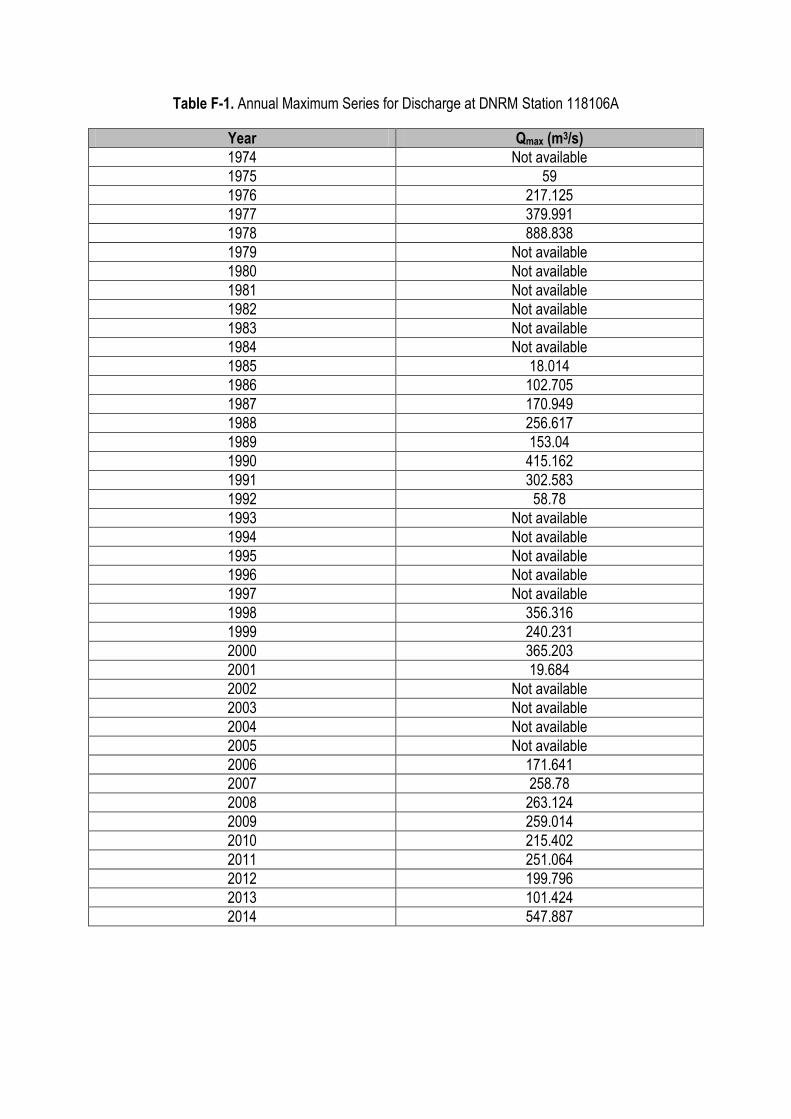
Table F-1. Annual Maximum Series for Discharge at DNRM Station 118106A
Year Qmax (m3/s)
1974 Not available
1975 59
1976 217.125
1977 379.991
1978 888.838
1979 Not available
1980 Not available
1981 Not available
1982 Not available
1983 Not available
1984 Not available
1985 18.014
1986 102.705
1987 170.949
1988 256.617
1989 153.04
1990 415.162
1991 302.583
1992 58.78
1993 Not available
1994 Not available
1995 Not available
1996 Not available
1997 Not available
1998 356.316
1999 240.231
2000 365.203
2001 19.684
2002 Not available
2003 Not available
2004 Not available
2005 Not available
2006 171.641
2007 258.78
2008 263.124
2009 259.014
2010 215.402
2011 251.064
2012 199.796
2013 101.424
2014 547.887

APPENDIX G
Flood Frequency Analysis – FLIKE Reports
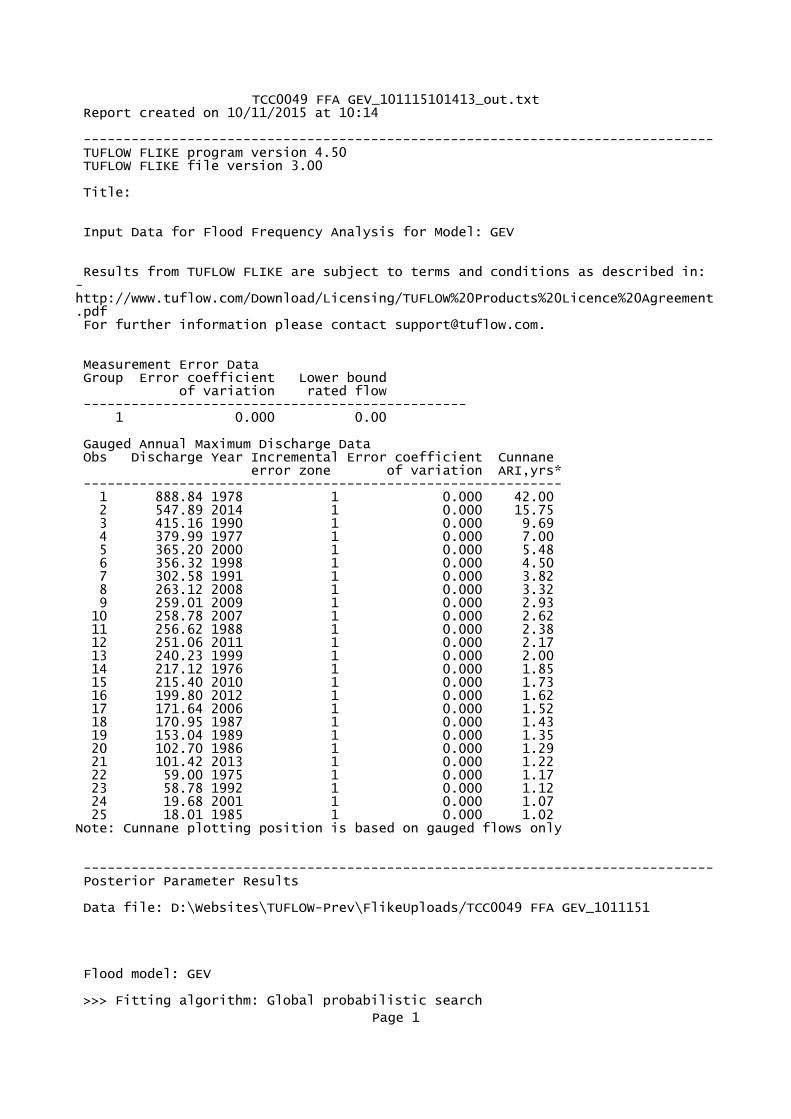
TCC0049 FFA GEV_101115101413_out.txt Report created on 10/11/2015 at 10:14
------------------------------------------------------------------------------- TUFLOW FLIKE program version 4.50 TUFLOW FLIKE file version 3.00
Title:
Input Data for Flood Frequency Analysis for Model: GEV
Results from TUFLOW FLIKE are subject to terms and conditions as described in:- http://www.tuflow.com/Download/Licensing/TUFLOW%20Products%20Licence%20Agreement.pdf For further information please contact [email protected].
Measurement Error Data Group Error coefficient Lower bound of variation rated flow ------------------------------------------------ 1 0.000 0.00
Gauged Annual Maximum Discharge Data Obs Discharge Year Incremental Error coefficient Cunnane error zone of variation ARI,yrs* ------------------------------------------------------------ 1 888.84 1978 1 0.000 42.00 2 547.89 2014 1 0.000 15.75 3 415.16 1990 1 0.000 9.69 4 379.99 1977 1 0.000 7.00 5 365.20 2000 1 0.000 5.48 6 356.32 1998 1 0.000 4.50 7 302.58 1991 1 0.000 3.82 8 263.12 2008 1 0.000 3.32 9 259.01 2009 1 0.000 2.93 10 258.78 2007 1 0.000 2.62 11 256.62 1988 1 0.000 2.38 12 251.06 2011 1 0.000 2.17 13 240.23 1999 1 0.000 2.00 14 217.12 1976 1 0.000 1.85 15 215.40 2010 1 0.000 1.73 16 199.80 2012 1 0.000 1.62 17 171.64 2006 1 0.000 1.52 18 170.95 1987 1 0.000 1.43 19 153.04 1989 1 0.000 1.35 20 102.70 1986 1 0.000 1.29 21 101.42 2013 1 0.000 1.22 22 59.00 1975 1 0.000 1.17 23 58.78 1992 1 0.000 1.12 24 19.68 2001 1 0.000 1.07 25 18.01 1985 1 0.000 1.02Note: Cunnane plotting position is based on gauged flows only
------------------------------------------------------------------------------- Posterior Parameter Results
Data file: D:\Websites\TUFLOW-Prev\FlikeUploads/TCC0049 FFA GEV_1011151
Flood model: GEV
>>> Fitting algorithm: Global probabilistic search
Page 1

TCC0049 FFA GEV_101115101413_out.txt
Parameter Lower bound Upper bound ------------------------------------- 1 -452.42452 785.49215 2 2.51601 7.12119 3 -2.50000 2.50000 >>> PENALTIES were added to log-posterior density <<<
Incremental error model: Log-normal
Solution PROBABLY found in 2491 iterations
Maximized log-posterior density = -161.215
No Parameter Initial value Most probable value --------------------------------------------------------------------- 1 Location u 166.53381 168.60874 2 loge (Scale a) 4.81860 4.82963 3 Shape k -0.09599 -0.07703
--------------------------------------------------Zero flow threshold: 0.0000 Number of gauged flows at or below flow threshold = 0
-------------------------------------------------- Parameter Moments based on Multi-normal Approximation to Posterior Distribution No Most probable Std dev Correlation --------------------------------------------------- 1 168.60874 28.40231 1.000 2 4.82963 0.16849 0.467 1.000 3 -0.07703 0.14885 0.346 0.213 1.000 --------------------------------------------------- Note: Parameters are roughly normally distributed. This approximation improves with sample size.
Summary of Posterior Moments from Importance Sampling No Mean Std dev Correlation ------------------------------------------------ 1 166.63242 30.70078 1.000 2 4.90422 0.18159 0.459 1.000 3 -0.14116 0.17279 0.266 0.071 1.000 ---------------- Note: Posterior expected parameters are the most accurate in the mean-squared-error sense. They should be used in preference to the most probable parameters
Lower bound = -788.718
Recurrence Exp parameter Monte Carlo 90% quantile Mean(log10(q)) Stdev(log10(q)) interval quantile probability limits yrs --------------------------------------------------------------------------------------- 1.100 55.68 4.72 94.7 1.6952 0.2665 1.250 104.56 58.88 147.8 1.9978 0.1329 1.500 154.03 106.62 203.9 2.1785 0.0878 1.750 189.24 138.95 245.2 2.2713 0.0765 2.000 217.36 163.98 279.2 2.3331 0.0718 3.000 296.47 231.96 380.5 2.4707
Page 2
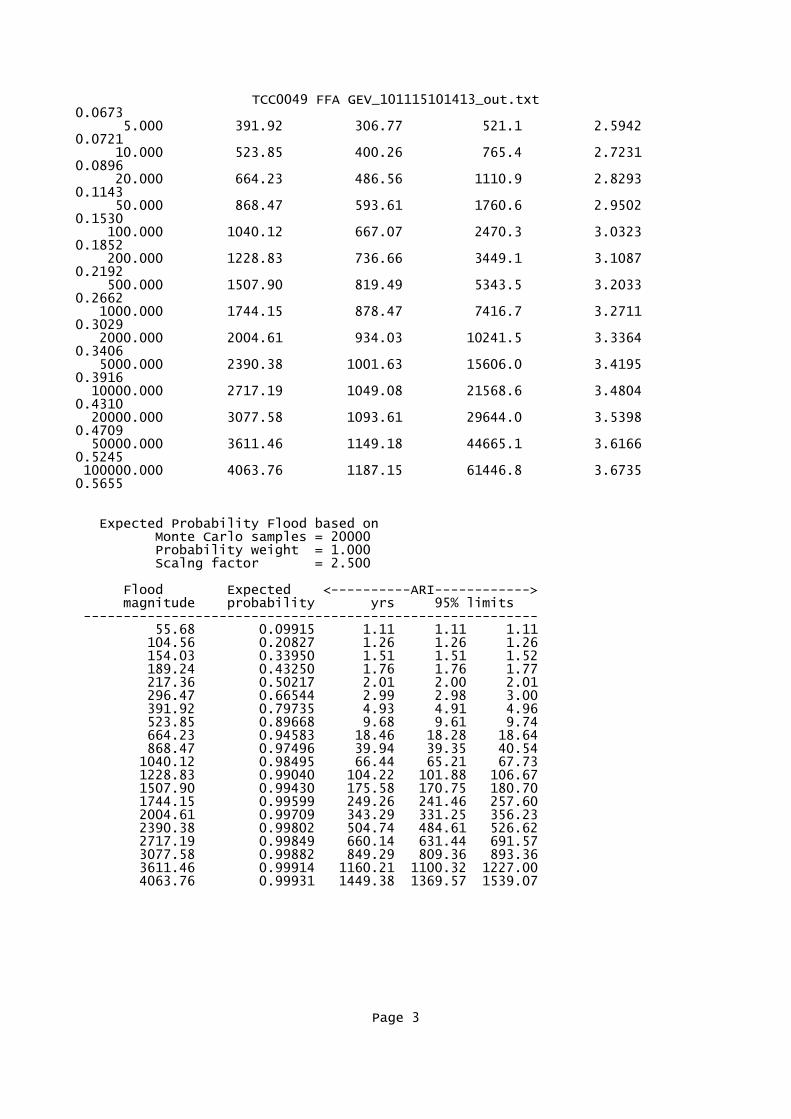
TCC0049 FFA GEV_101115101413_out.txt0.0673 5.000 391.92 306.77 521.1 2.5942 0.0721 10.000 523.85 400.26 765.4 2.7231 0.0896 20.000 664.23 486.56 1110.9 2.8293 0.1143 50.000 868.47 593.61 1760.6 2.9502 0.1530 100.000 1040.12 667.07 2470.3 3.0323 0.1852 200.000 1228.83 736.66 3449.1 3.1087 0.2192 500.000 1507.90 819.49 5343.5 3.2033 0.2662 1000.000 1744.15 878.47 7416.7 3.2711 0.3029 2000.000 2004.61 934.03 10241.5 3.3364 0.3406 5000.000 2390.38 1001.63 15606.0 3.4195 0.3916 10000.000 2717.19 1049.08 21568.6 3.4804 0.4310 20000.000 3077.58 1093.61 29644.0 3.5398 0.4709 50000.000 3611.46 1149.18 44665.1 3.6166 0.5245 100000.000 4063.76 1187.15 61446.8 3.6735 0.5655
Expected Probability Flood based on Monte Carlo samples = 20000 Probability weight = 1.000 Scalng factor = 2.500
Flood Expected <----------ARI------------> magnitude probability yrs 95% limits --------------------------------------------------------- 55.68 0.09915 1.11 1.11 1.11 104.56 0.20827 1.26 1.26 1.26 154.03 0.33950 1.51 1.51 1.52 189.24 0.43250 1.76 1.76 1.77 217.36 0.50217 2.01 2.00 2.01 296.47 0.66544 2.99 2.98 3.00 391.92 0.79735 4.93 4.91 4.96 523.85 0.89668 9.68 9.61 9.74 664.23 0.94583 18.46 18.28 18.64 868.47 0.97496 39.94 39.35 40.54 1040.12 0.98495 66.44 65.21 67.73 1228.83 0.99040 104.22 101.88 106.67 1507.90 0.99430 175.58 170.75 180.70 1744.15 0.99599 249.26 241.46 257.60 2004.61 0.99709 343.29 331.25 356.23 2390.38 0.99802 504.74 484.61 526.62 2717.19 0.99849 660.14 631.44 691.57 3077.58 0.99882 849.29 809.36 893.36 3611.46 0.99914 1160.21 1100.32 1227.00 4063.76 0.99931 1449.38 1369.57 1539.07
Page 3
TCC0049 FFA LP3_101115101428_out.txt Report created on 10/11/2015 at 10:14
------------------------------------------------------------------------------- TUFLOW FLIKE program version 4.50 TUFLOW FLIKE file version 3.00
Title:
Input Data for Flood Frequency Analysis for Model: Log Pearson III
Results from TUFLOW FLIKE are subject to terms and conditions as described in:- http://www.tuflow.com/Download/Licensing/TUFLOW%20Products%20Licence%20Agreement.pdf For further information please contact [email protected].
Measurement Error Data Group Error coefficient Lower bound of variation rated flow ------------------------------------------------ 1 0.000 0.00
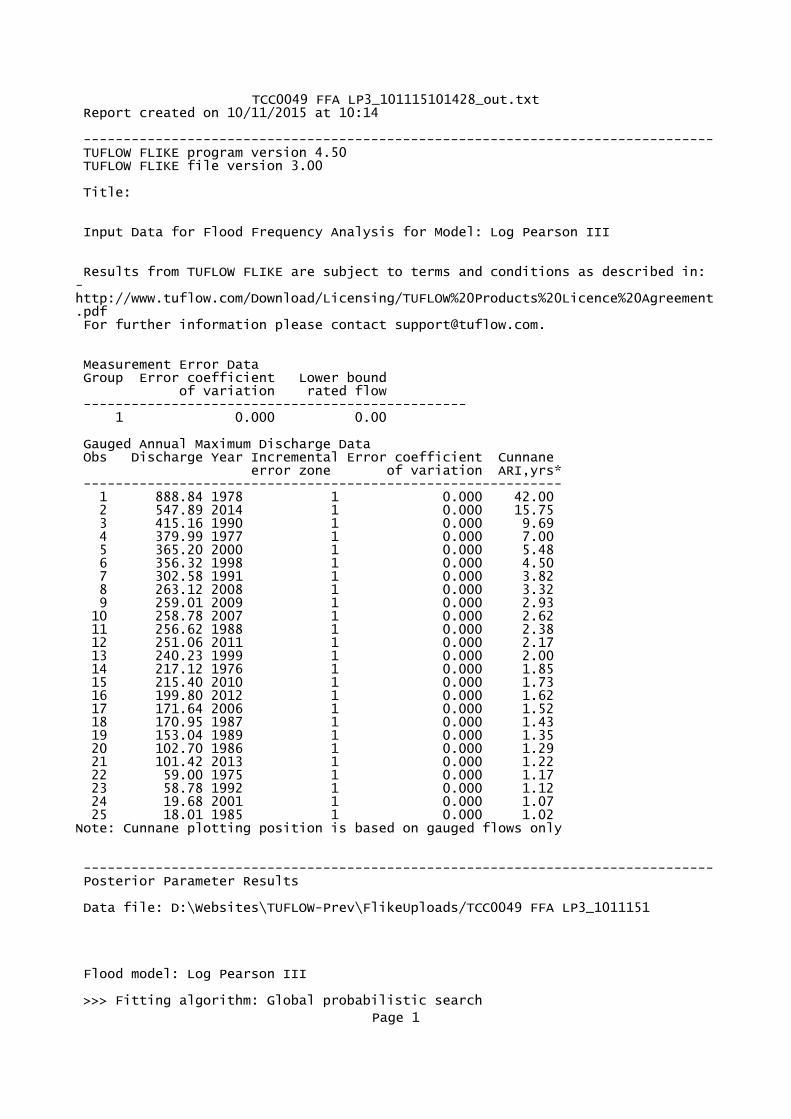
Gauged Annual Maximum Discharge Data Obs Discharge Year Incremental Error coefficient Cunnane error zone of variation ARI,yrs* ------------------------------------------------------------ 1 888.84 1978 1 0.000 42.00 2 547.89 2014 1 0.000 15.75 3 415.16 1990 1 0.000 9.69 4 379.99 1977 1 0.000 7.00 5 365.20 2000 1 0.000 5.48 6 356.32 1998 1 0.000 4.50 7 302.58 1991 1 0.000 3.82 8 263.12 2008 1 0.000 3.32 9 259.01 2009 1 0.000 2.93 10 258.78 2007 1 0.000 2.62 11 256.62 1988 1 0.000 2.38 12 251.06 2011 1 0.000 2.17 13 240.23 1999 1 0.000 2.00 14 217.12 1976 1 0.000 1.85 15 215.40 2010 1 0.000 1.73 16 199.80 2012 1 0.000 1.62 17 171.64 2006 1 0.000 1.52 18 170.95 1987 1 0.000 1.43 19 153.04 1989 1 0.000 1.35 20 102.70 1986 1 0.000 1.29 21 101.42 2013 1 0.000 1.22 22 59.00 1975 1 0.000 1.17 23 58.78 1992 1 0.000 1.12 24 19.68 2001 1 0.000 1.07 25 18.01 1985 1 0.000 1.02Note: Cunnane plotting position is based on gauged flows only
------------------------------------------------------------------------------- Posterior Parameter Results
Data file: D:\Websites\TUFLOW-Prev\FlikeUploads/TCC0049 FFA LP3_1011151
Flood model: Log Pearson III
>>> Fitting algorithm: Global probabilistic search
Page 1
TCC0049 FFA LP3_101115101428_out.txt
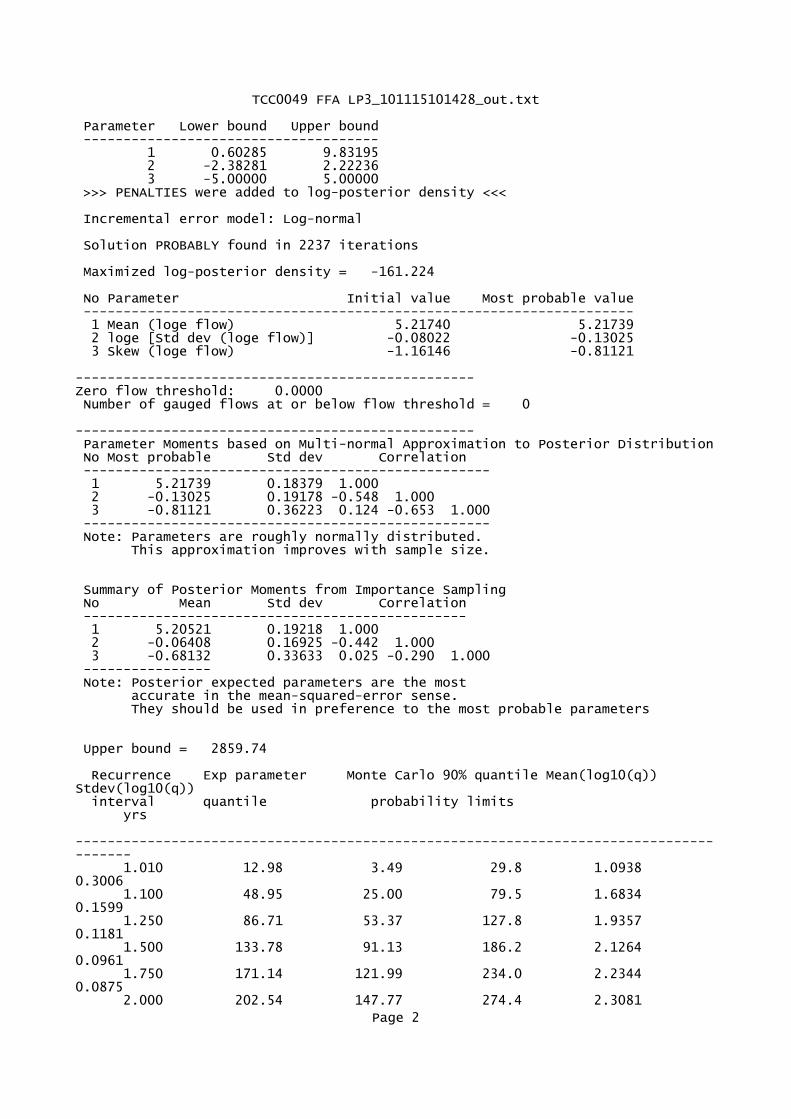
Parameter Lower bound Upper bound ------------------------------------- 1 0.60285 9.83195 2 -2.38281 2.22236 3 -5.00000 5.00000 >>> PENALTIES were added to log-posterior density <<<
Incremental error model: Log-normal
Solution PROBABLY found in 2237 iterations
Maximized log-posterior density = -161.224
No Parameter Initial value Most probable value --------------------------------------------------------------------- 1 Mean (loge flow) 5.21740 5.21739 2 loge [Std dev (loge flow)] -0.08022 -0.13025 3 Skew (loge flow) -1.16146 -0.81121
--------------------------------------------------Zero flow threshold: 0.0000 Number of gauged flows at or below flow threshold = 0
-------------------------------------------------- Parameter Moments based on Multi-normal Approximation to Posterior Distribution No Most probable Std dev Correlation --------------------------------------------------- 1 5.21739 0.18379 1.000 2 -0.13025 0.19178 -0.548 1.000 3 -0.81121 0.36223 0.124 -0.653 1.000 --------------------------------------------------- Note: Parameters are roughly normally distributed. This approximation improves with sample size.
Summary of Posterior Moments from Importance Sampling No Mean Std dev Correlation ------------------------------------------------ 1 5.20521 0.19218 1.000 2 -0.06408 0.16925 -0.442 1.000 3 -0.68132 0.33633 0.025 -0.290 1.000 ---------------- Note: Posterior expected parameters are the most accurate in the mean-squared-error sense. They should be used in preference to the most probable parameters
Upper bound = 2859.74
Recurrence Exp parameter Monte Carlo 90% quantile Mean(log10(q)) Stdev(log10(q)) interval quantile probability limits yrs --------------------------------------------------------------------------------------- 1.010 12.98 3.49 29.8 1.0938 0.3006 1.100 48.95 25.00 79.5 1.6834 0.1599 1.250 86.71 53.37 127.8 1.9357 0.1181 1.500 133.78 91.13 186.2 2.1264 0.0961 1.750 171.14 121.99 234.0 2.2344 0.0875 2.000 202.54 147.77 274.4 2.3081
Page 2
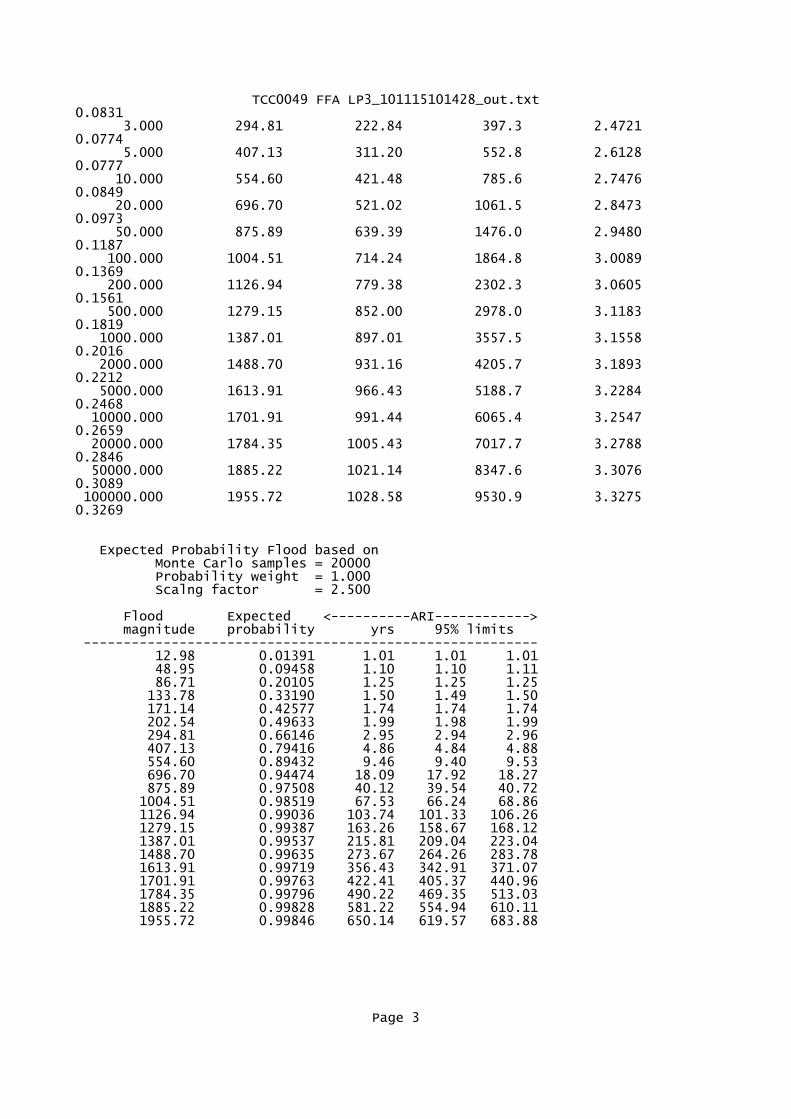
TCC0049 FFA LP3_101115101428_out.txt0.0831 3.000 294.81 222.84 397.3 2.4721 0.0774 5.000 407.13 311.20 552.8 2.6128 0.0777 10.000 554.60 421.48 785.6 2.7476 0.0849 20.000 696.70 521.02 1061.5 2.8473 0.0973 50.000 875.89 639.39 1476.0 2.9480 0.1187 100.000 1004.51 714.24 1864.8 3.0089 0.1369 200.000 1126.94 779.38 2302.3 3.0605 0.1561 500.000 1279.15 852.00 2978.0 3.1183 0.1819 1000.000 1387.01 897.01 3557.5 3.1558 0.2016 2000.000 1488.70 931.16 4205.7 3.1893 0.2212 5000.000 1613.91 966.43 5188.7 3.2284 0.2468 10000.000 1701.91 991.44 6065.4 3.2547 0.2659 20000.000 1784.35 1005.43 7017.7 3.2788 0.2846 50000.000 1885.22 1021.14 8347.6 3.3076 0.3089 100000.000 1955.72 1028.58 9530.9 3.3275 0.3269
Expected Probability Flood based on Monte Carlo samples = 20000 Probability weight = 1.000 Scalng factor = 2.500
Flood Expected <----------ARI------------> magnitude probability yrs 95% limits --------------------------------------------------------- 12.98 0.01391 1.01 1.01 1.01 48.95 0.09458 1.10 1.10 1.11 86.71 0.20105 1.25 1.25 1.25 133.78 0.33190 1.50 1.49 1.50 171.14 0.42577 1.74 1.74 1.74 202.54 0.49633 1.99 1.98 1.99 294.81 0.66146 2.95 2.94 2.96 407.13 0.79416 4.86 4.84 4.88 554.60 0.89432 9.46 9.40 9.53 696.70 0.94474 18.09 17.92 18.27 875.89 0.97508 40.12 39.54 40.72 1004.51 0.98519 67.53 66.24 68.86 1126.94 0.99036 103.74 101.33 106.26 1279.15 0.99387 163.26 158.67 168.12 1387.01 0.99537 215.81 209.04 223.04 1488.70 0.99635 273.67 264.26 283.78 1613.91 0.99719 356.43 342.91 371.07 1701.91 0.99763 422.41 405.37 440.96 1784.35 0.99796 490.22 469.35 513.03 1885.22 0.99828 581.22 554.94 610.11 1955.72 0.99846 650.14 619.57 683.88
Page 3
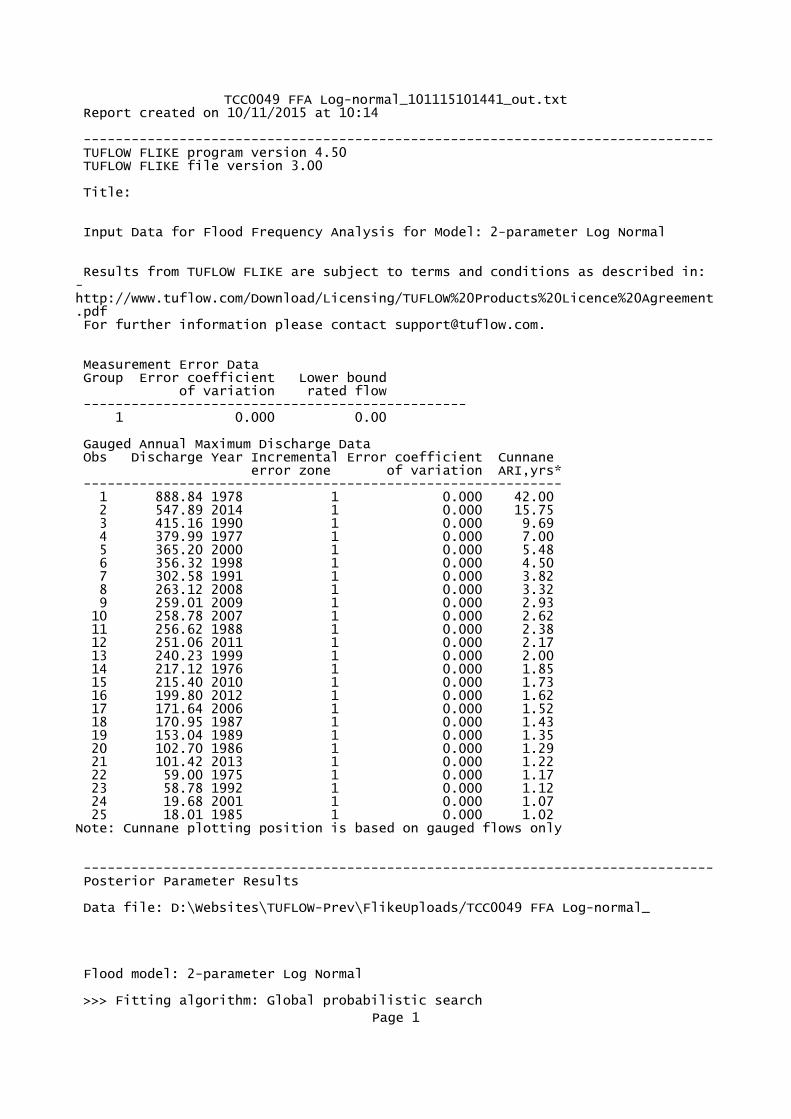
TCC0049 FFA Log-normal_101115101441_out.txt Report created on 10/11/2015 at 10:14
------------------------------------------------------------------------------- TUFLOW FLIKE program version 4.50 TUFLOW FLIKE file version 3.00
Title:
Input Data for Flood Frequency Analysis for Model: 2-parameter Log Normal
Results from TUFLOW FLIKE are subject to terms and conditions as described in:- http://www.tuflow.com/Download/Licensing/TUFLOW%20Products%20Licence%20Agreement.pdf For further information please contact [email protected].
Measurement Error Data Group Error coefficient Lower bound of variation rated flow ------------------------------------------------ 1 0.000 0.00
Gauged Annual Maximum Discharge Data Obs Discharge Year Incremental Error coefficient Cunnane error zone of variation ARI,yrs* ------------------------------------------------------------ 1 888.84 1978 1 0.000 42.00 2 547.89 2014 1 0.000 15.75 3 415.16 1990 1 0.000 9.69 4 379.99 1977 1 0.000 7.00 5 365.20 2000 1 0.000 5.48 6 356.32 1998 1 0.000 4.50 7 302.58 1991 1 0.000 3.82 8 263.12 2008 1 0.000 3.32 9 259.01 2009 1 0.000 2.93 10 258.78 2007 1 0.000 2.62 11 256.62 1988 1 0.000 2.38 12 251.06 2011 1 0.000 2.17 13 240.23 1999 1 0.000 2.00 14 217.12 1976 1 0.000 1.85 15 215.40 2010 1 0.000 1.73 16 199.80 2012 1 0.000 1.62 17 171.64 2006 1 0.000 1.52 18 170.95 1987 1 0.000 1.43 19 153.04 1989 1 0.000 1.35 20 102.70 1986 1 0.000 1.29 21 101.42 2013 1 0.000 1.22 22 59.00 1975 1 0.000 1.17 23 58.78 1992 1 0.000 1.12 24 19.68 2001 1 0.000 1.07 25 18.01 1985 1 0.000 1.02Note: Cunnane plotting position is based on gauged flows only
------------------------------------------------------------------------------- Posterior Parameter Results
Data file: D:\Websites\TUFLOW-Prev\FlikeUploads/TCC0049 FFA Log-normal_
Flood model: 2-parameter Log Normal
>>> Fitting algorithm: Global probabilistic search
Page 1
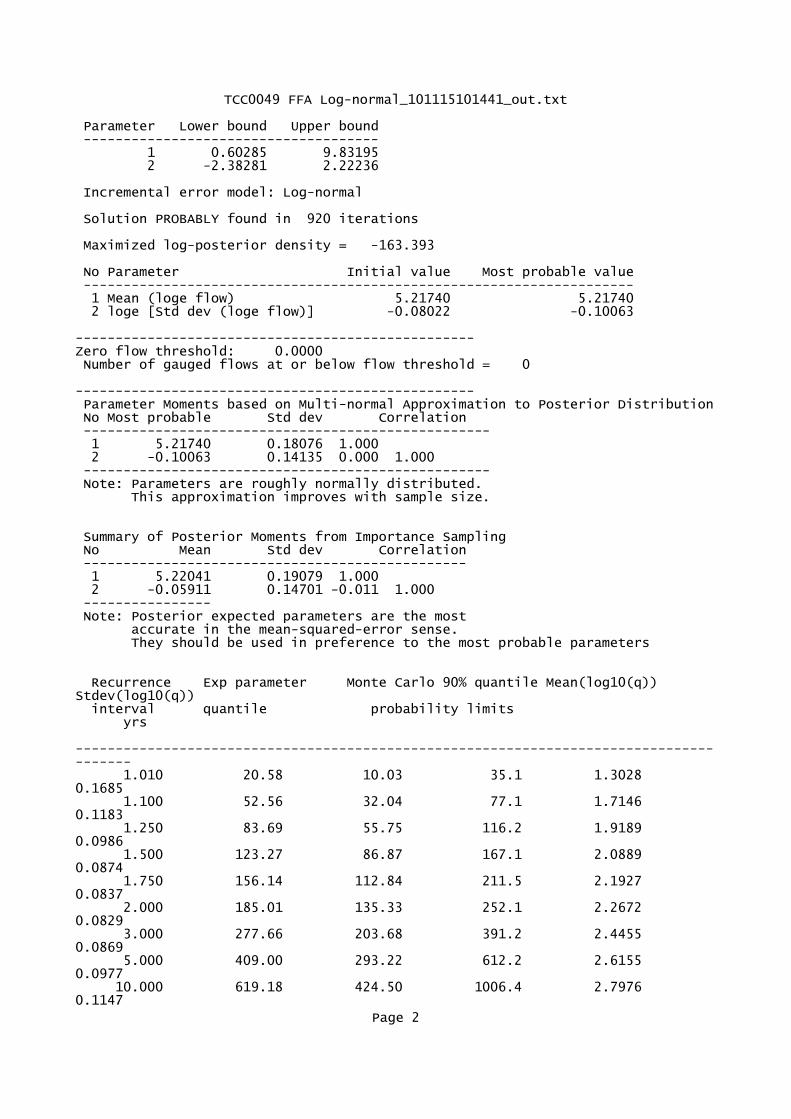
TCC0049 FFA Log-normal_101115101441_out.txt
Parameter Lower bound Upper bound ------------------------------------- 1 0.60285 9.83195 2 -2.38281 2.22236
Incremental error model: Log-normal
Solution PROBABLY found in 920 iterations
Maximized log-posterior density = -163.393
No Parameter Initial value Most probable value --------------------------------------------------------------------- 1 Mean (loge flow) 5.21740 5.21740 2 loge [Std dev (loge flow)] -0.08022 -0.10063
--------------------------------------------------Zero flow threshold: 0.0000 Number of gauged flows at or below flow threshold = 0
-------------------------------------------------- Parameter Moments based on Multi-normal Approximation to Posterior Distribution No Most probable Std dev Correlation --------------------------------------------------- 1 5.21740 0.18076 1.000 2 -0.10063 0.14135 0.000 1.000 --------------------------------------------------- Note: Parameters are roughly normally distributed. This approximation improves with sample size.
Summary of Posterior Moments from Importance Sampling No Mean Std dev Correlation ------------------------------------------------ 1 5.22041 0.19079 1.000 2 -0.05911 0.14701 -0.011 1.000 ---------------- Note: Posterior expected parameters are the most accurate in the mean-squared-error sense. They should be used in preference to the most probable parameters
Recurrence Exp parameter Monte Carlo 90% quantile Mean(log10(q)) Stdev(log10(q)) interval quantile probability limits yrs --------------------------------------------------------------------------------------- 1.010 20.58 10.03 35.1 1.3028 0.1685 1.100 52.56 32.04 77.1 1.7146 0.1183 1.250 83.69 55.75 116.2 1.9189 0.0986 1.500 123.27 86.87 167.1 2.0889 0.0874 1.750 156.14 112.84 211.5 2.1927 0.0837 2.000 185.01 135.33 252.1 2.2672 0.0829 3.000 277.66 203.68 391.2 2.4455 0.0869 5.000 409.00 293.22 612.2 2.6155 0.0977 10.000 619.18 424.50 1006.4 2.7976 0.1147
Page 2
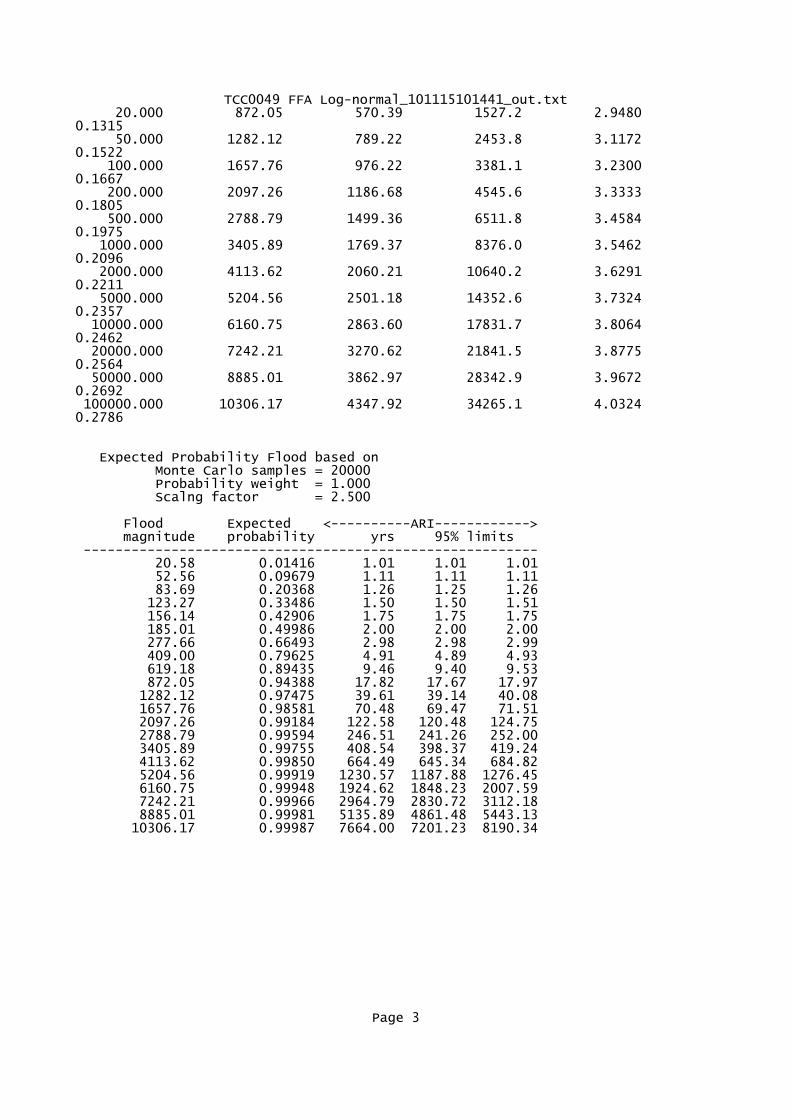
TCC0049 FFA Log-normal_101115101441_out.txt 20.000 872.05 570.39 1527.2 2.9480 0.1315 50.000 1282.12 789.22 2453.8 3.1172 0.1522 100.000 1657.76 976.22 3381.1 3.2300 0.1667 200.000 2097.26 1186.68 4545.6 3.3333 0.1805 500.000 2788.79 1499.36 6511.8 3.4584 0.1975 1000.000 3405.89 1769.37 8376.0 3.5462 0.2096 2000.000 4113.62 2060.21 10640.2 3.6291 0.2211 5000.000 5204.56 2501.18 14352.6 3.7324 0.2357 10000.000 6160.75 2863.60 17831.7 3.8064 0.2462 20000.000 7242.21 3270.62 21841.5 3.8775 0.2564 50000.000 8885.01 3862.97 28342.9 3.9672 0.2692 100000.000 10306.17 4347.92 34265.1 4.0324 0.2786
Expected Probability Flood based on Monte Carlo samples = 20000 Probability weight = 1.000 Scalng factor = 2.500
Flood Expected <----------ARI------------> magnitude probability yrs 95% limits --------------------------------------------------------- 20.58 0.01416 1.01 1.01 1.01 52.56 0.09679 1.11 1.11 1.11 83.69 0.20368 1.26 1.25 1.26 123.27 0.33486 1.50 1.50 1.51 156.14 0.42906 1.75 1.75 1.75 185.01 0.49986 2.00 2.00 2.00 277.66 0.66493 2.98 2.98 2.99 409.00 0.79625 4.91 4.89 4.93 619.18 0.89435 9.46 9.40 9.53 872.05 0.94388 17.82 17.67 17.97 1282.12 0.97475 39.61 39.14 40.08 1657.76 0.98581 70.48 69.47 71.51 2097.26 0.99184 122.58 120.48 124.75 2788.79 0.99594 246.51 241.26 252.00 3405.89 0.99755 408.54 398.37 419.24 4113.62 0.99850 664.49 645.34 684.82 5204.56 0.99919 1230.57 1187.88 1276.45 6160.75 0.99948 1924.62 1848.23 2007.59 7242.21 0.99966 2964.79 2830.72 3112.18 8885.01 0.99981 5135.89 4861.48 5443.13 10306.17 0.99987 7664.00 7201.23 8190.34
Page 3

TCC0049 FFA Gumbel_101115101455_out.txt Report created on 10/11/2015 at 10:14
------------------------------------------------------------------------------- TUFLOW FLIKE program version 4.50 TUFLOW FLIKE file version 3.00
Title:
Input Data for Flood Frequency Analysis for Model: Gumbel
Results from TUFLOW FLIKE are subject to terms and conditions as described in:- http://www.tuflow.com/Download/Licensing/TUFLOW%20Products%20Licence%20Agreement.pdf For further information please contact [email protected].
Measurement Error Data Group Error coefficient Lower bound of variation rated flow ------------------------------------------------ 1 0.000 0.00
Gauged Annual Maximum Discharge Data Obs Discharge Year Incremental Error coefficient Cunnane error zone of variation ARI,yrs* ------------------------------------------------------------ 1 888.84 1978 1 0.000 42.00 2 547.89 2014 1 0.000 15.75 3 415.16 1990 1 0.000 9.69 4 379.99 1977 1 0.000 7.00 5 365.20 2000 1 0.000 5.48 6 356.32 1998 1 0.000 4.50 7 302.58 1991 1 0.000 3.82 8 263.12 2008 1 0.000 3.32 9 259.01 2009 1 0.000 2.93 10 258.78 2007 1 0.000 2.62 11 256.62 1988 1 0.000 2.38 12 251.06 2011 1 0.000 2.17 13 240.23 1999 1 0.000 2.00 14 217.12 1976 1 0.000 1.85 15 215.40 2010 1 0.000 1.73 16 199.80 2012 1 0.000 1.62 17 171.64 2006 1 0.000 1.52 18 170.95 1987 1 0.000 1.43 19 153.04 1989 1 0.000 1.35 20 102.70 1986 1 0.000 1.29 21 101.42 2013 1 0.000 1.22 22 59.00 1975 1 0.000 1.17 23 58.78 1992 1 0.000 1.12 24 19.68 2001 1 0.000 1.07 25 18.01 1985 1 0.000 1.02Note: Cunnane plotting position is based on gauged flows only
------------------------------------------------------------------------------- Posterior Parameter Results
Data file: D:\Websites\TUFLOW-Prev\FlikeUploads/TCC0049 FFA Gumbel_1011
Flood model: Gumbel
>>> Fitting algorithm: Global probabilistic search
Page 1
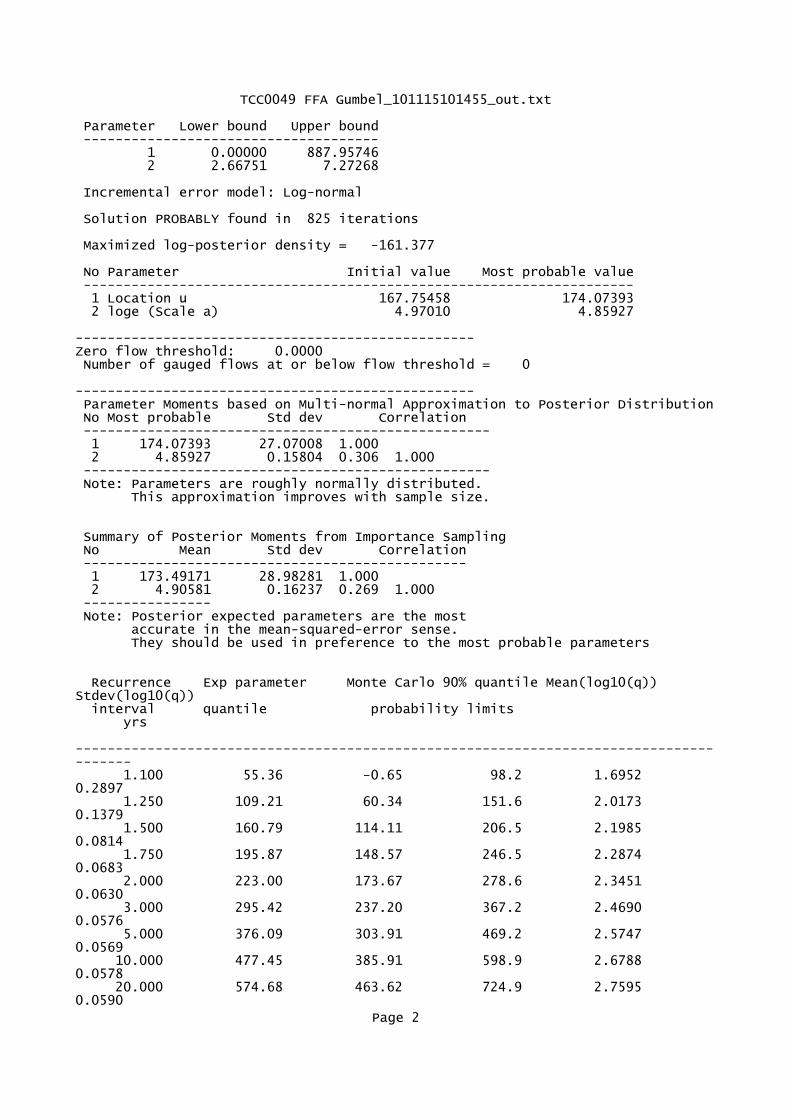
TCC0049 FFA Gumbel_101115101455_out.txt
Parameter Lower bound Upper bound ------------------------------------- 1 0.00000 887.95746 2 2.66751 7.27268
Incremental error model: Log-normal
Solution PROBABLY found in 825 iterations
Maximized log-posterior density = -161.377
No Parameter Initial value Most probable value --------------------------------------------------------------------- 1 Location u 167.75458 174.07393 2 loge (Scale a) 4.97010 4.85927
--------------------------------------------------Zero flow threshold: 0.0000 Number of gauged flows at or below flow threshold = 0
-------------------------------------------------- Parameter Moments based on Multi-normal Approximation to Posterior Distribution No Most probable Std dev Correlation --------------------------------------------------- 1 174.07393 27.07008 1.000 2 4.85927 0.15804 0.306 1.000 --------------------------------------------------- Note: Parameters are roughly normally distributed. This approximation improves with sample size.
Summary of Posterior Moments from Importance Sampling No Mean Std dev Correlation ------------------------------------------------ 1 173.49171 28.98281 1.000 2 4.90581 0.16237 0.269 1.000 ---------------- Note: Posterior expected parameters are the most accurate in the mean-squared-error sense. They should be used in preference to the most probable parameters
Recurrence Exp parameter Monte Carlo 90% quantile Mean(log10(q)) Stdev(log10(q)) interval quantile probability limits yrs --------------------------------------------------------------------------------------- 1.100 55.36 -0.65 98.2 1.6952 0.2897 1.250 109.21 60.34 151.6 2.0173 0.1379 1.500 160.79 114.11 206.5 2.1985 0.0814 1.750 195.87 148.57 246.5 2.2874 0.0683 2.000 223.00 173.67 278.6 2.3451 0.0630 3.000 295.42 237.20 367.2 2.4690 0.0576 5.000 376.09 303.91 469.2 2.5747 0.0569 10.000 477.45 385.91 598.9 2.6788 0.0578 20.000 574.68 463.62 724.9 2.7595 0.0590
Page 2
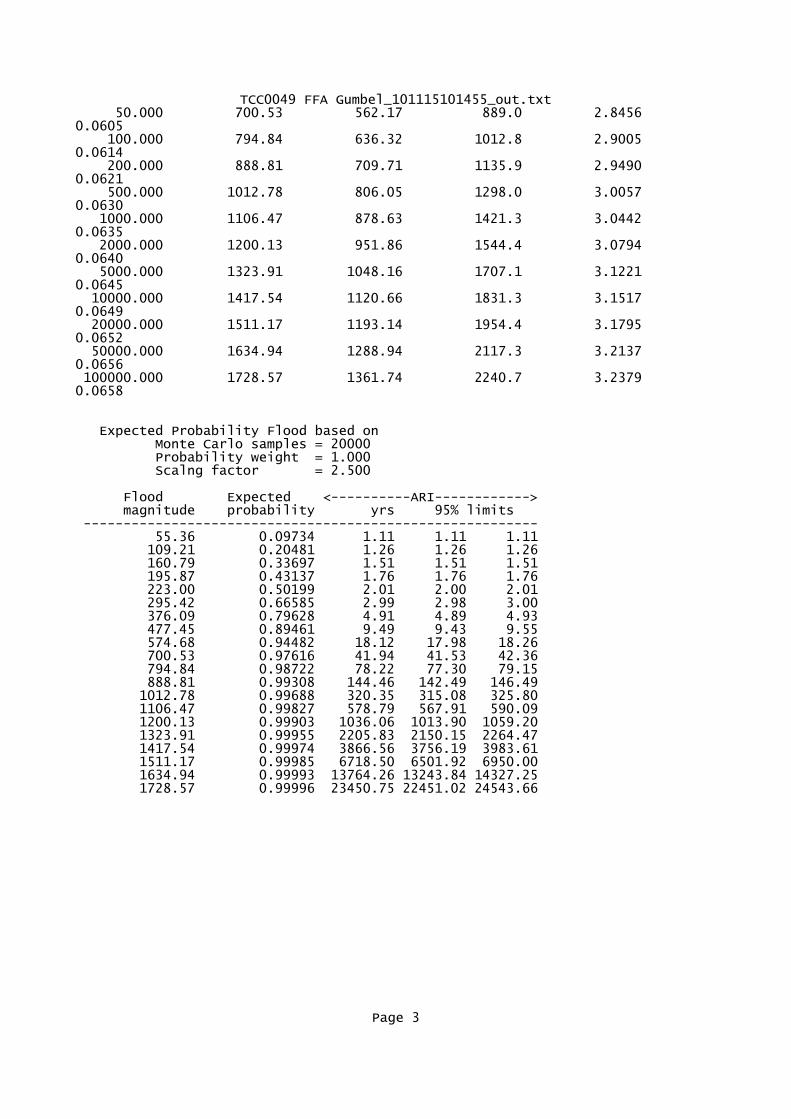
TCC0049 FFA Gumbel_101115101455_out.txt 50.000 700.53 562.17 889.0 2.8456 0.0605 100.000 794.84 636.32 1012.8 2.9005 0.0614 200.000 888.81 709.71 1135.9 2.9490 0.0621 500.000 1012.78 806.05 1298.0 3.0057 0.0630 1000.000 1106.47 878.63 1421.3 3.0442 0.0635 2000.000 1200.13 951.86 1544.4 3.0794 0.0640 5000.000 1323.91 1048.16 1707.1 3.1221 0.0645 10000.000 1417.54 1120.66 1831.3 3.1517 0.0649 20000.000 1511.17 1193.14 1954.4 3.1795 0.0652 50000.000 1634.94 1288.94 2117.3 3.2137 0.0656 100000.000 1728.57 1361.74 2240.7 3.2379 0.0658
Expected Probability Flood based on Monte Carlo samples = 20000 Probability weight = 1.000 Scalng factor = 2.500
Flood Expected <----------ARI------------> magnitude probability yrs 95% limits --------------------------------------------------------- 55.36 0.09734 1.11 1.11 1.11 109.21 0.20481 1.26 1.26 1.26 160.79 0.33697 1.51 1.51 1.51 195.87 0.43137 1.76 1.76 1.76 223.00 0.50199 2.01 2.00 2.01 295.42 0.66585 2.99 2.98 3.00 376.09 0.79628 4.91 4.89 4.93 477.45 0.89461 9.49 9.43 9.55 574.68 0.94482 18.12 17.98 18.26 700.53 0.97616 41.94 41.53 42.36 794.84 0.98722 78.22 77.30 79.15 888.81 0.99308 144.46 142.49 146.49 1012.78 0.99688 320.35 315.08 325.80 1106.47 0.99827 578.79 567.91 590.09 1200.13 0.99903 1036.06 1013.90 1059.20 1323.91 0.99955 2205.83 2150.15 2264.47 1417.54 0.99974 3866.56 3756.19 3983.61 1511.17 0.99985 6718.50 6501.92 6950.00 1634.94 0.99993 13764.26 13243.84 14327.25 1728.57 0.99996 23450.75 22451.02 24543.66
Page 3
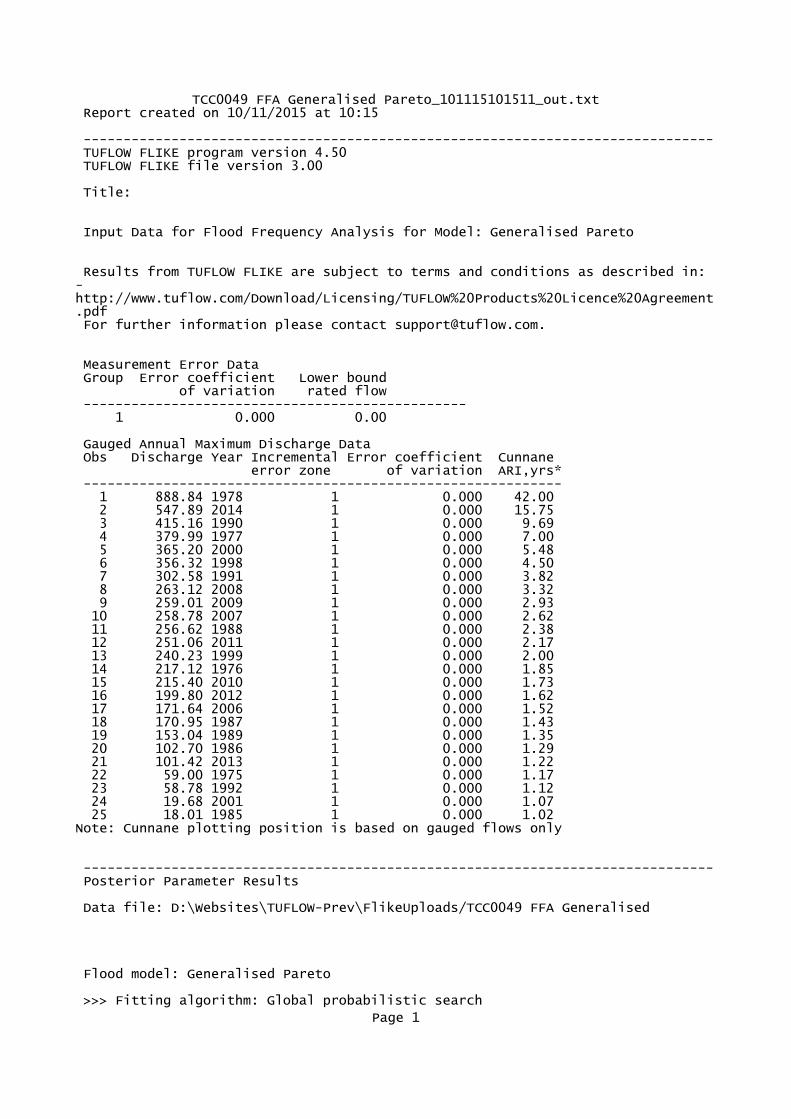
TCC0049 FFA Generalised Pareto_101115101511_out.txt Report created on 10/11/2015 at 10:15
------------------------------------------------------------------------------- TUFLOW FLIKE program version 4.50 TUFLOW FLIKE file version 3.00
Title:
Input Data for Flood Frequency Analysis for Model: Generalised Pareto
Results from TUFLOW FLIKE are subject to terms and conditions as described in:- http://www.tuflow.com/Download/Licensing/TUFLOW%20Products%20Licence%20Agreement.pdf For further information please contact [email protected].
Measurement Error Data Group Error coefficient Lower bound of variation rated flow ------------------------------------------------ 1 0.000 0.00
Gauged Annual Maximum Discharge Data Obs Discharge Year Incremental Error coefficient Cunnane error zone of variation ARI,yrs* ------------------------------------------------------------ 1 888.84 1978 1 0.000 42.00 2 547.89 2014 1 0.000 15.75 3 415.16 1990 1 0.000 9.69 4 379.99 1977 1 0.000 7.00 5 365.20 2000 1 0.000 5.48 6 356.32 1998 1 0.000 4.50 7 302.58 1991 1 0.000 3.82 8 263.12 2008 1 0.000 3.32 9 259.01 2009 1 0.000 2.93 10 258.78 2007 1 0.000 2.62 11 256.62 1988 1 0.000 2.38 12 251.06 2011 1 0.000 2.17 13 240.23 1999 1 0.000 2.00 14 217.12 1976 1 0.000 1.85 15 215.40 2010 1 0.000 1.73 16 199.80 2012 1 0.000 1.62 17 171.64 2006 1 0.000 1.52 18 170.95 1987 1 0.000 1.43 19 153.04 1989 1 0.000 1.35 20 102.70 1986 1 0.000 1.29 21 101.42 2013 1 0.000 1.22 22 59.00 1975 1 0.000 1.17 23 58.78 1992 1 0.000 1.12 24 19.68 2001 1 0.000 1.07 25 18.01 1985 1 0.000 1.02Note: Cunnane plotting position is based on gauged flows only
------------------------------------------------------------------------------- Posterior Parameter Results
Data file: D:\Websites\TUFLOW-Prev\FlikeUploads/TCC0049 FFA Generalised
Flood model: Generalised Pareto
>>> Fitting algorithm: Global probabilistic search
Page 1
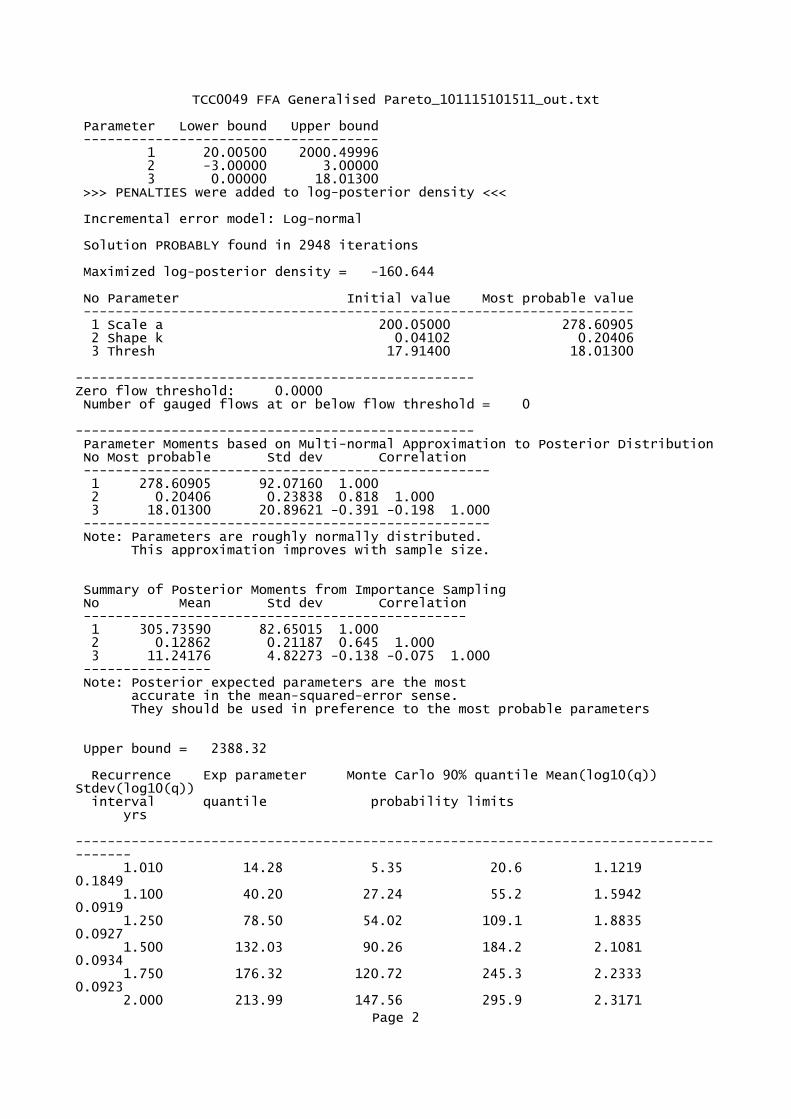
TCC0049 FFA Generalised Pareto_101115101511_out.txt
Parameter Lower bound Upper bound ------------------------------------- 1 20.00500 2000.49996 2 -3.00000 3.00000 3 0.00000 18.01300 >>> PENALTIES were added to log-posterior density <<<
Incremental error model: Log-normal
Solution PROBABLY found in 2948 iterations
Maximized log-posterior density = -160.644
No Parameter Initial value Most probable value --------------------------------------------------------------------- 1 Scale a 200.05000 278.60905 2 Shape k 0.04102 0.20406 3 Thresh 17.91400 18.01300
--------------------------------------------------Zero flow threshold: 0.0000 Number of gauged flows at or below flow threshold = 0
-------------------------------------------------- Parameter Moments based on Multi-normal Approximation to Posterior Distribution No Most probable Std dev Correlation --------------------------------------------------- 1 278.60905 92.07160 1.000 2 0.20406 0.23838 0.818 1.000 3 18.01300 20.89621 -0.391 -0.198 1.000 --------------------------------------------------- Note: Parameters are roughly normally distributed. This approximation improves with sample size.
Summary of Posterior Moments from Importance Sampling No Mean Std dev Correlation ------------------------------------------------ 1 305.73590 82.65015 1.000 2 0.12862 0.21187 0.645 1.000 3 11.24176 4.82273 -0.138 -0.075 1.000 ---------------- Note: Posterior expected parameters are the most accurate in the mean-squared-error sense. They should be used in preference to the most probable parameters
Upper bound = 2388.32
Recurrence Exp parameter Monte Carlo 90% quantile Mean(log10(q)) Stdev(log10(q)) interval quantile probability limits yrs --------------------------------------------------------------------------------------- 1.010 14.28 5.35 20.6 1.1219 0.1849 1.100 40.20 27.24 55.2 1.5942 0.0919 1.250 78.50 54.02 109.1 1.8835 0.0927 1.500 132.03 90.26 184.2 2.1081 0.0934 1.750 176.32 120.72 245.3 2.2333 0.0923 2.000 213.99 147.56 295.9 2.3171
Page 2
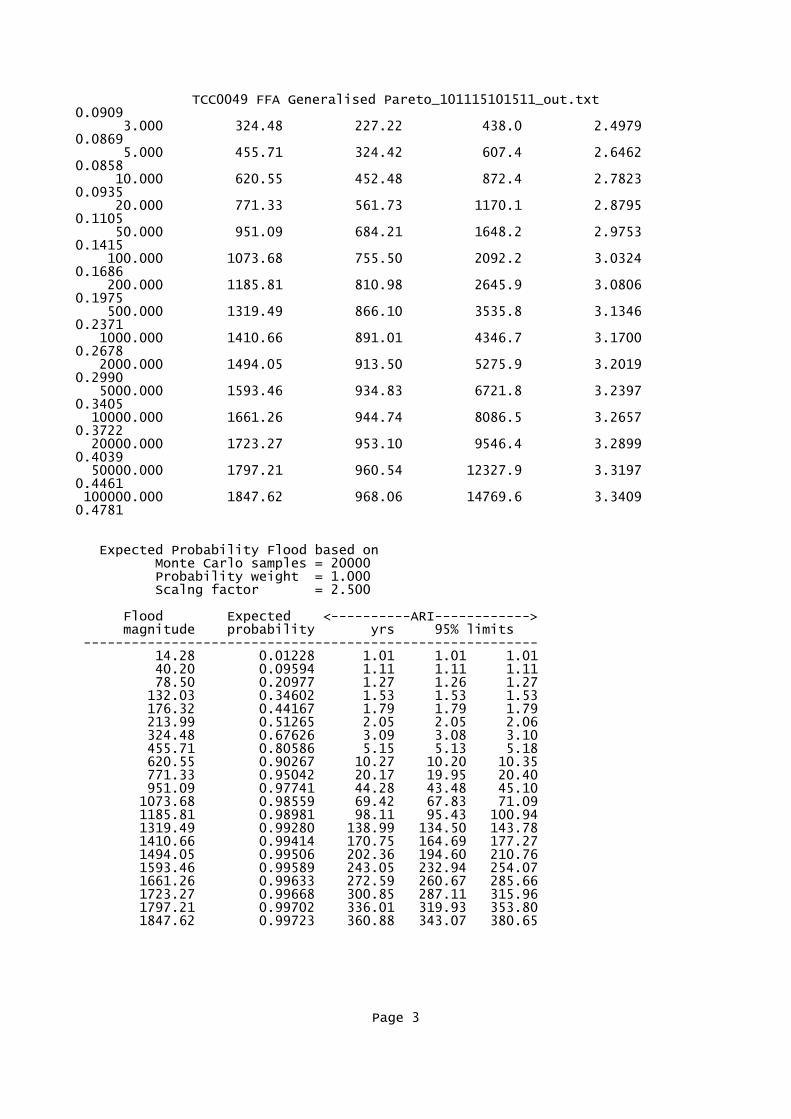
TCC0049 FFA Generalised Pareto_101115101511_out.txt0.0909 3.000 324.48 227.22 438.0 2.4979 0.0869 5.000 455.71 324.42 607.4 2.6462 0.0858 10.000 620.55 452.48 872.4 2.7823 0.0935 20.000 771.33 561.73 1170.1 2.8795 0.1105 50.000 951.09 684.21 1648.2 2.9753 0.1415 100.000 1073.68 755.50 2092.2 3.0324 0.1686 200.000 1185.81 810.98 2645.9 3.0806 0.1975 500.000 1319.49 866.10 3535.8 3.1346 0.2371 1000.000 1410.66 891.01 4346.7 3.1700 0.2678 2000.000 1494.05 913.50 5275.9 3.2019 0.2990 5000.000 1593.46 934.83 6721.8 3.2397 0.3405 10000.000 1661.26 944.74 8086.5 3.2657 0.3722 20000.000 1723.27 953.10 9546.4 3.2899 0.4039 50000.000 1797.21 960.54 12327.9 3.3197 0.4461 100000.000 1847.62 968.06 14769.6 3.3409 0.4781
Expected Probability Flood based on Monte Carlo samples = 20000 Probability weight = 1.000 Scalng factor = 2.500
Flood Expected <----------ARI------------> magnitude probability yrs 95% limits --------------------------------------------------------- 14.28 0.01228 1.01 1.01 1.01 40.20 0.09594 1.11 1.11 1.11 78.50 0.20977 1.27 1.26 1.27 132.03 0.34602 1.53 1.53 1.53 176.32 0.44167 1.79 1.79 1.79 213.99 0.51265 2.05 2.05 2.06 324.48 0.67626 3.09 3.08 3.10 455.71 0.80586 5.15 5.13 5.18 620.55 0.90267 10.27 10.20 10.35 771.33 0.95042 20.17 19.95 20.40 951.09 0.97741 44.28 43.48 45.10 1073.68 0.98559 69.42 67.83 71.09 1185.81 0.98981 98.11 95.43 100.94 1319.49 0.99280 138.99 134.50 143.78 1410.66 0.99414 170.75 164.69 177.27 1494.05 0.99506 202.36 194.60 210.76 1593.46 0.99589 243.05 232.94 254.07 1661.26 0.99633 272.59 260.67 285.66 1723.27 0.99668 300.85 287.11 315.96 1797.21 0.99702 336.01 319.93 353.80 1847.62 0.99723 360.88 343.07 380.65
Page 3
APPENDIX H
Flood Frequency Analysis – Results
1978
201
4 (T
C It
a)
1990
1
10
100
1000
10000
1 10 100
Dis
char
ge
(m3 /
s)
ARI (years)
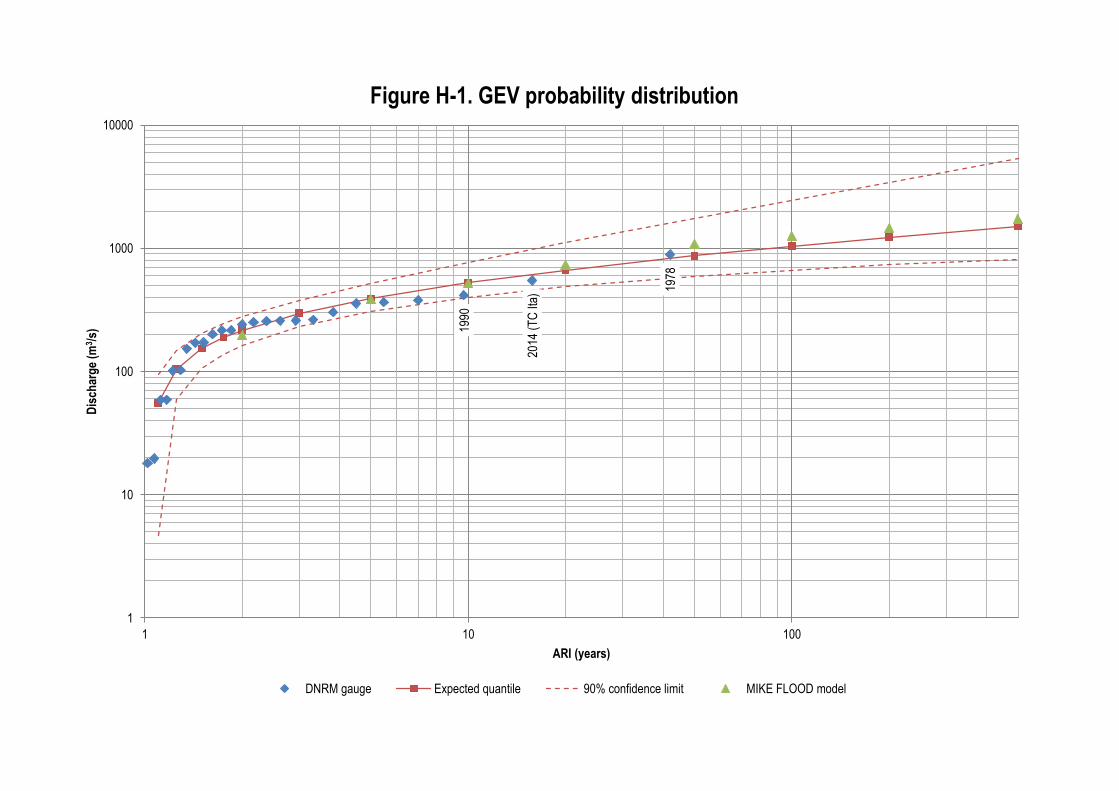
Figure H-1. GEV probability distribution
DNRM gauge Expected quantile 90% confidence limit MIKE FLOOD model
1978
2014
(T
C It
a)
1990
1
10
100
1000
10000
1 10 100
Dis
char
ge
(m3 /
s)
ARI (years)
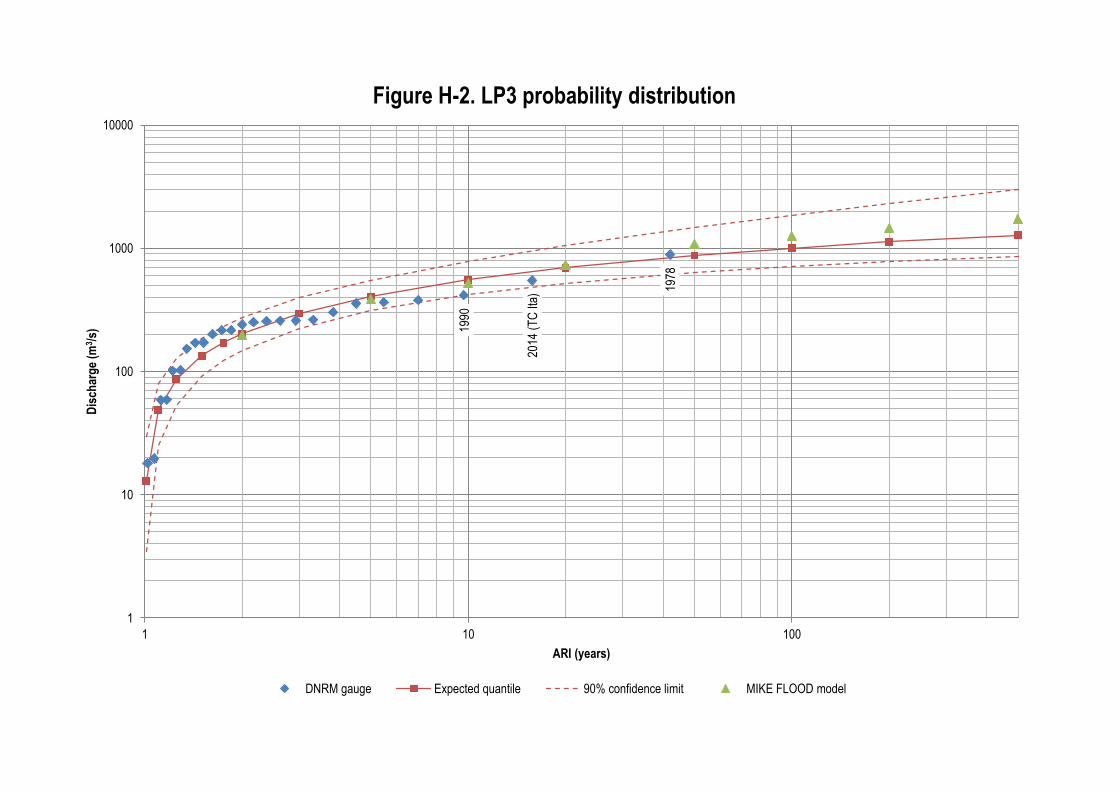
Figure H-2. LP3 probability distribution
DNRM gauge Expected quantile 90% confidence limit MIKE FLOOD model
1978
2014
(T
C It
a)
1990
1
10
100
1000
10000
1 10 100
Dis
char
ge
(m3 /
s)
ARI (years)
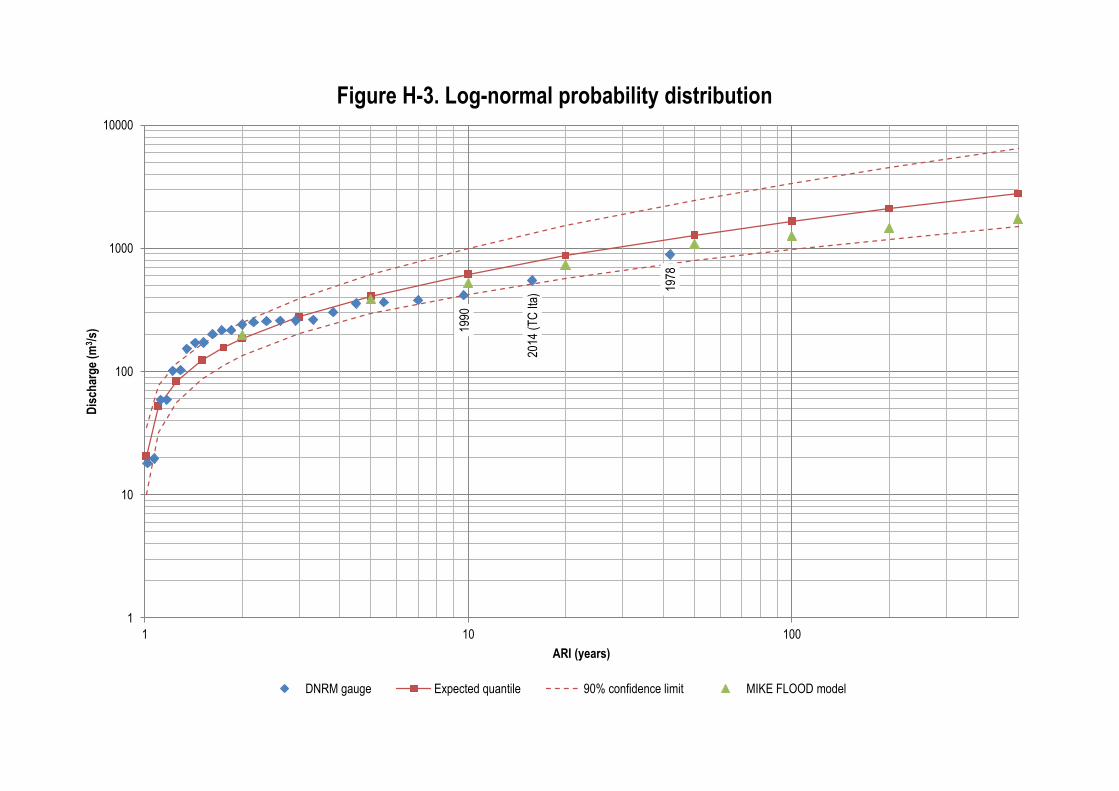
Figure H-3. Log-normal probability distribution
DNRM gauge Expected quantile 90% confidence limit MIKE FLOOD model
1978
2014
(T
C It
a)
1990
1
10
100
1000
10000
1 10 100
Dis
char
ge
(m3 /
s)
ARI (years)
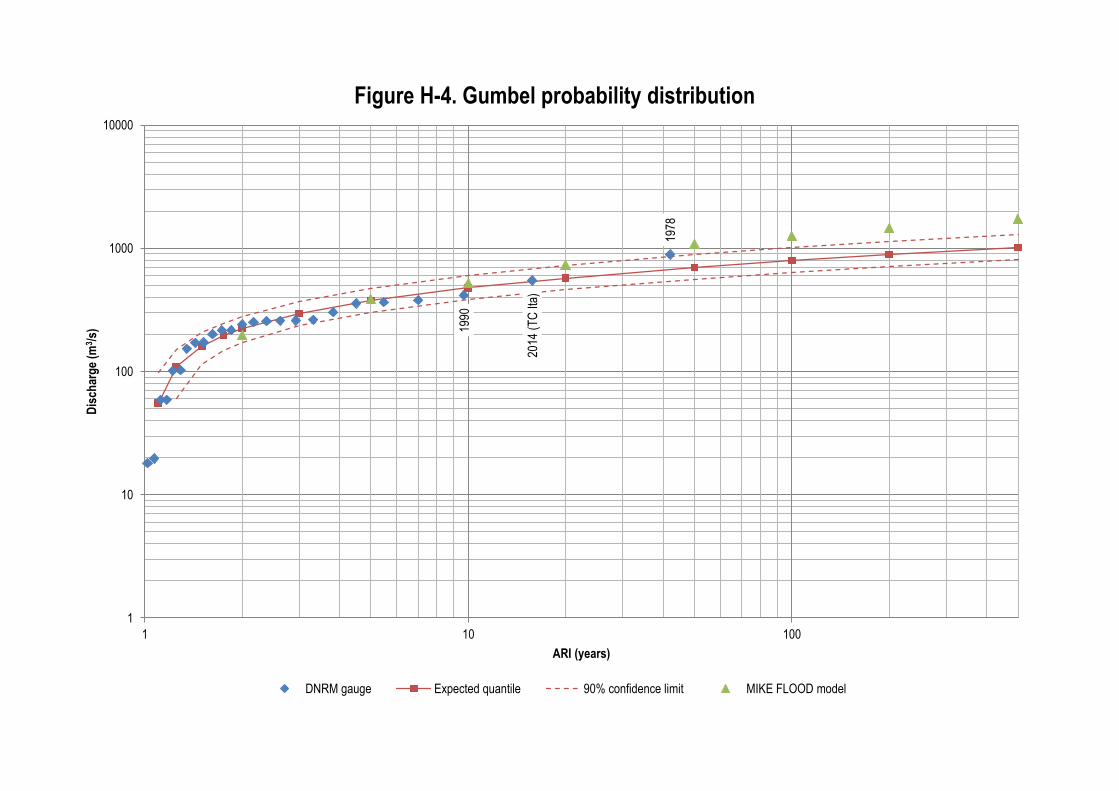
Figure H-4. Gumbel probability distribution
DNRM gauge Expected quantile 90% confidence limit MIKE FLOOD model
1978
2014
(T
C It
a)
1990
1
10
100
1000
10000
1 10 100
Dis
char
ge
(m3 /
s)
ARI (years)
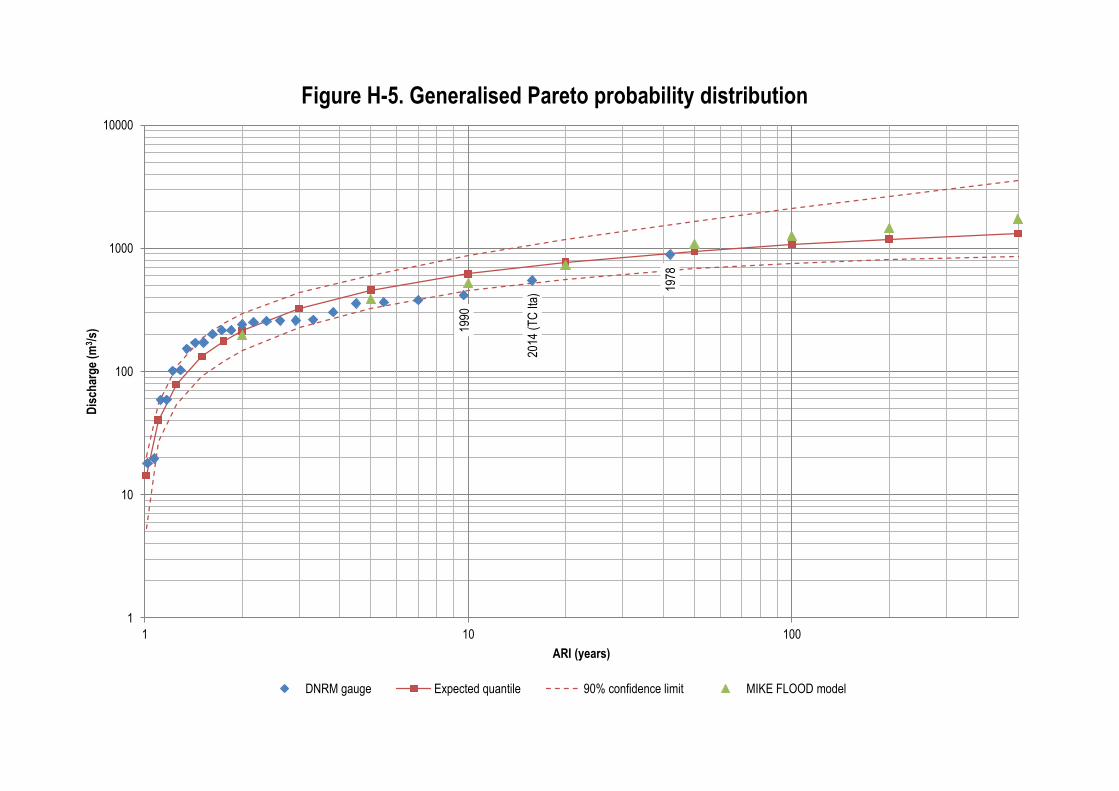
Figure H-5. Generalised Pareto probability distribution
DNRM gauge Expected quantile 90% confidence limit MIKE FLOOD model


