44
5187353DG0033 | 6 | April 2020 Atkins | 5187353dg0033 rev 6 - optionselectionreport.docx Appendix D. Traffic Modelling Report

5187353DG0033 | 6 | April 2020Atkins | 5187353dg0033 rev 6 - optionselectionreport.docx
Appendix D. Traffic Modelling Report

N53 Hackballscross to Rassan Upgrade 14/06/2019
Reference number 300513
PHASE 2 TRAFFIC MODELLING REPORT
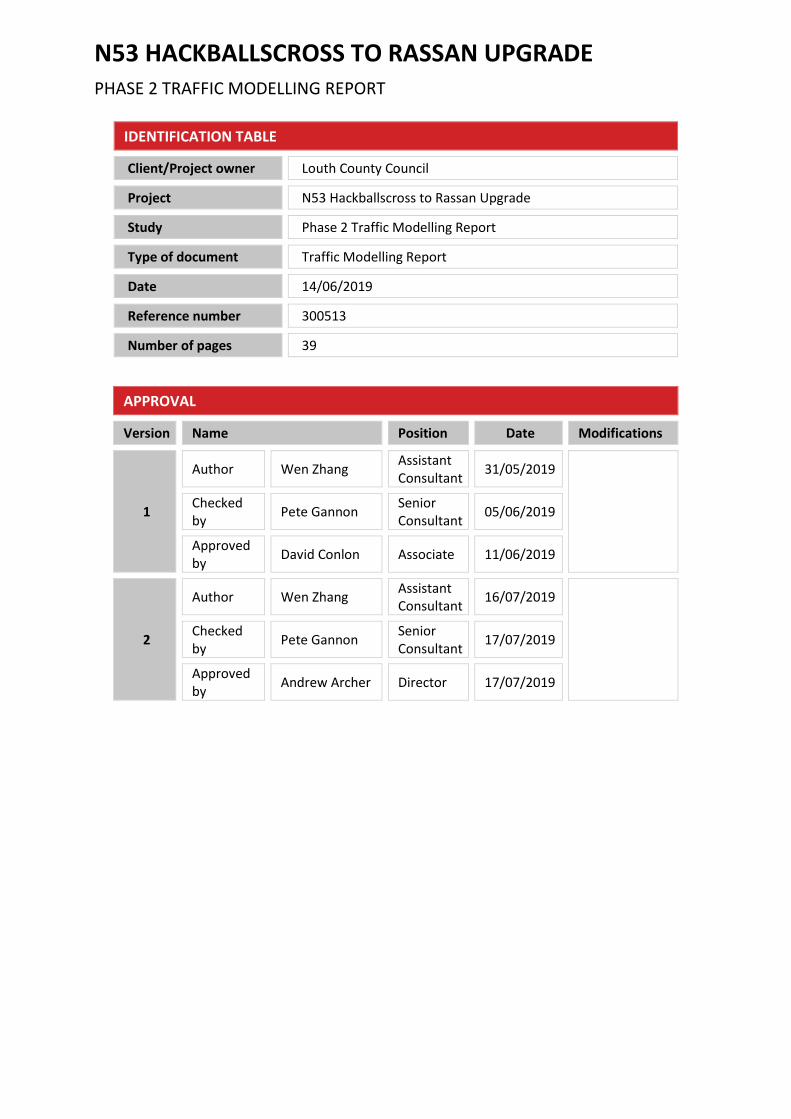
N53 HACKBALLSCROSS TO RASSAN UPGRADE PHASE 2 TRAFFIC MODELLING REPORT
IDENTIFICATION TABLE
Client/Project owner Louth County Council
Project N53 Hackballscross to Rassan Upgrade
Study Phase 2 Traffic Modelling Report
Type of document Traffic Modelling Report
Date 14/06/2019
Reference number 300513
Number of pages 39
APPROVAL
Version Name Position Date Modifications
1
Author Wen Zhang Assistant Consultant
31/05/2019
Checked by
Pete Gannon Senior Consultant
05/06/2019
Approved by
David Conlon Associate 11/06/2019
2
Author Wen Zhang Assistant Consultant
16/07/2019
Checked by
Pete Gannon Senior Consultant
17/07/2019
Approved by
Andrew Archer Director 17/07/2019
N53 Hackballscross to Rassan Upgrade
Phase 2 Traffic Modelling Report 300513
Transport Modelling Report 14/06/2019 Page 3/ 43
TABLE OF CONTENTS
1. INTRODUCTION 6
1.1 BACKGROUND 6
1.2 PURPOSE OF THIS STUDY 6
1.3 STUDY AREA 6
1.4 EXISTING CONDITIONS 7
1.5 PROPOSED OPTIONS 10
1.6 MODELLING OVERVIEW 11
2. DATA COLLECTION 12
2.1 SUMMARY 12
2.2 AUTOMATIC TRAFFIC COUNT (ATC) DATA 12
2.3 JUNCTION TURNING COUNT 13
2.4 MOVING CAR OBSERVER (MCO) JOURNEY TIME SURVEYS 13
3. MODEL DEVELOPMENT 15
3.1 OVERVIEW 15
3.2 MODEL SOFTWARE PLATFORM: VISSIM 15
3.3 MODEL TIME PERIODS AND USER CLASSES 15
3.4 NETWORK DEVELOPMENT 16
3.5 MODEL ZONE SYSTEM 17
3.6 GENERALISED COST 17
4. MODEL CALIBRATION AND VALIDATION 19
4.1 OVERVIEW OF THE CALIBRATION AND VALIDATION PROCESS 19
4.2 MODEL CALIBRATION RESULTS 20
5. MODEL VALIDATION 22
5.1 OVERVIEW 22
5.2 LINK AND TURN FLOW VALIDATION 22
5.3 JOURNEY TIME VALIDATION 23
5.4 CALIBRATION AND VALIDATION SUMMARY 24
6. FUTURE YEAR MODEL DEVELOPMENT 25
6.1 OVERVIEW 25
6.2 FUTURE YEAR NETWORK DEVELOPMENT 25
6.3 FUTURE YEAR MATRIX DEVELOPMENT 26
6.4 FUTURE YEAR MATRIX TOTALS 27

N53 Hackballscross to Rassan Upgrade
Phase 2 Traffic Modelling Report 300513
Transport Modelling Report 14/06/2019 Page 4/ 43
7. ANALYSIS OF OPTIONS 28
7.1 OVERVIEW 28
7.2 NETWORK PERFORMANCE INDICATORS 28
7.3 JOURNEY TIMES 29
7.4 ANNUAL AVERAGE DAILY TRAFFIC (AADT) 31
7.5 ROUTE OPTION AADTS 32
8. SUMMARY AND CONCLUSION 38
8.1 SUMMARY & CONCLUSIONS 38

N53 Hackballscross to Rassan Upgrade
Phase 2 Traffic Modelling Report 300513
Transport Modelling Report 14/06/2019 Page 5/ 43
LIST OF FIGURES
Figure 1-1 Study Area Extent 7 Figure 1-2 AADT Locations 8 Figure 1-3 ATC Traffic Profile 9 Figure 1-4 Route Options 11 Figure 2-1 Automatic Traffic Counter Locations 13 Figure 2-2 Junction Turning Count Locations 13 Figure 2-3 Journey Time Survey Route and Locations 14 Figure 3-1 N53 LAM VISSIM Microsimulation Model Extent 17 Figure 6-1 TII Proposed Speed Limits on N53 26 Figure 7-1 Green Route AADT Locations 33 Figure 7-2 Blue Route AADT Locations 34 Figure 7-3 Red Route AADT Locations 35 Figure 7-4 Brown Route AADT Locations 36 Figure 7-5 Purple Route AADT Locations 37
LIST OF TABLES
Table 2-1 AM and PM Peak Hour Start to End Journey Times 14 Table 4-1 Calibration Criteria 20 Table 4-2 Count Validation Statistics 21 Table 5-1 PAG Link Validation Criteria 22 Table 5-2 % of Links Achieving Validation Criteria for Counts used in Matrix Estimation 22 Table 5-3 % of Turns Achieving Validation Criteria for Counts used in Matrix Estimation 23 Table 5-4 PAG Journey Time Validation Criteria 23 Table 5-5 Journey Time Validation Summary 23 Table 6-1 Annual Growth Factors used in the model 26 Table 6-2 Comparison of Peak Hour Trip Matrix Totals 27 Table 7-1 Network Performance Indicators 2038 Design Year AM Peak 28 Table 7-2 Network Performance Indicators 2038 Design Year Inter Peak 29 Table 7-3 Network Performance Indicators 2038 Design Year PM Peak 29 Table 7-4 2038 Design Year AM Journey Time Comparison 30 Table 7-5 2038 Design Year Interpeak Journey Time Comparison 30 Table 7-6 2038 Design Year PM Journey Time Comparison 30 Table 7-7 AADT Expansion Factors by Time Period and User Class 32 Table 7-8 Green Route Future Year AADTs 33 Table 7-9 Blue Route Future Year AADTs 34 Table 7-10 Red Route Future Year AADTs 35 Table 7-11 Brown Route Future Year AADTs 36 Table 7-12 Purple Route Future Year AADTs 37

N53 Hackballscross to Rassan Upgrade
Phase 2 Traffic Modelling Report 300513
Transport Modelling Report 14/06/2019 Page 6/ 43
1. INTRODUCTION
1.1 Background
The proposed scheme entitled “N53 Hackballscross to Rassan Scheme” will commence at an appropriate tie-in point adjacent to Hackballscross in the Townland of Carrickastuck in Co. Louth and traverse west through the town lands of Annaghvacky and Rassan to tie-in to the existing engineered road cross section point in the Townland of Rassan. The scheme consists of the realignment of circa 3km of the existing N53 National Secondary Route.
The N53 has been identified as one of the country’s important National Secondary Routes, providing a strategic transport link for the northwest to the northeast. The N53 serves the towns of Dundalk, Castleblayney, where it joins the N2 for its onward linkage to the northwest.
The road is generally rural in nature. There are two number crossroads and other minor junctions within the scheme. The existing road is undulating in its vertical alignment with hidden dips, but generally straight in its horizontal alignment. The route caters for a significant number of heavy goods vehicles and strategic traffic.
Safety is compromised due to the poor vertical alignment and the number of at-grade junctions and private accesses along the existing road.
The N53 Hackballscross to Rassan Scheme is classified as a Minor Project (< €20m) [Ref: TII Project Appraisal Guidelines Unit 2.0].
1.2 Purpose of This Study
The scheme is currently at Option Selection stage (TII PAG Phase 2). The purpose of this Option Selection Phase is to identify a Preferred Option for the improvement of the N53. Feasible route options have been identified and assessed in order to identify a Preferred Route Corridor, to be progressed to Phase 3-Design and Phase 4-EIA/EAR & other Statutory Processes in accordance with TII’s Project Management Guidelines.
1.2.2 Atkins (Ireland) Ltd have been appointed to provide multi-disciplinary engineering consultancy services for delivery of the project and they have appointed SYSTRA Ltd to undertake the transport modelling elements of the project.
1.2.3 This report describes traffic modelling work undertaken by Systra, for the purpose of informing the selection of a Preferred Route Corridor. This includes the development of a Local Area Traffic Model (N53 LAM) to assess the likely traffic impact of a range of alignment options.
1.3 Study Area
For the purpose of this Traffic Modelling Report, a study area has been defined, within which transportation solutions will be assessed based on certain Key Performance Indicators (KPIs). The study area shown below in Figure 1-1 which includes the N53 National Road from Hackballscross to Rassan, and the following local roads:
Local Access Road L17120 North Local Road L17120 South Local Road

N53 Hackballscross to Rassan Upgrade
Phase 2 Traffic Modelling Report 300513
Transport Modelling Report 14/06/2019 Page 7/ 43
L7116 Local Road L3117 Local Road
Figure 1-1 Study Area Extent
1.4 Existing Conditions Overview
The section of the N53 between Hackballscross to Rassan is a national secondary route corridor which had essentially evolved over time to fit within the existing landscape. Hence, the current road layout bears little resemblance to modern day safety requirements and transportation demands. As such the alignment is well below current standards as it traverses the hilly terrain. The existing N53 is narrow and undulating in character thereby providing limited overtaking opportunities along its length. This in turn tends to lead to driver frustration and potentially hazardous driving manoeuvres.
The existing carriageway is a single carriageway, generally 6.0m wide with minimal grass verge widths. There is a posted speed limit of 100km/h in the rural areas, with 80km/h on approach to settlement areas, and 60km/h within the settlement areas (e.g. Annavacky). There are no hard shoulders or footways present which creates an inherently hazardous environment for vulnerable road users such as pedestrians and cyclists. There is no formal surface water drainage system present and run off from the road surface simply runs along the edge of the carriageway and discharges into the nearest ditch. The uneven surface can result in surface water ponding in certain areas during periods of heavy rainfall which creates inherent safety issues in wet weather.
This section of the N53 would not be considered to pass through heavily developed areas. The route passes through a small crossroads at Annaghvacky which has a local shop and several domestic houses. The N53 also caters for significant HGV’s and by its nature, the National Secondary Route is a strategic traffic route from the northeast to the northwest and partly through Northern Ireland. However, the high number of local accesses and the rural environment within which it lies means there is a significant proportion of local traffic and also slow-moving agricultural vehicles.
Hackballscross
Rassan
L17120 S
L17120 N
L3117 L7116
Local Access
N53 Hackballscross to Rassan Upgrade
Phase 2 Traffic Modelling Report 300513
Transport Modelling Report 14/06/2019 Page 8/ 43
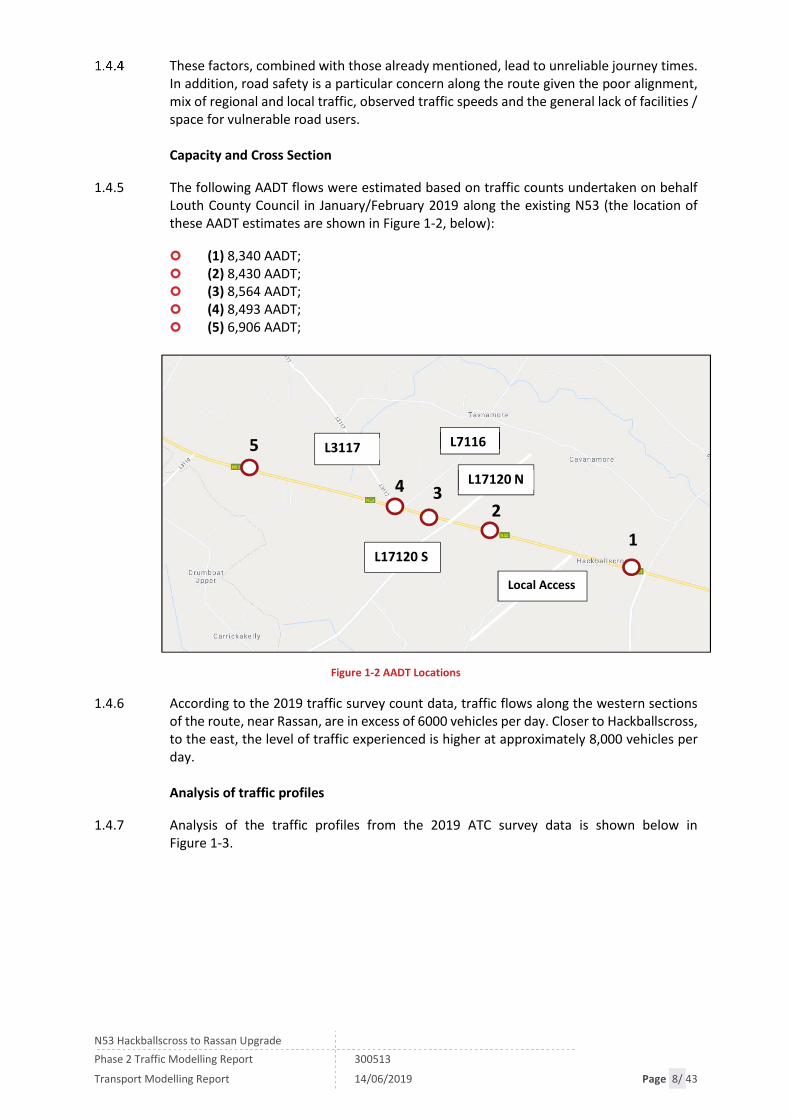
These factors, combined with those already mentioned, lead to unreliable journey times. In addition, road safety is a particular concern along the route given the poor alignment, mix of regional and local traffic, observed traffic speeds and the general lack of facilities / space for vulnerable road users. Capacity and Cross Section
1.4.5 The following AADT flows were estimated based on traffic counts undertaken on behalf Louth County Council in January/February 2019 along the existing N53 (the location of these AADT estimates are shown in Figure 1-2, below):
(1) 8,340 AADT; (2) 8,430 AADT; (3) 8,564 AADT; (4) 8,493 AADT; (5) 6,906 AADT;
Figure 1-2 AADT Locations
1.4.6 According to the 2019 traffic survey count data, traffic flows along the western sections of the route, near Rassan, are in excess of 6000 vehicles per day. Closer to Hackballscross, to the east, the level of traffic experienced is higher at approximately 8,000 vehicles per day. Analysis of traffic profiles
1.4.7 Analysis of the traffic profiles from the 2019 ATC survey data is shown below in Figure 1-3.
1
2 3 4
5
L17120 S
L17120 N
L3117 L7116
Local Access

N53 Hackballscross to Rassan Upgrade
Phase 2 Traffic Modelling Report 300513
Transport Modelling Report 14/06/2019 Page 9/ 43
Figure 1-3 ATC Traffic Profile
1.4.8 The graph above highlights the following points–
The daily profile above is similar to that which would be observed on many roads in Ireland, with two distinct peaks during the weekdays (implying significant commuter flows), and the PM having slightly higher levels of two-way traffic (implying a wider mix of purposes than simply the return flow of AM peak commuters). While the weekend days show a higher afternoon flow which would be representative of shopping patterns.
Friday conditions are markedly different from other weekdays, with a lower morning peak at 8am and higher flows leading up to the PM peak (a longer peak period).
The remaining weekdays show a similar pattern, with some day-to-day variations. P Factor
1.4.9 TII PAG Unit 16.1: Expansion Factors for Short Period Traffic Counts, discusses the daily profile of traffic and the concept of ‘peaky’ or ‘flat’ profiles. The unit states that ‘In order to represent the ‘Peakiness’ of a traffic flow profile over a particular day, the concept of a ‘p-factor’ has been derived. The p-factor simply describes the scale of the reduction in flow between the AM Peak and the quietest period of the afternoon (the Inter-Peak), and from the Inter-Peak back up to the PM Peak’. It is defined as follows:
p = a + b - 2c
Where: p = the peakiness index a = the maximum hourly proportion of traffic between 00:00
and 12:00 on a weekday b = the maximum hourly proportion of traffic between 12:00
and 24:00 on a weekday c = the minimum hourly proportion of traffic between 08:00
and 18:00 on a weekday

N53 Hackballscross to Rassan Upgrade
Phase 2 Traffic Modelling Report 300513
Transport Modelling Report 14/06/2019 Page 10/ 43
1.4.10 The ‘p-factor’ has been calculated as 0.104 for the N53 based on the daily traffic profile illustrated in Figure 1-3. PAG Unit 16.1 states that “the maximum p-factor is 1.0, in which case all traffic flow would occur during 2 individual peak hours of the day, separated by a cessation of all traffic during the afternoon.
1.4.11 The national mean p-factor taken from the Permanent counters located throughout out the country was found to be 0.071. The p-factor for the N53 is higher than the mean p-factor nationally which would indicate higher inter peak traffic levels.
1.5 Proposed Options
1.5.1 Five route options have been identified within the scheme study area, as shown in the figure below, which are to be appraised according to the PAG Phase 2 Option Selection guidelines. Figure 1.4 below shows a map of the five options and detailed descriptions are provided below. Red Route
The Red Route commences west of Hackballscross and continues on the existing N53 for approx. 400m before deviating north-westwards. It continues to follow this path, bypassing the settlements of Annaghvacky on the north side until it passes through the L7116 road. At this point it begins to turn southwest towards the existing N53, also intersecting the L3117 road. After bypassing south of Scoil Bhríde, it ties-in to the existing N53. Green Route
The Green Route commences west of Hackballscross and continues on the existing N53 for approx. 200m before deviating south-westwards. It continues to head in this direction for approx. 500m before traversing approx. westwards in a manner parallel with the existing N53. It maintains this direction until it passes the settlements of Annaghvacky, before tying back in to the existing N53 east of the L3117 road. Blue Route
The Blue Route commences west of Hackballscross and stays online for approx. 1.2km before turning offline in a south-westward direction. It bypasses the centre of Anaghvacky before tying back into the existing N53 east of the L3117 road. Purple Route
The Purple Route commences westof Hackballscross and continues on the existing N53 for approx. 200m before deviating south-westwards. It continues to head in this direction for approx. 500m before traversing approx. westwards in a manner parallel with the existing N53. This orientation is continued for approx. 1.6km as it heads westwards past the centre of Annaghvacky, before it heads in a northwest direction to tie back in with the existing N53. Brown Route
The Brown Route commences west of Hackballscross and stays online for approx. 1.2km before turning offline in a south-westward direction. As it bypasses the centre of Annaghvacky, it continues with an orientation approximately parallel to the existing N53

N53 Hackballscross to Rassan Upgrade
Phase 2 Traffic Modelling Report 300513
Transport Modelling Report 14/06/2019 Page 11/ 43
for approx. 500m before it heads in a northwest direction to tie back in with the existing N53.
Figure 1-4 Route Options
1.6 Modelling Overview Base Year Model Development
A Local Area Model (Microsimulation Model) has been developed in VISSIM for the study area. This model is referred to as the N53 Local Area Model (LAM). The LAM model comprises four basic components:
Highway network (links and connectors); Traffic control systems (stop and give-way control); Traffic inputs; Vehicle type and compositions; and Time periods modelled
1.6.2 For the purposes of this Study, a Local Area Model has been developed for the following time periods:
AM Peak Hour (08:00-09:00); Average Inter-Peak Hour (10:00-16:00); and PM Peak Hour (17:00 – 18:00). Forecast Year Models
Future growth in travel demand for the LAM has been determined in accordance with the Link Based Growth approach described in TII PAG Unit 5.3 - Travel Demand Projections.
Further details on the N53 Local Area Model development, including calibration and validation statistics are contained within Chapters 3 - 6 of this report.

N53 Hackballscross to Rassan Upgrade
Phase 2 Traffic Modelling Report 300513
Transport Modelling Report 14/06/2019 Page 12/ 43
2. DATA COLLECTION
2.1 Summary
Traffic data from multiple sources was required to ensure that the N53 LAM accurately replicated and represented base year traffic volumes, origin-destination patterns, driver behaviour, and network operations.
In summary, the following data sources were used in the calibration and validation of the N53 LAM model:
Automatic Traffic Counters (ATC) at 7 locations within the study area. This ATC data was collected over a 14 day period from Friday, January 25th until Thursday, February 7th, 2019.
Junction Turning Counts (JTC) at 2 locations within the study area. This JTC data was collected on Wednesday, February 6th 2019; and
Journey Time Surveys along the N53, collected in May 2019.
2.2 Automatic Traffic Count (ATC) Data
Automatic Traffic Counters (ATC) were set up at each road in the study area and collected data continuously for a 14 day period from Friday, January 25th until Thursday, February 7th, 2019.
The ATC locations are shown in Figure 2-1 and included:
1: N53 East National Road 2: Local Access Road 3: L17120 North Local Road 4: L17120 South Local Road 5: L7116 Local Road 6: L3117 Local Road 7: N53 West National Road
1 2
3
4
5 6
7
L17120 S
L17120 N
L3117 L7116
Local Access

N53 Hackballscross to Rassan Upgrade
Phase 2 Traffic Modelling Report 300513
Transport Modelling Report 14/06/2019 Page 13/ 43
Figure 2-1 Automatic Traffic Counter Locations
2.3 Junction Turning Count
Junction Turning Counts (JTCs) were carried out using camera footage collected during the ATC surveys. These JTCs were carried out using footage collected on the Wednesday, February 6th 2019 for the AM, Inter-Peak And PM Peak Periods, for the junctions illustrated in Figure 2-2, which included:
N53/ L3117 Priority Junction; and N53/ L17120 Priority Junction.
Figure 2-2 Junction Turning Count Locations
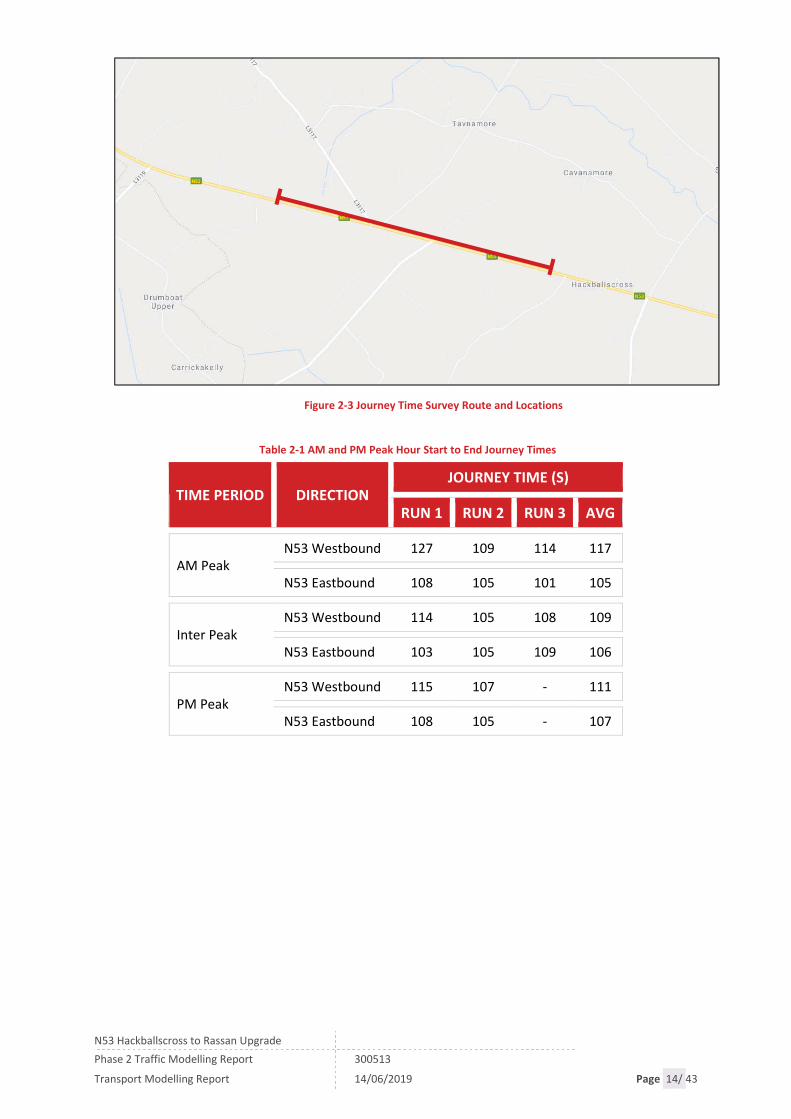
2.4 Moving Car Observer (MCO) Journey Time Surveys
Journey time surveys were carried out along the N53 on Wednesday, May 22nd 2019. Average Journey Times (eastbound and westbound) were recorded during the AM, Inter-Peak and PM peak periods. The journey time survey results for AM, Inter-Peak and PM peak hour periods are shown below in Table 2-1. The survey route start and end locations are shown in Figure 2-3.
2
1 L17120 S
L17120 N
L3117 L7116
Local Access
N53 Hackballscross to Rassan Upgrade
Phase 2 Traffic Modelling Report 300513
Transport Modelling Report 14/06/2019 Page 14/ 43
Figure 2-3 Journey Time Survey Route and Locations
Table 2-1 AM and PM Peak Hour Start to End Journey Times
TIME PERIOD DIRECTION JOURNEY TIME (S)
RUN 1 RUN 2 RUN 3 AVG
AM Peak N53 Westbound 127 109 114 117
N53 Eastbound 108 105 101 105
Inter Peak N53 Westbound 114 105 108 109
N53 Eastbound 103 105 109 106
PM Peak N53 Westbound 115 107 - 111
N53 Eastbound 108 105 - 107

N53 Hackballscross to Rassan Upgrade
Phase 2 Traffic Modelling Report 300513
Transport Modelling Report 14/06/2019 Page 15/ 43
3. MODEL DEVELOPMENT
3.1 Overview
This chapter of the report describes the development of the Base Year (2019) N53 Local Area Model with reference to the following aspects:
Modelling software used; Model time periods; and Network and Zone system development.
The model has been developed in line with the guidelines set out in the TII Project Appraisal Guidelines (PAG) Unit 5.1: Construction of Traffic Models.
3.2 Model Software Platform: VISSIM
A Local Area Model (Microsimulation Model) has been developed in VISSIM for the study area. This model is referred to as the N53 Local Area Model (LAM). The LAM model comprises five basic components:
Highway network (links and connectors); Traffic control systems (stop and give-way control); Traffic inputs; Vehicle type and compositions; and Vehicle routes.
The latest version of VISSIM 10 has been used to construct and run the model.
The model uses VISSIM’s dynamic traffic assignment, which requires traffic flows to be input as origin-destination (OD) matrices. Dynamic assignment allows vehicles to switch routes depending on which is quickest. Vehicles have been assigned to the network as total volumes over one-hour intervals. Compositions (split by vehicle type, 10% for HGV) have been calculated using the traffic survey data.
Some of the most commonly used model performance indicators available from VISSIM include:
General network performance statistics; Junction analysis (demand, average and maximum queue lengths); Link flow analysis; and Journey times.
As VISSIM is a stochastic model the results differ slightly depending on the random seed assigned to each simulation run. Therefore, in order to obtain statistically significant results the existing conditions peak hour models were simulated 10 times with different random seeds. Random seeds can be thought of as different days and therefore account for daily variation. The results presented are an average of the 10 random seed runs.
3.3 Model Time Periods and User Classes
The standard model time period for traffic simulation and assignment models is one hour and therefore model development and data collection was carried out based on this assumption.

N53 Hackballscross to Rassan Upgrade
Phase 2 Traffic Modelling Report 300513
Transport Modelling Report 14/06/2019 Page 16/ 43
Through a review of survey data, it was noted that the highest traffic flows entering and leaving the area were experienced from 08:00 to 09:00 in the AM, 17:00 to 18:00 in the PM and period. The Inter-Peak Period was defined as the averaged traffic flow data between 10:00 to 16:00. Therefore, the N53 LAM has been calibrated and validated to represent the following time periods:
AM Morning peak period: 08:00 to 09:00 Inter peak period: Average hour between 10:00 - 16:00 PM Evening peak period: 17:00 to 18:00
The trip demand matrices for these time periods, representing a base year of 2019, were developed using a combination of JTC and ATC survey data. The demand matrices are segregated into two vehicle types (or user classes), as follows:
User Class One - Cars and light Goods Vehicles (LV’s). All cars and two axle trucks or other type commercial vehicles are considered LV’s; and
User Class Two - Heavy Goods Vehicles (HV’s). This user class is comprised of goods vehicles with 3 or more axles.
3.4 Network Development
The goal in developing the N53 LAM was to create a model that accurately reflects current traffic conditions in the study area (illustrated in Figure 1-1previously) for the 2019 base year, and to a sufficient level of detail to allow the appraisal of each route option. To achieve this goal, the model must be defined in terms of road network and trip demand representation.
3.4.2 A best practice approach has been adopted to generate the detailed traffic network for the LAM. Digital mapping systems such as Google Earth were used to get a high-level view of the network including junction layout details, such as permitted or banned turns, junction priority etc., to ensure it represented, as accurately as possible, the existing road network.
Figure 3-1, below, illustrates the extent of the road network for the N53 LAM. The blue links represent the road network that is included in the N53 LAM VISSIM model.

N53 Hackballscross to Rassan Upgrade
Phase 2 Traffic Modelling Report 300513
Transport Modelling Report 14/06/2019 Page 17/ 43
Figure 3-1 N53 LAM VISSIM Microsimulation Model Extent
3.5 Model Zone system
The model uses VISSIM’s dynamic traffic assignment, which requires traffic flows to be input as origin-destination (OD) matrices. The OD matrices are generated based on Automatic Traffic Count (ATC) data and individual junction turning counts. Each ATC site is considered as one Zone (origin/destination) and a total of 7 zones are included in the N53 LAM model.
3.6 Generalised Cost
The path selection of traffic on the modelled network depends on the following factors:
Travel time spatial length of the paths financial cost on the paths, for example for a toll
In contrast to travel times, the spatial lengths of the paths and the financial costs do not depend on the traffic conditions. Thus the spatial lengths of the paths and the financial costs do not need to be determined by simulation but can be read directly from the network model.
To account for these three factors in path selection, for each edge the so called general cost is computed as a weighted sum:
General cost = a • travel time + b • travel distance + g • financial cost + Σ cost surcharge
Where:
a for travel time b for travel distance g for link costs
L17120 S
L17120 N
L3117 L7116
Local Access

N53 Hackballscross to Rassan Upgrade
Phase 2 Traffic Modelling Report 300513
Transport Modelling Report 14/06/2019 Page 18/ 43
Cost coefficients are specific to vehicle types. This allows the modelling of driver groups with different path selection behaviours, with different time, path and money determinants. The travel distances are determined from the geometry of the links. The financial cost of an edge is the sum of the costs of all links that are contained in that edge. The cost surcharge is computed by multiplying the cost rate per kilometre specified in the link by the length of the route which is contained in the edge, or added to the general link costs without weighting.
N53 Hackballscross to Rassan Upgrade
Phase 2 Traffic Modelling Report 300513
Transport Modelling Report 14/06/2019 Page 19/ 43
4. MODEL CALIBRATION AND VALIDATION
4.1 Overview of the Calibration and Validation Process
Calibration is used to improve agreement in the model between observed and modelled traffic characteristics. Generally, the components of the model that may be adjusted on the demand side are trip distribution and trip production and generation levels. This adjustment usually involves trip matrix estimation.
On the supply side (network), modelled junction and link characteristics may be altered if sufficient new information is available to justify changes to the existing network.
The N53 LAM was calibrated and validated in accordance with Transport Infrastructure Ireland’s (TII) Project Appraisal Guidelines (PAG) for National Roads Unit 5.1 – Construction of Transport Models (October 2016). This is a widely accepted standard in Ireland that provides robust calibration and validation criteria to which certain types of highway models should adhere.
The following sections of this chapter detail the calibration process undertaken to ensure that the N53 LAM model accurately reflects baseline conditions, including information on:
Traffic Count Data; Calibration Steps; Matrix Estimation; and Calibration Statistics i.e. GEH. Traffic Count Data
To ensure the robustness of the model, a series of traffic counts for the study area have been used to assist in the calibration and validation of base model flows. The following surveys (which have been described in chapter 2) were used in the process:
Junction Turning Counts (JTC) at 2 locations; Automatic Traffic Counts (ATC) at 7 locations; and Moving Car Observer (MCO) Journey Time Surveys along the existing alignment in
both directions. Calibration Steps
As an initial calibration step, all modelled movements with corresponding junction turning counts were examined to determine if the count exceeded modelled capacity. These movements were also compared to behaviour observed on site and in traffic survey video footage to ensure modelled driver behaviour matched observed driver behaviour. Remedial steps were then taken to permit realistic flows and behaviour in the model.
Similarly, the capacity and speeds of modelled links were also checked to ensure they were broadly in line with survey information. Matrix Estimation
Following calibration of the network, trip demand was adjusted in line with traffic count data, so that there is an improved agreement between counts and modelled flows. Each entry/exit point into the model was considered as one Zone (origin/destination) and a

N53 Hackballscross to Rassan Upgrade
Phase 2 Traffic Modelling Report 300513
Transport Modelling Report 14/06/2019 Page 20/ 43
total of 7 zones were included in the N53 LAM model. The OD matrices were generated using both Automatic Traffic Count (ATC) data and individual junction turning counts with the junction counts providing the turning proportions at junctions and the two week ATCs used to adjust the trip ends (entry/exit points).
Calibration Statistics: GEH
The GEH statistic is a measure that considers both absolute and proportional differences in flows. Thus, for high levels of flow a low GEH may only be achieved if the percentage difference in flow is small. For lower flows, a low GEH may be achieved even if the percentage difference is relatively large. GEH is formulated as:
The reason for introducing such a statistic is the inability of either the absolute difference or the relative difference to cope over a wide range of flows. For example, an absolute difference of 100 pcu/h may be considered a big difference if the flows are of the order of 100 pcu/h, but would be unimportant for flows in the order of several thousand pcu/h. Equally a 10% error in 100 pcu/h would not be important, whereas a 10% error in, say, 3000 pcu/h might mean the difference between adding capacity to a road or not.
In general, the GEH parameter is less sensitive to the above statistical biases since a modeller would probably feel that an error of 20 in 100 would be roughly as bad as an error of 90 in 2,000, and both would have a GEH statistic of roughly 2.
As a rule of thumb in comparing assigned volumes with observed flows, a GEH parameter of 5 or less would be an acceptable fit, while GEH parameters greater than 10 would require closer attention.
PAG (Unit 5.1 Table 5.1.3) specifies permissible differences between observed and modelled link flows that should be met during calibration. This document sets a guideline that 85% of links should have a GEH less than 5 (when measured in vehicles per hour) as shown in Table 4-1 below. In addition, it is commonplace to establish that 90% of assessment links have a GEH of less than 10 and that 100% of validation links have a GEH less than 20.
Table 4-1 Calibration Criteria
Criteria Acceptability Guideline
GEH < 5 for individual flows > 85% of cases
4.2 Model Calibration Results
Table 4-2below summarises the GEH calibration results for the N53 LAM after the matrix estimation process, for each of the three modelled time periods. The full list of GEH results for each traffic count location are presented in the accompanying calibration dashboards in Appendix A.
)modelledobserved(5.0
)modelledobserved(GEH
2

N53 Hackballscross to Rassan Upgrade
Phase 2 Traffic Modelling Report 300513
Transport Modelling Report 14/06/2019 Page 21/ 43
Table 4-2 Count Validation Statistics
GEH AM INTER-PEAK PM
GEH < 5 100% 100% 100%
GEH < 10 100% 100% 100%
GEH < 20 100% 100% 100%
Overall Average GEH 0.9 0.6 0.8
The figures above demonstrate that all calibration criteria have been achieved in the model for the morning, evening and inter peak periods, and fall above TII standards.
N53 Hackballscross to Rassan Upgrade
Phase 2 Traffic Modelling Report 300513
Transport Modelling Report 14/06/2019 Page 22/ 43
5. MODEL VALIDATION
5.1 Overview
The validation of the model uses additional comparative measures against which the robustness of the calibrated model may be judged. For the N53 LAM model, traffic flow criteria and modelled versus observed journey times were used to validate the model.
5.2 Link and Turn Flow Validation
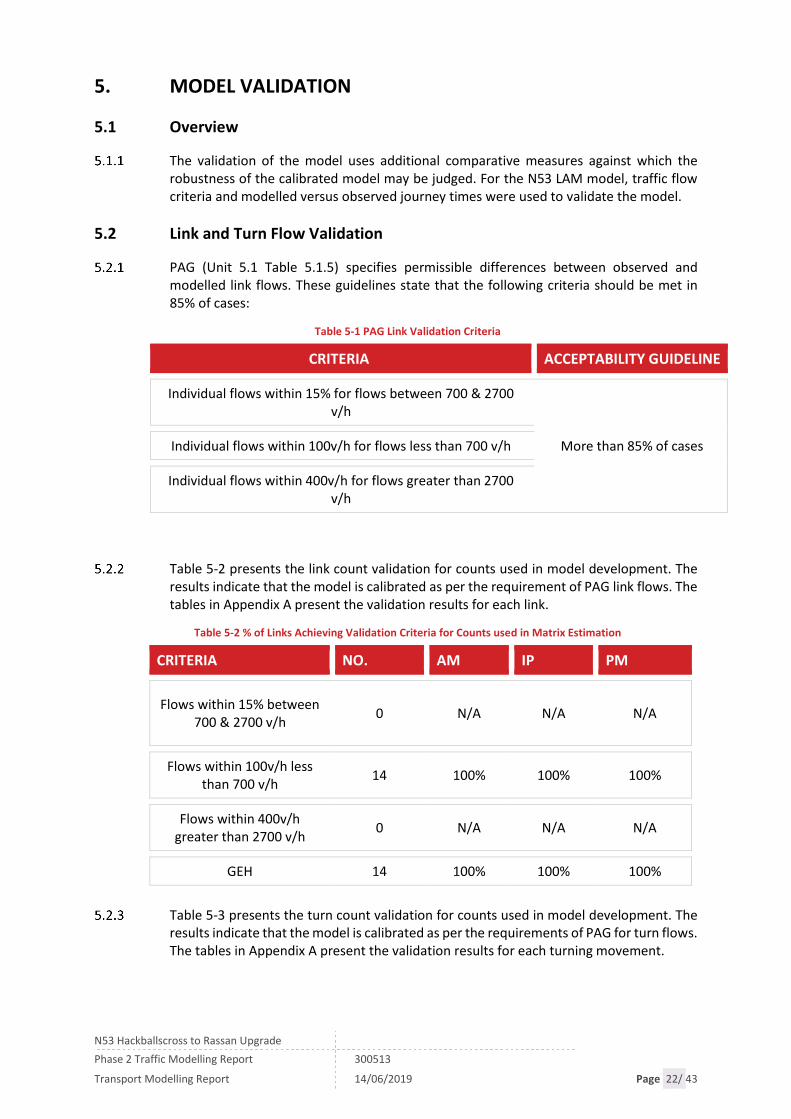
PAG (Unit 5.1 Table 5.1.5) specifies permissible differences between observed and modelled link flows. These guidelines state that the following criteria should be met in 85% of cases:
Table 5-1 PAG Link Validation Criteria
CRITERIA ACCEPTABILITY GUIDELINE
Individual flows within 15% for flows between 700 & 2700 v/h
More than 85% of cases Individual flows within 100v/h for flows less than 700 v/h
Individual flows within 400v/h for flows greater than 2700 v/h
Table 5-2 presents the link count validation for counts used in model development. The results indicate that the model is calibrated as per the requirement of PAG link flows. The tables in Appendix A present the validation results for each link.
Table 5-2 % of Links Achieving Validation Criteria for Counts used in Matrix Estimation
CRITERIA NO. AM IP PM
Flows within 15% between 700 & 2700 v/h
0 N/A N/A N/A
Flows within 100v/h less than 700 v/h
14 100% 100% 100%
Flows within 400v/h greater than 2700 v/h
0 N/A N/A N/A
GEH 14 100% 100% 100%
Table 5-3 presents the turn count validation for counts used in model development. The results indicate that the model is calibrated as per the requirements of PAG for turn flows. The tables in Appendix A present the validation results for each turning movement.

N53 Hackballscross to Rassan Upgrade
Phase 2 Traffic Modelling Report 300513
Transport Modelling Report 14/06/2019 Page 23/ 43
Table 5-3 % of Turns Achieving Validation Criteria for Counts used in Matrix Estimation
CRITERIA NO. AM IP PM
Flows within 15% between 700 & 2700 v/h
0 N/A N/A N/A
Flows within 100v/h less than 700 v/h
20 100% 100% 100%
Flows within 400v/h greater than 2700 v/h
0 N/A N/A N/A
GEH 20 100% 100% 100%
5.3 Journey Time Validation
As outlined previously in chapter 2, Journey Time Surveys were carried out along the N53 mainline. The Moving Observer method was used to collect journey time data in both directions.
The models have been validated against Journey Times observed on site. The validation criteria for Journey Time Validation is outlined in PAG Unit 5.2: Construction of Traffic Models and is summarised below in Table 5-4.
Table 5-4 PAG Journey Time Validation Criteria
TYPE VALIDATION CRITERIA ACCEPTABILITY GUIDELINE
Journey Times Times within 15% of or 1 minute of observed time
More than 85% of cases
The difference between modelled and observed journey times was compared for all vehicles with respect to the criteria outlined above. A summary of the calibration results is presented below for the AM and PM Peak hour.
Table 5-5 Journey Time Validation Summary
ROUTE TIME PERIOD
JOURNEY TIMES DIFF %
PAG CRITERIA OBSERVED MODELLED
N53 Westbound AM
117 102 13% PASS
N53 Eastbound 105 100 5% PASS
N53 Westbound Inter Peak
109 101 7% PASS
N53 Eastbound 106 96 9% PASS
N53 Westbound PM 111 107 3% PASS

N53 Hackballscross to Rassan Upgrade
Phase 2 Traffic Modelling Report 300513
Transport Modelling Report 14/06/2019 Page 24/ 43
ROUTE TIME PERIOD
JOURNEY TIMES DIFF %
PAG CRITERIA OBSERVED MODELLED
N53 Eastbound 107 97 9% PASS
5.4 Calibration and Validation Summary
The previous two chapters provide an overview of the calibration and validation of the N53 local area model which has been developed to assess the proposed route alignment options of the N53 upgrade. In summary:
The model has been calibrated and validated in-line with TII Project Appraisal Guidelines and meets all specified criteria for both the AM, Inter-peak and PM peaks;
The LAM is fit for purpose, and represents AM, Inter-peak and PM peak period base year traffic conditions well, as demonstrated statistically through calibration and validation.
It provides a robust basis for assessing the proposed route alignment options as:
The model realistically represents journey times; and The study area is covered by a large number of calibration counts.
N53 Hackballscross to Rassan Upgrade
Phase 2 Traffic Modelling Report 300513
Transport Modelling Report 14/06/2019 Page 25/ 43
6. FUTURE YEAR MODEL DEVELOPMENT
6.1 Overview
This chapter sets out the development of the future year N53 LAM models for the scheme opening year (2023) and design year (2038). These forecast years will be used for assessing the performance of the Scheme and for input into the design process.
6.2 Future Year Network Development
The future year networks include the different alignment options to be tested (outlined in chapter 1). The future year networks developed are: 2023 Opening Year
Do Minimum Do Something(s):
Green Route Blue Route Red Route Brown Route Purple Route
2038 Design Year
Do Minimum Do Something(s):
Green Route Blue Route Red Route Brown Route Purple Route
TII Speed Review
Transport Infrastructure Ireland (TII) have recently completed a speed review along the N53 in the study area. Following this review the speed limits along the N53 are set to be reduced from 100kph to 80kp and 60kph, as indicated in the figure below.

N53 Hackballscross to Rassan Upgrade
Phase 2 Traffic Modelling Report 300513
Transport Modelling Report 14/06/2019 Page 26/ 43
Figure 6-1 TII Proposed Speed Limits on N53
These revised speed limits are due to come into operation from late May / early June 2019 and therefore have been included in all future year models.
6.3 Future Year Matrix Development
The forecast year matrices have been estimated based on forecast growth between the base and future year for Light Vehicles (LV) and Heavy Vehicles (HV) respectively. The future growth in travel demand for the N53 model has been carried out in accordance with the Link Based Growth approach described in TII PAG Unit 5.3 - Travel Demand Projections (October 2016 version, latest version available at time of modelling). Table 6-1, below, shows the annual growth factors adopted in the development of the N53 future year models.
Table 6-1 Annual Growth Factors used in the model
REGION
CENTRAL GROWTH
2013 - 2030 2030 - 2050
LV HV LV HV
Border 1.0114 1.0237 1.0030 1.0176
These growth factors have been applied to the calibrated base year matrices to create the future year matrices for Light Vehicles and Heavy Vehicles.

N53 Hackballscross to Rassan Upgrade
Phase 2 Traffic Modelling Report 300513
Transport Modelling Report 14/06/2019 Page 27/ 43
6.4 Future Year Matrix Totals
A comparison of the peak hour trip matrix totals for the Base Year, 2023 Opening Year and 2038 Design Year scenarios are outlined in the tables below, in terms of vehicles (Light Vehicles and Heavy Vehicles combined).
Table 6-2 Comparison of Peak Hour Trip Matrix Totals
TIME PERIOD 2019 2023 2038
AM 973 1024 1163
IP 559 588 667
PM 1043 1098 1247
N53 Hackballscross to Rassan Upgrade
Phase 2 Traffic Modelling Report 300513
Transport Modelling Report 14/06/2019 Page 28/ 43
7. ANALYSIS OF OPTIONS
7.1 Overview
This chapter provides a summary of the performance of each upgrade option, based on the following analysis:
Network Performance Indicators; Journey Times; and AADT flows.
7.2 Network Performance Indicators
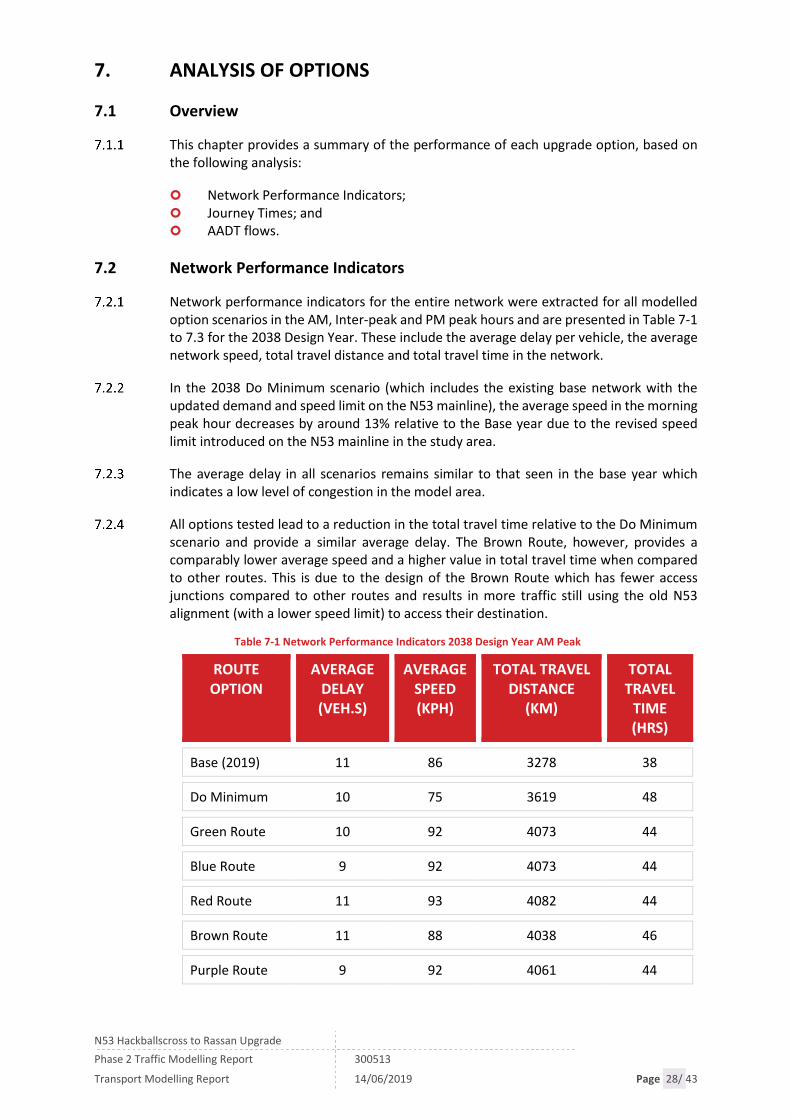
Network performance indicators for the entire network were extracted for all modelled option scenarios in the AM, Inter-peak and PM peak hours and are presented in Table 7-1 to 7.3 for the 2038 Design Year. These include the average delay per vehicle, the average network speed, total travel distance and total travel time in the network.
In the 2038 Do Minimum scenario (which includes the existing base network with the updated demand and speed limit on the N53 mainline), the average speed in the morning peak hour decreases by around 13% relative to the Base year due to the revised speed limit introduced on the N53 mainline in the study area.
The average delay in all scenarios remains similar to that seen in the base year which indicates a low level of congestion in the model area.
All options tested lead to a reduction in the total travel time relative to the Do Minimum scenario and provide a similar average delay. The Brown Route, however, provides a comparably lower average speed and a higher value in total travel time when compared to other routes. This is due to the design of the Brown Route which has fewer access junctions compared to other routes and results in more traffic still using the old N53 alignment (with a lower speed limit) to access their destination.
Table 7-1 Network Performance Indicators 2038 Design Year AM Peak
ROUTE OPTION
AVERAGE DELAY (VEH.S)
AVERAGE SPEED (KPH)
TOTAL TRAVEL DISTANCE
(KM)
TOTAL TRAVEL
TIME (HRS)
Base (2019) 11 86 3278 38
Do Minimum 10 75 3619 48
Green Route 10 92 4073 44
Blue Route 9 92 4073 44
Red Route 11 93 4082 44
Brown Route 11 88 4038 46
Purple Route 9 92 4061 44

N53 Hackballscross to Rassan Upgrade
Phase 2 Traffic Modelling Report 300513
Transport Modelling Report 14/06/2019 Page 29/ 43
Table 7-2 Network Performance Indicators 2038 Design Year Inter Peak
ROUTE OPTION
AVERAGE DELAY (VEH.S)
AVERAGE SPEED (KPH)
TOTAL TRAVEL DISTANCE
(KM)
TOTAL TRAVEL TIME
(HRS)
Base (2019) 8 86 1816 21
Do Minimum 7 76 2159 28
Green Route 8 91 2237 25
Blue Route 7 91 2234 25
Red Route 8 92 2225 24
Brown Route 8 87 2227 26
Purple Route 7 92 2235 24
Table 7-3 Network Performance Indicators 2038 Design Year PM Peak
ROUTE OPTION
AVERAGE DELAY (VEH.S)
AVERAGE SPEED (KPH)
TOTAL TRAVEL DISTANCE
(KM)
TOTAL TRAVEL TIME
(HRS)
Base (2019) 12 85 3445 40
Do Minimum 12 74 4108 55
Green Route 12 90 4277 47
Blue Route 12 91 4268 47
Red Route 10 92 4253 46
Brown Route 12 87 4274 49
Purple Route 10 92 4266 46
7.3 Journey Times
A Journey time analysis has been undertaken between Hackballscross and Rassan on the N53 mainline, in order to compare the performance of each option. The tables below present the journey time analysis for the 2038 design year in each of the three modelled time periods.
The journey time analysis shows that most of the route options perform similarly at reducing journey times compared to the Do-Minimum (DM), saving approximately 30 seconds (a 19% reduction) on the westbound route and 27 seconds (a 18% reduction) on the eastbound route in the AM peak hour. A similar result is observed in the PM peak hour.

N53 Hackballscross to Rassan Upgrade
Phase 2 Traffic Modelling Report 300513
Transport Modelling Report 14/06/2019 Page 30/ 43
The Red Route experiences a marginally longer journey time (approximately between 3% - 5% increase) compared to other route options. This is a result of the additional junctions on this route, which leads to increased delay and slightly slower speeds.
Table 7-4 2038 Design Year AM Journey Time Comparison
ROUTE OPTION JOURNEY TIME (S)
DIFF DIFF WB EB DM WB DM EB
Green Route 121.24 125.41 150.05 153.07 -19% -18%
Blue Route 120.75 125.09 150.05 153.07 -20% -18%
Red Route 123.95 131.88 150.05 153.07 -17% -14%
Brown Route 121.03 125.98 150.05 153.07 -19% -18%
Purple Route 120.98 125.65 150.05 153.07 -19% -18%
Table 7-5 2038 Design Year Interpeak Journey Time Comparison
ROUTE OPTION JOURNEY TIME (S)
DIFF DIFF WB EB DM WB DM EB
Green Route 121.49 120.96 150.05 153.07 -19% -21%
Blue Route 120.86 120.44 150.05 153.07 -19% -21%
Red Route 123.98 126.79 150.05 153.07 -17% -17%
Brown Route 121.22 120.62 150.05 153.07 -19% -21%
Purple Route 121.13 120.9 150.05 153.07 -19% -21%
Table 7-6 2038 Design Year PM Journey Time Comparison
ROUTE OPTION JOURNEY TIME (S)
DIFF DIFF WB EB DM WB DM EB
Green Route 128.63 122.47 150.05 153.07 -14% -20%
Blue Route 128.5 121.97 150.05 153.07 -14% -20%
Red Route 129.6 129.76 150.05 153.07 -14% -15%
Brown Route 128.77 122.48 150.05 153.07 -14% -20%
Purple Route 127.61 122.3 150.05 153.07 -15% -20%

N53 Hackballscross to Rassan Upgrade
Phase 2 Traffic Modelling Report 300513
Transport Modelling Report 14/06/2019 Page 31/ 43
7.4 Annual Average Daily Traffic (AADT)
To estimate the annual average daily traffic (AADT) using Model outputs, factors were developed that allowed extrapolation of peak hour traffic flows to AADT.
PAG Unit 16.0 suggests using the Permanent Counter method to estimate AADT, however TII permanent counters are located some distance from the Study Area. The Localised Period Count method was therefore preferable and has been applied using the 7 ATC count locations throughout the area (14 days, January /February 2019).
PAG recommends a daily flow profile generated for the weekday for which the short period traffic counts have been collated. In this case the short period data will be the AM, Inter-Peak and PM peak hour model outputs. The models have been developed to represent the “average weekday”, therefore, a daily profile for the average weekday was generated using two weeks of ATC data gathered in January /February 2019.
Data from the ATCs was then classified into Peak (comprising AM Peak and/or PM Peak) and Inter Peak periods. In performing this task, the following bands were used.
AM Peak Period: The period from 07:00 to 10:00 Inter Peak Period: The period from 10:00 to 16:00 PM Peak Period: The period from 16:00 to 19:00
To estimate the flow for a defined period (e.g. the AM peak) from the short period count, the procedure is as follows:
��� = ��� ∗ ���� + Constant
Where:
��� = Average AM Peak (07:00 – 10:00) traffic flow at location x ����= Short Period AM Peak traffic flow (8:00 – 9:00) at location x Constant is set to zero in regression analysis
A regression analysis was performed among the 7 locations of the ATC surveys illustrated in 0 to estimate the value of ��� , establishing a relationship between the short period AM Peak count (8:00 – 9:00) and the AM Peak Period (07:00-10:00) for all the sites. The same process was applied to ��� and ���.
Similarly, A 12hr-to-24hr expansion factor is estimated through regression analysis using the formula below:
����� = ���������� ∗ (��� + ��� + ���) + Constant
Where:
WADT� = 24hr Weekly Average Daily traffic flow at location x ��� + ��� + ��� = 12hr Weekday traffic flow (7:00 – 19:00) at location x Constant is set to zero in regression analysis
The table below shows the estimated expansion factors by time period and user class.

N53 Hackballscross to Rassan Upgrade
Phase 2 Traffic Modelling Report 300513
Transport Modelling Report 14/06/2019 Page 32/ 43
Table 7-7 AADT Expansion Factors by Time Period and User Class
TIME PERIOD LV HV
AM peak (1hr) to AM Peak Period (3hr) 2.08 2.81
Inter peak (1hr) to Inter Peak Period (6hr) 6 6
PM peak (1hr) to PM Peak Period (3hr) 2.46 2.73
Weekday 12hr to 24hr WADT 1.17 0.97
The 24hr Weekly Average Daily Traffic (WADT) were then expanded to the annual average daily flow (AADT) based on the seasonality factor outlined in TII Project Appraisal Guidelines (PAG) Unit 16.1 -Expansion Factors for Short Period Traffic Counts. This is to recognise the significant variation that can occur in traffic flows across the year.
The seasonality expansion factor is 1.02 used in the calculation.
Therefore, the result for all short peak periods (AM, IP and PM) is aggregated to give a value of AADT as follows:
����� = ((��� ∗ ����) + (��� ∗ ����
) + (��� ∗ ����)) ∗ ���������� ∗ ������������
7.5 Route Option AADTs
The forecast AADT flows for each of the route options are presented in the tables and figures below for both the opening year 2023 and the design year 2038 in the following sections of this report.
N53 Hackballscross to Rassan Upgrade
Phase 2 Traffic Modelling Report 300513
Transport Modelling Report 14/06/2019 Page 33/ 43
Figure 7-1 Green Route AADT Locations
Table 7-8 Green Route Future Year AADTs
LOCATION
2023 2038
LV HV TOTAL LV HV TOTAL
1 7875 903 8779 8719 1220 9940
2 0 0 0 0 0 0
3 645 76 721 698 84 782
4 761 103 863 826 96 922
5 6518 741 7260 7235 1017 8252
6 7870 906 8776 8722 1226 9948
7 7968 903 8872 8829 1223 10052
8 7502 834 8336 8357 1169 9526
9 6518 741 7260 7248 1011 8259
N53 Hackballscross to Rassan Upgrade
Phase 2 Traffic Modelling Report 300513
Transport Modelling Report 14/06/2019 Page 34/ 43
Figure 7-2 Blue Route AADT Locations
Table 7-9 Blue Route Future Year AADTs
LOCATION
2023 2038
LV HV TOTAL LV HV TOTAL
1 7875 903 8779 8719 1220 9940
2 0 0 0 0 0 0
3 629 76 706 631 68 699
4 781 103 883 826 100 925
5 6516 741 7257 7235 1011 8246
6 7968 903 8872 8829 1223 10052
7 7484 834 8317 8375 1168 9542
8 6518 741 7260 7248 1011 8259

N53 Hackballscross to Rassan Upgrade
Phase 2 Traffic Modelling Report 300513
Transport Modelling Report 14/06/2019 Page 35/ 43
Figure 7-3 Red Route AADT Locations
Table 7-10 Red Route Future Year AADTs
LOCATION
2023 2038
LV HV TOTAL LV HV TOTAL
1 7878 898 8775 8729 1217 9946
2 317 31 348 322 39 361
3 404 35 439 456 40 496
4 401 40 441 456 63 519
5 6516 741 7257 7242 1017 8259
6 7690 704 8395 8513 962 9476
7 7727 864 8591 8564 1176 9740
8 7675 873 8548 8529 1181 9710
9 6248 873 7120 6922 1181 8103
N53 Hackballscross to Rassan Upgrade
Phase 2 Traffic Modelling Report 300513
Transport Modelling Report 14/06/2019 Page 36/ 43
Figure 7-4 Brown Route AADT Locations
Table 7-11 Brown Route Future Year AADTs
LOCATION
2023 2038
LV HV TOTAL LV HV TOTAL
1 7875 903 8779 8719 1220 9940
2 7968 903 8872 8824 1223 10047
3 1670 169 1839 1847 236 2084
4 1609 160 1770 1771 231 2002
5 6518 741 7260 7235 1017 8252
6 6412 732 7144 7096 984 8081
7 6443 747 7190 7154 1002 8157
8 6516 741 7257 7238 1011 8249
N53 Hackballscross to Rassan Upgrade
Phase 2 Traffic Modelling Report 300513
Transport Modelling Report 14/06/2019 Page 37/ 43
Figure 7-5 Purple Route AADT Locations
Table 7-12 Purple Route Future Year AADTs
LOCATION
2023 2038
LV HV TOTAL LV HV TOTAL
1 7875 903 8779 8729 1220 9949
2 0 0 0 0 0 0
3 164 0 164 167 3 169
4 0 0 0 0 0 0
5 6518 741 7260 7235 1011 8246
6 7865 906 8771 8726 1223 9950
7 7963 903 8866 8822 1223 10045
8 6540 738 7278 7233 1001 8234
9 6516 741 7257 7235 1011 8246

N53 Hackballscross to Rassan Upgrade
Phase 2 Traffic Modelling Report 300513
Transport Modelling Report 14/06/2019 Page 38/ 43
8. SUMMARY AND CONCLUSION
8.1 Summary & Conclusions
Model Development
This Traffic Modelling Report documents the development of the N53 Local Area Traffic Model and its application to assist in the Phase 2 Option Selection process for the upgrade of the N53 between Hackballscross to Rassan.
8.1.2 The LAM has been developed, calibrated and validated to reflect the observed base year (2019) traffic conditions for the following time periods:
AM Morning peak period: 08:00 to 09:00 PM Evening peak period: 17:00 to 18:00 Inter peak period: Averaged one hour between 10:00 – 16:00
8.1.3 The model has been calibrated and validated in-line with TII Project Appraisal Guidelines and conforms to all calibration and validation criteria specified in PAG Unit 5.1 for each period modelled. The N53 LAM is therefore considered fit for purpose and provides a robust basis for assessing the proposed route options.
Option Assessment
8.1.4 The following indicators have been used to assess the performance of 5 options –
Overall Network Performance Statistics; Journey Times; and AADT.
The Network Performance Statistics indicate that all options reduce the total travel time throughout the study area relative to the Do Minimum scenario (approximately 8% - 15% reduction) and provide a similar average speed. The Brown Route, however, provides a higher value in terms of total travel time when compared to other routes.
The journey time analysis shows that most of the route options perform similarly at reducing journey times compared to the Do-Minimum Scenario, saving approximately 30 seconds (a 19% reduction) on the westbound route and 27 seconds (a 18% reduction) on the eastbound route in the AM peak hour. The Red Route experiences a marginally longer journey time (approximately between 3% - 5% increase) compared to other route options. This is a result of the additional junctions on this route, which leads to increased delay and slightly slower speeds.
8.1.7 All route options produce similar AADT values, due to similar levels of traffic transferred onto the new alignment. Some differences in AADT flows are seen on the mid-section of the new routes. This is a result of differing junction layouts and access arrangements between the various options (i.e. certain accesses are opened in some options and closed in others).
N53 Hackballscross to Rassan Upgrade
Phase 2 Traffic Modelling Report 300513
Transport Modelling Report 14/06/2019 Page 39/ 43
SYSTRA provides advice on transport, to central, regional and local government, agencies, developers, operators and financiers.
A diverse group of results-oriented people, we are part of a strong team of professionals worldwide. Through client business planning, customer research and strategy development we create solutions that work for real people in the real world.
For more information visit www.systra.co.uk
Birmingham – Newhall Street 5th Floor, Lancaster House, Newhall St, Birmingham, B3 1NQ T: +44 (0)121 393 4841 Birmingham – Edmund Gardens 1 Edmund Gardens, 121 Edmund Street, Birmingham B3 2HJ T: +44 (0)121 393 4841
Dublin 2nd Floor, Riverview House, 21-23 City Quay Dublin 2,Ireland T: +353 (0) 1 566 2028
Edinburgh – Thistle Street Prospect House, 5 Thistle Street, Edinburgh EH2 1DF United Kingdom T: +44 (0)131 460 1847
Glasgow – St Vincent St Seventh Floor, 124 St Vincent Street Glasgow G2 5HF United Kingdom T: +44 (0)141 468 4205
Glasgow – West George St 250 West George Street, Glasgow, G2 4QY T: +44 (0)141 468 4205 Leeds 100 Wellington Street, Leeds, LS1 1BA T: +44 (0)113 360 4842
London 3rd Floor, 5 Old Bailey, London EC4M 7BA United Kingdom T: +44 (0)20 3855 0079
Manchester – 16th Floor, City Tower 16th Floor, City Tower, Piccadilly Plaza Manchester M1 4BT United Kingdom T: +44 (0)161 504 5026 Newcastle Floor B, South Corridor, Milburn House, Dean Street, Newcastle, NE1 1LE United Kingdom T: +44 (0)191 249 3816
Perth 13 Rose Terrace, Perth PH1 5HA T: +44 (0)131 460 1847
Reading Soane Point, 6-8 Market Place, Reading, Berkshire, RG1 2EG T: +44 (0)118 206 0220
Woking Dukes Court, Duke Street Woking, Surrey GU21 5BH United Kingdom T: +44 (0)1483 357705
Other locations: France: Bordeaux, Lille, Lyon, Marseille, Paris Northern Europe: Astana, Copenhagen, Kiev, London, Moscow, Riga, Wroclaw Southern Europe & Mediterranean: Algiers, Baku, Bucharest, Madrid, Rabat, Rome, Sofia, Tunis Middle East: Cairo, Dubai, Riyadh Asia Pacific: Bangkok, Beijing, Brisbane, Delhi, Hanoi, Hong Kong, Manila, Seoul, Shanghai, Singapore, Shenzhen, Taipei Africa: Abidjan, Douala, Johannesburg, Kinshasa, Libreville, Nairobi Latin America: Lima, Mexico, Rio de Janeiro, Santiago, São Paulo North America: Little Falls, Los Angeles, Montreal, New-York, Philadelphia, Washington

N53 Hackballscross to Rassan Upgrade
Phase 2 Traffic Modelling Report 300513
Transport Modelling Report 14/06/2019 Page 40/ 43
Appendix A: Calibration tables

Individual Target Counts - AM
Observed Flow
Modelled Flow
Location Direction Turn Total (Veh) Total (Veh) GEH
Site 2 WB Left 2 0 2.0
Site 2 EB Right 2 4 1.1
Site 2 NB Left 1 5 2.1
Site 2 NB Right 5 2 1.7
Site 3 WB Right 2 1 1.0
Site 3 EB Left 2 3 0.4
Site 3 SB Left 6 4 1.0
Site 3 SB Right 2 4 1.5
Site 4 WB Left 6 7 0.4
Site 4 EB Right 8 6 0.7
Site 4 NB Left 8 9 0.2
Site 4 NB Right 24 20 0.8
Site 5 WB Right 4 6 0.8
Site 5 EB Left 4 2 1.3
Site 5 SB Left 17 15 0.6
Site 5 SB Right 4 4 0.2
Site 6 WB Right 37 35 0.3
Site 6 EB Left 3 1 1.5
Site 6 SB Left 121 108 1.2
Site 6 SB Right 4 4 0.2
N53 West WB Straight 230 204 1.7
N53 West EB Straight 526 469 2.5
N53 East WB Straight 255 228 1.7
N53 East EB Straight 673 600 2.9

Individual Target Counts - IP
Observed Flow
Modelled Flow
Location Direction Turn Total (Veh) Total (Veh) GEH
Site 2 WB Left 3 1 1.4
Site 2 EB Right 3 5 1.0
Site 2 NB Left 3 5 1.1
Site 2 NB Right 3 1 1.3
Site 3 WB Right 3 2 0.9
Site 3 EB Left 3 4 0.3
Site 3 SB Left 3 2 0.6
Site 3 SB Right 3 4 0.5
Site 4 WB Left 11 9 0.7
Site 4 EB Right 19 18 0.2
Site 4 NB Left 16 13 0.7
Site 4 NB Right 8 7 0.3
Site 5 WB Right 9 8 0.2
Site 5 EB Left 9 8 0.2
Site 5 SB Left 8 8 0.0
Site 5 SB Right 8 7 0.4
Site 6 WB Right 60 53 1.0
Site 6 EB Left 6 7 0.2
Site 6 SB Left 57 51 0.8
Site 6 SB Right 10 9 0.5
N53 West WB Straight 207 185 1.5
N53 West EB Straight 195 174 1.5
N53 East WB Straight 245 219 1.7
N53 East EB Straight 225 200 1.7

Individual Target Counts - PM
Observed Flow
Modelled Flow
Location Direction Turn Total (Veh) Total (Veh) GEH
Site 2 WB Left 5 2 1.7
Site 2 EB Right 1 5 2.1
Site 2 NB Left 3 5 1.1
Site 2 NB Right 3 1 1.3
Site 3 WB Right 7 4 1.3
Site 3 EB Left 2 4 1.3
Site 3 SB Left 3 2 0.8
Site 3 SB Right 3 4 0.3
Site 4 WB Left 35 29 1.1
Site 4 EB Right 26 26 0.0
Site 4 NB Left 15 13 0.6
Site 4 NB Right 8 8 0.0
Site 5 WB Right 19 17 0.5
Site 5 EB Left 5 5 0.1
Site 5 SB Left 9 10 0.2
Site 5 SB Right 9 8 0.5
Site 6 WB Right 142 125 1.4
Site 6 EB Left 13 13 0.0
Site 6 SB Left 66 59 0.9
Site 6 SB Right 12 10 0.6
N53 West WB Straight 502 450 2.4
N53 West EB Straight 257 229 1.8
N53 East WB Straight 655 586 2.8
N53 East EB Straight 287 253 2.0


