150
APPENDIX E-2 GEOTECHNICAL INVESTIGATION/SLOPE STABILITY REPORT FOR ADV

APPENDIX E-2
GEOTECHNICAL INVESTIGATION/SLOPE STABILITY REPORT FOR ADV

PREPARED FOR:CEMEX2365 IRON POINT ROAD, SUITE 120FOLSOM, CALIFORNIA 95630
PREPARED BY:GEOCON CONSULTANTS, INC.3160 GOLD VALLEY DRIVE, SUITE 800RANCHO CORDOVA, CALIFORNIA 95742
GEOCON PROJECT NO. S1264-05-01 DECEMBER 2019
Cemex Eliot – Arroyo Del ValleRealignment at Lake B
Alameda, California
GEOTECHNICAL INVESTIGATION/SLOPE STABILITY ANALYSIS

Project No. S1264-05-01 March 3, 2017 Revised December 31, 2019
Antonella Turnbull Regional Natural Resources Manager CEMEX 2365 Iron Point Road, Suite 120 Folsom, California 95630
Subject: GEOTECHNICAL INVESTIGATION / SLOPE STABILITY ANALYSIS CEMEX ELIOT – ARROYO DEL VALLE REALIGNMENT AT LAKE B ALAMEDA COUNTY, CALIFORNIA
Ms. Turnbull:
In accordance with your authorization of our proposal (Geocon Proposal No. LS-16-275, dated November 17, 2016) and peer review comments by Questa Engineering (dated April 25, 2019), we have updated our geotechnical evaluation for the proposed realignment of a portion of the Arroyo del Valle (the Arroyo) at the CEMEX Eliot Quarry in Alameda County, California.
The accompanying report presents our findings, conclusions, and recommendations regarding geotechnical aspects of slope construction as presently proposed. Based on the results of our study, the proposed project is feasible from a geotechnical viewpoint provided, the recommendations of this report are incorporated into the design and construction of the project.
Please contact us if you have any questions regarding this report or if we may be of further service.
Respectfully Submitted,
GEOCON CONSULTANTS, INC.
Jeremy J. Zorne, PE, GE John C. Pfeiffer, PG, CEG Senior Engineer Senior Geologist
Ronald E. Loutzenhiser, PE, GE Senior Engineer/QA Review

TABLE OF CONTENTS
SLOPE STABILITY EVALUATION PAGE
1.0 INTRODUCTION ............................................................................................................................ 4
2.0 SITE AND PROJECT INFORMATION ......................................................................................... 5
3.0 SOIL AND GEOLOGIC CONDITIONS ......................................................................................... 6 3.1 Regional and Site Geology .................................................................................................... 7 3.2 Subsurface Explorations ........................................................................................................ 7 3.3 Fill .......................................................................................................................................... 8 3.4 Alluvium ................................................................................................................................ 9
4.0 GROUNDWATER ........................................................................................................................... 9
5.0 SEISMICITY ................................................................................................................................. 10
6.0 SEEPAGE AND SLOPE STABILITY ANALYSES .................................................................... 11 6.1 Current Conditions / Previous Stability Analyses ................................................................ 11 6.2 Geometry for Stability Analyses .......................................................................................... 13 6.3 Seepage / Groundwater / Surface Water Conditions ........................................................... 14 6.4 Material Parameters for Stability Analyses ......................................................................... 16 6.5 Seismic Forces for Dynamic (Seismic) Slope Stability Analysis ........................................ 18 6.6 Slope Stability Analyses and Results ................................................................................... 19
7.0 CONCLUSIONS ............................................................................................................................ 21 7.1 Seepage ................................................................................................................................ 21 7.2 Settlement ............................................................................................................................ 21 7.3 Slope Stability ...................................................................................................................... 21 7.4 Pit Capture Potential ............................................................................................................ 21
8.0 RECOMMENDATIONS ............................................................................................................... 22 8.1 Slope Geometry ................................................................................................................... 22 8.2 Materials for Fill .................................................................................................................. 22 8.3 Wet Weather Grading Conditions ........................................................................................ 23 8.4 Grading/Embankments/Slopes ............................................................................................. 23 8.5 Slope Maintenance ............................................................................................................... 25
9.0 FURTHER GEOTECHNICAL SERVICES .................................................................................. 26 9.1 Plan Review ......................................................................................................................... 26 9.2 Testing and Observation Services ........................................................................................ 26
10.0 LIMITATIONS AND UNIFORMITY OF CONDITIONS ........................................................... 27
11.0 REFERENCES ............................................................................................................................... 28 FIGURES Figure 1 – Vicinity Map Figure 2 – Proposed Project Overview Figure 3 – Site Plan Figure 4 – Cross-Section A-A’ PHOTOS Photos 1 through 13

TABLE OF CONTENTS (Continued)
APPENDIX A FIELD EXPLORATION Figure A1 – Key to Logs Figures A2 through A11 – Logs of Test Pits TP1 through TP10 (Geocon 2016) Figures A12 through A19 – Boring Logs B3 and B4 (Geocon 2017) Exploratory Boring Logs BH2013-01 and BH2013-7 through -13 (KANE GeoTech, Inc., 2013) APPENDIX B LABORATORY TESTING PROGRAM Figure B1 – Summary of Laboratory Results Figure B2 – Atterberg Limits Figure B3 – Grain Size Distribution Figures B4 and B5 – Triaxial Shear Strength – CU Test with Pore Pressure Measurements
(Staged) Figure B6 – Triaxial Shear Strength – UU Test (Staged) Figure B7 – Hydraulic Conductivity Figure B8 – Compaction Test Report Geo-Logic Associates – Lab Report (January 26, 2017) KANE GeoTech, Inc. – Material Properties (Lab Test Results) Berlogar Stevens & Associates – Lab Test Results (October 30, 2012) APPENDIX C SLOPE STABILITY ANALYSES

Geocon Project No. S1264-05-01 - 4 - March 3, 2017 Revised December 31, 2019
1.0 INTRODUCTION
This report presents the results of our geotechnical investigation for the proposed realignment of a portion of the Arroyo del Valle (ADV) at the CEMEX Eliot Quarry in Alameda County, California. The approximate site location is shown on the Vicinity Map, Figure 1. The purpose of our study was to evaluate subsurface conditions at the site based on literature review, targeted subsurface exploration, and laboratory testing. In addition, the study evaluated the stability of slopes along the proposed realignment of the ADV channel adjacent to the Lake B mining pit under static and dynamic (seismic) conditions. The results of this evaluation will be used in developing an amended Reclamation Plan and other required regulatory permits for the project. This report has been revised to address peer review comments prepared by Questa Engineering Corporation (dated April 25, 2019). To prepare this report, Geocon performed the following scope of services:
• Reviewed published geologic maps, geotechnical reports, and other pertinent literature pertaining to the site. A list of referenced materials is presented in Section 11.0 of this report.
• Attended a kickoff meeting at the site with the project team on December 20, 2016. The purpose of the meeting was to discuss project specifics and develop a geotechnical exploration plan for the project. Another purpose of the meeting was to review project limits and determine equipment access.
• Marked out exploratory excavation locations for subsequent utility clearance and notified subscribing utility companies via Underground Service Alert (USA) a minimum of 48 hours prior to performing exploratory excavations at the site.
• Performed detailed geologic mapping throughout the ADV realignment area by a California Certified Engineering Geologist (CEG).
• Performed ten exploratory test pits (T1 through T10) using track-mounted Komatsu 240 and Caterpillar 325 excavators equipped with 36-inch wide buckets. Test pit depths ranged from approximately 6½ to 20 feet.
• Obtained representative soil samples from the test pits.
• Logged the test pits in accordance with the Unified Soil Classification System (USCS).
• Upon completion, backfilled the test pits with the excavated material.
• Remolded (fabricated) soil samples in our laboratory and performed testing to evaluate index properties, shear strength, and permeability characteristics.
• Analyzed the field and laboratory testing data, performed numerical slope stability analyses, and prepared this report with our findings, conclusions, and recommendations. This report also includes recommended embankment geometry, fill/embankment material specifications, and earthwork recommendations for the project.

Geocon Project No. S1264-05-01 - 5 - March 3, 2017 Revised December 31, 2019
Details of our field exploration program, including test pit logs, are presented in Appendix A. A general overview of the proposed project is shown on Figure 2 and approximate locations of subsurface explorations (current and previous) are presented on the Site Plan, Figure 3. A generalized subsurface cross-section (Cross-Section A-A’) is presented as Figure 4. Site photographs are presented as Photos 1 through 13. Details of our laboratory testing program and test results are summarized in Appendix B. Details of our slope stability analyses are summarized in Appendix C.
2.0 SITE AND PROJECT INFORMATION
CEMEX Construction Materials Pacific, LLC (CEMEX) owns and operates the Eliot Facility, a sand and gravel mining operation located between the cities of Pleasanton and Livermore within the unincorporated area of Alameda County, California (Vicinity Map, Figure 1). CEMEX is seeking approval to amend its existing Reclamation Plan, which was originally approved in 1987 under Surface Mining Permit 23 (SMP-23). In December 2016, an updated application for SMP-23 was submitted to the Alameda County Community Development Agency. The Amendment presents options for mining Lake B to an elevation of 150 feet above mean sea level (MSL), which is approximately 100 feet deeper than the currently mined elevation. Under the preferred option outlined in the Amendment, CEMEX proposes to move ADV south along a new alignment parallel to Vineyard Avenue to allow for the southerly progression of mining at Lake B. As part of the project, the ADV corridor in this area will be restored and enhanced by creating aquatic habitat and native plant species. An overview of the proposed project is presented as Figure 2. Sheet C-101 of the 95% Improvement Plans by Brown & Caldwell (B&C, 2018) provides conceptual details for the proposed realignment of the ADV. Based on our review, the proposed realigned ADV channel will extend through previously-mined areas, quarry ponds, and currently undisturbed (un-mined) areas. The ADV realignment will require cuts and fills along various portions of the new channel. The existing ADV alignment, proposed ADV realignment, and approximate locations of cuts and fills required for the project are shown on the Site Plan, Figure 3. A typical profile view (cross-section) of the current and proposed conditions is presented as Cross-Section A-A’, Figure 4. Photographs of the site are presented as Photos 1 through 13.
As shown on the Site Plan, the ADV realignment corridor is approximately 5,800 feet long. The channel invert elevation at the upstream and downstream ends of the corridor is approximately 390 feet and 360 feet MSL, respectively. The resulting average slope is approximately 0.56 percent. In general, cut and fill slopes associated with the channel realignment will be 2:11 or flatter. The approximate elevation of Vineyard Avenue adjacent to the project is 430 feet MSL. The existing ADV (Photo 5) is located between the Quarry Ponds (Photos 7 and 8) and Lake B (Photo 9). The ADV is separated from Lake B by an irregular-shaped, minor embankment with a top elevation of approximately 390 feet MSL.
1 All slope ratios presented in this report are horizontal: vertical.
Geocon Project No. S1264-05-01 - 6 - March 3, 2017 Revised December 31, 2019
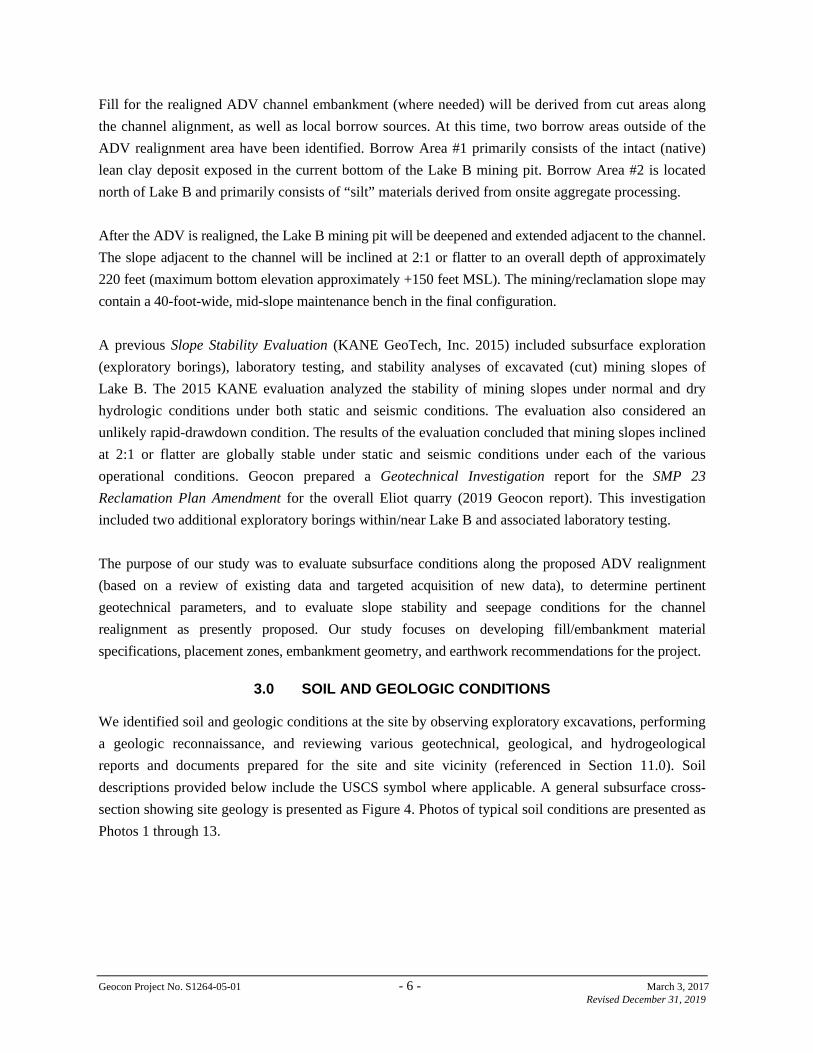
Fill for the realigned ADV channel embankment (where needed) will be derived from cut areas along the channel alignment, as well as local borrow sources. At this time, two borrow areas outside of the ADV realignment area have been identified. Borrow Area #1 primarily consists of the intact (native) lean clay deposit exposed in the current bottom of the Lake B mining pit. Borrow Area #2 is located north of Lake B and primarily consists of “silt” materials derived from onsite aggregate processing. After the ADV is realigned, the Lake B mining pit will be deepened and extended adjacent to the channel. The slope adjacent to the channel will be inclined at 2:1 or flatter to an overall depth of approximately 220 feet (maximum bottom elevation approximately +150 feet MSL). The mining/reclamation slope may contain a 40-foot-wide, mid-slope maintenance bench in the final configuration. A previous Slope Stability Evaluation (KANE GeoTech, Inc. 2015) included subsurface exploration (exploratory borings), laboratory testing, and stability analyses of excavated (cut) mining slopes of Lake B. The 2015 KANE evaluation analyzed the stability of mining slopes under normal and dry hydrologic conditions under both static and seismic conditions. The evaluation also considered an unlikely rapid-drawdown condition. The results of the evaluation concluded that mining slopes inclined at 2:1 or flatter are globally stable under static and seismic conditions under each of the various operational conditions. Geocon prepared a Geotechnical Investigation report for the SMP 23 Reclamation Plan Amendment for the overall Eliot quarry (2019 Geocon report). This investigation included two additional exploratory borings within/near Lake B and associated laboratory testing. The purpose of our study was to evaluate subsurface conditions along the proposed ADV realignment (based on a review of existing data and targeted acquisition of new data), to determine pertinent geotechnical parameters, and to evaluate slope stability and seepage conditions for the channel realignment as presently proposed. Our study focuses on developing fill/embankment material specifications, placement zones, embankment geometry, and earthwork recommendations for the project.
3.0 SOIL AND GEOLOGIC CONDITIONS
We identified soil and geologic conditions at the site by observing exploratory excavations, performing a geologic reconnaissance, and reviewing various geotechnical, geological, and hydrogeological reports and documents prepared for the site and site vicinity (referenced in Section 11.0). Soil descriptions provided below include the USCS symbol where applicable. A general subsurface cross-section showing site geology is presented as Figure 4. Photos of typical soil conditions are presented as Photos 1 through 13.

Geocon Project No. S1264-05-01 - 7 - March 3, 2017 Revised December 31, 2019
3.1 Regional and Site Geology
The site is located near the center of the east-west trending Livermore-Amador Valley at the approximate basin axis. The Livermore-Amador Valley is a tilt-block basin bounded on the south side by the Verona Thrust Fault and the Las Positas Fault system. The valley was filled with late Tertiary and Quaternary alluvial deposits. The Livermore-Amador Valley is partially filled with alluvial fan, stream, and lake deposits, collectively referred to as alluvium which consists of interbedded/intermixed gravel, sand, silt, and clay. At the site, coarse alluvial fan deposits were formed by the ancestral and present ADV and Arroyo Mocho. The coarse alluvial fan deposits are the target of extensive aggregate mining in the area. The alluvium in the area includes the following three major units, listed from youngest to oldest (top to bottom): Quaternary alluvium, Upper Livermore Gravels, and Lower Livermore Gravels (Barlock 1989). The characteristics of the individual units are similar (mixtures and layers of sand, silt, clay, gravel, and small cobble). The division between individual units is not distinct and generally coincides with gradual grain size transitions. For the purposes of this report, the natural deposits at the site are collectively termed “alluvium.”
3.2 Subsurface Explorations
To evaluate subsurface conditions pertinent to the ADV realignment and adjacent Lake B mining pit, we reviewed selected exploratory borings performed as part of the 2015 KANE Slope Stability Evaluation. The borings were performed in April 2013 using a Becker Hammer drill rig. Table 3.2A summarizes the details of the borings.
TABLE 3.2A SUMMARY OF PREVIOUS EXPLORATIONS (KANE 2013)
Boring ID Date Boring Depth (feet)
Approximate Boring Elevations (feet MSL)
Groundwater
Top Bottom Depth (feet) Elevation (feet MSL)
BH2013-01 4/12/2013 280 416 136 230 186 BH2013-07 4/6/2013 300 392 92 65 327 BH2013-08 4/4/2013 300 401 101 70 331 BH2013-09 4/2/2013 200 300 100 50 250
BH2013-10A 4/14/2013 50 304 254 2 302 BH2013-10B 4/14/2013 50 304 254 4 300 BH2013-11 4/5/2013 220 320 100 5 315 BH2013-12 4/9/2013 280 376 96 5 371 BH2013-13 4/11/2013 300 412 112 60 352

Geocon Project No. S1264-05-01 - 8 - March 3, 2017 Revised December 31, 2019
To supplement this subsurface information, we excavated ten exploratory test pits (TP1 through TP10) on December 22, 2016 using Komatsu 240 and Caterpillar 325 excavators equipped with 36-inch-wide buckets. We also performed a detailed site reconnaissance on December 22 and 23, 2016. In addition, we performed two borings (Borings B3 and B4) as part of our 2019 geotechnical investigation for the SMP 23 Reclamation Plan Amendment project. Details of our test pits and borings are summarized in Table 3.2B.
TABLE 3.2B SUMMARY OF TEST PITS AND BORINGS (GEOCON 2016 AND 2019)
Test Pit ID General Area Test Pit / Boring Depth (feet)
Approximate Test Pit / Boring Elevations
(feet MSL) Groundwater
Top Bottom Depth (feet) Elevation (feet MSL)
TP1 Borrow Area #2 (“Silt” Area) 20 382 362 --- ---
TP2 Borrow Area #2 (“Silt” Area) 20 382 362 --- ---
TP3 Borrow Area #2 (“Silt” Area) 20 382 362 --- ---
TP4 Borrow Area #1 (“Clay” Area) 20 304 284 18 286
TP5 Borrow Area #1 (“Clay” Area) 6.5 294 287.5 --- ---
TP6 ADV Realignment – Cut Area 8 410 402 --- ---
TP7 ADV Realignment – Cut Area 12 422 410 --- ---
TP8 ADV Realignment – Cut Area 9 422 413 --- ---
TP9 ADV Realignment – Cut Area 12 400 388 --- ---
TP10 ADV Realignment – Cut Area 10 372 362 6 366
B3 Lake B (current bottom) 150.5 300 150 30 270
B4 Near Northwest Quarry Pond 101.5 380 278.5 30 350
Approximate locations of the borings and test pits are shown on the Site Plan, Figure 3. Logs of the explorations are presented in Appendix A.
3.3 Fill
We encountered fill within TP1 through TP3 performed within Borrow Area #2 containing “silt” deposits resulting from onsite aggregate processing (Photos 10 and 11). Based on our test pits, the fill generally consists of a heterogeneous mixture of sandy lean clay (CL) with gravel and some small cobble (Photo 10). Gravel and small cobble is typically rounded and consists of maximum particle

Geocon Project No. S1264-05-01 - 9 - March 3, 2017 Revised December 31, 2019
sizes of approximately 4 inches or less. The fractions of sand, silt, clay, and gravel vary significantly throughout the deposit. Based on laboratory tests performed on a composite sample, the fractions were approximately 55% fines (clay/silt), 25% sand, and 20% gravel.
3.4 Alluvium
We encountered alluvium in Test Pits TP4 through TP10. The alluvium generally consisted of “gravel” deposits and “clay” deposits. Gravel Deposits: These deposits generally consist of subrounded to rounded gravel and small cobble (generally 4 inches or smaller in maximum dimension) in sand, silt, and clay matrix (Photos 3 and 4). The fractions of sand, silt, and clay vary throughout the gravel deposits (Photo 13). USCS classifications for this material include, but are not limited to, the following: clayey gravel (GC), well-graded gravel with silt, clay, and sand (GW-GC), clayey sand with gravel (SC), and well-graded sand with gravel (SW-SM). Some of the intact gravel deposits are weakly- to moderately-cemented, as evidenced by near-vertical gravel exposures throughout the project area (Photos 1, 2, 3, and 6). Clay Deposits: These deposits generally consist of sandy lean clay (CL) with little gravel (Photo 12). Gravel within the clay is typically subrounded to rounded and generally 1½ inches or smaller in maximum dimension. This material exhibits low to moderate plasticity and stiff to very stiff consistency. Subsurface conditions described in the previous paragraphs are generalized. The exploration logs included in Appendix A detail soil type, color, moisture, consistency/relative density, and USCS classification of the materials encountered at specific locations and elevations.
4.0 GROUNDWATER
As shown in Tables 3.2A and 3.2B, groundwater was encountered at various depths within the borings and test pits. A detailed discussion of hydrogeologic (groundwater) conditions in the project area is provided in the Technical Memorandum – Updated Analysis of Lake A and B Water Levels, Cemex Eliot Facility, prepared by EMKO Environmental, Inc., August 28, 2018 (EMKO Technical Memorandum) and the Groundwater Hydrology and Water Quality Analysis Report for the Cemex Eliot Quarry SMP-23 Reclamation Plan Amendment Project, Alameda County, California, prepared by EMKO Environmental, Inc., February 2019 (EMKO Hydrology and Water Quality Analysis Report). In general, groundwater levels (depths/elevations) in the project area are strongly influenced by the water level in the ADV, which recharges groundwater in the local area. However, groundwater levels are also altered by dewatering/pumping operations associated with active mining in the area. As outlined in the referenced EMKO Hydrology and Water Quality Analysis Report, the long-term water-level cycles are related to climatic changes such as wet periods and drought periods. Annual cycles are

Geocon Project No. S1264-05-01 - 10 - March 3, 2017 Revised December 31, 2019
due to recharge during the wet season and extraction during the dry season. Peak water levels generally occur between March and May and minimum water levels generally occur in August or September. The long term climatic cycles can result in water-level changes of up to 100 feet. The annual cycles typically range in magnitude from approximately 15 feet to 40 feet. Based on information from the EMKO Technical Memorandum, at the central portion of the ADV realignment area (approximate channel invert elevation of 380 feet MSL), seasonal high groundwater elevation is expected to be approximately coincident with the ADV channel invert elevation of 380 feet MSL and seasonal low groundwater elevation is expected to be approximately 373 feet MSL. We note that fluctuations in the level of groundwater may occur due to variations in rainfall, temperature, and other factors. Depth to groundwater can also vary significantly due to local pumping, irrigation practices, and seasonal fluctuations in ADV.
5.0 SEISMICITY
Based on our research, analyses, and observations, the site is not located on any known “active” earthquake fault trace. In addition, the site is not contained within an Alquist-Priolo Earthquake Fault Zone. Therefore, we consider the potential for ground rupture due to onsite active faulting to be low. Table 5.0 presents approximate distances to active faults within 20 miles of the site based on mapping by the California Geological Survey (CGS), as presented in an online fault database maintained by Caltrans.
TABLE 5.0 REGIONAL ACTIVE FAULTS
Fault Name Approximate
Distance to Site (miles)
Maximum Moment
Magnitude, Mw Las Positas 3 6.4 Pleasanton 3 ¼ 6.6
Mt. Diablo Thrust 4 ¾ 6.6 Calaveras (North) 5 6.9
Greenville 7 ¼ 6.9 Hayward (South) 11 7.3
Clayton 13 ¾ 6.9 Calaveras (Central) 14 6.9
Hayward (Southern Extension) 14 ¼ 6.7 Silver Creek 15 ½ 6.9
Great Valley 7 16 ¾ 6.7 Great Valley 6 17 6.8
Hayward (North) 18 ¾ 7.3 Concord 19 6.6

Geocon Project No. S1264-05-01 - 11 - March 3, 2017 Revised December 31, 2019
We used the United States Geological Survey (USGS) web-based application 2008 Interactive Deaggregations to estimate the peak ground acceleration (PGA) and modal (most probable) magnitude associated with a 475-year return period (typical design-level earthquake event). This return period corresponds to an event with 10% chance of exceedance in a 50-year period. The USGS-estimated PGA is 0.49g and the modal magnitude is 6.6 for Seismic Site Class D (stiff soil profile). While listing PGA is useful for comparison of potential effects of fault activity in a region, other considerations are important in seismic design, including frequency and duration of motion and soil conditions underlying the site.
6.0 SEEPAGE AND SLOPE STABILITY ANALYSES
We evaluated the stability of the proposed ADV realignment embankment fill and adjacent Lake B mining slopes based on infiltration/hydraulic conductivity assessments, derived soil strength parameters, and the proposed slope configurations presented on the conceptual design plans. The following sections provide details for the derivation of parameters used in our analyses. Slope stability analyses evaluate the ratio of the resisting forces (predominantly soil shear strength) to the driving forces that would cause a slope failure (predominantly gravity, soil unit weight, and slope/strata geometry). The ratio of the summation of driving forces divided by the summation of resisting forces is termed Factor of Safety (FS). FS of 1.0 indicates that the driving and resisting forces are equal and the slope is in a state of impending failure/movement. FS greater than 1.0 indicates the presence of reserve strength; however, this does not guarantee that failure will not occur. Rather, the probability of failure generally decreases as the FS increases. Typical minimum required FS for slope stability analyses are summarized in Table 6.0.
TABLE 6.0 MINIMUM REQUIRED FACTORS OF SAFETY – SLOPE STABILITY ANALYSES
Analysis Condition Typical Minimum Factor of Safety (FS) End of Construction / Temporary Conditions1 1.32
Permanent, Long-Term (Steady Seepage) 1.52 Seismic / Earthquake 1.0 to 1.23
1. Temporary conditions include mining and/or maintenance. 2. Minimum FS per EM 1110-2-1902 “Engineering and Design – Slope Stability,” US Army Corps of Engineers,
October 2003. We note that a minimum acceptable seismic FS of 1.0 was used for previous slope stability evaluations at the site.
3. Typical minimum FS range per commonly accepted engineering practice.
6.1 Current Conditions / Previous Stability Analyses
Currently, the ADV borders the existing south mining slope of Lake B. The ADV and the mining pit are separated by an irregular-shaped minor embankment with a top elevation of approximately 390 feet MSL. The current ADV natural channel is underlain by braided, coarse alluvial sediments primarily composed of sand and gravel. Based on the geologic cross-sections and information contained in the referenced EMKO Hydrology and Water Quality Analysis Report and the 3D Clay Bed Geologic Model and Lack of Evidence for the Presence of Aquitards, Eliot Quarry – CEMEX

Geocon Project No. S1264-05-01 - 12 - March 3, 2017 Revised December 31, 2019
Aggregates, Alameda County, California report, prepared by Jeff Light Geologic Consulting (November 12, 2019), clay layers in the area are relatively thin, laterally discontinuous, and do not function as aquitards. Therefore, there is direct hydraulic communication between the surface water in the ADV and groundwater in the immediate area. As such, in the absence of dewatering and pumping, at any given location along the project alignment, the water level in Lake B would be nearly consistent with the surface water level in the ADV. The previous KANE Slope Stability Evaluation analyzed global slope stability under static and seismic conditions, including the proposed Lake B mining slope adjacent to the current ADV (KANE’s Profile 4). KANE’s stability analyses were performed using a typical 2:1 cut slope inclination to a maximum mining depth of 150 feet MSL. The stability analyses considered both high and low groundwater and lake water conditions, as well as a rapid-drawdown condition in Lake B. The stability analyses were performed using the GeoStrucural Analysis slope stability software (Version 5.17.10.0, Fine Civil Engineering Software). The results of the evaluation concluded that mining slopes inclined at 2:1 or flatter are globally stable under static and seismic conditions under each of the various operational conditions. Because the previous project did not include significant fill embankments, the investigation did not evaluate potential fill slopes/constructed embankments at the site. For this study, we evaluated slope stability using the computer program SLOPE/W (Version 7.23 by Geo-Slope International). Our analysis for the slope adjacent to the realigned ADV considered circular failure modes, which were determined in previous studies to be the most critical slope failure mode (versus polygonal or wedge failures) under static and seismic conditions. We also analyzed the stability of block failure modes for the Lake B Southeast slope adjacent to Isabel Avenue (State Route 84). Our analysis was performed in general accordance with California Geological Survey (CGS) Special Publication 117A and an earlier, related guidance document published by the Southern California Earthquake Center (SCEC). Per the procedures recommended by SCEC, our analysis used Spencer’s Method. Spencer’s Method satisfies both force and moment equilibrium conditions and SCEC recommends it be used for the analysis of failure surfaces of any shape. Because the previous slope stability analyses for Lake B were performed using different software, we re-analyzed “Profile 4” (southeast slope of Lake B adjacent to the current ADV) that was previously performed by KANE in order to calibrate the two studies so that meaningful comparisons could be made. Table 6.1 summarizes the results.

Geocon Project No. S1264-05-01 - 13 - March 3, 2017 Revised December 31, 2019
TABLE 6.1
SLOPE STABILITY ANALYSIS CONFIRMATION – LAKE B “PROFILE 4”
Condition Analyst Calculated Minimum
Factor of Safety Static Seismic
Circular Failure, SE Slope, Mined to 150 feet MSL, Average Groundwater/Lake Water
Conditions
KANE GeoTech, Inc. 1.8 1.2
Geocon Consultants, Inc. 1.9 1.2
As shown in Table 6.1, our stability analysis results are essentially the same as the previous KANE analysis. Therefore, we consider our analytical methods to be substantially equivalent to the previous analyses.
6.2 Geometry for Stability Analyses
Our stability analyses were performed using the geometry at Cross-Section A-A’ (Figure 4) located within the central portion of the project alignment and a representative section located at the southeast end of Lake B (“Lake B Southeast Slope Analysis Section”), as shown on the Site Plan, Figure 3. The slope configurations and geometry at Cross-Section A-A’ are based on existing and proposed topography shown on the Reclamation Plans by Spinardi Associates, January 2019. Cross-Section A-A’ is considered to be representative of the “worst case” slope conditions along the project alignment because it includes the most significant fills (Topcon ponds) and the new embankment fill on the north side of the new ADV channel adjacent to the Lake B mining pit, as well as representing a location with a minimal setback between the realigned ADV and adjacent mining slope. Most other locations along the ADV realignment will be formed either at-grade or by cuts/excavations in intact, native materials, which represents less adverse slope conditions. We originally modeled the mining/reclamation slopes with an inclination of 2:1 – the full height of the slope. However, our updated analysis considers a higher pseudostatic seismic coefficient than originally modeled (0.21 vs. 0.16, see Section 6.5). This higher seismic loading resulted in an FS of less than 1.0 for the seismic case analyses. Therefore, our updated analysis reflects two alternative configurations for the cut slope below the realigned ADV – one with a 2¼:1 slope and another with a mid-slope, 40-foot horizontal bench within a 2:1 slope. Lithology at the analysis section (Cross-Section A-A’) was based on conditions encountered in our borings, previous explorations by others, and observed subsurface conditions on existing cut slopes at the site. We modeled clay or silt layers as horizontal and conservatively assumed to extend infinitely behind the proposed slope faces, even though these layers have been shown to be discontinuous (Jeff Light Geologic Consulting, 2019).

Geocon Project No. S1264-05-01 - 14 - March 3, 2017 Revised December 31, 2019
6.3 Seepage / Groundwater / Surface Water Conditions
As discussed previously, there is direct hydraulic communication between the surface water in ADV and groundwater in the immediate area. As such, in the absence of dewatering and pumping, the water level in Lake B would be consistent with the surface water level in the ADV. At the design profile for the project (Cross-Section A-A’), seasonal high groundwater elevation is expected to be approximately coincident with the ADV channel invert elevation of 380 feet MSL. Seasonal low groundwater elevation is expected to be approximately 373 feet MSL. To gain an understanding of general groundwater flow (seepage) conditions in the project area, we reviewed results of field infiltration testing performed at the site by Balance Hydrologics and EMKO. Details and results of the testing are summarized in the Memo – Infiltration Tests of Native and Spoil Soil along Reach B, Arroyo del Valle, CEMEX Eliot Facility prepared by Balance Hydrologics, Inc. and EMKO Environmental Inc. (May 13, 2016). The goal of the infiltration testing was to evaluate the infiltration rates of native soil and spoil material in terms of their suitability for use as construction materials for the reconstructed ADV channel. A secondary objective was to provide a quantitative assessment of the potential change in the rate of percolation from the existing stream bed compared to the realigned stream bed, and the qualitative implications for seepage and slope stability along the south slope of the Lake B mining pit. Field infiltration tests were performed using a double-ring infiltrometer apparatus following methods outlined by the USGS (1963). Infiltration tests were performed at four locations – two in native soil material (N1 and N2) along the riparian corridor of Reach-B and two on spoil soil material (S1 and S2). Approximate test locations are shown on the Site Plan, Figure 3. Field infiltration test results are summarized in Table 6.3A.
TABLE 6.3A INFILTRATION RATES
Test Location Surface Infiltration Rates (min/inch) 20 Minutes 30 Minutes 1 Hour 12 Hours
N1 13.47 11.40 8.58 3.09 N2 3.43 3.11 2.62 1.43 S1 0.59 0.46 0.31 0.07 S2 1.91 1.61 1.20 0.42
The field infiltration test results generally indicated that infiltration rates for the spoil soil material were less (slower) then those observed in native soil materials. Balance/EMKO concluded that infiltration rates following the ADV channel reconstruction should be similar to or slower than current rates. Therefore, infiltration of water through the realigned ADV channel would not steepen the groundwater gradient toward the south edge of Lake B, would not increase the groundwater elevation at the south edge of Lake B, and would not increase the rate of seepage into the south face of Lake B.

Geocon Project No. S1264-05-01 - 15 - March 3, 2017 Revised December 31, 2019
Surface infiltration testing generally evaluates vertical movement of water through an unsaturated medium. To further assess seepage conditions, we reviewed previous testing/analyses to evaluate vertical and horizontal saturated hydraulic conductivity. Table 6.3B summarizes saturated hydraulic conductivity values for the native gravels at the site.
TABLE 6.3B SATURATED HYDRAULIC CONDUCTIVITY
Material Saturated Hydraulic Conductivity
Vertical (ky)
Horizontal (kx) Ky/kx
Native Gravels 3.2 x 10⁻⁴ cm/sec 4.3 x 10⁻³ cm/sec 0.07
Vertical saturated hydraulic conductivity (ky) of the native gravels is based on in-situ field testing (pump tests, slug tests) as outlined in the Technical Memorandum #2 – Hydraulic Conductivity of Upper and Lower Gravels, prepared by Tim Sneddon, December 10, 2004. The average horizontal hydraulic conductivity (kx) of the native gravels is based on information obtained from the EMKO Hydrology and Water Quality Analysis Report. The calculated ratio of vertical to horizontal hydraulic conductivity (ky/kx) is approximately 0.07, which is generally consistent with the typical value of 0.1 for this type of alluvial material and compacted engineered fill.
We performed laboratory hydraulic conductivity testing on remolded soil samples to evaluate hydraulic conductivity properties of soil in a compacted state. We fabricated samples of the clay and gravels (the likely source of fill for the ADV realignment) and performed laboratory hydraulic conductivity testing in accordance with ASTM D5084. Test results are summarized in Table 6.3C.
TABLE 6.3C SATURATED HYDRAULIC CONDUCTIVITY
Material Saturated Hydraulic Conductivity
Vertical1 (ky)
Horizontal2 (kx) Ky/kx
Proposed Fill - Clay (remolded) 5.1 x 10⁻⁶ cm/sec 5.1 x 10⁻⁵ cm/sec 0.1 Proposed Fill - Gravel (remolded) 4.3 x 10⁻⁶ cm/sec 4.3 x 10⁻⁵ cm/sec 0.1
1. Based on laboratory hydraulic conductivity testing performed on remolded samples in accordance with ASTM D5084. Samples were remolded to approximately 90% relative compaction near optimum moisture content per ASTM D1557.
2. Horizontal hydraulic conductivity estimated based using a Ky/Kx ratio of 0.1.
A comparison of the hydraulic conductivity values presented in Tables 6.3B and 6.3C show that the remolded clay and gravel samples have lower (slower) hydraulic conductivity than the native gravel deposits. This further substantiates the conclusion that infiltration of water through the realigned ADV channel would not steepen the groundwater gradient toward the south edge of Lake B, would not increase the groundwater elevation at the south edge of Lake B, and would not increase the rate of seepage into the south face of Lake B to cause an adverse seepage and slope stability condition. Based on the above discussion and consultation with EMKO Environmental, Table 6.3D summarizes the surface water and groundwater elevations used in our analyses.

Geocon Project No. S1264-05-01 - 16 - March 3, 2017 Revised December 31, 2019
TABLE 6.3D
SURFACE WATER AND GROUNDWATER ELEVATIONS FOR ANALYSIS1
CROSS-SECTION A-A’ (APPROXIMATE STA. 25+50)
Case Condition Water Elevation in ADV (Feet)1
Groundwater Elevation at Lake B Slope Face (Feet)
Lake B Water Elevation (Feet)
Temporary Operational Conditions2 T-1 100-Year Flow 387.0 At Toe (150.0) 150.0 (Dewatered)3 T-2 Typical Flow 381.5 At Toe (150.0) 150.0 (Dewatered)3 T-3 Low Flow 380.5 At Toe (150.0) 150.0 (Dewatered)3
Permanent Operational Conditions4 P-1 100-Year Flow 387.0 369.0 369.0 P-2 Typical Flow 381.5 369.0 369.0 P-3 Low Flow 380.5 369.0 369.0
1. Information per Brown & Caldwell Hydraulic Modeling of Arroyo del Valle [DRAFT October 17, 2019]. 2. Temporary Operational Conditions = Expected conditions during active mining. 3. Dewatering drawdown assumed to occur at a rate such that the adjacent groundwater level draws down consistent
with the Lake B pool (e.g., no rapid drawdown condition resulting in undrained slopes). 4. Permanent Operational Conditions = Expected reclamation conditions (no dewatering). Groundwater elevation at
the slope and Lake B water elevations are coincident at the Lake B spillway elevation of 369 feet for all flow conditions.
We note that other surface water/groundwater elevation conditions are possible; however, the conditions listed in Table 6.3D effectively capture the likely range of critical temporary and permanent (long-term) operational conditions for the project. For the purposes of this report, Cases T-1, T-2, and T-3 represent temporary operational conditions, such as during mining and/or maintenance. Cases P-1, P-2, and P-3 represent permanent (long-term) operational conditions. For the “Lake B Southeast” slope stability analysis, we considered a typical groundwater elevation of 370 feet. In our analyses, we assumed a “straight line” groundwater gradient between the surface water elevation in ADV and the Lake B water elevation. This assumption is reasonable considering that the true gradient surface would be slightly curved, although relatively flat based on the ky/kx ratio.
6.4 Material Parameters for Stability Analyses
We selected material parameters for our slope stability analyses based on our review of the referenced previous geotechnical studies at the site, as well as results of our test pits, laboratory testing, published correlations, engineering judgment, and experience. At this time, we anticipate that the borrow material to be used for fill along the project alignment will consist of (1) “Gravels” derived from cut areas along the ADV realignment, (2) “Clay” excavated from the current bottom of Lake B (Borrow Area #1), and/or (3) “Silt” materials derived from onsite aggregate processing and stockpiled north of Lake B. Table 6.4A provides a summary of soil properties for each of these materials based on our laboratory testing program. Complete laboratory test results are presented in Appendix B.

Geocon Project No. S1264-05-01 - 17 - March 3, 2017 Revised December 31, 2019
TABLE 6.4A
SOIL PROPERTIES – PROPOSED FILL MATERIALS (REMOLDED)
Property / Parameter “Gravels” “Clay” “Silt” Percent Gravel (larger than No. 4 Sieve) 17.7% to 58.5% 11.6% 18.3%
Percent Sand (between No. 4 and No. 200 Sieves) 34.6% to 43.2% 33.5% 26.5%
Percent Fines (Silt/Clay) (Finer than No. 200 Sieve) 6.9% to 39.1% 54.8% 55.2%
Liquid Limit --- 31% 31% Plastic Limit --- 14% 13%
Plasticity Index --- 17% 18% USCS Soil Classification (SC/SM) to (GC/GM) CL CL
Total Unit Weight (at 90% relative compaction) 134 pcf 126 pcf ---
Optimum Moisture Content 8.5% 10% --- Total Cohesion, C Unsaturated
Conditions --- 2,550 pcf ---
Total Friction Angle, φ --- 25º --- Effective Cohesion, C Saturated
Conditions 40 to 160 pcf 150 pcf ---
Effective Friction Angle, φ 23º to 37º 32º ---
Saturated Hydraulic Conductivity 3 x 10⁻⁵ to 4.3 x 10⁻⁶ cm/sec 5.1 x 10⁻⁶ cm/sec ---
Shear strength parameters for the gravels were determined by performing large box (12-inch square) direct shear testing on selected saturated, remolded specimens. The specimens tested were obtained from the recent alluvium in the proposed ADV realignment and are considered representative of the “worst case” gravel material because the specimens contained nearly 40% fines (silt and clay). The test results represented the lower-bound shear strength parameters presented in Table A. Based on conditions encountered in our test pits, we expect that the majority of the gravel materials will contain less fines and will therefore have higher shear strength parameters. The upper-range shear strength parameters are based on direct shear testing performed by Berlogar Stevens & Associates on gravels obtained from the Lake B slope in 2012. The lower-bound (slower) hydraulic conductivity of the gravels is based on laboratory hydraulic conductivity testing performed by Geo-Logic Associates in accordance with ASTM D5084. We estimated the upper bound (faster) hydraulic conductivity of the gravel deposit using correlations developed by Alyamani and Sen (1993). This estimated value is approximately one order of magnitude slower than the hydraulic conductivity of the natural gravel deposits presented in Table 6.3B. Total and effective shear strength parameters and hydraulic conductivity of the “clay” to be potentially used as fill are based on the results of laboratory triaxial shear strength testing and hydraulic conductivity testing on remolded test specimens. Material sample specimens were remolded in the laboratory to approximately 90% relative compaction and at least 2% above optimum moisture content per ASTM D1557. As shown in Table 6.4A, the physical properties for the “clay” and “silt” materials are very similar; therefore, we assume that the shear strength parameters would also be similar.
Geocon Project No. S1264-05-01 - 18 - March 3, 2017 Revised December 31, 2019
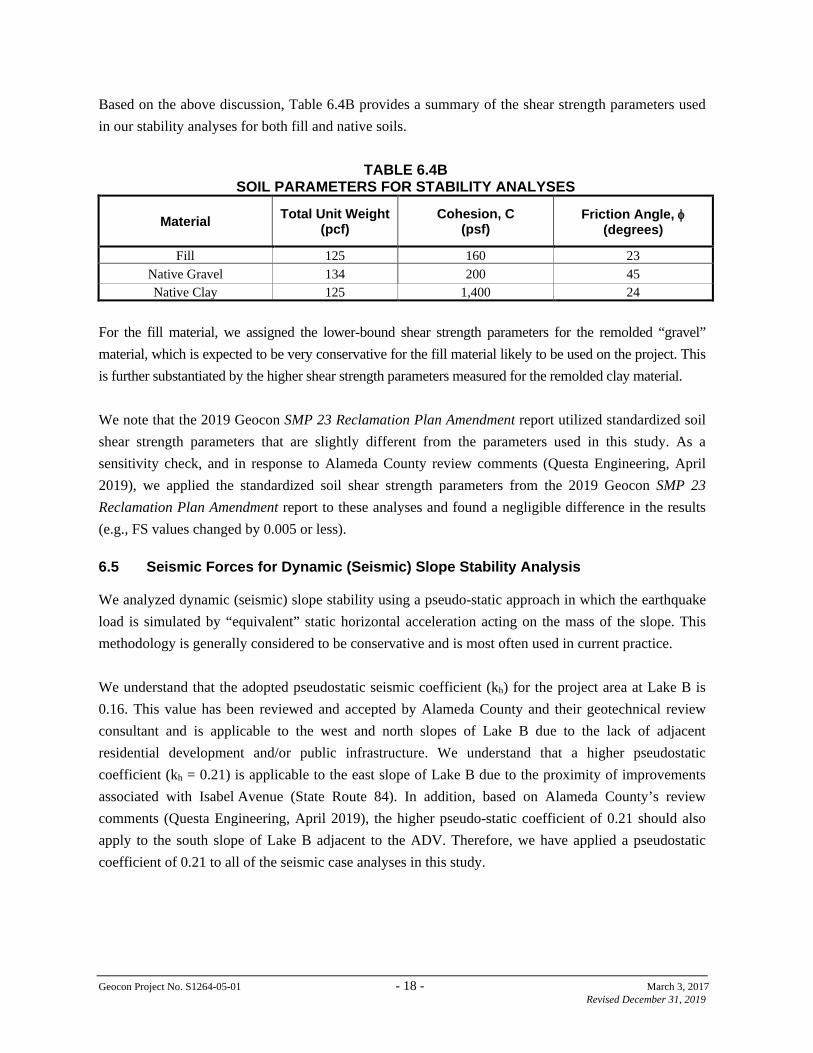
Based on the above discussion, Table 6.4B provides a summary of the shear strength parameters used in our stability analyses for both fill and native soils.
TABLE 6.4B SOIL PARAMETERS FOR STABILITY ANALYSES
Material Total Unit Weight (pcf)
Cohesion, C (psf)
Friction Angle, φ (degrees)
Fill 125 160 23 Native Gravel 134 200 45 Native Clay 125 1,400 24
For the fill material, we assigned the lower-bound shear strength parameters for the remolded “gravel” material, which is expected to be very conservative for the fill material likely to be used on the project. This is further substantiated by the higher shear strength parameters measured for the remolded clay material. We note that the 2019 Geocon SMP 23 Reclamation Plan Amendment report utilized standardized soil shear strength parameters that are slightly different from the parameters used in this study. As a sensitivity check, and in response to Alameda County review comments (Questa Engineering, April 2019), we applied the standardized soil shear strength parameters from the 2019 Geocon SMP 23 Reclamation Plan Amendment report to these analyses and found a negligible difference in the results (e.g., FS values changed by 0.005 or less).
6.5 Seismic Forces for Dynamic (Seismic) Slope Stability Analysis
We analyzed dynamic (seismic) slope stability using a pseudo-static approach in which the earthquake load is simulated by “equivalent” static horizontal acceleration acting on the mass of the slope. This methodology is generally considered to be conservative and is most often used in current practice. We understand that the adopted pseudostatic seismic coefficient (kh) for the project area at Lake B is 0.16. This value has been reviewed and accepted by Alameda County and their geotechnical review consultant and is applicable to the west and north slopes of Lake B due to the lack of adjacent residential development and/or public infrastructure. We understand that a higher pseudostatic coefficient (kh = 0.21) is applicable to the east slope of Lake B due to the proximity of improvements associated with Isabel Avenue (State Route 84). In addition, based on Alameda County’s review comments (Questa Engineering, April 2019), the higher pseudo-static coefficient of 0.21 should also apply to the south slope of Lake B adjacent to the ADV. Therefore, we have applied a pseudostatic coefficient of 0.21 to all of the seismic case analyses in this study.

Geocon Project No. S1264-05-01 - 19 - March 3, 2017 Revised December 31, 2019
6.6 Slope Stability Analyses and Results
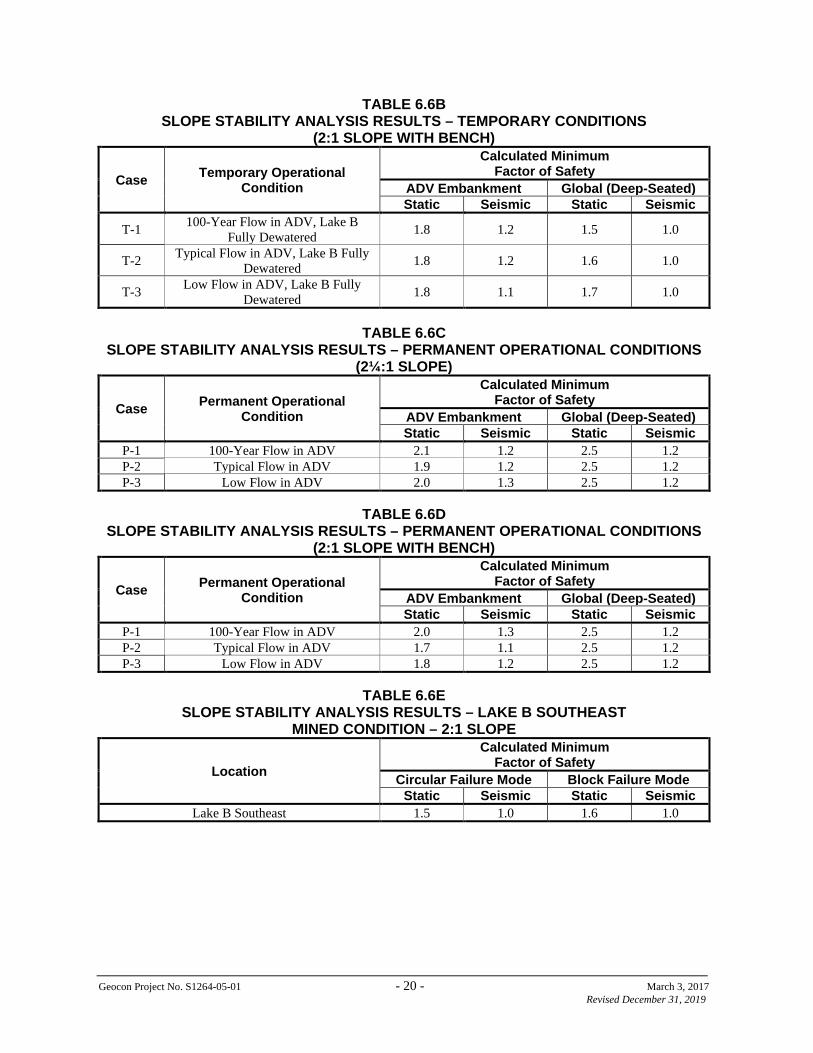
At Cross-Section A-A’, we analyzed slope stability conditions within the “ADV embankment” and the adjacent Lake B slope. For the purposes of this report, the ADV embankment is defined as the new embankment fill separating the realigned ADV channel with the Lake B mining slope. “Global” failures for the Lake B mining slope are considered deep-seated failure surfaces that would extend into the ADV realigned channel. We analyzed slope stability under both temporary and permanent operations conditions, as outlined in Section 6.3. As discussed previously, we originally modeled the mining/reclamation slopes with an inclination of 2:1 – the full height of the slope. However, our updated analysis considers a higher pseudostatic seismic coefficient than originally modeled (0.21 vs. 0.16, see Section 6.5). This higher seismic loading resulted in an FS of less than 1.0 for the seismic case analyses. Therefore, our updated analysis reflects two alternative configurations for the cut slope below the realigned ADV – one with a 2¼:1 slope and another with a mid-slope, 40-foot horizontal bench within a 2:1 slope. Tabulated results of our slope stability analysis (FS against failure) for both ADV embankment and global (deep-seated) failures for temporary and permanent operational conditions at Cross-Section A-A’ are summarized in Tables 6.6A through 6.6D. Tabulated results of our slope stability analysis for the Lake B southeast section for both circular and block failures are summarized in Table 6.6E. Graphical representations of the potential critical failure surfaces and parameters used for each stability analysis are presented in Appendix C.
TABLE 6.6A SLOPE STABILITY ANALYSIS RESULTS – TEMPORARY CONDITIONS (2¼:1 SLOPE)
Case Temporary Operational Condition
Calculated Minimum Factor of Safety
ADV Embankment Global (Deep-Seated) Static Seismic Static Seismic
T-1 100-Year Flow in ADV, Lake B Fully Dewatered 2.0 1.3 1.5 1.0
T-2 Typical Flow in ADV, Lake B Fully Dewatered 2.0 1.3 1.6 1.0
T-3 Low Flow in ADV, Lake B Fully Dewatered 2.0 1.2 1.6 1.0
Geocon Project No. S1264-05-01 - 20 - March 3, 2017 Revised December 31, 2019
TABLE 6.6B SLOPE STABILITY ANALYSIS RESULTS – TEMPORARY CONDITIONS
(2:1 SLOPE WITH BENCH)
Case Temporary Operational Condition
Calculated Minimum Factor of Safety
ADV Embankment Global (Deep-Seated) Static Seismic Static Seismic
T-1 100-Year Flow in ADV, Lake B Fully Dewatered 1.8 1.2 1.5 1.0
T-2 Typical Flow in ADV, Lake B Fully Dewatered 1.8 1.2 1.6 1.0
T-3 Low Flow in ADV, Lake B Fully Dewatered 1.8 1.1 1.7 1.0
TABLE 6.6C
SLOPE STABILITY ANALYSIS RESULTS – PERMANENT OPERATIONAL CONDITIONS (2¼:1 SLOPE)
Case Permanent Operational Condition
Calculated Minimum Factor of Safety
ADV Embankment Global (Deep-Seated) Static Seismic Static Seismic
P-1 100-Year Flow in ADV 2.1 1.2 2.5 1.2 P-2 Typical Flow in ADV 1.9 1.2 2.5 1.2 P-3 Low Flow in ADV 2.0 1.3 2.5 1.2
TABLE 6.6D
SLOPE STABILITY ANALYSIS RESULTS – PERMANENT OPERATIONAL CONDITIONS (2:1 SLOPE WITH BENCH)
Case Permanent Operational Condition
Calculated Minimum Factor of Safety
ADV Embankment Global (Deep-Seated) Static Seismic Static Seismic
P-1 100-Year Flow in ADV 2.0 1.3 2.5 1.2 P-2 Typical Flow in ADV 1.7 1.1 2.5 1.2 P-3 Low Flow in ADV 1.8 1.2 2.5 1.2
TABLE 6.6E
SLOPE STABILITY ANALYSIS RESULTS – LAKE B SOUTHEAST MINED CONDITION – 2:1 SLOPE
Location
Calculated Minimum Factor of Safety
Circular Failure Mode Block Failure Mode Static Seismic Static Seismic
Lake B Southeast 1.5 1.0 1.6 1.0
Geocon Project No. S1264-05-01 - 21 - March 3, 2017 Revised December 31, 2019
7.0 CONCLUSIONS
Based on the results of our study, the realignment of ADV as presently proposed is geotechnically feasible, provided the recommendations presented in this report are incorporated into the design and construction of the project. Conclusions and recommendations provided in this report are based on review of referenced literature, analysis of data obtained from our field exploration, the results of our laboratory testing program, and our understanding of the project at this time.
7.1 Seepage
Given that the proposed fill materials will exhibit lower (slower) hydraulic conductivity, infiltration through the realigned ADV channel should not steepen the groundwater gradient toward the south edge of Lake B, should not increase the groundwater elevation at the south edge of Lake B, and should not increase the rate of seepage into the south face of Lake B. Therefore, adverse seepage conditions are not expected.
7.2 Settlement
Generally, the proposed project includes placing fill in areas that were previously excavated and will not result in a significant increase in effective overburden pressure over the preexisting condition. Therefore, we do not expect significant post-construction, time-dependent settlement that would compromise the stability or performance of the embankments adjacent to the ADV.
7.3 Slope Stability
As outlined in Section 6.6, the calculated FS against failure for the ADV embankment and global (deep-seated) failures of the Lake B slope meets or exceeds the minimum acceptable FS outlined in Table 6.0 for static and seismic conditions for both temporary and permanent operational conditions. Based on the results of our study, the proposed ADV embankment and Lake B mining slopes are considered adequately stable for static and seismic conditions under the anticipated temporary and permanent operational conditions.
7.4 Pit Capture Potential
In off-channel mining operations, “pit capture” is a term to describe the process where the earthen material separating the mining pit from an adjacent watercourse is breached or overtopped by floodwaters, streambank erosion, and/or channel migration. Provided the embankment is not overtopped by floodwaters in the ADV and given the low potential for adverse seepage and slope instability, the potential for pit capture is low.

Geocon Project No. S1264-05-01 - 22 - March 3, 2017 Revised December 31, 2019
8.0 RECOMMENDATIONS
8.1 Slope Geometry
Based on our stability analyses, particularly the seismic case analysis for Cross-Section A-A’, final maximum slope inclinations adjacent to the ADV are as follows:
• 2¼ :1 for the full height of the slope; and
• 2:1 for the full height of the slope provided a 40-foot-wide maintenance bench is constructed mid-slope.
Based on our stability analyses for the Lake B Southeast section, the maximum slope inclination of the full height of the slope may be 2:1 without a mid-slope maintenance for the portions of the south slope east of (upstream of) Sta. 20+00. The slope in this area has a lower overall height.
8.2 Materials for Fill
In general, excavated soils generated from cut operations along the ADV realignment are suitable for use as engineered fill/embankment construction, provided they do not contain deleterious matter, organic material, or rock/cementations larger than 6 inches in maximum dimension. We anticipate that the majority of these materials will consist of gravel deposits. Based on the results of our investigation, the identified borrow materials (“clay” and “silt”) are also acceptable for use as fill. However, we expect some variability in soil conditions throughout the area, particularly in the “silt” material (Borrow Area #2). Therefore, periodic sampling and laboratory testing should be performed to verify that the following properties outlined in Table 8.2 are met.
TABLE 8.2 RECOMMENDED PROPERTIES FOR FILL
Property / Parameter Requirement
Percent Gravel (lager than No. 4 Sieve) --- Percent Sand (between No. 4 and No. 200 Sieves) 25% Minimum
Percent Fines (Silt/Clay) (Finer than No. 200 Sieve) 10% Minimum Liquid Limit 50 Maximum
Plasticity Index 7 Minimum, 25 Maximum Acceptable USCS Soil Classifications CL, SC, SC-SM, GC, GW-GC
Total Unit Weight (at 90% relative compaction) 120 pcf Minimum Effective Cohesion, C Saturated Conditions 150 pcf
Effective Friction Angle, φ 23º Saturated Hydraulic Conductivity 1 x 10⁻⁴
cm/sec (or slower)

Geocon Project No. S1264-05-01 - 23 - March 3, 2017 Revised December 31, 2019
8.3 Wet Weather Grading Conditions
If grading occurs in winter or spring, surface soils will likely be wet. The contractor should be aware of the moisture sensitivity of clayey and fine-grained soils and potential compaction/workability difficulties.
Earthwork operations in wet weather conditions will likely be difficult with low productivity. Often, a period of at least one month of warm and dry weather is necessary to allow the site to dry sufficiently so that heavy grading equipment can operate effectively. Conversely, during dry summer and fall months, dry clay soils may require additional grading effort (discing or other means) to attain proper moisture conditioning.
In-situ moisture content of the “clay” and “silt” soil is significantly higher than optimum moisture content. Due to the fine-grained nature of the soils and in-situ moisture contents well above optimum, additional drying effort to attain moisture contents suitable for compaction should be anticipated regardless of the time of year.
8.4 Grading/Embankments/Slopes
8.4.1 All earthwork operations should be observed and all fills tested for recommended compaction and moisture content by a representative of our firm. References to relative compaction and optimum moisture content in this report are based on the American Society for Testing and Materials (ASTM) D1557 Test Procedure, latest edition.
8.4.2 Prior to commencing grading, a pre-construction conference with representatives from CEMEX, the grading contractor, and Geocon should be held at the site. Site preparation, soil handling, and/or the grading plans should be discussed at the pre-construction conference.
8.4.3 Prior to commencing grading within embankment and slope areas, surface vegetation should be removed by stripping to a sufficient depth to remove roots and organic-rich topsoil. We estimate stripping depth will be on the order of 2 to 4 inches. Material generated during stripping is not suitable for use as embankment or reclamation slope fill but may be stockpiled for future use as topsoil. Any existing trees and associated root systems should be removed. Roots larger than 1 inch in diameter should be completely removed. Smaller roots may be left in place as conditions warrant and at the discretion of our field representative.
8.4.4 Prior to placing fill in the existing Topcon ponds, the ponds should be dewatered and allowed to dry for some time. We expect that clay soils exposed in the pond bottoms will be wet and unstable, even after dewatering. We recommend placing a bridging layer of rock (local gravel deposits) to stabilize the bottom and to allow access for grading equipment. For planning purposes, placing a 2- to 3-foot layer of gravel should provide adequate stabilization. Geocon should observe conditions exposed at the time of grading and provide specific stabilization recommendations during construction, based on conditions encountered.

Geocon Project No. S1264-05-01 - 24 - March 3, 2017 Revised December 31, 2019
8.4.5 To increase stability and to provide a stable foundation for the embankments, the full length of the embankments should be provided with embankment-width keyways. The keyways should have a minimum embedment depth of 3 feet into firm, competent, undisturbed soil. The actual depth of the keyway should be evaluated during construction by a Geocon representative. Keyway backslopes should be no flatter than 1:1.
8.4.6 In general, where fill is placed on sloping ground steeper than 5H:1V, the fill should be benched into the adjacent native materials as the fill is placed. Benches should roughly parallel slope contours and extend at least 2 feet into competent material. In addition, a keyway should be cut into the slope at the base of the fill. In general, keyways should be at least 15 feet wide and extend at least 2 feet into competent material. Bench and keyway criteria may need revision during construction based on the actual materials encountered and grading performed in the field.
8.4.7 Pipe penetrations through the new ADV embankment should be avoided. If pipe penetrations
are unavoidable, we recommend providing concrete cut-off collars at the penetration to reduce potential for seepage. Reinforced concrete cut-off collars should completely encircle the pipe and should be sized such that they are 12 to 18 inches larger than the nominal outside diameter of the pipe. Thickness of the cut-off collars should be at least 6 inches. Water-tight filler should be used between collars and pipes.
8.4.8 Bottoms of keyways and areas to receive fill should be scarified 12 inches, uniformly
moisture-conditioned at or above optimum moisture content, and compacted to at least 90% relative compaction. Scarification and recompaction operations should be performed in the presence of a Geocon representative to evaluate performance of the subgrade under compaction equipment loading.
8.4.9 Engineered fill consisting of onsite or approved import materials should be compacted in
horizontal lifts not exceeding 8 inches (loose thickness) and brought to final subgrade elevations. Each lift should be moisture-conditioned at or above optimum and compacted to at least 90% relative compaction.
8.4.10 Fill slopes should be built such that soils are uniformly compacted to at least 90% relative
compaction to the finished face of the completed slope. This may require over-building the slopes and cutting them back. Track-walking is typically not an acceptable means of slope zone compaction.

Geocon Project No. S1264-05-01 - 25 - March 3, 2017 Revised December 31, 2019
8.5 Slope Maintenance
As with any slope, slopes along the project alignment will be susceptible to erosion and surficial degradation when exposed to rain and surface runoff. Proper surface drainage facilities directing runoff away from slopes, vegetation, erosion control measures, and best management practice (BMP) devices should be maintained to reduce long-term slope degradation from erosion. Periodic inspections should be performed on a regular basis to identify and address maintenance needs. Geocon should be contacted to observe erosional features and to provide specific maintenance and repair recommendations, as needed. In general, localized slumps deeper than approximately 2 to 3 feet should be excavated/removed and replaced with engineered fill (compacted to at least 90% relative compaction) that is keyed and benched into the existing, intact slope. Significant erosional features such as deep rills and gullies should be re-graded (smoothed, backfilled, and tracked/compacted). Any repaired areas should be re-vegetated as soon as possible.

Geocon Project No. S1264-05-01 - 26 - March 3, 2017 Revised December 31, 2019
9.0 FURTHER GEOTECHNICAL SERVICES
9.1 Plan Review
Geocon should review the construction improvement drawings prior to final submittal to assess whether our recommendations have been properly incorporated and to evaluate if additional analysis and/or recommendations are required.
9.2 Testing and Observation Services
The recommendations provided in this report are based on the assumption that we will continue as Geotechnical Engineer of Record throughout the construction phase. It is important to maintain continuity of geotechnical interpretation and confirm that field conditions encountered are similar to those anticipated during design. It will be critical to verify that the materials used for fill/embankments on this project comply with the minimum recommended material specifications (Table 8.2). If we are not retained for these services, we cannot assume any responsibility for other’s interpretation of our recommendations or the future performance of the project.

Geocon Project No. S1264-05-01 - 27 - March 3, 2017 Revised December 31, 2019
10.0 LIMITATIONS AND UNIFORMITY OF CONDITIONS
The recommendations of this report pertain only to the site investigated and are based upon the assumption that the soil conditions do not deviate from those disclosed in the investigation. If any variations or undesirable conditions are encountered during construction, or if the proposed construction will differ from that anticipated herein, a licensed geotechnical engineer should be notified so that supplemental recommendations can be given. The evaluation or identification of the potential presence of hazardous materials or environmental contamination was not part of the scope of services provided by Geocon. This report is issued with the understanding that it is the responsibility of the owner or their representative to ensure that the information and recommendations contained herein are brought to the attention of the design team for the project and incorporated into the plans and specifications, and that the necessary steps are taken to see that the contractor and subcontractors carry out such recommendations in the field. The recommendations contained in this report are preliminary until verified during construction by representatives of our firm. Changes in the conditions of a property can occur with the passage of time, whether they are due to natural processes or the works of man on this or adjacent properties. Additionally, changes in applicable or appropriate standards may occur, whether they result from legislation or the broadening of knowledge. Accordingly, the findings of this report may be invalidated partially or wholly by changes outside our control. Therefore, this report is subject to review and should not be relied upon after a period of three years. Our professional services were performed, our findings were obtained, and our recommendations were prepared in accordance with generally accepted geotechnical engineering principles and practices used in this area at this time. No warranty is provided, express or implied.

Geocon Project No. S1264-05-01 - 28 - March 3, 2017 Revised December 31, 2019
11.0 REFERENCES
1. Alyamani and Sen, Determination of Hydraulic Conductivity from Complete Grain-Size Distribution Curves, Groundwater Journal, July-August 1993.
2. Balance Hydrologics, Inc. and EMKO Environmental Inc., Memo – Infiltration Tests of Native and Spoil Soil Along Reach B, Arroyo del Valle, CEMEX Eliot Facility, May 13, 2016.
3. Barlock, V.E., Sedimentology of the Livermore Gravels (Miocene-Pleistocene), Southern Livermore Valley, California, 1989.
4. Berlogar Stevens & Associates, Slope Stability Investigation, Lake B – Corrective Action Plan, SMP23 Quarry, Livermore, California, October 30, 2012.
5. Blake, T.F., EQFAULT, A Computer Program for the Deterministic Prediction of Peak Horizontal Acceleration from Digitized California Faults, Version 2.20, 2000.
6. Brown and Caldwell, Hydraulic Design Study, CEMEX Eliot Facility, CA MINE 91-01-0009, January 2020.
7. Brown and Caldwell, Improvement Plans for Eliot Facility Arroyo Del Valle Realignment Project (Cemex), Alameda County, California – 95% Construction Drawings, August 2018.
8. Bryant & Hart, E. W., Fault-Rupture Hazard Zones in California, Alquist-Priolo Earthquake Fault Zoning Act with Index to Earthquake Fault Zone Maps, California Division of Mines and Geology Special Publication 42, 1973 (revised 2007).
9. California Division of Mines and Geology, Guidelines for Evaluating and Mitigating Seismic Hazards in California, Special Publication 117A, revised and re-adopted September 11, 2008.
10. EMKO Environmental, Inc., Groundwater Hydrology and Water Quality Analysis Report for the Cemex Eliot Quarry SMP-23 Reclamation Plan Amendment Project, Alameda County, California, February 2019.
11. EMKO Environmental, Inc., Technical Memorandum – Updated Analysis of Lake A and B Water Levels, Cemex Eliot Facility, August 28, 2018.
12. Geocon Consultants, Inc., Geotechnical Investigation – Cemex Eliot – SMP 23 Reclamation, Alameda County, California (Geocon Project No. E9029-04-0), December 31, 2019.
13. Geo-Slope International, SEEP/W and SLOPE/W, Version 7.22, 2011.
14. Jennings, C.W., Fault Activity Map of California and Adjacent Areas with Locations and Ages of Recent Volcanic Eruptions, California Division of Mines and Geology Map No. 6, 1994.
15. KANE GeoTech, Inc., Cemex Eliot Quarry – Geotechnical Characterization Report, Alameda County, California, (Project No. GT13-16), May 7, 2015.
16. KANE GeoTech, Inc., Cemex Eliot Quarry – Geotechnical Characterization Appendices, Alameda County, California, (Project No. GT13-16), May 7, 2015.
17. KANE GeoTech, Inc., Cemex Eliot Quarry – Lake B Evaluation Report, Alameda County, California, (Project No. GT13-16), May 7, 2015.
18. Questa Engineering Corporation, Memorandum – Review of Geotechnical Investigation and Slope Stability Analysis, Eliot Quarry (SMP 23), April 25, 2019.
19. Sneddon, Tim, Technical Memorandum #2 – Hydraulic Conductivity of Upper and Lower Gravels, December 10, 2004.

Geocon Project No. S1264-05-01 - 29 - March 3, 2017 Revised December 31, 2019
20. United States Geological Survey, 2008 Interactive Deaggregations, http://eqint.cr.usgs.gov/deaggint/2008/index.php.
21. Unpublished reports, aerial photographs, and maps on file with Geocon.

Dublin
Pleasanton
Livermore
Valley Ave.
Ave.
Bernal
Bernal
Vineyard
1st
St.St
.
Mai
n
Blvd.Hopyard
Rd.
Hop
yard
Stoneridge
Ston
eridg
e
Dr.
W. LasPositas
Blvd.
Las PositasBlvd.
Rd.
Foothill
Rd.
DublinBlvd.
DublinBlvd.
Tass
ajar
a
Rosewood
RitaRd.
LivermoreMunicipal Airport
Las PositasGolf
Course
LivermorePremiumOutlets
Ruby HillGolfClub
Canyons Pkwy.
ShadowCliffs
RegionalPark
PleasantonGolf
CenterAlamedaCounty
Fairgrounds
PleasantonSportsPark
Hacie
ndaStoneridgeShopping
Center
Dublin
Pleasanton
Livermore
Valley Ave.
Valley
Ave.
Blvd
.
Bernal Ave.
Bernal
Ave.
Vineyard
Ave.1st
St.St
.
Mai
n
StanleyBlvd.
Stanley
Blvd.
Hopyard
Rd.
Hop
yard
Rd.
Stoneridge Dr.
Ston
eridg
e
Dr.
W. LasPositas
Blvd.
W.
Las PositasBlvd.
Foothill
Rd.
Foothill
Rd.
DublinBlvd.
DublinBlvd.
Dr.
Owens
Dr. R
d.Ta
ssaj
ara
RosewoodDr.
SantaRita
Rd.
FallonR
d.
ElCharro
Rd.Jack
London Blvd.
AirwayLivermore
Municipal Airport
Las PositasGolf
Course
LivermorePremiumOutlets
Ruby HillGolfClub
Blvd.
Canyons Pkwy.
Isab
elAv
e.Is
abel
Ave.
ShadowCliffs
RegionalPark
PleasantonGolf
CenterAlamedaCounty
Fairgrounds
PleasantonSportsPark
Hacie
ndaStoneridgeShopping
Center
N0 1
Scale in Miles
580
680
680
680
580580
Arroyo Del Valle RealignmentCemex Eliot Mine
Alameda County, California
VICINITY MAP
December 2019 Figure 1S1264-05-01
P H O N E 9 1 6 . 8 5 2 . 9 11 8 – FA X 9 1 6 . 8 5 2 . 9 1 3 23 1 6 0 G O L D VA L L E Y D R – S U I T E 8 0 0 – R A N C H O C O R D O VA , C A 9 5 7 4 2
PROJECTSITE
PROJECTSITE

60+22.12
0+00
5+00
10+00
15+00
20+00
25+00
30+00
35+0040+00
45+0050+00
55+00
1
D
DATE
REVISIONS
DESCRIPTION
BC PROJECT NUMBER
FILENAME
SHEET NUMBER
DRAWING NUMBER
AT FULL SIZE
CHECKED:
APPROVED:
DRAWN:
CLIENT PROJECT NUMBER
DESIGNED:
REV
CHECKED:
2 3 4 5 6
C
B
1 2 3 4 5 6OF
D
C
B
A
Path
: \\B
CSE
AFP0
1\PR
OJE
CTS
\CEM
EX\1
4995
1 AR
RO
YO D
EL V
ALLE
REA
LIG
NM
EN
T\C
AD\2
-SH
EETS
\C-C
IVIL
F
ILEN
AME:
C-1
01.D
WG
P
LOT
DAT
E: 8
/16/
2018
6:5
0 P
M
CAD
USE
R: S
AMAN
THA
CO
HE
N
LINE IS 2 INCHES
A
701 PIKE STREETSUITE 1200
SEATTLE, WA 98101
2365 IRON POINT ROADSUITE 120
FOLSOM, CA 95630
ARROYO DEL VALLEREALIGNMENT
PROJECT
1544 STANLEY BOULEVARDPLEASANTON, CA 94566
CA MINE ID NO: 91-01-0009
DRAFTNOT FOR
CONSTRUCTION
PRELIMINARYDESIGN
FOR REVIEW ONLY
SCALE IN FEET
0 200' 400'
VINEYARD AVE
VINEYARD AVE
MACHAD
O PL
SAFRENO W
AY
149951
C-101.DWG
4
C-101
SITE PLAN
CIVIL
BACKWATERWETLAND
BACKWATER WETLAND
FLOW-THROUGH WETLAND
BACKWATER WETLAND
FLOW-THROUGH WETLAND
CHANNEL BIFURCATION
TRIBUTARY WETLAND
CHANNEL BIFURCATION
CHANNELBIFURCATION
BACKWATER WETLAND
BACKWATER WETLAND
EXISTING STREAM CENTERLINE
EXISTING STREAM CENTERLINE
LIMIT OF GRADING
30'-0" WIDE DRIVE
PROPOSED STREAM CENTERLINE
PROPOSED FLOODPLAIN TERRACE
1
C-503
1
C-503
3
C-503
1
C-503
4
C-503
3
C-503
3
C-503
1
C-503
2
C-503
1
C-503
TIE PROPOSED GRADESINTO EXISTING PERUPSTREAM TRANSITIONPLAN (SEE SHEET C-102)
FUTURE PEDESTRIAN PATH(20'-0" WIDE)
4
C-503
TURNAROUND
TURNAROUND
30'-0" WIDE DRIVE
ACCESS ROAD
RETAINING WALL FORPEDESTRIAN PATH
48-INCH CULVERTOUTLET INV: 424.4TO 7' X 7' UPPER DROP STRUCTURESEE DETAIL C/SHEET C-504
48-INCH CULVERTTO 7' X 7' MIDDLE DROP STRUCTURE
24-INCH CULVERTOUTLET INV: 408.8EXTEND UNDER PATHTO EXTENDED RIPRAP
24-INCH CULVERTOUTLET INV: 407.8EXTEND UNDER PATHTO DROP STRUCTURE
24-INCH CULVERTFROM DROP STRUCTUREUNDER ACCESS ROAD TOLATERAL PIPE ENTRY (SD 505)
TWO 48-INCH CULVERTSOUTLET INV: 396.84EXTEND UNDER PATHTO 15' X 6' DROP STRUCURESEE DETAIL C/SHEET C-504
72-INCH CULVERTFROM DROP STRUCTUREUNDER ACCESS ROADTO LATERAL PIPE ENTRY(SD-505)SEE DETAIL D/SHEET C-504
48-INCH CULVERT FROMLOWER DROP STRUCTUREUNDER ACCESS ROAD TOLATERAL PIPE ENTRY (SD-505)SEE DETAIL C/SHEET C-504
TIE PROPOSED GRADESINTO EXISTING PERDOWNSTREAM TRANSITIONPLAN (SHEET C-103)
FUTURE PEDESTRIAN PATH(20'-0" WIDE)
FUTURE PEDESTRIAN PATH(20'-0" WIDE)
PROPOSED LIMITS OF FLOODPLAIN
PROPOSED LIMITS OF FLOODPLAIN
Ref: Site Plan, Brown and Caldwell, 8/16/18
PROPOSEDPROJECT OVERVIEW
Arroyo Del Valle RealignmentCemex Eliot Mine
Alameda County, CaliforniaS1264-05-01 December 2019 Figure 2P H O N E 9 1 6 . 8 5 2 . 9 11 8 – FA X 9 1 6 . 8 5 2 . 9 1 3 2
3 1 6 0 G O L D VA L L E Y D R – S U I T E 8 0 0 – R A N C H O C O R D O VA , C A 9 5 7 4 2

0 400
Scale in Feet
N
Arroyo Del Valle RealignmentCemex Eliot Mine
Alameda County, CaliforniaSITE PLAN
December 2019 Figure 3S1264-05-01P H O N E 9 1 6 . 8 5 2 . 9 11 8 – FA X 9 1 6 . 8 5 2 . 9 1 3 23 1 6 0 G O L D VA L L E Y D R – S U I T E 8 0 0 – R A N C H O C O R D O VA , C A 9 5 7 4 2
BH2013-09
BH2013-10
BH2013-11
BH2013-07
BH2013-01
BH2013-08
BH2013-09
B3
B4
B3
B4
BH2013-10
BH2013-11
BH2013-07
BH2013-01
BH2013-08
V I N E YA R D AV E N U EV I N E YA R D AV E N U E
A'
A'
TP4
TP7
TP5
NorthwestPond
LAKE B
TP4
TP7
TP5
NorthwestPond
QUARRYPONDS
QUARRYPONDS
TP1
TP2TP3
BORROWAREA #2 (SILT)
BORROWAREA #1 (CLAY)
BORROWAREA #2 (SILT)
BORROWAREA #1 (CLAY)
LAKE B
TP9TP9
TP10TP10
TP6TP6
LEGEND:
Approximate Boring Location (Geocon 2018)
Approximate Test Pit Location (Geocon 2016)
Approximate Boring Location (Kane 2013)
Approximate Infiltration Location(Balance Hydrologics/EMKO, 2016)
Approximate Cross-Section Location(Figure 3)
Approximate Cut Area
Approximate Fill Area
Existing Arroyo Del Valle Alignment
Proposed Arroyo Del Valle Alignment
Top of Floodplain Corridor
Site Photograph Location & Orientation
BH2013-01
N2
TP1
A A'
AA
1
BH2013-12BH2013-12
South PondSouth Pond
TP1
TP2TP3
10
11
9
4
5
3
13
1
12
7
2
TP8TP8
S2N2
N1
S2N2
N1
BH2013-13BH2013-13
6
S1S1
NortheastPond
NortheastPond
8
Lake B SoutheastSlope Analysis Section
Lake B SoutheastSlope Analysis Section
B4

Arroyo Del Valle RealignmentCemex Eliot Mine
Alameda County, CaliforniaCROSS-SECTION A – A'
December 2019 Figure 4S1264-05-01
P H O N E 9 1 6 . 8 5 2 . 9 11 8 – FA X 9 1 6 . 8 5 2 . 9 1 3 23 1 6 0 G O L D VA L L E Y D R – S U I T E 8 0 0 – R A N C H O C O R D O VA , C A 9 5 7 4 2
TD=Total Depth
Boring ID
Proposed Grade
Existing Grade
Lithologic Contact
Groundwater (Date Measured)
Mining/Reclamation Slope Option #1 – 2:1 Slope with 40' Wide Bench
Mining/Reclamation Slope Option #2 – 2.25:1 Slope
Water Body
New FILL (Embankment)
New FILL (Water Body)
SAND/GRAVEL
CLAY/SILT**
Although shown as continuous, the silt/claylayers are variable and discontinuous
0 120
120
0
HorizontalScale in Feet
Vert
ical
Scal
e in
Fee
t
Blow Counts (*N-Value)80
ASouth
A'North
Elev
atio
n in
Fee
t (M
SL)
500
400
300
200
100
0
500
Elev
atio
n in
Fee
t (M
SL)
500
400
300
200
100
0
BH20
13-1
3
BH20
13-1
2
TP8
BH20
13-0
9 (P
roje
cted
750
' NW
)
TD=280'
57
TD=200'
21
20
(4/13/13)
TD=280'
TD=9'TD=9'
57
BH20
13-1
3 (P
roje
cted
130
0' S
E)
TD=300'TD=300'
CLAY/SILT
CLAY/SILT CLAY/SILT
CLAY/SILT
CLAY/SILT
SAND/GRAVEL
SAND/GRAVEL SAND/GRAVEL
SAND/GRAVEL
CLAY/SILT
CLAY/SILT CLAY/SILT
CLAY/SILT
CLAY/SILT
SAND/GRAVEL
SAND/GRAVEL SAND/GRAVEL
SAND/GRAVEL
78*
37*
34*
31*
37*
107*
78*
37*
34*
SouthTopcon Pond
31*
37*
TD=200'
21
21
21
12.252.25
1
(4/4/13)
20107*
(4/13/13)
ProposedArroyo Del Valle
ExistingArroyo Del Valle
Typical Surface WaterElevation ± 380' Existing Lake B
Mining Slope
ExistingGradeNorthwest
Topcon Pond
21
21
**
BH20
13-0
7 (P
roje
cted
2,0
00' W
est)
TD=300' TD=300'
TD=150'
TD=150'
(4/12/13)
(10/24/17)
(4/5/13)(4/8/13)
(10/30/17)
TD=300'
BH20
13-0
8 (P
roje
cted
3,0
00' W
est)
TD=300'
B3 (P
roje
cted
550
' Wes
t)
TD=150'
B4 (P
roje
cted
400
' Eas
t)
TD=150'
(4/12/13)
(10/24/17)
(4/5/13)(4/8/13)
(10/30/17)

PHOTOS NO. 1 & 2
December 2019GEOCON Project No. S1264-05-01
Cemex Eliot MineAlameda County, California
Arroyo Del Valle Realignment
Photo No. 2 Quaternary gravel in south side of existing Arroyo del Valle (December 2016)
Photo No. 1 Embankment of Quaternary alluvium on the south side of the South Topcon Pond (December 2016)
P H O N E 9 1 6 . 8 5 2 . 9 11 8 – FA X 9 1 6 . 8 5 2 . 9 1 3 23 1 6 0 G O L D VA L L E Y D R – S U I T E 8 0 0 – R A N C H O C O R D O VA , C A 9 5 7 4 2

PHOTOS NO. 3 & 4
December 2019GEOCON Project No. S1264-05-01
Cemex Eliot MineAlameda County, California
Arroyo Del Valle Realignment
Photo No. 4 Sandy clayey gravel near northwest end of proposed Arroyo del Valle realignment (January 2017)
Photo No. 3 Ridge of Quaternary gravel between the Pond west of the Topcon facility and Arroyo del Valle (December 2016)
P H O N E 9 1 6 . 8 5 2 . 9 11 8 – FA X 9 1 6 . 8 5 2 . 9 1 3 23 1 6 0 G O L D VA L L E Y D R – S U I T E 8 0 0 – R A N C H O C O R D O VA , C A 9 5 7 4 2

PHOTOS NO. 5 & 6
December 2019GEOCON Project No. S1264-05-01
Cemex Eliot MineAlameda County, California
Arroyo Del Valle Realignment
Photo No. 6 Southwest margin of existing Arroyo del Valle west of Topcon Ponds (looking east) (December 2016)
Photo No. 5 Existing Arroyo del Valle west of Topcon Ponds (looking northeast) (December 2016)
P H O N E 9 1 6 . 8 5 2 . 9 11 8 – FA X 9 1 6 . 8 5 2 . 9 1 3 23 1 6 0 G O L D VA L L E Y D R – S U I T E 8 0 0 – R A N C H O C O R D O VA , C A 9 5 7 4 2

PHOTOS NO. 7 & 8
December 2019GEOCON Project No. S1264-05-01
Cemex Eliot MineAlameda County, California
Arroyo Del Valle Realignment
Photo No. 8 View looking northwest across the Northeast Topcon Pond (December 2016)
Photo No. 7 South embankment above the Northeast Topcon Pond (December 2016)
P H O N E 9 1 6 . 8 5 2 . 9 11 8 – FA X 9 1 6 . 8 5 2 . 9 1 3 23 1 6 0 G O L D VA L L E Y D R – S U I T E 8 0 0 – R A N C H O C O R D O VA , C A 9 5 7 4 2

PHOTOS NO. 9 & 10
December 2019GEOCON Project No. S1264-05-01
Cemex Eliot MineAlameda County, California
Arroyo Del Valle Realignment
Photo No. 10 Test Pit TP2 in Borrow Area #2 (Silt) (December 2016)
Photo No. 9 Looking southeast at Lake B. Borrow Area #1 (Clay) at far end of the lake (December 2016)
P H O N E 9 1 6 . 8 5 2 . 9 11 8 – FA X 9 1 6 . 8 5 2 . 9 1 3 23 1 6 0 G O L D VA L L E Y D R – S U I T E 8 0 0 – R A N C H O C O R D O VA , C A 9 5 7 4 2

PHOTOS NO. 11 & 12
December 2019GEOCON Project No. S1264-05-01
Cemex Eliot MineAlameda County, California
Arroyo Del Valle Realignment
Photo No. 12 Test Pit TP4 in Borrow Area #1 (Clay) (December 2016)
Photo No. 11 Borrow Area #2 (Silt) with soil piles excavated from TP2 (left) and TP3 (right) (December 2016)
P H O N E 9 1 6 . 8 5 2 . 9 11 8 – FA X 9 1 6 . 8 5 2 . 9 1 3 23 1 6 0 G O L D VA L L E Y D R – S U I T E 8 0 0 – R A N C H O C O R D O VA , C A 9 5 7 4 2

PHOTO NO. 13
December 2019GEOCON Project No. S1264-05-01
Cemex Eliot MineAlameda County, California
Arroyo Del Valle Realignment
Photo No. 13 Test Pit TP8 in Quaternary alluvium (Silty clayey sand with gravel) south of the South Topcon Pond (December 2016)
P H O N E 9 1 6 . 8 5 2 . 9 11 8 – FA X 9 1 6 . 8 5 2 . 9 1 3 23 1 6 0 G O L D VA L L E Y D R – S U I T E 8 0 0 – R A N C H O C O R D O VA , C A 9 5 7 4 2

APPENDIX A

APPENDIX A
FIELD EXPLORATION PROGRAM
Our field exploration program was performed on December 22, 2016. The field exploration program consisted of excavating ten exploratory test pits (T1 through T10) with track-mounted excavators (Komatsu 240 and Caterpillar 325 excavators equipped with 36-inch wide buckets) at the approximate locations shown on the Site Plan, Figure 3. Bulk samples were obtained from the test pits. Upon completion, the test pits were backfilled with the excavated material.
Subsurface conditions encountered in the test pits were visually examined, classified, and logged in general accordance with the American Society for Testing and Materials (ASTM) Practice for Description and Identification of Soils (Visual-Manual Procedure D2488-90). This system uses the USCS for soil designations. The logs depict the soil and geologic conditions encountered and the depths at which samples were obtained. The logs also include our interpretation of the conditions between sampling intervals. Therefore, the logs contain both observed and interpreted data. We determined the lines designating the interface between soil materials on the logs using visual observations, excavation characteristics, and other factors. The transition between the materials may be abrupt or gradual. Where applicable, the field logs were revised based on subsequent laboratory testing. Logs of exploratory test pits are presented herein.
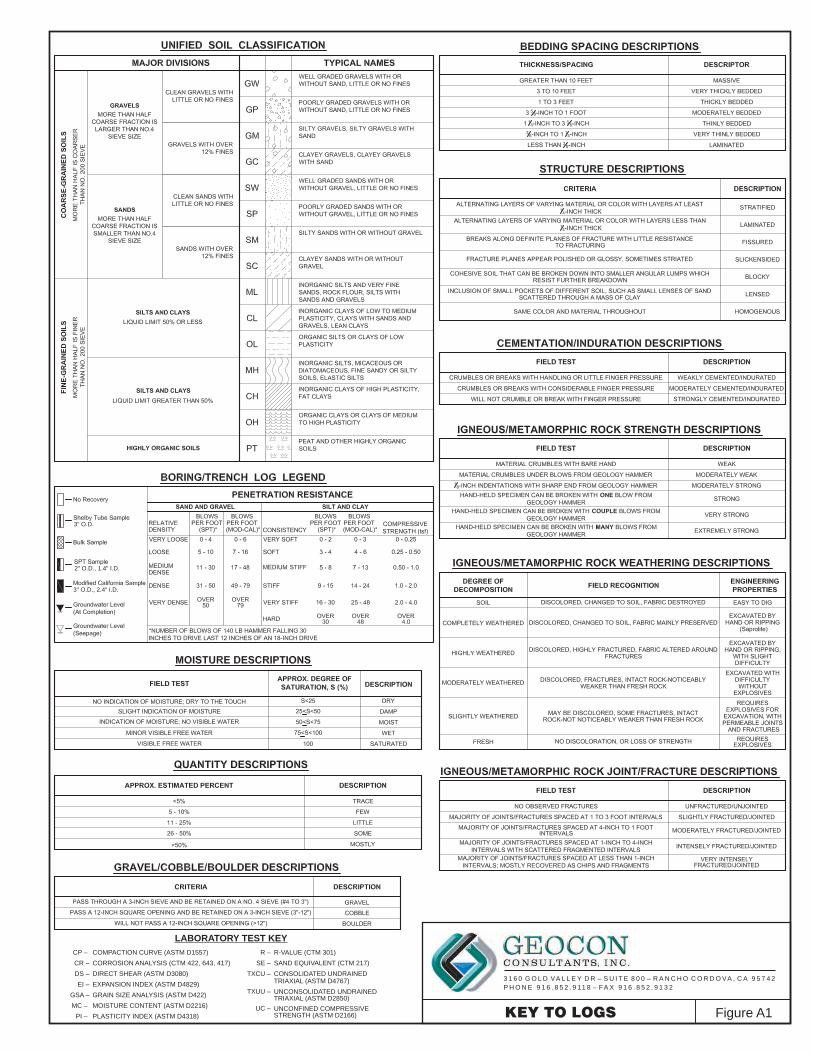
COMPACTION CURVE (ASTM D1557)CORROSION ANALYSIS (CTM 422, 643, 417)DIRECT SHEAR (ASTM D3080)EXPANSION INDEX (ASTM D4829)GRAIN SIZE ANALYSIS (ASTM D422)MOISTURE CONTENT (ASTM D2216)PLASTICITY INDEX (ASTM D4318)
LABORATORY TEST KEYCP – CR –DS –EI –
GSA –MC –
PI –
R-VALUE (CTM 301)SAND EQUIVALENT (CTM 217)CONSOLIDATED UNDRAINEDTRIAXIAL (ASTM D4767)UNCONSOLIDATED UNDRAINEDTRIAXIAL (ASTM D2850)
R –SE –
TXCU –
TXUU –
UNCONFINED COMPRESSIVESTRENGTH (ASTM D2166)
UC –
3" O.D.
2" O.D., 1.4" I.D.
3" O.D., 2.4" I.D.
KEY TO LOGS Figure A1
P H O N E 9 1 6 . 8 5 2 . 9 11 8 – FA X 9 1 6 . 8 5 2 . 9 1 3 23 1 6 0 G O L D VA L L E Y D R – S U I T E 8 0 0 – R A N C H O C O R D O VA , C A 9 5 7 4 2

TP1-5
TP1-10
TP1-15
CL FILLMoist, brown, Sandy lean CLAY with gravel, roundedgravel to 4 inches maximum dimension
- increased gravel below approximately 17 feet
TEST PIT TERMINATED AT 20 FEETGROUNDWATER NOT ENCOUNTERED
GSA, PI
SAMPLE SYMBOLS... SAMPLING UNSUCCESSFUL
~382' 12/22/2016
GR
OU
ND
WA
TE
R
... CHUNK SAMPLE
... STANDARD PENETRATION TEST
ENG./GEO.
ELEV. (MSL.)
TE
ST
S
PE
NE
TR
AT
ION
RE
SIS
TA
NC
E(B
LO
WS
/FT
.)
DR
Y D
EN
SIT
Y(P
.C.F
.)
MO
IST
UR
EC
ON
TE
NT
(%
)
AD
DIT
ION
AL
IN
HAMMER TYPE
FEET
Figure A2, Log of Test Pit, page 1 of 1
... DRIVE SAMPLE (UNDISTURBED)
CAT 325 Excavator
... DISTURBED OR BAG SAMPLE
DRILLER
LIT
HO
LO
GY
IN PROGRESS S1264-05-01 CEMEX ELIOT.GPJ 01/27/17
TEST PIT TP1
(USCS)John C. Pfeiffer
... WATER TABLE OR SEEPAGE
CLASS
DATE COMPLETED
NA
DEPTHSAMPLE
INTERVAL
&RECOVERY
Independent Construction
EQUIPMENT
MATERIAL DESCRIPTION0
1
2
3
4
5
6
7
8
9
10
11
12
13
14
15
16
17
18
19
20
SOIL
NOTE: THE LOG OF SUBSURFACE CONDITIONS SHOWN HEREON APPLIES ONLY AT THE SPECIFIC BORING OR TRENCH LOCATION AND AT THE DATE INDICATED. IT IS NOT WARRANTED TO BE REPRESENTATIVE OFSUBSURFACE CONDITIONS AT OTHER LOCATIONS AND TIMES.
PROJECT NO. S1264-05-01 PROJECT NAME Cemex Eliot

TP2-5
TP2-10
TP2-15
CL FILLMoist, brown, Sandy lean CLAY with gravel, roundedgravel to 4 inches maximum dimension
- increased gravel below approximately 17 feet
TEST PIT TERMINATED AT 20 FEETGROUNDWATER NOT ENCOUNTERED
SAMPLE SYMBOLS... SAMPLING UNSUCCESSFUL
~382' 12/22/2016
GR
OU
ND
WA
TE
R
... CHUNK SAMPLE
... STANDARD PENETRATION TEST
ENG./GEO.
ELEV. (MSL.)
TE
ST
S
PE
NE
TR
AT
ION
RE
SIS
TA
NC
E(B
LO
WS
/FT
.)
DR
Y D
EN
SIT
Y(P
.C.F
.)
MO
IST
UR
EC
ON
TE
NT
(%
)
AD
DIT
ION
AL
IN
HAMMER TYPE
FEET
Figure A3, Log of Test Pit, page 1 of 1
... DRIVE SAMPLE (UNDISTURBED)
CAT 325 Excavator
... DISTURBED OR BAG SAMPLE
DRILLER
LIT
HO
LO
GY
IN PROGRESS S1264-05-01 CEMEX ELIOT.GPJ 01/27/17
TEST PIT TP2
(USCS)John C. Pfeiffer
... WATER TABLE OR SEEPAGE
CLASS
DATE COMPLETED
NA
DEPTHSAMPLE
INTERVAL
&RECOVERY
Independent Construction
EQUIPMENT
MATERIAL DESCRIPTION0
1
2
3
4
5
6
7
8
9
10
11
12
13
14
15
16
17
18
19
20
SOIL
NOTE: THE LOG OF SUBSURFACE CONDITIONS SHOWN HEREON APPLIES ONLY AT THE SPECIFIC BORING OR TRENCH LOCATION AND AT THE DATE INDICATED. IT IS NOT WARRANTED TO BE REPRESENTATIVE OFSUBSURFACE CONDITIONS AT OTHER LOCATIONS AND TIMES.
PROJECT NO. S1264-05-01 PROJECT NAME Cemex Eliot

TP1-5
TP3-10
TP3-15
CL FILLMoist, brown, Sandy lean CLAY with gravel, roundedgravel to 4 inches maximum dimension
- increased gravel below approximately 17 feet
TEST PIT TERMINATED AT 20 FEETGROUNDWATER NOT ENCOUNTERED
SAMPLE SYMBOLS... SAMPLING UNSUCCESSFUL
~382' 12/22/2016
GR
OU
ND
WA
TE
R
... CHUNK SAMPLE
... STANDARD PENETRATION TEST
ENG./GEO.
ELEV. (MSL.)
TE
ST
S
PE
NE
TR
AT
ION
RE
SIS
TA
NC
E(B
LO
WS
/FT
.)
DR
Y D
EN
SIT
Y(P
.C.F
.)
MO
IST
UR
EC
ON
TE
NT
(%
)
AD
DIT
ION
AL
IN
HAMMER TYPE
FEET
Figure A4, Log of Test Pit, page 1 of 1
... DRIVE SAMPLE (UNDISTURBED)
CAT 325 Excavator
... DISTURBED OR BAG SAMPLE
DRILLER
LIT
HO
LO
GY
IN PROGRESS S1264-05-01 CEMEX ELIOT.GPJ 01/27/17
TEST PIT TP3
(USCS)John C. Pfeiffer
... WATER TABLE OR SEEPAGE
CLASS
DATE COMPLETED
NA
DEPTHSAMPLE
INTERVAL
&RECOVERY
Independent Construction
EQUIPMENT
MATERIAL DESCRIPTION0
1
2
3
4
5
6
7
8
9
10
11
12
13
14
15
16
17
18
19
20
SOIL
NOTE: THE LOG OF SUBSURFACE CONDITIONS SHOWN HEREON APPLIES ONLY AT THE SPECIFIC BORING OR TRENCH LOCATION AND AT THE DATE INDICATED. IT IS NOT WARRANTED TO BE REPRESENTATIVE OFSUBSURFACE CONDITIONS AT OTHER LOCATIONS AND TIMES.
PROJECT NO. S1264-05-01 PROJECT NAME Cemex Eliot

TP4A-F CL ALLUVIUMMoist, reddish brown to brown, Sandy lean CLAY, littleround to subround gravel to 1.5 inches maximum dimension
- increased moisture
- increased gravel content below 19 feet
TEST PIT TERMINATED AT 20 FEETGROUNDWATER ENCOUNTERED AT 18 FEET
GSA, PI
SAMPLE SYMBOLS... SAMPLING UNSUCCESSFUL
~304' 12/22/2016
GR
OU
ND
WA
TE
R
... CHUNK SAMPLE
... STANDARD PENETRATION TEST
ENG./GEO.
ELEV. (MSL.)
TE
ST
S
PE
NE
TR
AT
ION
RE
SIS
TA
NC
E(B
LO
WS
/FT
.)
DR
Y D
EN
SIT
Y(P
.C.F
.)
MO
IST
UR
EC
ON
TE
NT
(%
)
AD
DIT
ION
AL
IN
HAMMER TYPE
FEET
Figure A5, Log of Test Pit, page 1 of 1
... DRIVE SAMPLE (UNDISTURBED)
CAT 325 Excavator
... DISTURBED OR BAG SAMPLE
DRILLER
LIT
HO
LO
GY
IN PROGRESS S1264-05-01 CEMEX ELIOT.GPJ 01/27/17
TEST PIT TP4
(USCS)John C. Pfeiffer
... WATER TABLE OR SEEPAGE
CLASS
DATE COMPLETED
NA
DEPTHSAMPLE
INTERVAL
&RECOVERY
Independent Construction
EQUIPMENT
MATERIAL DESCRIPTION0
1
2
3
4
5
6
7
8
9
10
11
12
13
14
15
16
17
18
19
20
SOIL
NOTE: THE LOG OF SUBSURFACE CONDITIONS SHOWN HEREON APPLIES ONLY AT THE SPECIFIC BORING OR TRENCH LOCATION AND AT THE DATE INDICATED. IT IS NOT WARRANTED TO BE REPRESENTATIVE OFSUBSURFACE CONDITIONS AT OTHER LOCATIONS AND TIMES.
PROJECT NO. S1264-05-01 PROJECT NAME Cemex Eliot

TP5A-B GC ALLUVIUMDamp to moist, brown, Clayey GRAVEL, subround toround gravel to 4 inches maximum dimension
TEST PIT TERMINATED AT 6.5 FEETGROUNDWATER NOT ENCOUNTERED
SAMPLE SYMBOLS... SAMPLING UNSUCCESSFUL
~294' 12/22/2016
GR
OU
ND
WA
TE
R
... CHUNK SAMPLE
... STANDARD PENETRATION TEST
ENG./GEO.
ELEV. (MSL.)
TE
ST
S
PE
NE
TR
AT
ION
RE
SIS
TA
NC
E(B
LO
WS
/FT
.)
DR
Y D
EN
SIT
Y(P
.C.F
.)
MO
IST
UR
EC
ON
TE
NT
(%
)
AD
DIT
ION
AL
IN
HAMMER TYPE
FEET
Figure A6, Log of Test Pit, page 1 of 1
... DRIVE SAMPLE (UNDISTURBED)
CAT 325 Excavator
... DISTURBED OR BAG SAMPLE
DRILLER
LIT
HO
LO
GY
IN PROGRESS S1264-05-01 CEMEX ELIOT.GPJ 01/27/17
TEST PIT TP5
(USCS)John C. Pfeiffer
... WATER TABLE OR SEEPAGE
CLASS
DATE COMPLETED
NA
DEPTHSAMPLE
INTERVAL
&RECOVERY
Independent Construction
EQUIPMENT
MATERIAL DESCRIPTION0
1
2
3
4
5
6
SOIL
NOTE: THE LOG OF SUBSURFACE CONDITIONS SHOWN HEREON APPLIES ONLY AT THE SPECIFIC BORING OR TRENCH LOCATION AND AT THE DATE INDICATED. IT IS NOT WARRANTED TO BE REPRESENTATIVE OFSUBSURFACE CONDITIONS AT OTHER LOCATIONS AND TIMES.
PROJECT NO. S1264-05-01 PROJECT NAME Cemex Eliot

TP6-0-1.5
TP6-1.5-8A-C
ML
GW-GC
Damp, brown, SILT, trace sand and fine to medium roundgravel
Loose to medium dense, gray, Well graded GRAVEL withsilt, clay, and sand
TEST PIT TERMINATED AT 8 FEETGROUNDWATER NOT ENCOUNTERED
GSA
SAMPLE SYMBOLS... SAMPLING UNSUCCESSFUL
~410' 12/22/2016
GR
OU
ND
WA
TE
R
... CHUNK SAMPLE
... STANDARD PENETRATION TEST
ENG./GEO.
ELEV. (MSL.)
TE
ST
S
PE
NE
TR
AT
ION
RE
SIS
TA
NC
E(B
LO
WS
/FT
.)
DR
Y D
EN
SIT
Y(P
.C.F
.)
MO
IST
UR
EC
ON
TE
NT
(%
)
AD
DIT
ION
AL
IN
HAMMER TYPE
FEET
Figure A7, Log of Test Pit, page 1 of 1
... DRIVE SAMPLE (UNDISTURBED)
Komatsu 240 Excavator w/ 36"bucket
... DISTURBED OR BAG SAMPLE
DRILLER
LIT
HO
LO
GY
IN PROGRESS S1264-05-01 CEMEX ELIOT.GPJ 01/27/17
TEST PIT TP6
(USCS)John C. Pfeiffer
... WATER TABLE OR SEEPAGE
CLASS
DATE COMPLETED
NA
DEPTHSAMPLE
INTERVAL
&RECOVERY
Independent Construction
EQUIPMENT
MATERIAL DESCRIPTION0
1
2
3
4
5
6
7
8
SOIL
NOTE: THE LOG OF SUBSURFACE CONDITIONS SHOWN HEREON APPLIES ONLY AT THE SPECIFIC BORING OR TRENCH LOCATION AND AT THE DATE INDICATED. IT IS NOT WARRANTED TO BE REPRESENTATIVE OFSUBSURFACE CONDITIONS AT OTHER LOCATIONS AND TIMES.
PROJECT NO. S1264-05-01 PROJECT NAME Cemex Eliot

TP7-0-2.5
TP7-3-9
TP7-5-12
ML
SC
Damp, dark brown, Sandy SILT with gravel
Medium dense to dense, damp, yellowish brown, Siltyclayey SAND with gravel, subround to round gravel to 4inches maximum dimension
TEST PIT TERMINATED AT 12 FEETGROUNDWATER NOT ENCOUNTERED
GSA
SAMPLE SYMBOLS... SAMPLING UNSUCCESSFUL
~422' 12/22/2016
GR
OU
ND
WA
TE
R
... CHUNK SAMPLE
... STANDARD PENETRATION TEST
ENG./GEO.
ELEV. (MSL.)
TE
ST
S
PE
NE
TR
AT
ION
RE
SIS
TA
NC
E(B
LO
WS
/FT
.)
DR
Y D
EN
SIT
Y(P
.C.F
.)
MO
IST
UR
EC
ON
TE
NT
(%
)
AD
DIT
ION
AL
IN
HAMMER TYPE
FEET
Figure A8, Log of Test Pit, page 1 of 1
... DRIVE SAMPLE (UNDISTURBED)
Komatsu 240 Excavator w/ 36"bucket
... DISTURBED OR BAG SAMPLE
DRILLER
LIT
HO
LO
GY
IN PROGRESS S1264-05-01 CEMEX ELIOT.GPJ 01/27/17
TEST PIT TP7
(USCS)John C. Pfeiffer
... WATER TABLE OR SEEPAGE
CLASS
DATE COMPLETED
NA
DEPTHSAMPLE
INTERVAL
&RECOVERY
Independent Construction
EQUIPMENT
MATERIAL DESCRIPTION0
1
2
3
4
5
6
7
8
9
10
11
12
SOIL
NOTE: THE LOG OF SUBSURFACE CONDITIONS SHOWN HEREON APPLIES ONLY AT THE SPECIFIC BORING OR TRENCH LOCATION AND AT THE DATE INDICATED. IT IS NOT WARRANTED TO BE REPRESENTATIVE OFSUBSURFACE CONDITIONS AT OTHER LOCATIONS AND TIMES.
PROJECT NO. S1264-05-01 PROJECT NAME Cemex Eliot

TP8-0-3
TP8-3-9
ML
SC
Damp, dark brown, Sandy SILT with gravel
Medium dense to dense, damp, yellowish brown, Siltyclayey SAND with gravel, subround to round gravel to 4inches maximum dimension
TEST PIT TERMINATED AT 9 FEETGROUNDWATER NOT ENCOUNTERED
SAMPLE SYMBOLS... SAMPLING UNSUCCESSFUL
~422' 12/22/2016
GR
OU
ND
WA
TE
R
... CHUNK SAMPLE
... STANDARD PENETRATION TEST
ENG./GEO.
ELEV. (MSL.)
TE
ST
S
PE
NE
TR
AT
ION
RE
SIS
TA
NC
E(B
LO
WS
/FT
.)
DR
Y D
EN
SIT
Y(P
.C.F
.)
MO
IST
UR
EC
ON
TE
NT
(%
)
AD
DIT
ION
AL
IN
HAMMER TYPE
FEET
Figure A9, Log of Test Pit, page 1 of 1
... DRIVE SAMPLE (UNDISTURBED)
Komatsu 240 Excavator w/ 36"bucket
... DISTURBED OR BAG SAMPLE
DRILLER
LIT
HO
LO
GY
IN PROGRESS S1264-05-01 CEMEX ELIOT.GPJ 01/27/17
TEST PIT TP8
(USCS)John C. Pfeiffer
... WATER TABLE OR SEEPAGE
CLASS
DATE COMPLETED
NA
DEPTHSAMPLE
INTERVAL
&RECOVERY
Independent Construction
EQUIPMENT
MATERIAL DESCRIPTION0
1
2
3
4
5
6
7
8
9
SOIL
NOTE: THE LOG OF SUBSURFACE CONDITIONS SHOWN HEREON APPLIES ONLY AT THE SPECIFIC BORING OR TRENCH LOCATION AND AT THE DATE INDICATED. IT IS NOT WARRANTED TO BE REPRESENTATIVE OFSUBSURFACE CONDITIONS AT OTHER LOCATIONS AND TIMES.
PROJECT NO. S1264-05-01 PROJECT NAME Cemex Eliot

TP9-0-3
TP9-3-10
ML
SW-SM
Damp to moist, brown, SILT to gravelly SILT
Medium dense, moist, gray to brownish gray, interbeddedwell graded SAND with gravel and well graded GRAVELwith silt, clay and sand- layers/lenses 1 to 2 feet thick, subround to round gravel to4 inches maximum dimension
TEST PIT TERMINATED AT 12 FEETGROUNDWATER NOT ENCOUNTERED
SAMPLE SYMBOLS... SAMPLING UNSUCCESSFUL
~400' 12/22/2016
GR
OU
ND
WA
TE
R
... CHUNK SAMPLE
... STANDARD PENETRATION TEST
ENG./GEO.
ELEV. (MSL.)
TE
ST
S
PE
NE
TR
AT
ION
RE
SIS
TA
NC
E(B
LO
WS
/FT
.)
DR
Y D
EN
SIT
Y(P
.C.F
.)
MO
IST
UR
EC
ON
TE
NT
(%
)
AD
DIT
ION
AL
IN
HAMMER TYPE
FEET
Figure A10, Log of Test Pit, page 1 of 1
... DRIVE SAMPLE (UNDISTURBED)
Komatsu 240 Excavator w/ 36"bucket
... DISTURBED OR BAG SAMPLE
DRILLER
LIT
HO
LO
GY
IN PROGRESS S1264-05-01 CEMEX ELIOT.GPJ 01/27/17
TEST PIT TP9
(USCS)John C. Pfeiffer
... WATER TABLE OR SEEPAGE
CLASS
DATE COMPLETED
NA
DEPTHSAMPLE
INTERVAL
&RECOVERY
Independent Construction
EQUIPMENT
MATERIAL DESCRIPTION0
1
2
3
4
5
6
7
8
9
10
11
12
SOIL
NOTE: THE LOG OF SUBSURFACE CONDITIONS SHOWN HEREON APPLIES ONLY AT THE SPECIFIC BORING OR TRENCH LOCATION AND AT THE DATE INDICATED. IT IS NOT WARRANTED TO BE REPRESENTATIVE OFSUBSURFACE CONDITIONS AT OTHER LOCATIONS AND TIMES.
PROJECT NO. S1264-05-01 PROJECT NAME Cemex Eliot

SW
GC
Moist, brownish gray, Well graded SAND with gravel
Moist to wet, brown to light brown, Clayey GRAVEL withcobbles and boulders to 18 inches
- seepage
TEST PIT TERMINATED AT 10 FEETGROUNDWATER NOT ENCOUNTERED
SAMPLE SYMBOLS... SAMPLING UNSUCCESSFUL
~372 12/22/2016
GR
OU
ND
WA
TE
R
... CHUNK SAMPLE
... STANDARD PENETRATION TEST
ENG./GEO.
ELEV. (MSL.)
TE
ST
S
PE
NE
TR
AT
ION
RE
SIS
TA
NC
E(B
LO
WS
/FT
.)
DR
Y D
EN
SIT
Y(P
.C.F
.)
MO
IST
UR
EC
ON
TE
NT
(%
)
AD
DIT
ION
AL
IN
HAMMER TYPE
FEET
Figure A11, Log of Test Pit, page 1 of 1
... DRIVE SAMPLE (UNDISTURBED)
Komatsu 240 Excavator w/ 36"bucket
... DISTURBED OR BAG SAMPLE
DRILLER
LIT
HO
LO
GY
IN PROGRESS S1264-05-01 CEMEX ELIOT.GPJ 01/27/17
TEST PIT TP10
(USCS)John C. Pfeiffer
... WATER TABLE OR SEEPAGE
CLASS
DATE COMPLETED
NA
DEPTHSAMPLE
INTERVAL
&RECOVERY
Independent Construction
EQUIPMENT
MATERIAL DESCRIPTION0
1
2
3
4
5
6
7
8
9
10
SOIL
NOTE: THE LOG OF SUBSURFACE CONDITIONS SHOWN HEREON APPLIES ONLY AT THE SPECIFIC BORING OR TRENCH LOCATION AND AT THE DATE INDICATED. IT IS NOT WARRANTED TO BE REPRESENTATIVE OFSUBSURFACE CONDITIONS AT OTHER LOCATIONS AND TIMES.
PROJECT NO. S1264-05-01 PROJECT NAME Cemex Eliot

CL
GC
113.5
Very stiff, damp, dark yellow-brown, CLAY
-dark yellow-brown with trace gray-brown vertical stringers and blackmottling-blocky soil structure
Very dense, damp, strong brown mottle black, Clayey (f-c) GRAVELwith (f-c) sand-clasts are decomposed brown siltstone and diorite and strong to verystrong sub-rounded to rounded brown sandstone
-wet, yellow-brown, more sand
14.7
14.8
30
50/5"
50/6"
B3-10.5
B3-11
B3-11.5
B3-20
B3-30
DR
Y D
ENSI
TY
JP
EQUIPMENT
DRILLER
300 DATE COMPLETED
HAMMER TYPE
MO
ISTU
RE
BK81 w/ 8-inch HSA & 3.75-inch Mud Rotary
V&W
BORING B3
CO
NTE
NT
(%)
... SAMPLING UNSUCCESSFUL
GEOCON BORING LOG E9029-04-01 BORING LOGS.GPJ 04/12/18
... CHUNK SAMPLE
GR
OU
ND
WAT
ER
SOIL
MATERIAL DESCRIPTION
DEPTHIN
NO.(USCS)
ELEV. (MSL.)
CLASSENG./GEO.
Figure A12, Log of Boring B3, page 1 of 5
Downhole-Wireline
FEET
... STANDARD PENETRATION TEST ... DRIVE SAMPLE (UNDISTURBED)
SAMPLE SYMBOLS
RES
ISTA
NC
E(B
LOW
S/FT
.)
(P.C
.F.)
... WATER TABLE OR SEEPAGE
PEN
ETR
ATIO
N
LITH
OLO
GY
... DISTURBED OR BAG SAMPLE
0
1
2
3
4
5
6
7
8
9
10
11
12
13
14
15
16
17
18
19
20
21
22
23
24
25
26
27
28
29
30
31
32
33
34
SAMPLE10/30/2017
PROJECT NO.
NOTE: THE LOG OF SUBSURFACE CONDITIONS SHOWN HEREON APPLIES ONLY AT THE SPECIFIC BORING OR TRENCH LOCATION AND AT THE DATE INDICATED. IT IS NOT WARRANTED TO BE REPRESENTATIVE OF SUBSURFACE CONDITIONS AT OTHER LOCATIONSAND TIMES.
PROJECT NAME: E9029-04-01 Cemex Eliot - SMP 23 Reclamation
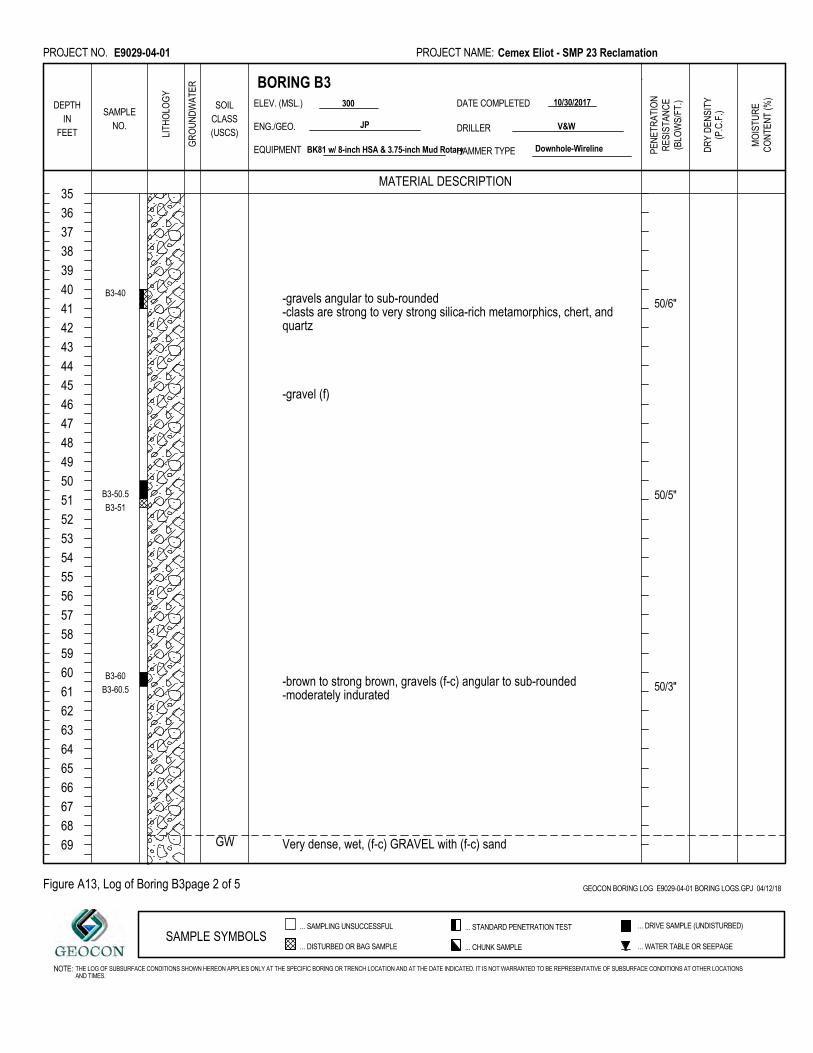
GW
-gravels angular to sub-rounded-clasts are strong to very strong silica-rich metamorphics, chert, andquartz
-gravel (f)
-brown to strong brown, gravels (f-c) angular to sub-rounded-moderately indurated
Very dense, wet, (f-c) GRAVEL with (f-c) sand
50/6"
50/5"
50/3"
B3-40
B3-50.5
B3-51
B3-60
B3-60.5
DR
Y D
ENSI
TY
JP
EQUIPMENT
DRILLER
300 DATE COMPLETED
HAMMER TYPE
MO
ISTU
RE
BK81 w/ 8-inch HSA & 3.75-inch Mud Rotary
V&W
BORING B3
CO
NTE
NT
(%)
... SAMPLING UNSUCCESSFUL
GEOCON BORING LOG E9029-04-01 BORING LOGS.GPJ 04/12/18
... CHUNK SAMPLE
GR
OU
ND
WAT
ER
SOIL
MATERIAL DESCRIPTION
DEPTHIN
NO.(USCS)
ELEV. (MSL.)
CLASSENG./GEO.
Figure A13, Log of Boring B3, page 2 of 5
Downhole-Wireline
FEET
... STANDARD PENETRATION TEST ... DRIVE SAMPLE (UNDISTURBED)
SAMPLE SYMBOLS
RES
ISTA
NC
E(B
LOW
S/FT
.)
(P.C
.F.)
... WATER TABLE OR SEEPAGE
PEN
ETR
ATIO
N
LITH
OLO
GY
... DISTURBED OR BAG SAMPLE
35
36
37
38
39
40
41
42
43
44
45
46
47
48
49
50
51
52
53
54
55
56
57
58
59
60
61
62
63
64
65
66
67
68
69
SAMPLE10/30/2017
PROJECT NO.
NOTE: THE LOG OF SUBSURFACE CONDITIONS SHOWN HEREON APPLIES ONLY AT THE SPECIFIC BORING OR TRENCH LOCATION AND AT THE DATE INDICATED. IT IS NOT WARRANTED TO BE REPRESENTATIVE OF SUBSURFACE CONDITIONS AT OTHER LOCATIONSAND TIMES.
PROJECT NAME: E9029-04-01 Cemex Eliot - SMP 23 Reclamation

SW-SM
CL
GC
Very dense, wet, (f) Gravelly (f-c) SAND with few fines
CLAY
Very dense, brown, (f-c) Sandy (f-c) angular to sub-rounded GRAVELwith little clay
50/6"
50/6"
50/5"
B3-70
B3-70.5
B3-80
B3-85-90
B3-93
B3-97
B3-100
B3-100.5
B3-102
DR
Y D
ENSI
TY
JP
EQUIPMENT
DRILLER
300 DATE COMPLETED
HAMMER TYPE
MO
ISTU
RE
BK81 w/ 8-inch HSA & 3.75-inch Mud Rotary
V&W
BORING B3
CO
NTE
NT
(%)
... SAMPLING UNSUCCESSFUL
GEOCON BORING LOG E9029-04-01 BORING LOGS.GPJ 04/12/18
... CHUNK SAMPLE
GR
OU
ND
WAT
ER
SOIL
MATERIAL DESCRIPTION
DEPTHIN
NO.(USCS)
ELEV. (MSL.)
CLASSENG./GEO.
Figure A14, Log of Boring B3, page 3 of 5
Downhole-Wireline
FEET
... STANDARD PENETRATION TEST ... DRIVE SAMPLE (UNDISTURBED)
SAMPLE SYMBOLS
RES
ISTA
NC
E(B
LOW
S/FT
.)
(P.C
.F.)
... WATER TABLE OR SEEPAGE
PEN
ETR
ATIO
N
LITH
OLO
GY
... DISTURBED OR BAG SAMPLE
70
71
72
73
74
75
76
77
78
79
80
81
82
83
84
85
86
87
88
89
90
91
92
93
94
95
96
97
98
99
100
101
102
103
104
SAMPLE10/30/2017
PROJECT NO.
NOTE: THE LOG OF SUBSURFACE CONDITIONS SHOWN HEREON APPLIES ONLY AT THE SPECIFIC BORING OR TRENCH LOCATION AND AT THE DATE INDICATED. IT IS NOT WARRANTED TO BE REPRESENTATIVE OF SUBSURFACE CONDITIONS AT OTHER LOCATIONSAND TIMES.
PROJECT NAME: E9029-04-01 Cemex Eliot - SMP 23 Reclamation

GW
-gravels (f-c)
-cuttings show white and clear quartz, pink feldspar, lithic fragments:granitic, dioritic, mafic to ultramafic (olivine-rich), metabasalt, red chert
Very dense, GRAVEL with cobbles
50/4"
50/2"
80/6"
B3-105
B3-110
B3-112
B3-116
B3-120
B3-121
B3-125
B3-127
B3-130
DR
Y D
ENSI
TY
JP
EQUIPMENT
DRILLER
300 DATE COMPLETED
HAMMER TYPE
MO
ISTU
RE
BK81 w/ 8-inch HSA & 3.75-inch Mud Rotary
V&W
BORING B3
CO
NTE
NT
(%)
... SAMPLING UNSUCCESSFUL
GEOCON BORING LOG E9029-04-01 BORING LOGS.GPJ 04/12/18
... CHUNK SAMPLE
GR
OU
ND
WAT
ER
SOIL
MATERIAL DESCRIPTION
DEPTHIN
NO.(USCS)
ELEV. (MSL.)
CLASSENG./GEO.
Figure A15, Log of Boring B3, page 4 of 5
Downhole-Wireline
FEET
... STANDARD PENETRATION TEST ... DRIVE SAMPLE (UNDISTURBED)
SAMPLE SYMBOLS
RES
ISTA
NC
E(B
LOW
S/FT
.)
(P.C
.F.)
... WATER TABLE OR SEEPAGE
PEN
ETR
ATIO
N
LITH
OLO
GY
... DISTURBED OR BAG SAMPLE
105
106
107
108
109
110
111
112
113
114
115
116
117
118
119
120
121
122
123
124
125
126
127
128
129
130
131
132
133
134
135
136
137
138
139
SAMPLE10/30/2017
PROJECT NO.
NOTE: THE LOG OF SUBSURFACE CONDITIONS SHOWN HEREON APPLIES ONLY AT THE SPECIFIC BORING OR TRENCH LOCATION AND AT THE DATE INDICATED. IT IS NOT WARRANTED TO BE REPRESENTATIVE OF SUBSURFACE CONDITIONS AT OTHER LOCATIONSAND TIMES.
PROJECT NAME: E9029-04-01 Cemex Eliot - SMP 23 Reclamation

GC Very dense, brown, Clayey GRAVEL with sand
END OF BORING AT APPROXIMATELY 150½ FEETGROUNDWATER INITIALLY ENCOUNTERED AT 30 FEET
BACKFILLED WITH GROUT VIA TREMIE
80/3"50/1"
90/4"
B3-145
B3-147
DR
Y D
ENSI
TY
JP
EQUIPMENT
DRILLER
300 DATE COMPLETED
HAMMER TYPE
MO
ISTU
RE
BK81 w/ 8-inch HSA & 3.75-inch Mud Rotary
V&W
BORING B3
CO
NTE
NT
(%)
... SAMPLING UNSUCCESSFUL
GEOCON BORING LOG E9029-04-01 BORING LOGS.GPJ 04/12/18
... CHUNK SAMPLE
GR
OU
ND
WAT
ER
SOIL
MATERIAL DESCRIPTION
DEPTHIN
NO.(USCS)
ELEV. (MSL.)
CLASSENG./GEO.
Figure A16, Log of Boring B3, page 5 of 5
Downhole-Wireline
FEET
... STANDARD PENETRATION TEST ... DRIVE SAMPLE (UNDISTURBED)
SAMPLE SYMBOLS
RES
ISTA
NC
E(B
LOW
S/FT
.)
(P.C
.F.)
... WATER TABLE OR SEEPAGE
PEN
ETR
ATIO
N
LITH
OLO
GY
... DISTURBED OR BAG SAMPLE
140
141
142
143
144
145
146
147
148
149
150
SAMPLE10/30/2017
PROJECT NO.
NOTE: THE LOG OF SUBSURFACE CONDITIONS SHOWN HEREON APPLIES ONLY AT THE SPECIFIC BORING OR TRENCH LOCATION AND AT THE DATE INDICATED. IT IS NOT WARRANTED TO BE REPRESENTATIVE OF SUBSURFACE CONDITIONS AT OTHER LOCATIONSAND TIMES.
PROJECT NAME: E9029-04-01 Cemex Eliot - SMP 23 Reclamation

GC Very dense, dry to damp, brown, Clayey (f-c) sub-angular tosub-rounded GRAVEL with (f-c) sand
-moist, gravels (f-c) sub-rounded
-gravels angular to sub-rounded-clasts are strong to very strong metasedimentary and metavolcanicrocks including quartzite, metabasalt, chert, and quartz
-with interbedded layer of dark brown (f) sand
50/6"
50/3"
50/3"71
B4-10.5
B4-11
B4-20.3
B4-20.8
B4-30.3
B4-30.8
B4-31
DR
Y D
ENSI
TY
JP
EQUIPMENT
DRILLER
380 DATE COMPLETED
HAMMER TYPE
MO
ISTU
RE
BK81 w/ 8-inch HSA
V&W
BORING B4
CO
NTE
NT
(%)
... SAMPLING UNSUCCESSFUL
GEOCON BORING LOG E9029-04-01 BORING LOGS.GPJ 04/12/18
... CHUNK SAMPLE
GR
OU
ND
WAT
ER
SOIL
MATERIAL DESCRIPTION
DEPTHIN
NO.(USCS)
ELEV. (MSL.)
CLASSENG./GEO.
Figure A17, Log of Boring B4, page 1 of 3
Downhole-Wireline
FEET
... STANDARD PENETRATION TEST ... DRIVE SAMPLE (UNDISTURBED)
SAMPLE SYMBOLS
RES
ISTA
NC
E(B
LOW
S/FT
.)
(P.C
.F.)
... WATER TABLE OR SEEPAGE
PEN
ETR
ATIO
N
LITH
OLO
GY
... DISTURBED OR BAG SAMPLE
0
1
2
3
4
5
6
7
8
9
10
11
12
13
14
15
16
17
18
19
20
21
22
23
24
25
26
27
28
29
30
31
32
33
34
SAMPLE10/24/2017
PROJECT NO.
NOTE: THE LOG OF SUBSURFACE CONDITIONS SHOWN HEREON APPLIES ONLY AT THE SPECIFIC BORING OR TRENCH LOCATION AND AT THE DATE INDICATED. IT IS NOT WARRANTED TO BE REPRESENTATIVE OF SUBSURFACE CONDITIONS AT OTHER LOCATIONSAND TIMES.
PROJECT NAME: E9029-04-01 Cemex Eliot - SMP 23 Reclamation

CL
GW
104.6
106.5
107.4
Very stiff, moist, strong brown, CLAY
-stiff, light yellow-brown with strong brown and trace black mottling
-same
Very dense, wet, gray-brown, (f) angular to subrounded GRAVEL with(m-c) sand-clasts are quartz, chert, dark metamorphics, including metabasalt andgraywacke
21.8
23.3
20.9
27
20
39
B4-40.5
B4-41
B4-50.5
B4-51
B4-51.5
B4-60
B4-60.5
B4-61
B4-61.5D
RY
DEN
SITY
JP
EQUIPMENT
DRILLER
380 DATE COMPLETED
HAMMER TYPE
MO
ISTU
RE
BK81 w/ 8-inch HSA
V&W
BORING B4
CO
NTE
NT
(%)
... SAMPLING UNSUCCESSFUL
GEOCON BORING LOG E9029-04-01 BORING LOGS.GPJ 04/12/18
... CHUNK SAMPLE
GR
OU
ND
WAT
ER
SOIL
MATERIAL DESCRIPTION
DEPTHIN
NO.(USCS)
ELEV. (MSL.)
CLASSENG./GEO.
Figure A18, Log of Boring B4, page 2 of 3
Downhole-Wireline
FEET
... STANDARD PENETRATION TEST ... DRIVE SAMPLE (UNDISTURBED)
SAMPLE SYMBOLS
RES
ISTA
NC
E(B
LOW
S/FT
.)
(P.C
.F.)
... WATER TABLE OR SEEPAGE
PEN
ETR
ATIO
N
LITH
OLO
GY
... DISTURBED OR BAG SAMPLE
35
36
37
38
39
40
41
42
43
44
45
46
47
48
49
50
51
52
53
54
55
56
57
58
59
60
61
62
63
64
65
66
67
68
69
SAMPLE10/24/2017
PROJECT NO.
NOTE: THE LOG OF SUBSURFACE CONDITIONS SHOWN HEREON APPLIES ONLY AT THE SPECIFIC BORING OR TRENCH LOCATION AND AT THE DATE INDICATED. IT IS NOT WARRANTED TO BE REPRESENTATIVE OF SUBSURFACE CONDITIONS AT OTHER LOCATIONSAND TIMES.
PROJECT NAME: E9029-04-01 Cemex Eliot - SMP 23 Reclamation

SM
CL
-sand (f-c), with silt
-yellow-brown, gravel (f-c)-clasts are quartz, chert, metabasalt, and some weak sandstone
Medium dense, wet, brown, Silty SAND with (f) gravel
Very stiff, moist, strong brown with pale brown mottling, CLAY withtrace (m-c) sand
END OF BORING AT APPROXIMATELY 101½ FEETGROUNDWATER INITIALLY ENCOUNTERED AT 30 FEET
BACKFILLED WITH GROUT VIA TREMIE
50/6"
50/5"
50/5"
52
B4-70.5
B4-71
B4-80
B4-90
B4-100
DR
Y D
ENSI
TY
JP
EQUIPMENT
DRILLER
380 DATE COMPLETED
HAMMER TYPE
MO
ISTU
RE
BK81 w/ 8-inch HSA
V&W
BORING B4
CO
NTE
NT
(%)
... SAMPLING UNSUCCESSFUL
GEOCON BORING LOG E9029-04-01 BORING LOGS.GPJ 04/12/18
... CHUNK SAMPLE
GR
OU
ND
WAT
ER
SOIL
MATERIAL DESCRIPTION
DEPTHIN
NO.(USCS)
ELEV. (MSL.)
CLASSENG./GEO.
Figure A19, Log of Boring B4, page 3 of 3
Downhole-Wireline
FEET
... STANDARD PENETRATION TEST ... DRIVE SAMPLE (UNDISTURBED)
SAMPLE SYMBOLS
RES
ISTA
NC
E(B
LOW
S/FT
.)
(P.C
.F.)
... WATER TABLE OR SEEPAGE
PEN
ETR
ATIO
N
LITH
OLO
GY
... DISTURBED OR BAG SAMPLE
70
71
72
73
74
75
76
77
78
79
80
81
82
83
84
85
86
87
88
89
90
91
92
93
94
95
96
97
98
99
100
101
SAMPLE10/24/2017
PROJECT NO.
NOTE: THE LOG OF SUBSURFACE CONDITIONS SHOWN HEREON APPLIES ONLY AT THE SPECIFIC BORING OR TRENCH LOCATION AND AT THE DATE INDICATED. IT IS NOT WARRANTED TO BE REPRESENTATIVE OF SUBSURFACE CONDITIONS AT OTHER LOCATIONSAND TIMES.
PROJECT NAME: E9029-04-01 Cemex Eliot - SMP 23 Reclamation

CEMEX Eliot QuarryGeotechnical Characterization Report
Volume II – AppendicesPage II-3

CEMEX Eliot QuarryGeotechnical Characterization Report
Volume II – AppendicesPage II-15

CEMEX Eliot QuarryGeotechnical Characterization Report
Volume II – AppendicesPage II-17

CEMEX Eliot QuarryGeotechnical Characterization Report
Volume II – AppendicesPage II-19

CEMEX Eliot QuarryGeotechnical Characterization Report
Volume II – AppendicesPage II-21

CEMEX Eliot QuarryGeotechnical Characterization Report
Volume II – AppendicesPage II-23

CEMEX Eliot QuarryGeotechnical Characterization Report
Volume II – AppendicesPage II-25

CEMEX Eliot QuarryGeotechnical Characterization Report
Volume II – AppendicesPage II-27

CEMEX Eliot QuarryGeotechnical Characterization Report
Volume II – AppendicesPage II-29

APPENDIX B

APPENDIX B
LABORATORY TESTING PROGRAM
Laboratory tests were performed in accordance with generally accepted test methods of the ASTM or other suggested procedures. Selected soil samples were tested for their grain size distribution, plasticity characteristics, maximum dry density/optimum moisture content, shear strength parameters, and hydraulic conductivity. Laboratory test results from our current laboratory testing program and pertinent laboratory test results from previous studies are presented on the following pages.

TP1-3 (5-20') 5 31 13 18 --- 55.3
TP4A-F (0-20') 0 31 14 17 --- 54.8
TP6A-C (1.5-8') 1.5 --- 6.9
TP7-8 (3-12') 3 --- 39.1
Depth(feet)
Sheet 1 of 1
Summary of Laboratory Results
DryDensity
(pcf)
WaterContent
(%)
PlasticityIndex
PlasticLimit
LiquidLimit
%<#200SieveSample ID
MaximumSize(mm)
Project: Cemex Eliot
Location: Alameda County, California
Number: S1264-05-01
Figure: B1
Geocon Consultants3160 Gold Valley Drive, Suite 800Rancho Cordova, CA 95742Telephone: 9168529118
US
LA
B S
UM
MA
RY
GE
OT
EC
H 2
S12
64-0
5-0
1 C
EM
EX
ELI
OT
.GP
J U
S_L
AB
.GD
T 1
/23/
17

0
10
20
30
40
50
60
0 20 40 60 80 100
PreparationMethod
TP1-3 (5-20')
TP4A-F (0-20')
13
14
18
17
55.3
54.8
Unified Soil ClassificationDescription
ML
CL
MH
LiquidLimit
Plastic Limit
PlasticityIndex
Sample No.
31
31
ATTERBERG LIMITS (ASTM D4318)
CH
.
.
.
.
.
.
.
.
.
.
.
.
.
.
.
.
.
.
.
.
CL-ML
PLASTICITY
INDEX
LIQUID LIMIT
% Pass#200Sieve
dry
dry
SANDY LEAN CLAY withGRAVEL(CL)SANDY LEAN CLAY(CL)
Project: Cemex Eliot
Location: Alameda County, California
Number: S1264-05-01
Figure: B2
Geocon Consultants3160 Gold Valley Drive, Suite 800Rancho Cordova, CA 95742Telephone: 9168529118
PI C
OP
Y 2
S12
64-0
5-01
CE
ME
X E
LIO
T.G
PJ
US
_LA
B.G
DT
1/2
3/1
7

0
5
10
15
20
25
30
35
40
45
50
55
60
65
70
75
80
85
90
95
100
0.0010.010.1110100
60
fine
2003
25.7
22.9
3.2
16.8
PL
4 3 810 14
13
14
31
31
D10
41 16 20 30
U.S. SIEVE NUMBERS
18
17
1.5
Cc
40 50
%Silt %Clay
100 140
.
.
.
.
.
.
.
.
.
.
Classification
Sample No.
Sample No. LL
3/4 1/2
HYDROMETER
26.5
33.5
34.6
43.2
U.S. SIEVE OPENING IN INCHES
29.5
31.9
3.7
22.3
0.101
0.112
12.061
0.376
49.3
TP1-3 (5-20')
TP4A-F (0-20')
TP6A-C (1.5-8')
TP7-8 (3-12')
TP1-3 (5-20')
TP4A-F (0-20')
TP6A-C (1.5-8')
TP7-8 (3-12')
18.3
11.6
58.5
17.7
COBBLESGRAVEL SAND
SILT OR CLAY
1.60
GRAIN SIZE IN MILLIMETERS
PE
RC
EN
T F
INE
R B
Y W
EIG
HT
2
fine coarse medium
6
D30D100
CuPI
D60
GRAIN SIZE DISTRIBUTION (ASTM D422, D6913)
3/8
coarse
SANDY LEAN CLAY with GRAVEL(CL)
SANDY LEAN CLAY(CL)
WELL-GRADED GRAVEL with SILT CLAY and SAND (GW-GC)
SILTY, CLAYEY SAND with GRAVEL (SC-SM)
%Gravel %Sand
50
37.5
50
50
0.011
0.013
2.172
0.035
0.244
6
Project: Cemex Eliot
Location: Alameda County, California
Number: S1264-05-01
Figure: B3
Geocon Consultants, Inc.3160 Gold Valley Drive, Suite 800Rancho Cordova, CA 95742Telephone: 916-852-9118
GR
AIN
SIZ
E C
OP
Y 2
S12
64-0
5-0
1 C
EM
EX
ELI
OT
.GP
J U
S_L
AB
.GD
T 1
/23/
17

Consolidated Undrained Triaxial Compression - ICU Test ASTM D4767
Test Results, At Maximum Principal Stress Ratio Total EffectiveFriction Angle f (degrees) 18.2 31.6cohesion (psf) 235 150
Initial Conditions at Start of Test stage 1 stage 2 stage 3
Sample ID (psf), Initial Confining Pressure 1000 2000 4000Height (inch) 5.010 4.978 4.895Diameter (inch) 2.414 2.446 2.448Moisture Content (%) 11.3 -- --Dry Density (pcf) 114.4 -- --Saturation (%) 64.6 -- --
After SaturationDry Density (pcf) 111.9 -- --
After ConsolidationDry Density (pcf) 112.1 -- --
Shear Test ConditionsDry Density (pcf) 112.1 113.7 115.5Moisture Content (%) -- -- 16.7Saturation (%) -- -- 98.3Strain rate (%/hr) 1.86 1.89 1.95Cell pressure (psf) 11220 12210 14230Initial Back Pressure (psf) 10210 10210 10230Initial Effective Confining Pressure (psf) 1010 2000 4000Total Major Principal Stress At Failure (psf) 2480 4410 8180Effective Major Principal Stress At Failure (psf) 1930 3430 5890Pore Pressure At Failure (psf) 560 980 2290Effective Minor Principal Stress At Failure (psf) 450 1020 1710
Project:Location:Number:
Figure:
Boring NumberSample Number
Sample Description
TP4TP4-A-F
Rancho Cordova, California 95742Telephone: (916) 852-9118 S1264-05-01
Alameda County, CA
Geocon Consultants, Inc.3160 Gold Valley Drive, Suite 800 Cemex Eliot
Sandy Lean CLAY (CL)
B4 page 1 of 2Fax: (916) 852-9132
Triaxial Shear Strength - CU Test, ASTM D4767 with Pore Pressure Measurements (staged)
0.0
0.5
1.0
1.5
2.0
2.5
3.0
3.5
4.0
4.5
5.0
0.0 1.0 2.0 3.0 4.0 5.0 6.0 7.0 8.0 9.0 10.0
Shea
r Str
ess
(ksf
)
Normal Stress (ksf)
MOHR'S CIRCLES
Tot Load 1 Tot Load 2 Tot Load 3 Tot Fail EnvelopeEffec Load 1 Effec Load 2 Effec Load 3 Effec Fail Envelope

Geocon Consultants, Inc.3160 Gold Valley Drive, Suite 800 Project:Rancho Cordova, California 95742 Location:Telephone: (916) 852-9118 Number:Fax: (916) 852-9132 Figure: B5
CONSOLIDATED UNDRAINED TRIAXIAL COMPRESSION - ICU TEST ASTM D4767
Boring NumberSample Number
Sample Description
TP4
Triaxial Shear Strength - CU Test, ASTM D4767 with pore pressure measurements
After shear photo
TP4-A-F
Sandy Lean CLAY (CL)
Alameda County, CACemex Eliot
Page 2 of 2S1264-05-01
0.0
500.0
1000.0
1500.0
2000.0
2500.0
0 2 4 6 8 10 12 14 16 18
Indu
ced
Pore
Pre
ss, p
sf
Strain, %
PORE PRESS vs STRAIN
Stage 1
Stage 2
Stage 3
0
500
1000
1500
2000
2500
0 500 1000 1500 2000 2500 3000 3500 4000 4500
q, p
sf
p', psf
STRESS PATH
Stage 1
Stage 2
Stage 3
0
500
1000
1500
2000
2500
3000
3500
4000
4500
5000
0 2 4 6 8 10 12 14 16 18
Dev
iato
r Str
ess,
psf
Strain, %
STRESS-STRAIN
Stage 1
Stage 2
Stage 3

Test Resultsf, degrees 25.3c, psf 2550
Sample DescriptionSample Number A-FSample Depth (feet) 0Material Description
Initial Conditions at Start of StageSample ID (psf), minor principal stress 1000 2000 4000
Height (inch) 4.990 4.940 4.890Diameter (inch) 2.402 2.414 2.414Moisture Content (%) 11.8 11.8 11.8Dry Density (pcf) 116.9 116.9 116.9Saturation (%) 72.2 72.2 72.2
Shear Test ConditionsStrain Rate (%/min) 0.2937 0.3011 0.2977
Major Principal Stress at Failure (psf) 10460 12800 17940Strain at failure (%) 1.54 2.33 10.33Deviator Stress and Fail (psf) 9460 10820 13950
Project:Location:Number:
Figure:
Failure Photo
Geocon Consultants, Inc.
Rancho Cordova, California 95742
Triaxial Shear Strength - UU Test (staged)
dark yellowish brown Sandy lean CLAY
B6Fax: (916) 852-9132
3160 Gold Valley Drive, Suite 800
Telephone: (916) 852-9118 S1264-05-01Alameda County, CACemex Eliot
0.0
1.0
2.0
3.0
4.0
5.0
6.0
7.0
8.0
9.0
10.0
0.0 2.0 4.0 6.0 8.0 10.0 12.0 14.0 16.0 18.0 20.0
Shea
r Str
ess
(ksf
)
Normal Stress (ksf)
MOHR'S CIRCLES
0
2000
4000
6000
8000
10000
12000
14000
16000
0 2 4 6 8 10 12 14 16
Dev
iato
r Str
ess,
psf
Strain, %
STRESS-STRAIN

Project Name: Cemex EliotProject Number: S1264-05-01 Cell Pressure (psi) 72Beginning Test Date: 1/6/2017 In Pressure (psi) 70Ending Test Date: 1/7/2017 Out Pressure (psi) 70Sample ID: TP4-A-F Burette area (cm2) 0.872Sample Description: d. y. brn. Lean CLAY Burette Correction (cm/ml) 1.147Estimated Specific Gravity: 2.67
AVG AVG1 2 3 (inches) (cm)
Initial Height (in.) 3.000 3.000 3.000 3.00 7.62Final Height (in.) 3.069 3.062 3.049 3.06 7.77Initial Diameter (in.) 2.409 2.406 2.409 2.41 6.12Final Diameter (in.) 2.458 2.463 2.456 2.46 6.25Initial Area 4.55 29.38Initial Volume (ft3) 0.00791 Final Volume (ft3) 0.00841Initial Volume (cm3) 223.9 Final Volume (cm3) 238.1
Weight Moisture Wet Density Dry Density Void Ratio(grams) Content (%) (pcf) (pcf) (%)
Initial 459.46 11.7 128.1 114.7 0.453 69.0Final 493.07 19.9 129.3 107.8 0.545 97.3Dry 411.37
Beginning Date & Time
End Date & Time
Elapsed Time (sec.)
Burette Out (ml)
Burette In (ml)
Pressure Head (cm) Gradient
H1 (cm)
H2 (cm)
Outflow (ml)
Inflow (ml)
Outflow to Inflow
RatioPermeability
(cm/s)1/6/17 9:04 AM 23.55 1.55 - 3.3 25.2
1/6/17 9:23 AM 1,140 22.95 2.15 - 3.1 23.9 0.60 0.60 1.00 5.56E-061/6/17 9:23 AM 1,140 22.95 2.15 - 3.1 23.9
1/6/17 9:46 AM 1,380 22.25 2.90 - 2.9 22.2 0.70 0.75 0.93 5.92E-061/6/17 9:46 AM 2,520 22.25 2.90 - 2.9 22.2
1/6/17 12:23 PM 9,420 18.90 6.40 - 1.9 14.3 3.35 3.50 0.96 5.25E-061/7/17 11:08 AM 11,940 24.10 1.05 - 3.5 26.4
1/7/17 11:52 AM 2,640 22.70 2.45 - 3.0 23.2 1.40 1.40 1.00 5.55E-061/7/17 11:52 AM 14,580 22.70 2.45 - 3.0 23.2
1/7/17 12:34 PM 2,520 21.52 3.60 - 2.7 20.6 1.18 1.15 1.03 5.48E-061/7/17 12:34 PM 17,100 21.52 3.60 - 2.7 20.6
1/7/17 1:21 PM 2,820 20.40 4.72 - 2.4 18.0 1.12 1.12 1.00 5.35E-061/7/17 1:21 PM 19,920 20.40 4.72 - 2.4 18.0
1/7/17 1:58 PM 2,220 19.62 5.50 - 2.1 16.2 0.78 0.78 1.00 5.34E-0622,140
Average Permeability (cm/s): 5.36E-06Permeability @ 20OC 5.09E-06
Notes: spec remolded to 90% of ASTM D1557 at +2% optimum moisture Average temperature during test 0C = 22.2Tap water utlized as permeantTested By: M. Repking Calculated By: MR Reviewed By: JZ
Saturation
Hydraulic Conductivity(ASTM D5084)
1.00E-06
1.00E-05
1.00E-04
0 5,000 10,000 15,000 20,000 25,000
perm
eabi
lity
(cm
/sec
)
elapsed time (sec)
Permeability vs elapsed time
Figure B7

127.7 pcf Maximum dry density = 129.4 pcf
10.0 % Optimum moisture = 9.6 %
4108.1 4042.7 4101.7 4015.2
1978.3 1978.3 1978.3 1978.3
2586.2 2353.3 2411.0 2236.6
2354.5 2096.3 2223.0 2097.5
457.6 291.0 290.7 221.0
11.6 13.5 9.3 7.1
127.0 121.2 129.4 126.9
WM + WS
WM
WW + T #1
WD + T #1
TARE #1
WW + T #2
WD + T #2
TARE #2
MOISTURE
DRY DENSITY
Tested By
Preparation Method
Hammer Wt.
Hammer Drop
Number of Layers
Blows per Layer
Mold Size
Test Performed on Material
Passing Sieve
NM LL PI
Sp.G. (ASTM D 854)
%>3/8 in. %<No.200
USCS AASHTO
Date Sampled
Date Tested
ASTM 1557 Method B 2016ASTM D 4718-87 Oversize Corr. Applied to EachTest Point
10.00
18
5
25
0.03341 cu. ft.
3/8 in.
5.8
1/3/2017
VG
Reddish Brown Gravelly Clay
S1264-05-01 Cemex
BP
Staff Engineer
Test Specification:
TESTING DATA
ROCK CORRECTED TEST RESULTS UNCORRECTED Material Description
Remarks:
Project No. Client:
Project:
Sample Number: TP4-A-F Checked by:
GEOCON CONSULTANTS, INC.Title:
Figure
1Curve No.
Dry
de
nsi
ty, p
cf
110
115
120
125
130
135
Water content, %
- Rock Corrected - Uncorrected
5 7 9 11 13 15 17
9.6%, 129.4 pcf
10.0%, 127.7 pcf
ZAV SpG2.70
1 2 3 4 5 6
COMPACTION TEST REPORT
Cemex Eliot
B8

DATE:
TO: John Pfeiffer JOB NO: GEOCON Consultants, Inc. LAB LOG: 3160 Gold Valley Drive, Suite 800Rancho Cordova, CA 95742
e-mail: [email protected]
RE: Lab Report: Cemex Eliot / Project No. S1264-05-01
Enclosed are results for: Samples Received -
Code Item Quantity
2600 1
1650 31750 3
2250 13350 1
4650 1
Sincerely,
January 26, 2017
4148.0AU17.1011.00
January 16, 2017
This report shall not be reproduced except in full without written approval of Geo-Logic Associates.
Moisture Density Curve, Mod. 4" - ASTM D-1557
at 1-530-272-2448. This testing is based upon accepted industry practice as well as the test
Bulk Sample Preparation & Processing, per hr. -
to working with you again. If you have any questions or require any additional information, please call us
Direct Shear CD / pt., 2.5 - 4" - ASTM D-3080
Technical DirectorLaboratory ManagerReviewed By: Kenneth R. CrileyPrepared By: Kindra Hillman
method listed. These results apply only to the samples supplied and tested for the above referenced job.
Large Box, 12" x 12" add / pt -
Hydraulic Conductivity-Flex-wall, 2-4" - ASTM D-5084
Thank you for consulting Geo-Logic Associates for your material testing requirements. We look forward
Remold fee, 2-3" dia -
Geo‐Logic Associates143E Spring Hill DriveGrass Valley, CA 95945USAT+1 530 272 2448F+1 530 272 8533www.geo‐logic.com
LT-1-AF (rev.2-10-04)

MOISTURE / DENSITY RELATIONSHIPS Test Report
ASTM D - 1557
Client: Project No.: Lab Log No.:
GEOCON Consultants, Inc. AU17.1011.00Project Name: Report Date:
Cemex Eliot/ Project No. S1264-05-01
LabNo.
pcf kg / m3
Corrected Values For Oversized Particles, per ASTM D-4718
4148A with 22.9 Percent +#4 Gravel, the maximum Dry Density = 139.9 6.5
Note: The test was conducted as method A with 0 percent retained on the no. 4 sieve ( minus #4)
This testing is based upon accepted industry practice as well as the test method listed. These results apply only to the samplesupplied and tested for the above referenced job
L:Labexcel \ FORMS \ GLA Forms \ Reports \ AU17.1011.00 \ 4148A-cmp.xls Print Date: Entered By: Reviewed By: LSN:
DCN: CMP-rp (rev. 5/21/09) Print Date : 1/26/2017 1/26/2017 JL KH 4148A
2134Brown Sandy Silty, Clay with Gravel 8.5
January 19, 2017
4148A
Optimum Water Content
4148A TP 7/8 (3-12) 133.2
%
Description Maximum Dry Density
Sample Identification
Sym
bol
110
112
114
116
118
120
122
124
126
128
130
132
134
136
138
140
0 2 4 6 8 10 12 14 16 18 20 22 24 26 28 30 32 34 36 38 40
Dry
Den
sity
, pc
f
Water Content, %
100 % Saturation Curve, Specific Gravity app. 2.7

LARGE SCALE DIRECT SHEAR REPORTInternal Shear D-3080 Modified
Report Date:
Client / Project Name: GEOCON CONSULTANTS, INC. / CEMEX ELIOT / PROJECT NO. S1264-05-01 Project No:
Superstrate: SpacersMaterial 1: TP 7/8 (3-12) Sandy Silty Clay w/ Gravel LSN: 4148A RemoldedMaterial 2: TP 7/8 (3-12) Sandy Silty Clay w/ Gravel LSN: 4148A RemoldedSubstrate: Spacers
Shear Secant Stress Friction
psf psf Angle1000 620 32
2000 930 25
4000 1860 25
Adhesion: 160 psf
Friction Angle: 23 degrees
NOTE: GRAPH NOT TO SCALE
Shear Secant Stress Friction
psf psf Angle1000 620 32
2000 920 25
4000 1800 24
Adhesion: 180 psf
Friction Angle: 22 degrees
NOTE: GRAPH NOT TO SCALE
This testing is based upon accepted industry practice as well as the test method listed. These results apply only to the samples
supplied and tested for the above referenced job.L:Labexcel \Projects \ Client \ Name \ AU17.1011.00 \ 4148A-LSDS-rp Print Date: Entered By: Reviewed By: Lab Log:
DCN: LSDS-rp (rev., 11/29/12) 01/24/17 KH krc 4148A
Coefficient of Friction:
NormalStress
TestPoint
1.
27.8
0.4
January 24, 2017
psi
STRENGTH ENVELOPE
Test
0.42
2.
6.9
Coefficient of Friction:
6.9
3.
1.
Point Stress
13.9
(at 3.0 in. displacement)
3.
Normal
27.8
AU17.1011.00
psi
2.
PEAK STRENGTH
13.9
0
1000
2000
3000
4000
5000
0 1000 2000 3000 4000 5000 6000
SH
EA
R S
TRE
SS
(psf
)
NORMAL STRESS (psf)
0
1000
2000
3000
4000
5000
0 1000 2000 3000 4000 5000 6000
SH
EA
R S
TRE
SS
(psf
)
NORMAL STRESS (psf)
Page 1 of 2

LARGE SCALE DIRECT SHEAR REPORTInternal Shear D-3080 Modified
Report Date:
Client / Project Name: GEOCON CONSULTANTS, INC. / CEMEX ELIOT / PROJECT NO. S1264-05-01 Project No:
Superstrate: SpacersMaterial 1: TP 7/8 (3-12) Sandy Silty Clay w/ Gravel LSN: 4148A RemoldedMaterial 2: TP 7/8 (3-12) Sandy Silty Clay w/ Gravel LSN: 4148A RemoldedSubstrate: Spacers DISPLACEMENT vs. SHEAR STRESS
psf1000
2000
4000
MOISTURE DATA:
3) 11.5
STANDARD CONDITIONS: SHEAR DISPLACEMENT RATE: 0.04 in/min1. The "gap" between shear boxes was set at 0.5 inches.2. The test specimens were flooded during testing unless otherwise noted.3. High Normal Stresses, >5psi (35 kPa) was applied using air pressure.4. Low Normal Stresses, <5psi (35 kPa) was applied using dead weights.5. The tests were terminated after 3.0"(75 mm) of displacement unless otherwise noted.6. Tests were performed in general accordance with ASTM procedure D-3080 - Modified using a Brainard-Killman LG-112 direct shear machine
with an effective area of 12" x 12" (300 x300 mm).
TEST ORIENTATION:
SOIL
Asperity Height: in. BOTTOM BOX W/ SPACERS & DRAINAGE Asperity Height: in.
SPECIAL TEST NOTES:1. The test method was modified to measure the internal shear characteristics of the soill.2. The soil was remolded into both the upper and lower box to the specified dry density and water content.3. Each test point was consolidated under specified normal stress for approximately 24 hours, then sheared.4. The test was performed in a "wet" or "flooded" condition.5. Shearing occurred internally within the soil.6. The Friction Angle and Adhesion (or Cohesion) results given here are based on a mathematically determined best fit line.7. Further interpretation should be conducted by a qualified professional experienced in geosynthetic and geotechnical engineering.
This testing is based upon accepted industry practice as well as the test method listed. These results apply only to the samples
supplied and tested for the above referenced job.L:Labexcel \Projects \ Client \ Name \ AU17.1011.00 \ 4148A-LSDS-rp Print Date: Entered By: Reviewed By: LLN:
01/24/17 KH krc 4148A
Normal
DCN: LSDS-rp (rev., 11/29/12)
(Soil)
27.8
2) 11.8
Initial Dry Density:
TOP BOX w/ SPACERS & DRAINAGE GRAVEL
NORMAL STRESS
psi
Final Water Content:(%)1) 11.3
125.9 pcf
6.5%Initial Water Content:
Point
13.9
1.
2.
3.
6.9
StressTest
January 24, 2017AU17.1011.00
0
500
1000
1500
2000
2500
3000
0.0 0.5 1.0 1.5 2.0 2.5 3.0
SH
EA
R S
TRE
SS
(psf
)
HORIZONTAL DISPLACEMENT (inches)
CLAMP
Page 2 of 2

HYDRAULIC CONDUCTIVITYREPORT
Project No: Lab Sample Number:
GEOCON Consultants, Inc. / Cemex Eliot / Project No. S1264-05-01Sample ID: Description: Report Date:
TP7/8 (3-12) Brown Sandy Silty Clay w/ Gravel
SPECIMEN DATA TEST DATA SAMPLE ID: ASTM D-5084, Method C
DESCRIPTION: EFFECTIVE STRESS: 2 psiINITIAL FINAL GRADIENT RANGE: 4 - 6
IN / OUT RATIO: 1.00HEIGHT, in. 3.1 3.0 "B" PARAMETER: 0.97DIAMETER, in. 2.9 2.9WATER CONTENT, % 6.0 15.0 HYDRAULIC
DRY DENSITY, pcf 123 118 TRIAL TIME CONDUCTIVITY, k 20
SATURATION, % 44 95 nos. hrs. cm / s
(Specific Gravity assumed as 2.7 ) 1 5.0E-06MAXIMUM DRY DENSITY, pcf 2 4.3E-06OPTIMUM WATER CONTENT, % 3 4.5E-06SPECIFIED COMPACTION, % 4 4.3E-06ACHIEVED COMPACTION, % 5 4.0E-06
COMMENTS:
Tap water used as permeant. AVERAGE LAST 4 :
corrected to 20 ° C
This testing is based upon accepted industry practice as well as the test method listed. These results apply only to the samplessupplied and tested for the above referenced job.
L : Labexcel \PROJECTS \ GEOCON Consultants \ 4148A-txk Print Date: Entered By: Reviewed By: LSN:
DCN: TXK-QC-GRAPH (rev. 11/20/12)KH krc 4148A01/26/17
48.9
48.5
Brown Sandy Silty Clay w/ Gravel
4.3E-06
AU17.1011.00 4148A
48.4
TP7/8 (3-12)
90.0
Client / Project Name:
88.2
January 26, 2017
48.8
48.2
6.5139.9
1.E-07
1.E-06
1.E-05
1.E-04
48.1 48.2 48.3 48.4 48.5 48.6 48.7 48.8 48.9 49.0
Hyd
raul
ic C
ondu
ctiv
ity, k
cm
/sec
Time, Hrs
Hydraulic Conductivity vs Time

CEMEX Eliot QuarryGeotechnical Characterization Report
Volume II – AppendicesPage II-47
APPENDIX B
MATERIAL PROPERTIES

CEMEX Eliot QuarryGeotechnical Characterization Report
Volume II – AppendicesPage II-49

CEMEX Eliot QuarryGeotechnical Characterization Report
Volume II – AppendicesPage II-51

CEMEX Eliot QuarryGeotechnical Characterization Report
Volume II – AppendicesPage II-53

CEMEX Eliot QuarryGeotechnical Characterization Report
Volume II – AppendicesPage II-55

CEMEX Eliot QuarryGeotechnical Characterization Report
Volume II – AppendicesPage II-57

CEMEX Eliot QuarryGeotechnical Characterization Report
Volume II – AppendicesPage II-59

LOCATION: B-1 at 32 feet
SAMPLE: CLAYEY SAND with GRAVEL, brown
TEST TYPE: Consolidated Drained SPECIMEN A B C
DRY DENSITY (psf) 127.1 123.7 123.4
RATE OF SHEAR (in/min): 0.00099 INITIAL WATER CONTENT (%) 10.1 10.1 10.1
FINAL WATER CONTENT (%) 11 13.7 11
FRICTION ANGLE: 27 NORMAL STRESS (psf) 1000 3000 5000
MAXIMUM SHEAR (psf) 1785 2373 3819
COHESION (psf): 1,100
0
1000
2000
3000
4000
5000
6000
7000
0 1000 2000 3000 4000 5000 6000 7000
SH
EA
R S
TR
ES
S (
psf
)
NORMAL STRESS (psf)
DIRECT SHEAR TEST
JOB
NU
MB
ER
: 3415.7
00
D
AT
E:6
-5-1
2
B
Y:
CC
B-3

LOCATION: B-1 at 37 feet
SAMPLE: CLAYEY SAND with GRAVEL, red-brown
TEST TYPE: Consolidated Drained SPECIMEN A B C
DRY DENSITY (psf) 125.8 113.8 122.3
RATE OF SHEAR (in/min): 0.00099 INITIAL WATER CONTENT (%) 9.2 9.2 9.2
FINAL WATER CONTENT (%) 11.4 11 10.4
FRICTION ANGLE: 37 NORMAL STRESS (psf) 2500 4500 7000
MAXIMUM SHEAR (psf) 1969 3353 5354
COHESION (psf): 40
0
1000
2000
3000
4000
5000
6000
7000
0 1000 2000 3000 4000 5000 6000 7000
SH
EA
R S
TR
ES
S (
psf
)
NORMAL STRESS (psf)
DIRECT SHEAR TEST
JOB
NU
MB
ER
: 3415.7
00
D
AT
E:6
-5-1
2
B
Y:
CC
B-4

APPENDIX C

APPENDIX C
SLOPE STABILITY ANALYSES
We used the computer program SLOPE/W Version 7.22 distributed by Geo-Slope International to perform slope stability analyses. SLOPE/W uses conventional slope stability equations and a two-dimensional limit-equilibrium method to calculate the factor of safety against failure. For our analyses, the Bishop’s and/or Spencer’s Method with a circular failure mechanism were used. The computer program searches for the critical failure surface based on user-provided input parameters. For a circular failure search, a linear search of entry and exit locations is specified and the computer searches for the critical failure slip surface. Graphical representations of the slope stability analyses, potential critical failure surfaces, and parameters used for each analysis are presented on the following pages.

2.013
Case T-1 with 2.25:1 Slope - SHALLOW
A)
B)
C)
Name: Fill - Clay Model: Mohr-Coulomb Unit Weight: 125 pcfCohesion: 160 psfPhi: 23 °
Name: Lean Clay Model: Mohr-Coulomb Unit Weight: 125 pcfCohesion: 1400 psfPhi: 24 °
Name: Sand and Gravel Model: Mohr-Coulomb Unit Weight: 134 pcfCohesion: 200 psfPhi: 45 °
AA
B
B
C C
C
C
Distance (x 1000)0.00 0.03 0.06 0.09 0.12 0.15 0.18 0.21 0.24 0.27 0.30 0.33 0.36 0.39 0.42 0.45 0.48 0.51 0.54 0.57 0.60 0.63 0.66 0.69 0.72 0.75 0.78 0.81 0.84 0.87 0.90 0.93 0.96 0.99 1.02 1.05
100
110
120
130
140
150
160
170
180
190
200
210
220
230
240
250
260
270
280
290
300
310
320
330
340
350
360
370
380
390
400
410
420
430
440
450
460
470
480
490
500
510
520
530
540
550
560
570
580
590
600
Elev
atio
n
100
110
120
130
140
150
160
170
180
190
200
210
220
230
240
250
260
270
280
290
300
310
320
330
340
350
360
370
380
390
400
410
420
430
440
450
460
470
480
490
500
510
520
530
540
550
560
570
580
590
600

1.277
Case T-1 with 2.25:1 Slope, Seismic Coefficient = 0.21g - SHALLOW/SEISMIC
A)
B)
C)
Name: Fill - Clay Model: Mohr-Coulomb Unit Weight: 125 pcfCohesion: 160 psfPhi: 23 °
Name: Lean Clay Model: Mohr-Coulomb Unit Weight: 125 pcfCohesion: 1400 psfPhi: 24 °
Name: Sand and Gravel Model: Mohr-Coulomb Unit Weight: 134 pcfCohesion: 200 psfPhi: 45 °
AA
B
B
C C
C
C
Distance (x 1000)0.00 0.03 0.06 0.09 0.12 0.15 0.18 0.21 0.24 0.27 0.30 0.33 0.36 0.39 0.42 0.45 0.48 0.51 0.54 0.57 0.60 0.63 0.66 0.69 0.72 0.75 0.78 0.81 0.84 0.87 0.90 0.93 0.96 0.99 1.02 1.05
100
110
120
130
140
150
160
170
180
190
200
210
220
230
240
250
260
270
280
290
300
310
320
330
340
350
360
370
380
390
400
410
420
430
440
450
460
470
480
490
500
510
520
530
540
550
560
570
580
590
600
Elev
atio
n
100
110
120
130
140
150
160
170
180
190
200
210
220
230
240
250
260
270
280
290
300
310
320
330
340
350
360
370
380
390
400
410
420
430
440
450
460
470
480
490
500
510
520
530
540
550
560
570
580
590
600

1.513
Case T-1 with 2.25:1 Slope - DEEP SEATED
A)
B)
C)
Name: Fill - Clay Model: Mohr-Coulomb Unit Weight: 125 pcfCohesion: 160 psfPhi: 23 °
Name: Lean Clay Model: Mohr-Coulomb Unit Weight: 125 pcfCohesion: 1400 psfPhi: 24 °
Name: Sand and Gravel Model: Mohr-Coulomb Unit Weight: 134 pcfCohesion: 200 psfPhi: 45 °
AA
B
B
C C
C
C
Distance (x 1000)0.00 0.03 0.06 0.09 0.12 0.15 0.18 0.21 0.24 0.27 0.30 0.33 0.36 0.39 0.42 0.45 0.48 0.51 0.54 0.57 0.60 0.63 0.66 0.69 0.72 0.75 0.78 0.81 0.84 0.87 0.90 0.93 0.96 0.99 1.02 1.05
100
110
120
130
140
150
160
170
180
190
200
210
220
230
240
250
260
270
280
290
300
310
320
330
340
350
360
370
380
390
400
410
420
430
440
450
460
470
480
490
500
510
520
530
540
550
560
570
580
590
600
Elev
atio
n
100
110
120
130
140
150
160
170
180
190
200
210
220
230
240
250
260
270
280
290
300
310
320
330
340
350
360
370
380
390
400
410
420
430
440
450
460
470
480
490
500
510
520
530
540
550
560
570
580
590
600

0.958
Case T-1 with 2.25:1 Slope, Seismic Coefficient = 0.21g - DEEP SEATED/SEISMIC
A)
B)
C)
Name: Fill - Clay Model: Mohr-Coulomb Unit Weight: 125 pcfCohesion: 160 psfPhi: 23 °
Name: Lean Clay Model: Mohr-Coulomb Unit Weight: 125 pcfCohesion: 1400 psfPhi: 24 °
Name: Sand and Gravel Model: Mohr-Coulomb Unit Weight: 134 pcfCohesion: 200 psfPhi: 45 °
AA
B
B
C C
C
C
Distance (x 1000)0.00 0.03 0.06 0.09 0.12 0.15 0.18 0.21 0.24 0.27 0.30 0.33 0.36 0.39 0.42 0.45 0.48 0.51 0.54 0.57 0.60 0.63 0.66 0.69 0.72 0.75 0.78 0.81 0.84 0.87 0.90 0.93 0.96 0.99 1.02 1.05
100
110
120
130
140
150
160
170
180
190
200
210
220
230
240
250
260
270
280
290
300
310
320
330
340
350
360
370
380
390
400
410
420
430
440
450
460
470
480
490
500
510
520
530
540
550
560
570
580
590
600
Elev
atio
n
100
110
120
130
140
150
160
170
180
190
200
210
220
230
240
250
260
270
280
290
300
310
320
330
340
350
360
370
380
390
400
410
420
430
440
450
460
470
480
490
500
510
520
530
540
550
560
570
580
590
600

2.016
Case T-2 with 2.25:1 Slope - SHALLOW
A)
B)
C)
Name: Fill - Clay Model: Mohr-Coulomb Unit Weight: 125 pcfCohesion: 160 psfPhi: 23 °
Name: Lean Clay Model: Mohr-Coulomb Unit Weight: 125 pcfCohesion: 1400 psfPhi: 24 °
Name: Sand and Gravel Model: Mohr-Coulomb Unit Weight: 134 pcfCohesion: 200 psfPhi: 45 °
A
A
B
B
C C
C
C
Distance (x 1000)0.00 0.03 0.06 0.09 0.12 0.15 0.18 0.21 0.24 0.27 0.30 0.33 0.36 0.39 0.42 0.45 0.48 0.51 0.54 0.57 0.60 0.63 0.66 0.69 0.72 0.75 0.78 0.81 0.84 0.87 0.90 0.93 0.96 0.99 1.02 1.05
100
110
120
130
140
150
160
170
180
190
200
210
220
230
240
250
260
270
280
290
300
310
320
330
340
350
360
370
380
390
400
410
420
430
440
450
460
470
480
490
500
510
520
530
540
550
560
570
580
590
600
Elev
atio
n
100
110
120
130
140
150
160
170
180
190
200
210
220
230
240
250
260
270
280
290
300
310
320
330
340
350
360
370
380
390
400
410
420
430
440
450
460
470
480
490
500
510
520
530
540
550
560
570
580
590
600

1.287
Case T-2 with 2.25:1 Slope, Seismic Coefficient = 0.21g - SHALLOW/SEISMIC
A)
B)
C)
Name: Fill - Clay Model: Mohr-Coulomb Unit Weight: 125 pcfCohesion: 160 psfPhi: 23 °
Name: Lean Clay Model: Mohr-Coulomb Unit Weight: 125 pcfCohesion: 1400 psfPhi: 24 °
Name: Sand and Gravel Model: Mohr-Coulomb Unit Weight: 134 pcfCohesion: 200 psfPhi: 45 °
A
A
B
B
C C
C
C
Distance (x 1000)0.00 0.03 0.06 0.09 0.12 0.15 0.18 0.21 0.24 0.27 0.30 0.33 0.36 0.39 0.42 0.45 0.48 0.51 0.54 0.57 0.60 0.63 0.66 0.69 0.72 0.75 0.78 0.81 0.84 0.87 0.90 0.93 0.96 0.99 1.02 1.05
100
110
120
130
140
150
160
170
180
190
200
210
220
230
240
250
260
270
280
290
300
310
320
330
340
350
360
370
380
390
400
410
420
430
440
450
460
470
480
490
500
510
520
530
540
550
560
570
580
590
600
Elev
atio
n
100
110
120
130
140
150
160
170
180
190
200
210
220
230
240
250
260
270
280
290
300
310
320
330
340
350
360
370
380
390
400
410
420
430
440
450
460
470
480
490
500
510
520
530
540
550
560
570
580
590
600

1.603
Case T-2 with 2.25:1 Slope - DEEP SEATED
A)
B)
C)
Name: Fill - Clay Model: Mohr-Coulomb Unit Weight: 125 pcfCohesion: 160 psfPhi: 23 °
Name: Lean Clay Model: Mohr-Coulomb Unit Weight: 125 pcfCohesion: 1400 psfPhi: 24 °
Name: Sand and Gravel Model: Mohr-Coulomb Unit Weight: 134 pcfCohesion: 200 psfPhi: 45 °
A
A
B
B
C C
C
C
Distance (x 1000)0.00 0.03 0.06 0.09 0.12 0.15 0.18 0.21 0.24 0.27 0.30 0.33 0.36 0.39 0.42 0.45 0.48 0.51 0.54 0.57 0.60 0.63 0.66 0.69 0.72 0.75 0.78 0.81 0.84 0.87 0.90 0.93 0.96 0.99 1.02 1.05
100110120130140150160170180190200210220230240250260270280290300310320330340350360370380390400410420430440450460470480490500510520530540550560570580590600
Elev
atio
n
100110120130140150160170180190200210220230240250260270280290300310320330340350360370380390400410420430440450460470480490500510520530540550560570580590600

0.981
Case T-2 with 2.25:1 Slope, Seismic Coefficient = 0.21g - DEEP SEATED/SEISMIC
A)
B)
C)
Name: Fill - Clay Model: Mohr-Coulomb Unit Weight: 125 pcfCohesion: 160 psfPhi: 23 °
Name: Lean Clay Model: Mohr-Coulomb Unit Weight: 125 pcfCohesion: 1400 psfPhi: 24 °
Name: Sand and Gravel Model: Mohr-Coulomb Unit Weight: 134 pcfCohesion: 200 psfPhi: 45 °
A
A
B
B
C C
C
C
Distance (x 1000)0.00 0.03 0.06 0.09 0.12 0.15 0.18 0.21 0.24 0.27 0.30 0.33 0.36 0.39 0.42 0.45 0.48 0.51 0.54 0.57 0.60 0.63 0.66 0.69 0.72 0.75 0.78 0.81 0.84 0.87 0.90 0.93 0.96 0.99 1.02 1.05
100
110
120
130
140
150
160
170
180
190
200
210
220
230
240
250
260
270
280
290
300
310
320
330
340
350
360
370
380
390
400
410
420
430
440
450
460
470
480
490
500
510
520
530
540
550
560
570
580
590
600
Elev
atio
n
100
110
120
130
140
150
160
170
180
190
200
210
220
230
240
250
260
270
280
290
300
310
320
330
340
350
360
370
380
390
400
410
420
430
440
450
460
470
480
490
500
510
520
530
540
550
560
570
580
590
600

2.020
Case T-3 with 2.25:1 Slope - SHALLOW
A)
B)
C)
Name: Fill - Clay Model: Mohr-Coulomb Unit Weight: 125 pcfCohesion: 160 psfPhi: 23 °
Name: Lean Clay Model: Mohr-Coulomb Unit Weight: 125 pcfCohesion: 1400 psfPhi: 24 °
Name: Sand and Gravel Model: Mohr-Coulomb Unit Weight: 134 pcfCohesion: 200 psfPhi: 45 °
A
A
B
B
CC
C
C
Distance (x 1000)0.00 0.03 0.06 0.09 0.12 0.15 0.18 0.21 0.24 0.27 0.30 0.33 0.36 0.39 0.42 0.45 0.48 0.51 0.54 0.57 0.60 0.63 0.66 0.69 0.72 0.75 0.78 0.81 0.84 0.87 0.90 0.93 0.96 0.99 1.02 1.05
100
110
120
130
140
150
160
170
180
190
200
210
220
230
240
250
260
270
280
290
300
310
320
330
340
350
360
370
380
390
400
410
420
430
440
450
460
470
480
490
500
510
520
530
540
550
560
570
580
590
600
Elev
atio
n
100
110
120
130
140
150
160
170
180
190
200
210
220
230
240
250
260
270
280
290
300
310
320
330
340
350
360
370
380
390
400
410
420
430
440
450
460
470
480
490
500
510
520
530
540
550
560
570
580
590
600

1.245
Case T-3 with 2.25:1 Slope, Seismic Coefficient = 0.21g - SHALLOW/SEISMIC
A)
B)
C)
Name: Fill - Clay Model: Mohr-Coulomb Unit Weight: 125 pcfCohesion: 160 psfPhi: 23 °
Name: Lean Clay Model: Mohr-Coulomb Unit Weight: 125 pcfCohesion: 1400 psfPhi: 24 °
Name: Sand and Gravel Model: Mohr-Coulomb Unit Weight: 134 pcfCohesion: 200 psfPhi: 45 °
A
A
B
B
CC
C
C
Distance (x 1000)0.00 0.03 0.06 0.09 0.12 0.15 0.18 0.21 0.24 0.27 0.30 0.33 0.36 0.39 0.42 0.45 0.48 0.51 0.54 0.57 0.60 0.63 0.66 0.69 0.72 0.75 0.78 0.81 0.84 0.87 0.90 0.93 0.96 0.99 1.02 1.05
100
110
120
130
140
150
160
170
180
190
200
210
220
230
240
250
260
270
280
290
300
310
320
330
340
350
360
370
380
390
400
410
420
430
440
450
460
470
480
490
500
510
520
530
540
550
560
570
580
590
600
Elev
atio
n
100
110
120
130
140
150
160
170
180
190
200
210
220
230
240
250
260
270
280
290
300
310
320
330
340
350
360
370
380
390
400
410
420
430
440
450
460
470
480
490
500
510
520
530
540
550
560
570
580
590
600

1.617
Case T-3 with 2.25:1 Slope - DEEP SEATED
A)
B)
C)
Name: Fill - Clay Model: Mohr-Coulomb Unit Weight: 125 pcfCohesion: 160 psfPhi: 23 °
Name: Lean Clay Model: Mohr-Coulomb Unit Weight: 125 pcfCohesion: 1400 psfPhi: 24 °
Name: Sand and Gravel Model: Mohr-Coulomb Unit Weight: 134 pcfCohesion: 200 psfPhi: 45 °
A
A
B
B
CC
C
C
Distance (x 1000)0.00 0.03 0.06 0.09 0.12 0.15 0.18 0.21 0.24 0.27 0.30 0.33 0.36 0.39 0.42 0.45 0.48 0.51 0.54 0.57 0.60 0.63 0.66 0.69 0.72 0.75 0.78 0.81 0.84 0.87 0.90 0.93 0.96 0.99 1.02 1.05
100
110
120
130
140
150
160
170
180
190
200
210
220
230
240
250
260
270
280
290
300
310
320
330
340
350
360
370
380
390
400
410
420
430
440
450
460
470
480
490
500
510
520
530
540
550
560
570
580
590
600
Elev
atio
n
100
110
120
130
140
150
160
170
180
190
200
210
220
230
240
250
260
270
280
290
300
310
320
330
340
350
360
370
380
390
400
410
420
430
440
450
460
470
480
490
500
510
520
530
540
550
560
570
580
590
600

0.989
Case T-3 with 2.25:1 Slope, Seismic Coefficient = 0.21g - DEEP SEATED/SEISMIC
A)
B)
C)
Name: Fill - Clay Model: Mohr-Coulomb Unit Weight: 125 pcfCohesion: 160 psfPhi: 23 °
Name: Lean Clay Model: Mohr-Coulomb Unit Weight: 125 pcfCohesion: 1400 psfPhi: 24 °
Name: Sand and Gravel Model: Mohr-Coulomb Unit Weight: 134 pcfCohesion: 200 psfPhi: 45 °
A
A
B
B
CC
C
C
Distance (x 1000)0.00 0.03 0.06 0.09 0.12 0.15 0.18 0.21 0.24 0.27 0.30 0.33 0.36 0.39 0.42 0.45 0.48 0.51 0.54 0.57 0.60 0.63 0.66 0.69 0.72 0.75 0.78 0.81 0.84 0.87 0.90 0.93 0.96 0.99 1.02 1.05
100
110
120
130
140
150
160
170
180
190
200
210
220
230
240
250
260
270
280
290
300
310
320
330
340
350
360
370
380
390
400
410
420
430
440
450
460
470
480
490
500
510
520
530
540
550
560
570
580
590
600
Elev
atio
n
100
110
120
130
140
150
160
170
180
190
200
210
220
230
240
250
260
270
280
290
300
310
320
330
340
350
360
370
380
390
400
410
420
430
440
450
460
470
480
490
500
510
520
530
540
550
560
570
580
590
600

1.814
Case T-1 with 40' Mid-Bench and 2:1 Slopes - SHALLOW
A)
B)
C)
Name: Fill - Clay Model: Mohr-Coulomb Unit Weight: 125 pcfCohesion: 160 psfPhi: 23 °
Name: Lean Clay Model: Mohr-Coulomb Unit Weight: 125 pcfCohesion: 1400 psfPhi: 24 °
Name: Sand and Gravel Model: Mohr-Coulomb Unit Weight: 134 pcfCohesion: 200 psfPhi: 45 °
AA
B
B
C C
C
C
Distance (x 1000)0.00 0.03 0.06 0.09 0.12 0.15 0.18 0.21 0.24 0.27 0.30 0.33 0.36 0.39 0.42 0.45 0.48 0.51 0.54 0.57 0.60 0.63 0.66 0.69 0.72 0.75 0.78 0.81 0.84 0.87 0.90 0.93 0.96 0.99 1.02 1.05
100110120130140150160170180190200210220230240250260270280290300310320330340350360370380390400410420430440450460470480490500510520530540550560570580590600
Elev
atio
n
100110120130140150160170180190200210220230240250260270280290300310320330340350360370380390400410420430440450460470480490500510520530540550560570580590600
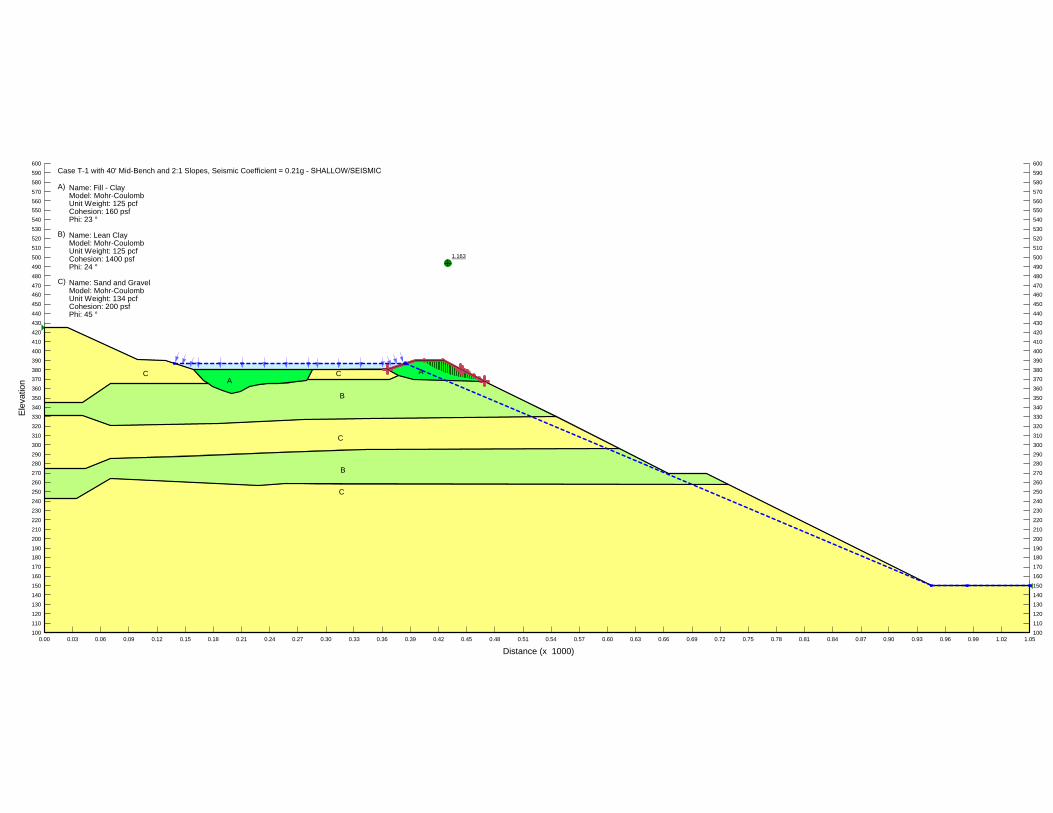
1.163
Case T-1 with 40' Mid-Bench and 2:1 Slopes, Seismic Coefficient = 0.21g - SHALLOW/SEISMIC
A)
B)
C)
Name: Fill - Clay Model: Mohr-Coulomb Unit Weight: 125 pcfCohesion: 160 psfPhi: 23 °
Name: Lean Clay Model: Mohr-Coulomb Unit Weight: 125 pcfCohesion: 1400 psfPhi: 24 °
Name: Sand and Gravel Model: Mohr-Coulomb Unit Weight: 134 pcfCohesion: 200 psfPhi: 45 °
AA
B
B
C C
C
C
Distance (x 1000)0.00 0.03 0.06 0.09 0.12 0.15 0.18 0.21 0.24 0.27 0.30 0.33 0.36 0.39 0.42 0.45 0.48 0.51 0.54 0.57 0.60 0.63 0.66 0.69 0.72 0.75 0.78 0.81 0.84 0.87 0.90 0.93 0.96 0.99 1.02 1.05
100110120130140150160170180190200210220230240250260270280290300310320330340350360370380390400410420430440450460470480490500510520530540550560570580590600
Elev
atio
n
100110120130140150160170180190200210220230240250260270280290300310320330340350360370380390400410420430440450460470480490500510520530540550560570580590600

1.513
Case T-1 with 40' Mid-Bench and 2:1 Slopes - DEEP SEATED
A)
B)
C)
Name: Fill - Clay Model: Mohr-Coulomb Unit Weight: 125 pcfCohesion: 160 psfPhi: 23 °
Name: Lean Clay Model: Mohr-Coulomb Unit Weight: 130 pcfCohesion: 200 psfPhi: 34 °
Name: Sand and Gravel Model: Mohr-Coulomb Unit Weight: 140 pcfCohesion: 200 psfPhi: 45 °
AA
B
B
C C
C
C
Distance (x 1000)0.00 0.03 0.06 0.09 0.12 0.15 0.18 0.21 0.24 0.27 0.30 0.33 0.36 0.39 0.42 0.45 0.48 0.51 0.54 0.57 0.60 0.63 0.66 0.69 0.72 0.75 0.78 0.81 0.84 0.87 0.90 0.93 0.96 0.99 1.02 1.05
100110120130140150160170180190200210220230240250260270280290300310320330340350360370380390400410420430440450460470480490500510520530540550560570580590600
Elev
atio
n
100110120130140150160170180190200210220230240250260270280290300310320330340350360370380390400410420430440450460470480490500510520530540550560570580590600

0.951
Case T-1 with 40' Mid-Bench and 2:1 Slopes, Seismic-Coefficient = 0.21g - DEEP SEATED/SEISMIC
A)
B)
C)
Name: Fill - Clay Model: Mohr-Coulomb Unit Weight: 125 pcfCohesion: 160 psfPhi: 23 °
Name: Lean Clay Model: Mohr-Coulomb Unit Weight: 125 pcfCohesion: 1400 psfPhi: 24 °
Name: Sand and Gravel Model: Mohr-Coulomb Unit Weight: 134 pcfCohesion: 200 psfPhi: 45 °
AA
B
B
C C
C
C
Distance (x 1000)0.00 0.03 0.06 0.09 0.12 0.15 0.18 0.21 0.24 0.27 0.30 0.33 0.36 0.39 0.42 0.45 0.48 0.51 0.54 0.57 0.60 0.63 0.66 0.69 0.72 0.75 0.78 0.81 0.84 0.87 0.90 0.93 0.96 0.99 1.02 1.05
100110120130140150160170180190200210220230240250260270280290300310320330340350360370380390400410420430440450460470480490500510520530540550560570580590600
Elev
atio
n
100110120130140150160170180190200210220230240250260270280290300310320330340350360370380390400410420430440450460470480490500510520530540550560570580590600

1.780
Case T-2 with 40' Mid-Bench and 2:1 Slopes - SHALLOW
A)
B)
C)
Name: Fill - Clay Model: Mohr-Coulomb Unit Weight: 125 pcfCohesion: 160 psfPhi: 23 °
Name: Lean Clay Model: Mohr-Coulomb Unit Weight: 125 pcfCohesion: 1400 psfPhi: 24 °
Name: Sand and Gravel Model: Mohr-Coulomb Unit Weight: 134 pcfCohesion: 200 psfPhi: 45 °
A
A
B
B
C C
C
C
Distance (x 1000)0.00 0.03 0.06 0.09 0.12 0.15 0.18 0.21 0.24 0.27 0.30 0.33 0.36 0.39 0.42 0.45 0.48 0.51 0.54 0.57 0.60 0.63 0.66 0.69 0.72 0.75 0.78 0.81 0.84 0.87 0.90 0.93 0.96 0.99 1.02 1.05
100110120130140150160170180190200210220230240250260270280290300310320330340350360370380390400410420430440450460470480490500510520530540550560570580590600
Elev
atio
n
100110120130140150160170180190200210220230240250260270280290300310320330340350360370380390400410420430440450460470480490500510520530540550560570580590600

1.179
Case T-2 with 40' Mid-Bench and 2:1 Slopes, Seismic Coefficient = 0.21g - SHALLOW/SEISMIC
A)
B)
C)
Name: Fill - Clay Model: Mohr-Coulomb Unit Weight: 125 pcfCohesion: 160 psfPhi: 23 °
Name: Lean Clay Model: Mohr-Coulomb Unit Weight: 125 pcfCohesion: 1400 psfPhi: 24 °
Name: Sand and Gravel Model: Mohr-Coulomb Unit Weight: 134 pcfCohesion: 200 psfPhi: 45 °
A
A
B
B
C C
C
C
Distance (x 1000)0.00 0.03 0.06 0.09 0.12 0.15 0.18 0.21 0.24 0.27 0.30 0.33 0.36 0.39 0.42 0.45 0.48 0.51 0.54 0.57 0.60 0.63 0.66 0.69 0.72 0.75 0.78 0.81 0.84 0.87 0.90 0.93 0.96 0.99 1.02 1.05
100110120130140150160170180190200210220230240250260270280290300310320330340350360370380390400410420430440450460470480490500510520530540550560570580590600
Elev
atio
n
100110120130140150160170180190200210220230240250260270280290300310320330340350360370380390400410420430440450460470480490500510520530540550560570580590600

1.640
Case T-2 with 40' Mid-Bench and 2:1 Slopes - DEEP SEATED
A)
B)
C)
Name: Fill - Clay Model: Mohr-Coulomb Unit Weight: 125 pcfCohesion: 160 psfPhi: 23 °
Name: Lean Clay Model: Mohr-Coulomb Unit Weight: 125 pcfCohesion: 1400 psfPhi: 24 °
Name: Sand and Gravel Model: Mohr-Coulomb Unit Weight: 134 pcfCohesion: 200 psfPhi: 45 °
A
A
B
B
C C
C
C
Distance (x 1000)0.00 0.03 0.06 0.09 0.12 0.15 0.18 0.21 0.24 0.27 0.30 0.33 0.36 0.39 0.42 0.45 0.48 0.51 0.54 0.57 0.60 0.63 0.66 0.69 0.72 0.75 0.78 0.81 0.84 0.87 0.90 0.93 0.96 0.99 1.02 1.05
100110120130140150160170180190200210220230240250260270280290300310320330340350360370380390400410420430440450460470480490500510520530540550560570580590600
Elev
atio
n
100110120130140150160170180190200210220230240250260270280290300310320330340350360370380390400410420430440450460470480490500510520530540550560570580590600

1.007
Case T-2 with 40' Mid-Bench and 2:1 Slopes, Seismic Coefficient = 0.21g - DEEP SEATED/SEISMIC
A)
B)
C)
Name: Fill - Clay Model: Mohr-Coulomb Unit Weight: 125 pcfCohesion: 160 psfPhi: 23 °
Name: Lean Clay Model: Mohr-Coulomb Unit Weight: 125 pcfCohesion: 1400 psfPhi: 24 °
Name: Sand and Gravel Model: Mohr-Coulomb Unit Weight: 134 pcfCohesion: 200 psfPhi: 45 °
A
A
B
B
C C
C
C
Distance (x 1000)0.00 0.03 0.06 0.09 0.12 0.15 0.18 0.21 0.24 0.27 0.30 0.33 0.36 0.39 0.42 0.45 0.48 0.51 0.54 0.57 0.60 0.63 0.66 0.69 0.72 0.75 0.78 0.81 0.84 0.87 0.90 0.93 0.96 0.99 1.02 1.05
100110120130140150160170180190200210220230240250260270280290300310320330340350360370380390400410420430440450460470480490500510520530540550560570580590600
Elev
atio
n
100110120130140150160170180190200210220230240250260270280290300310320330340350360370380390400410420430440450460470480490500510520530540550560570580590600

1.783
Case T-3 with 40' Mid-Bench and 2:1 Slopes - SHALLOW
A)
B)
C)
Name: Fill - Clay Model: Mohr-Coulomb Unit Weight: 125 pcfCohesion: 160 psfPhi: 23 °
Name: Lean Clay Model: Mohr-Coulomb Unit Weight: 125 pcfCohesion: 1400 psfPhi: 24 °
Name: Sand and Gravel Model: Mohr-Coulomb Unit Weight: 134 pcfCohesion: 200 psfPhi: 45 °
A
A
B
B
CC
C
C
Distance (x 1000)0.00 0.03 0.06 0.09 0.12 0.15 0.18 0.21 0.24 0.27 0.30 0.33 0.36 0.39 0.42 0.45 0.48 0.51 0.54 0.57 0.60 0.63 0.66 0.69 0.72 0.75 0.78 0.81 0.84 0.87 0.90 0.93 0.96 0.99 1.02 1.05
100
110
120
130
140
150
160
170
180
190
200
210
220
230
240
250
260
270
280
290
300
310
320
330
340
350
360
370
380
390
400
410
420
430
440
450
460
470
480
490
500
510
520
530
540
550
560
570
580
590
600
Elev
atio
n
100
110
120
130
140
150
160
170
180
190
200
210
220
230
240
250
260
270
280
290
300
310
320
330
340
350
360
370
380
390
400
410
420
430
440
450
460
470
480
490
500
510
520
530
540
550
560
570
580
590
600

1.134
Case T-3 with 40' Mid-Bench and 2:1 Slopes, Seismic Coefficient = 0.21g - SHALLOW/SEISMIC
A)
B)
C)
Name: Fill - Clay Model: Mohr-Coulomb Unit Weight: 125 pcfCohesion: 160 psfPhi: 23 °
Name: Lean Clay Model: Mohr-Coulomb Unit Weight: 125 pcfCohesion: 1400 psfPhi: 24 °
Name: Sand and Gravel Model: Mohr-Coulomb Unit Weight: 134 pcfCohesion: 200 psfPhi: 45 °
A
A
B
B
CC
C
C
Distance (x 1000)0.00 0.03 0.06 0.09 0.12 0.15 0.18 0.21 0.24 0.27 0.30 0.33 0.36 0.39 0.42 0.45 0.48 0.51 0.54 0.57 0.60 0.63 0.66 0.69 0.72 0.75 0.78 0.81 0.84 0.87 0.90 0.93 0.96 0.99 1.02 1.05
100
110
120
130
140
150
160
170
180
190
200
210
220
230
240
250
260
270
280
290
300
310
320
330
340
350
360
370
380
390
400
410
420
430
440
450
460
470
480
490
500
510
520
530
540
550
560
570
580
590
600
Elev
atio
n
100
110
120
130
140
150
160
170
180
190
200
210
220
230
240
250
260
270
280
290
300
310
320
330
340
350
360
370
380
390
400
410
420
430
440
450
460
470
480
490
500
510
520
530
540
550
560
570
580
590
600

1.653
Case T-3 with 40' Mid-Bench and 2:1 Slopes - DEEP SEATED
A)
B)
C)
Name: Fill - Clay Model: Mohr-Coulomb Unit Weight: 125 pcfCohesion: 160 psfPhi: 23 °
Name: Lean Clay Model: Mohr-Coulomb Unit Weight: 125 pcfCohesion: 1400 psfPhi: 24 °
Name: Sand and Gravel Model: Mohr-Coulomb Unit Weight: 134 pcfCohesion: 200 psfPhi: 45 °
A
A
B
B
CC
C
C
Distance (x 1000)0.00 0.03 0.06 0.09 0.12 0.15 0.18 0.21 0.24 0.27 0.30 0.33 0.36 0.39 0.42 0.45 0.48 0.51 0.54 0.57 0.60 0.63 0.66 0.69 0.72 0.75 0.78 0.81 0.84 0.87 0.90 0.93 0.96 0.99 1.02 1.05
100110120130140150160170180190200210220230240250260270280290300310320330340350360370380390400410420430440450460470480490500510520530540550560570580590600
Elev
atio
n
100110120130140150160170180190200210220230240250260270280290300310320330340350360370380390400410420430440450460470480490500510520530540550560570580590600

1.015
Case T-3 with 40' Mid-Bench and 2:1 Slopes, Seismic Coefficient = 0.21g - DEEP SEATED/SEISMIC
A)
B)
C)
Name: Fill - Clay Model: Mohr-Coulomb Unit Weight: 125 pcfCohesion: 160 psfPhi: 23 °
Name: Lean Clay Model: Mohr-Coulomb Unit Weight: 125 pcfCohesion: 1400 psfPhi: 24 °
Name: Sand and Gravel Model: Mohr-Coulomb Unit Weight: 134 pcfCohesion: 200 psfPhi: 45 °
A
A
B
B
CC
C
C
Distance (x 1000)0.00 0.03 0.06 0.09 0.12 0.15 0.18 0.21 0.24 0.27 0.30 0.33 0.36 0.39 0.42 0.45 0.48 0.51 0.54 0.57 0.60 0.63 0.66 0.69 0.72 0.75 0.78 0.81 0.84 0.87 0.90 0.93 0.96 0.99 1.02 1.05
100
110
120
130
140
150
160
170
180
190
200
210
220
230
240
250
260
270
280
290
300
310
320
330
340
350
360
370
380
390
400
410
420
430
440
450
460
470
480
490
500
510
520
530
540
550
560
570
580
590
600
Elev
atio
n
100
110
120
130
140
150
160
170
180
190
200
210
220
230
240
250
260
270
280
290
300
310
320
330
340
350
360
370
380
390
400
410
420
430
440
450
460
470
480
490
500
510
520
530
540
550
560
570
580
590
600

2.088
Case P-1 with 2.25:1 Slope - SHALLOW
A)
B)
C)
Name: Fill - Clay Model: Mohr-Coulomb Unit Weight: 125 pcfCohesion: 160 psfPhi: 23 °
Name: Lean Clay Model: Mohr-Coulomb Unit Weight: 125 pcfCohesion: 1400 psfPhi: 24 °
Name: Sand and Gravel Model: Mohr-Coulomb Unit Weight: 134 pcfCohesion: 200 psfPhi: 45 °
A
A
B
B
C
C
C
C
Distance (x 1000)0.00 0.03 0.06 0.09 0.12 0.15 0.18 0.21 0.24 0.27 0.30 0.33 0.36 0.39 0.42 0.45 0.48 0.51 0.54 0.57 0.60 0.63 0.66 0.69 0.72 0.75 0.78 0.81 0.84 0.87 0.90 0.93 0.96 0.99 1.02 1.05
100110120130140150160170180190200210220230240250260270280290300310320330340350360370380390400410420430440450460470480490500510520530540550560570580590600
Elev
atio
n
100110120130140150160170180190200210220230240250260270280290300310320330340350360370380390400410420430440450460470480490500510520530540550560570580590600

1.197
Case P-1 with 2.25:1 Slope, Seismic Coefficient = 0.21g - SHALLOW/SEISMIC
A)
B)
C)
Name: Fill - Clay Model: Mohr-Coulomb Unit Weight: 125 pcfCohesion: 160 psfPhi: 23 °
Name: Lean Clay Model: Mohr-Coulomb Unit Weight: 125 pcfCohesion: 1400 psfPhi: 24 °
Name: Sand and Gravel Model: Mohr-Coulomb Unit Weight: 134 pcfCohesion: 200 psfPhi: 45 °
A
A
B
B
C
C
C
C
Distance (x 1000)0.00 0.03 0.06 0.09 0.12 0.15 0.18 0.21 0.24 0.27 0.30 0.33 0.36 0.39 0.42 0.45 0.48 0.51 0.54 0.57 0.60 0.63 0.66 0.69 0.72 0.75 0.78 0.81 0.84 0.87 0.90 0.93 0.96 0.99 1.02 1.05
100
110120
130
140
150
160
170
180
190
200210
220
230
240
250
260
270
280
290
300310
320
330
340
350
360
370
380
390400
410
420
430
440
450
460
470
480490
500
510
520
530
540
550
560
570580
590
600
Elev
atio
n
100
110120
130
140
150
160
170
180
190
200210
220
230
240
250
260
270
280
290
300310
320
330
340
350
360
370
380
390400
410
420
430
440
450
460
470
480490
500
510
520
530
540
550
560
570580
590
600

2.463
Case P-1 with 2.25:1 Slope - DEEP SEATED
A)
B)
C)
Name: Fill - Clay Model: Mohr-Coulomb Unit Weight: 125 pcfCohesion: 160 psfPhi: 23 °
Name: Lean Clay Model: Mohr-Coulomb Unit Weight: 125 pcfCohesion: 1400 psfPhi: 24 °
Name: Sand and Gravel Model: Mohr-Coulomb Unit Weight: 134 pcfCohesion: 200 psfPhi: 45 °
A
A
B
B
C
C
C
C
Distance (x 1000)0.00 0.03 0.06 0.09 0.12 0.15 0.18 0.21 0.24 0.27 0.30 0.33 0.36 0.39 0.42 0.45 0.48 0.51 0.54 0.57 0.60 0.63 0.66 0.69 0.72 0.75 0.78 0.81 0.84 0.87 0.90 0.93 0.96 0.99 1.02 1.05
100110120130140150160170180190200210220230240250260270280290300310320330340350360370380390400410420430440450460470480490500510520530540550560570580590600
Elev
atio
n
100110120130140150160170180190200210220230240250260270280290300310320330340350360370380390400410420430440450460470480490500510520530540550560570580590600

1.166
Case P-1 with 2.25:1 Slope - DEEP SEATED/SEISMIC
A)
B)
C)
Name: Fill - Clay Model: Mohr-Coulomb Unit Weight: 125 pcfCohesion: 160 psfPhi: 23 °
Name: Lean Clay Model: Mohr-Coulomb Unit Weight: 125 pcfCohesion: 1400 psfPhi: 24 °
Name: Sand and Gravel Model: Mohr-Coulomb Unit Weight: 134 pcfCohesion: 200 psfPhi: 45 °
A
A
B
B
C
C
C
C
Distance (x 1000)0.00 0.03 0.06 0.09 0.12 0.15 0.18 0.21 0.24 0.27 0.30 0.33 0.36 0.39 0.42 0.45 0.48 0.51 0.54 0.57 0.60 0.63 0.66 0.69 0.72 0.75 0.78 0.81 0.84 0.87 0.90 0.93 0.96 0.99 1.02 1.05
100110120130140150160170180190200210220230240250260270280290300310320330340350360370380390400410420430440450460470480490500510520530540550560570580590600
Elev
atio
n
100110120130140150160170180190200210220230240250260270280290300310320330340350360370380390400410420430440450460470480490500510520530540550560570580590600

1.896
Case P-2 with 2.25:1 Slope - SHALLOW
A)
B)
C)
Name: Fill - Clay Model: Mohr-Coulomb Unit Weight: 125 pcfCohesion: 160 psfPhi: 23 °
Name: Lean Clay Model: Mohr-Coulomb Unit Weight: 125 pcfCohesion: 1400 psfPhi: 24 °
Name: Sand and Gravel Model: Mohr-Coulomb Unit Weight: 134 pcfCohesion: 200 psfPhi: 45 °
A
A
B
B
C C
C
C
Distance (x 1000)0.00 0.03 0.06 0.09 0.12 0.15 0.18 0.21 0.24 0.27 0.30 0.33 0.36 0.39 0.42 0.45 0.48 0.51 0.54 0.57 0.60 0.63 0.66 0.69 0.72 0.75 0.78 0.81 0.84 0.87 0.90 0.93 0.96 0.99 1.02 1.05
100110120130140150160170180190200210220230240250260270280290300310320330340350360370380390400410420430440450460470480490500510520530540550560570580590600
Elev
atio
n
100110120130140150160170180190200210220230240250260270280290300310320330340350360370380390400410420430440450460470480490500510520530540550560570580590600

1.211
Case P-2 with 2.25:1 Slope, Seismic Coefficient = 0.21g - SHALLOW/SEISMIC
A)
B)
C)
Name: Fill - Clay Model: Mohr-Coulomb Unit Weight: 125 pcfCohesion: 160 psfPhi: 23 °
Name: Lean Clay Model: Mohr-Coulomb Unit Weight: 125 pcfCohesion: 1400 psfPhi: 24 °
Name: Sand and Gravel Model: Mohr-Coulomb Unit Weight: 134 pcfCohesion: 200 psfPhi: 45 °
A
A
B
B
C C
C
C
Distance (x 1000)0.00 0.03 0.06 0.09 0.12 0.15 0.18 0.21 0.24 0.27 0.30 0.33 0.36 0.39 0.42 0.45 0.48 0.51 0.54 0.57 0.60 0.63 0.66 0.69 0.72 0.75 0.78 0.81 0.84 0.87 0.90 0.93 0.96 0.99 1.02 1.05
100
110120
130
140
150
160
170
180
190
200210
220
230
240
250
260
270
280
290
300310
320
330
340
350
360
370
380
390400
410
420
430
440
450
460
470
480490
500
510
520
530
540
550
560
570580
590
600
Elev
atio
n
100
110120
130
140
150
160
170
180
190
200210
220
230
240
250
260
270
280
290
300310
320
330
340
350
360
370
380
390400
410
420
430
440
450
460
470
480490
500
510
520
530
540
550
560
570580
590
600

2.485
Case P-2 with 2.25:1 Slope - DEEP SEATED
A)
B)
C)
Name: Fill - Clay Model: Mohr-Coulomb Unit Weight: 125 pcfCohesion: 160 psfPhi: 23 °
Name: Lean Clay Model: Mohr-Coulomb Unit Weight: 125 pcfCohesion: 1400 psfPhi: 24 °
Name: Sand and Gravel Model: Mohr-Coulomb Unit Weight: 134 pcfCohesion: 200 psfPhi: 45 °
A
A
B
B
C C
C
C
Distance (x 1000)0.00 0.03 0.06 0.09 0.12 0.15 0.18 0.21 0.24 0.27 0.30 0.33 0.36 0.39 0.42 0.45 0.48 0.51 0.54 0.57 0.60 0.63 0.66 0.69 0.72 0.75 0.78 0.81 0.84 0.87 0.90 0.93 0.96 0.99 1.02 1.05
100110120130140150160170180190200210220230240250260270280290300310320330340350360370380390400410420430440450460470480490500510520530540550560570580590600
Elev
atio
n
100110120130140150160170180190200210220230240250260270280290300310320330340350360370380390400410420430440450460470480490500510520530540550560570580590600

1.177
Case P-2 with 2.25:1 Slope, Seismic Coefficient = 0.21g - DEEP SEATED/SEISMIC
A)
B)
C)
Name: Fill - Clay Model: Mohr-Coulomb Unit Weight: 125 pcfCohesion: 160 psfPhi: 23 °
Name: Lean Clay Model: Mohr-Coulomb Unit Weight: 125 pcfCohesion: 1400 psfPhi: 24 °
Name: Sand and Gravel Model: Mohr-Coulomb Unit Weight: 134 pcfCohesion: 200 psfPhi: 45 °
A
A
B
B
C C
C
C
Distance (x 1000)0.00 0.03 0.06 0.09 0.12 0.15 0.18 0.21 0.24 0.27 0.30 0.33 0.36 0.39 0.42 0.45 0.48 0.51 0.54 0.57 0.60 0.63 0.66 0.69 0.72 0.75 0.78 0.81 0.84 0.87 0.90 0.93 0.96 0.99 1.02 1.05
100110120130140150160170180190200210220230240250260270280290300310320330340350360370380390400410420430440450460470480490500510520530540550560570580590600
Elev
atio
n
100110120130140150160170180190200210220230240250260270280290300310320330340350360370380390400410420430440450460470480490500510520530540550560570580590600
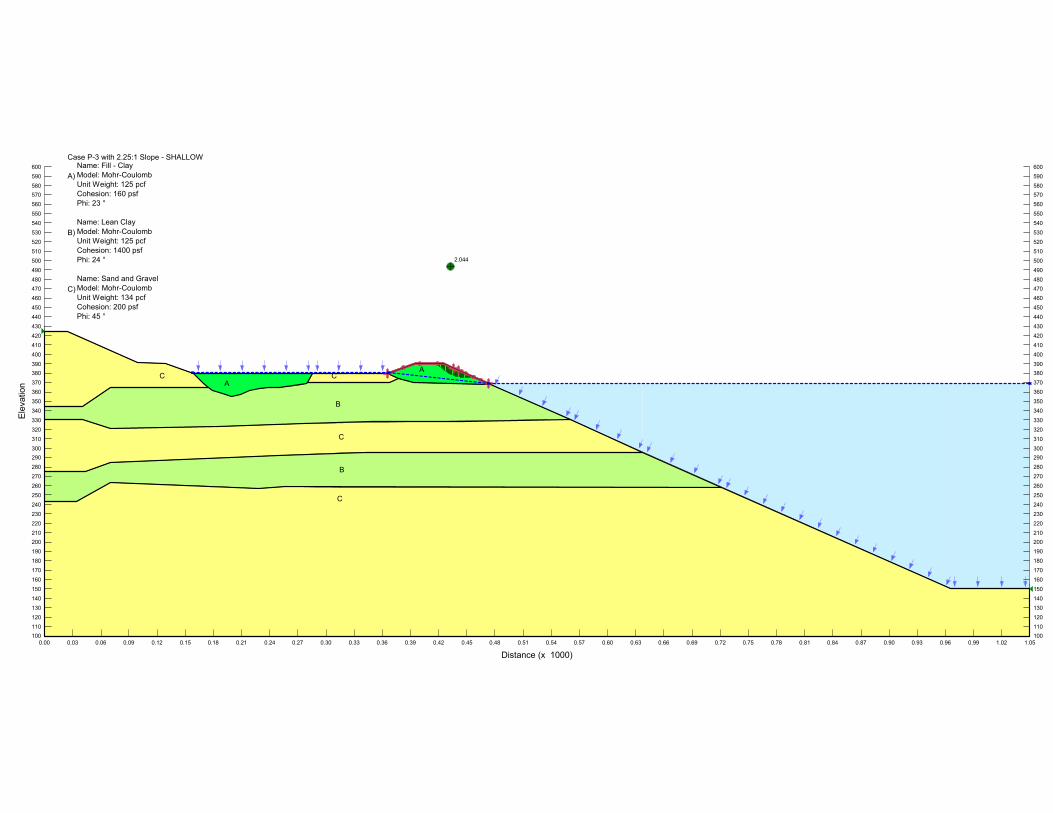
2.044
Case P-3 with 2.25:1 Slope - SHALLOW
A)
B)
C)
Name: Fill - Clay Model: Mohr-Coulomb Unit Weight: 125 pcfCohesion: 160 psfPhi: 23 °
Name: Lean Clay Model: Mohr-Coulomb Unit Weight: 125 pcfCohesion: 1400 psfPhi: 24 °
Name: Sand and Gravel Model: Mohr-Coulomb Unit Weight: 134 pcfCohesion: 200 psfPhi: 45 °
A
A
B
B
C C
C
C
Distance (x 1000)0.00 0.03 0.06 0.09 0.12 0.15 0.18 0.21 0.24 0.27 0.30 0.33 0.36 0.39 0.42 0.45 0.48 0.51 0.54 0.57 0.60 0.63 0.66 0.69 0.72 0.75 0.78 0.81 0.84 0.87 0.90 0.93 0.96 0.99 1.02 1.05
100110120130140150160170180190200210220230240250260270280290300310320330340350360370380390400410420430440450460470480490500510520530540550560570580590600
Elev
atio
n
100110120130140150160170180190200210220230240250260270280290300310320330340350360370380390400410420430440450460470480490500510520530540550560570580590600

1.293
Case P-3 with 2.25:1 Slope, Seismic Coefficient = 0.21g - SHALLOW/SEISMIC
A)
B)
C)
Name: Fill - Clay Model: Mohr-Coulomb Unit Weight: 125 pcfCohesion: 160 psfPhi: 23 °
Name: Lean Clay Model: Mohr-Coulomb Unit Weight: 125 pcfCohesion: 1400 psfPhi: 24 °
Name: Sand and Gravel Model: Mohr-Coulomb Unit Weight: 134 pcfCohesion: 200 psfPhi: 45 °
A
A
B
B
C C
C
C
Distance (x 1000)0.00 0.03 0.06 0.09 0.12 0.15 0.18 0.21 0.24 0.27 0.30 0.33 0.36 0.39 0.42 0.45 0.48 0.51 0.54 0.57 0.60 0.63 0.66 0.69 0.72 0.75 0.78 0.81 0.84 0.87 0.90 0.93 0.96 0.99 1.02 1.05
100110120130140150160170180190200210220230240250260270280290300310320330340350360370380390400410420430440450460470480490500510520530540550560570580590600
Elev
atio
n
100110120130140150160170180190200210220230240250260270280290300310320330340350360370380390400410420430440450460470480490500510520530540550560570580590600

2.498
Case P-3 with 2.25:1 Slope - DEEP SEATED
A)
B)
C)
Name: Fill - Clay Model: Mohr-Coulomb Unit Weight: 125 pcfCohesion: 160 psfPhi: 23 °
Name: Lean Clay Model: Mohr-Coulomb Unit Weight: 125 pcfCohesion: 1400 psfPhi: 24 °
Name: Sand and Gravel Model: Mohr-Coulomb Unit Weight: 134 pcfCohesion: 200 psfPhi: 45 °
A
A
B
B
C C
C
C
Distance (x 1000)0.00 0.03 0.06 0.09 0.12 0.15 0.18 0.21 0.24 0.27 0.30 0.33 0.36 0.39 0.42 0.45 0.48 0.51 0.54 0.57 0.60 0.63 0.66 0.69 0.72 0.75 0.78 0.81 0.84 0.87 0.90 0.93 0.96 0.99 1.02 1.05
100110120130140150160170180190200210220230240250260270280290300310320330340350360370380390400410420430440450460470480490500510520530540550560570580590600
Elev
atio
n
100110120130140150160170180190200210220230240250260270280290300310320330340350360370380390400410420430440450460470480490500510520530540550560570580590600

1.180
Case P-3 with 2.25:1 Slope, Seismic Coefficient = 0.21g - DEEP SEATED/SEISMIC
A)
B)
C)
Name: Fill - Clay Model: Mohr-Coulomb Unit Weight: 125 pcfCohesion: 160 psfPhi: 23 °
Name: Lean Clay Model: Mohr-Coulomb Unit Weight: 125 pcfCohesion: 1400 psfPhi: 24 °
Name: Sand and Gravel Model: Mohr-Coulomb Unit Weight: 134 pcfCohesion: 200 psfPhi: 45 °
A
A
B
B
C C
C
C
Distance (x 1000)0.00 0.03 0.06 0.09 0.12 0.15 0.18 0.21 0.24 0.27 0.30 0.33 0.36 0.39 0.42 0.45 0.48 0.51 0.54 0.57 0.60 0.63 0.66 0.69 0.72 0.75 0.78 0.81 0.84 0.87 0.90 0.93 0.96 0.99 1.02 1.05
100110120130140150160170180190200210220230240250260270280290300310320330340350360370380390400410420430440450460470480490500510520530540550560570580590600
Elev
atio
n
100110120130140150160170180190200210220230240250260270280290300310320330340350360370380390400410420430440450460470480490500510520530540550560570580590600

2.036
Case P-1 with 40' Mid-Bench and 2:1 Slopes - SHALLOW
A)
B)
C)
Name: Fill - Clay Model: Mohr-Coulomb Unit Weight: 125 pcfCohesion: 160 psfPhi: 23 °
Name: Lean Clay Model: Mohr-Coulomb Unit Weight: 125 pcfCohesion: 1400 psfPhi: 24 °
Name: Sand and Gravel Model: Mohr-Coulomb Unit Weight: 134 pcfCohesion: 200 psfPhi: 45 °
A
A
B
B
C
C
C
C
Distance (x 1000)0.00 0.03 0.06 0.09 0.12 0.15 0.18 0.21 0.24 0.27 0.30 0.33 0.36 0.39 0.42 0.45 0.48 0.51 0.54 0.57 0.60 0.63 0.66 0.69 0.72 0.75 0.78 0.81 0.84 0.87 0.90 0.93 0.96 0.99 1.02 1.05
100
110
120
130
140
150
160
170
180
190
200
210
220
230
240
250
260
270
280
290
300
310
320
330
340
350
360
370
380
390
400
410
420
430
440
450
460
470
480
490
500
510
520
530
540
550
560
570
580
590
600
Elev
atio
n
100
110
120
130
140
150
160
170
180
190
200
210
220
230
240
250
260
270
280
290
300
310
320
330
340
350
360
370
380
390
400
410
420
430
440
450
460
470
480
490
500
510
520
530
540
550
560
570
580
590
600

1.285
Case P-1 with 40' Mid-Bench and 2:1 Slopes, Seismic Coefficient = 0.21g - SHALLOW/SEISMIC
A)
B)
C)
Name: Fill - Clay Model: Mohr-Coulomb Unit Weight: 125 pcfCohesion: 160 psfPhi: 23 °
Name: Lean Clay Model: Mohr-Coulomb Unit Weight: 125 pcfCohesion: 1400 psfPhi: 24 °
Name: Sand and Gravel Model: Mohr-Coulomb Unit Weight: 134 pcfCohesion: 200 psfPhi: 45 °
A
A
B
B
C
C
C
C
Distance (x 1000)0.00 0.03 0.06 0.09 0.12 0.15 0.18 0.21 0.24 0.27 0.30 0.33 0.36 0.39 0.42 0.45 0.48 0.51 0.54 0.57 0.60 0.63 0.66 0.69 0.72 0.75 0.78 0.81 0.84 0.87 0.90 0.93 0.96 0.99 1.02 1.05
100110120130140150160170180190200210220230240250260270280290300310320330340350360370380390400410420430440450460470480490500510520530540550560570580590600
Elev
atio
n
100110120130140150160170180190200210220230240250260270280290300310320330340350360370380390400410420430440450460470480490500510520530540550560570580590600

2.462
Case P-1 with 40' Mid-Bench and 2:1 Slopes - DEEP SEATED
A)
B)
C)
Name: Fill - Clay Model: Mohr-Coulomb Unit Weight: 125 pcfCohesion: 160 psfPhi: 23 °
Name: Lean Clay Model: Mohr-Coulomb Unit Weight: 125 pcfCohesion: 1400 psfPhi: 24 °
Name: Sand and Gravel Model: Mohr-Coulomb Unit Weight: 134 pcfCohesion: 200 psfPhi: 45 °
A
A
B
B
C
C
C
C
Distance (x 1000)0.00 0.03 0.06 0.09 0.12 0.15 0.18 0.21 0.24 0.27 0.30 0.33 0.36 0.39 0.42 0.45 0.48 0.51 0.54 0.57 0.60 0.63 0.66 0.69 0.72 0.75 0.78 0.81 0.84 0.87 0.90 0.93 0.96 0.99 1.02 1.05
100
110
120
130
140
150
160
170
180
190
200
210
220
230
240
250
260
270
280
290
300
310
320
330
340
350
360
370
380
390
400
410
420
430
440
450
460
470
480
490
500
510
520
530
540
550
560
570
580
590
600
Elev
atio
n
100
110
120
130
140
150
160
170
180
190
200
210
220
230
240
250
260
270
280
290
300
310
320
330
340
350
360
370
380
390
400
410
420
430
440
450
460
470
480
490
500
510
520
530
540
550
560
570
580
590
600
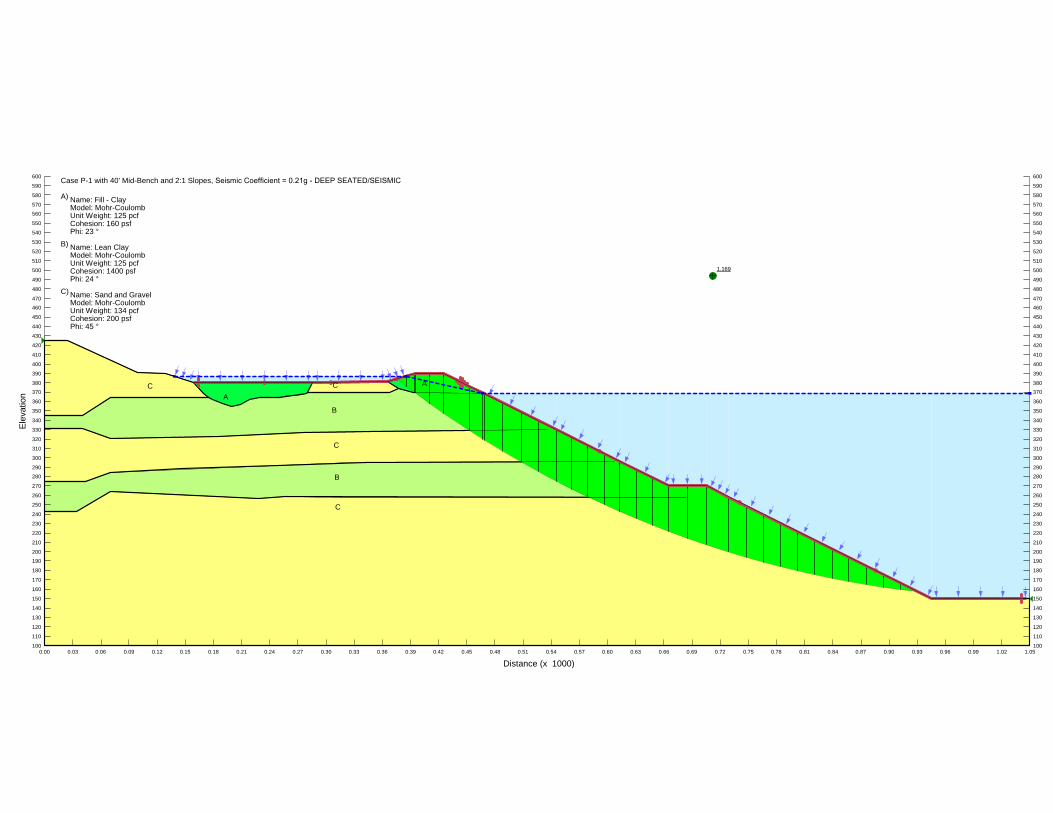
1.169
Case P-1 with 40' Mid-Bench and 2:1 Slopes, Seismic Coefficient = 0.21g - DEEP SEATED/SEISMIC
A)
B)
C)
Name: Fill - Clay Model: Mohr-Coulomb Unit Weight: 125 pcfCohesion: 160 psfPhi: 23 °
Name: Lean Clay Model: Mohr-Coulomb Unit Weight: 125 pcfCohesion: 1400 psfPhi: 24 °
Name: Sand and Gravel Model: Mohr-Coulomb Unit Weight: 134 pcfCohesion: 200 psfPhi: 45 °
A
A
B
B
C
C
C
C
Distance (x 1000)0.00 0.03 0.06 0.09 0.12 0.15 0.18 0.21 0.24 0.27 0.30 0.33 0.36 0.39 0.42 0.45 0.48 0.51 0.54 0.57 0.60 0.63 0.66 0.69 0.72 0.75 0.78 0.81 0.84 0.87 0.90 0.93 0.96 0.99 1.02 1.05
100
110
120
130
140
150
160
170
180
190
200
210
220
230
240
250
260
270
280
290
300
310
320
330
340
350
360
370
380
390
400
410
420
430
440
450
460
470
480
490
500
510
520
530
540
550
560
570
580
590
600
Elev
atio
n
100
110
120
130
140
150
160
170
180
190
200
210
220
230
240
250
260
270
280
290
300
310
320
330
340
350
360
370
380
390
400
410
420
430
440
450
460
470
480
490
500
510
520
530
540
550
560
570
580
590
600

1.672
Case P-2 with 40' Mid-Bench and 2:1 Slopes - SHALLOW
A)
B)
C)
Name: Fill - Clay Model: Mohr-Coulomb Unit Weight: 125 pcfCohesion: 160 psfPhi: 23 °
Name: Lean Clay Model: Mohr-Coulomb Unit Weight: 125 pcfCohesion: 1400 psfPhi: 24 °
Name: Sand and Gravel Model: Mohr-Coulomb Unit Weight: 134 pcfCohesion: 200 psfPhi: 45 °
A
A
B
B
C C
C
C
Distance (x 1000)0.00 0.03 0.06 0.09 0.12 0.15 0.18 0.21 0.24 0.27 0.30 0.33 0.36 0.39 0.42 0.45 0.48 0.51 0.54 0.57 0.60 0.63 0.66 0.69 0.72 0.75 0.78 0.81 0.84 0.87 0.90 0.93 0.96 0.99 1.02 1.05
100110120130140150160170180190200210220230240250260270280290300310320330340350360370380390400410420430440450460470480490500510520530540550560570580590600
Elev
atio
n
100110120130140150160170180190200210220230240250260270280290300310320330340350360370380390400410420430440450460470480490500510520530540550560570580590600

1.107
Case P-2 with 40' Mid-Bench and 2:1 Slopes, Seismic Coefficient = 0.21g - SHALLOW/SEISMIC
A)
B)
C)
Name: Fill - Clay Model: Mohr-Coulomb Unit Weight: 125 pcfCohesion: 160 psfPhi: 23 °
Name: Lean Clay Model: Mohr-Coulomb Unit Weight: 125 pcfCohesion: 1400 psfPhi: 24 °
Name: Sand and Gravel Model: Mohr-Coulomb Unit Weight: 134 pcfCohesion: 200 psfPhi: 45 °
A
A
B
B
C C
C
C
Distance (x 1000)0.00 0.03 0.06 0.09 0.12 0.15 0.18 0.21 0.24 0.27 0.30 0.33 0.36 0.39 0.42 0.45 0.48 0.51 0.54 0.57 0.60 0.63 0.66 0.69 0.72 0.75 0.78 0.81 0.84 0.87 0.90 0.93 0.96 0.99 1.02 1.05
100110120130140150160170180190200210220230240250260270280290300310320330340350360370380390400410420430440450460470480490500510520530540550560570580590600
Elev
atio
n
100110120130140150160170180190200210220230240250260270280290300310320330340350360370380390400410420430440450460470480490500510520530540550560570580590600
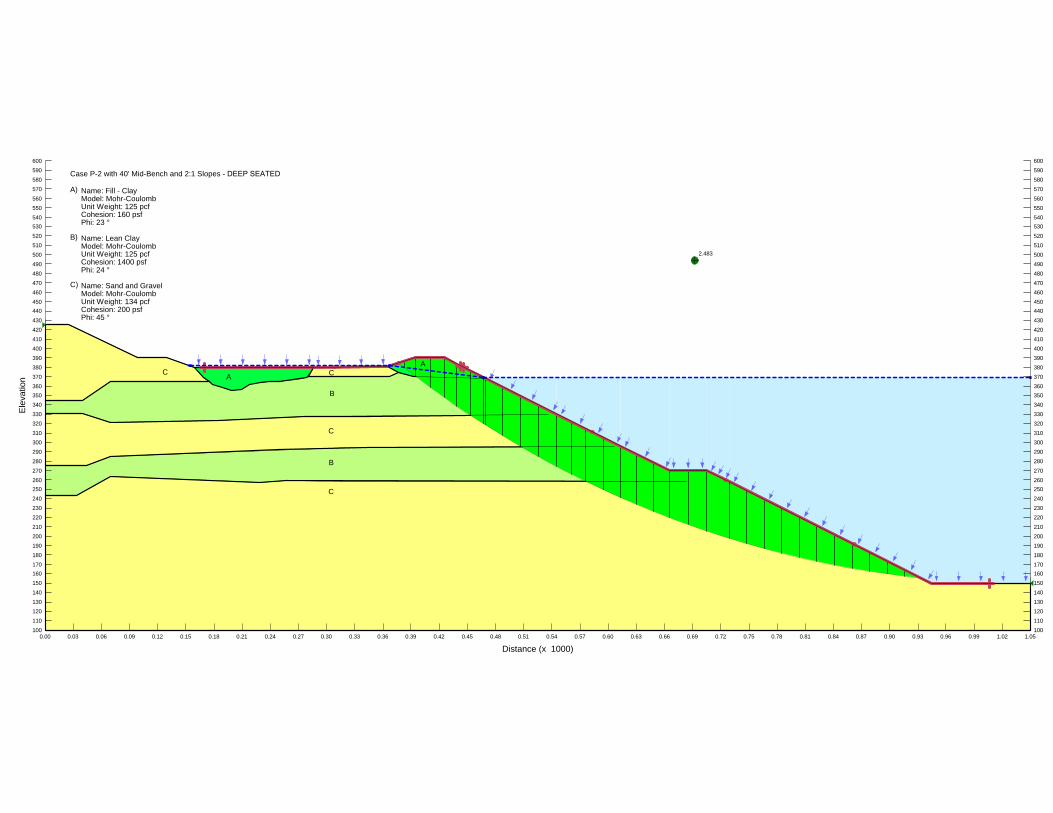
2.483
Case P-2 with 40' Mid-Bench and 2:1 Slopes - DEEP SEATED
A)
B)
C)
Name: Fill - Clay Model: Mohr-Coulomb Unit Weight: 125 pcfCohesion: 160 psfPhi: 23 °
Name: Lean Clay Model: Mohr-Coulomb Unit Weight: 125 pcfCohesion: 1400 psfPhi: 24 °
Name: Sand and Gravel Model: Mohr-Coulomb Unit Weight: 134 pcfCohesion: 200 psfPhi: 45 °
A
A
B
B
C C
C
C
Distance (x 1000)0.00 0.03 0.06 0.09 0.12 0.15 0.18 0.21 0.24 0.27 0.30 0.33 0.36 0.39 0.42 0.45 0.48 0.51 0.54 0.57 0.60 0.63 0.66 0.69 0.72 0.75 0.78 0.81 0.84 0.87 0.90 0.93 0.96 0.99 1.02 1.05
100110120130140150160170180190200210220230240250260270280290300310320330340350360370380390400410420430440450460470480490500510520530540550560570580590600
Elev
atio
n
100110120130140150160170180190200210220230240250260270280290300310320330340350360370380390400410420430440450460470480490500510520530540550560570580590600

1.180
Case P-2 with 40' Mid-Bench and 2:1 Slopes, Seismic Coefficient = 0.21g - DEEP SEATED/SEISMIC
A)
B)
C)
Name: Fill - Clay Model: Mohr-Coulomb Unit Weight: 125 pcfCohesion: 160 psfPhi: 23 °
Name: Lean Clay Model: Mohr-Coulomb Unit Weight: 125 pcfCohesion: 1400 psfPhi: 24 °
Name: Sand and Gravel Model: Mohr-Coulomb Unit Weight: 134 pcfCohesion: 200 psfPhi: 45 °
A
A
B
B
C C
C
C
Distance (x 1000)0.00 0.03 0.06 0.09 0.12 0.15 0.18 0.21 0.24 0.27 0.30 0.33 0.36 0.39 0.42 0.45 0.48 0.51 0.54 0.57 0.60 0.63 0.66 0.69 0.72 0.75 0.78 0.81 0.84 0.87 0.90 0.93 0.96 0.99 1.02 1.05
100110120130140150160170180190200210220230240250260270280290300310320330340350360370380390400410420430440450460470480490500510520530540550560570580590600
Elev
atio
n
100110120130140150160170180190200210220230240250260270280290300310320330340350360370380390400410420430440450460470480490500510520530540550560570580590600

1.799
Case P-3 with 40' Mid-Bench and 2:1 Slopes - SHALLOW
A)
B)
C)
Name: Fill - Clay Model: Mohr-Coulomb Unit Weight: 125 pcfCohesion: 160 psfPhi: 23 °
Name: Lean Clay Model: Mohr-Coulomb Unit Weight: 125 pcfCohesion: 1400 psfPhi: 24 °
Name: Sand and Gravel Model: Mohr-Coulomb Unit Weight: 134 pcfCohesion: 200 psfPhi: 45 °
A
A
B
B
C C
C
C
Distance (x 1000)0.00 0.03 0.06 0.09 0.12 0.15 0.18 0.21 0.24 0.27 0.30 0.33 0.36 0.39 0.42 0.45 0.48 0.51 0.54 0.57 0.60 0.63 0.66 0.69 0.72 0.75 0.78 0.81 0.84 0.87 0.90 0.93 0.96 0.99 1.02 1.05
100
110
120
130
140
150
160
170
180
190
200
210
220
230
240
250
260
270
280
290
300
310
320
330
340
350
360
370
380
390
400
410
420
430
440
450
460
470
480
490
500
510
520
530
540
550
560
570
580
590
600
Elev
atio
n
100
110
120
130
140
150
160
170
180
190
200
210
220
230
240
250
260
270
280
290
300
310
320
330
340
350
360
370
380
390
400
410
420
430
440
450
460
470
480
490
500
510
520
530
540
550
560
570
580
590
600

1.181
Case P-3 with 40' Mid-Bench and 2:1 Slopes, Seismic Coefficient = 0.21g - SHALLOW/SEISMIC
A)
B)
C)
Name: Fill - Clay Model: Mohr-Coulomb Unit Weight: 125 pcfCohesion: 160 psfPhi: 23 °
Name: Lean Clay Model: Mohr-Coulomb Unit Weight: 125 pcfCohesion: 1400 psfPhi: 24 °
Name: Sand and Gravel Model: Mohr-Coulomb Unit Weight: 134 pcfCohesion: 200 psfPhi: 45 °
A
A
B
B
C C
C
C
Distance (x 1000)0.00 0.03 0.06 0.09 0.12 0.15 0.18 0.21 0.24 0.27 0.30 0.33 0.36 0.39 0.42 0.45 0.48 0.51 0.54 0.57 0.60 0.63 0.66 0.69 0.72 0.75 0.78 0.81 0.84 0.87 0.90 0.93 0.96 0.99 1.02 1.05
100
110
120
130
140
150
160
170
180
190
200
210
220
230
240
250
260
270
280
290
300
310
320
330
340
350
360
370
380
390
400
410
420
430
440
450
460
470
480
490
500
510
520
530
540
550
560
570
580
590
600
Elev
atio
n
100
110
120
130
140
150
160
170
180
190
200
210
220
230
240
250
260
270
280
290
300
310
320
330
340
350
360
370
380
390
400
410
420
430
440
450
460
470
480
490
500
510
520
530
540
550
560
570
580
590
600

2.491
Case P-3 with 40' Mid-Bench and 2:1 Slopes - DEEP SEATED
A)
B)
C)
Name: Fill - Clay Model: Mohr-Coulomb Unit Weight: 125 pcfCohesion: 160 psfPhi: 23 °
Name: Lean Clay Model: Mohr-Coulomb Unit Weight: 125 pcfCohesion: 1400 psfPhi: 24 °
Name: Sand and Gravel Model: Mohr-Coulomb Unit Weight: 134 pcfCohesion: 200 psfPhi: 45 °
A
A
B
B
C C
C
C
Distance (x 1000)0.00 0.03 0.06 0.09 0.12 0.15 0.18 0.21 0.24 0.27 0.30 0.33 0.36 0.39 0.42 0.45 0.48 0.51 0.54 0.57 0.60 0.63 0.66 0.69 0.72 0.75 0.78 0.81 0.84 0.87 0.90 0.93 0.96 0.99 1.02 1.05
100
110
120
130
140
150
160
170
180
190
200
210
220
230
240
250
260
270
280
290
300
310
320
330
340
350
360
370
380
390
400
410
420
430
440
450
460
470
480
490
500
510
520
530
540
550
560
570
580
590
600
Elev
atio
n
100
110
120
130
140
150
160
170
180
190
200
210
220
230
240
250
260
270
280
290
300
310
320
330
340
350
360
370
380
390
400
410
420
430
440
450
460
470
480
490
500
510
520
530
540
550
560
570
580
590
600

1.181
Case P-3 with 40' Mid-Bench and 2:1 Slopes, Seismic Coefficient = 0.21g - DEEP SEATED/SEISMIC
A)
B)
C)
Name: Fill - Clay Model: Mohr-Coulomb Unit Weight: 125 pcfCohesion: 160 psfPhi: 23 °
Name: Lean Clay Model: Mohr-Coulomb Unit Weight: 125 pcfCohesion: 1400 psfPhi: 24 °
Name: Sand and Gravel Model: Mohr-Coulomb Unit Weight: 134 pcfCohesion: 200 psfPhi: 45 °
A
A
B
B
C C
C
C
Distance (x 1000)0.00 0.03 0.06 0.09 0.12 0.15 0.18 0.21 0.24 0.27 0.30 0.33 0.36 0.39 0.42 0.45 0.48 0.51 0.54 0.57 0.60 0.63 0.66 0.69 0.72 0.75 0.78 0.81 0.84 0.87 0.90 0.93 0.96 0.99 1.02 1.05
100
110
120
130
140
150
160
170
180
190
200
210
220
230
240
250
260
270
280
290
300
310
320
330
340
350
360
370
380
390
400
410
420
430
440
450
460
470
480
490
500
510
520
530
540
550
560
570
580
590
600
Elev
atio
n
100
110
120
130
140
150
160
170
180
190
200
210
220
230
240
250
260
270
280
290
300
310
320
330
340
350
360
370
380
390
400
410
420
430
440
450
460
470
480
490
500
510
520
530
540
550
560
570
580
590
600

1.52
Note: 1.5x Vertical ExaggerationLithology Modeled From Borings B3 (Geocon, 2017) and B2 (Berlogar, 2012)
Approximate Existing Grade
Cemex Eliot FacilityLake B Southeast Side
Soil Type: GCSoil Type: CL
Unit Weight: 140 pcf Cohesion: 200 psf Phi: 45 ° Unit Weight: 130 pcf Cohesion: 200 psf Phi: 34 ° GC
GC
GC
GC
CL
CL
CL
CL
GC
Distance (Feet) (x 1000)0.0 0.1 0.2 0.3 0.4 0.5 0.6 0.7 0.8 0.9 1.0 1.1 1.2
Ele
vatio
n (F
eet M
SL)
0
50
100
150
200
250
300
350
400
450

1.02
Note: 1.5x Vertical ExaggerationLithology Modeled From Borings B3 (Geocon, 2017) and B2 (Berlogar, 2012)
Approximate Existing Grade
Cemex Eliot FacilityLake B Southeast Side
Soil Type: GCSoil Type: CL
Unit Weight: 140 pcf Cohesion: 200 psf Phi: 45 ° Unit Weight: 130 pcf Cohesion: 200 psf Phi: 34 ° GC
GC
GC
GC
CL
CL
CL
CL
GC
Seismic Coefficient: 0.21
Distance (Feet) (x 1000)0.0 0.1 0.2 0.3 0.4 0.5 0.6 0.7 0.8 0.9 1.0 1.1 1.2
Ele
vatio
n (F
eet M
SL)
0
50
100
150
200
250
300
350
400
450

1.59
Note: 1.5x Vertical ExaggerationLithology Modeled From Borings B3 (Geocon, 2017) and B2 (Berlogar, 2012)
Approximate Existing Grade
Cemex Eliot FacilityLake B Southeast Side
Soil Type: GCSoil Type: CL
Unit Weight: 140 pcf Cohesion: 200 psf Phi: 45 ° Unit Weight: 130 pcf Cohesion: 200 psf Phi: 34 ° GC
GC
GC
GC
CL
CL
CL
CL
GC
Distance (Feet) (x 1000)0.0 0.1 0.2 0.3 0.4 0.5 0.6 0.7 0.8 0.9 1.0 1.1 1.2
Ele
vatio
n (F
eet M
SL)
0
50
100
150
200
250
300
350
400
450

1.04
Note: 1.5x Vertical ExaggerationLithology Modeled From Borings B3 (Geocon, 2017) and B2 (Berlogar, 2012)
Approximate Existing Grade
Cemex Eliot FacilityLake B Southeast Side
Soil Type: GCSoil Type: CL
Unit Weight: 140 pcf Cohesion: 200 psf Phi: 45 ° Unit Weight: 130 pcf Cohesion: 200 psf Phi: 34 ° GC
GC
GC
GC
CL
CL
CL
CL
GC
Seismic Coefficient: 0.21
Distance (Feet) (x 1000)0.0 0.1 0.2 0.3 0.4 0.5 0.6 0.7 0.8 0.9 1.0 1.1 1.2
Ele
vatio
n (F
eet M
SL)
0
50
100
150
200
250
300
350
400
450


