47
APPENDIX E Evaluation of the Radiological Characteristics of Uranium Mine Waste Rock
APPENDIX E
Evaluation of the Radiological Characteristics of Uranium Mine Waste Rock
Prepared by:
Energy Fuels Resources (USA) Inc. 225 Union Blvd., Suite 600
Lakewood, Colorado 80228
March 2014
Evaluation of the Radiological Characteristics
of Uranium Mine Waste Rock

Page | i V:\Environmental General\Technical\Waste Rock Reclamation\Radiological Characteristics of U Mine Waste Rock_20140326.docx
TABLE OF CONTENTS
Contents 1.0 Introduction .......................................................................................................................... 1
2.0 Uranium Radiation Properties.............................................................................................. 2
2.1 Types of Ionizing Radiation ............................................................................................. 2 2.2 Uranium-Radium Decay Series ........................................................................................ 3 2.3 Radiation Dose and Voluntary Limit ............................................................................... 4
3.0 Uranium Radiation Regulations ........................................................................................... 6
3.1 Mine Radiation Regulations ............................................................................................. 6 3.2 Milling Regulations .......................................................................................................... 7
4.0 Uranium Mining in Utah and Colorado ............................................................................... 9
4.1 Mining History ................................................................................................................. 9 4.2 Uranium Ore Deposits .................................................................................................... 10 4.3 Mine Reclamation Practices ........................................................................................... 11
5.0 Characterization of Uranium Ore and Waste Rock ........................................................... 13
5.1 Ore Characterization ...................................................................................................... 13 5.2 Waste Rock Characterization ......................................................................................... 14 5.3 Ventilation Shaft Study .................................................................................................. 15
6.0 Radiological Dose Rate Assessment .................................................................................. 16
6.1 Model Input Parameters ................................................................................................. 16 6.2 Dose Calculation Results ............................................................................................... 17
7.0 Summary and Recommendations ...................................................................................... 19
8.0 References .......................................................................................................................... 21

Page | ii V:\Environmental General\Technical\Waste Rock Reclamation\Radiological Characteristics of U Mine Waste Rock_20140326.docx
Tables Table 2.1 Uranium-Radium Decay Series Table 5.1 Uranium Ore Characterization Table 5.2 Daneros Waste Rock Analyses Table 5.3 Uranium Waste Rock Characterization
Figures Figure 4-1 Salt Wash Stratigraphic Column Figure 4-2 Chinle Stratigraphic Column – White Canyon Area Figure 5-1 Uranium Ore and Waste Rock Characterization Sample Locations Figure 6-1 Conceptual Waste Rock Area
Appendix Appendix A Technical Memorandum, E. Tiepel (Golder) to F. Filas (Energy Fuels), “Colorado
Plateau Uranium Waste Rock Dose Calculations”

Page | 1
1.0 INTRODUCTION Starting in 2003, a number of uranium mines were restarted in the northern part of the Colorado Plateau in response to higher uranium and vanadium prices. These mines are located in southwestern Colorado and southeastern Utah. In most instances, additional reclamation planning and permitting was necessary prior to starting or expanding these mines. Because naturally occurring uranium is radioactive, a common concern of the regulatory agencies during the permitting process for these mines revolved around the radiation levels and associated health risk posed by reclaimed waste rock piles. Concern has also been expressed by the public about historic uranium mines on the Colorado Plateau that were closed prior to the advent of state reclamation laws in the mid-1970s. Although some of these mines have been reclaimed by state and/or federal programs, most of the historic mines are not reclaimed at this time.
This report was prepared, in large part, to address agency concerns regarding the adequacy of current reclamation practices, but it also looks at the risks associated with un-reclaimed historic mines on the Colorado Plateau. It includes a discussion of uranium radiation properties, mining and milling regulations, mining and reclamation practices, ore and waste rock characterization, and dose rates assessments for waste rock piles. The report also provides recommendations for uranium mine reclamation based on the information presented.

Page | 2
2.0 URANIUM RADIATION PROPERTIES Radiation is energy given off by matter in the form of rays or high-speed particles. Radiation is either ionizing or non-ionizing, depending on its energy and how it affects matter. Non-ionizing radiation has a lower frequency that ionizing radiation (and therefore lower energy) and includes visible light, heat, radar, microwaves, and radio waves. It deposits energy in materials it passes through with little affect. Conversely, ionizing radiation, such as x-rays and gamma rays (e.g., cosmic rays), is more energetic than non-ionizing radiation. When ionizing radiation interacts with tissue, enough energy is deposited to potentially break molecular bonds and create charged particles (NRC 2006). We are generally more concerned about ionizing radiation because it can be potentially harmful to human health.
In this section, we will discuss the three primary types of ionizing radiation that are emitted by uranium and its decay products, examine the uranium-radium decay series, and explain how radiation doses are determined for various conditions.
2.1 Types of Ionizing Radiation There are three major types of ionizing radiation associated with the naturally occurring uranium decay chain. They include alpha particles, beta particles, and gamma rays. Being exposed to these types of radiation does not make things radioactive. Each of these types of radiation is discussed below.
Alpha particles are charged particles with very little penetration power. They can be blocked by a sheet of paper, skin, or a few inches of air. Materials that emit alpha particles are only potentially dangerous when inhaled or swallowed, but present little risk from external exposure (NRC 2006). Uranium, radium, and radon are all alpha emitters. It is well known that poorly ventilated areas, such as basements, can build up elevated concentrations of radon. Under these circumstances, prolonged inhalation of this contaminated air by an occupant presents an elevated cancer risk due to the release of alpha particles within the body. In open, well ventilated areas, alpha emitters quickly dissipate and are not considered a health risk. When inhaled alpha particles can produce greater harm than the other two types of ionizing radiation associated with the uranium decay chain; in fact, they are considered 20 times more harmful than beta particles or gamma rays for a given absorbed dose (CCOHS 2007).
Beta particles, which are similar to electrons, are much lighter and more penetrating that alpha particles for equivalent energy levels. They can travel a few feet in the air and can penetrate the skin; however, like alpha particles, they do not make things radioactive and can be stopped by a thin sheet of metal (e.g., aluminum foil) or plastic or a block of wood (NRC 2006). If inhaled or ingested, they can potentially present an increased risk of cancer. However, that risk is much less than that associated with alpha particles. Given their relatively low penetrating power and less ionization potential, beta particles are typically of less concern than alpha particles or gamma rays in uranium mining and milling activities.
Page | 3
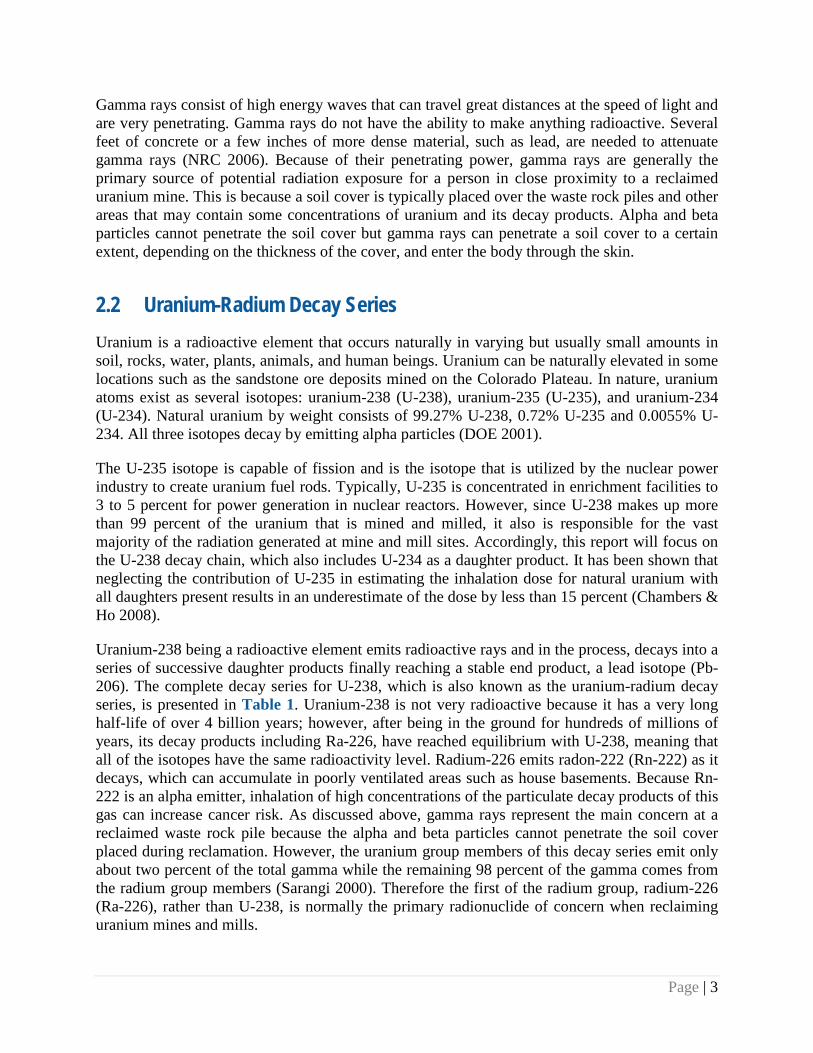
Gamma rays consist of high energy waves that can travel great distances at the speed of light and are very penetrating. Gamma rays do not have the ability to make anything radioactive. Several feet of concrete or a few inches of more dense material, such as lead, are needed to attenuate gamma rays (NRC 2006). Because of their penetrating power, gamma rays are generally the primary source of potential radiation exposure for a person in close proximity to a reclaimed uranium mine. This is because a soil cover is typically placed over the waste rock piles and other areas that may contain some concentrations of uranium and its decay products. Alpha and beta particles cannot penetrate the soil cover but gamma rays can penetrate a soil cover to a certain extent, depending on the thickness of the cover, and enter the body through the skin.
2.2 Uranium-Radium Decay Series Uranium is a radioactive element that occurs naturally in varying but usually small amounts in soil, rocks, water, plants, animals, and human beings. Uranium can be naturally elevated in some locations such as the sandstone ore deposits mined on the Colorado Plateau. In nature, uranium atoms exist as several isotopes: uranium-238 (U-238), uranium-235 (U-235), and uranium-234 (U-234). Natural uranium by weight consists of 99.27% U-238, 0.72% U-235 and 0.0055% U-234. All three isotopes decay by emitting alpha particles (DOE 2001).
The U-235 isotope is capable of fission and is the isotope that is utilized by the nuclear power industry to create uranium fuel rods. Typically, U-235 is concentrated in enrichment facilities to 3 to 5 percent for power generation in nuclear reactors. However, since U-238 makes up more than 99 percent of the uranium that is mined and milled, it also is responsible for the vast majority of the radiation generated at mine and mill sites. Accordingly, this report will focus on the U-238 decay chain, which also includes U-234 as a daughter product. It has been shown that neglecting the contribution of U-235 in estimating the inhalation dose for natural uranium with all daughters present results in an underestimate of the dose by less than 15 percent (Chambers & Ho 2008).
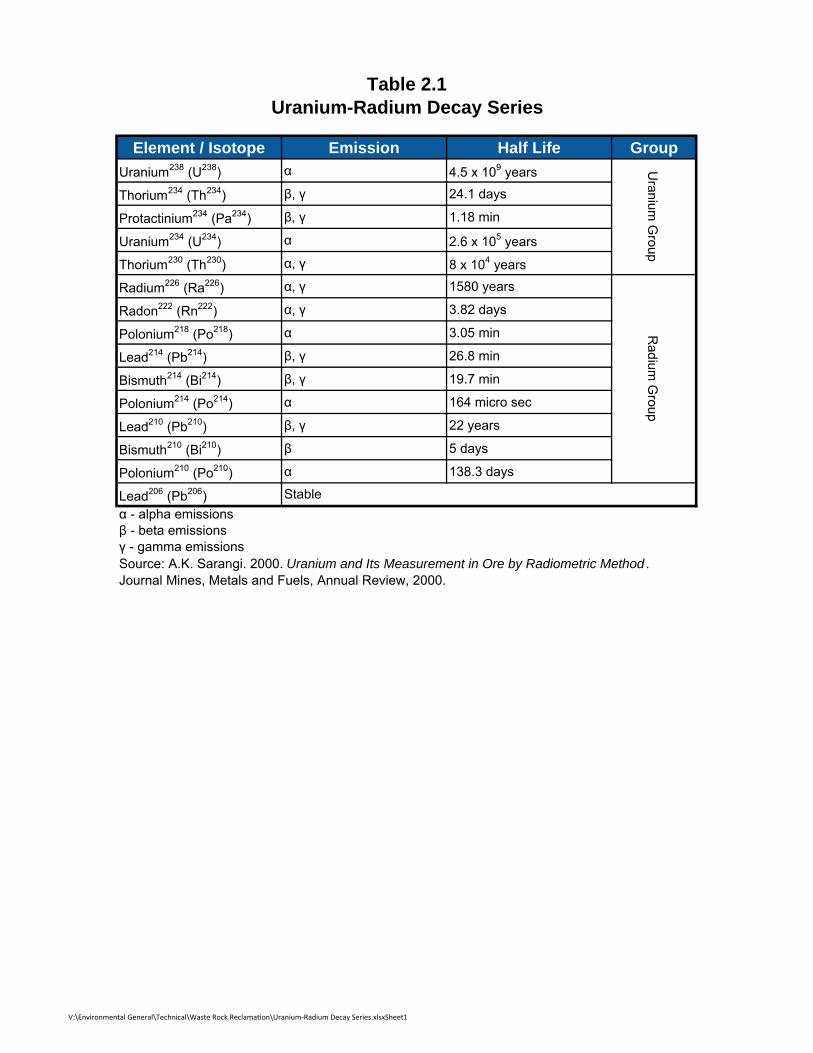
Uranium-238 being a radioactive element emits radioactive rays and in the process, decays into a series of successive daughter products finally reaching a stable end product, a lead isotope (Pb-206). The complete decay series for U-238, which is also known as the uranium-radium decay series, is presented in Table 1. Uranium-238 is not very radioactive because it has a very long half-life of over 4 billion years; however, after being in the ground for hundreds of millions of years, its decay products including Ra-226, have reached equilibrium with U-238, meaning that all of the isotopes have the same radioactivity level. Radium-226 emits radon-222 (Rn-222) as it decays, which can accumulate in poorly ventilated areas such as house basements. Because Rn-222 is an alpha emitter, inhalation of high concentrations of the particulate decay products of this gas can increase cancer risk. As discussed above, gamma rays represent the main concern at a reclaimed waste rock pile because the alpha and beta particles cannot penetrate the soil cover placed during reclamation. However, the uranium group members of this decay series emit only about two percent of the total gamma while the remaining 98 percent of the gamma comes from the radium group members (Sarangi 2000). Therefore the first of the radium group, radium-226 (Ra-226), rather than U-238, is normally the primary radionuclide of concern when reclaiming uranium mines and mills.

Page | 4
Gamma meters are the most common radiation detection devices used in the field because of their simplicity, ruggedness, sensitivity, and relatively low cost (Sarangi 2000). Given that these devices are readily available, they are typically used during and after mine and mill reclamation to identify radiation levels on site. Soil samples are typically taken during mill reclamation and analyzed in a laboratory for radium-226 with the results correlated back to the gamma measurements. The correlation factor developed between gamma measurements and Ra-226 provide an economical and effective method for estimating the Ra-226 activity level over the entire site. The Ra-226 information is then input into an appropriate model to determine the overall radiation emission levels for various cover designs. This information can also be used to estimate the radiation dose for a person working on the site or living near the site as discussed in Section 2.3.
2.3 Radiation Dose and Voluntary Limit The average U.S. citizen receives a natural background radiation dose of about 300 millirems per year (mrem/yr) and the average in Colorado and Utah is about 400 to 450 mrem/yr (Whicker 2008 and Brown 2008). The average dose is higher in these states primarily because of their higher elevation, which results in higher levels of cosmic radiation. There is also an increased level of natural uranium mineralization in the soil, rock, and water in southwest Colorado and southeast Utah. The background dose originates from terrestrial radiation (the ground), cosmic radiation (space), ingested food and water, and inhaled naturally occurring radon and its decay products. We also receive incremental radiation from medical x-rays, air travel, and consumer products such as cigarettes, smoke detectors, and luminous dials on wristwatches (Brown 2012).
Uranium miners, ore transporters, and millers are, under today’s regulatory framework, exposed to much lower levels of radiation than their predecessors. However, they are still exposed to low levels of radiation above natural background levels that result in incremental radiation doses measured in mrem/yr. Scientists know how high doses of radiation can increase the risk of cancer but they do not have precise information on the effects of lower doses. The American Council on Science and Health (ACSH) states that “Because of the uncertainties in our understanding of the effects of low-dose radiation exposure, it is inappropriate to calculate a numerical estimate of cancer risk for any individual who has received a radiation dose of less than 5 rem (5,000 mrem) in a single year or 10 rem (10,000 mrem) over a lifetime above natural background exposure because adequate scientific evidence to support such a calculation does not exist.” (ACSH 2005). Additionally, an official position of the National Health Physics Society is that below 5,000 to 10,000 mrem, risks of health effects are either too small to be observed or non-existent (see the Health Physics Society’s Position Statement: Radiation Risk in Perspective (HPS 2004)).
The greatest source for a potential radiation dose at a reclaimed mine site is the waste rock pile. Only ore is higher in radioactivity but any ore remaining when mining stops is either transported to the mill for processing or placed back underground prior to reclamation. Although no federal, Utah, or Colorado radiological standards exist for reclamation of waste rock piles, Energy Fuels has voluntarily agreed to reclaim the piles at its Utah mines to a standard dose of 100 mrem or less above background to a person camping on or near a reclaimed mine site for 14 days. Fourteen days is the longest period of time that a person is allowed to camp on public land

Page | 5
managed by the BLM and U.S. Forest Service (USFS), and the majority of our mine sites are located on public lands managed by these agencies. BLM established occupancy limits for camping with the publication of a notice in the Federal Register on Oct. 5, 1993. USFS camping limits are set by individual Forest Orders (36 CFR 261.58) but generally allow only 14 consecutive days. An incremental dose of 100 mrem/yr is very low, as it represents an increase of only 25 percent above the average natural background radiation levels for the area. The 100 mrem limit is supported technically by recommendations from the National Council on Radiation Protection and Measurements and is also consistent with the numerical public dose protection standard set by the NRC for uranium milling facilities (see Section 3.0).
The problem with establishing a dose limit is that there is no feasible manner to measure the incremental dose at a site when it represents only a small percentage of the natural background dose. The only feasible method for estimating the dose is to collect physical and radiological data from the site and input this data into a radiological model. There are a number of such models available for this type of work including MILDOS AREA and RESRAD. In this report, we have modeled a typical waste rock pile for the northern Colorado Plateau that is reclaimed using various soil cover depths. As will be discussed in Section 6, the modeling showed that no soil cover is required at a typical waste rock pile in the region to meet the 100 mrem/yr limit for a 14-day exposure period. However, some soil cover would be needed to meet the limit for longer exposure periods (e.g., 2,000 hours per year) and, of course, placement of a soil cover is necessary to meet mined-land revegetation requirements.

Page | 6
3.0 URANIUM RADIATION REGULATIONS Although there are no specific radiation regulations for reclamation of uranium mines in Colorado and Utah, there are many other radiation regulations that must be observed at uranium mines (and mills). These regulations are discussed in this section because many people are unaware of these requirements that are enforced by the Mine Safety and Health Administration (MSHA), the U.S. Environmental Protection Agency (EPA), the Colorado Department of Public Health and Environment (CDPHE), and the Utah Department of Environmental Quality (UDEQ). Both CDPHE and UDEQ are responsible for regulating uranium mills, because Colorado and Utah are “Agreement States”, meaning that they have adopted and enforce regulations equivalent to those of the U.S. Nuclear Regulatory Commission (NRC) that were developed under the Atomic Energy Act. CDPHE and UDEQ are also responsible for enforcing some of EPA’s radon emission regulations for mines and mills.
3.1 Mine Radiation Regulations The uranium ore produced from the Colorado Plateau has relatively low levels of radiation and metal content compared to some of the higher–grade deposits mined in other countries. The average grade of the uranium ore is typically between 0.20 and 0.25 percent uranium. The waste rock, on average, contains about 0.01 percent uranium.
As discussed above, Ra-226 forms Rn-222 as it decays, which can accumulate in poorly ventilated areas and inhalation of radon’s particulate decay products in high concentrations can increase the risk of cancer. Historically, in the 1950s and 1960s, uranium miners contracted cancer while working underground in mines with little or no ventilation (and little if any regulatory oversight) where radon decay product concentrations were extremely elevated. Many of these men also smoked while underground and inhaled large amounts of uranium dust. The Atomic Energy Commission (AEC) historically controlled uranium mining and milling in the United States and the U.S. Congress passed the Radiation Exposure Compensation Act in 1990 that provided benefits to uranium miners (and their families) that had contracted cancer while working in uranium mines between 1942 and 1971. Later the Act was revised to include mill workers and ore transporters in addition to miners.
Starting in the early 1970s, ventilation regulations for controlling radon levels in underground uranium mines were passed and implemented. In underground uranium mines, radiation exposure occurs mainly due to the short-lived decay products of radon, often referred to as radon daughters or radon progeny. The concentration of radon gas is measured in units of picoCuries per liter (ρCi/L). The concentration of radon daughters is measured in working level months (WL) units, which is a measure of the concentration of potential alpha particles per liter of air that could be inhaled. The mine worker’s exposure to radon daughters is expressed in units of Working Level Months (WLM) where one WLM is equal to 1 WL exposure for 170 hours. MSHA now requires that all working areas be ventilated to an average concentration at or below 0.3 WL. This level is used as a precaution to ensure that a person working in the area will not receive greater than 4 WLM in a year. This limit is one to two orders of magnitude less than the exposure rates experienced by uranium miners prior to 1970 (Ringholz 1989). MSHA’s

Page | 7
regulations for radon monitoring and control are found in 30 CFR Part 57.5037 through Part 57.5047.
As a point of comparison, it is not uncommon in the U.S. for natural radon levels in our homes to be near or in excess of EPA’s recommended 4ρCi/L standard for Rn-222. This concentration corresponds to an indoor exposure of about 0.6 WLM per year (based on 24 hours per day exposure for 365 days per year) or comparable to the average radon exposure of modern uranium miners who spend about 2000 hours per year underground. About six percent of homes in the U.S. exceed this concentration (Marcinowski et. al. 1994).
Uranium mine operators are also required to minimize exposure of the general public to radon emissions emanating from their uranium mine ventilation systems. Radon emissions from mine exhaust vents are monitored and controlled in accordance with standards implemented under UDEQ and EPA regulations that require that the radon dose to the nearest receptor (member of the public) be limited to 10 mrem/yr or less. These regulations require that a mine operator monitor the air flow and radon concentration levels at the mine exhaust points and use this information to derive an annual radon emission rate estimate. The annualized emission rate data, the physical parameters of the mine exhaust, and the locations of the nearest residents are entered into EPA’s computer model (Comply-R) or an equivalent, EPA approved model. The model output is compared against the 10 mrem/yr standard to determine compliance or the need for further radon effluent control. This very low dose standard is easily met at remotely located mines, but mines located nearer to residential receptors typically have to implement additional controls to reduce radon emissions. EPA’s regulations for mine radon emissions are found in 40 CFR Part 61, Subpart B.
The EPA only requires estimates of radon emissions from mine ventilations shafts. In its 1985 draft guidance document (EPA 1985), the EPA noted that mine ventilation radon emissions greatly exceed the radon-222 emissions from all other sources, such as waste rock and ore stockpiles on the surface. Such other sources were determined to constitute only between two and three percent of a mine’s total radon emissions.
3.2 Milling Regulations Although mill workers were eligible for compensation under the Radiation Exposure Compensation Act, subsequent studies have shown that an excess of lung cancer among workers in mills during the 1950s and 1960s only occurred in those who had also worked underground. No increased risk of cancer was found among millers who had not worked underground and were exposed to uranium ore during processing operations (Boice 2008). A study conducted in 2003 of nearly 1,500 men employed at seven uranium mills in the Colorado Plateau found that mortality from all causes and all cancers was less than expected based on U.S. mortality rates. There was a statistically significant increase in non-malignant respiratory disease (e.g., emphysema and pneumoconiosis) but cancer deaths were less than the U.S. average (Pinkerton 2003). Similar studies of residences living in the vicinity of mills also showed no increase in fatal cancers compared to the general population (Boice 2007 and 2010).

Page | 8
The NRC and Agreement States (e.g., Colorado and Utah) limit exposure of uranium mill workers to 5,000 mrem/yr (5 rem/yr) above natural background levels (see 10 CFR Part 20 Subpart C, Utah Administrative Code Rule R313-15, and CDPHE 6 CCR 1007-1, Part 4). However, the maximum dose received by workers at modern uranium mills rarely exceeds 500 mrem/yr (0.5 rem). This is because the mills today are designed and engineered to higher standards than in the past and must be operated under requirements to reduce doses to “As Low As Reasonably Achievable” or ALARA levels. ALARA means making every reasonable effort to maintain exposures to ionizing radiation as far below the dose limits as practical, consistent with the purpose for which the licensed activity is undertaken, taking into account the state of technology, the economics of improvements in relation to state of technology, the economics of improvements in relation to benefits to the public health and safety, and other societal and socioeconomic considerations, and in relation to utilization of nuclear energy and licensed materials in the public interest (10 CFR 20.1003).
The NRC and Agreement States limit the radiation dose received by the general public, including ore transporters, to 100 mrem per year above background levels for uranium mills and other uranium fuel cycle facilities. They also limit the radiation dose to 25 mrem/yr to any organ (except the thyroid for which the criterion is 75 mrem) or the whole body, excluding the dose due to radon. These rules are set forth in EPA’s regulation 40 CFR Part 190 and incorporated by reference in NRC’s regulation 10 CFR Part 20.1301, Subpart D. The dose received by various receptors is typically estimated using the MILDOS AREA model, developed by Argonne National Laboratories for the NRC, with the ore stockpiles, tailings impoundments, and uranium dryer stack usually being the largest sources of emissions. As discussed in Section 2.3, Energy Fuels has voluntarily agreed to implement 100 mrem/yr as a radiation dose limit for its reclaimed uranium mines in Utah.
Both the NRC and the EPA regulate radon emissions from tailings impoundments. Older facilities that were in operation prior to 1989 must maintain emissions at or below 20 ρCi/m2 of radon-222 (Rn-222) while operating. Radon-222 emissions at post-1989 tailing impoundments are controlled by limiting the active tailings impoundments to two 40-acre conventional impoundments or one impoundment containing dewatered tailings with no more than 10 acres exposed at any one time. EPA’s regulations for tailings radon emissions are found in 40 CFR Part 61, Subpart W. These regulations may change in the near future, as EPA expects to issue revised draft Subpart W regulations for comment this year.

Page | 9
4.0 URANIUM MINING IN UTAH AND COLORADO This section of the report provides a summary of the: (1) history of uranium mining in the region, (2) geology of the uranium ore deposits, (3) mining methods employed, and (4) mine reclamation practices. The information presented in this section is intended to provide the reader with an overall picture of uranium mining in the area and context for the subsequent sections on waste rock characterization and modeling.
4.1 Mining History Uranium mining in the U.S. and in the Colorado Plateau has experienced a number of booms and busts over the years. Mining and milling of uranium first started in western Colorado during World War II as part of the effort to build nuclear weapons. After the war, the Atomic Energy Commission (AEC) was created to develop a U.S. uranium reserve base and increase production capabilities. AEC aggressively pursued this goal through its ore buying program, which created elevated demand for uranium from the late 1940s through the early 1960s. This program was gradually phased out starting in 1957 and ultimately terminated at the end of 1970. This resulted in the closure of many mines and mills in Colorado and Utah during the 1960s.
By the early to mid-1970s, uranium mining and milling began to pick up again as the AEC began to partially release market controls, allowing sales of uranium to private utilities and increasing the authorized number of nuclear power plants (Odell 1999). Uranium prices climbed to new record levels and there was a surge of activity resulting in the construction of new mines and mills in the area.
By the late 1970s into the 1980s, growth and interest in nuclear power slowed due to lower than expected electric generating need and rising health and environment concerns regarding nuclear power. With the exception of the White Mesa Mill near Blanding, Utah, all the mills in the area had closed by 1988. The White Mesa Mill was able to continue operations into the late-1990s due to the processing of higher grade ores from the breccia pipe mines in northern Arizona and occasional spikes in the price of vanadium, which is extracted as a byproduct of uranium milling from some of the Colorado Plateau ores.
Uranium mining and milling in the area remained dormant from the mid-1990s until 2003 when Cotter restarted some of its mines in western Colorado in response to increasing uranium prices. Numerous companies initiated exploration programs and made plans to reopen their mines. Activity on the Colorado Plateau intensified when the short-term price of uranium reached a record high of $137/pound in mid-2007. The White Mesa Mill resumed processing of ore in 2008 with ore mined from Utah, Colorado, and northern Arizona.
The short-term uranium price has since decreased to about $35/pound at the time of this writing, largely due to the temporary shutdown of nuclear reactors in Japan and a reduction in nuclear energy production in several other countries. The uranium mines in Utah and Colorado are currently on standby. Several uranium mines in northern Arizona continue to operate and ship ore to the White Mesa Mill for processing on an intermittent basis. However, most market analysts believe that the uranium price will gradually increase again as Japan’s reactors come
Page | 10
back on line and new reactors are constructed and brought on line in China, Russia, India, and other countries. In addition, the Russian Megatons to Megawatts Program that supplied much of our country’s uranium needs over the last 20 years ended at the end of 2013 and is not expected to be extended. Energy Fuels remains optimistic that it will be in position to restart many of its mines in the next few years.
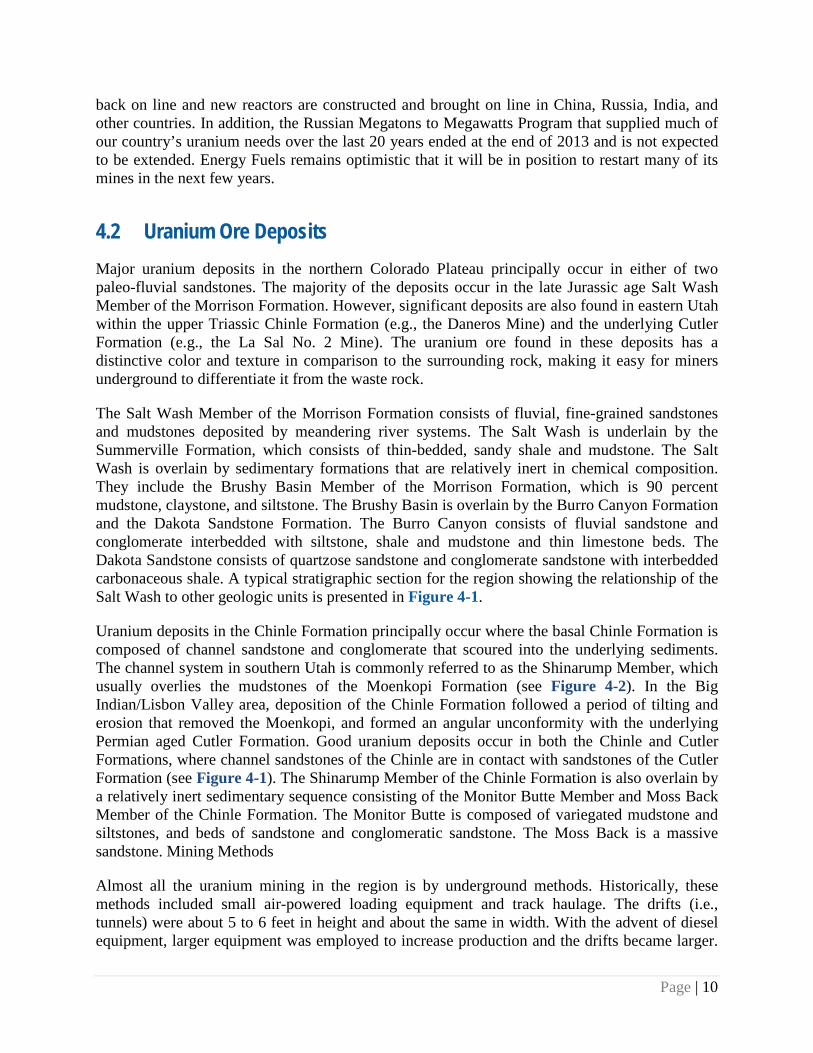
4.2 Uranium Ore Deposits Major uranium deposits in the northern Colorado Plateau principally occur in either of two paleo-fluvial sandstones. The majority of the deposits occur in the late Jurassic age Salt Wash Member of the Morrison Formation. However, significant deposits are also found in eastern Utah within the upper Triassic Chinle Formation (e.g., the Daneros Mine) and the underlying Cutler Formation (e.g., the La Sal No. 2 Mine). The uranium ore found in these deposits has a distinctive color and texture in comparison to the surrounding rock, making it easy for miners underground to differentiate it from the waste rock.
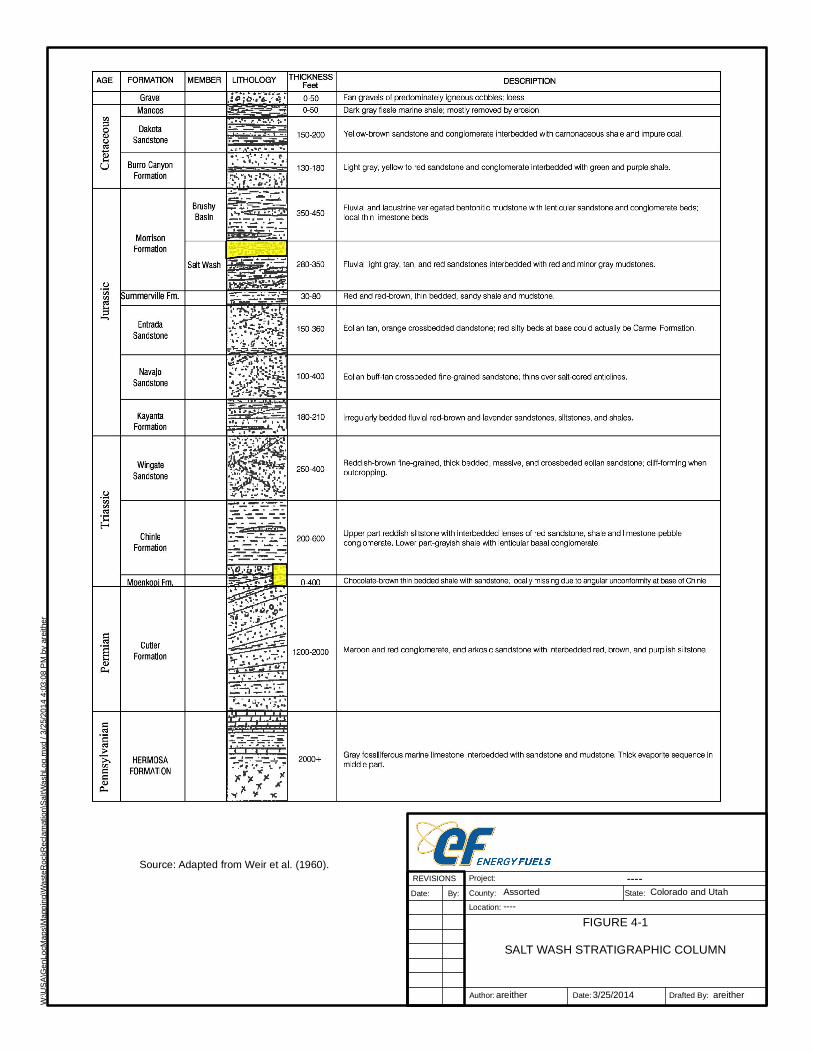
The Salt Wash Member of the Morrison Formation consists of fluvial, fine-grained sandstones and mudstones deposited by meandering river systems. The Salt Wash is underlain by the Summerville Formation, which consists of thin-bedded, sandy shale and mudstone. The Salt Wash is overlain by sedimentary formations that are relatively inert in chemical composition. They include the Brushy Basin Member of the Morrison Formation, which is 90 percent mudstone, claystone, and siltstone. The Brushy Basin is overlain by the Burro Canyon Formation and the Dakota Sandstone Formation. The Burro Canyon consists of fluvial sandstone and conglomerate interbedded with siltstone, shale and mudstone and thin limestone beds. The Dakota Sandstone consists of quartzose sandstone and conglomerate sandstone with interbedded carbonaceous shale. A typical stratigraphic section for the region showing the relationship of the Salt Wash to other geologic units is presented in Figure 4-1.
Uranium deposits in the Chinle Formation principally occur where the basal Chinle Formation is composed of channel sandstone and conglomerate that scoured into the underlying sediments. The channel system in southern Utah is commonly referred to as the Shinarump Member, which usually overlies the mudstones of the Moenkopi Formation (see Figure 4-2). In the Big Indian/Lisbon Valley area, deposition of the Chinle Formation followed a period of tilting and erosion that removed the Moenkopi, and formed an angular unconformity with the underlying Permian aged Cutler Formation. Good uranium deposits occur in both the Chinle and Cutler Formations, where channel sandstones of the Chinle are in contact with sandstones of the Cutler Formation (see Figure 4-1). The Shinarump Member of the Chinle Formation is also overlain by a relatively inert sedimentary sequence consisting of the Monitor Butte Member and Moss Back Member of the Chinle Formation. The Monitor Butte is composed of variegated mudstone and siltstones, and beds of sandstone and conglomeratic sandstone. The Moss Back is a massive sandstone. Mining Methods
Almost all the uranium mining in the region is by underground methods. Historically, these methods included small air-powered loading equipment and track haulage. The drifts (i.e., tunnels) were about 5 to 6 feet in height and about the same in width. With the advent of diesel equipment, larger equipment was employed to increase production and the drifts became larger.

Page | 11
In a typical uranium mine, the rock is drilled using jacklegs operating on compressed air and shot using ammonium nitrate and fuel oil (ANFO) prills. The ore and waste is then scooped up by a load-haul-dump (LHD) loader, which can haul and dump the ore or load the ore into low-profile underground trucks. In shaft mines, the material is hauled to a loading pocket where it is then hoisted to the surface. In decline mines, the ore is hauled up the decline to the surface where it is placed on an ore pad. Waste rock is disposed of (gobbed) underground or hauled to the surface for disposal in a waste rock pile.
Although earlier uranium mines in the region were typically developed by mining into the ore deposit where it was exposed on the side of a mesa, most mines in the region are now accessed by declines and/or shafts depending on the depth of the deposit. In either case, a substantial amount of sedimentary rock of the overlying geologic units is mined during development and placed in the waste rock pile. This material, as discussed above, consists of sandstones, shales, mudstones, and other relatively inert sedimentary rock that contain only small traces (i.e., background levels) of uranium, vanadium, radium, or other associated metals. Accordingly, this material does not typically present a health risk to the miners or the general public when placed in the waste rock area.
The uranium ore is found in thin seams that can range in thickness from less than 1 foot to over 8 feet, with 3 to 4 feet being more typical. Modern diesel mining equipment normally requires entry heights of about 9 feet so some waste rock is mined out along with the ore in order to construct underground workings that accommodate mine equipment. Customarily, miners split shoot the ore and waste (i.e., drill and blast the ore and waste separately) to avoid dilution of the ore. Split shooting invariably results in some of the ore mixing with the waste rock. The uranium deposit is also not uniform, but occurs irregularly in a series of pods. The uranium is mined using random room and pillar methods where production stopes are located in the ore pods and are connected by haulage drifts. The miners attempt to maximize ore extraction by leaving pillars in less mineralized rock while mining out the higher grade material. The drifts between ore pods typically produce waste rock with very little contained ore material while waste rock mined from production stopes tends to have a higher percentage of ore or proto-ore (i.e., lower grade ore material) mixed with the waste rock.
Most waste rock piles consist of a mixture of development rock (from shafts, declines, and underground drifts) and waste rock mined from the production stopes. Accordingly, the waste rock piles are not uniform in composition and it is usually necessary to collect composite samples from a waste rock pile to accurately characterize the material. As discussed earlier, gamma surveys can also be used to assist in characterizing waste rock.
4.3 Mine Reclamation Practices Historically, mines in the United States were not required to be reclaimed and were, for the most part, not reclaimed. State reclamation programs were started in the western U.S. beginning in the late 1960s. Both Colorado and Utah passed and implemented Mine Land Reclamation Acts in the mid-1970s. The mines in operation at that time were required to file mine and reclamation plans with the State and bond for reclamation. New mines had to obtain approval of their mine and reclamation plans before they could begin development.

Page | 12
As discussed previously uranium mining started in the mid-1940s in the Colorado Plateau. Even older mines are present in the Uravan Mineral Belt, which extends along the Colorado and Utah border. These uranium deposits were first mined for radium and vanadium as early as 1910. Some of these pre-law mines (i.e., mines that closed prior to the mid-1970s) have been reclaimed or partially reclaimed by land managing agencies (e.g., the BLM or U.S. Forest Service) or State Abandoned Mine Land (AML) programs. However, most of the pre-law mines in the area remain un-reclaimed because they are generally small, located in remote areas, and have been determined to present little risk to the general public and the environment.
Since reclamation had not previously been required, most of the mines that were in operation when the reclamation laws were passed had not salvaged topsoil and some of them were located in steep areas where it was difficult to achieve good reclamation success. Early attempts at reclaiming steep slopes with limited soil cover were unsuccessful. In addition, erosion of steeper areas and drainages were common problems during operation and reclamation of these mines.
Over time, standard reclamation practices were developed and gradually refined to achieve better reclamation results. Waste rock piles are typically regraded from angle of repose to 3 horizontal to 1 vertical (3H:1V) or less steep and covered with borrowed or salvaged topsoil. Sediment control measures such as sediment basins, berms, ditches, silt fence, and straw bales/wattles are included in the operating and reclamation designs to limit erosion. Native seed mixes and proven seeding methods are used to re-establish vegetation on disturbed areas. Natural drainages are avoided to the extent possible during mine development and drainages constructed in steeper areas are carefully designed to be stable under large storm events.
At uranium mines, it has become common reclamation practice to transport any remaining ore to the mill or place it underground to limit the residual radioactivity on site. Because waste rock radiation levels are relatively low, reclaimed waste rock piles traditionally have not been considered a risk to the public and no state or federal regulations are in place to provide guidance on what is an acceptable radiation level for reclaimed waste rock piles. Most waste rock piles on the Colorado Plateau are also located in remote locations that are visited only infrequently for short periods of time. Accordingly, post-law waste rock piles have generally been reclaimed using standard mine reclamation practices (regrading, covering with soil, and seeding).
State and federal regulators have in recent years questioned whether this reclamation approach adequately protects the public from radiation exposure and have worked to better understand the radiation levels associated with waste rock piles and any risks associated with both reclaimed and un-reclaimed piles. The U.S. Department of Energy (DOE) recently shed some light on this subject with the release of a final draft report (DOE 2014) that assesses the radiological human health risk of historic, un-reclaimed uranium mines. Even though very conservative assumptions were used in the assessment for waste rock (e.g., 95th percentile of mean uranium concentration), the DOE concluded that only an onsite resident or a reclamation worker had an elevated risk of cancer. The risk for a resident (i.e., house built on a waste rock pile) was relatively high due to the high radon concentrations that would occur within the house. The risk to a reclamation worker were mostly associated with exposure at underground mine adits, rather than from the waste rock piles. The next two sections of this report present’s Energy Fuels’ evaluation of waste rock using more typical waste rock concentrations and exposure scenarios.

Page | 13
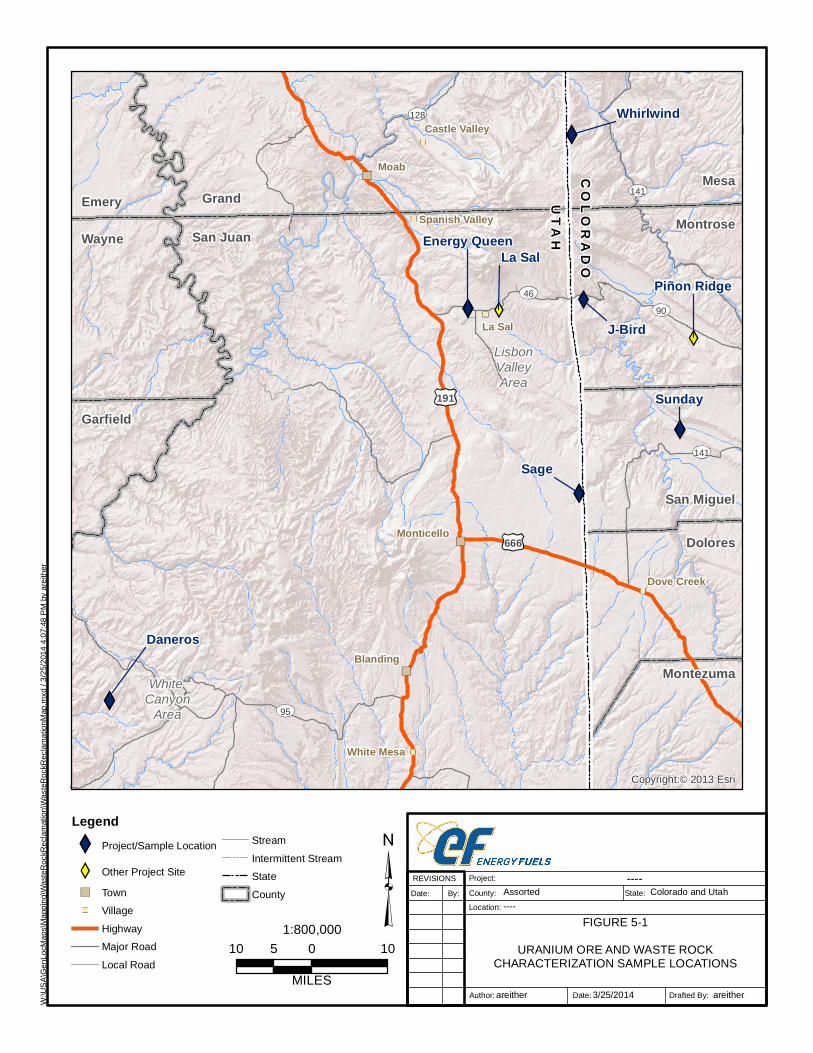
5.0 CHARACTERIZATION OF URANIUM ORE AND WASTE ROCK Energy Fuels has sampled and analyzed both ore and waste rock at a number of mine sites in western Colorado and eastern Utah over the past seven years. These mines are shown on Figure 5-1. Both grab and composite samples were analyzed for metal and radionuclide content. Depending on the original purpose of the sampling, some of the samples were analyzed for a full suite of metals and radionuclides and some were analyzed for a more limited suite of metals or radionuclides. This analytical data is presented in this section and forms the basis for some of the input values into the radiation model in Section 6.
In addition to laboratory analyses, many of the samples were tested using the Synthetic Precipitation Leaching Procedure (SPLP), also referred to as EPA SW-846 Method 1312 to determine their leaching potential. In the SPLP test, the sample is ground to a minute size (i.e., smaller than 9.5 millimeters) prior to leaching with a pH 5 solution. A 20:1 ratio of solution to solid is used in the test. The test is very conservative in that the sample is ground to a very fine size and totally saturated with solution. This test is not representative of typical ore stockpiles or waste rock piles where the material is of coarser texture, unsaturated, and in the case of waste rock, compacted by haulage trucks. However, the test does provide a means to identify the relative potential of metals or radionuclides to leach from the material.
Analytical and test information for ore and waste rock is presented below in Sections 5.1 and 5.2 respectively. The tables presented in these sections do not include all of the analytical results, but rather focus on the constituents of most concern. Section 5.3 presents data collected in a recent study of the soils around three vent shafts at the La Sal Mines Complex. This data indicates that the radioactivity levels in soil around the vent shafts are substantially lower than those observed in the waste rock piles.
5.1 Ore Characterization Table 5.1 presents the laboratory data for ore samples collected at the Whirlwind, Energy Queen, J-Bird, Sunday and Sage Mines. The uranium concentrations are presented as both U-Natural (U-Nat) and U3O8. In the mining industry, U3O8, is the more common form for discussing ore grades and pounds of uranium. The samples range in U3O8 content from 558 to 14,300 mg/kg which is generally discussed as percent U308, e.g., 0.055 to 1.43%. The 0.055% sample from the Whirlwind Mine would have to be blended with higher grade ore before being shipped to the mill. The 1.43% high grade sample from the Energy Queen was collected by hand selecting some of the higher grade material from residual materials left on the ore pad, as the mine is currently flooded. The average grade of U308 shipped from the Colorado Plateau mines to the White Mesa Mill is normally between 0.20 and 0.30%. Accordingly, the sample from the Sage Mine with 0.218% U308 is most representative of the average ore grade for mines in the area.
As expected, Ra-226 values increase with the ore grade and range from 113 ρCi/g for the low-grade Whirlwind sample to 2,070 ρCi/g for the high-grade Energy Queen sample. If we assume an average grade of 0.25% U308 for Colorado Plateau, the average U-238 activity level in the ore can be calculated to be about 700 ρCi/g as shown using the calculation below. Under equilibrium

Page | 14
conditions, Ra-226 would also be 700 ρCi/g. It should be noted that radioactive decay does not occur uniformly and lab testing only provides a measure of the radioactive decay occurring during the period of the analysis (usually 14 to 21 days). Consequently, the calculation below only applies to average radioactivity levels. For example a Whirlwind ore sample had a U308 concentration of 558 mg/kg, which would indicate a Ra-226 activity level of 158 ρCi/g; however, the laboratory analysis showed Ra-226 at 113 ρCi/g.
Activity = [0.0025 g U308/g ore][0.85g U-238/g U308][333,000 ρCi U-238/g U-238] ~ 700 ρCi/g
Within Table 5.1, leachate concentrations that exceed federal drinking water standards are shaded for ease of reference. However, as discussed above, the test provides a relative measure of potential constituents of concern and is not a true indicator of natural leaching of coarser material stockpiled in a semi-arid environment. The four constituents of most concern in the ore are uranium, radium, arsenic, and selenium. This is consistent with what Energy Fuels has observed in mine water that is treated to meet discharge standards at its various mines. Lead, cadmium, and pH were also elevated in some of the samples. The relatively high pH of the samples is normal for the Salt Wash ores. Typically, the pH of untreated mine water ranges between 7.5 and 8.5 standard units. An SPLP test has not been done on the Daneros ore (from the Chinle Formation), but it would be expected to have a lower pH than the other ores because the ore contains iron and sulfide minerals and exhibits some acid-generating potential. The Chinle ores do, however, contain higher concentrations of calcite than the Salt Wash ores, which helps to buffer acid generation.
5.2 Waste Rock Characterization As discussed in Section 4.3, much of the initial waste rock generated during mine development has low levels of radionuclides. This is evident in Table 5.2, which lists the Ra-226 and thorium-230 (Th-230) activity levels from quarterly sampling of the waste rock pile at the Daneros Mine. During development of the declines through relatively inert rock, the Ra-226 activity levels ranged from 3.9 to 15.5 ρCi/g and averaged about 8.3 ρCi/g. Once the mine advanced into the ore body and commenced full production, the Ra-226 activity levels ranged from 32.4 to 59.3 ρCi/g with an average of 42.3 ρCi/g. Th-230 activity levels closely approximated Ra-226 levels, indicating that the mined material is in radioactive equilibrium. As shown in Table 2.1, Th-230 is part of the U-238 decay chain along with Ra-226.
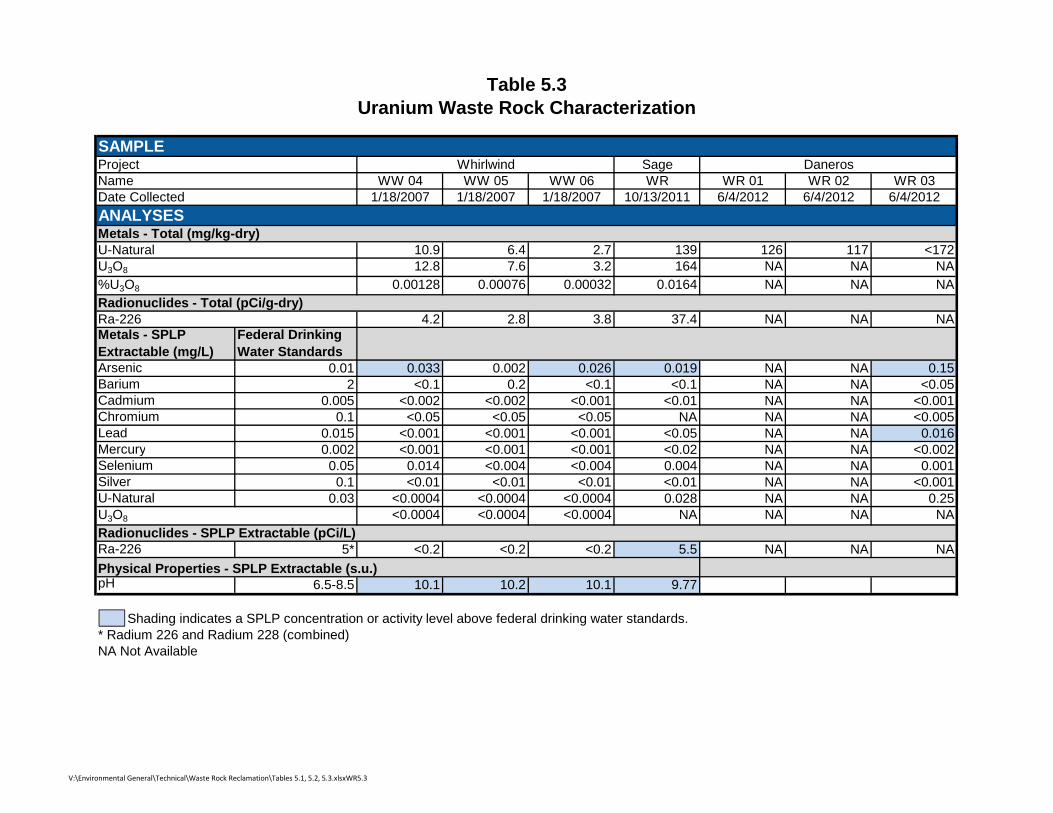
Table 5.3 provides additional waste rock analyses and SPLP testing from several mines. The first three samples were individual samples collected in a working face at the Whirlwind Mine. Given that they were discrete samples collected prior to drilling and blasting, they did not contain any ore material. The Ra-226 activity levels were relatively low and ranged from 2.8 to 4.2 ρCi/g. The four samples from the Sage and Daneros mines were collected at the waste rock piles. These samples had uranium (U-natural) concentrations ranging from 117 to less than 172 mg/kg with an average concentration of about 127 mg/kg for the three samples with known values. If we assume equilibrium, the average uranium concentration of 127 mg/kg equates to a Ra-226 activity level of 42.3 ρCi/g. The Ra-226 activity level for the Sage Mine sample was 37.4 ρCi/g.

Page | 15
The SPLP tests for the waste rock samples are also presented in Table 5.3. The results indicate that this material is relatively inert with very low leachate concentrations for most constituents. Arsenic was the only constituent that was detected to any extent while lead and Ra-226 were just slightly elevated in one instance. It was not surprising that all the pH values for the Whirlwind and Sage mines were elevated, as this material originates from the Salt Wash Member of the Morrison Formation.
As can be seen from the analytical and SPLP test data, the waste rock at uranium mines in the region contains substantially lower metal concentrations and radionuclide activity levels than the ore (e.g., approximately 40 ρCi/g Ra-226 for waste rock compared to 700 ρCi/g Ra-226 for ore). In addition, the waste rock has very little potential to leach metals or radionuclides. By comparison, Ra-226 analytical results from surface sampling at the proposed Piñon Ridge Mill site, which is a greenfield site, ranged from 0.13 to 2.6 ρCi/g (excluding outliers) with a median of 0.97 ρCi/g. However, gamma levels and Ra-226 activity levels were elevated in the drainages with Ra-226 levels as high as 24 ρCi/g being identified. The elevated measurements in the drainages are not surprising, given that the drainages originate in outcrops of the Salt Wash Member of the Morrison Formation in the mesa above the proposed mill site. Piñon Ridge is located near Paradox, Colorado (see Figure 5-1).
5.3 Ventilation Shaft Study Energy Fuels conducted soil sampling around three of its ventilation shafts at the La Sal Mines Complex in conjunctions with BLM and USFS personnel in April 2013 (Energy Fuels 2013). The La Sal Mines Complex is located near the town of La Sal Utah (see Figure 5-1) and consists of the La Sal Decline, Beaver Shaft, Snowball Decline, and the Pandora Decline. The sampling was done at the request of the aforementioned agencies, as concerns had been expressed during a public comment period regarding radioactive dust accumulating near ventilation shafts. The areas around three ventilation shafts were checked with a gamma meter and soil samples were collected to determine the extent of radionuclide concentrations above background levels.
The gamma survey determined that background gamma radiation levels in the general area ranged from 4 to 8 microRoentgens per hour (µR/hr) with an average of 6 µR/hr. The maximum gamma levels reported around the shafts for waist-level measurements were 34, 23, and 16 µR/hr at the Snowball 2, Pandora 2, and Pandora 10, respectively. A marked reduction in gamma readings were observed as the distance from the vent shafts increased with background levels being present within 15 feet at two of the shafts and within 33 feet at the third shaft. Ra-226 activity levels in the surface soil samples ranged from 0.3 to 3.1 ρCi/g. Metal concentrations were also very low and well below all risk-based standards. As discussed above, natural background Ra-226 analytical results from surface sampling at the proposed Piñon Ridge Mill ranged from 0.13 to 2.6 ρCi/g (excluding outliers) with a median of 0.97 ρCi/g.
Although, radiation activity and metal levels are very low around the vent shafts, Energy Fuels has agreed to remove the top one inch of soil around the shafts during reclamation and dispose of the material in the shafts.
Page | 16
6.0 RADIOLOGICAL DOSE RATE ASSESSMENT Energy Fuels commissioned Dr. Erich Tiepel of Golder Associates Inc. (Golder) to model a typical waste rock pile for the northern Colorado Plateau region to determine the radiological dose that could be received at a reclaimed (regraded with soil cover and vegetation) and un-reclaimed (i.e., no soil cover) waste rock pile. As discussed in Section 2.3, Energy Fuels has voluntarily agreed to reclaim its uranium mines to achieve a standard dose of 100 mrem or less above background to a person camping on or near a reclaimed mine site for 14 days. This is the longest period that a person can legally camp on public lands managed by the BLM. The modeling results, which are presented in Appendix A, indicate that the 100 mrem per 14-day exposure dose limit can be met without applying any soil cover. The modeling effort also evaluated the dose received by a person on the waste rock pile for 2,000 hours per year. Under that scenario, a relatively thin soil cover would be needed to maintain the dose at less than 100 mrem/yr above background.
The modeling was performed using the RESRAD v6.5 model, developed by the Argonne National Laboratory and which is a jointly sponsored transport and dose calculation code developed for the DOE and the NRC for site site-specific dose assessments of residual radioactivity. The model is capable of calculating the dose to an individual from a known source with a wide variety of radionuclides and exposure pathways.
The data input and assumptions made in the modeling effort are presented in Section 6.1. The results are evaluated and discussed in Section 6.2.
6.1 Model Input Parameters The rationales for selecting the input parameters used in the RESRAD modeling are discussed below. In general, average to conservative parameters were selected.
Waste rock pile area, height, and volume: A 10-acre waste rock pile on a 2H:1V hillside slope was conservatively selected because it represents a larger than average waste rock pile for the region. As shown on Figure 6-1, the pile was assumed to have a maximum height of 40 feet and a capacity of 12,000,000 cubic feet (approximately 440,000 cubic yards).
Waste rock characteristics: A density of 130 pounds per cubic foot and a moisture content of 4 percent were selected because they are representative of typical conditions for waste rock piles in the area. A porosity of 0.30 percent and a hydraulic conductivity of 10 meters per year were selected, as the values are typical for a well compacted, fine-grained sand.
Radionuclide activity levels: A uranium concentration of 125 mg/kg was selected based on the information presented in Table 5.3 in which development waste rock averaged 6.7 mg/kg and production waste rock averaged 127 mg/kg. The model then automatically assigned specific activity ratios for U-234, U-235, and U-238.
In addition to the uranium isotopes, Ra-226, Th-230, and Pb-210 were selected for inclusion in the model output results because they have much longer half-lives than the other radionuclides,

Page | 17
which are all implicitly accounted for in the model under equilibrium conditions. The Ra-226, Th-230, and Pb-210 activity level of 41.3 ρCi/g assumed equilibrium with the selected uranium concentration of 125 mg/kg. The Ra-226 activity level of 41.3 ρCi/g compares favorably with the average Ra-226 activity level of 42.3 ρCi/g measured in three waste rock samples collected at the Daneros Mine in 2010 and 2011 (see Table 5.2). The Daneros Mine is one of Energy Fuels higher grade mines on the Colorado Plateau; accordingly, the waste rock would also tend to contain higher levels of radionuclides.
Although the number of waste rock samples analyzed is not as large as one would like, the data input compares favorably with activity levels reported by the EPA and DOE. The EPA has reported average Ra-226 activity levels in waste rock piles of 23.7 ρCi/g (EPA 1991) while the DOE recently reported an average activity level for U-238 of 50.2 ρCi/g based on the reported results for 36 discrete samples at sites in Utah and Colorado (DOE 2014). DOE very conservatively conducted its modeling using the 95th percentile value of 70 ρCi/g.
Soil cover characteristics: The soils in the region range from a sandy loam to a clayey loam, depending on whether the soil was derived from the sandstone formations or the shale/mudstone formations. A sandy loam with a specific gravity of 1.33 g/cm3 was conservatively used in the model, as it is less dense than a clayey loam and is more easily penetrated by gamma rays.
Climate data: Data from the PRISM Climate Group shows that our mine sites in Utah and Colorado receive between 8 and 19 inches of precipitation per year. Ten inches of precipitation was conservatively used in the model, as more precipitation results in greater saturation of the soil cover and reduced radiation levels. A wind speed of 2 m/s and an average temperature of 53ºF were selected and are consistent with meteorological data collected at the Piñon Ridge site in 2008 and 2009.
Exposure pathways and durations: The model was set to consider external gamma from the waste rock, inhalation, soil ingestion, and radon exposure for the uncovered waste rock scenario. For the soil cover scenario, inhalation and soil ingestion were removed from the modeling, as the soil cover blocks those pathways. Food consumption from vegetation grown on the waste rock pile and water consumption from runoff, streams, or groundwater were also removed from consideration because this land use is highly unlikely.
Two exposure durations were modeled. The first duration was for 336 hours per year, which is equivalent to 24 hours a day for 14 days. This duration represented a person camping on the waste rock pile for 14 days. The second duration was for 2,000 hours per year and represented someone on the site for 40 hours a day over a 50 week period. This could be mine operations personnel or a nearby resident, although it is very unlikely that a nearby resident would be present on the waste rock pile for 2,000 hours a year.
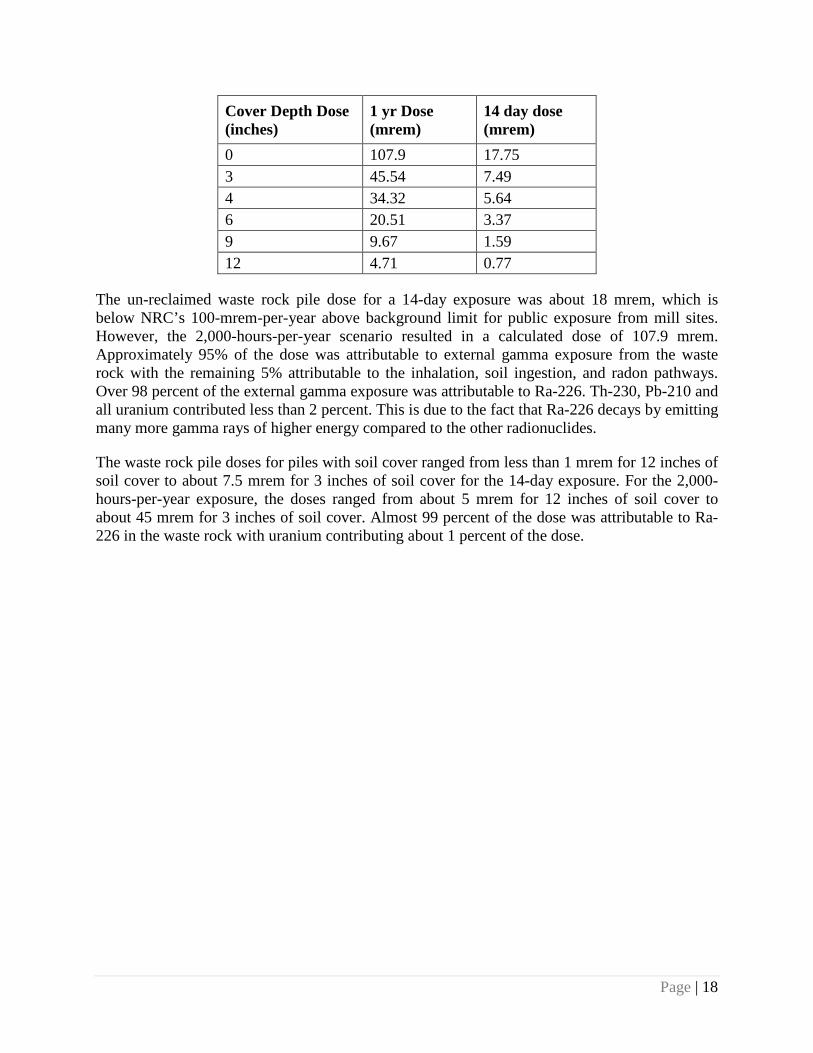
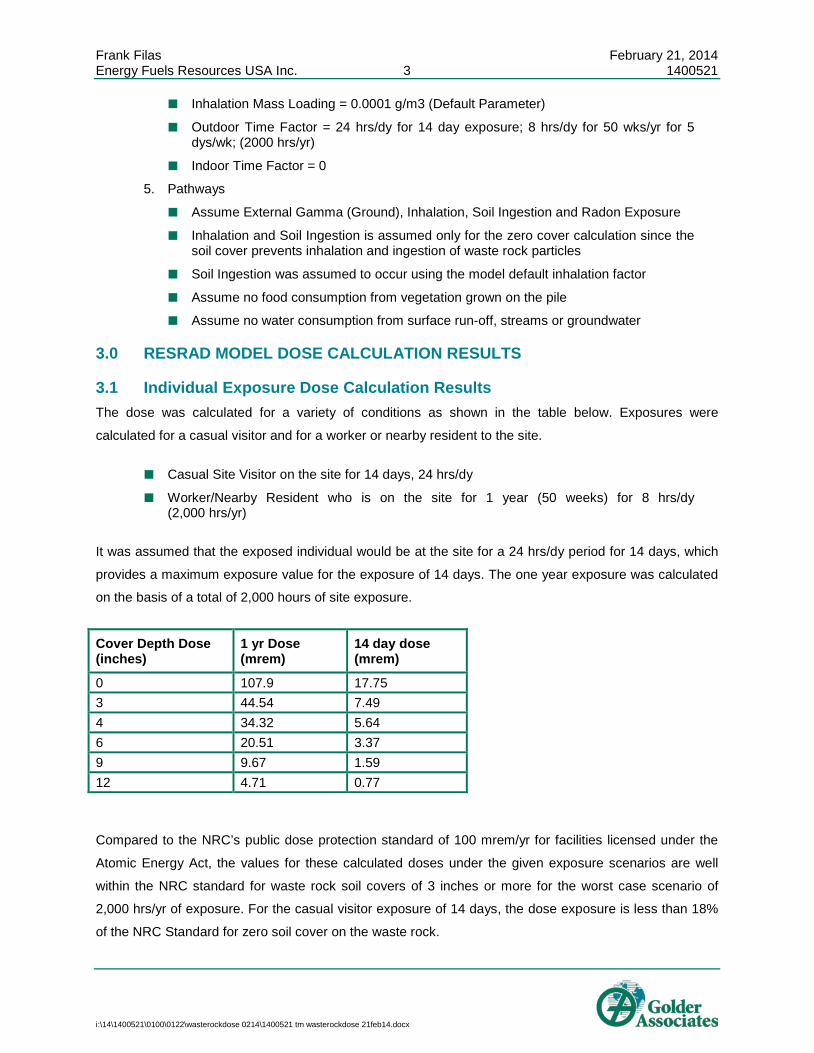
6.2 Dose Calculation Results The RESRAD dose calculation results are presented in Golder’s technical memorandum that is included as Appendix A to this report. The results are summarized below for uncovered waste rock and waste rock with soil cover of 3, 4, 6, 9, and 12 inches.
Page | 18
Cover Depth Dose (inches)
1 yr Dose (mrem)
14 day dose (mrem)
0 107.9 17.75 3 45.54 7.49 4 34.32 5.64 6 20.51 3.37 9 9.67 1.59 12 4.71 0.77
The un-reclaimed waste rock pile dose for a 14-day exposure was about 18 mrem, which is below NRC’s 100-mrem-per-year above background limit for public exposure from mill sites. However, the 2,000-hours-per-year scenario resulted in a calculated dose of 107.9 mrem. Approximately 95% of the dose was attributable to external gamma exposure from the waste rock with the remaining 5% attributable to the inhalation, soil ingestion, and radon pathways. Over 98 percent of the external gamma exposure was attributable to Ra-226. Th-230, Pb-210 and all uranium contributed less than 2 percent. This is due to the fact that Ra-226 decays by emitting many more gamma rays of higher energy compared to the other radionuclides.
The waste rock pile doses for piles with soil cover ranged from less than 1 mrem for 12 inches of soil cover to about 7.5 mrem for 3 inches of soil cover for the 14-day exposure. For the 2,000-hours-per-year exposure, the doses ranged from about 5 mrem for 12 inches of soil cover to about 45 mrem for 3 inches of soil cover. Almost 99 percent of the dose was attributable to Ra-226 in the waste rock with uranium contributing about 1 percent of the dose.

Page | 19
7.0 SUMMARY AND RECOMMENDATIONS Energy Fuels has voluntarily agreed to reclaim its waste rock piles at its Utah mines to a standard dose of 100 mrem or less above background for a person camping on or near a reclaimed mine site for 14 days. The 100 mrem limit is consistent with recommendations made by the National Council on Radiation Protection and Measurements and with the numerical public dose protection standard set by the NRC in 10 CFR Part 20.1301, Subpart D (and equivalent sections of Colorado and Utah regulations). The 100 mrem dose represents an incremental dose of about 25 percent above average natural background levels for southwest Colorado and southeast Utah.
The dose at a typical waste rock pile was determined using the RESRAD model with data input based on previous sampling and analysis of waste rock and average to conservative physical parameters for the waste rock and soil cover. The modeling results showed that the 100 mrem limit for a 14-day exposure would not be exceeded on a typical waste rock pile even if no soil cover was present. It also showed that with as little as three inches of soil cover, the dose received over a 2,000-hours-per-year exposure period would be less than 100 mrem above background.
Analytical and leach test data for uranium ores indicate that this material is more than an order of magnitude more radioactive than the waste rock and more susceptible to leaching of both metals and radionuclides. However, ore is typically stockpiled on site for a short time period and is shipped to a mill or is placed back underground prior to reclamation. A study conducted at the La Sal Mines Complex vent shafts demonstrate that radiation and metal levels in the soil near the vents are slightly elevated above background levels within a limited area around each vent.
Energy Fuels believes that the data and modeling results presented herein supports the conventional wisdom regarding uranium mine reclamation. Open declines, adits, and shafts at abandoned uranium mines represent the greatest risk to the general public in terms of both potential physical and radiological risk. The radiation levels at the remaining surface facilities including the waste rock piles are typically relatively low and do not represent a large risk to the general public, especially in those cases where the mines are located in remote locations. This opinion is supported by the risk study recently completed by the DOE, which was based on conservative assumptions (DOE 2014). The DOE study did demonstrate that placing a home on top of a waste pile presents a greater level of risk due to the potential for radon to accumulate within the house. It may be a good practice to place deed restrictions on building structures on top of waste rock piles located on private and state land.
With regard to mine reclamation practices, the analytical data support the practice of removing any residual ore from the mine surface prior to reclamation and over-excavating the ore pad area where metals and radionuclides may have leached into the surficial soils. The modeling results show that the radiation exposure at uranium mine waste rock piles is relatively low and that even a thin cover of soil will reduce radiation levels to even lower levels. Energy Fuels believes that the soil cover thickness on waste rock piles should be based on the amount of soil necessary to establish a stable vegetative cover rather than radiation exposure levels. Radiation levels in the surface soils around ventilation shafts are even lower; however, the upper one inch of soils near the vent can easily be scraped off prior to reclamation and placed in the vent shafts.

Page | 20
Finally, the data and modeling demonstrate that Ra-226 is the primary radionuclide of concern when reclaiming surface disturbance at uranium mines. Sampling and analysis for Ra-226 in combination with a gamma survey prior to and after reclamation can provide the mine operator and regulatory agencies with a level of assurance that the reclaimed site does not present a risk to nearby residents and the general public.

Page | 21
8.0 REFERENCES American Council on Science and Health (ACSH) 2005. The Health Effects of Low-Level Radiation. New York, NY September 2005.
Boice, John D., Mumma, Michael T., and Blot, William J. 2007. Cancer and Noncancer Mortality in Populations Living Near Uranium and Vanadium Mining and Milling Operations in Montrose County, Colorado, 1950-2000. Radiation Research, Bozeman, MT July 2007.
Boice, J.D., Cohen S.S., Mumma M.T., Chadda B., and Blot, W.J. 2008. A Cohort Study of Uranium Millers and Miners of Grants, New Mexico, 1979-2005. Journal of Radiological Protection, Devon, England 2008.
Boice, John D., Mumma, Michael T., and Blot, William J. 2010. Cancer Incidence and Mortality in Populations Living Near Uranium Milling and Mining Operations in Grants, New Mexico, 1950-2004. Radiation Research, Bozeman, MT, July 2010.
Brown, Steven H. 2012. A Citizens Guide to Uranium Mining, SENES Consultants Limited, Englewood, CO, February 2012.
Canadian Centre for Occupational Health and Safety (CCOHS), 2007. Physical Agents, Radiation – Quantities and Units of Ionizing Radiation http://www.ccohs.ca/oshanswers/phys_agents/ionizing.html
Chambers, Douglas and Ho, Aron, 2008. Review of Derived Air Concentrations, SENES Consultants Limited, Richmond Hill, Ontario, June 2008.
Energy Fuels Resources (USA) Inc. (Energy Fuels) 2013. Vent Shaft Gamma Survey and Sampling Report, Lakewood, CO, August 2013.
Health Physics Society 2004. Health Physics Society’s Position Statement: Radiation Risk in Perspective . HPS.org
Marcinowski, F., R.M. Lucas and W.M. Yeager 1994. National and Regional Distributions of Airborne Radon Concentrations in U.S. Homes. Health Phys. 66(6): 699-706.
Odell, R. 1999. Getting the Cake in the Can: A Short United States Uranium History from the Rocky Mountain Scout Viewpoint. Casper, WY 1999.
Pinkerton, L.E., Bloom T.F., Hein, M.J., Ward, E.M., 2004. Mortality Among a Cohort of Uranium Mill Workers: An Update, Occupational and Environmental Medicine, London, England 2004.
Ringholz, Raye C. 1989. Uranium Frenzy, W.W. Norton, New York, NY 1989.
Sarangi, A. K. 2000. Uranium and its Measurement in Ore by Radiometric Method, Journal Mines, Metals and Fuels, 2000 Annual Review, India 2000.

Page | 22
U.S. Department of Energy (DOE), 2001. Characteristics of Uranium and Its Compounds, Office of Environmental Management, Germantown, MD, Fall 2001.
U.S. Department of Energy (DOE) 2014. Abandoned Uranium Mines Assessment of Radiological Risk to Human Health and the Environment Topic Report, LMS/AUM/S11072, Office of Legacy Management, Washington D.C., February 2014.
U.S. Environmental Protection Agency (EPA), 1985. Draft Background Information Document, Standard for Radon-222 Emissions from Underground Uranium Mines, Office of Radiation Programs, Washington D.C. February 14, 1985.
U.S. Nuclear Regulatory Commission (NRC), 2006. Radiation Protection and the NRC, Office of Public Affairs, Washington D.C., February 2006.
Whicker, F. Ward 2008. Natural Radiation: Sources, Relevance and Uranium Levels, Uranium Symposium and Workshop 2008, Colorado State University, Fort Collins, CO, February 2008.

TABLES
Element / Isotope Emission Half Life GroupUranium238 (U238) α 4.5 x 10⁹ years
Thorium234 (Th234) β, γ 24.1 days
Protactinium234 (Pa234) β, γ 1.18 min
Uranium234 (U234) α 2.6 x 10⁵ years
Thorium230 (Th230) α, γ 8 x 10⁴ years
Radium226 (Ra226) α, γ 1580 years
Radon222 (Rn222) α, γ 3.82 days
Polonium218 (Po218) α 3.05 min
Lead214 (Pb214) β, γ 26.8 min
Bismuth214 (Bi214) β, γ 19.7 min
Polonium214 (Po214) α 164 micro sec
Lead210 (Pb210) β, γ 22 years
Bismuth210 (Bi210) β 5 days
Polonium210 (Po210) α 138.3 days
Lead206 (Pb206)α - alpha emissionsβ - beta emissionsγ - gamma emissionsSource: A.K. Sarangi. 2000. Uranium and Its Measurement in Ore by Radiometric Method . Journal Mines, Metals and Fuels, Annual Review, 2000.
Table 2.1Uranium-Radium Decay Series
Uranium
Group
Radium
Group
Stable
V:\Environmental General\Technical\Waste Rock Reclamation\Uranium‐Radium Decay Series.xlsxSheet1

SageWW 01 WW 02 WW 03 LG Ore
1/18/2007 1/18/2007 1/18/2007 1/10/2008 1/10/2008 1/10/2008 1/10/2008 12/8/2011
474 4000 5100 12100 883 984 1160 1850558 4720 6020 14300 1040 1160 1360 2180
0.0558 0.472 0.602 1.43 0.104 0.116 0.136 0.0218
113 482 1170 2070 334 274 335 391Metals - SPLP Extractable (mg/L)
Federal Drinking Water Standards
Arsenic 0.01 0.715 0.228 1.15 0.048 0.427 0.028 0.043 0.3Barium 2 <0.1 <0.1 <0.1 <0.1 <0.1 <0.1 <0.1 <0.1Cadmium 0.005 <0.002 <0.002 <0.002 0.006 0.002 0.003 0.004 <0.01Chromium 0.1 <0.05 <0.05 <0.05 <0.05 <0.05 <0.05 <0.05 NALead 0.015 0.004 <0.001 0.001 0.018 0.089 1.32 1.23 <0.05Mercury 0.002 <0.001 <0.001 <0.001 <0.001 <0.001 <0.001 <0.001 <0.02Selenium 0.05 0.0216 0.064 0.173 0.019 0.528 0.25 0.242 0.22Silver 0.1 <0.01 <0.01 <0.01 <0.01 <0.01 <0.01 <0.01 <0.01U-Natural 0.03 0.11 1.6 1.09 0.0458 0.0824 0.0225 0.0213 0.37
0.13 1.88 1.28 0.054 0.0971 0.0265 0.0251 NA
Ra-226 5* 6.7 24.2 134 36.8 2.7 2 17.1 172
pH 6.5-8.5 10.1 9.89 9.87 7.9 6.58 8.44 8.02 8.22
Shading indicates a SPLP concentration or activity level above federal drinking water standards.* Radium 226 and Radium 228 (combined)NA Not Available
Table 5.1Uranium Ore Characterization
ANALYSESMetals - Total (mg/kg-dry)U-Natural
SAMPLEProjectNameDate Collected
Whirlwind Energy Queen Whirlwind J-Bird Sunday
Ra-226
Physical Properties - SPLP Extractable (s.u.)
Radionuclides - SPLP Extractable (pCi/L)
U3O8
Radionuclides - Total (pCi/g-dry)%U3O8
U3O8
V:\Environmental General\Technical\Waste Rock Reclamation\Tables 5.1, 5.2, 5.3.xlsxOre5.1

SAMPLEProjectName Vent Decline Main Decline Vent Decline Main Decline Waste Pile Waste Pile Waste Pile Waste Pile Waste PileDate Collected 8/14/2009 8/14/2009 11/18/2009 11/18/2009 2/4/2010 5/10/2010 7/20/2010 11/18/2010 3/23/2011ANALYSESRadionuclides - Total (pCi/g-dry)Ra-226 15.5 8.3 4 5.6 12.4 3.9 32.4 59.3 35.2Th-230 14 7.3 4.2 6.6 12 3.3 31 78 34
Table 5.2Daneros Waste Rock Analyses
Daneros
V:\Environmental General\Technical\Waste Rock Reclamation\Tables 5.1, 5.2, 5.3.xlsxWR5.2
SageWW 04 WW 05 WW 06 WR WR 01 WR 02 WR 03
1/18/2007 1/18/2007 1/18/2007 10/13/2011 6/4/2012 6/4/2012 6/4/2012
10.9 6.4 2.7 139 126 117 <17212.8 7.6 3.2 164 NA NA NA
0.00128 0.00076 0.00032 0.0164 NA NA NA
4.2 2.8 3.8 37.4 NA NA NAMetals - SPLP Extractable (mg/L)
Federal Drinking Water Standards
Arsenic 0.01 0.033 0.002 0.026 0.019 NA NA 0.15Barium 2 <0.1 0.2 <0.1 <0.1 NA NA <0.05Cadmium 0.005 <0.002 <0.002 <0.001 <0.01 NA NA <0.001Chromium 0.1 <0.05 <0.05 <0.05 NA NA NA <0.005Lead 0.015 <0.001 <0.001 <0.001 <0.05 NA NA 0.016Mercury 0.002 <0.001 <0.001 <0.001 <0.02 NA NA <0.002Selenium 0.05 0.014 <0.004 <0.004 0.004 NA NA 0.001Silver 0.1 <0.01 <0.01 <0.01 <0.01 NA NA <0.001U-Natural 0.03 <0.0004 <0.0004 <0.0004 0.028 NA NA 0.25
<0.0004 <0.0004 <0.0004 NA NA NA NA
Ra-226 5* <0.2 <0.2 <0.2 5.5 NA NA NA
pH 6.5-8.5 10.1 10.2 10.1 9.77
Shading indicates a SPLP concentration or activity level above federal drinking water standards.* Radium 226 and Radium 228 (combined)NA Not Available
Physical Properties - SPLP Extractable (s.u.)
Radionuclides - SPLP Extractable (pCi/L)
Ra-226
U-NaturalU3O8
Radionuclides - Total (pCi/g-dry)%U3O8
U3O8
Table 5.3Uranium Waste Rock Characterization
Date CollectedANALYSESMetals - Total (mg/kg-dry)
Whirlwind DanerosSAMPLE ProjectName
V:\Environmental General\Technical\Waste Rock Reclamation\Tables 5.1, 5.2, 5.3.xlsxWR5.3

FIGURES
REVISIONS
Date: By:
Project:
County:
Location:
State:
Author: Date: Drafted By:
W:\U
SA
\Gen
LocM
aps\
Map
ping
\Was
teR
ockR
ecla
mat
ion\
SaltW
ashL
og.m
xd /
3/25
/201
4 4:
03:0
8 P
M b
y ar
eith
er
FIGURE 4-1
SALT WASH STRATIGRAPHIC COLUMN
----Assorted Colorado and Utah----
areither 3/25/2014 areither
AJR
Source: Adapted from Weir et al. (1960).

W:\U
SA
\Gen
LocM
aps\
Map
ping
\Was
teR
ockR
ecla
mat
ion\
Whi
teC
anyo
nLog
.mxd
/ 3/
25/2
014
4:03
:26
PM b
y ar
eith
er
Source: Geology and Ore Depositsof the White Canyon Area
San Juan and Garfield Counties, UtahGeological Survey Bulletin 1125
Figure 3 - Generalized profile of the sedimentaryunits exposed in the White Canyon area.
REVISIONS
Date: By:
Project:
County:
Location:
State:
Author: Date: Drafted By:
FIGURE 4-2
CHINLE STRATIGRAPHIC COLUMNWHITE CANYON AREA
----Assorted Colorado and Utah----
areither 3/25/2014 areither
AJR
REVISIONS
Date: By:
Project:
County:
Location:
State:
Author: Date: Drafted By:
Moab
Monticello
La Sal
Castle Valley
Spanish Valley
Blanding
White Mesa
Dove Creek
San Juan
MesaGrand
Montrose
San Miguel
Dolores
CO
LO
RA
DO
UT
AH
Montezuma
Wayne
Garfield
Emery
191
666
141
90
128
46
141
95
Sage
Sunday
Whirlwind
Energy Queen
J-Bird
Daneros
La Sal
Piñon Ridge
White Canyon
Area
LisbonValleyArea
Copyright:© 2013 Esri
Legend
Project/Sample Location
Other Project Site
Town
Village
Highway
Major Road
Local Road
Stream
Intermittent Stream
State
County
10 0 105
MILES
1:800,000 FIGURE 5-1
URANIUM ORE AND WASTE ROCKCHARACTERIZATION SAMPLE LOCATIONS
----Assorted Colorado and Utah----
areither 3/25/2014 areither
AJR
W:\U
SA
\Gen
LocM
aps\
Map
ping
\Was
teR
ockR
ecla
mat
ion\
Was
teR
ockR
ecla
mat
ionM
ap.m
xd /
3/25
/201
4 4:
07:4
8 P
M b
y ar
eith
er


APPENDIX
TECHNICAL MEMORANDUM
i:\14\1400521\0100\0122\wasterockdose 0214\1400521 tm wasterockdose 21feb14.docx Golder Associates Inc.
44 Union Boulevard, Suite 300 Lakewood, CO 80228 USA
Tel: (303) 980-0540 Fax: (303) 985-2080 www.golder.com
Golder Associates: Operations in Africa, Asia, Australasia, Europe, North America and South America
Golder, Golder Associates and the GA globe design are trademarks of Golder Associates Corporation
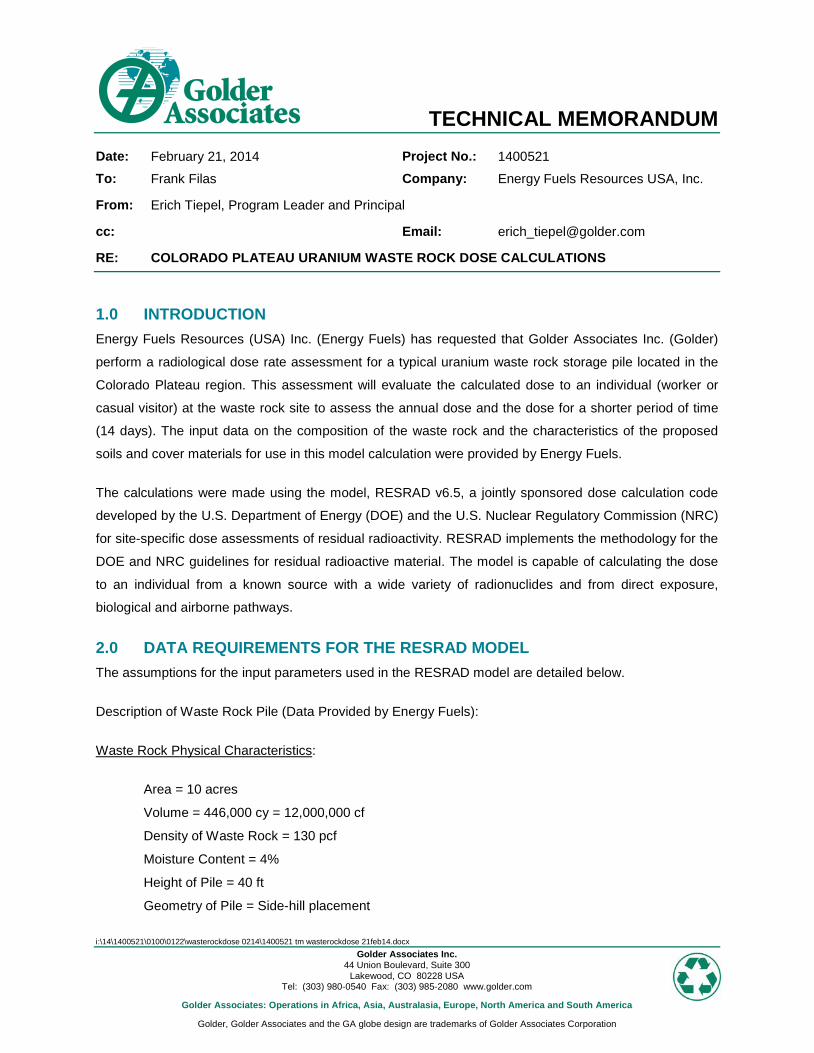
1.0 INTRODUCTION Energy Fuels Resources (USA) Inc. (Energy Fuels) has requested that Golder Associates Inc. (Golder)
perform a radiological dose rate assessment for a typical uranium waste rock storage pile located in the
Colorado Plateau region. This assessment will evaluate the calculated dose to an individual (worker or
casual visitor) at the waste rock site to assess the annual dose and the dose for a shorter period of time
(14 days). The input data on the composition of the waste rock and the characteristics of the proposed
soils and cover materials for use in this model calculation were provided by Energy Fuels.
The calculations were made using the model, RESRAD v6.5, a jointly sponsored dose calculation code
developed by the U.S. Department of Energy (DOE) and the U.S. Nuclear Regulatory Commission (NRC)
for site-specific dose assessments of residual radioactivity. RESRAD implements the methodology for the
DOE and NRC guidelines for residual radioactive material. The model is capable of calculating the dose
to an individual from a known source with a wide variety of radionuclides and from direct exposure,
biological and airborne pathways.
2.0 DATA REQUIREMENTS FOR THE RESRAD MODEL The assumptions for the input parameters used in the RESRAD model are detailed below.
Description of Waste Rock Pile (Data Provided by Energy Fuels):
Waste Rock Physical Characteristics:
Area = 10 acres
Volume = 446,000 cy = 12,000,000 cf
Density of Waste Rock = 130 pcf
Moisture Content = 4%
Height of Pile = 40 ft
Geometry of Pile = Side-hill placement
Date: February 21, 2014 Project No.: 1400521
To: Frank Filas Company: Energy Fuels Resources USA, Inc.
From: Erich Tiepel, Program Leader and Principal
cc: Email: [email protected]
RE: COLORADO PLATEAU URANIUM WASTE ROCK DOSE CALCULATIONS

Frank Filas February 21, 2014 Energy Fuels Resources USA Inc. 2 1400521
i:\14\1400521\0100\0122\wasterockdose 0214\1400521 tm wasterockdose 21feb14.docx
Waste Rock Radiological Characteristics:
Ra-226 = 41.3 pCi/g
Th-230 = 41.3 pCi/g
Pb-210 = 41.3 pCi/g
U (Nat’l) = 125 mg/kg (dry)
The specific activity of these radionuclides is:
Specific Activity of Ra-226 = 0.989 Ci/g
Specific Activity of Th-230 = 1.9xE-2Ci/g
Specific Activity of Pb-210 = 8.8xE1 Ci/g
Specific Activity of U (Nat’l) = 6.77xE-7 Ci/g
Characterization of U (Nat’l) in Waste Rock (Ref.: DOE Data):
U-234 = 48.9% of the U Specific Activity
U-235 = 2.3% of the U Specific Activity
U-238 = 48.8% of the U Specific Activity
Input Data to the RESRAD Model:
1. Calculation Times = 1 year and fractional year (14 days)
2. Cover Characteristics:
Depth of Cover = Variable (0, 3in, 4in, 6in, 9in, 12in)
Type = Uncompacted sandy loam with a density of 1.33 g/cm3
3. Waste Rock Zone
Density of Waste Rock = 130 pcf (2.083g/cm3)
Porosity = 0.3 (Typical of fine grained sand)
Hydraulic Conductivity = 10 m/yr
Estimated Wind Speed = 2 m/s
Precipitation = 10 in/yr
Avg. Temperature = 53oF
Underlying Zones
Assume an unsaturated zone of 150 feet
Lower saturated zone beneath unsaturated zone
4. Inhalation and External Gamma
Exposure Duration Assumption:
Casual Site Visitor on the site for 14 days, 24 hrs/dy
Worker/Nearby Resident who is actually on the site for 1 year (50 weeks for 8 hrs/dy)
Frank Filas February 21, 2014 Energy Fuels Resources USA Inc. 3 1400521
i:\14\1400521\0100\0122\wasterockdose 0214\1400521 tm wasterockdose 21feb14.docx
Inhalation Mass Loading = 0.0001 g/m3 (Default Parameter)
Outdoor Time Factor = 24 hrs/dy for 14 day exposure; 8 hrs/dy for 50 wks/yr for 5 dys/wk; (2000 hrs/yr)
Indoor Time Factor = 0
5. Pathways
Assume External Gamma (Ground), Inhalation, Soil Ingestion and Radon Exposure
Inhalation and Soil Ingestion is assumed only for the zero cover calculation since the soil cover prevents inhalation and ingestion of waste rock particles
Soil Ingestion was assumed to occur using the model default inhalation factor
Assume no food consumption from vegetation grown on the pile
Assume no water consumption from surface run-off, streams or groundwater
3.0 RESRAD MODEL DOSE CALCULATION RESULTS
3.1 Individual Exposure Dose Calculation Results The dose was calculated for a variety of conditions as shown in the table below. Exposures were
calculated for a casual visitor and for a worker or nearby resident to the site.
Casual Site Visitor on the site for 14 days, 24 hrs/dy
Worker/Nearby Resident who is on the site for 1 year (50 weeks) for 8 hrs/dy (2,000 hrs/yr)
It was assumed that the exposed individual would be at the site for a 24 hrs/dy period for 14 days, which
provides a maximum exposure value for the exposure of 14 days. The one year exposure was calculated
on the basis of a total of 2,000 hours of site exposure.
Cover Depth Dose (inches)
1 yr Dose (mrem)
14 day dose (mrem)
0 107.9 17.75 3 44.54 7.49 4 34.32 5.64 6 20.51 3.37 9 9.67 1.59 12 4.71 0.77
Compared to the NRC’s public dose protection standard of 100 mrem/yr for facilities licensed under the
Atomic Energy Act, the values for these calculated doses under the given exposure scenarios are well
within the NRC standard for waste rock soil covers of 3 inches or more for the worst case scenario of
2,000 hrs/yr of exposure. For the casual visitor exposure of 14 days, the dose exposure is less than 18%
of the NRC Standard for zero soil cover on the waste rock.
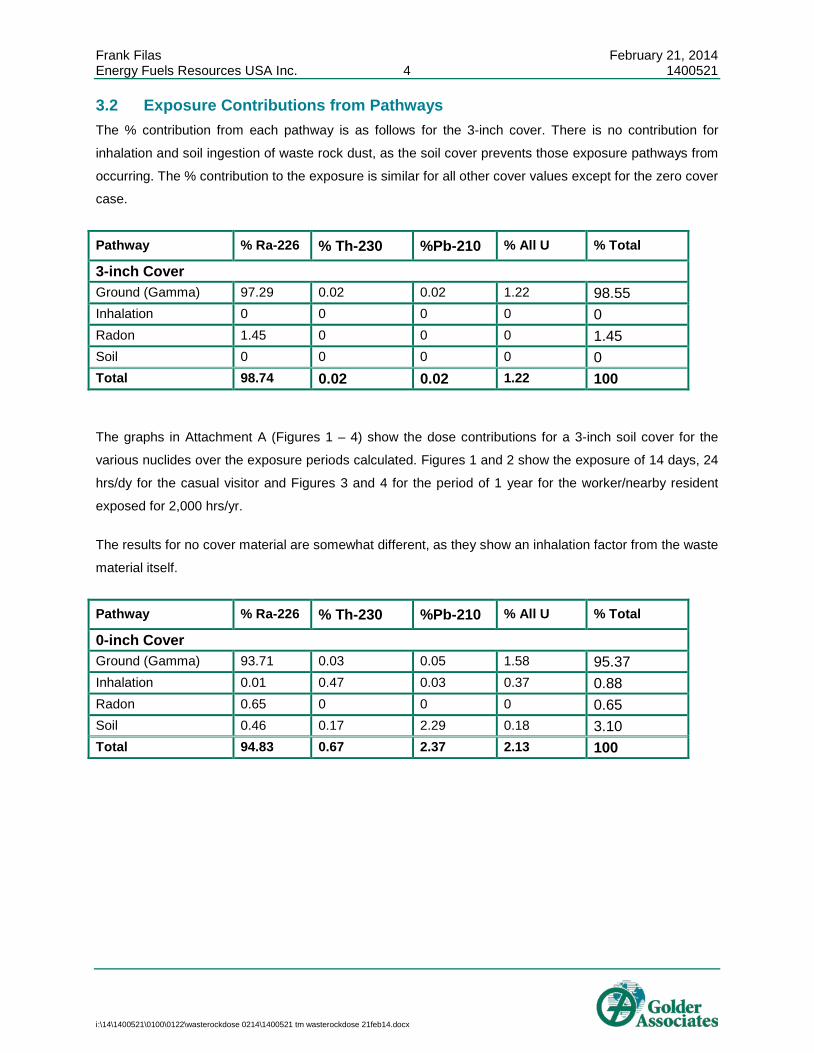
Frank Filas February 21, 2014 Energy Fuels Resources USA Inc. 4 1400521
i:\14\1400521\0100\0122\wasterockdose 0214\1400521 tm wasterockdose 21feb14.docx
3.2 Exposure Contributions from Pathways The % contribution from each pathway is as follows for the 3-inch cover. There is no contribution for
inhalation and soil ingestion of waste rock dust, as the soil cover prevents those exposure pathways from
occurring. The % contribution to the exposure is similar for all other cover values except for the zero cover
case.
Pathway % Ra-226 % Th-230 %Pb-210 % All U % Total
3-inch Cover Ground (Gamma) 97.29 0.02 0.02 1.22 98.55 Inhalation 0 0 0 0 0 Radon 1.45 0 0 0 1.45 Soil 0 0 0 0 0 Total 98.74 0.02 0.02 1.22 100
The graphs in Attachment A (Figures 1 – 4) show the dose contributions for a 3-inch soil cover for the
various nuclides over the exposure periods calculated. Figures 1 and 2 show the exposure of 14 days, 24
hrs/dy for the casual visitor and Figures 3 and 4 for the period of 1 year for the worker/nearby resident
exposed for 2,000 hrs/yr.
The results for no cover material are somewhat different, as they show an inhalation factor from the waste
material itself.
Pathway % Ra-226 % Th-230 %Pb-210 % All U % Total
0-inch Cover Ground (Gamma) 93.71 0.03 0.05 1.58 95.37 Inhalation 0.01 0.47 0.03 0.37 0.88 Radon 0.65 0 0 0 0.65 Soil 0.46 0.17 2.29 0.18 3.10 Total 94.83 0.67 2.37 2.13 100

Frank Filas February 21, 2014 Energy Fuels Resources USA Inc. 5 1400521
i:\14\1400521\0100\0122\wasterockdose 0214\1400521 tm wasterockdose 21feb14.docx
4.0 CONCLUSIONS This report presents the dose modeling results conducted for typical Colorado Plateau waste rock with
various soil thicknesses assumed for the reclamation cover. A relatively porous, sandy soil cover is
conservatively assumed for the modeling runs, as it provides the least amount of resistance to radiation.
The modeling results indicate that uncovered waste rock presents little risk to the public if the reclaimed area is visited infrequently with a calculated dose of 17.8 mrem received by a person exposed to the material 24 hrs/dy over a 14-day period.
Reclaimed waste rock piles with 3 inches of soil cover or more resulted in a dose of 7.5 mrem per year for an infrequent visitor exposed for 24 hrs/dy and 14 dys/yr and 44.5 mrem per year for a person exposed for 8 hrs/dy for 50 weeks (2,000 hours) for a period of 1 year. The 2,000 hrs/yr exposure assumes that the person is actually on the waste rock pile for the entire specified time.
Golder appreciates the opportunity to be of service to Energy Fuels. Should you have any questions
concerning this technical memo please call me at 303-520-7602.
List of Attachments Attachment A Figures:
Figure 1 3-inch Soil Cover, 14 Days Exposure Waste Rock DOSE: Ra-226, All Pathways Summed
Figure 2 3-inch Soil Cover, 14 Days Exposure Waste Rock DOSE: All Nuclides Summed, All Pathways Summed
Figure 3 3-inch Soil Cover, 365 Days/yr Exposure Waste Rock DOSE: Ra 226, All Pathways Summed
Figure 4 3-inch Soil Cover, 365 Days/yr Exposure Waste Rock DOSE: All Nuclides Summed, All Pathways Summed

ATTACHMENT A FIGURES

Figure 1: 3-inch Soil Cover; 14 day/24 hour Exposure Waste Rock DOSE: Ra-226; All Pathways Summed
i:\14\1400521\0100\0122\wasterockdose 0214\1400521 tm wasterockdose figs 21feb14rev.docx
4.5
5.0
5.5
6.0
6.5
7.0
7.5
1 10 100 1000Years
DOSE: Ra-226, A ll Pathways Summed

Figure 2: 3-inch Soil Cover; 14 day/24 hour Exposure Waste Rock DOSE: All Nuclides; All Pathways Summed
i:\14\1400521\0100\0122\wasterockdose 0214\1400521 tm wasterockdose figs 21feb14rev.docx
0
1
2
3
4
5
6
7
8
1 10 100 1000Years
Pb -2 1 0 Ra -2 2 6 Th -2 3 0 U-2 3 4 U-2 3 5 U-2 3 8 To ta l
DOSE: All Nuclides Summed, A ll Pathways Summed

Figure 3: 3-inch Soil Cover; 1 Year (2,000 hour) Exposure Waste Rock DOSE: Ra-226; All Pathways Summed
i:\14\1400521\0100\0122\wasterockdose 0214\1400521 tm wasterockdose figs 21feb14rev.docx
26
28
30
32
34
36
38
40
42
44
1 10 100 1000Years
DOSE: Ra-226, A ll Pathways Summed
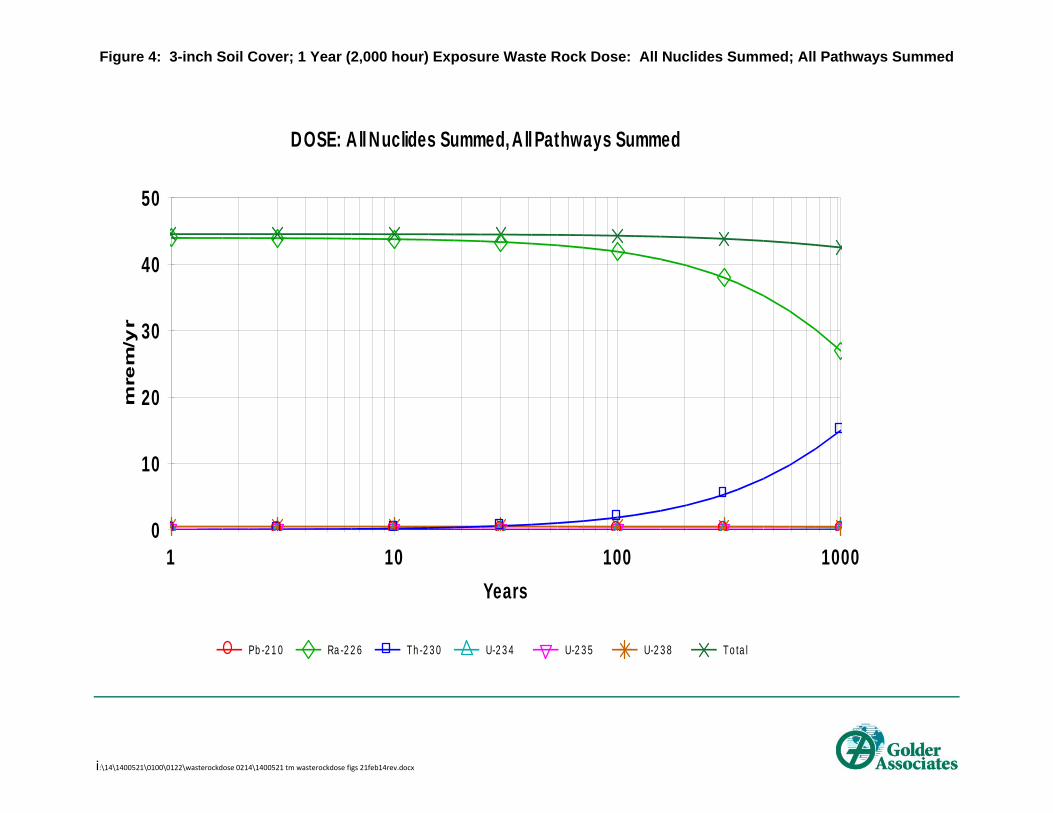
Figure 4: 3-inch Soil Cover; 1 Year (2,000 hour) Exposure Waste Rock Dose: All Nuclides Summed; All Pathways Summed
i:\14\1400521\0100\0122\wasterockdose 0214\1400521 tm wasterockdose figs 21feb14rev.docx
0
10
20
30
40
50
1 10 100 1000Years
Pb -2 1 0 Ra -2 2 6 Th -2 3 0 U-2 3 4 U-2 3 5 U-2 3 8 To ta l
DOSE: A ll Nuclides Summed, A ll Pathways Summed


