APPENDIX E History and Projection of Traffic, Toll Revenues and Expenses and Review of Physical Conditions of the Facilities of Triborough Bridge and Tunnel Authority Prepared for: Triborough Bridge and Tunnel Authority Prepared by: Stantec Consulting Services, Inc. April 28, 2017
Transcript
APPENDIX E
History and Projection of Traffic, Toll Revenues and Expenses and Review of Physical Conditions of the Facilities of Triborough Bridge and Tunnel Authority
Prepared for: Triborough Bridge and Tunnel Authority
Prepared by: Stantec Consulting Services, Inc.
April 28, 2017
HISTORY AND PROJECTION OF TRAFFIC, TOLL REVENUES AND EXPENSES AND REVIEW OF PHYSICAL CONDITIONS OF THE FACILITIES OF TRIBOROUGH BRIDGE AND TUNNEL AUTHORITY
TOLL COLLECTION ON THE TBTA FACILITIES ................................................................................................... 6 Present and Proposed Toll Structures and Operation .................................................................. 6 E-ZPass Electronic Toll Collection System ...................................................................................... 12 TBTA’s Role in E-ZPass......................................................................................................................... 14
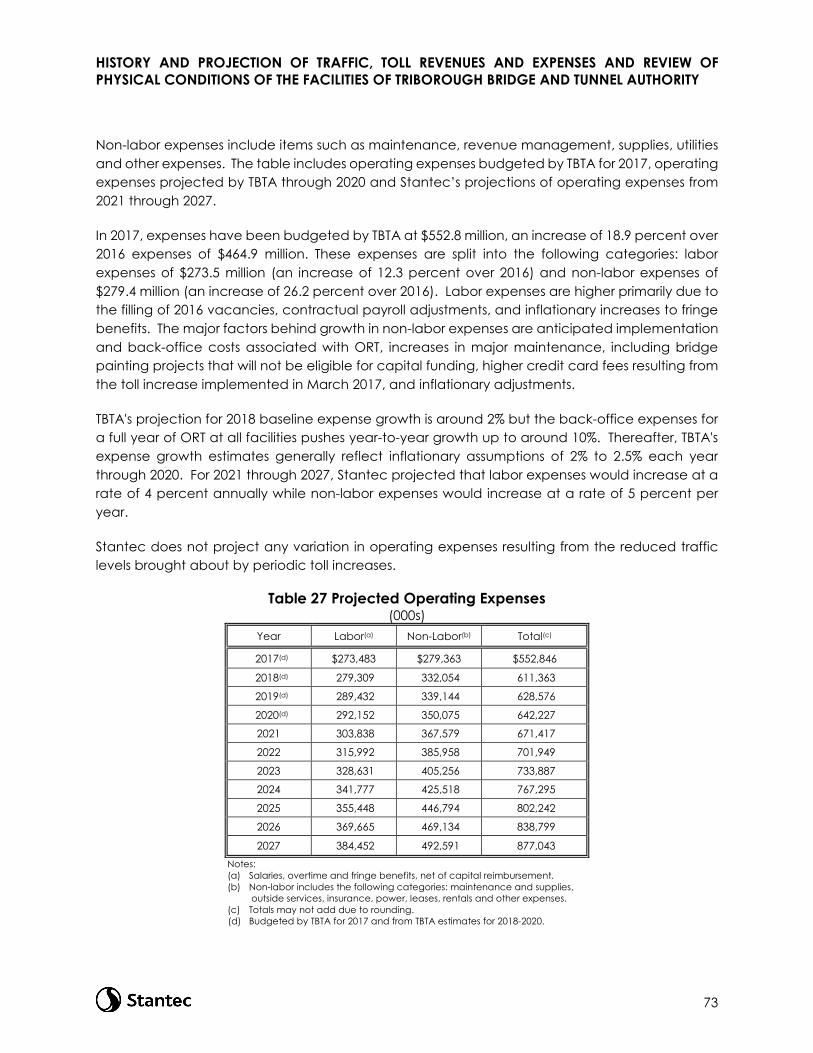
HISTORICAL TRAFFIC, REVENUES AND EXPENSES AND ESTIMATED/BUDGETED NUMBERS FOR 2016 ...................................................................................................................................................... 19 Traffic and Toll Revenue, 2006 to 2016 .......................................................................................... 22 Traffic by Facility and Vehicle Class, 2016 .................................................................................... 25 Monthly Traffic, 2016 ......................................................................................................................... 26 Changes in Monthly Traffic, 2015 to 2016 ..................................................................................... 28 Operating Expenses, 2006 to 2016 ................................................................................................. 28
FACTORS AFFECTING TRAFFIC GROWTH ..................................................................................................... 31 Employment, Population, and Motor Vehicle Registrations ..................................................... 31 Fuel Conditions ................................................................................................................................... 41 Toll Increase Impacts, Collection Methods, and Elasticity ........................................................ 44 Availability of Capacity on TBTA Facilities .................................................................................... 47 TBTA and Regional Operational and Construction Impacts..................................................... 47 Summary of Assumptions and Conditions .................................................................................... 63
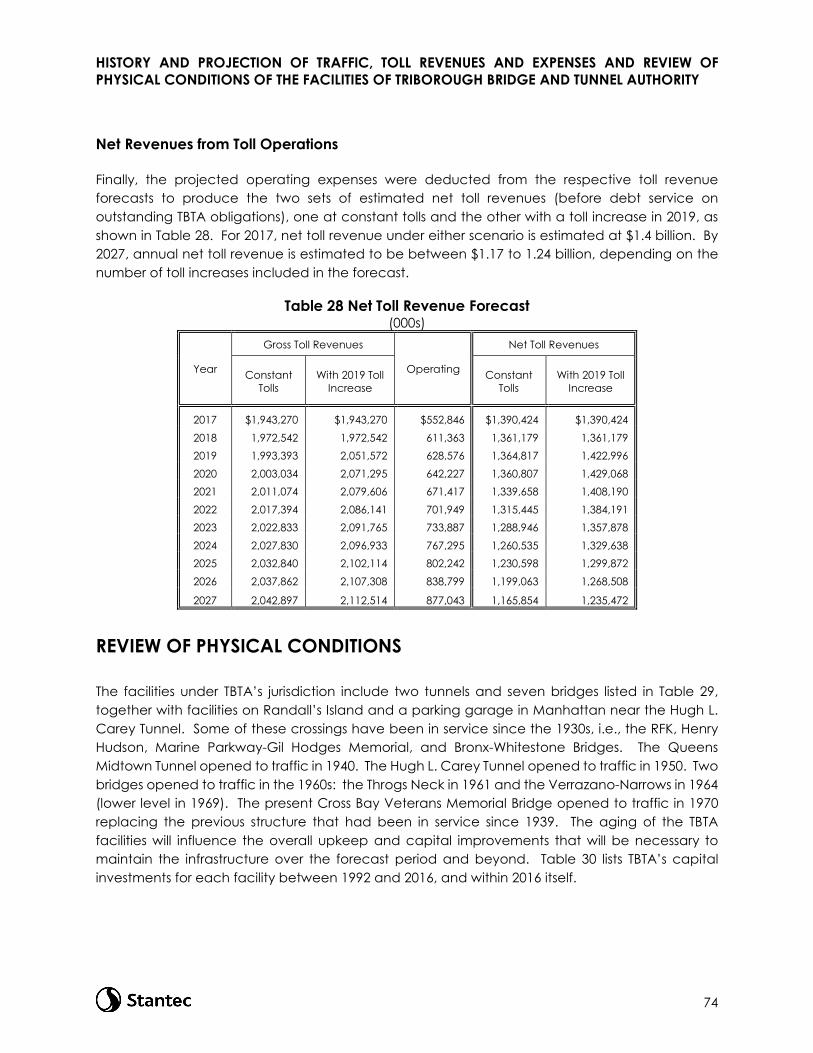
PROJECTED TRAFFIC, REVENUES, AND EXPENSES ....................................................................................... 66 Estimated Traffic and Toll Revenue, 2017 ..................................................................................... 66 Traffic and Toll Revenue at Current Tolls ....................................................................................... 68 Traffic and Toll Revenue with Assumed 2019 Toll Increase ........................................................ 69 Effects of Second Avenue Subway Construction in Forecast Years ....................................... 72 Effects of Open Road Tolling (ORT) in Forecast Years ................................................................ 72 Operating Expenses .......................................................................................................................... 72 Net Revenues from Toll Operations ................................................................................................ 74
REVIEW OF PHYSICAL CONDITIONS .............................................................................................................. 74 Post-Superstorm Sandy Reports, Capital Investments and Rehabilitation ............................. 76 Inspection Reports, Flagged Conditions and Rehabilitation Projects ..................................... 76 Other Systemwide Improvements .................................................................................................. 83 Long-Term Outlook for TBTA Facilities ............................................................................................. 85
HISTORY AND PROJECTION OF TRAFFIC, TOLL REVENUES AND EXPENSES AND REVIEW OF PHYSICAL CONDITIONS OF THE FACILITIES OF TRIBOROUGH BRIDGE AND TUNNEL AUTHORITY
ii
CONCLUDING REMARKS ................................................................................................................................ 85 LIST OF TABLES
Page
Table 1 Current Toll Rates at TBTA Facilities, Effective Since March 19, 2017 ........................................ 7 Table 2 E-ZPass Participation Rates .............................................................................................................. 13 Table 3 ORT Activation Schedule ................................................................................................................. 16 Table 4 Historical Trends in Cash/TBM and E-ZPass Passenger Car Toll Rates ...................................... 18 Table 5 E-ZPass Passenger Toll Rates versus Consumer Price Index ....................................................... 19 Table 6 Annual Toll-Paying Traffic and Toll Revenue, 2006 to 2016 ....................................................... 23 Table 7 Summary of Annual Paid Traffic and Toll Revenue, 2006 to 2016............................................ 24 Table 8 Actual Changes in January – February Traffic, 2016 to 2017 ................................................... 25 Table 9 Traffic by Facility and Vehicle Class, 2016 .................................................................................... 26 Table 10 Monthly Traffic Variations, 2016 .................................................................................................... 27 Table 11 Changes in Monthly Average Daily Traffic, 2015 to 2016 ....................................................... 28 Table 12 Historical Operating Expenses, 2006 to 2016 ............................................................................. 29 Table 13 Employment Trends ........................................................................................................................ 33 Table 14 Employment Projections ................................................................................................................ 34 Table 15 Labor Force Conditions, 2010 & 2016 .......................................................................................... 35 Table 16 Housing Building Permits Issued within the City, 2014 - 2016 ................................................... 37 Table 17 Population Trends............................................................................................................................ 38 Table 18 Population Projections ................................................................................................................... 39 Table 19 Motor Vehicle Registrations .......................................................................................................... 40 Table 20 New York City Motor Vehicle Registrations, 2011 to 2016 ....................................................... 41 Table 21 Elasticity Factors .............................................................................................................................. 46 Table 22 Estimated Percent Change in Average Toll Rates and Traffic in 2019 ................................. 46 Table 23 Estimated Changes in Annual Traffic, 2016 to 2017 ................................................................. 67 Table 24 Estimated 2017 Toll-Paying Traffic and Toll Revenue ............................................................... 68 Table 25 Traffic and Toll Revenue Forecast, Constant Tolls ..................................................................... 70 Table 26 Traffic and Toll Revenue Forecast with Assumed 2019 Toll Increase .................................... 71 Table 27 Projected Operating Expenses .................................................................................................... 73 Table 28 Net Toll Revenue Forecast............................................................................................................. 74 Table 29 Opening Dates of TBTA Facilities .................................................................................................. 75 Table 30 Capital Investments by Facility, 1992 through 2016 ................................................................. 75 Table 31 Facility Inspection Firms .................................................................................................................. 78 Table 32 TBTA 2015-2019 Capital Program by Facility ($ in millions)(a) ................................................... 79
LIST OF FIGURES Page
Figure 1 Location Map ..................................................................................................................................... 2 Figure 2A/2B Aggregated TBTA Facilities Paid Traffic and Toll Revenue, 1970 to 2016 ..................... 21 Figure 3A/3B New York City Gas Prices Compared to New York State VMT and TBTA Bridges and Tunnels Total Transactions .............................................................................................................................. 43
HISTORY AND PROJECTION OF TRAFFIC, TOLL REVENUES AND EXPENSES AND REVIEW OF PHYSICAL CONDITIONS OF THE FACILITIES OF TRIBOROUGH BRIDGE AND TUNNEL AUTHORITY
1
April 28, 2017
To the Triborough Bridge and Tunnel Authority:
In accordance with your request, Stantec Consulting Services Inc. (Stantec) conducted this annual study to develop projections of traffic, toll revenues, and expenses for the toll bridge and tunnel facilities operated by the Triborough Bridge and Tunnel Authority (TBTA), and to provide an overview of the physical conditions of each facility. We have reviewed the bridge and tunnel inspection reports provided by TBTA and discussed TBTA’s on-going maintenance and capital programs with its engineering staff.
Our projections have taken into account: (1) the general physical condition of TBTA’s toll facilities; (2) traffic and toll revenue data, reflecting the 18 toll increases since 1972, including the most recent toll increase effective March 2017; (3) the impact of the E-ZPass electronic toll collection system; (4) the impact of systemwide Open Road Tolling (ORT) initiatives; s(5) the toll structure; (6) planned and possible future toll increases; (7) economic, population, employment, and other demographic forecasts in the New York Metropolitan Area; (8) the traffic capacities of the bridges and tunnels and the existing roadway network that feeds the facilities in terms of the potential for future growth of peak versus non-peak period traffic; (9) current and programmed construction activities on TBTA’s facilities and the arterial highway network serving the New York Metropolitan Area, including the toll-free Harlem and East River bridges; and (10) mass transit network projects.
In 2016, actual total toll revenues for the TBTA facilities were $1,870.0 million, or 0.6 percent lower than our 2016 forecast of $1,880.9 million and 3.4 percent higher than actual 2015 toll revenue. Total revenue traffic in 2016 was 307.3 million vehicles, or 0.8 percent lower than previously forecasted at 309.9 million vehicles and 3.1 percent higher than actual 2015 traffic.
TRANSPORTATION INFRASTRUCTURE
The New York Metropolitan Area’s transportation infrastructure consists of an extensive network of highways, tunnels, and bridges (both tolled and toll-free), regional bus and commuter rail, and the New York City transit system.
TBTA Facilities
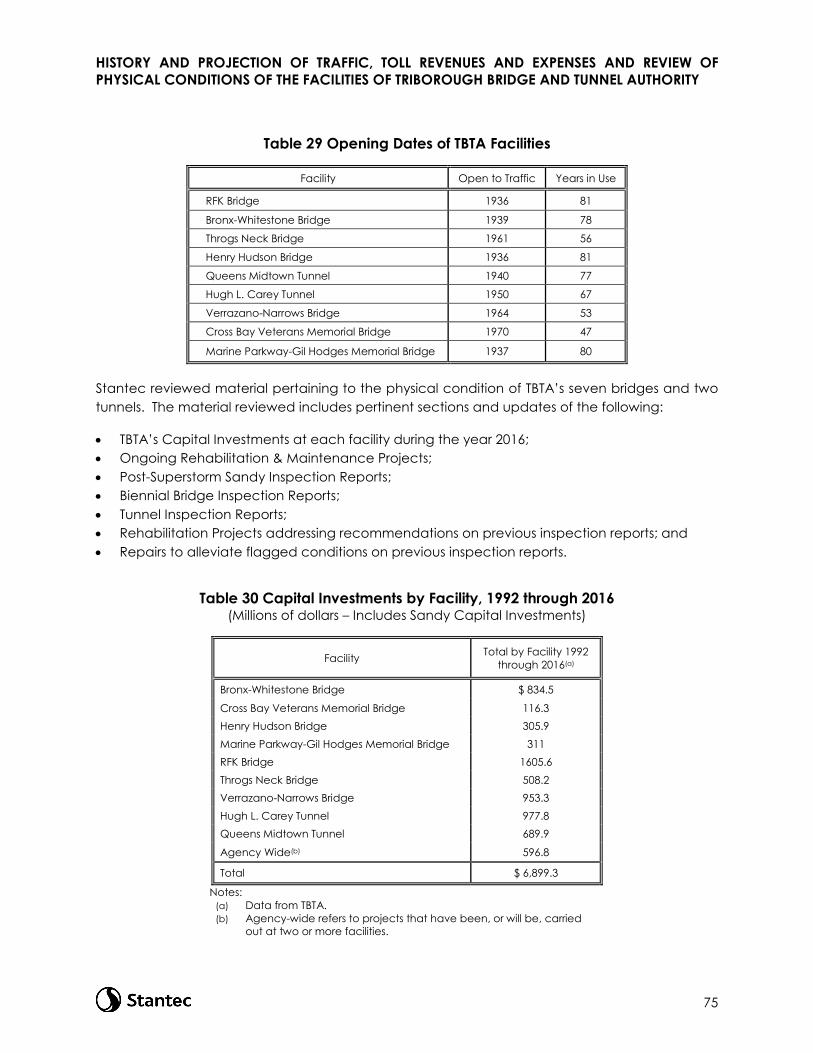
TBTA operates nine toll facilities within New York City (the “City”), consisting of seven bridges and two tunnels that provide vital links across the City’s rivers and bays. In 2016, these facilities carried 307.3 million total toll-paying vehicles, and generated $1,870.0 million in total toll revenue. The locations of the facilities are shown in the context of the regional highway network on the following map.
HISTORY AND PROJECTION OF TRAFFIC, TOLL REVENUES AND EXPENSES AND REVIEW OF PHYSICAL CONDITIONS OF THE FACILITIES OF TRIBOROUGH BRIDGE AND TUNNEL AUTHORITY
2
Figure 1 Location Map
HISTORY AND PROJECTION OF TRAFFIC, TOLL REVENUES AND EXPENSES AND REVIEW OF PHYSICAL CONDITIONS OF THE FACILITIES OF TRIBOROUGH BRIDGE AND TUNNEL AUTHORITY
3
The facilities are briefly described as follows:
Verrazano-Narrows Bridge - a two-level suspension bridge, with three lanes of traffic in each direction on both decks. It crosses the entrance to New York Harbor and connects Brooklyn and Staten Island.
Robert F. Kennedy (RFK) Bridge (formerly the Triborough Bridge) - crosses the East River and the Harlem River, and connects the boroughs of Queens, the Bronx and Manhattan. Opened to traffic in 1936, it generally carries eight traffic lanes between Queens and the Bronx via Wards Island and Randall’s Island except where the Wards Island Viaduct has been widened to nine lanes. The bridge also generally carries six traffic lanes between Randall’s Island and Manhattan. These three major crossings are interconnected by viaducts.
Bronx-Whitestone Bridge - a suspension bridge, with three lanes of traffic in each direction, which crosses the East River connecting the boroughs of Queens and the Bronx.
Throgs Neck Bridge - a suspension bridge with three lanes of traffic in each direction, which crosses the upper East River also connecting the boroughs of Queens and the Bronx.
Queens Midtown Tunnel - a twin-tube tunnel with each tube carrying two lanes of traffic under the East River between the boroughs of Queens and Manhattan. During normal morning commuting hours, three lanes are operated in the peak traffic direction.
Hugh L. Carey Tunnel (formerly the Brooklyn-Battery Tunnel) - a twin-tube tunnel with each tube carrying two lanes of traffic under the East River connecting the southern tip of Manhattan with Brooklyn. During normal commuting hours, three lanes are operated in the peak traffic direction.
Henry Hudson Bridge - a two-level steel arch bridge with three southbound lanes on its lower deck and three northbound lanes on its upper deck, which crosses the Harlem River to connect the northern tip of Manhattan with the Spuyten Duyvil section of the Bronx.
Marine Parkway - Gil Hodges Memorial Bridge (Marine Parkway) - a four-lane crossing of the Rockaway Inlet that connects the Rockaway peninsula in Queens with Brooklyn.
Cross Bay Veterans Memorial Bridge (Cross Bay) - a precast post-tensioned concrete T-girder bridge with three lanes of traffic in each direction crossing Beach Channel in Jamaica Bay, connecting the Rockaway peninsula in Queens with the Queens mainland, via Broad Channel.
HISTORY AND PROJECTION OF TRAFFIC, TOLL REVENUES AND EXPENSES AND REVIEW OF PHYSICAL CONDITIONS OF THE FACILITIES OF TRIBOROUGH BRIDGE AND TUNNEL AUTHORITY
4
Metropolitan Area Arterial Network
The New York Metropolitan Area is served by an extensive network of highway facilities. Many of the bridges and tunnels operated by TBTA are links in the Interstate highway network, as these limited-access expressways pass through the City to serve both local and long distance traffic. These regional facilities are shown on the map above.
The Verrazano-Narrows Bridge is adjacent to I-278 (Staten Island, Gowanus, and Brooklyn-Queens Expressways), which connects with the Hugh L. Carey Tunnel and the RFK Bridge. The Queens Midtown Tunnel joins I-495 (Long Island Expressway) with Manhattan. The RFK Bridge joins I-87 (Major Deegan Expressway) and I-278 (Bruckner Expressway) with I-278/Grand Central Parkway in Queens and the FDR and Harlem River Drives in Manhattan. The Bronx-Whitestone Bridge carries traffic between the Hutchinson River and Merritt Parkways and Long Island via I-678 (Whitestone and Van Wyck Expressways) and the Cross Island Parkway. The Throgs Neck Bridge carries traffic between I-95 (New England Thruway and George Washington Bridge) and Long Island via I-295. The Henry Hudson Bridge is part of the Henry Hudson Parkway, a major commuter route into Manhattan from the extensive parkway network in western Westchester County and beyond.
In addition to TBTA facilities and their expressway/parkway connections, the City’s toll-free East River bridges — Brooklyn, Manhattan, Williamsburg, and Ed Koch Queensboro — also connect Manhattan with Brooklyn and Queens; and nine toll-free bridges over the Harlem River connect Manhattan with the Bronx. Unlike the TBTA facilities, the approaches to these bridges are mostly surface arterials, such as Flatbush Avenue and Queens Boulevard. Only a few have expressway ramp connections (such as the Brooklyn-Queens Expressway connections to the Brooklyn, Manhattan, and Williamsburg Bridges). The Alexander Hamilton Bridge, as part of I-95, connects the Trans-Manhattan Expressway and the Cross Bronx Expressway.
Other Regional Toll Facilities
TBTA is one of a number of toll authorities that operate bridge, tunnel, and highway facilities in the New York Metropolitan Area. The agency whose facilities are geographically closest to TBTA’s bridges and tunnels is the Port Authority of New York and New Jersey (Port Authority). The Port Authority’s George Washington Bridge is linked to the RFK, Bronx-Whitestone, and Throgs Neck Bridges via the expressway system in the Bronx, to the RFK Bridge via the Harlem River Drive in Manhattan and to the Henry Hudson Bridge via the Henry Hudson Parkway in Manhattan, while the Bayonne Bridge, Goethals Bridge, and Outerbridge Crossing are linked to the Verrazano-Narrows Bridge via the expressway system in Staten Island. Only motorists using the Port Authority’s two tunnels — Holland and Lincoln — must traverse surface streets (in Manhattan) to reach TBTA’s and the City’s East River crossings. The other toll authorities in the region are the New York State Thruway Authority (Tappan Zee Bridge and several Thruway sections), New York State Bridge Authority (five upstate Hudson River bridges), and the New Jersey Turnpike Authority (Garden State Parkway and New Jersey Turnpike).
HISTORY AND PROJECTION OF TRAFFIC, TOLL REVENUES AND EXPENSES AND REVIEW OF PHYSICAL CONDITIONS OF THE FACILITIES OF TRIBOROUGH BRIDGE AND TUNNEL AUTHORITY
5
All of these authorities, together with 23 others beyond the New York Metropolitan Area, are linked through the E-ZPass Interagency Group (E-ZPass Group) to better serve the regional traveler through a common electronic toll collection tag. On March 13, 2012, the E-ZPass Group announced a new “National Affiliate” membership category that would allow other tolling agencies to join the E-ZPass Group and become interoperable with the E-ZPass Group by using equipment that is compatible with the E-ZPass system. Since then, the E-ZPass Group has further expanded its footprint, continuing to work towards national interoperability. E-ZPass and its impact on the TBTA facilities are discussed further in this report.
Regional Public Transportation
In addition to the TBTA facilities, most of the public transportation facilities within the City and the suburban counties north and east of the City are part of the Metropolitan Transportation Authority (MTA) system. These include the New York City Transit Authority and the Manhattan and Bronx Surface Transit Operating Authority (its subsidiary), MTA Bus Company, Staten Island Rapid Transit Operating Authority, Metro-North Commuter Railroad Company, and the Long Island Rail Road Company.
For those TBTA facilities directly serving Manhattan — Henry Hudson Bridge, RFK Bridge, Queens Midtown Tunnel, and Hugh L. Carey Tunnel — the motorist can, for the most part, choose to use transit as an alternative. For the outlying bridges, however, the choice is more difficult due to more limited availability of transit options or different trip characteristics.
Potential Regional Tolling Proposals
From time to time, the possibility of tolling the City’s free East River crossings has been discussed by City and State policy makers, as well as other interested parties. Variations of this proposal have included discussions of imposing tolls on the Harlem and East River crossings, the establishment of a “cordon” in Manhattan that would be tolled, and a discussion of congestion pricing on tolled facilities, including the possibility of lower tolls on TBTA facilities. Currently, a proposal by a consortium of organizations, private companies, and interested individuals (the group is called MOVE NY) advocates many of the same elements as previously discussed.
Legislation was introduced in the New York State Assembly on January 5, 2017 to establish the MOVE New York Fair Plan and, among other things, establish a Move New York Mobility Fund, set tolls for TBTA’s outer borough bridges at a set ratio, and establish an authority for the receipt and disbursement of realized funds. MTA and TBTA staff are reviewing the legislation to assess the possible effects on the MTA system. At this time, the likelihood of passage is too uncertain to draw any conclusion about the potential impacts on the MTA or TBTA. With the onset of ORT there are advocates to return toll collection on the Verrazano Bridge to two-way. This would require a change in Federal legislation.
HISTORY AND PROJECTION OF TRAFFIC, TOLL REVENUES AND EXPENSES AND REVIEW OF PHYSICAL CONDITIONS OF THE FACILITIES OF TRIBOROUGH BRIDGE AND TUNNEL AUTHORITY
6
TOLL COLLECTION ON THE TBTA FACILITIES
The nine TBTA toll facilities have four toll structures, in terms of toll levels : major, minor, Henry Hudson Bridge, and the Verrazano-Narrows Bridge. The major crossings for this purpose include the RFK Bridge, Bronx-Whitestone Bridge, Throgs Neck Bridge, Queens Midtown Tunnel, and Hugh L. Carey Tunnel. The minor crossings are the Marine Parkway Bridge and Cross Bay Bridge. The Henry Hudson Bridge is the only facility limited to vehicles that are authorized to use parkways. The Verrazano-Narrows Bridge is the only facility on which tolls are collected in one direction only.
Present and Proposed Toll Structures and Operation
The current toll structure, in place since the March 19, 2017 toll increase, is shown in Table 1. Tolls are determined using a basic rate as modified by variables specific to a number of factors. These factors include:
• crossing used; • vehicle classification; • toll payment method; • place of residence; and • vehicle occupancy. This study uses the phrase “cash tolls/Tolls by Mail” (cash/TBM) to refer to crossing charge rates charged for the use of fare media other than E-ZPass by New York E-ZPass Customer Service Center (NYCSC) customers (see 21 NYCRR §1021.1). As presented in Table 1, E-ZPass toll rates apply only to customer tags issued by the NYCSC (this includes TBTA, Port Authority of New York and New Jersey, New York State Thruway Authority, the Buffalo and Fort Erie Public Bridge Authority (Peace Bridge), and New York State Bridge Authority). Cash/TBM toll rates are charged to cash customers and non-NYCSC E-ZPass customers (effective July 12, 2009), as well as to Tolls by Mail (TBM) customers at the Henry Hudson Bridge, Hugh L. Carey Tunnel, and Queens Midtown Tunnel1. TBM toll rates will also be implemented at the remaining TBTA facilities by fall 2017 as part of the systemwide implementation of ORT. Only NYCSC E-ZPass customers are eligible for the lower E-ZPass toll rates. Any motorist, regardless of residence, can obtain a NYCSC transponder.
1 TBM toll rates have been in place at the Henry Hudson Bridge since the inception of the cashless All-Electronic Tolling (AET) pilot program on November 10, 2012 and continue to be in effect after the implementation of ORT at the Henry Hudson Bridge on November 20, 2016. TBM toll rates have also been in effect at the Hugh L. Carey Tunnel and Queens Midtown Tunnel since the inception of ORT at these facilities on January 4, 2017 and January 10, 2017, respectively.
HISTORY AND PROJECTION OF TRAFFIC, TOLL REVENUES AND EXPENSES AND REVIEW OF PHYSICAL CONDITIONS OF THE FACILITIES OF TRIBOROUGH BRIDGE AND TUNNEL AUTHORITY
7
Table 1 Current Toll Rates at TBTA Facilities, Effective Since March 19, 2017
Classification
Verrazano-Narrows Bridge(a)
RFK Bridge Bronx-Whitestone
Bridge Throgs Neck Bridge Queens Midtown
Tunnel(c) Hugh L. Carey Tunnel(c)
Henry Hudson Bridge(c)
Marine Parkway- Gil Hodges Memorial
Bridge Cross Bay Veterans
Memorial Bridge
Cash/TBM E-ZPass(b) Cash/ TBM E-ZPass(b) Cash/
TBM E-ZPass(b) Cash/ TBM E-ZPass(b)
Two-axle vehicles, including: Passenger vehicles, SUVs, station wagons, self-propelled mobile homes, ambulances, hearses, vehicles with seating capacity of not more than 15 adult persons (including the driver) and trucks with maximum gross weight of 7,000 lbs. and under
$17.00 $11.52 $8.50 $5.76 $6.00 $2.64 $4.25 $2.16
Each additional axle costs 7.00 7.00 3.50 3.50 2.75 2.75 2.75 2.75 The following reduced rate prepaid charges are presently available for the two-axle vehicles referenced above: Prepaid charges through reduced rate token roll purchase/E-Tokens 2.83/2.83(d) Prepaid charges per crossing for registered Rockaway Peninsula/Broad Channel Residents using an eligible vehicle paying with tokens/E-Tokens 1.93/1.92(d)
Registered Rockaway Residents using an eligible vehicle 1.41(e) Prepaid charges per crossing for registered Staten Island Residents using an eligible vehicle with three or more occupants (HOV) paying with carpool tickets/E-Tickets 3.20/3.20(d)
Prepaid charges per crossing for registered Staten Island Residents using an eligible vehicle through token roll purchase/E-Tokens 9.23/9.22(d)
Registered Staten Island Residents using an eligible vehicle taking 3 or more trips per month 6.48(f) Registered Staten Island Residents using an eligible vehicle taking less than 3 trips per month 6.84(g) All two-axle vehicles greater than 7,000 lbs. and buses (other than franchise buses and motor homes) 34.00 20.80 17.00 10.40
Notes: (a) Under the Verrazano-Narrows Bridge one-way crossing charge collection program toll is collected only in the westbound direction in accordance with federal law. As discussed in this report, the MTA also has two toll rebate
programs at the Verrazano-Narrows Bridge for eligible Staten Island residents and qualifying commercial vehicles using the same New York Customer Service Center (NYCSC) E-ZPass account. (b) E-ZPass crossing charges apply to NYCSC E-ZPass customers only; customers of other E-ZPass CSCs are charged the cash/TBM toll. Any motorist, regardless of residence, can obtain a NYCSC transponder. (c) TBM has been implemented at the Henry Hudson Bridge since November 2012 initially as a pilot program in November 2012 and then permanently beginning in January 2015. TBM has also been implemented at the Queens
Midtown Tunnel and Hugh L. Carey Tunnel since January 2017. Vehicles at these facilities without an NYCSC E-ZPass tag pay the higher cash/TBM toll rate via the TBM program. (d) Tokens and tickets are sold in prepaid rolls or books. The non-resident Marine Parkway/Cross Bay token roll is sold as 15 crossings for $42.50 ($2.8333 per crossing). The Rockaway Resident token roll is sold as 14 crossings for $27.00
($1.9286 per crossing). The Staten Island Resident carpool ticket book is sold as 12 round-trip crossings for $76.80 ($3.20 per round-trip). The Staten Island resident token roll is sold as 10 round-trip crossings for $92.25 ($9.225 per round trip). Once cashless tolling is implemented, they will be replaced with equivalent pre-paid E-Tokens and E-Tickets, using a registered E-ZPass tag.
(e) Effective April 1, 2012, eligible Rockaway Peninsula and Broad Channel residents using E-ZPass at the Cross Bay Bridge (CBB) receive a full rebate of the Rockaway Resident E-ZPass toll from the MTA. It is likely that the MTA will continue the CBB rebate program at its current level only if there is sufficient funding to do so. Should there not be sufficient funding to continue the CBB rebate program at its current level, the rebate program would likely revert to the level that existed prior to April 1, 2012, where Rockaway Residents paid the Rockaway Resident E-ZPass toll for the first two trips and received the rebate only for subsequent trips taken during a calendar day using the same E-ZPass tag.
(f) After $0.98 rebate, effective toll is $5.50 per trip. (g) After $1.34 rebate, effective toll is $5.50 per trip. (h) Passage prohibited.
HISTORY AND PROJECTION OF TRAFFIC, TOLL REVENUES AND EXPENSES AND REVIEW OF PHYSICAL CONDITIONS OF THE FACILITIES OF TRIBOROUGH BRIDGE AND TUNNEL AUTHORITY
8
Passenger Car Tolls
As noted, TBTA crossings are separated into four categories for toll classification purposes: major facilities, minor facilities, the Verrazano-Narrows Bridge, and the Henry Hudson Bridge. The single trip passenger car cash/TBM2 toll is $8.50 for the major crossings and $17.00 for the Verrazano-Narrows Bridge. The minor crossing passenger car cash/TBM toll is $4.25 on the Marine Parkway and Cross Bay Bridges, which is half the level of those on the major facilities. On the Henry Hudson Bridge, the passenger car toll is $6.00 for TBM customers. All tolls are collected in each direction except on the Verrazano-Narrows Bridge where the round-trip tolls are collected only in the westbound (Staten Island-bound) direction in accordance with federal law.
Tolls for passenger cars are reduced by TBTA under the following programs: (1) NYCSC E-ZPass; (2) tokens or E-Tokens required by statute; (3) place of residence/crossing used; (4) place of residence/vehicle occupancy; and (5) some combination of the foregoing. The MTA also has toll rebate programs for certain eligible residents using NYCSC E-ZPass at the Cross Bay and Verrazano-Narrows Bridges. MTA reimburses TBTA in full for these rebates with a combination of its own funds and New York State funds.
E-ZPass electronic toll collection is available on all TBTA toll facilities (see the following section for a more complete description of E-ZPass and its impact). Motorists open an E-ZPass account and receive a transponder that they mount on their vehicles (typically their windshields). TBTA facilities are all equipped with E-ZPass antennas (either at toll plazas or on gantries over the roadway) that identify and read the on-board tags and electronically debit the toll from the motorist’s account. Under the current toll schedule, passenger cars equipped with a NYCSC E-ZPass receive a $2.74 reduction per trip at all major facilities and a $5.48 reduction at the Verrazano-Narrows Bridge where the round-trip toll is collected only in the westbound direction, and $2.09 at the Cross Bay and Marine Parkway Bridges. On the Henry Hudson Bridge, passenger cars with a NYCSC E-ZPass receive a $3.36 reduction per trip. Passenger cars equipped with a transponder not issued by the NYCSC pay the same toll rate as cash/TBM customers. Any motorist, regardless of residence, can obtain a NYCSC transponder.
Toll Discounts for Passenger Cars
TBTA provides toll discounts by means of resident tokens or E-Tokens and NYCSC E-ZPass to registered Rockaway Peninsula and Broad Channel residents on the Cross Bay and Marine Parkway Bridges and registered Staten Island residents on the Verrazano-Narrows Bridge. Under the current toll schedule, eligible Rockaway Residents paying with a Token receive a $2.3214 reduction per trip at the Cross Bay and Marine Parkway Bridges (tokens are sold in a roll of 14 for $27.00); after implementation of ORT on April 30, 2017, Rockaway Residents paying with an E-Token using a registered E-ZPass tag will receive a $2.33 reduction per trip at these bridges. Customers paying with a non-resident token, or with an E-Token using a registered E-ZPass tag after April 30, 2017, receive a $1.42 reduction per trip at the Cross Bay and Marine Parkway Bridges. Rockaway
2 Under the TBM program, license plate images for vehicles without E-ZPass tags are matched with information from the applicable Department of Motor Vehicles and a toll bill is mailed to the vehicle owner.
HISTORY AND PROJECTION OF TRAFFIC, TOLL REVENUES AND EXPENSES AND REVIEW OF PHYSICAL CONDITIONS OF THE FACILITIES OF TRIBOROUGH BRIDGE AND TUNNEL AUTHORITY
9
Residents using a registered Rockaway Resident E-ZPass tag receive a $2.81 reduction per trip at the Cross Bay and Marine Parkway Bridges.
Eligible Staten Island Residents paying with a token receive a $7.775 reduction per trip at the Verrazano-Narrows Bridge where the round-trip toll is collected only in the westbound direction (tokens are sold in a roll of 10 for $92.25); Staten Island Residents paying with an E-Token using a registered E-ZPass tag after implementation of ORT in July 2017 will receive a $7.78 reduction per trip at the Verrazano-Narrows Bridge. Staten Island Residents paying with a registered Staten Island Resident E-ZPass tag receive a $10.52 reduction per trip if they take three or more trips across the Verrazano-Narrows Bridge per month and a $10.16 reduction per trip if they take one or two trips across the bridge per month. TBTA also provides a toll discount for resident carpools (vehicles with three or more passengers) to registered Staten Island residents on the Verrazano-Narrows Bridge. Under the current toll schedule, eligible Staten Island Residents paying with a Ticket, or an E-Ticket using a registered E-ZPass tag after ORT implementation, receive a $13.80 reduction per trip at the Verrazano-Narrows Bridge.
Tolls for Vehicles over 7,000 Pounds
The toll charges for vehicles over 7,000 pounds are a function of weight/number of axles as well as the crossing used. For the major crossings, the present cash/TBM rate for these vehicles is $17.00 for two axles, increasing to $66.00 for a seven-axle vehicle (rates at the Verrazano-Narrows Bridge are doubled since the toll is collected in the westbound direction only). These vehicles receive a reduction of approximately 39 percent with a NYCSC E-ZPass. Vehicles with more than seven axles pay a cash/TBM rate of $10.00 for each additional axle over seven and a NYCSC E-ZPass rate of $6.64 for each additional axle over seven (rates at the Verrazano-Narrows Bridge are doubled since the toll is collected in the westbound direction only). Vehicles with three to six axles pay varying rates, which increase with the number of axles, as shown in Table 1.
For the minor crossings, the two-axle cash/TBM rate for vehicles over 7,000 pounds is $8.50, increasing to $33.00 for a seven-axle vehicle. These vehicles presently receive approximately a 39 percent reduction with a NYCSC E-ZPass. Vehicles with more than seven axles pay a cash/TBM rate of $5.00 for each additional axle over seven and a NYCSC E-ZPass rate of $3.32 for each additional axle over seven. Vehicles with three to six axles pay varying rates, which increase with the number of axles, as shown in Table 1. Commercial vehicles are not permitted on the Henry Hudson Bridge without a New York City Department of Transportation (NYCDOT) permit.
The MTA also has a partial toll rebate program for eligible NYCSC E-ZPass commercial customers at the Verrazano-Narrows Bridge.
MTA's Toll Rebate Programs
Toll rebate programs are available for: (1) registered residents of Broad Channel and the Rockaway Peninsula (“Rockaway Residents”) for use on the Cross Bay Bridge; (2) Staten Island residents participating in the Staten Island Resident (“SIR”) E-ZPass discount program (the “SIR Rebate Program”); and (3) commercial vehicles participating in the Verrazano-Narrows Bridge Commercial Rebate Program (“VNB Commercial Rebate Program”). The MTA toll rebate
HISTORY AND PROJECTION OF TRAFFIC, TOLL REVENUES AND EXPENSES AND REVIEW OF PHYSICAL CONDITIONS OF THE FACILITIES OF TRIBOROUGH BRIDGE AND TUNNEL AUTHORITY
10
programs are available only to residents with registered NYCSC E-ZPass tags and commercial vehicles with more than ten trips per month across the Verrazano-Narrows Bridge using the same NYCSC E-ZPass account. These rebate programs do not affect TBTA revenues since TBTA collects the full toll, with a portion paid by the motorist and the remainder paid by the MTA with a combination of its own funds and New York State funds.
Cross Bay Bridge Rebate Program
A toll-rebate program for the benefit of E-ZPass customers who are Rockaway Residents was implemented by the MTA on January 1, 1998 for use on the Cross Bay Bridge. This program was modified during the period from July 23, 2010 to March 31, 2012, during which eligible Rockaway Residents were charged the reduced resident toll rate for the first two trips over the Cross Bay Bridge and only subsequent trips during the same calendar day using the same E-ZPass transponder were eligible for the rebate. Effective April 1, 2012, the MTA has been using funds allocated by New York State to restore the rebate for tolls incurred on the first two trips made on the same day over the Cross Bay Bridge by eligible residents. In 2016 the MTA reimbursed the TBTA in the amount of approximately $5.2 million in toll rebates relating to the Cross Bay Bridge program. The TBTA estimates that the reimbursements in 2017 will total approximately $5.3 million.
Verrazano-Narrows Bridge Rebate Programs
Since 2014, the MTA has had two toll rebate programs at the Verrazano-Narrows Bridge (VNB Rebate Programs): (1) the SIR Rebate Program, available for residents of Staten Island participating in the SIR E-ZPass toll discount plan; and (2) the VNB Commercial Rebate Program, available for commercial vehicles making more than ten trips per month using the same NYCSC E-ZPass account. Since they are partially funded by the State, the VNB Rebate Programs follow the State fiscal year.
The annualized cost of the 2016-2017 VNB Rebate Programs was $17.3 million, with $14 million for the 2016-2017 VNB Commercial Rebate Program and 2016-2017 SIR Rebate Program, funded equally by the State and the MTA, with the State's contribution provided by appropriations to the MTA. An additional $3.3 million in appropriations was provided by the State to the MTA to increase the rebate from $.50 to $.74 for Staten Island Residents with three or more trips per month and from $.86 to $1.10 for Staten Island Residents with less than three trips per month.
The projected annualized cost of the 2017-2018 VNB Rebate Programs is approximately $20.8 million, with $14 million for the 2017-2018VNB Commercial Rebate Program and for the 2017-2018 SIR Rebate Program, funded equally by the State and the MTA, with the State’s contribution provided by appropriations to the MTA. An additional $6.8 million in appropriations is being provided by the State to the MTA to keep the effective post-rebate SIR E-ZPass toll at $5.50 by providing a $0.98 rebate for Staten Island Residents with three or more trips per month and a $1.34 rebate for Staten Island Residents with less than three trips per month.
The money to fund a year’s estimated costs for the VNB Rebate Programs is transferred by the MTA to TBTA prior to the implementation of the VNB Rebate Programs each year. The 2017-2018 VNB Rebate Programs will be implemented as specified herein only for such periods during which both
HISTORY AND PROJECTION OF TRAFFIC, TOLL REVENUES AND EXPENSES AND REVIEW OF PHYSICAL CONDITIONS OF THE FACILITIES OF TRIBOROUGH BRIDGE AND TUNNEL AUTHORITY
11
(1) MTA’s total financial responsibility, net of State actions or available offsets, does not exceed $7 million for the 2017-2018 SIR Rebate and VNB Commercial Rebate Programs and (2) the State provides (i) at least $7 million for the 2017-2018 SIR Rebate Program and VNB Commercial Rebate Program and (ii) such additional funds as are necessary (currently estimated to be $6.8 million) to keep the effective post-rebate SIR E-ZPass toll at $5.50 by increasing the rebate to $0.98 for Staten Island Residents with three or more trips per month and to $1.34 for Staten Island Residents with less than three trips per month under the 2017-2018 SIR Rebate Program. MTA shall apply the $6.8 million of additional funds provided by the State to provide a $0.98 rebate for Staten Island Residents with three or more trips per month and a $1.34 rebate for Staten Island Residents with less than three trips per month.
If, as a result of unexpected toll transaction activity, TBTA estimates that such MTA and State funds allocated to the MTA for the 2017-2018 VNB Rebate Programs, net of offsets, will be insufficient to fund the 2017-2018 VNB Rebate Programs for the full Program year, TBTA may reduce the rebate amount under such Program to a percentage that is forecast to be payable in full for the remainder of the Program year with the available funds. However, in the event that such MTA and State funds allocated to the MTA for the 2017-2018 VNB Rebate Programs are fully depleted at any time during the 2017-2018 VNB Rebate Programs annual period, the 2017-2018 VNB Rebate Programs will cease and Staten Island residents will be charged the applicable resident discount toll and trucks and other commercial vehicles will be charged the applicable NYCSC E-ZPass toll for the Verrazano-Narrows Bridge.
The VNB Rebate Programs will continue into future years provided that (a) MTA’s annual period contribution does not exceed $7 million, (b) the MTA Board approves a budget that includes MTA’s contribution to such program, and (c) the State provides to MTA funds sufficient for at least half the expenses of each continuing annual period.
Under the 2016-2017 SIR Rebate Program, the MTA rebated $0.74 of the $6.24 SIR E-ZPass toll paid by Staten Island residents with three or more trips per month across the Verrazano-Narrows Bridge, and $1.10 of the $6.60 SIR E-ZPass toll paid by Staten Island residents with one or two trips across the bridge. As a result of these MTA toll rebates, Staten Island residents paid an effective toll of $5.50 per trip. The 2016-2017 SIR Rebate Program was retroactive to April 1, 2016 and continued through March 31, 2017.
Under the 2017-2018 SIR Rebate Program the MTA will rebate $0.98of the $6.48 SIR E-ZPass toll paid by Staten Island residents with three or more trips per month across the Verrazano-Narrows Bridge, and $1.34 of the $6.84 SIR E-ZPass toll paid by Staten Island residents with one or two trips across the bridge. As a result of these MTA toll rebates, Staten Island residents will pay an effective toll of $5.50 per trip under the current SIR toll rates. The 2017-2018 SIR Rebate Program will continue through March 31, 2018.
Under the 2016-2017 VNB Commercial Rebate Program, the rebate was 18 percent of the E-ZPass toll for trucks and other commercial vehicles with more than ten (10) trips per month across the Verrazano-Narrows Bridge, using the same NYCSC E-ZPass Account until March 2017 when the rebate was reduced because of insufficient funds. The 2016-2017 VNB Commercial Rebate Program continued through March 31, 2017.
HISTORY AND PROJECTION OF TRAFFIC, TOLL REVENUES AND EXPENSES AND REVIEW OF PHYSICAL CONDITIONS OF THE FACILITIES OF TRIBOROUGH BRIDGE AND TUNNEL AUTHORITY
12
Under the 2017-2018 VNB Commercial Rebate Program, the initial rebate is 17.5 percent of the E-ZPass toll for trucks and other commercial vehicles with more than ten (10) trips per month across the Verrazano-Narrows Bridge, using the same NYCSC E-ZPass Account. Implementing a 17.5 percent rebate of the E-ZPass toll for trucks and other eligible commercial vehicles is expected to ensure that the $7 million allocated for the 2017-2018 VNB Commercial Rebate Program is sufficient to provide funding from April 1, 2017 through March 31, 2018. The 2017-2018 VNB Commercial Rebate Program will continue through March 31, 2018.
E-ZPass Electronic Toll Collection System
The E-ZPass Electronic Toll Collection (ETC) system has been fully installed at all TBTA bridges and tunnels since December 1996. When a vehicle with an E-ZPass transponder enters the toll payment area, an electronic reader identifies the tag code at the toll plaza and the toll is deducted from the customer’s account. TBTA has over 4.8 million E-ZPass tags in use. For calendar year 2016, E-ZPass participation rates averaged 85.9 percent of toll-paying traffic TBTA-wide. The total number of active E-ZPass Group tags in use for all participating agencies as of December 31, 2016 was over 32 million.
With the introduction of E-ZPass at all TBTA crossings, toll plaza operations improved and vehicle-hours of delay have been reduced. This, in turn, has led to even more motorists enrolling in E-ZPass. Electronic payment of tolls has accelerated vehicle processing through the E-ZPass lanes, thereby reducing the overall vehicle queues at the plazas. TBTA estimates that manual toll lanes are able to process approximately 250 vehicles per hour and dedicated (gated) E-ZPass lanes are able to process approximately 800 vehicles per hour. Prior to implementation of E-ZPass, vehicle processing through the TBTA toll plazas during peak periods was a primary cause of congestion at the crossings.
Table 2 lists the E-ZPass annual TBTA-wide participation rates starting in 2007, the eleventh year since all nine crossings had E-ZPass in operation. Implementation of E-ZPass started in October 1995 on the Verrazano-Narrows Bridge and was phased in gradually on the remaining crossings through December 1996. Also shown are the participation rates for each of the facilities for 2016. Based on customer acceptance of the technology, TBTA expects that the E-ZPass share of total transactions will continue to increase moderately over time.
HISTORY AND PROJECTION OF TRAFFIC, TOLL REVENUES AND EXPENSES AND REVIEW OF PHYSICAL CONDITIONS OF THE FACILITIES OF TRIBOROUGH BRIDGE AND TUNNEL AUTHORITY
13
Table 2 E-ZPass Participation Rates
Year Annual Participation Rates for all Facilities
Source: TBTA data. TBTA continues to undertake efforts to increase E-ZPass market share. The most recent toll increase continued to widen the gap between E-ZPass and cash/TBM tolls, which has contributed towards a bigger shift in favor of E-ZPass. Spanish language versions of the E-ZPass application, interactive website, and the customer service telephone voice response system were introduced in January 2012. In addition, TBTA began selling E-ZPass “On-the-Go" pre-paid tags in the cash toll lanes at each facility in 2012. The program has been very successful with more than 934,000 tags sold in the lanes since the program began, including 243,000 in 2016. TBTA will continue the program into 2017 by selling tags in the cash lanes until such lanes are closed and replaced with ORT and then by exploring other sales venues, including potential retail and on-line outlets.
TBTA launched its MTA Cash Reload Card pilot program in February 2012. This program allows customers who wish to replenish their accounts with cash to receive an MTA card that is directly linked to their E-ZPass accounts. Customers can go to any one of thousands of Visa ReadyLink retail merchants throughout the New York region and use the card to reload their E-ZPass accounts using cash through a self-service kiosk or through a sales clerk. This eliminates the need for customers who previously had to travel to one of three walk-in centers in Yonkers, Queens, or Staten Island to add cash to their E-ZPass accounts. The card is designed for people who want greater cash control and either do not have or do not want to use a credit card for E-ZPass. Receipts are provided to the customers at the completion of the reload transaction. Through December 2016, nearly 175,000 cards have been issued to customers and nearly 18 percent of total cash replenishments are being made using the reload cards.
In November 2012, TBTA introduced E-ZPass “Pay Per Trip”, which enables customers to set up an E-ZPass account without a pre-paid balance. Those interested in this program pay for their tolls each day through an automated checking account debit. Through December 2016, over 80,000 account holders have signed up for this initiative.
Future marketing efforts to promote the benefits of E-ZPass and to facilitate the opening of accounts (through On-the-Go, at the E-ZPass website, or potentially other mechanisms) and maintaining them (whether through cash or credit replenishments) may include promotional videos linked to social media, the MTA web site, travel-related web sites, advertisements through radio, print and variable message signs, and a marketing presence at community events.
HISTORY AND PROJECTION OF TRAFFIC, TOLL REVENUES AND EXPENSES AND REVIEW OF PHYSICAL CONDITIONS OF THE FACILITIES OF TRIBOROUGH BRIDGE AND TUNNEL AUTHORITY
14
Additionally, early January and February 2017 data on ORT toll collection, has shown a further increase in E-ZPass participation at the Queens Midtown Tunnel and the Hugh L. Carey Tunnel. As discussed in detail later in the report, conversion to ORT induces current cash customers to switch to E-ZPass. While Stantec projects overall E-ZPass usage to increase by 2 to 3 percent with the implementation of ORT, this is a combination of trip shrinkage and payment method shifts; both of which can vary by facility.
TBTA’s Role in E-ZPass
TBTA was a founding member of the E-ZPass Interagency Group (E-ZPass Group). Originally comprised of toll authorities in Delaware, Pennsylvania, New Jersey, and New York, the E-ZPass Group now encompasses 28 toll agencies in 16 states, including five international border crossings. Since the inception of the E-ZPass Group more than 20 years ago, customers of the member E-ZPass Group agencies have been able to use their E-ZPass tags on any E-ZPass-equipped facility operated by another E-ZPass Group member. The E-ZPass Group processes over 3.0 billion toll transactions annually. As the E-ZPass Group has grown, the E-ZPass customer base has increased, which has helped increase usage of E-ZPass on TBTA facilities. The transportation network includes, in addition to TBTA, the following agencies and bridges:
• The six interstate crossings of the Port Authority of New York and New Jersey;
• New Jersey Turnpike and Garden State Parkway operated by the New Jersey Turnpike Authority;
• New York State Thruway including its Tappan Zee Bridge;
• The five bridges of the New York State Bridge Authority (from Bear Mountain northward);
• The Buffalo and Fort Erie Public Bridge Authority’s Peace Bridge;
• The Thousand Island Bridges of the Thousand Island Bridge Authority;
• The three bridges of the Niagara Falls Bridge Commission;
• The Atlantic City Expressway (operated by the South Jersey Transportation Authority);
• The four toll bridges between New Jersey and Pennsylvania operated by the Delaware River Port Authority;
• The seven toll bridges between New Jersey and Pennsylvania operated by the Delaware River Joint Toll Bridge Commission;
• The Delaware Memorial Bridge between New Jersey and Delaware operated by the Delaware River and Bay Authority; and
• The two toll bridges between New Jersey and Pennsylvania operated by the Burlington County Bridge Commission.
Also included are the toll facilities operated by the following agencies and companies across the United States:
• Delaware Department of Transportation
• Illinois State Toll Highway Authority
• Indiana Toll Road Concession Company, LLC
HISTORY AND PROJECTION OF TRAFFIC, TOLL REVENUES AND EXPENSES AND REVIEW OF PHYSICAL CONDITIONS OF THE FACILITIES OF TRIBOROUGH BRIDGE AND TUNNEL AUTHORITY
15
• Kentucky Public Transportation Infrastructure Authority
• Massachusetts Department of Transportation
• Maryland Transportation Authority
• Maine Turnpike Authority
• New Hampshire Department of Transportation
• North Carolina Turnpike Authority
• Ohio Turnpike and Infrastructure Commission
• The Pennsylvania Turnpike Commission
• Rhode Island Turnpike and Bridge Authority
• Skyway Concession Company (Chicago)
• Virginia Department of Transportation
• West Virginia Parkway Authority
With the exception of TBTA customers enrolled in the E-ZPass Pay Per Trip plan, all TBTA customers must pre-pay their E-ZPass accounts. These pre-payments are based on a customer’s E-ZPass usage at both TBTA and other E-ZPass Group member facilities. Through the E-ZPass Group system, TBTA and other member agencies transfer payments associated with inter-operability to each other on a routine basis. For 2016, TBTA transferred $973.1 million to, and received $475.1 million from, other members within the E-ZPass Group.
Cashless Open Road Tolling (ORT) and Toll Violation Enforcement
TBTA implemented a cashless tolling pilot at the Henry Hudson Bridge in November 2012, made cashless tolling the permanent method of toll collection in January 2015, and implemented ORT in November 2016. Under ORT, toll equipment is mounted on overhead gantries and all motorists can now use any lane to drive at highway speeds through a free-flowing environment. Tolls continue to be collected using E-ZPass tags and readers. For drivers without an E-ZPass tag, an image is taken of their license plate, matched with information from the applicable Department of Motor Vehicles and a bill for the toll is mailed to the vehicle’s registered owner under the TBM program. Currently, approximately 94 percent of crossings at the Henry Hudson Bridge are processed through E-ZPass and 6 percent are Tolls by Mail transactions. Throughput capacity at the Henry Hudson Bridge increased from around 800 vehicles per hour with gated E-ZPass lanes to over 1,400 vehicles per hour under AET operations. Under ORT operations, throughput capacity has increased to levels comparable to the capacity of a free-flowing lane of traffic, which is about 1,800 vehicles per hour.
As listed in Table 3 below, TBTA implemented cashless ORT at the Hugh L. Carey Tunnel on January 4, 2017 and at the Queens Midtown Tunnel on January 10, 2017 and toll plazas at both tunnel facilities were demolished in February 2017. By fall 2017, the ORT system is expected to be put into revenue service at all TBTA facilities and the existing toll plazas including the booths will be demolished.
HISTORY AND PROJECTION OF TRAFFIC, TOLL REVENUES AND EXPENSES AND REVIEW OF PHYSICAL CONDITIONS OF THE FACILITIES OF TRIBOROUGH BRIDGE AND TUNNEL AUTHORITY
16
Table 3 ORT Activation Schedule
Facility Date of Activation
Throgs Neck Bridge End of 2017
Bronx-Whitestone Bridge End of 2017
RFK Bridge Summer 2017
Queens Midtown Tunnel 1/10/2017
Hugh L. Carey Tunnel 1/4/2017
Verrazano-Narrows Bridge End of 2017
Henry Hudson Bridge 11/20/2016
Marine Parkway-Gil Hodges Memorial Bridge 4/30/2017
Cross Bay Veterans Memorial Bridge 4/30/2017
In spring 2016, TBTA began asking the New York State Department of Motor Vehicles (NYSDMV) to suspend the vehicle registrations of violators who fail to pay their tolls and violation fees or have them dismissed or transferred in response to violation notices for five toll violations within 18 months, in accordance with the new NYSDMV regulation for persistent or habitual toll violators. In January 2017, the NYSDMV changed its regulation for persistent or habitual toll violators so that vehicle registrations can be suspended for three toll violations within five years and commercial vehicle registrations can be suspended for $200.00 in unpaid tolls within five years.
Effective March 15, 2017, the violation fee at the Queens Midtown and Hugh L. Carey Tunnels and the Bronx-Whitestone, Robert F. Kennedy, Throgs Neck and Verrazano-Narrows Bridges has increased to $100.00 per toll violation; the violation fee remains at $50.00 per violation for the Henry Hudson, Cross Bay and Marine Parkway Bridges.
TBTA is employing and developing measures to enhance collection and enforcement of toll violations under the ORT system. License plate recognition technology on gantries and in patrol vehicles is being used for the detection of persistent toll violators and toll violation enforcement. Additionally, TBTA began issuing exclusion orders barring the vehicles of out-of-state toll violation scofflaws from TBTA facilities.
In April 2017, NYSDMV received legislative authorization to enter into reciprocal compacts with other states to suspend the vehicle registrations of persistent or habitual toll violators, which will allow TBTA to have the home states of out-of-state violators suspend their vehicle registrations for
HISTORY AND PROJECTION OF TRAFFIC, TOLL REVENUES AND EXPENSES AND REVIEW OF PHYSICAL CONDITIONS OF THE FACILITIES OF TRIBOROUGH BRIDGE AND TUNNEL AUTHORITY
17
toll violations committed on TBTA facilities. In time TBTA will be able to discontinue issuing exclusion orders to out-of-state toll violators barring their vehicles from TBTA facilities.
Passenger Car Toll Rate Trends and Inflation
Since 1971, toll rates have been increased periodically on the TBTA facilities. Table 4 displays passenger car toll rates for the nine TBTA bridges and tunnels over the past 45 years. Tolls are shown for cash/TBM passenger car transactions since 1971 and for all E-ZPass transactions from 1996, when E-ZPass was introduced on the TBTA system, until July 12, 2009. Effective July 12, 2009, only NYCSC E-ZPass customers are eligible for the lower E-ZPass rate and non-NYCSC E-ZPass customers paid the cash/TBM toll. Beginning in 2009, Table 4 shows the cash/TBM rate and the NYCSC E-ZPass rate.
Passenger Car Toll Rate Trends
Since 1982, passenger car toll rates have been separated into four categories, as follows:
• Major crossings – RFK, Bronx-Whitestone, and Throgs Neck Bridges, and the Queens Midtown and Hugh L. Carey Tunnels;
• Minor crossings – Marine Parkway and Cross Bay Bridges; • Henry Hudson Bridge (treated as a minor facility prior to the 2008 toll increase) – a crossing
restricted to passenger vehicles; and • Verrazano-Narrows Bridge – a major crossing with one-way toll collection since 1986 in
accordance with federal law.
In general, tolls for vehicles over 7,000 pounds have also been adjusted upward whenever passenger car toll rates were increased. Notable exceptions occurred in 1987 and 1989 when these toll rates were not raised while there was a general increase for passenger cars.
Over the years, TBTA has implemented various resident toll discount programs at the Cross Bay, Marine Parkway, and Verrazano-Narrows Bridges. The MTA also has toll rebate programs for certain eligible residents using NYCSC E-ZPass at the Cross Bay and Verrazano-Narrows Bridges, as well as a toll rebate program for eligible NYCSC E-ZPass commercial customers at the Verrazano-Narrows Bridge. While the rebate programs do not have an effect on revenues, due to MTA reimbursements as noted above, the toll discount programs have a negative effect on revenues, in part offset by a positive effect on traffic by attracting additional traffic to the facilities.
HISTORY AND PROJECTION OF TRAFFIC, TOLL REVENUES AND EXPENSES AND REVIEW OF PHYSICAL CONDITIONS OF THE FACILITIES OF TRIBOROUGH BRIDGE AND TUNNEL AUTHORITY
18
Table 4 Historical Trends in Cash/TBM and E-ZPass Passenger Car Toll Rates
2017(f) $8.50 / $5.76(b) $8.50 / $5.76(g) $6.00 / $2.64 $4.25 / $2.16 Notes: (a) At the Hugh L. Carey Tunnel, the cash passenger car toll rates were $0.35 in 1971 and $0.70 in 1972. (b) Since March 20, 1986, round-trip tolls (twice the amount shown) have been collected on the Verrazano-Narrows Bridge in only the
westbound direction in compliance with federal law. Eastbound traffic uses the bridge toll-free. These amounts are the equivalents of collecting tolls in each direction.
(c) E-ZPass introduced to all TBTA facilities in December 1996. (d) Effective July 12, 2009, when the lower E-ZPass rate became available only to NYCSC E-ZPass customers. (e) Since November 10, 2012, customers without E-ZPass transponders at the Henry Hudson Bridge pay via the TBM program, under which
a license plate image is matched with information from the applicable Department of Motor Vehicles and a toll bill is sent to the registered vehicle owner.
(f) New rates effective as of March 19, 2017 (g) Customers without E-ZPass transponders have been receiving toll bills under the Tolls by Mail program at the Hugh L. Carey and Queens
Midtown Tunnels since January 2017.
Inflation
The Consumer Price Index Urban (CPI-U), compiled by the US Department of Labor, Bureau of Labor Statistics for United States Cities, is often used to compare toll rate increases. Since over 85 percent of transactions on TBTA facilities are by E-ZPass, we have compared cumulative CPI-U alongside the TBTA major crossing passenger car E-ZPass toll rates. The comparison starts in 1996 when E-ZPass was instituted on TBTA facilities. As indicated in Table 5, TBTA E-ZPass tolls in March
HISTORY AND PROJECTION OF TRAFFIC, TOLL REVENUES AND EXPENSES AND REVIEW OF PHYSICAL CONDITIONS OF THE FACILITIES OF TRIBOROUGH BRIDGE AND TUNNEL AUTHORITY
19
2017 (after the March 19th toll increase) were 1.9 times higher than the 1996 E-ZPass toll rate while the CPI-U was 1.6 times higher than the 1996 level. If adjusted for changes in the CPI-U, current tolls are 1.2 times higher than the 1996 rate.
Table 5 E-ZPass Passenger Toll Rates versus Consumer Price Index
Year Consumer Price Index (a)
RFK, Bronx-Whitestone and Throgs Neck Bridges and Queens Midtown
and Hugh L. Carey Tunnels
Tolls Adjusted to 1982 - 1984 dollars(b)
1996(c) 166.9 $3.00 $1.80
2003 197.8 3.50 1.77
2005 212.7 4.00 1.88
2008 235.8 4.15 1.76
2009(d) 236.8 4.57 1.93
2010(e) 240.9 4.80 1.99
2013(f) 256.8 5.33 2.08
2015(g) 259.2 5.54 2.14
2017(h) 267.7 5.76 2.15
Ratio 2017/1996 1.6 1.9 1.2
Notes: (a) New York Metropolitan Statistical Area: New York–Northern New Jersey-Long Island, NY-NJ-CT-PA, All Urban Consumers,
All Items. Base period: 1982-1984 = 100.0. Not seasonally adjusted. Source: US Department of Labor, Bureau of Labor Statistics.
(b) The current toll divided by the CPI and expressed in dollars. (c) E-ZPass introduced to all TBTA facilities in December 1996. (d) Effective July 12, 2009, when the lower E-ZPass rate became available only to NYCSC E-ZPass customers. (e) Effective December 30, 2010. (f) Effective March 3, 2013. (g) Effective March 22, 2015. (h) Effective March 19, 2017.
HISTORICAL TRAFFIC, REVENUES AND EXPENSES AND ESTIMATED/BUDGETED NUMBERS FOR 2016
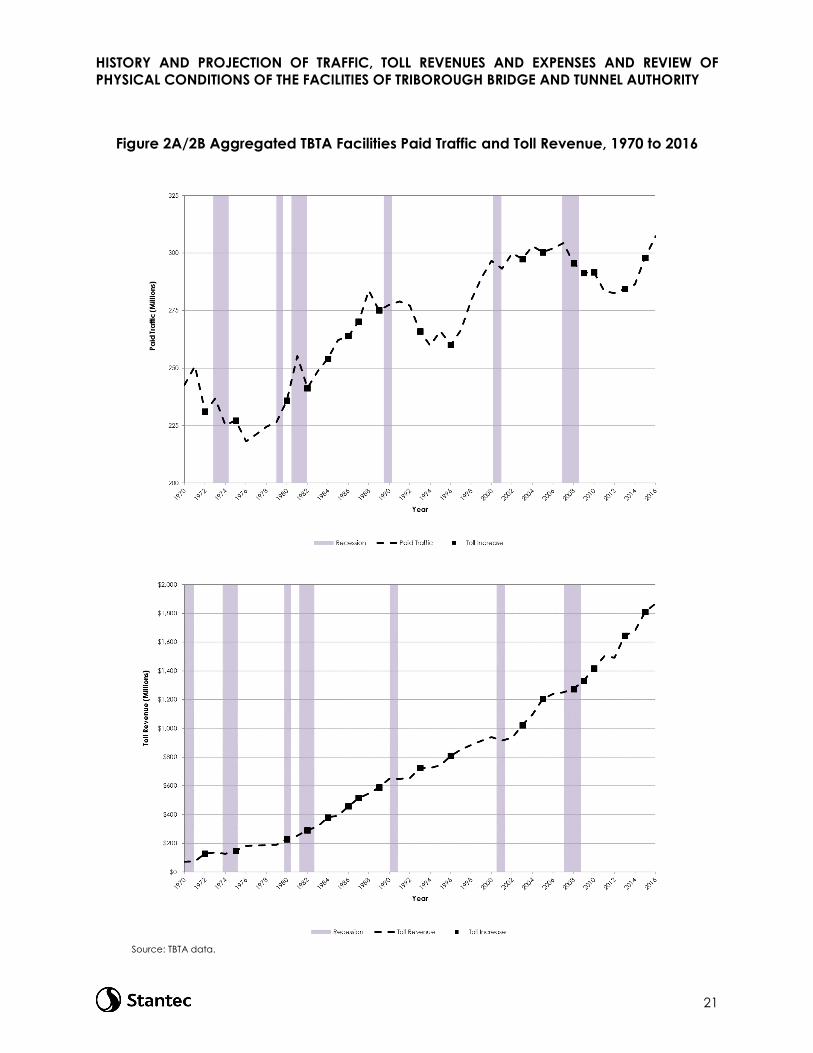
Historical traffic, toll revenues, and expenses were reviewed for the nine TBTA bridges and tunnels. Over the last 47 years, paid traffic volumes on the crossings have ranged from a low of 218 million in 1976 to a high of 307 million in 2016. As displayed in Figure 2A/2B, the growth of traffic and revenue has been affected by the region’s overall growth in population and employment, offset by the impact of 17 periodic toll increases (through the end of 2016 and represented by the boxes in the graph). By 2000, after 10 toll increases and 18 percent higher traffic volume, toll revenues had increased more than 13-fold, from $72 million to $941 million in 2000. Revenues declined to $915 million in 2001 primarily due to the closures and restrictions on TBTA facilities following the September 11 terrorist attack on the World Trade Center and the regional decline in employment.
Toll increases in March 2008, July 2009, and December 2010 resulted in annual revenue increases through 2011. In 2012, toll revenues were $1,491 million, $11 million less than the 2011 level of $1,502
HISTORY AND PROJECTION OF TRAFFIC, TOLL REVENUES AND EXPENSES AND REVIEW OF PHYSICAL CONDITIONS OF THE FACILITIES OF TRIBOROUGH BRIDGE AND TUNNEL AUTHORITY
20
million, reflecting the negative impacts including temporary closures caused by Superstorm Sandy, partially offset by modest improvements in the regional and national economies. Toll revenues in 2013 increased to $1,645 million primarily due to the rebound from Superstorm Sandy and the March 2013 toll increase. In 2014, total toll revenues for the TBTA facilities were $1,676 million, 1.9 percent higher than 2013 toll revenues. That increase in toll revenue was attributed to a continuing modest economic recovery and the March 2013 toll increase. Toll revenues in 2015 were $1,809 million (7.9 percent higher than 2014 toll revenues) primarily due to the March 2015 toll increase, generally overall favorable weather conditions, relatively low gas prices, and a continued modest recovery in the economy. In 2016, these conditions continued resulting in traffic reaching a new historical high of 307 million vehicles, which was a 3.2 percent increase from the previous year. Toll revenues in 2016 were $1,870 million, 3.4 percent higher than 2015 toll revenues.
Also note in Figure 2A/2B that, despite the periodic toll increases, the traffic trend is generally upward. Recessionary conditions in 2008 and 2009 led to a decrease in overall travel as unemployment rose and overall economic growth declined. Though the recession technically ended in 2009, the economy was slow to recover with several years of little to no growth. Tepid economic conditions, combined with toll increases in 2008, 2009, 2010, and 2011, led to continued modest declines in total transactions. Since 2012, as the economy has begun to show positive signs of growth, with increasing employment levels and recent decreases in gasoline prices, transaction growth has returned. Overall traffic at TBTA facilities continued to increase despite the periodic toll increases implemented in March 2013 and March 2015.
Other noticeable declines in traffic have occurred during the fuel crises of the 1970s and during the economic recessions in the late 1980s, early 1990s, and 2008-2009, all periods of difficult and prolonged economic downturns.
HISTORY AND PROJECTION OF TRAFFIC, TOLL REVENUES AND EXPENSES AND REVIEW OF PHYSICAL CONDITIONS OF THE FACILITIES OF TRIBOROUGH BRIDGE AND TUNNEL AUTHORITY
21
Figure 2A/2B Aggregated TBTA Facilities Paid Traffic and Toll Revenue, 1970 to 2016
Source: TBTA data.
HISTORY AND PROJECTION OF TRAFFIC, TOLL REVENUES AND EXPENSES AND REVIEW OF PHYSICAL CONDITIONS OF THE FACILITIES OF TRIBOROUGH BRIDGE AND TUNNEL AUTHORITY
22
Traffic and Toll Revenue, 2006 to 2016
Table 6 lists the traffic and toll revenue record for each of the nine crossings for the 2006-2016 period. Total TBTA traffic and toll revenue are shown in Table 7. Within this eleven-year period toll-paying traffic reached historic peaks twice, first in 2007 with 304 million crossings and again in 2016 with 307 million crossings.
The first toll increase within this period occurred on March 16, 2008. In general, the pattern historically has been that when toll rates are increased, traffic declines moderately and then traffic begins to rise until the next rate increase. However, the toll rate increase in 2008 was also accompanied by rising fuel prices through mid-2008 and the deteriorating economy, resulting in a 2.9 percent drop in traffic. In contrast, with gasoline prices dropping in the latter portion of 2008, traffic decreased only 1.5 percent between 2008 and 2009, even with a toll increase occurring in July 2009. The December 2010 toll increase was also in the midst of a slowly recovering economy and accelerating gasoline prices, resulting in a 2.8 percent decrease in traffic in 2011.
TBTA traffic following the March 2013 and March 2015 toll increases has not followed the typical pattern outlined above. Lower gasoline prices, among other factors, resulted in a 0.7 percent increase in traffic following the March 2013 toll increase and a 4.0 percent increase in traffic following the March 2015 toll increase. The five toll increases reflected in Table 6 and Table 7 in 2008, 2009, 2010, 2013, and 2015 are evident in the jump in average tolls in the years following the increase. The historical relationship between toll increases and its effects on TBTA traffic volumes is further discussed in the Toll Impacts and Elasticity section of this report.
In 2008, traffic volumes decreased 2.9 percent from 304 million in 2007 to 296 million as a result of the March 16, 2008 toll increase and also in part due to the nationwide recession and the increase in gas prices, while toll revenues increased 1.9 percent to $1,274 million, as a result of the toll increase.
The July 12, 2009 toll increase resulted in an overall increase in toll revenue from $1,274 million in 2008 to $1,332 million, an increase of 4.6 percent, while traffic decreased by 1.5 percent from 295.7 million to 291.4 million vehicles. Traffic grew by 0.1 percent in 2010 to 291.7 million vehicles and toll revenue grew 6.4 percent to $1,417 million, primarily due to a full year’s impact of the July 2009 toll increase. The December 30, 2010 toll increase resulted in an overall increase in toll revenue from $1,417 million in 2010 to $1,502 in 2011, an increase of 6.0 percent, while traffic decreased by 2.8 percent from 291.7 million to 283.5 million. The reduction in toll traffic was a result of severe winter weather, high gas prices, Tropical Storm Irene in August 2011 (tolls were not collected for approximately two days at the Marine Parkway, Cross Bay, Verrazano-Narrows, Throgs Neck, and Bronx-Whitestone Bridges), decreased overall travel and the December 2010 increase in toll rates, among other factors.
HISTORY AND PROJECTION OF TRAFFIC, TOLL REVENUES AND EXPENSES AND REVIEW OF PHYSICAL CONDITIONS OF THE FACILITIES OF TRIBOROUGH BRIDGE AND TUNNEL AUTHORITY
23
Table 6 Annual Toll-Paying Traffic and Toll Revenue, 2006 to 2016 (000s)(a)
Source: TBTA data. Notes: (a) Toll rate increases occurred on March 16, 2008, July 12, 2009, December 30, 2010, March 3, 2013, and March 22, 2015. (b) Westbound toll traffic volume doubled, since traffic is not registered in the eastbound direction. (c) Average toll on basis of revenues divided by doubled westbound volume.
HISTORY AND PROJECTION OF TRAFFIC, TOLL REVENUES AND EXPENSES AND REVIEW OF PHYSICAL CONDITIONS OF THE FACILITIES OF TRIBOROUGH BRIDGE AND TUNNEL AUTHORITY
24
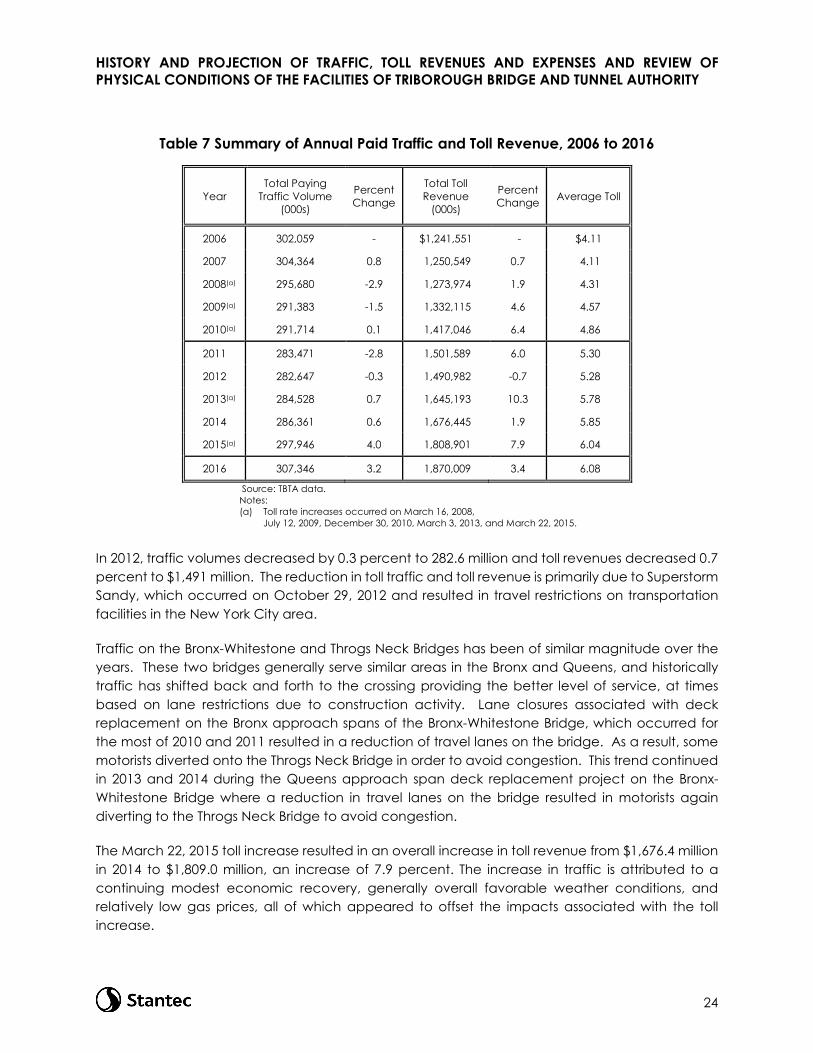
Table 7 Summary of Annual Paid Traffic and Toll Revenue, 2006 to 2016
Year Total Paying
Traffic Volume (000s)
Percent Change
Total Toll Revenue
(000s)
Percent Change Average Toll
2006 302,059 - $1,241,551 - $4.11
2007 304,364 0.8 1,250,549 0.7 4.11
2008(a) 295,680 -2.9 1,273,974 1.9 4.31
2009(a) 291,383 -1.5 1,332,115 4.6 4.57
2010(a) 291,714 0.1 1,417,046 6.4 4.86
2011 283,471 -2.8 1,501,589 6.0 5.30
2012 282,647 -0.3 1,490,982 -0.7 5.28
2013(a) 284,528 0.7 1,645,193 10.3 5.78
2014 286,361 0.6 1,676,445 1.9 5.85
2015(a) 297,946 4.0 1,808,901 7.9 6.04
2016 307,346 3.2 1,870,009 3.4 6.08
Source: TBTA data. Notes: (a) Toll rate increases occurred on March 16, 2008,
July 12, 2009, December 30, 2010, March 3, 2013, and March 22, 2015.
In 2012, traffic volumes decreased by 0.3 percent to 282.6 million and toll revenues decreased 0.7 percent to $1,491 million. The reduction in toll traffic and toll revenue is primarily due to Superstorm Sandy, which occurred on October 29, 2012 and resulted in travel restrictions on transportation facilities in the New York City area.
Traffic on the Bronx-Whitestone and Throgs Neck Bridges has been of similar magnitude over the years. These two bridges generally serve similar areas in the Bronx and Queens, and historically traffic has shifted back and forth to the crossing providing the better level of service, at times based on lane restrictions due to construction activity. Lane closures associated with deck replacement on the Bronx approach spans of the Bronx-Whitestone Bridge, which occurred for the most of 2010 and 2011 resulted in a reduction of travel lanes on the bridge. As a result, some motorists diverted onto the Throgs Neck Bridge in order to avoid congestion. This trend continued in 2013 and 2014 during the Queens approach span deck replacement project on the Bronx-Whitestone Bridge where a reduction in travel lanes on the bridge resulted in motorists again diverting to the Throgs Neck Bridge to avoid congestion.
The March 22, 2015 toll increase resulted in an overall increase in toll revenue from $1,676.4 million in 2014 to $1,809.0 million, an increase of 7.9 percent. The increase in traffic is attributed to a continuing modest economic recovery, generally overall favorable weather conditions, and relatively low gas prices, all of which appeared to offset the impacts associated with the toll increase.
HISTORY AND PROJECTION OF TRAFFIC, TOLL REVENUES AND EXPENSES AND REVIEW OF PHYSICAL CONDITIONS OF THE FACILITIES OF TRIBOROUGH BRIDGE AND TUNNEL AUTHORITY
25
In 2016, traffic volumes increased by 3.2 percent to a new all-time high of 307.3 million vehicles. The increase in traffic is attributed to a continued modest recovery of the economy, favorable gas prices, and generally overall favorable weather conditions throughout the year. Another possible factor for the increase in year over year traffic is the substantial increase in housing construction activity throughout the City as developers were motivated to secure 421-a property tax exemptions before the program’s expiration in January 2016.
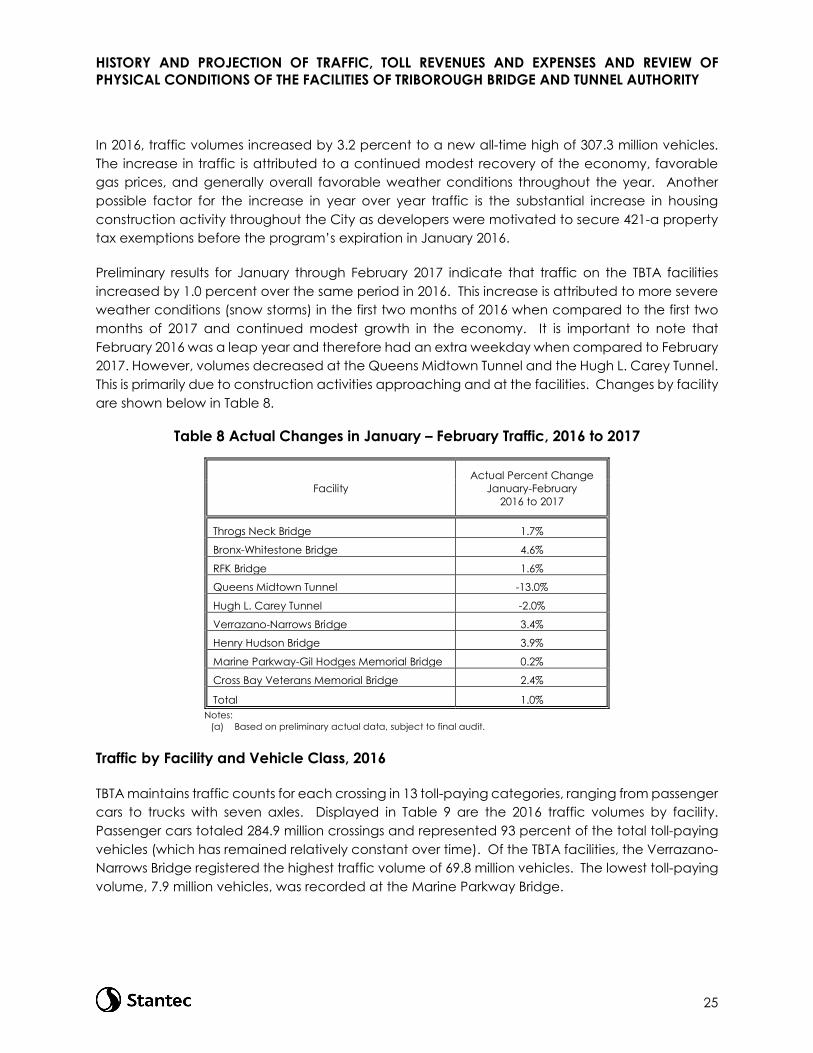
Preliminary results for January through February 2017 indicate that traffic on the TBTA facilities increased by 1.0 percent over the same period in 2016. This increase is attributed to more severe weather conditions (snow storms) in the first two months of 2016 when compared to the first two months of 2017 and continued modest growth in the economy. It is important to note that February 2016 was a leap year and therefore had an extra weekday when compared to February 2017. However, volumes decreased at the Queens Midtown Tunnel and the Hugh L. Carey Tunnel. This is primarily due to construction activities approaching and at the facilities. Changes by facility are shown below in Table 8.
Table 8 Actual Changes in January – February Traffic, 2016 to 2017
Facility Actual Percent Change
January-February 2016 to 2017
Throgs Neck Bridge 1.7%
Bronx-Whitestone Bridge 4.6%
RFK Bridge 1.6%
Queens Midtown Tunnel -13.0%
Hugh L. Carey Tunnel -2.0%
Verrazano-Narrows Bridge 3.4%
Henry Hudson Bridge 3.9%
Marine Parkway-Gil Hodges Memorial Bridge 0.2%
Cross Bay Veterans Memorial Bridge 2.4%
Total 1.0% Notes:
(a) Based on preliminary actual data, subject to final audit.
Traffic by Facility and Vehicle Class, 2016
TBTA maintains traffic counts for each crossing in 13 toll-paying categories, ranging from passenger cars to trucks with seven axles. Displayed in Table 9 are the 2016 traffic volumes by facility. Passenger cars totaled 284.9 million crossings and represented 93 percent of the total toll-paying vehicles (which has remained relatively constant over time). Of the TBTA facilities, the Verrazano-Narrows Bridge registered the highest traffic volume of 69.8 million vehicles. The lowest toll-paying volume, 7.9 million vehicles, was recorded at the Marine Parkway Bridge.
HISTORY AND PROJECTION OF TRAFFIC, TOLL REVENUES AND EXPENSES AND REVIEW OF PHYSICAL CONDITIONS OF THE FACILITIES OF TRIBOROUGH BRIDGE AND TUNNEL AUTHORITY
26
Table 9 Traffic by Facility and Vehicle Class, 2016 (000s)(a,b)
Source: TBTA Notes: (a) Totals may not add due to rounding. (b) Based on preliminary actual data, subject to final audit. (c) Westbound traffic doubled, since traffic is not registered in the eastbound direction. (d) Truck passage prohibited except with NYCDOT permit. (e) Includes police, fire, and other emergency vehicles and TBTA vehicles.
Monthly Traffic, 2016
Monthly variations in traffic volumes on the nine crossings have been attributed to several factors historically, including severe weather, either winter or tropical storms, which result in lower volumes; and, conversely, traffic reaching its highest levels during the summer months when recreational travel peaks. Traffic volumes also typically decline or growth slows in the aftermath of a toll increase. Furthermore, individual facilities can be affected by construction projects on the facility itself or its approaches, and on adjacent arterials or competing bridges. The limited number of crossings in the region, however, sustains the overall demand for TBTA’s bridges and tunnels. In addition to these normal impacts, there are extraordinary events such as the effects of September 11th and Superstorm Sandy.
HISTORY AND PROJECTION OF TRAFFIC, TOLL REVENUES AND EXPENSES AND REVIEW OF PHYSICAL CONDITIONS OF THE FACILITIES OF TRIBOROUGH BRIDGE AND TUNNEL AUTHORITY
27
The data in Table 10 indicate that total traffic on the nine crossings in 2016 peaked in June. August was the second highest month in 2016. For the combined facilities, the monthly variations in 2016 ranged from 15 percent and 8 percent below the annual average in both January and February, respectively to 8 percent and 6 percent above in both June and August, respectively. This traffic mix is relatively stable comprising a solid base of commuting, discretionary and commercial traffic.
AADT(d) 118,155 125,182 171,915 73,291 49,075 190,591 67,268 21,591 22,676 839,742 1.00 Notes: (a) Totals may not add due to rounding. (b) Westbound traffic doubled. (c) For total traffic on the nine crossings. (d) Annual Average Daily Traffic.
HISTORY AND PROJECTION OF TRAFFIC, TOLL REVENUES AND EXPENSES AND REVIEW OF PHYSICAL CONDITIONS OF THE FACILITIES OF TRIBOROUGH BRIDGE AND TUNNEL AUTHORITY
28
Changes in Monthly Traffic, 2015 to 2016
Table 11 lists the monthly average daily traffic changes that have occurred between 2015 and 2016.
Table 11 Changes in Monthly Average Daily Traffic, 2015 to 2016
Month
Percent Change Comparing 2015 Monthly Average Daily Traffic to 2016
Major reasons for monthly traffic changes include:
• Generally overall favorable weather conditions throughout the year; • Continued modest economic recovery, including continued regional jobs growth; • Sustained lower gasoline prices throughout 2016; and • Construction activities at and approaching the Queens Midtown Tunnel and Hugh L. Carey
Tunnel.
It is also worth noting that the recent availability and usage levels of services such as Uber and Lyft may have had impacts on traffic and may have contributed to the increase in vehicular travel.
Operating Expenses, 2006 to 2016
Table 12 displays the historical operating expenses for the TBTA facilities from 2006 through 2016. TBTA divides operating expenses into two major categories: labor and non-labor. Labor includes salaries, overtime and fringe benefits, net of capital reimbursements. Major maintenance, some bridge painting, outside services, insurance, TBTA’s share of the E-ZPass Customer Service Center, and other non-personnel expenses are included in non-labor.
TBTA labor expenses increased from $183.3 million in 2006 to $243.4 million in 2016. Over half of the $60.1 million increase ($30.2 million) was due to higher actuarial assessments of pension
HISTORY AND PROJECTION OF TRAFFIC, TOLL REVENUES AND EXPENSES AND REVIEW OF PHYSICAL CONDITIONS OF THE FACILITIES OF TRIBOROUGH BRIDGE AND TUNNEL AUTHORITY
29
commitments. Another $20.3 million was the result of increases in costs for fringe benefits including health and welfare benefits for current employees and retirees, workers' compensation, and others. While regular payroll increased by $10.9 million primarily due to wage inflation and negotiated union contract obligations, actual year-end headcount declined from 1,783 in 2006 to 1,451 in 2016, reflecting numerous managerial initiatives aimed at achieving operational efficiencies, several MTA-wide workforce consolidation efforts, and the evolution of moving toward cashless tolling. In real, inflation-adjusted terms, actual regular payroll costs declined by 7.6 percent. In addition, persistent efforts to reduce overtime expenses through tighter managerial controls and scheduling efficiencies resulted in a 3.1 percent decline in nominal costs and an 18.6 percent decline in real costs over the ten-year period.
Table 12 Historical Operating Expenses, 2006 to 2016
(a) Totals may not add due to rounding. (b) Includes salaries, overtime and fringe benefits, net of capital
reimbursements. (c) Non-labor includes the following categories: major maintenance
and supplies, bridge painting, outside services, insurance, power, leases and rentals and other expenses.
Non-labor expenses increased from $169.6 million in 2006 to $217.4 million in 2016. The enormous growth of E-ZPass usage over this period accounts for $28.1 million, or 59 percent of the total $47.8 million increase. In 2006, E-ZPass market share averaged 72.6 percent; in 2016, average usage was 85.9 percent. There were 1.6 million active TBTA E-ZPass accounts and 3.4 million active tags at year-end 2006; at year-end 2016, there were 3.1 million active accounts and 4.9 million active tags. Over this ten-year period, TBTA has been successful in negotiating lower unit costs for E-ZPass tags and has achieved contracted efficiency savings associated with running the E-ZPass Customer Service Center. The large growth in usage has nevertheless pushed up the total costs in these and other areas, including credit/debit card fee expenses (which have also been impacted by higher E-ZPass tolls) and E-ZPass equipment maintenance. Aside from E-ZPass expenses, the only other major expense items that have grown significantly above inflation over
HISTORY AND PROJECTION OF TRAFFIC, TOLL REVENUES AND EXPENSES AND REVIEW OF PHYSICAL CONDITIONS OF THE FACILITIES OF TRIBOROUGH BRIDGE AND TUNNEL AUTHORITY
30
the ten-year period are insurance ($7.7 million, or 16 percent of total expense growth) and bond issuance costs ($7.3 million, or 15 percent of total growth).
The following is a brief discussion of the major year-to-year shifts in operating expenses.
Total operating expenses grew 4.6 percent in 2007, with labor expenses growing by 7.4 percent and non-labor expenses growing by 1.5 percent. The growth in labor costs was primarily due to wage inflation, contractual step-up increases, and higher pension obligation valuations. Non-labor expense growth was largely inflationary. In 2008, total expense growth was 10.6%. Labor costs grew by 5.4 percent for the same reasons as in 2007. Non-labor expenses grew by 10.6 percent. Of the total $39.0 million dollar increase, $22.8 million was for additional major maintenance and bridge painting work. Other areas which grew above normal inflation were E-ZPass-related costs, bond issuance fees and insurance.
The operating expenses for 2009 saw a net decrease in expenditures from 2008 of 2.5 percent. Labor expenses increased by 6.3 percent primarily due to wage inflation, contractual step-up increases and upward pension assessments. The rise in labor costs was offset by an 11.6 percent drop in non-labor expenses, which was primarily due to a return to more typical major maintenance project funding following the additional needs in 2008. Total operating expenses in 2010 declined another 3.6 percent. TBTA undertook a major organizational assessment in 2010 which included staff reductions and the elimination of redundant or unnecessary organizational levels. These actions resulted in a 5.0 percent decline in labor expenses. Non-labor expenditures declined 1.9 percent primarily due to the capitalization of much of the bridge painting program. In 2011, total operating expenses decreased for the third year in a row. Expenses in 2011 decreased 6.4 percent from 2010, with the majority of the decrease attributed to reductions in non-labor expenses.
Total operating expenses for 2012 increased $19.2 million, or 5.3 percent from 2011 primarily due to the emergency response and facility restoration efforts associated with Superstorm Sandy totaling $11.7 million. In addition, pension costs were greater by $8.5 million due to a revised valuation by the New York City Office of the Actuary that included a drop in the assumed rate of investment return, from 8% to 7%, retroactive to July 2011.
Total operating expenses for 2013 increased $31.5 million, or 8.3 percent above 2012 primarily due to: $12.6 million in additional bond issuance costs associated with the implementation of Government Accounting Standards Bureau (GASB) 65, which requires that certain expenses that were previously allowed to be amortized over the life of the bonds must now be realized in full when incurred; $5.2 million in Superstorm Sandy restoration costs; $4.4 million in higher insurance premiums; additional credit/debit card fees of $2.7 million due to the March increase in E-ZPass tolls; and another $2.7 million in E-ZPass Customer Service Center costs stemming from account growth and the first full year of cashless tolling at the Henry Hudson Bridge.
Total operating expenses for 2014 increased $34.3 million, or 8.4 percent above 2013 primarily resulting from: $13.3 million in additional wage and associated fringe benefit costs primarily stemming from payments and provisions for actual and projected union contract settlements
HISTORY AND PROJECTION OF TRAFFIC, TOLL REVENUES AND EXPENSES AND REVIEW OF PHYSICAL CONDITIONS OF THE FACILITIES OF TRIBOROUGH BRIDGE AND TUNNEL AUTHORITY
31
retroactive to 2009; an actuarial adjustment of $3.8 million for Worker's Compensation; $9.5 million to fund additional major maintenance and bridge painting projects; and a total increase of $6.5 million in property and general liability insurance premiums.
In 2015, total operating expenses were $452.8 million, which was $9.0 million, or 2.0 percent above 2014 expenses. Labor expenses declined by $3.4 million, or 1.4 percent, primarily due to unfilled vacancies throughout the year and the transfer of 53 technology positions to the MTA as part of an agency-wide IT consolidation effort. Non-labor expenses grew by $12.4 million, or 6.1%, primarily due to additional major maintenance and bridge painting projects and higher credit card fees associated with the toll increase implemented on March 22, 2015.
In 2016, total operating expenses were $464.9 million, which was $12.1 million, or 2.7 percent above 2015 expenses. Labor expenses increased by $8.3 million, or 3.5 percent, primarily due to wage inflation and actuarial adjustments to pension expenses. Non-labor expenses grew by $3.8 million, or 1.7%, which was slightly above the national inflation rate of 1.3%. Growth exceeded inflation primarily due to additional major maintenance projects and higher bond issuance costs.
FACTORS AFFECTING TRAFFIC GROWTH
A previous section of this report identified the historical trends in traffic, revenue and expenses of the nine TBTA bridges and tunnels. Before developing the forecasts, several factors affecting future traffic were considered, including the projected trends in population and employment, TBTA and regional construction impacts, the capacity constraints in the regional highway network, and toll and elasticity impacts. This section of the report concludes with a summary of the assumptions and conditions upon which the traffic and toll revenue forecasts were based.
Employment, Population, and Motor Vehicle Registrations
In keeping with federal requirements mandating the preparation of long term demographic and socioeconomic forecasts for travel demand modeling purposes, the New York Metropolitan Transportation Council (NYMTC) prepares and periodically updates employment and population forecasts for the 10-county NYMTC territory and 21 surrounding counties in New York, New Jersey and Connecticut. The latest forecasts, which are included in the following tables and are updated from the prior report submission, range from 2010 to 2050 on a 5-year interval basis. They are consistent with historical trends from 1970 to 2016.
The NYMTC forecasting approach begins with econometric modeling of the regional growth in employment relative to national trends and forecasts prepared by IHS Global Insight, calibrated at the county level on an industry-specific basis (IHS Global Insight is a major vendor of economic and financial analysis, forecasts, and market intelligence worldwide and provides the New York State Department of Transportation (NYSDOT) with socioeconomic projections for the state and upstate regions). Employment then drives population growth which is forecasted at the sub-regional level by a model that includes fertility, mortality, net migration of labor force, aged workers, dependents, and foreign migrants.
HISTORY AND PROJECTION OF TRAFFIC, TOLL REVENUES AND EXPENSES AND REVIEW OF PHYSICAL CONDITIONS OF THE FACILITIES OF TRIBOROUGH BRIDGE AND TUNNEL AUTHORITY
32
Typically, traffic volumes in the region are affected by changes in employment and population. Normally, the demand on TBTA facilities tends to be influenced less by regional employment and population trends than other toll facilities because available water crossings are limited. Motor vehicle registrations are another indicator of trends in traffic volumes. To better understand how these indicators may influence traffic volumes on TBTA crossings over the long term, Stantec first reviewed historical trends and forecasts by NYMTC and others, and then adjusted traffic forecasts in the short term to account for current economic conditions.
Employment Trends and Projections
Job growth traditionally has had an impact on traffic generation. Generally, when the economy is robust and jobs are growing, there is an increase in traffic. Conversely, when employment trends downward traffic volumes generally decline. However, the rate of decline depends upon the severity of employment losses. Table 13 depicts the long term trend in total employment in the region since 1970. The region is defined as consisting of 31 counties that comprised the commuter-shed: the five boroughs of the City; 9 suburban counties of New York State in Long Island and the Mid-Hudson; 14 counties of northern and central New Jersey; and 3 counties of Connecticut.
HISTORY AND PROJECTION OF TRAFFIC, TOLL REVENUES AND EXPENSES AND REVIEW OF PHYSICAL CONDITIONS OF THE FACILITIES OF TRIBOROUGH BRIDGE AND TUNNEL AUTHORITY
1970 to 1980 -1.2% 2.1% 1.5% 1.8% 0.5% 1980 to 1990 0.9% 2.0% 1.9% 1.4% 1.5% 1990 to 2000 0.8% 0.9% 0.9% 0.8% 0.9% 2000 to 2005 0.5% 1.2% 1.1% 0.5% 0.8% 2005 to 2010 1.5% 0.5% 0.0% 0.2% 0.7% 2010 to 2011 4.5% 2.5% 1.5% 2.0% 2.9% 2011 to 2012 2.0% 0.8% 0.8% 0.9% 1.2% 2012 to 2013 2.6% 1.5% 1.7% 1.5% 2.0% 2013 to 2014 3.5% 1.2% 1.7% 0.9% 2.2% 2014 to 2015 3.1% 1.8% 2.1% 1.3% 2.4% 2015 to 2016 2.5% 0.8% 2.0% 1.1% 1.9%
Source: New York Metropolitan Transportation Council, New York State Department of Labor, Connecticut Department of Labor, New Jersey Department of Labor and Workforce Development, United States Bureau of Labor Statistics (BLS), and United States Bureau of Economic Analysis.
Notes: (a) Historic employment estimates are modeled using data inputs from the BLS Current Employment Statistics Program (CES)
Quarterly Census of Employment and Wages (QCEW) program as well as the Bureau of Economic Analysis’ Table 25N Proprietors statistics. Final revisions to statewide and local area CES data, called a "Benchmark," are made each March for the previous five years based on payroll tax reports submitted by employers covered by the Unemployment Insurance program to individual states. On February 3 2017, the BLS released its 2016 re-benchmarked CES data with revisions to employment of specific industries going back as far as 1990.
(b) Consists of the following counties: Dutchess, Nassau, Orange, Putnam, Rockland, Suffolk, Sullivan, Ulster and Westchester. (c) Consists of the following counties: The 13 counties of the North Jersey Transportation Planning Authority (Bergen, Essex,
Hudson, Hunterdon, Middlesex, Monmouth, Morris, Ocean, Passaic, Somerset, Sussex, Union, Warren) plus Mercer County of the Delaware Valley Regional Planning Commission.
(d) Consists of the following counties: Fairfield, Litchfield, and New Haven. (e) Totals may not add due to rounding. (f) In 2015, the City of New York changed its methodology of reporting local government workers to more accurately reflect
the geographic distribution of the workforce.
As Table 13 shows, the City’s employment decreased from a peak of 4.1 million jobs in 1970 to 3.6 million in 1980. Since 1980, the City has shown consistent employment growth in each decade, having returned to 1970 levels in the 1990s and reached 5.7 million jobs in 2016, despite the downturn which occurred in the severe 2007-2009 recession. The Long Island and Mid-Hudson suburbs have reflected continuous growth in the decades since 1970, expanding from 1.6 million
HISTORY AND PROJECTION OF TRAFFIC, TOLL REVENUES AND EXPENSES AND REVIEW OF PHYSICAL CONDITIONS OF THE FACILITIES OF TRIBOROUGH BRIDGE AND TUNNEL AUTHORITY
34
jobs in 1970 to 3.0 million in 2016. Similar rates of suburban growth occurred in New Jersey and Connecticut between 1970 and 2010 and all three suburban regions saw annual growth rates from 2010 to the present that outpace historic annual growth from 1970 to 2010. Between 1970 and 2016, New Jersey added 1.9 million jobs while Connecticut gained 480,000 jobs. Among the four sub-regions, the City accounted for the largest employment base with 40 percent of 14.3 million regional jobs, followed by New Jersey with 31 percent, the New York suburbs with 21 percent and Connecticut with 8 percent.
NYMTC prepared a series of 40-year employment forecasts, released in final form in March 2015. Forecasted trends are compressed to 5-year intervals which masks cyclical trends between these years, a common practice in long term econometric forecasting. NYMTC projected regional employment growth would increase at an average annual rate of 0.5 percent between 2010 and 2050. However, regional employment levels increased at an average annual growth rate of 2.1 percent between 2010 and 2016, more than four times greater than the average annual growth rate NYMTC forecasted between 2010 and 2050 in 2016, suggesting that NYMTC forecasts understate the near term expansion over the remaining decade. NYMTC’s employment projections from its 2015 40-year employment forecast are presented in Table 14.
Table 14 Employment Projections (000s)
Year New York City
New York Region (a)
New Jersey Region (b)
Connecticut Region (c)
NYC and All Regions
Average Annual Percent Change
2010 to 2015 3.1% 1.5% 1.6% 1.3% 2.1% 2015 to 2020 0.5% 0.6% 0.8% 0.7% 0.6% 2020 to 2025 0.2% 0.4% 0.3% 0.3% 0.3% 2025 to 2030 0.2% 0.4% 0.3% 0.4% 0.3% 2030 to 2035 0.2% 0.4% 0.5% 0.4% 0.4% 2035 to 2040 0.2% 0.4% 0.5% 0.5% 0.4% 2040 to 2045 0.2% 0.4% 0.4% 0.5% 0.3% 2045 to 2050 0.2% 0.4% 0.4% 0.5% 0.4%
2010 to 2050 0.4% 0.5% 0.5% 0.5% 0.5% Source: New York Metropolitan Transportation Council, New York State Department of Labor, Connecticut Department of Labor, New
Jersey Department of Labor and Workforce Development, and United States Bureau of Economic Analysis. Notes: (a) Consists of the following counties: Dutchess, Nassau, Orange, Putnam, Rockland, Suffolk, Sullivan, Ulster and Westchester. (b) Consists of the following counties: The 13 counties of the North Jersey Transportation Planning Authority (Bergen, Essex, Hudson,
Hunterdon, Middlesex, Monmouth, Morris, Ocean, Passaic, Somerset, Sussex, Union, Warren) plus Mercer County of the Delaware Valley Regional Planning Commission.
(c) Consists of the following counties: Fairfield, Litchfield, and New Haven.
Based on national forecasts to 2024 and regional forecasts to 2050, taking into account the modest recovery since the 2007-2009 recession, the existing regional outlook suggests that jobs will expand by 0.5 percent annually over the period, nearly half the annual average growth rate of 0.9 percent between 1970 and 2010. Employment in the City is expected to expand at a rate slightly less than the suburban regions of New Jersey, Connecticut and New York. No sub-regions
HISTORY AND PROJECTION OF TRAFFIC, TOLL REVENUES AND EXPENSES AND REVIEW OF PHYSICAL CONDITIONS OF THE FACILITIES OF TRIBOROUGH BRIDGE AND TUNNEL AUTHORITY
35
are projected to experience a period of interim decline in employment, as each tends to grow with cyclical contractions between 0.2 and 0.8 percent annually on average over the period.
The economic recovery in the region and the nation appeared to be largely complete in 2016, with unemployment levels slightly above 2007 pre-recession levels. The New York State Department of Labor reported that the City’s annual average jobless rate had dropped to 5.3 percent in 2016, just above the 5.0 unemployment rate reported in 2006 and 20073. On average, 223,200 residents were unemployed in a labor force of 4.2 million, while more than 377,000 had gained employment between 2010 and 2016. The City’s rate of unemployment is equal to the Connecticut counties of Fairfield, Litchfield and New Haven but considerably more than that of the New York and New Jersey suburbs which averaged 4.1 percent and 4.7 percent unemployed respectively, in 2016. Labor force conditions are summarized in Table 15.
Table 15 Labor Force Conditions, 2010 & 2016
New York City
New York Region(a)
New Jersey Region(b)
Connecticut Region(c)
Labor Force(d)
2010 3,950,400 2,430,000 3,606,400 1,045,100
2016 4,173,700 2,438,000 3,644,300 1,045,000
Employed(d)
2010 3,573,600 2,248,200 3,276,000 949,700
2016 3,950,600 2,337,900 3,473,700 989,800
Unemployed(d)
2010 376,900 181,900 330,500 95,400
2016 223,200 100,100 170,600 55,100
Unemployment Rate
2010 9.5% 7.5% 9.2% 9.1%
2016 5.3% 4.1% 4.7% 5.3% Source: State Departments of Labor and BLS. Notes: (a) Consists of the following counties: Dutchess, Nassau, Orange, Putnam,
Rockland, Suffolk, Sullivan, Ulster and Westchester. (b) Consists of the following counties: The 13 counties of the North Jersey
Transportation Planning Authority (Bergen, Essex, Hudson, Hunterdon, Middlesex, Monmouth, Morris, Ocean, Passaic, Somerset, Sussex, Union, Warren) plus Mercer County of the Delaware Valley Regional Planning Commission.
(c) Consists of the following counties: Fairfield, Litchfield, and New Haven. (d) Per BLS procedures, monthly labor force statistics are subject to annual
benchmark revisions in subsequent years. Revised (benchmarked) data for the preceding 3-5 years are subject to benchmark revision on an as-needed basis. On February 28 2017, the BLS released re-benchmarked data for the New York metropolitan region going back to April 2010.
3 As of December 2016, the City’s monthly unemployment rate had fallen to 4.4 percent.
HISTORY AND PROJECTION OF TRAFFIC, TOLL REVENUES AND EXPENSES AND REVIEW OF PHYSICAL CONDITIONS OF THE FACILITIES OF TRIBOROUGH BRIDGE AND TUNNEL AUTHORITY
36
Over the year 2016, the City gained 63,500 payroll jobs, with 58,300 jobs added in the private sector. Leading industries included Health Care and Social Assistance, which accounted for a gain of 20,600 jobs, Accommodation and Food Services with 10,400 more jobs, Administration Support and Waste Management with 6,900 added employment opportunities and Other Services (including Religious, Grant Making, Civic and Professional occupations), with 6,400 additional jobs. Lesser job gains occurred in the sectors of Wholesale Trade (+5,600 jobs), Government (+5,200 jobs), Educational Services (+4,900 jobs), Arts, Entertainment, and Recreation (+4,300 jobs), Construction (+3,100 jobs), and Transportation and Warehousing (+2,100 jobs). Less than a thousand jobs were created in Management of Companies (+900 jobs) and Real Estate Services (+500 jobs). Several sectors saw reduced employment including: Finance and Insurance (-4,200 jobs), Information (-2,200 jobs) and Manufacturing (-700 jobs).
In the housing market, building permits authorizing new housing construction decreased in the City to 16,269 units in 2016, an annual decrease of 40,259 units or 71.2 percent in 2016. The significant reduction was primarily due to a rush by multi-family housing developers in 2015 to secure 421-a property tax exemptions before the program’s expiration in January 2016. Compared with 2014, 2016 permits were down by 4,214 units or 20.6 percent. In other property markets, notably office, Jones Lang LaSalle reported that recent political and economic uncertainty were primarily responsible for Manhattan’s lowest level of office leasing activity since the financial crisis, with rising vacancy rates and muted gains in office rents, all signs that demand for Manhattan office market have waned over the last 12 months. At the top, Class A rental rates climbed to $78.43 per square foot from $76.76 in 2015. Among all classes, average rental rates climbed from $71.58 per square foot to $72.82 in 2016. Net absorption for the borough’s office market was up by 2.6 million square feet by year end 2016, a drop from a 4.5 million square foot gain in 2015. With 2.1 million square feet of new construction delivered to the market during the year, Manhattan’s inventory of office space expanded from 394.7 million square feet in 2015 to 396.9 million square feet in 2016, a net gain of 2.2 million square feet.
An additional 12.5 million square feet is under construction and anticipated to be completed in the next few years including: 390 Madison Avenue (862,000 square feet) in 2017; Three World Trade Center (2,861,000 square feet), 55 Hudson Yards (1,556,000 square feet), and 425 Park Avenue (670,000 square feet) in 2018; 30 Hudson Yards (2,600,000 square feet) and One Manhattan West (2,216,000 square feet) in 2019; and One Vanderbilt (1,750,000 square feet) in 2020. This is expected to increase the borough’s vacancy rate further, as office employment is expanding more slowly than available space and firms are consolidating their use of office space.
HISTORY AND PROJECTION OF TRAFFIC, TOLL REVENUES AND EXPENSES AND REVIEW OF PHYSICAL CONDITIONS OF THE FACILITIES OF TRIBOROUGH BRIDGE AND TUNNEL AUTHORITY
37
Table 16 Housing Building Permits Issued within the City, 2014 - 2016
Borough 2014 2015 2016 14-15 15-16
Bronx 1,885 4,682 4,003 148.4% -14.5%
Brooklyn 7,551 26,026 4,503 244.7% -82.7%
Manhattan 5,435 12,612 4,024 132.1% -68.1%
Queens 4,900 12,667 2,838 158.5% -77.6%
Staten Island 712 541 901 -24.0% 66.5%
Total 20,483 56,528 16,269 176.0% -71.2% Source: US Census Bureau, Building Permit Survey.
Population Trends and Projections
Since 1980, US Census data indicate that the City’s population has increased by 1.5 million persons to 8.6 million residents in 2015. Although the Census Bureau’s 2010 population count was disputed by the City as under-counted by several hundred thousand, the City has nonetheless continued to be a desirable place of residence for many young professionals, foreign immigrants and international investors who maintain multiple residences, as well as the City’s long-standing residents that have aged in place. Four of the City’s boroughs, Manhattan, Brooklyn, Queens, and Staten Island are now more populous than in 1970, a City high point, while the Bronx remains only marginally less populated than in earlier years.
While the City’s population has recorded historical periods of contraction, as shown in Table 17, the commuter suburbs of New York, New Jersey and Connecticut have grown continuously over the past 45 years. Compared to 8.6 million residents in the City, northern and central New Jersey now houses 7.1 million residents while the 9 counties of Long Island and the Mid-Hudson are home to 5.2 million residents. Over the period from 1980 to 2015 in which the City added 1.5 million more inhabitants, New Jersey saw an increase of 1.3 million residents and the New York suburbs added 655,700. Connecticut, with 2 million residents, has added 265,900 residents since 1980. This represents the latest data available. According to NYMTC the next scheduled update is planned for 2019, but this may change due to future short-term economic and demographic trends.
NYMTC’s 40-year projections of regional population are presented in Table 18. Between 2010 and 2050, NYMTC projects a 0.4 percent annual rate of growth between 2010 and 2050, compared to a 0.3 percent increase since 1970. Of this gain, the City is expected to account for an estimated 25 percent of the regional growth. The New Jersey suburbs are expected to have 37 percent of the increase, while Long Island and the Mid-Hudson are expected to account for 28 percent of the total. Connecticut, by contrast, will likely account for 10 percent of the regional growth.
HISTORY AND PROJECTION OF TRAFFIC, TOLL REVENUES AND EXPENSES AND REVIEW OF PHYSICAL CONDITIONS OF THE FACILITIES OF TRIBOROUGH BRIDGE AND TUNNEL AUTHORITY
38
Table 17 Population Trends (000s)
Year New York City
New York Region (a)
New Jersey Region (b)
Connecticut Region (c)
NYC and All Regions
1970 7,894.9 4,371.5 5,799.7 1,681.9 19,748.0
1980 7,071.6 4,537.1 5,856.8 1,725.2 19,190.8
1990 7,322.6 4,635.2 6,079.5 1,806.0 19,843.2
2000 8,008.3 4,933.1 6,661.8 1,888.8 21,491.9
2005 8,013.4 5,059.8 6,830.6 1,933.7 21,837.5
2010 8,175.1 5,123.7 6,946.4 1,969.2 22,214.5
2011 8,244.9 5,146.5 6,975.3 1,975.8 22,342.5
2012 8,336.7 5,158.0 7,014.8 1,984.2 22,493.7
2013 8,405.8 5,171.4 7,051.1 1,989.1 22,617.5
2014 8,491.1 5,186.6 7,093.8 1,991.7 22,763.2
2015 8,550.4 5,192.8 7,116.4 1,991.1 22,850.8
Average Annual Percent Change
1970 to 1980 -1.1% 0.4% 0.1% 0.3% -0.3%
1980 to 1990 0.3% 0.2% 0.4% 0.5% 0.3%
1990 to 2000 0.9% 0.6% 0.9% 0.4% 0.8%
2000 to 2005 0.0% 0.5% 0.5% 0.5% 0.3%
2005 to 2010 0.4% 0.3% 0.3% 0.4% 0.3%
2010 to 2011 0.9% 0.4% 0.4% 0.3% 0.6%
2011 to 2012 1.1% 0.2% 0.6% 0.4% 0.7%
2012 to 2013 0.8% 0.3% 0.5% 0.2% 0.6%
2013 to 2014 1.0% 0.3% 0.6% 0.1% 0.6%
2014 to 2015 0.7% 0.1% 0.3% 0.0% 0.4%
Source: US Census Bureau and New York Metropolitan Transportation Council. Notes: (a) Consists of the following counties: Dutchess, Nassau, Orange, Putnam, Rockland, Suffolk, Sullivan, Ulster
and Westchester. (b) Consists of the following counties: The 13 counties of the North Jersey Transportation Planning Authority
(Bergen, Essex, Hudson, Hunterdon, Middlesex, Monmouth, Morris, Ocean, Passaic, Somerset, Sussex, Union, Warren) plus Mercer County of the Delaware Valley Regional Planning Commission.
(c) Consists of the following counties: Fairfield, Litchfield, and New Haven.
Population growth will positively affect traffic demand on crossings, although employment trends appear to have had a more noticeable effect on traffic volumes on TBTA facilities. However, TBTA traffic variations do not always correlate year by year with regional demographic trends. As evident, demand for TBTA facilities has been strong overall and NYMTC’s long term regional population projections indicate a trend for such demand to increase over the projected period. With regard to employment, there may be some years that will show declines, but that is projected to be offset by other years that will be characterized by growth. In general, an upward trend is expected over the long term through the end of NYMTC’s current forecast period in 2050.
HISTORY AND PROJECTION OF TRAFFIC, TOLL REVENUES AND EXPENSES AND REVIEW OF PHYSICAL CONDITIONS OF THE FACILITIES OF TRIBOROUGH BRIDGE AND TUNNEL AUTHORITY
39
Table 18 Population Projections (000s)(a)
Year New York City
New York Region (b)
New Jersey Region (c)
Connecticut Region (d)
NYC and All Regions
Average Annual Percent Change
2010 to 2015 0.5% 0.3% 0.4% 0.4% 0.4%
2015 to 2020 0.4% 0.2% 0.3% 0.3% 0.3%
2020 to 2025 0.3% 0.4% 0.4% 0.4% 0.4%
2025 to 2030 0.3% 0.7% 0.5% 0.6% 0.5%
2030 to 2035 0.2% 0.7% 0.6% 0.6% 0.5%
2035 to 2040 0.2% 0.6% 0.5% 0.5% 0.4%
2040 to 2045 0.2% 0.6% 0.5% 0.5% 0.4%
2045 to 2050 0.1% 0.6% 0.5% 0.5% 0.4%
2010 to 2050 0.3% 0.5% 0.5% 0.5% 0.4% Source: New York Metropolitan Transportation Council, New York State Department of Labor, Connecticut Department of Labor, New Jersey Department of Labor and Workforce Development, and United States Bureau of Economic Analysis. Notes: (a) Forecast is the most recent available, unchanged from the previous year. (b) Consists of the following counties: Dutchess, Nassau, Orange, Putnam, Rockland, Suffolk, Sullivan,
Ulster and Westchester. (c) Consists of the following counties: The 13 counties of the North Jersey Transportation Planning
Authority (Bergen, Essex, Hudson, Hunterdon, Middlesex, Monmouth, Morris, Ocean, Passaic, Somerset, Sussex, Union, Warren) plus Mercer County of the Delaware Valley Regional Planning Commission.
(d) Consists of the following counties: Fairfield, Litchfield, and New Haven.
Motor Vehicle Registrations
The trend in motor vehicle registrations in an area is a predictor of growth or stability in levels of vehicular traffic. As Table 19 shows, over the 2006 to 2016 period, motor vehicle registrations in the region peaked in 2007 and dropped sharply following the financial crisis. In New York State and Connecticut, registrations since 2012 have recovered somewhat while registrations in New Jersey peaked in that year and have since declined by nearly 25 percent. Registrations in New York City have increased steadily since 2006 with no major decline in recent years. As of April 28, 2017, 2016 motor vehicle registration data for New Jersey and Connecticut have not been released.
Although motor vehicle registrations are not projected for future years, there has been a recent increase in auto sales nationally following the 2007-2009 recession with a record number of annual sales in both 2015 and 2016. Over the long term, with continued modest economic recovery and the restoration of consumer confidence in spending, the growth in registrations will likely keep pace with population and employment growth.
HISTORY AND PROJECTION OF TRAFFIC, TOLL REVENUES AND EXPENSES AND REVIEW OF PHYSICAL CONDITIONS OF THE FACILITIES OF TRIBOROUGH BRIDGE AND TUNNEL AUTHORITY
40
Table 19 Motor Vehicle Registrations (000s)(a)
Year New York City
New York State(b) New Jersey Connecticut
2006 1,833 11,487 6,122 3,117
2007 1,926 11,811 6,411 3,112
2008 1,945 11,429 6,411 3,160
2009 1,952 11,591 6,272 3,137
2010 1,962 10,603 6,956 3,148
2011 1,961 10,431 7,940 2,829
2012 1,978 10,449 7,911 2,706
2013 2,016 10,674 7,061 2,856
2014 2,057 10,904 6,874 2,866
2015 2,107 10,639 5,939 2,842
2016 2,152 10,401 N/A N/A
Average Annual Growth
2005-2015 1.27% -1.24% -0.78% -0.94%
2006-2016 1.62% -0.99% N/A N/A
Source: United States Federal Highway Administration. Notes: (a) This represents the most recent available data for New Jersey and Connecticut and
differs in reporting source from the prior year’s report, which was based solely upon state data.
(b) Including New York City.
Annual year-end motor vehicle registrations for the five year period 2011 through 2016 are shown for each of the City’s five boroughs in Table 20. Throughout the City, changes in registrations were minimal from 2011 to 2012(+0.9%). In the following years, annual citywide growth in registrations more than doubled as disposable income increased following the 2007 financial crisis, reaching 2.4 percent from 2014 to 2015, later falling to 2.1 percent from 2015 to 2016. Over the last five years, Queens saw the largest gain in new registrations (+78,045), followed by Brooklyn (+61,867), the Bronx (+36,496), Manhattan (+11,069), and Staten Island (+3,212). From 2015 to 2016, Staten Island was the only borough to experience a decline in registrations (-2.3%) while the Bronx, Queens, and Brooklyn all experienced higher annual growth rates than the City as a whole. Manhattan’s annual growth at 0.9 percent was comparatively low, however, the four outer boroughs are the most significant contributors to trips on the TBTA facilities. It is also worth noting that the recent availability and usage levels of services such as Uber and Lyft may have had impacts on traffic and may have contributed to the increase in vehicular travel.
HISTORY AND PROJECTION OF TRAFFIC, TOLL REVENUES AND EXPENSES AND REVIEW OF PHYSICAL CONDITIONS OF THE FACILITIES OF TRIBOROUGH BRIDGE AND TUNNEL AUTHORITY
41
Table 20 New York City Motor Vehicle Registrations, 2011 to 2016
Staten Island 264,727 265,122 268,492 269,219 274,275 267,939 -2.3% 0.2%
Total 1,961,328 1,978,392 2,016,158 2,057,433 2,107,321 2,152,017 2.1% 1.9%
Source: New York State Department of Motor Vehicles
Fuel Conditions
Traffic and revenue on the TBTA crossings have been affected in varying degrees by the availability and price of gasoline since 1970, with the most recent effects seen following the high prices throughout 2011. The effects on TBTA traffic resulting from fuel shortages and increases in gasoline prices in 1973-1974 and in 1979, during the first war in the Persian Gulf in the early 1990s, during the war in Iraq and after Hurricane Katrina can be seen in Figure 2A/2B. In some instances, such as 2011, economic conditions and toll increases also contributed to the reduction of traffic volumes. After Superstorm Sandy in 2012, odd-even gasoline rationing was implemented in the City from November 9th until November 24th whereby motorists could purchase gasoline on alternate days based on the last digit of their license plate. The effects were seen as part of the decrease in traffic after the storm.
In July 2008, the average price of regular grade gasoline was the highest recorded – $4.114 per gallon in the U.S. and $4.179 in the City. Prices then dropped in the second half of 2008, remaining steady through 2009 and increasing through 2010. The next peak, in May, 2011, saw prices at $3.965 per gallon in the U.S. and $4.069 in the City. As of March 20, 2017, the U.S. Energy Information Administration (EIA) stated that the price of regular grade gasoline averaged $2.495 per gallon nationally, and $2.329 in the City.
Sharp increases in the price of gasoline in 2008 and 2011 resulted in decreases in vehicle miles of travel in the United States and in the New York metropolitan area. Data from the United States Federal Highway Administration indicates that Vehicle Miles of Travel (VMT) decreased between 2007 and 2008 by 2.5 percent nationally and by 4.1 percent in New York State. In 2011, largely in response to the recession, national VMT was 1.4 percent below the 2007 level and New York State VMT was 4.1 percent below 2007. New York State VMT decreased by 0.6 percent from 2012 to 2013, in part due to the availability of significant and reliable public transportation in the New York City area. In 2015, national travel demand increased 3.5 percent and travel demand within New York State increased 2.2 percent. National and statewide travel demand continued to increase
HISTORY AND PROJECTION OF TRAFFIC, TOLL REVENUES AND EXPENSES AND REVIEW OF PHYSICAL CONDITIONS OF THE FACILITIES OF TRIBOROUGH BRIDGE AND TUNNEL AUTHORITY
42
in 2016 (2.7 percent and 2.8 percent respectively), reflecting the continued modest improvement in the economy.
Factors contributing to changes in the price and availability of gasoline are both upward and downward and each has an unknown element that contributes to uncertainty. These factors include:
• Dependence on imported crude oil – United States dependence on imported fuel has continued to decrease as the country continues to increase its reliance on domestic resources. As of March 20, 2017, weekly domestic crude oil production levels surpassed 9.1 million barrels (4.9 percent below the historic weekly high experienced in June 2015). In February 2017, the EIA reported that weekly domestic crude oil production is projected to continue to increase over the upcoming year;
• Use of substitute fuels – The use of biofuels has decreased in the United States primarily due to a large reduction of imported biofuels from Argentina which expanded its trade with the United States in late 2013 due to tariffs imposed by the European Union. In July 2016 the EIA projected that biofuels would experience slow rates of growth in the upcoming year. Fluctuations in biofuel imports have an impact on the need for gasoline;
• Increase in demand – Domestic economic recovery is expected to be the slowest growth of any recovery since 1960 and, while the total energy consumption is estimated to increase over the next 25 years, per capita consumption is expected to decrease, according to EIA. The slowing of domestic demand should result in lower prices; however, this may be offset by increased demand overseas as world economic conditions improve;
• Political conditions – Ongoing political developments in oil producing countries and elsewhere produce tension and uncertainty; however, these factors are partially reflected in current oil prices; and
• Motor vehicle fuel efficiency – The preliminary adjusted composite model year 2016 fuel economy of 25.6 miles per gallon (mpg) was the highest level of fuel efficiency since the United States Environmental Protection Agency (EPA) began its analysis of light-duty automotive vehicles in 1975. In April 2010, both the National Highway Traffic Safety Administration and the EPA raised the fleet-wide Corporate Average Fuel Economy (CAFE) requirements to 35.1 mpg for 2017. On March 16, 2017, President Trump ordered a review of the 2010 fuel economy standards, which may result in relaxation of these fuel economy standards.
The EIA, in the March 2017 Short-Term Energy Outlook, indicates that they expect the national price of regular grade gasoline to average $2.40 per gallon in 2017 and $2.44 per gallon in 2018, compared with $2.15 per gallon in 2016. Increased consumption associated with increased manufacturing, industrial, and freight transportation activity is expected to result in an increase in gasoline prices.
Depicted below are Figure 3A and Figure 3B, which illustrate the relationship between gas prices and travel. As shown with both New York State VMT and TBTA Total Transactions, a reduction in the price of gas generally correlates to a rise in travel. However, Figure 3B shows that the rise in monthly transactions began prior to the drop in gas price, indicating that although gas prices can affect travel, the increase in transactions cannot entirely be attributed to gas prices.
HISTORY AND PROJECTION OF TRAFFIC, TOLL REVENUES AND EXPENSES AND REVIEW OF PHYSICAL CONDITIONS OF THE FACILITIES OF TRIBOROUGH BRIDGE AND TUNNEL AUTHORITY
43
Figure 3A/3B New York City Gas Prices Compared to New York State VMT and TBTA Bridges and Tunnels Total Transactions
$1.50
$2.00
$2.50
$3.00
$3.50
$4.00
$4.50
10,000
10,250
10,500
10,750
11,000
11,250
11,500
11,750
12,000
12,250
12,500
12,750
2003
2004
2005
2006
2007
2008
2009
2010
2011
2012
2013
2014
2015
2016
Gas Price per G
allonNYS
VM
T (in
Mill
ions
)
Recession Rolling Avg NYS VMT NYC Gas Price Rolling Avg
$1.00
$1.50
$2.00
$2.50
$3.00
$3.50
$4.00
23,000
23,500
24,000
24,500
25,000
25,500
26,000
2009
2010
2011
2012
2013
2014
2015
2016
Gas Price per G
allonTo
tal T
BTA
Tran
sact
ions
(in
Thou
sand
s)
TBTA Total Txns Rolling Avg NYC Gas Price Rolling Avg
HISTORY AND PROJECTION OF TRAFFIC, TOLL REVENUES AND EXPENSES AND REVIEW OF PHYSICAL CONDITIONS OF THE FACILITIES OF TRIBOROUGH BRIDGE AND TUNNEL AUTHORITY
44
Toll Increase Impacts, Collection Methods, and Elasticity
Tolls that are increased periodically affect traffic usage, especially if they outpace the rate of inflation, as they have on the TBTA facilities, as well as in those instances where competing facilities provide a good alternative. Elasticity, as used herein, is the relationship between traffic volume and the toll rate change, and represents the relative decrease in traffic corresponding to a given increase in toll. Elasticity is expressed as a negative value and the higher the absolute value, the more apt a facility is to lose traffic, which can be due to diversions to competing facilities, switches in travel modes, consolidation of trips and elimination of trips. Elasticity, in this sense, is used to analyze the relationship between tolls and use, i.e., when tolls are increased, motorists react and travel patterns may change.
Elasticity factors vary, demonstrating that users react differently to toll increases depending on influencing conditions. On the TBTA crossings, elasticity tends to be influenced by the proximity of the toll-free City bridges and other considerations. The low factors for the Throgs Neck and Bronx-Whitestone Bridges indicate their relative isolation from the nearest toll-free competitor, the Ed Koch Queensboro Bridge. On the East River at the RFK Bridge and at the Queens Midtown and Hugh L. Carey Tunnels elasticity increases as the degree of toll-free competition increases. The TBTA tunnels tend to lose traffic particularly when the competing crossings are operating under reasonable levels of traffic service and providing motorists with viable toll-free alternatives during non-peak periods. In addition, trip purpose influences demand, i.e., peak-period, work-related trips are less elastic than off-peak or discretionary trips that have fewer travel-time constraints. The effects of construction on main thoroughfares and feeder routes also affect driver choices of toll facilities.
Two sets of forecasts were developed for this report: one at constant tolls and the other with tolls at the current level in 2017 and 2018 and factoring in a toll increase in March 2019 as included in the MTA 2017-2020 Financial Plan adopted by the MTA Board in December 2016. Elasticity factors used for the forecasts in this report are based on factors developed by Stantec in analyzing the elasticity exhibited from the toll increase in March 2015.
Behaviors exhibited after the March 2015 toll increase were unlike most prior toll increases in that, with the exception of the Queens Midtown Tunnel, total transactions continued to increase. Since elasticities are predicated on a loss in traffic due to increased tolls, elasticity factors were developed by adjusting for normal traffic changes in the New York City metropolitan area in 2015, including effects of changes to fuel prices, economic conditions, and severe weather, among other factors. Our analysis of the 2015 toll increase found that cash/TBM motorists are more sensitive to toll rates when compared to E-ZPass users. Reasons for the relatively higher sensitivity may include less frequent usage of the facilities, more travel during off-peak periods, and generally fewer time constraints. The analysis indicated a significantly higher elasticity for cash/TBM transactions than for E-ZPass users. Our analysis also found that the TBM program at the Henry Hudson Bridge yielded about a 3 percentage point increase in E-ZPass participation, raising usage to well above 90 percent. Early data at the Queens Midtown and Hugh L. Carey tunnels, which shifted to ORT in January 2017 as discussed above, indicate that this same effect, about a
HISTORY AND PROJECTION OF TRAFFIC, TOLL REVENUES AND EXPENSES AND REVIEW OF PHYSICAL CONDITIONS OF THE FACILITIES OF TRIBOROUGH BRIDGE AND TUNNEL AUTHORITY
45
3 percentage point increase in E-ZPass, is occurring. As part of Stantec’s overall elasticity analysis, comparisons were made against elasticities used as part of the prior Report and those comparisons indicated that, overall, the updated elasticities are comparable, but not the same as those values previously used. These differences are related to general differences in the stable low price of fuel and improved employment environment which together should result in higher levels of disposable income.
With the implementation of ORT and the elimination of cash collection, there will be impacts to both traffic and revenue at the TBTA facilities. After ORT implementation current cash customers have to choose one of three potential options: 1) continue to utilize the facility as a TBM customer; 2) switch to E-ZPass as their preferred toll collection method; or 3) choose to travel a different, non-tolled, route. The loss of traffic due to a change in collection method (3) is often referred to as "trip shrinkage". Utilizing the limited payment data at the facilities that have already implemented ORT, Stantec estimated trip shrinkage impacts at the remaining TBTA facilities, all of which, will undergo transition to ORT in 2017. The level of trip shrinkage varies by facility due to mix of vehicle classes, availability of alternative routes, and payment type splits, among other factors.
As noted above, conversion to ORT also induces current cash customers to switch to E-ZPass. While Stantec projects overall E-ZPass usage to increase by 2-3% with the implementation of ORT, this is a combination of trip shrinkage and payment method shifts; both of which can vary by facility.
In the absence of sufficient data on elasticity for TBM customers, the cash transaction elasticity data corresponding to recent toll increases were analyzed and used as surrogates for future TBM customer response to toll increases. Over time, as more data are accumulated, Stantec estimates that elasticity rates for TBM customers will evolve to be closer to those for E-ZPass as behavior stabilizes between the two collection methods. It is important to remember, however, that toll rates for the two payment methods are not equal and that a financial saving can be achieved by obtaining a NYCSC E-ZPass tag. Elasticity factors for cash/TBM and E-ZPass transactions based on the analysis of the March 2015 toll increase are shown in Table 21.
For purposes of this report and Stantec’s projections, we have assumed the future toll increase in accordance with the 2017-2020 MTA Financial Plan. This plan includes a projected toll increase on March 1, 2019. Accordingly, the revenue forecast with the toll increase laid out in this report includes a toll increase averaging 4 percent to be implemented on March 1, 2019. Any such toll increase or other adjustments are subject to future action by the TBTA Board.
For the toll-increase scenario, it was assumed that the NYCSC E-ZPass toll for passenger cars on the major and minor crossings would be increased by 4 percent in 2019, as noted above. Further, it was assumed that truck tolls would be increased proportionately, and that the relationships between TBM and NYCSC E-ZPass tolls for passenger cars would remain the same as those implemented for the toll increase on March 19, 2017.
HISTORY AND PROJECTION OF TRAFFIC, TOLL REVENUES AND EXPENSES AND REVIEW OF PHYSICAL CONDITIONS OF THE FACILITIES OF TRIBOROUGH BRIDGE AND TUNNEL AUTHORITY
Cross Bay Bridge -0.161 -0.029 Notes: (a) For each 1% increase in toll the volume is expected to decrease by the elasticity factor; e.g.
for each 1% increase in the cash toll at the Queens Midtown Tunnel, cash traffic would decrease by 0.252%.
(b) Elasticity factors for cash transactions at the Henry Hudson Bridge were developed prior to the implementation of the AET Pilot Program in November 2012.
(c) Assume TBM customers have similar elasticity to cash.
As for the impacts of the toll increase on traffic demand, the elasticity factors from Table 21, as described above, were used by Stantec to calculate traffic decreases, as shown in Table 22. These traffic impacts represent the reduction in volume from the corresponding annual traffic levels that would be expected if the tolls were not increased.
Table 22 Estimated Percent Change in Average Toll Rates and Traffic in 2019
Cross Bay Bridge -0.161 -0.029 4.0% 4.0% -0.6% -0.1% Notes: (a) Assume TBM customers have similar elasticity to cash.
HISTORY AND PROJECTION OF TRAFFIC, TOLL REVENUES AND EXPENSES AND REVIEW OF PHYSICAL CONDITIONS OF THE FACILITIES OF TRIBOROUGH BRIDGE AND TUNNEL AUTHORITY
47
Availability of Capacity on TBTA Facilities
Stantec's assessment of TBTA's bridges and tunnels indicates that during most, if not all hours of the day, most facilities are operating below carrying capacity and more growth can be accommodated. The exception is the Queens Midtown Tunnel where capacity is somewhat constrained during specific hours within peak periods. This may limit potential traffic growth during these specific times, but the great majority of the hours have sufficient available capacity to absorb any volume growth that may occur. Overall, wherever capacity constraints are observed, TBTA takes action wherever feasible to alleviate those constraints through targeted investments.
Subject to toll plaza changes described below, in connection with ORT, we also reviewed toll plaza operations with the E-ZPass payment system. Characteristics of the E-ZPass system are discussed throughout this report. The acceleration of vehicle throughput for E-ZPass customers has mitigated congestion at the toll plazas. With the E-ZPass participation rate at 86 percent in 2016 and the E-ZPass customer base increasing, efficient toll plaza operations are anticipated throughout the forecast period.
TBTA will also implement ORT at all of its facilities by fall 2017. The ORT system, which is already in place at the Henry Hudson Bridge, Queens Midtown Tunnel, and Hugh L. Carey Tunnel, utilizes current methods employed at each facility to capture E-ZPass transponder-reads and license plate images, but will do so in an environment absent a traditional toll plaza, enabling customers to traverse tolling areas in free-flow fashion. It is anticipated that traffic flows at these facilities will experience capacity improvements comparable to those previously seen at the Henry Hudson Bridge when cashless AET was first implemented in November 2012.
Traffic modelling performed in the planning stages for the conversion to ORT showed that the removal of the toll booths eliminated any localized queuing and congestion associated with cash collection and E-ZPass interventions. The conversion to ORT, however, does not address any recurring downstream congestion issues that exist at some facilities. These downstream capacity constraints are typically located outside the Authority’s jurisdictional boundaries, but can impact traffic flow within the plaza areas during peak commuter and recreational periods. Flow through the former plaza areas will continue to be affected by these off-site conditions even after the facilities are operating in an open road environment.
TBTA and Regional Operational and Construction Impacts
Traffic volumes on TBTA facilities are in some instances influenced by construction and rehabilitation projects involving roadways and bridges in the New York City area.
Major projects that result in long-term closures on the competing bridges may increase volumes on TBTA’s facilities. Also, long-term lane closures on the roadway network serving the TBTA crossings or on the TBTA crossings themselves may affect TBTA traffic volumes or cause traffic to shift from the affected crossing to either another TBTA facility or to one of the City’s toll-free bridges. For example, when replacement of the Queens Approach on the Bronx-Whitestone Bridge began in 2011, some traffic diverted to the Throgs Neck Bridge, as the Bronx-Whitestone Bridge and the
HISTORY AND PROJECTION OF TRAFFIC, TOLL REVENUES AND EXPENSES AND REVIEW OF PHYSICAL CONDITIONS OF THE FACILITIES OF TRIBOROUGH BRIDGE AND TUNNEL AUTHORITY
48
Throgs Neck Bridge serve similar traffic and a delay on one of the bridges results in a shift to the other crossing. A number of roadway construction/rehabilitation projects, over the past few years, have influenced traffic volumes on TBTA facilities, and future construction will also affect traffic. The following descriptions also highlight area construction activities and measures that have influ-enced TBTA volumes and other planned and proposed projects that may affect traffic during the forecast period. Information on future construction activity was obtained from NYSDOT, NYCDOT, NYMTC, and the Port Authority.
Construction on TBTA Facilities
In general, the majority of construction activities programmed for the TBTA facilities themselves is scheduled to take place during off-peak hours, including nighttime and weekend lane closures in the tunnels. They are expected to have minimal impacts on bridge and/or tunnel traffic.
TBTA has an active program of regional transportation planning and coordinates closely with regional partners on all projects in common corridors. TBTA meets with NYCDOT and NYSDOT as needed to discuss on-going and future projects in order to mitigate, to the greatest extent possible, traffic impacts for concurrent construction that may occur at some of the many adjoining and interrelated crossings.
• On the Verrazano-Narrows Bridge, the construction contract for the upper level suspended spans involving the removal and replacement of the existing concrete filled grid deck with a steel orthotropic deck, reconfiguring the widening of the deck to accommodate a Bus/HOV lane, and painting of the superstructure was awarded in November 2012 and will continue into 2017. The deck work is complete and six lanes of traffic have been restored on the upper level suspended span. The construction contract for the building of a new ramp providing Bus/HOV access from the Gowanus Expressway in Brooklyn to the Verrazano-Narrows Bridge upper level was awarded in December of 2013 was substantially complete in December 2016. It is anticipated that the reversible 7th (Bus/HOV) lane will become operational on the VNB upper level and new Brooklyn Bus/HOV ramp in 2017. Extensive planning and close coordination efforts are ongoing with NYCDOT and NYSDOT on the Gowanus Bus/HOV operations and on the planned operation of the Verrazano-Narrows Bridge Bus/HOV lane to minimize any impacts to bridge traffic. Upcoming work included in the 2015-2019 Capital Program includes the Brooklyn approach reconstruction and replacement of upper level elevated approach decks.
• The Cross Bay Veterans Memorial Bridge superstructure/deck rehabilitation was completed in
May 2010. Substructure rehabilitation was completed in December 2012. There are no upcoming roadway projects for the Cross Bay Bridge in the near future.
• The Marine Parkway-Gil Hodges Memorial Bridge deck rehabilitation on the Rockaway Point
Boulevard and Jacob Riis Park Pedestrian Bridges was awarded in 2015 and completed in 2016. Construction was staged to avoid traffic impacts with the use of a temporary bridge to carry traffic while the overpass was reconstructed. In addition, the Marine Parkway Bridge will
HISTORY AND PROJECTION OF TRAFFIC, TOLL REVENUES AND EXPENSES AND REVIEW OF PHYSICAL CONDITIONS OF THE FACILITIES OF TRIBOROUGH BRIDGE AND TUNNEL AUTHORITY
49
undergo electrical and mechanical rehabilitation of the lift span along with miscellaneous steel repairs and painting of the trusses, and installation of a fire line, under a project that was awarded in 2015.
• On the Bronx-Whitestone Bridge, the replacement of the Bronx approach structure began in
late 2008 and was completed in 2012. The Queens approach replacement work started in mid-2011, with no impact to the roadway until staged deck replacement started in mid-2013 and is now substantially complete. Currently, under a project that was awarded in 2015, the Bronx-Whitestone is undergoing miscellaneous structural rehabilitation, painting, and inspection of the main cables. As noted above, the Bronx-Whitestone Bridge and the Throgs Neck Bridge serve the same traffic and delays on one of the bridges results in a shift to the other crossing.
• The Throgs Neck Bridge suspended span deck replacement design is ongoing with
construction planned to begin in 2018 with staged construction planned to begin in 2018. With the use of a movable barrier to implement a reversible lane, three lanes will be maintained in the peak direction to maximize traffic flow. This traffic management strategy has been successfully deployed on recent projects at TBTA’s suspension bridges and has been effective in minimizing traffic impacts. As noted above, the Bronx-Whitestone Bridge and the Throgs Neck Bridge serve similar traffic and a delay on one of the bridges results in a shift to the other crossing.
• At the Henry Hudson Bridge, an enabling project to facilitate replacement of both the upper
and lower level toll plazas was awarded in late 2014 and completed in 2016. In 2017, the replacement of both the upper and lower level plaza will begin. Two through lanes will be maintained on the lower level at all times. Traffic mitigation measures will be installed to minimize any traffic impacts.
• At the RFK Bridge, reconstruction and rehabilitation of the Manhattan Approach ramps began in early 2015 and continuing into 2017. A temporary bridge to carry the off-bound Manhattan Approach Ramp was used to mitigate traffic impacts on that ramp. The reconstruction of the Bronx Toll Plaza deck began in early 2015 and will continue into 2018. Work has been staged to minimize traffic impacts. Construction of a new ramp to the northbound Harlem River Drive is scheduled to start in mid-2019 and will continue into 2021. Construction of the new ramp is not expected to impact traffic on the RFK Bridge and has been closely coordinated with the NYCDOT 127th Street viaduct project.
• A major Queens Midtown Tunnel electrical rehabilitation project was awarded in late 2012 and is scheduled for completion in 2018. Major tunnel restoration work primarily attributable to Superstorm Sandy impacts commenced in the second quarter of 2015 and is scheduled to be completed in 2018. Rehabilitation of the Manhattan Exit plaza has been combined with the major tunnel restoration project to minimize traffic impacts. Work is being carried out via night and weekend closures.
HISTORY AND PROJECTION OF TRAFFIC, TOLL REVENUES AND EXPENSES AND REVIEW OF PHYSICAL CONDITIONS OF THE FACILITIES OF TRIBOROUGH BRIDGE AND TUNNEL AUTHORITY
50
• Hugh L. Carey Tunnel plaza rehabilitation in Brooklyn, in-tunnel rehabilitation work along with major Superstorm Sandy restoration work is currently underway. Work commenced in late 2014 and is scheduled to be completed in 2018. Planned capital work and Superstorm Sandy restoration work were combined to minimize traffic impacts and work is being performed during routine nighttime and weekend tube closures.
Competing East River Crossings Construction
Programmed construction along competing East River crossings include:
• Ed Koch Queensboro Bridge – As part of the seismic retrofitting of the Ed Koch Queensboro Bridge and bringing it into a state of good repair, this project will evaluate and strengthen all structural members and their connections of the bridge. The project began in 2014 and is expected to be completed in 2023. The replacement of the upper level roadway deck is scheduled; however, a construction schedule has not been finalized. Once construction begins, two lanes on the upper level will be closed during off peak and one lane during peak hours for each phase of construction. These projects may result in increased usage of the Queens Midtown Tunnel and, to a lesser extent, the RFK Bridge.
• Manhattan Bridge – As part of the seismic retrofitting of the Manhattan Bridge, all structural
members and their connections will be evaluated and strengthened, including expansion joints, cables, suspenders, anchorages, masonry piers, abutments, bracings, superstructure framings, and bearings. The steel repairs for the Manhattan Bridge are expected to begin in 2018 and are expected to be completed in 2023. As part of the continuing reconstruction program, work for the structural and component rehabilitation of the bridge is scheduled to begin in summer 2017
These projects may result in increased usage of the Hugh L. Carey Tunnel and, to a lesser extent, the Queens Midtown Tunnel.
• Brooklyn Bridge – Painting of the entire bridge to prevent steel corrosion and improve
aesthetics is currently underway and is expected to be substantially completed by spring 2017. Work is scheduled to begin in June 2017 (to be completed in 2019), on repairs due to damage from Superstorm Sandy including masonry work along the bridge’s exit and entrance ramps. Rehabilitation of approach arches, towers and ramp structures on the Brooklyn Bridge and the maintenance and protection of traffic is scheduled to begin in November 2018 and expected to be completed in 2022.
HISTORY AND PROJECTION OF TRAFFIC, TOLL REVENUES AND EXPENSES AND REVIEW OF PHYSICAL CONDITIONS OF THE FACILITIES OF TRIBOROUGH BRIDGE AND TUNNEL AUTHORITY
51
These projects may result in increased usage of the High L. Carey Tunnel and, to a lesser extent, the Queens Midtown Tunnel.
Other Major Bridge and Roadway Construction
During the forecast period, several major roadway and bridge projects, which are part of NYMTC’s current Transportation Improvement Program (TIP) for federal Fiscal Years 2017-2021, will potentially have traffic implications for the TBTA facilities. These projects are expected to have a minimal impact on traffic at TBTA facilities.
Other bridges, roads, and overpasses programmed for construction include:
• Madison Avenue Bridge – Rehabilitation of the Madison Avenue Bridge over the Harlem River is scheduled to begin in July 2017 and end in July 2019. The project includes electrical, mechanical, and miscellaneous operating system-related work. Minimal diversions to the RFK Bridge are anticipated.
• Macombs Dam Bridge – Rehabilitation of fender system and repair/replacement of the superstructure and bridge deck of the 155th Street Viaduct began in summer 2016 and is expected to end in fall 2017. Minimal diversions to the RFK Bridge are anticipated.
• 127th Street Viaduct (Harlem River Drive 125th Street Exit) – Replacement of the existing bridge
and reconstruction of the Harlem River Drive between the Willis Avenue and Third Avenue bridges began in 2015 and is expected to be completed in December 2018. Construction will result in the full closure of the northbound East 125th Street exit for 33 months and full closure of the southbound East 125th Street exit for ten months. The Harlem River Drive Northbound Exit Ramp to East 125th Street is closed through 2017. This project has been closely coordinated with TBTA’s RFK Bridge construction program. Any restrictions on the approach ramps may result in minimal diversions to the RFK Bridge.
• Broadway Bridge – Currently in its final design phase, the reconstruction of the bridge is scheduled to start in July 2017. The project’s scope of work includes a major rehabilitation of the roadway deck, superstructure steel and substructure elements of the vertical lift span, as well as the approach spans. It will also include the replacement and rehabilitation of electrical and mechanical components of the vertical lift span, as well as replacement of the existing fender system with a new larger and stronger one. Construction is expected to be completed in November 2020. Minimal diversions to the Henry Hudson Bridge are anticipated.
• I-87/Major Deegan Expressway – Rehabilitation of various overpasses along the Major Deegan
Expressway between the RFK Bridge and Mosholu Parkway is scheduled for design and construction through 2022. The anticipated schedule for construction is:
RFK Bridge to 138th Street – summer 2020 - fall 2022 160th Street to 232nd Street – spring 2017 – spring 2019 232nd Street to City Line – fall 2019 – summer 2021
HISTORY AND PROJECTION OF TRAFFIC, TOLL REVENUES AND EXPENSES AND REVIEW OF PHYSICAL CONDITIONS OF THE FACILITIES OF TRIBOROUGH BRIDGE AND TUNNEL AUTHORITY
52
Over Mosholu Parkway – Construction began in January 2015 and is scheduled to continue through June 2017
The Major Deegan Expressway between East 138th Street and the 161st Street/Macombs Dam Bridge interchange will be reconstructed to address structural deficiencies. The concrete deck will be replaced and approximately one mile of the steel structure will be repaired. The substructure will also be repaired. Construction began in spring 2014 and is expected to be completed in summer 2017, two years ahead of schedule.
Two bridges over the subway and Metro-North rail yard (on the Major Deegan Expressway in the Bronx) will be eliminated. This project will also include operational improvements to the southbound and northbound roadways to ensure motorist safety. This project commences in fall 2017 and expected to be completed in fall 2019. Safety and operational improvements northbound from Burnside Avenue to Van Cortlandt Park, including West 230th Street, are scheduled from summer 2021 to spring 2023. These projects may result in minimal diversions to the RFK Bridge.
• I-95/Cross Bronx Expressway – Several rehabilitation projects are in development for the Cross
Bronx Expressway. The rehabilitation of the six Cross Bronx Expressway bridges (replacement of deck and superstructure) over the Sheridan Expressway and Amtrak right-of-way from Boston Road to the Bronx River Parkway is a potential design-build project with construction currently scheduled to begin in 2018 and extend through summer 2024. The rehabilitation of the Arthur Avenue and 176th Street bridges over the Cross Bronx Expressway is currently under development. Construction is scheduled to begin in fall 2024 and be completed in fall 2026. The rehabilitation of the Grant Avenue Bridge to address structural deficiencies is scheduled to begin in summer 2020 and expected to be completed in spring 2023. The rehabilitation of Jesup Avenue Bridge, which will include deck and bearings replacement and steel repairs to address structural deficiencies as well as extend service life of structures, is scheduled to begin in summer 2020 and be completed in spring 2023. The rehabilitation and deck replacement of three bridges at the Highbridge interchange (which carry ramps between the Cross Bronx Expressway and Major Deegan Expressway) is scheduled to begin in fall 2017 and is expected to be completed in spring 2019. The rehabilitation of Nelson Avenue Bridge over the Cross Bronx Expressway is scheduled to begin in summer 2020 and end in spring 2023. The scope will include replacing the bridge deck, repairing concrete substructures, replacing bearings, and repairing other deteriorated
HISTORY AND PROJECTION OF TRAFFIC, TOLL REVENUES AND EXPENSES AND REVIEW OF PHYSICAL CONDITIONS OF THE FACILITIES OF TRIBOROUGH BRIDGE AND TUNNEL AUTHORITY
53
elements to assure continued safe operations. The steel superstructure is in fair condition and will require minor repairs. The rehabilitation of Jerome Avenue and East 174th Street Bridges over the Cross Bronx Expressway (to extend the service life of the two bridges) is scheduled to begin in fall 2021 and end in summer 2022. The scope of work will include replacement of the bridge decks/slabs, the repair of superstructures, the repair of concrete substructures, the replacement of bearings, and the repair of other deteriorated elements to assure continued safe operations. The rehabilitation of Cross Bronx Expressway over Webster Avenue is scheduled to begin in winter 2022/2023 and end in summer 2025. The scope will include replacing the concrete deck and replacing/repairing other deteriorated bridge elements to ensure continued safe operations.
These projects may result in minimal diversions to the RFK, Bronx-Whitestone, and/or the Throgs Neck bridges.
• Bruckner/Sheridan Expressway Interchange – The project consists of reconstruction of the Bruckner Expressway viaduct and the related ramps to address the poorly rated deck, deteriorated concrete columns, repair/replacement of the bearings, pedestals and other minor work elements. The twelve bridges in this project include ten vehicular bridges and two pedestrian bridges. Phase 1 includes reconstruction of deck area from RFK Bridge to East 141st Street and is expected to begin in late 2017 and end in late 2019. Phase 2 includes deck area east of East 141st Street and is expected to begin in spring 2020 and end in winter 2020/2021. The TBTA has entered into MOA discussions with NYSDOT to share in the costs to have the Bruckner connector ramp to the RFK facility replaced under DOT’s design-build project. This project may result in minimal diversions to the RFK, Bronx-Whitestone, and/or the Throgs Neck bridges.
• I-95/Bruckner Expressway – The addition of a fourth northbound lane between Wilkinson Avenue and the Hutchinson River Parkway is slated to begin in winter 2018/2019 and be completed in spring 2021. The construction of access improvements between Brush Avenue and Pelham Parkway, which would involve the construction of new bridges, is scheduled to begin in summer 2019 and be completed in summer 2020.
Construction to repair and replace deteriorated components of the Bruckner Expressway Bridge over Rosedale Avenue is expected to begin in winter 2022/2023 and end in fall 2025. The Unionport Bridge, which carries the northbound and southbound Bruckner Expressway service roads over the Westchester Creek, is scheduled for a complete replacement beginning in spring 2017. The new bridge would be expanded from four to six lanes and all of the approaches will be completely rebuilt. Traffic flow across the bridge is expected to
HISTORY AND PROJECTION OF TRAFFIC, TOLL REVENUES AND EXPENSES AND REVIEW OF PHYSICAL CONDITIONS OF THE FACILITIES OF TRIBOROUGH BRIDGE AND TUNNEL AUTHORITY
54
continue uninterrupted through the estimated four year construction period, which is anticipated to start in spring 2017 and be completed in 2021.
These projects may result in minimal diversions to the RFK, Bronx-Whitestone, and/or the Throgs Neck bridges.
• Bronx River Parkway – General repairs on the Bronx River Parkway Bridge over the Metro-North right-of-way at 236th Street will address corrective maintenance issues. Construction began in summer 2015 and is expected to be completed by summer 2017.
Rehabilitation of the Bronx River Parkway Bridge over Metro-North will repair/replace the severely deteriorated non-redundant three-girder structure whose highway geometry is considered substandard. A replacement with highway realignment is being considered. Construction is expected to begin in summer 2018 and be completed in summer 2019.
Repair of the Bronx River Parkway Bridge over Morris Park Avenue and the NYCTA Unionport Yard will address steel and concrete repairs. Construction is expected to begin in summer 2017 and be completed in winter 2018/2019.
Replacement of deteriorated bridges on the Bronx River Parkway, specifically the two span bridge over AMTRAK/CSX (near the Cross Bronx Expressway interchange), the single span bridge over East Tremont Avenue and the seventeen-span viaduct over East. 180th Street/Morris Park Avenue and along the MTA’s East 180th Street subway yard is expected to begin in summer 2021 and is expected to be completed in summer 2025. The project will improve the roadway geometry, eliminate the structural deficiencies and provide standard travel lanes and shoulders. In addition, the project will provide a fully ADA compliant shared-use path and a new exit ramp structure spanning over the AMTRAK/CSX tracks.
Reconstruction of the Gun Hill Road Interchange to implement safety improvements along the northbound and southbound off ramps include an upgrade of the deceleration lane, extension of the two lane northbound ramp configuration limits, and the improvement of the geometry of the northbound off ramp geometry. Additionally, the southbound travel lanes as well as the southbound on ramp from Gun Hill Road will be resurfaced. Construction is expected to begin in summer 2017 and expected to be completed in summer 2018.
These projects may result in minimal diversions to the RFK, Bronx-Whitestone, and/or the Throgs Neck bridges.
• I-278/Gowanus Expressway – The replacement of bridge decks on the 79th Street Bridge is scheduled to begin in winter 2018/2019 and is expected to be completed in winter 2021/2022. The replacement of bridge decks and repair of deteriorated elements on the 86th Street Bridge is scheduled to begin in spring 2017 and is expected to be completed in fall 2018.
HISTORY AND PROJECTION OF TRAFFIC, TOLL REVENUES AND EXPENSES AND REVIEW OF PHYSICAL CONDITIONS OF THE FACILITIES OF TRIBOROUGH BRIDGE AND TUNNEL AUTHORITY
55
A project to install TRANSMIT Readers and Travel Time Signs that will provide real travel time information to the motorists along the Gowanus Expressway from the Verrazano Narrows Bridge to the Hugh L. Carey Tunnel began in 2014. The project was scheduled to be completed in February 2017, but is delayed and as of the date of this report, is still under construction. The Gowanus Expressway Active Traffic Management System project will focus on the Gowanus Expressway Corridor from the Brooklyn approach of the Verrazano Narrows Bridge to the Hugh L. Carey Tunnel to allow for quick incident response, improved traffic flow and more reliable travel times. Construction is expected to begin in fall 2021 and be completed in spring 2023.
The Gowanus Expressway Viaduct between 48th Street and Hugh L. Carey Tunnel and between 92nd Street to 48th Street is undergoing structural steel repairs to extend service life and ensure motorist safety. Construction began in summer 2016 and is expected to end in spring 2018. This work is primarily below the I-278/Gowanus Expressway.
These projects may result in minimal diversions to the Hugh L. Carey Tunnel and the Verrazano-Narrows Bridge.
• I-695/Throgs Neck Expressway - The replacement of bridge decks and repair of deteriorated elements on the Randal Avenue Bridge is scheduled to begin in spring 2017 and is expected to be completed in fall 2018. Minimal impact to traffic at the Throgs Neck Bridge may occur.
• I-295/Clearview Expressway - Repaving and concrete repairs on the full length of the Clearview Expressway in both directions between Hillside Avenue and Willets Point Boulevard is currently underway and is expected to be completed in fall 2017. Minimal impact to traffic at the Throgs Neck Bridge may occur.
• Hutchinson River Parkway - The rehabilitation of the Westchester Avenue bridge over the
Hutchinson River Parkway will repair abutments, piers, approaches, steel superstructure and replace the reinforced concrete deck. Currently in design phase, the project is expected to be completed in fall 2020. Minimal impact to traffic at the Bronx-Whitestone Bridge may occur.
• I-278/Brooklyn-Queens Expressway (BQE) – Replacement of the girder/floor beam system on the eastbound BQE ramp to Grand Central Parkway is scheduled to begin in winter 2018/2019 and is expected to be completed in winter 2021/2022.
HISTORY AND PROJECTION OF TRAFFIC, TOLL REVENUES AND EXPENSES AND REVIEW OF PHYSICAL CONDITIONS OF THE FACILITIES OF TRIBOROUGH BRIDGE AND TUNNEL AUTHORITY
56
The rehabilitation of the Grand Central Parkway interchange complex from 71st Street to 82nd Street and 25th Avenue on the Brooklyn-Queens Expressway to the Grand Central Parkway ramp is scheduled to begin in 2020, preceded by the section of the Grand Central Parkway from Astoria Boulevard to 44th Street in 2019. The projects involve reconstruction of the highway interchange and both stages are currently in development. This project has the potential for lane closures that could affect the Queens Midtown Tunnel and the RFK Bridge; however, this would affect alternative routes as well. The replacement of four bridge decks over the Brooklyn Queens Expressway, which will replace concrete decks, repair concrete substructures, and repair other deteriorated elements, is in development and construction expected to begin in spring 2021 and expected to be completed in winter 2021/2022. Phase I of the new Kosciuszko Bridge which began in fall 2014 is expected to be completed in fall 2017. Traffic switchover in both directions from the old bridge to the new eastbound structure is expected to take place in spring 2017. Phase II of the project is expected to begin in spring 2018, with completion expected in summer 2020. Maintenance and protection of traffic plans indicate that the existing number of lanes will be maintained during peak periods on the Brooklyn-Queens Expressway while lane reductions and or closures may occur during off-peak periods. These projects may result in minimal diversions to the RFK Bridge and Queens Midtown Tunnel.
• BQE Triple Cantilever Project – The NYCDOT plans to reconstruct 1.5 miles of the BQE including the triple cantilever structure between Atlantic Avenue and Sands Street which consists of a series of 21 concrete-and-steel bridges over local roads. The preliminary design is expected to be completed by 2019. Improvements will include new lane design, fewer joints on the roadway, a new highway deck, new ramps, improved drainage and new lighting. Construction is expected to begin by 2021/2022 and be completed by 2025/2026. Traffic is not expected to be diverted to local streets during construction but this project has potential for lane closures that could impact traffic at the Hugh L. Carey Tunnel.
• Belt Parkway – Installation of Advanced Traffic Management System equipment including CCTV, VMS, detection system and travel time system from the Gowanus Expressway to Cross Bay Boulevard is scheduled to begin in fall 2018 and end in summer 2020. The reconstruction of the seven bridges and their approaches on the Belt Parkway (over three local streets and four waterways) began in the fall of 2009. The Paerdegat Basin, Fresh Creek, and the Rockaway Parkway bridges were completed in 2016. Reconstruction of the Bay Ridge Avenue Bridge started in November 2013 and was completed in fall 2015. Reconstruction of the Gerritsen Inlet Bridge started in February 2013 and is expected to be complete in summer 2017. The reconstruction of the Mill Basin Bridge began in summer 2015 and is planned to be complete in winter 2020/2021. The reconstruction of the Nostrand Avenue Bridge is expected to start in 2021.
HISTORY AND PROJECTION OF TRAFFIC, TOLL REVENUES AND EXPENSES AND REVIEW OF PHYSICAL CONDITIONS OF THE FACILITIES OF TRIBOROUGH BRIDGE AND TUNNEL AUTHORITY
57
The 17th Avenue Pedestrian Bridge and 27th Avenue Bridge over the Belt Parkway will be reconstructed in 2018 with an expected date of completion in 2020. The Shore Parkway Bridge rehabilitation over Shell Road will replace the concrete decks, repair the superstructure, substructure and other deteriorated elements. Construction is expected to begin in spring 2023 with an expected date of completion in winter 2025/2026. The replacement of bridge decks and repair of deteriorated elements on the Lefferts Boulevard Bridge is scheduled to begin in spring 2017 and is expected to be completed in fall 2018. These projects may result in minimal impacts to traffic at the Verrazano-Narrows Bridge, Cross Bay Bridge, and Marine Parkway Bridge.
• Grand Central Parkway – The Grand Central Parkway and Jackie Robinson Parkway lighting improvement projects are scheduled to start in fall 2019 and expected to be completed in spring 2021. The project to reconstruct the Grand Central Parkway and Brooklyn-Queens Expressway (east leg) interchange is scheduled to start in spring 2020 and expected to be completed in 2023 while the reconstruction of Brooklyn-Queens Expressway and Grand Central Parkway (west leg) interchange is expected to be completed in 2035. The planned rehabilitation of the Grand Central Parkway Bridge over Winchester Boulevard and ramp over the Cross Island Parkway is scheduled to begin in summer 2023 and be completed in summer 2026. The rehabilitation of the 188th Street Bridge over the Grand Central Parkway will consist of replacing the decks and repairing steel superstructures and other deteriorated elements such as concrete substructure and bearings. The project also includes full paint removal and re-painting of all existing structural steel. The project is under construction with an expected completion date in fall 2017. A guiderail upgrade on Grand Central Parkway between 31st Street and the Nassau County Line is scheduled to start in winter 2017/2018 and expected to be completed in winter 2018/2019. The purpose of this project is to improve the roadside safety for motorists by upgrading nonstandard guiderails.
Repaving and concrete repairs in both directions of the Grand Central Parkway between 34th Street and 82nd Street and in eastbound direction from 168th Street to the Clearview Expressway is currently underway and are scheduled to be completed by fall 2017.
HISTORY AND PROJECTION OF TRAFFIC, TOLL REVENUES AND EXPENSES AND REVIEW OF PHYSICAL CONDITIONS OF THE FACILITIES OF TRIBOROUGH BRIDGE AND TUNNEL AUTHORITY
58
These projects may result in minimal impacts to traffic at the RFK Bridge and Queens-Midtown Tunnel.
• I-678/Whitestone Expressway Bridge over the Flushing River – The project will replace the
existing fender system on the Whitestone Expressway bridges to protect the bridge piers as part of corrective maintenance. The project is under construction and is expected to be completed in fall 2017. This project may result in minimal impacts to traffic at the Bronx-Whitestone and Throgs Neck bridges.
• I-678/Van Wyck Expressway – The rehabilitation of the Roosevelt Avenue Bridge began in
January 2016 and is expected to be complete in August 2019. Major reconstruction plans include installation of new girders, a new deck, new lighting, and an approximate two-feet widening of the sidewalk to allow for a bike lane. The project to replace steel girders on the Rockaway Boulevard Bridge over the Van Wyck Expressway is scheduled to begin in winter 2018/2019 and be completed in winter 2021/2022.
Phase 2B of the Kew Gardens Interchange reconstruction includes replacement of the southbound Van Wyck Expressway viaduct, replacement of the Kennedy Airport ramp bridge, rehabilitation of the southbound Van Wyck Expressway connection to westbound Jackie Robinson Parkway, realignment of the at-grade MTA Yard Perimeter road, addition of a dedicated exit lane on southbound Van Wyck Expressway to Kennedy Airport ramp and addition of southbound connection to westbound Jackie Robinson Parkway. The project is currently scheduled to begin in spring 2017 and is expected to be completed in fall 2019. The reconstruction of parkway roadways located within the Kew Gardens Interchange is scheduled to begin in spring 2018 and is expected to be completed in fall 2021. The scope of work includes replacement of highway viaducts and ramp structures, the realignment of ramps to improve connections, the addition of highway shoulders to improve safety, and the addition of a multi-use path to improve pedestrian and bicycle connections. Van Wyck Expressway / Long Island Expressway Interchange structural rehabilitation project will replace concrete deck, perform corrective repairs of bridge steel and concrete elements on College Point Boulevard ramp and concrete deck replacement and concrete piers repairs on selected spans of the Van Wyck Expressway viaduct over the Long Island Expressway. The project is expected to begin in fall 2019 and is expected to be completed in fall 2021.
• Van Wyck Expressway/JFK Airport Access Improvements – This project will widen the Van Wyck
Expressway (I-678) in order to add a fourth lane from the Kew Gardens Interchange to JFK Airport in each direction. The project will impact up to twenty bridges, including four bridges that carry the LIRR over the Van Wyck Expressway. These projects may result in minimal impacts to traffic at the Bronx-Whitestone Bridge and the Queens Midtown Tunnel.
HISTORY AND PROJECTION OF TRAFFIC, TOLL REVENUES AND EXPENSES AND REVIEW OF PHYSICAL CONDITIONS OF THE FACILITIES OF TRIBOROUGH BRIDGE AND TUNNEL AUTHORITY
59
• I-495/Long Island Expressway – Various projects are underway between the Van Wyck
Expressway and Grand Central Parkway to improve infrastructure, traffic operations, and safety conditions on the Long Island Expressway, the Grand Central Parkway, the connecting cloverleaf interchange ramps, the service roads and the collector distributor roads in the project area. Interim rehabilitation of three bridges at the Long Island Expressway/Grand Central Parkway interchange, involving the replacement of the bridge superstructure, began in June 2015 and is estimated to be completed in early 2019. New guiderail installation to improve the safety of the motorists on the Long Island Expressway between the Grand Central Parkway and the Cross Island Parkway is currently under construction and is estimated to be completed in spring 2017. Plans are in development to extend the existing managed HOV/Bus contraflow lane from its current terminus at 58th Avenue to a new terminus in the vicinity of 102nd Street in Queens. The contraflow lane, operating on the left lane of the eastbound side of the Long Island Expressway, will operate on weekdays from 6AM to 1PM. Construction is expected to begin in winter 2019/2020 and be completed in fall 2021. These projects may result in minimal impacts to traffic at the Queens Midtown Tunnel and Bronx-Whitestone Bridge.
• Route 9A – Henry Hudson Parkway Viaduct reconstruction from West 72nd to 82nd Street is
currently under design and is scheduled for construction in spring 2019. The viaduct reconstruction from West 94th to 98th Street is also under design and is scheduled for construction in 2020. This project has the potential for lane closures that could affect the Henry Hudson Bridge and possibly alternative routes. Repairs from the World Trade Center attacks and Superstorm Sandy are in progress to improve transportation systems in this area. The World Trade Campus Security project, in the vicinity of World Trade Center site, is expected to affect Hugh L. Carey Tunnel traffic when implemented in 2019. The project involves the implementation of a comprehensive perimeter vehicle security plan for the World Trade Center site. Construction on the campus was 90 percent complete as of February 2017. Other projects include restoration and reconstruction of pavement joints and pavements striping, markings, urban design elements, pedestrian bridges, irrigation equipment, ITS equipment, drainage system, traffic signals, street lights, pedestrian bridge elevators/escalators on Route 9A damaged by Superstorm Sandy in addition to the required repairs of pavement joints, and bikeway/walkway pavement resurfacing and striping. Construction began in spring 2014 and is expected to be completed in spring 2017. The ongoing West Thames Street pedestrian bridge construction project will construct a pedestrian bridge over Route 9A at West Thames Street, and remove the existing Rector Street
HISTORY AND PROJECTION OF TRAFFIC, TOLL REVENUES AND EXPENSES AND REVIEW OF PHYSICAL CONDITIONS OF THE FACILITIES OF TRIBOROUGH BRIDGE AND TUNNEL AUTHORITY
60
pedestrian bridge. The project is expected to be completed in spring 2018. The project coincides with post-Sandy work at the Hugh L. Carey Tunnel and construction of the Morris Street Pedestrian Bridge. The project is being coordinated closely with TBTA to avoid impacts during post-Sandy work and construction of the Morris Street Pedestrian Bridge. Repairs on the Battery Park Underpass due to Superstorm Sandy flood damage to restore the tunnel systems beneath Battery Park and West Street Underpass are currently underway. The construction is expected to be completed in winter 2017/2018. Upon completion, these projects may have a positive impact on traffic using the Hugh L. Carey Tunnel as motorists achieve the comfort level with the permanent traffic patterns that will be in place.
• Harlem River/FDR Drive – Replacement of decks on the Harlem River Drive exit ramp to 139th Street is scheduled to begin in winter 2018/2019 and is expected to be completed in winter 2021/2022. The Harlem River Drive Viaduct reconstruction at 127th street will convert the existing bridge into two separate bridges: East 127th Street entrance ramp to northbound Harlem River Drive and Third Avenue Bridge entrance ramp to southbound Harlem River Drive. Currently under construction, the project is expected to be completed in winter 2018/2019. The NYSDOT plans to rebuild the ramps connecting the Harlem River Drive to the Trans-Manhattan Expressway (I-95, US 1 and US 9).
Replacement of the deck on the I-95 ramp is expected to begin in fall 2020 and finish in winter 2022/2023. Restoration of FDR Drive bridge structure and adjacent roadway elements damaged by Superstorm Sandy will repair the pier columns along South Street Viaduct and 42nd Street, the northbound off-ramp and the at-grade pavement, joints and concrete barriers. The construction is expected to begin in summer 2018 and be completed in winter 2019/2020. Safety improvements on Harlem River Drive from 131st Street to 166th Street will include pavement resurfacing, replacement of median barriers, and installation of a median fence in high accident locations to eliminate pedestrian fatalities. Construction is expected to begin in spring 2017 and be completed in winter 2017/2018. These projects may result in minimal impacts to traffic at the RFK Bridge.
• I-278/Goethals Bridge Replacement – Construction on the new Goethals Bridge began in May 2014 and is forecasted to be completed by late 2018. After the new bridge is in operation, the old bridge will be demolished. Although the Goethals Bridge will not be closed during construction, this project may result in minimal impacts to traffic at the Verrazano-Narrows Bridge.
HISTORY AND PROJECTION OF TRAFFIC, TOLL REVENUES AND EXPENSES AND REVIEW OF PHYSICAL CONDITIONS OF THE FACILITIES OF TRIBOROUGH BRIDGE AND TUNNEL AUTHORITY
61
• I-278/Staten Island Expressway – Replacement of decks of five bridges located along Staten
Island Expressway at Mosel Avenue (westbound and eastbound) and Staten Island Rapid Transit right-of-way is scheduled to begin in spring 2018. This project will replace concrete decks, repair concrete substructures, repair bearings, and other deteriorated elements at five bridges. Construction is expected to begin in spring 2018 and end in winter 2019/2020. A project to install Transmit Readers and Travel Time Signs that will provide real travel time information to motorists along the Staten Island Expressway and the West Shore Expressway is currently underway. The project expected to be completed in winter 2017/2018. These projects may result in minimal impacts to traffic at the Verrazano-Narrows Bridge and Hugh L. Carey Tunnel. Additional projects in Staten Island scheduled for the long term would likely have little negative impacts on the Verrazano-Narrows Bridge during construction but positive impact upon completion.
• Pulaski Skyway (Routes 1 & 9 in New Jersey) – The contract for reconstruction and rehabilitation of the Pulaski Skyway, an elevated roadway for automobiles only, extending from the vicinity of Newark Airport to the approach to the Holland Tunnel, was awarded in May 2012 and is scheduled for completion in 2020. During construction, the Skyway will be closed in the north/east bound direction for two years (this began in April 2014). The re-decking of the Pulaski Skyway is expected to be completed by end of summer 2017. Although the Verrazano-Narrows Bridge could provide an alternative route for traffic between southern New Jersey and Manhattan, this project is expected to result in minimal impacts to traffic at the Verrazano-Narrows Bridge.
• Route 440/Bayonne Bridge – In December 2010, the Port Authority announced that the Bayonne Bridge would be raised to solve the navigational clearance restrictions. The construction began in May 2013 and will be completed by mid-2019. On February 20, 2017, the new elevated roadway was opened to traffic and cashless tolling was implemented.
• Holland Tunnel Concrete Repairs – In May 2016, the Port Authority initiated a two-year, project to repair the concrete air supply ports inside the Holland Tunnel. To accommodate construction work, overnight single tunnel lane closures are planned in both directions through June 2018. It is expected that New Jersey bound traffic in Manhattan would experience some heavy congestion during weeknight lane closures and motorists may detour to alternate routes. This project may result in a minimal positive impact to traffic at the Hugh L. Carey Tunnel and the Verrazano-Narrows Bridge.
In February 2017, the Port Authority authorized $7 million for a Superstorm Sandy mitigation project at the Holland Tunnel. The scope of work includes planning for permanent flood mitigation repairs and restorations to the Holland Tunnel. Both the north and south tubes were damaged severely by water entering through the New Jersey roadway portals and through
HISTORY AND PROJECTION OF TRAFFIC, TOLL REVENUES AND EXPENSES AND REVIEW OF PHYSICAL CONDITIONS OF THE FACILITIES OF TRIBOROUGH BRIDGE AND TUNNEL AUTHORITY
62
the exhaust air duct system. Potential lane closures may result in a minimal positive impact to the traffic at the Hugh L. Carey and the Verrazano-Narrows Bridge.
• Gowanus Canal Superfund Site – In 2010, Gowanus Canal, an EPA Superfund site was added to the National Priorities List (NPL) as a hazardous waste site requiring clean up. In September 2013, the EPA issued its Record of Decision (ROD), which explained the remediation plan for the Gowanus Canal. The project involves removing contaminated sediment from the canal via dredging, installing a cap, and restoring the 5th Street basin. The Remedial Design (RD) process is currently underway and the design related to the upper portion of the Canal is expected to be completed by end of 2019. It is anticipated that active construction will occur over a six- to 10-year period. Proposed plans for Hamilton Avenue over Gowanus Canal are not yet available so it is not possible to estimate the impact to traffic at the Hugh L. Carey Tunnel.
Transit Improvements
Significant transit improvements, when completed, are expected to affect TBTA traffic levels during the forecast period through the year 2024.
• MTA Second Avenue Subway – Construction of Phase 1 started in April 2007 and service opened to the public on January 1, 2017. Service from new stations at East 96th, East 86th, and East 72nd Streets along Second Avenue now connects to the 63rd Street line at Lexington Avenue. The 2015-2019 Capital Program includes funding to complete design and initial construction of Phase 2 (125th Street to 96th Street) of the Second Avenue Subway; Phase 3 (63rd Street to Houston Street) and Phase 4 (to Lower Manhattan; Houston Street to Hanover Square) are not yet funded and are not included in the current MTA Capital Program. It is anticipated that Phase 3 and Phase 4 construction work, when commenced, may cause some travelers to the East Side to shift to MTA New York City Transit from other modes, including TBTA facilities including the RFK Bridge.
• MTA “L” train shutdown – The MTA has announced it would shut down the “L” train between Manhattan and Brooklyn for 18 months beginning in April 2019 so that it can make critical repairs to both tubes of the Canarsie Tunnel, which were damaged severely during Superstorm Sandy. Service between Eighth Avenue in Manhattan and Bedford Avenue in Brooklyn will be suspended in both directions for 15 months beginning April 2019. This project may result in a positive impact to traffic at the Queens Midtown Tunnel. NYCDOT is currently exploring options such as HOV lanes 3+ on Williamsburg Bridge to relieve traffic impacts.
• MTA/LIRR East Side Access – This project will result in a new connection from the LIRR Main and Port Washington lines in Queens to a new LIRR terminal beneath Grand Central Terminal in Manhattan. Project completion is scheduled for December 2022. MTA anticipates that some travelers to the East Side will shift to the LIRR from other modes, including the Queens Midtown Tunnel and the Robert F. Kennedy Bridge.
HISTORY AND PROJECTION OF TRAFFIC, TOLL REVENUES AND EXPENSES AND REVIEW OF PHYSICAL CONDITIONS OF THE FACILITIES OF TRIBOROUGH BRIDGE AND TUNNEL AUTHORITY
63
• Penn Station Access Study – This study is to evaluate proposed additional rail services for the New York Metropolitan Area, which would improve access between Metro-North east-of-Hudson service area to the West Side of Manhattan, creating two new stations on the West Side of Manhattan and four in the East Bronx. The MTA is preparing a federal Environmental Assessment, and will update key technical analysis that were previously prepared for Draft Environmental Impact Statement (DEIS). MTA expects environmental and federal reviews to be completed by 2017. Assuming the project proceeds, Metro-North service to Penn Station will begin after completion of the East Side Access project.
• The Gateway Project (Amtrak) – The Gateway Project includes the design and construction a new Hudson River rail tunnel serving Penn Station, New York, and the rehabilitation and modernization of the existing North River Tunnel which incurred serious and ongoing damage during Superstorm Sandy. Due to the high level of traffic in the existing Hudson River Tunnel (450 trains per weekday, 600,000 riders), taking one of its two tubes out of service for necessary repairs would reduce total capacity for Amtrak and NJ TRANSIT from 24 trains per hour to approximately six trains per hour in the peak direction. This very significant reduction in capacity would impact New York and New Jersey commuters who cross the Hudson on a daily basis along with Amtrak passengers. This project will allow NJ TRANSIT and Amtrak to continue to operate and maintain existing levels of passenger rail service in the new tunnel while the North River Tunnel is taken out of service for critical rehabilitation and repairs. The Hudson Tunnel Project’s scoping process was conducted in May 2016 and currently the release of NEPA Draft EIS is scheduled for summer 2017. A preliminary schedule aims to complete the new tunnel in 2026 to enable the planned rehabilitation of the existing tubes to be complete in 2030. Unexpected closures in existing tubes for emergency repairs during weekday hours may force some rail commuters to switch to a bus or car. Funding is not yet identified to fully finance this project. TBTA facilities may experience a sporadic increase in usage with commuters choosing to travel to/from the City via any of the tolled Hudson River bridge and tunnel facilities.
• AirTrain extension to LGA – This Port Authority capital project will provide a new AirTrain service between the LGA airport and a new intermodal station at Willets Point with connections to LIRR and MTA-NYCT (“7” Subway line). Construction is expected to begin in 2019 and end in 2023. This project can impact traffic at the RFK Bridge and the Queens Midtown Tunnel as some airport travelers and employees may shift to subway. Some impacts to traffic may also be seen at the Bronx-Whitestone and Throgs Neck Bridges. However, this would impact the other East River crossings as well.
Summary of Assumptions and Conditions
TBTA traffic, toll revenues and expenses have been projected by Stantec on the basis of the historical record of traffic, toll revenues and expenses, the capacities of the TBTA facilities, traffic growth forecasts, the historic traffic elasticity due to toll variations, impacts of construction projects and the following assumptions and conditions, which we believe are reasonable.
HISTORY AND PROJECTION OF TRAFFIC, TOLL REVENUES AND EXPENSES AND REVIEW OF PHYSICAL CONDITIONS OF THE FACILITIES OF TRIBOROUGH BRIDGE AND TUNNEL AUTHORITY
64
• All TBTA facilities will be operated efficiently and maintained in good physical condition in order to attract customers and to sustain traffic demand levels.
• ORT will be implemented at all TBTA facilities by the end of 2017. • The TBTA 2015-2019 Capital Program that was approved by the MTA Board on April 20, 2016
will be carried out throughout the forecast period. Future capital programs sufficient to maintain the structural integrity of bridges and tunnels will be adopted and implemented throughout the forecast period.
• Electronic toll payment by E-ZPass will continue to be available on all TBTA crossings, and the
payment of revenue in full to TBTA will continue to be in accordance with current inter-agency agreements. As of the end of 2016, almost 86 percent of all tolls paid on TBTA facilities were E-ZPass transactions. The conversion to ORT will cause an increase in E-ZPass transactions and this percentage will slowly increase over time.
• It is assumed that congestion pricing in Manhattan will not be implemented during the time
period included in these forecasts. • Competing East River crossings will continue to operate toll-free and be maintained in efficient
operating condition. • For the scenario with constant tolls, the present toll schedule will be in effect during the
remainder of the forecast period through 2027. For the scenario with toll increases, tolls on TBTA facilities will be increased by 4 percent for most customers on March 1, 2019, in accordance with the 2017-2020 MTA Financial Plan.
• Capacity constraints on the local and arterial highway networks which may be somewhat
mitigated by stagnant traffic growth in the near term will, however, continue to limit traffic growth on the nine TBTA crossings. This is reflected in conservative growth rates used to forecast TBTA traffic.
• Although City and State budget difficulties continue, highway/crossing improvements, in
general, for the competing bridges and roadway network will be made in accordance with the plans and schedules described herein.
• Major TBTA roadway and structural improvements will continue to be performed during
nighttime and non-peak hours, and/or in the off-peak direction, and approaches to the nine TBTA crossings will not be significantly impaired by construction work.
• It is noted that as full implementation approaches higher E-ZPass usage will occur but will result
in lower average tolls. After the expected increases in E-ZPass from the full implementation of ORT, E-ZPass usage will continue to grow at a slow rate through the following years, this slower growth in E-ZPass participation will slightly reduce average tolls.
HISTORY AND PROJECTION OF TRAFFIC, TOLL REVENUES AND EXPENSES AND REVIEW OF PHYSICAL CONDITIONS OF THE FACILITIES OF TRIBOROUGH BRIDGE AND TUNNEL AUTHORITY
65
• With full implementation of ORT, overall toll facility operations will function at a capacity equal
to or larger than downstream capacity, eliminating toll plaza delays due to collection. • Growth assumptions, based on trends in regional employment and population, forecast by
NYMTC through 2050, will be realized in the Tri-State area and in the City. • If gasoline prices in the New York metropolitan area were to increase again to and above the
levels they did when they spiked in 2008 and 2011, discretionary travel could decline and there may be fewer recreational trips. Also, the reduced non-work travel could also make the toll-free alternatives more competitive. In general, however, TBTA facilities carry regular com-muters and other non-discretionary trips so that the overall impact on toll volumes and toll revenues is not expected to be significant if prices do not increase substantially above previously experienced high levels.
• LIRR East Side Access may shift some Long Island auto commuters to rail, after its planned
completion in December 2022. Current TBTA reduced rate toll programs and MTA rebate programs remain in effect at current projected levels, including reduced rates for NYCSC E-ZPass and token customers and for Staten Island residents at the Verrazano-Narrows Bridge and for Rockaway Peninsula and Broad Channel residents at the Cross Bay and Marine Parkway Bridges. TBTA’s reduced rate programs provide, by statute, a toll rate lower than the cash rate for Staten Island Residents using resident tokens or E-Tokens to cross the Verrazano-Narrows Bridge and for Rockaway Residents using resident tokens or E-Tokens and non-residents using minor tokens or E-Tokens to cross the Cross Bay and Marine Parkway Bridges. The reduced rate programs provide, by Board policy, a toll rate lower than the cash rate to non-resident NYCSC E-ZPass customers. TBTA’s reduced rate programs also provide, by Board Policy, a toll rate lower than the NYCSC E-ZPass rate to Staten Island Residents crossing the Verrazano-Narrows Bridge and to Rockaway Residents crossing the Cross Bay and Marine Parkway Bridges. The MTA’s rebate programs lower the effective toll rates below the reduced rates discussed above for Rockaway Residents at the Cross Bay Bridge and Staten Island Residents and certain commercial vehicles with NYCSC commercial and business accounts at the Verrazano-Narrows Bridge by using a combination of MTA funds and New York State funds to pay for all or a portion of the toll. TBTA’s “reduced rate” programs and MTA's rebate programs both result in increased traffic. TBTA's toll revenue is impacted unfavorably by charging a reduced rate for residents but there are no adverse revenue impacts stemming from the rebate programs because the rebate values are fully reimbursed by MTA and New York State. • No other reduced rate toll programs will be introduced that would adversely affect the TBTA
toll facilities' revenue stream. • Economic conditions, nationally and in the New York Metropolitan Area, will continue to
improve in the next five years at a modest pace.
HISTORY AND PROJECTION OF TRAFFIC, TOLL REVENUES AND EXPENSES AND REVIEW OF PHYSICAL CONDITIONS OF THE FACILITIES OF TRIBOROUGH BRIDGE AND TUNNEL AUTHORITY
66
• No natural disaster or local, state or national emergency will occur that would materially alter travel patterns and divert traffic from the TBTA facilities.
While the projections are made and presented year-by-year by Stantec, they are intended to show trends on the basis of its analysis of historical data and the assumptions and conditions set forth above. Variations in the year-to-year forecasted results may occur and such variations may be significant.
PROJECTED TRAFFIC, REVENUES, AND EXPENSES
Current and future traffic and toll revenues are estimated for the 11-year (2017-2027) forecast period for each TBTA facility based on historical trends in traffic and toll revenue, elasticity factors for the future toll increase, toll collection operations, capacities of the nine crossings, facility maintenance, E-ZPass participation levels, externalities such as area roadway improvement plans and regional demographic projections, and the assumptions and conditions summarized previously. Trends in operating expenses for the toll facilities, TBTA’s 2017 budget and 2017 through 2020 financial plan, and growth estimates based on the Consumer Price Index and historical trends are reflected in the future operating expense forecast. Future operating expense estimates are used to develop net toll revenue projections over the forecast period.
Estimated Traffic and Toll Revenue, 2017
Stantec’s development of the traffic and toll revenue estimates for 2017 took into account the economic condition of the region, fuel prices, unusual weather events, and construction projects. The impacts in the long term, regarding the national and regional economies, projected employment in the Manhattan business districts and the traffic and toll revenue forecasts beyond 2017, are covered in a previous section of this report. In developing the traffic and toll revenue estimates for 2017, Stantec reviewed data for the previous four-year period (2013-2016) as well as preliminary 2017 data. In addition, Stantec reviewed data from competing toll and toll-free facilities to determine recent regional traffic trends. The estimates for the remainder of 2017 assume that the base traffic levels at TBTA facilities for the remaining months of calendar year 2017 will be 1.2 percent greater than volumes in the same months of 2016. The forecast percent changes are shown in Table 23. Traffic volumes in January through February 2017 increased at seven of the facilities when compared to the same months in 2016. However, volumes decreased at the Queens Midtown Tunnel and the Hugh L. Carey Tunnel. This is likely due to the activation of ORT at these two facilities in January 2017 which led to some traffic loss.
HISTORY AND PROJECTION OF TRAFFIC, TOLL REVENUES AND EXPENSES AND REVIEW OF PHYSICAL CONDITIONS OF THE FACILITIES OF TRIBOROUGH BRIDGE AND TUNNEL AUTHORITY
67
Table 23 Estimated Changes in Annual Traffic, 2016 to 2017
Facility
Actual Percent Change
January - February 2016 to 2017
Estimated Percent Change
March - December 2016 to 2017
Projected Percent Change
Full Year 2017
Throgs Neck Bridge 1.7% 1.5% 1.6%
Bronx-Whitestone Bridge 4.6% 2.0% 2.4%
RFK Bridge 1.6% 1.3% 1.3%
Queens Midtown Tunnel -13.0% -2.7% -4.3%
Hugh L. Carey Tunnel -2.0% 0.3% 0.0%
Verrazano-Narrows Bridge 3.4% 1.5% 1.8%
Henry Hudson Bridge 3.9% 2.0% 2.3%
Marine Parkway-Gil Hodges Memorial Bridge 0.2% 1.7% 1.5%
Cross Bay Veterans Memorial Bridge 2.4% 1.7% 1.8%
Total 1.0% 1.2% 1.1% Notes: (a) Based on preliminary actual data, subject to final audit.
As shown in Table 23, total 2017 traffic at the crossings is forecasted to increase at an average rate of 1.1 percent for the year, which is the result of an actual 1.0 percent gain in January and February and net systemwide growth of 1.2 percent from March through December. With the exception of the Queens Midtown Tunnel and the Hugh L. Carey Tunnel, traffic is estimated to increase at all facilities stemming largely from continued modest economic recovery, significant construction activity around the City, and sustained lower gasoline prices. These factors more than offset the negative impacts of the March 2017 toll increase. The resulting traffic and toll revenue estimates for 2017 are presented in Table 24. Estimated toll revenue for 2017 is based on average toll rates developed from the toll schedule in effect as of the March 19, 2017 toll increase and the projected vehicle class distribution and payment method for 2016 and 2017.
HISTORY AND PROJECTION OF TRAFFIC, TOLL REVENUES AND EXPENSES AND REVIEW OF PHYSICAL CONDITIONS OF THE FACILITIES OF TRIBOROUGH BRIDGE AND TUNNEL AUTHORITY
68
Table 24 Estimated 2017 Toll-Paying Traffic and Toll Revenue
Facility Traffic (000s)
Average Toll
Revenue (000s)
Throgs Neck Bridge 43,920 $8.02 $352,055
Bronx-Whitestone Bridge 46,909 $7.22 $338,905
RFK Bridge 63,744 $7.00 $446,296
Queens Midtown Tunnel 25,658 $6.47 $166,122
Hugh L. Carey Tunnel 17,956 $6.17 $110,765
Verrazano-Narrows Bridge(a) 71,009 $5.78 $410,316
Henry Hudson Bridge 25,186 $3.27 $82,309
Marine Parkway-Gil Hodges Memorial Bridge 8,022 $2.20 $17,688
Cross Bay Veterans Memorial Bridge 8,449 $2.23 $18,815
Total 310,855 $6.25 $1,943,270
Percent Change
2016-2017 (All Facilities) 1.1% 2.7% 3.9%
Notes: (a) Westbound traffic doubled, since traffic is not registered in the eastbound direction.
Summarizing, our estimates show a 1.1 percent increase in traffic, a 2.7 percent increase in the systemwide average toll, and a 3.9 percent increase in systemwide revenue over 2016, which reflects actual performance through February 2017 and anticipated traffic volumes for the remainder of the year. Table 24 provides the transition between the historical traffic and revenue data presented earlier in the report and the 10-year forecasts in Table 25 and Table 26.
Traffic and Toll Revenue at Current Tolls
Traffic and toll revenues were first projected on the basis that the tolls placed into effect on March 19, 2017 will be continued throughout the forecast period. The methodology employed by Stantec to forecast traffic was based on the development of an annual growth rate for each facility (based on historical traffic trends), the construction activities (historical and projected) throughout the highway network (bridges, tunnels and arterials), and the traffic capacity constraints in the network. Regional demographic projections were also taken into consideration.
All indicators point to the potential for traffic growth in the short-term, reflecting improved economic conditions, buoyed by the sustained low cost of motor fuel. An additional factor affecting growth is the potential capacity constraints in the regional transportation network due to construction projects.
The 2017 estimated traffic and revenue from Table 24 includes the impacts of the March 2017 toll increase. Starting with the estimate for 2017 as a base, Stantec projected the traffic and toll revenue for the forecast period through 2027 (at constant tolls at the current rates established on March 19, 2017), as shown in Table 25.
HISTORY AND PROJECTION OF TRAFFIC, TOLL REVENUES AND EXPENSES AND REVIEW OF PHYSICAL CONDITIONS OF THE FACILITIES OF TRIBOROUGH BRIDGE AND TUNNEL AUTHORITY
69
Changes in traffic volumes are in the range of -4.3 to +2.4 percent in 2017 depending on the facility. As previously discussed, this is based on the actual change in traffic on each facility in January and February 2017 and Stantec’s projections by facility for the March through December period. For 2018, traffic is projected to increase at 1.2 percent systemwide, with growth rates varying by facility. For 2019, traffic is projected to increase at 1.1 percent annually, with growth rates varying by facility. For 2020 through 2027, Stantec assumes a long term growth rate of 0.25 percent to approximate the trendline background growth rate accounting for changes in population, employment and other economic factors. Over the forecast period the economy is assumed to be cyclical and thus will both grow and contract in certain periods; this trendline growth assumption accounts for the overall growth pattern through these cycles. Impacts associated with a general increase in E-ZPass and toll increases are computed separately. The exception to this is the growth of the Queens Midtown Tunnel which will be in a traffic recovery phase through 2022 after the completion of Superstorm Sandy restoration work in 2018.
Traffic and Toll Revenue with Assumed 2019 Toll Increase
The traffic forecast with a toll increase in 2019 was built upon the base forecast (from Table 25), to which the elasticity impacts (from Table 21) were applied. In accordance with the 2017-2020 MTA Financial Plan, Stantec applied the appropriate projected future increase in toll rates (from Table 22) effective March 1, 2019 (a 4 percent toll increase) to calculate the corresponding toll revenues. The traffic and revenue forecasts with the planned toll increase in 2019 are listed in Table 26.
HISTORY AND PROJECTION OF TRAFFIC, TOLL REVENUES AND EXPENSES AND REVIEW OF PHYSICAL CONDITIONS OF THE FACILITIES OF TRIBOROUGH BRIDGE AND TUNNEL AUTHORITY
70
Table 25 Traffic and Toll Revenue Forecast, Constant Tolls
Note: (a) Westbound traffic doubled, since traffic is not registered in the eastbound direction.
HISTORY AND PROJECTION OF TRAFFIC, TOLL REVENUES AND EXPENSES AND REVIEW OF PHYSICAL CONDITIONS OF THE FACILITIES OF TRIBOROUGH BRIDGE AND TUNNEL AUTHORITY
71
Table 26 Traffic and Toll Revenue Forecast with Assumed 2019 Toll Increase
Note: (a) Westbound traffic doubled, since traffic is not registered in the eastbound direction.
HISTORY AND PROJECTION OF TRAFFIC, TOLL REVENUES AND EXPENSES AND REVIEW OF PHYSICAL CONDITIONS OF THE FACILITIES OF TRIBOROUGH BRIDGE AND TUNNEL AUTHORITY
72
Effects of Second Avenue Subway Construction in Forecast Years
The foregoing tables forecasting traffic and toll revenues incorporate estimated effects of the construction of the Second Avenue Subway. While not likely, activity associated with such construction could result in changes to traffic patterns, possibly resulting in a shift of traffic volumes to other TBTA facilities, as well as the toll-free East River Bridges or a diversion to mass transit. Such changes in traffic patterns could have an adverse effect on the forecasts set forth in Table 25 and Table 26 as described in the following paragraph.
Various stages of the project will result in visible construction activity on segments of Second Avenue at any given time. In addition, tunnel construction, either through the use of a tunnel boring machine or cut-and-cover, will affect vehicular activity not only on Second Avenue, but also on adjacent avenues and streets. During the first phase of the project (between 96th Street and 63rd Street), four lanes were maintained on Second Avenue and, no impacts were discernable at the RFK Bridge.
Effects of Open Road Tolling (ORT) in Forecast Years
The foregoing tables forecasting traffic and toll revenues incorporate estimated effects of the implementation of ORT at each of the TBTA facilities. It is likely that there will be some impacts to traffic associated to the implementation of ORT and those impacts would, to a lesser extent, mimic those experienced after a toll increase. In general, the implementation of ORT is projected to result in minimal impacts to traffic and revenue at the facilities.
Stantec’s forecast assumed that the conversion to ORT would result in several changes to traffic, which include, but are not limited to: (1) non-toll traffic diverting to ORT facilities due to the elimination of queuing and increases in travel speeds at the toll plazas, (2) tolled traffic diverting to alternate toll-free routes or to mass transit due to a preference to pay cash tolls in lieu of paying tolls by mail, (3) changes in payment type among tolled traffic (shifts to/from cash and TBM).
Our forecast reflects a minimal adjustment to revenues, primarily due to lower overall average tolls. As ORT is implemented, there will be a slight uptick in E-ZPass usage, which will be similar to the increases recently experienced at the Queens Midtown and Hugh L Carey Tunnels (a 3 percentage point increase in E-ZPass based on preliminary January 2017 and February 2017 data). For purposes of our forecast, consistent with current TBTA practices, it was assumed that revenues associated with TBM transactions will be accounted for within the month that the transaction takes place. A liability on the balance sheet will be created to offset the toll revenue associated with TBM revenues and this liability will decrease as tolls are collected. Therefore, there is no delay in revenue collection assumed in our forecast due to the implementation of ORT.
Operating Expenses
The projection of operating expenses for 2017 through 2027 is shown in Table 27. Total operating expenses, consisting of labor and non-labor, are estimated to increase from $552.8 million in 2017 to $877.0 million in 2027. Labor expenses consist of wages, salaries, overtime and fringe benefits.
HISTORY AND PROJECTION OF TRAFFIC, TOLL REVENUES AND EXPENSES AND REVIEW OF PHYSICAL CONDITIONS OF THE FACILITIES OF TRIBOROUGH BRIDGE AND TUNNEL AUTHORITY
73
Non-labor expenses include items such as maintenance, revenue management, supplies, utilities and other expenses. The table includes operating expenses budgeted by TBTA for 2017, operating expenses projected by TBTA through 2020 and Stantec’s projections of operating expenses from 2021 through 2027.
In 2017, expenses have been budgeted by TBTA at $552.8 million, an increase of 18.9 percent over 2016 expenses of $464.9 million. These expenses are split into the following categories: labor expenses of $273.5 million (an increase of 12.3 percent over 2016) and non-labor expenses of $279.4 million (an increase of 26.2 percent over 2016). Labor expenses are higher primarily due to the filling of 2016 vacancies, contractual payroll adjustments, and inflationary increases to fringe benefits. The major factors behind growth in non-labor expenses are anticipated implementation and back-office costs associated with ORT, increases in major maintenance, including bridge painting projects that will not be eligible for capital funding, higher credit card fees resulting from the toll increase implemented in March 2017, and inflationary adjustments.
TBTA's projection for 2018 baseline expense growth is around 2% but the back-office expenses for a full year of ORT at all facilities pushes year-to-year growth up to around 10%. Thereafter, TBTA's expense growth estimates generally reflect inflationary assumptions of 2% to 2.5% each year through 2020. For 2021 through 2027, Stantec projected that labor expenses would increase at a rate of 4 percent annually while non-labor expenses would increase at a rate of 5 percent per year.
Stantec does not project any variation in operating expenses resulting from the reduced traffic levels brought about by periodic toll increases.
Table 27 Projected Operating Expenses
(000s) Year Labor(a) Non-Labor(b) Total(c)
2017(d) $273,483 $279,363 $552,846
2018(d) 279,309 332,054 611,363
2019(d) 289,432 339,144 628,576
2020(d) 292,152 350,075 642,227
2021 303,838 367,579 671,417
2022 315,992 385,958 701,949
2023 328,631 405,256 733,887
2024 341,777 425,518 767,295
2025 355,448 446,794 802,242
2026 369,665 469,134 838,799
2027 384,452 492,591 877,043 Notes: (a) Salaries, overtime and fringe benefits, net of capital reimbursement. (b) Non-labor includes the following categories: maintenance and supplies,
outside services, insurance, power, leases, rentals and other expenses. (c) Totals may not add due to rounding. (d) Budgeted by TBTA for 2017 and from TBTA estimates for 2018-2020.
HISTORY AND PROJECTION OF TRAFFIC, TOLL REVENUES AND EXPENSES AND REVIEW OF PHYSICAL CONDITIONS OF THE FACILITIES OF TRIBOROUGH BRIDGE AND TUNNEL AUTHORITY
74
Net Revenues from Toll Operations
Finally, the projected operating expenses were deducted from the respective toll revenue forecasts to produce the two sets of estimated net toll revenues (before debt service on outstanding TBTA obligations), one at constant tolls and the other with a toll increase in 2019, as shown in Table 28. For 2017, net toll revenue under either scenario is estimated at $1.4 billion. By 2027, annual net toll revenue is estimated to be between $1.17 to 1.24 billion, depending on the number of toll increases included in the forecast.
The facilities under TBTA’s jurisdiction include two tunnels and seven bridges listed in Table 29, together with facilities on Randall’s Island and a parking garage in Manhattan near the Hugh L. Carey Tunnel. Some of these crossings have been in service since the 1930s, i.e., the RFK, Henry Hudson, Marine Parkway-Gil Hodges Memorial, and Bronx-Whitestone Bridges. The Queens Midtown Tunnel opened to traffic in 1940. The Hugh L. Carey Tunnel opened to traffic in 1950. Two bridges opened to traffic in the 1960s: the Throgs Neck in 1961 and the Verrazano-Narrows in 1964 (lower level in 1969). The present Cross Bay Veterans Memorial Bridge opened to traffic in 1970 replacing the previous structure that had been in service since 1939. The aging of the TBTA facilities will influence the overall upkeep and capital improvements that will be necessary to maintain the infrastructure over the forecast period and beyond. Table 30 lists TBTA’s capital investments for each facility between 1992 and 2016, and within 2016 itself.
HISTORY AND PROJECTION OF TRAFFIC, TOLL REVENUES AND EXPENSES AND REVIEW OF PHYSICAL CONDITIONS OF THE FACILITIES OF TRIBOROUGH BRIDGE AND TUNNEL AUTHORITY
75
Table 29 Opening Dates of TBTA Facilities
Facility Open to Traffic Years in Use
RFK Bridge 1936 81
Bronx-Whitestone Bridge 1939 78
Throgs Neck Bridge 1961 56
Henry Hudson Bridge 1936 81
Queens Midtown Tunnel 1940 77
Hugh L. Carey Tunnel 1950 67
Verrazano-Narrows Bridge 1964 53
Cross Bay Veterans Memorial Bridge 1970 47
Marine Parkway-Gil Hodges Memorial Bridge 1937 80
Stantec reviewed material pertaining to the physical condition of TBTA’s seven bridges and two tunnels. The material reviewed includes pertinent sections and updates of the following:
• TBTA’s Capital Investments at each facility during the year 2016; • Ongoing Rehabilitation & Maintenance Projects; • Post-Superstorm Sandy Inspection Reports; • Biennial Bridge Inspection Reports; • Tunnel Inspection Reports; • Rehabilitation Projects addressing recommendations on previous inspection reports; and • Repairs to alleviate flagged conditions on previous inspection reports.
Table 30 Capital Investments by Facility, 1992 through 2016 (Millions of dollars – Includes Sandy Capital Investments)
Facility Total by Facility 1992 through 2016(a)
Bronx-Whitestone Bridge $ 834.5
Cross Bay Veterans Memorial Bridge 116.3 Henry Hudson Bridge 305.9 Marine Parkway-Gil Hodges Memorial Bridge 311 RFK Bridge 1605.6 Throgs Neck Bridge 508.2 Verrazano-Narrows Bridge 953.3 Hugh L. Carey Tunnel 977.8 Queens Midtown Tunnel 689.9
Agency Wide(b) 596.8
Total $ 6,899.3
Notes: (a) Data from TBTA. (b) Agency-wide refers to projects that have been, or will be, carried
out at two or more facilities.
HISTORY AND PROJECTION OF TRAFFIC, TOLL REVENUES AND EXPENSES AND REVIEW OF PHYSICAL CONDITIONS OF THE FACILITIES OF TRIBOROUGH BRIDGE AND TUNNEL AUTHORITY
76
Post-Superstorm Sandy Reports, Capital Investments and Rehabilitation
On October 29th 2012, Superstorm Sandy struck the East Coast of the United States, including the New York Metropolitan Area. In response to this, the TBTA initiated a post-event assessment of all TBTA bridges and tunnels. This assessment was to assure that bridge/tunnel elements identified as vulnerable/susceptible to a major flooding or wind event did not sustain any damage, or that any noted damage was not detrimental to the safe operation of the bridge/tunnel. These inspections and assessments were performed by experienced bridge/structural engineers and inspectors familiar with the structures. The bridges experienced sustained winds of 70 mph with gusts of up to 103 mph. In advance of the major impact of the storm and as a safety precaution due to the wind velocity, all bridges and tunnels were closed to all vehicular traffic.
When the Post-Superstorm Sandy inspections were finalized, it was found that no significant damages were caused by Superstorm Sandy at any of the bridges; however, some of the ancillary facilities of the Rockaway crossings (Cross Bay Veterans Memorial Bridge and Marine Parkway-Gil Hodges Memorial Bridge) sustained damage. TBTA’s bridges reopened the day after the storm (except the Marine Parkway-Gil Hodges Bridge which reopened October 31st). TBTA’s two tunnels sustained structural, electrical and mechanical damage due to substantial flooding. TBTA engineering and maintenance staff worked with outside contractors to reopen the tunnels in a relatively short period of time.
Inspection Reports, Flagged4 Conditions and Rehabilitation Projects
The review by Stantec of the pertinent material consists of the following subtasks:
• Comparison of condition ratings of the current inspection reports with the previous inspection reports to note significant changes in observed deterioration, and repairs to priority conditions from previous inspections, if any.
• Review of the current TBTA Capital Program to verify that the repairs recommended by the latest inspection reports are being addressed.
• Review of TBTA’s Routine Maintenance Program to verify that the maintenance-related recommendations of the current inspection reports are being addressed.
TBTA’s seven bridges and two tunnel facilities undergo periodic condition inspections. Bridges are inspected biennially per federal and State mandate, with interim yearly inspections of any components that require monitoring. The purpose of the biennial inspection program is to maintain the safety and structural integrity of bridges. TBTA’s Bridge Inspection Program was 4 The New York State Bridge Inspection Manual defines the following "flags" for reporting purposes: Red Flag – A structural flag that is used to report the failure or potential failure of a primary structural component that is likely to occur within two years from the current inspection. Red Flag PIA (Prompt Interim Action) – A designation that is made when a Red Flag condition is considered extremely serious and in need of immediate attention. This designation requires appropriate action by the responsible party within twenty-four hours. Yellow Flag - A structural flag that is used to report a potentially hazardous structural condition which if left unattended could become a clear and present danger within two years from the current inspection, or the actual or imminent failure of a non-critical structural component, where such failure may reduce the reserve capacity or redundancy of the bridge, but would not result in a structural collapse. Safety Flag – A flag that is used to report a condition presenting a clear and present danger to vehicular or pedestrian traffic, but poses no danger of structural failure or collapse. Safety Flags can be issued on closed bridges where conditions present a threat to vehicular or pedestrian traffic underneath the structure or in the immediate vicinity. Safety Flag PIA (Prompt Interim Action) – A designation that is made when a Safety Flag condition is considered extremely serious and in need of immediate attention. This designation requires appropriate action by the responsible party within twenty-four hours.
HISTORY AND PROJECTION OF TRAFFIC, TOLL REVENUES AND EXPENSES AND REVIEW OF PHYSICAL CONDITIONS OF THE FACILITIES OF TRIBOROUGH BRIDGE AND TUNNEL AUTHORITY
77
assessed from 2006 to 2007 by an independent engineering firm well known in the field of structural inspection and appraisal, which noted that “the program is meeting the minimum State and federal standards” and “in several respects the program exceeds the minimum standards” and “with respect to the accuracy, clarity, and thoroughness of the reports generated, we find them to be of the highest quality.”
TBTA has been inspecting its two tunnels on an ongoing basis as per the agency-established Tunnel Inspection procedure, which is already in general compliance with the new FHWA National Tunnel Inspection Standards (NTIS) that became effective on August 13, 2015. The new NTIS will foster a more uniform approach to tunnel inspections, similar to the bridge inspection program. TBTA has awarded a contract to a qualified consulting engineering firm, Gannett Fleming, to conduct the mandated Initial Tunnel Inspection and National Tunnel Inventory by August 13, 2017. Inspection of the tunnels is on-going. Both tunnels are currently undergoing comprehensive rehabilitation mainly driven by Superstorm Sandy damage and state of good repair needs. In addition, TBTA has dedicated engineering, maintenance and operation staff located at the tunnel facilities who continuously monitor and evaluate tunnel conditions and help ensure the tunnels remain in safe condition and continue to provide reliable levels of service at all times. A comprehensive inspection of the Queens Midtown Tunnel was performed from April 2013 through June 2015 by URS. Post-Sandy monitoring inspections continue to be performed at the Hugh L. Carey Tunnel by Mott-MacDonald and at the Queens-Midtown Tunnel by URS (now part of AECOM).
The TBTA bridges were last inspected and their physical condition appraised in 2015-2016 by various consultants, under the New York State Biennial Bridge Inspection Program, as shown in Table 31. Separate underwater and substructure inspections were performed in accordance with the five-year cycles of NYSDOT to obtain riverbed contours and to assess potential scour conditions at the substructure.
These ongoing inspections, performed by the inspection consultants, consist of close visual exami-nation, 100% hands-on inspection of designated critical elements, sounding concrete, and taking appropriate measurements to determine the physical conditions of the bridges and tunnels. The 2015 biennial bridge inspections were performed per the guidelines of the 2014 New York State Bridge Inspection Manual and the Federal Guidelines. The 2016 biennial bridge inspections were performed in accordance with the updated 2016 New York State Bridge Inspection Manual and the new Federal Highway Administration AASHTO Manual Guidelines. Under these guidelines, each bridge component is inspected and assigned a rating. Any priority conditions are reported immediately to the TBTA for prompt attention. The ratings are reviewed by TBTA personnel to assess what components of the bridge require more comprehensive inspection and rehabilitation, which are then awarded as contracts under the Capital and Maintenance Programs. Bridge components which warrant more frequent monitoring to ensure public safety are monitored annually with a special inspection.
After performing a comparison of the individual overall ratings of the current inspection reports against the previous inspection reports, it was noted that there has been no significant change in the overall ratings and the bridges remain in good condition.
HISTORY AND PROJECTION OF TRAFFIC, TOLL REVENUES AND EXPENSES AND REVIEW OF PHYSICAL CONDITIONS OF THE FACILITIES OF TRIBOROUGH BRIDGE AND TUNNEL AUTHORITY
78
TBTA has an ongoing seismic retrofit program to identify and implement necessary seismic retrofits in order to bring critical facilities to current seismic code standards. This program has made substantial progress in identifying necessary seismic upgrades and incorporating them into various Capital facility rehabilitation design and construction projects when applicable. This effort will continue in the current 2015-2019 Capital Program.
The consulting engineering firms who performed the 2015 and 2016 biennial bridge inspections and the 2015/2016 tunnel inspections for each facility are shown in Table 31.
Table 31 Facility Inspection Firms
Facility Consulting Firm (Inspection Year)
RFK Bridge WSP / Hardesty & Hanover (2016)
Throgs Neck Bridge HAKS (2015)
Bronx-Whitestone Bridge Ammann & Whitney (2015)
Henry Hudson Bridge Hardesty & Hanover (2015)
Queens Midtown Tunnel URS (Now part of AECOM)/AECOM (2015)
Marine Parkway-Gil Hodges Memorial Bridge WSP (2015)
Cross Bay Veterans Memorial Bridge WSP (2015)
These firms are well known in the field of structural inspection and appraisal. Copies of pertinent sections of the final inspection reports for the various facilities were requested and made available by TBTA. Bridges that are part of the odd-year inspection cycle listed above will be undergoing inspections this summer, however, the 2016 interim inspection data is available for review, as well as the 2015 Biennial Inspection data. The results of the 2017 inspections, also done by experts in the field, will generally be available at the end of the year.
Funds currently programmed for TBTA’s 2015-2019 Capital Program are summarized in Table 32. The plan, which totals $2.856 billion, separates this amount into specific projects by facility as well as agency-wide projects. Comparisons between the 2015-2019 Capital Program planned projects and total repair item lists for each facility, as prepared by inspection consultants in the biennial reports, confirm that the 2015-2019 Capital Program gives high priority to key rehabilitation projects. By prioritizing necessary facility rehabilitation projects, TBTA addresses all high priority recommendations in the current 2015-2019 Capital Program or under maintenance programs that have not been addressed as part of the previous 2010-2014 Capital Program. All of these high priority needs will continue to be met.
HISTORY AND PROJECTION OF TRAFFIC, TOLL REVENUES AND EXPENSES AND REVIEW OF PHYSICAL CONDITIONS OF THE FACILITIES OF TRIBOROUGH BRIDGE AND TUNNEL AUTHORITY
79
Table 32 TBTA 2015-2019 Capital Program by Facility ($ in millions)(a)
Facility 2015-2019 Percent
Bronx-Whitestone Bridge (BWB) 137 4%
Henry Hudson Bridge (HHB) 243 9%
Hugh L. Carey Tunnel (HCT) 116 4%
Queens Midtown Tunnel (QMT) 64 2%
Robert F. Kennedy Bridge (RFK) 747 26%
Rockaway Crossings (Cross Bay and Marine Parkway Bridges) 56 2%
Throgs Neck Bridge (TNB) 578 20%
Verrazano-Narrows Bridge (VNB) 530 19%
Agency Wide 385 14%
Total 2,856 100%
Notes: (a) The table above has not been updated to reflect the redistribution among facilities
due to the inclusion of the New York Crossings Project ($501M). The proposed revised capital plan which includes the NY Crossings Project has not yet been approved by MTA Board.
Bronx-Whitestone Bridge (BWB)
The next biennial inspection of the BWB will occur in 2017 and is on schedule. Of the 25 yellow flags issued in the 2015 biennial inspection, 23 have been repaired and 2 remain active. During the 2016 Special In-Lieu of Interim Inspection, 1 new yellow flag was issued resulting in 3 active yellow flags on the bridge. Of the 7 safety flags issued in the 2015 biennial inspection, 5 have been repaired and 2 have been re-classified as corrective maintenance repairs (CMR); there are no active safety flags.
Projects in the 2015-2019 Capital Program (or ongoing from 2010-2014 Capital Program) at the BWB:
• Fender Protection Around Tower Piers – Design-Build award scheduled for 2018. • Miscellaneous Structural Rehabilitation – Construction was awarded in late 2015. It is an on-
going project and is projected to be complete in 2018. • Installation of Necklace Lighting System and Acoustic Monitoring of Main Cables –
Construction was awarded in July 2013 and is substantially complete. • Continued Cable Investigation/Monitoring – The design contract was awarded in September
2013 with the associated construction contract awarded in late 2015. Project is on-going and is projected to be complete in 2018.
• Installation of Facility-wide Electronic Monitoring and Detection Systems – Design-Build award is scheduled for 2017.
• Installation of Fire Standpipe Connection from Tower Pedestals to Roadway Level – Design-Build award scheduled for 2018.
HISTORY AND PROJECTION OF TRAFFIC, TOLL REVENUES AND EXPENSES AND REVIEW OF PHYSICAL CONDITIONS OF THE FACILITIES OF TRIBOROUGH BRIDGE AND TUNNEL AUTHORITY
80
Henry Hudson Bridge (HHB)
The next biennial inspection of the HHB will occur in 2017. There are no active structural or safety flags on the bridge.
Projects in the 2015-2019 Capital Program (or ongoing from 2010-2014 Capital Program) at the HHB:
• Skewbacks Retrofit – Design-build award scheduled for 2017. • Replacement of the Upper and Lower Plaza and Southbound Approach – The design contract
was awarded in January 2013. Phase I construction contract was awarded in December 2014 and was substantially complete in 2016. Phase II construction award is scheduled for 2017.
• Structural Rehabilitation Consisting of High Priority Structural Steel Repairs – Phase I is complete and Phase II construction award is scheduled for 2019.
• Replacement of Overcoat System – Construction award is scheduled for 2019. • Replacement of Facility Lighting System construction is scheduled for 2017.
Hugh L. Carey Tunnel (HCT)
Based on the 2016 interim monitoring inspections of the HCT, one safety flag was issued and has been addressed.
Projects in the 2015-2019 Capital Program (or ongoing from 2010-2014 Capital Program and Sandy Program) at the HCT:
• Service Building Alterations – The construction contract was awarded in 2014 and was substantially complete in 2016.
• Rehabilitation of the Tunnel Walls, Roadway Drainage, Firelines, Superstorm Sandy Restoration, and Repair/Replacement of Brooklyn Plaza Structural Slab – The construction contract was awarded in 2014. It is an on-going project and is projected to be complete in 2018.
• Rehabilitation of HCT Ventilation Systems – Design-Build award scheduled for 2018. • Rehabilitation of the Ventilation Buildings (Design Only) – Design award scheduled for 2018. • Electrical Rehabilitation at the Brooklyn Service Building – Design-Build award scheduled for
2018. • Install Smoke Detection/Alarm Systems - Design-Build award scheduled for 2018.
Queens-Midtown Tunnel (QMT)
The 2016 Interim Monitoring Inspection for the QMT, appurtenant structures, and ancillary overpasses revealed no significant changes in condition.
Projects in the 2015-2019 Capital Program (or ongoing from 2010-2014 Capital Program and Sandy Program) at the QMT:
• Service and FE Building Rehabilitation – Construction contract was awarded in 2014 and was substantially complete in 2016.
HISTORY AND PROJECTION OF TRAFFIC, TOLL REVENUES AND EXPENSES AND REVIEW OF PHYSICAL CONDITIONS OF THE FACILITIES OF TRIBOROUGH BRIDGE AND TUNNEL AUTHORITY
81
• Rehabilitation of the Tunnel Walls, Roadway Drainage, Firelines, Superstorm Sandy Restoration, and rehabilitation of Manhattan Exit Plaza – The construction contract was awarded in 2015. It is an on-going project and is projected to be complete in 2018.
• Tunnel Ventilation Building Electrical Upgrade – The construction contract was awarded in 2012. It is an ongoing project and is projected to be complete in 2018.
• Rehabilitation of Tunnel Controls and Communication Systems – Design-Build award is scheduled for 2018.
• Rehabilitation of the Ventilation Buildings. (Design Only) – Design award is scheduled for 2018. • Installation of facility-wide smoke detections systems – Design-Build award is scheduled for
2018.
Robert F. Kennedy Bridge (RFK)
The Biennial Inspection was performed at the RFK in 2016. Out of a total of 200 flags recorded under this facility, 2 out of 2 red flags were inactivated. Out of the 156 previously issued yellow flags in 2015, 7 have been repaired. Forty-one new yellow flags have been issued resulting in a combined 190 active yellow flags. One safety flag was issued and repaired.
Projects in the 2015-2019 Capital Program (or ongoing from 2010-2014 Capital Program) at the RFK:
• Study and Monitoring for the Rehabilitation of the Queens Anchorage – The study was awarded in 2016 and is projected to be complete in 2020.
• Monitoring, Inspection, and Testing of the RFK Queens Suspension Bridge Main Cables and Cable Wires – The contract is projected to be awarded in 2019 and completed in 2021.
• Miscellaneous Structural Repair – The construction contract was awarded in December 2014 and was substantially complete in 2016. An additional miscellaneous structural repair contract is included in the 2015-2019 Capital Program.
• Reconstruction and Rehabilitation of the Manhattan Approach Ramps – Construction contract was awarded in 2014. It is an on-going project and it is projected to be complete in 2017.
• Seismic and Wind Load Study – The study was awarded in December 2012 and completed in 2015. Design award is scheduled for 2017. Phase I construction (retrofit on the suspended spans) is scheduled for award in 2019.
• Construction of New Harlem River Drive Ramp – Design-Build award is scheduled for 2019. • Bronx Toll Plaza Structure Reconstruction – The construction contract was awarded in 2014. It
is an on-going project and is projected to be complete in 2018. • Interim Repairs to the Manhattan Toll Plaza Structure – Phase I construction was substantially
complete in 2016. Phase II construction was awarded in 2016. • Installation of Facility-wide Electronic Monitoring and Detection Systems – Design-Build award
is scheduled for 2017. • Installation of Fire Standpipe and Upgrade of Fire Protection Systems – Design-Build award is
scheduled for 2017. • Electrical/Mechanical Rehabilitation of Harlem River Lift Span – Design-Build award is
scheduled for 2017.
HISTORY AND PROJECTION OF TRAFFIC, TOLL REVENUES AND EXPENSES AND REVIEW OF PHYSICAL CONDITIONS OF THE FACILITIES OF TRIBOROUGH BRIDGE AND TUNNEL AUTHORITY
82
• Construction of the Training Facility – Design-Build project was awarded in June 2014 and was substantially complete in 2016.
Throgs Neck Bridge Bridge (TNB)
The next biennial inspection of the TNB will occur in 2017. Out of the 99 yellow flags which remained active from the 2015 biennial inspection, 1 has been re-classified as a red flag which has subsequently been removed and 98 remain active. During the 2016 Special In-Lieu of Interim Inspection, 4 PIA red flags and 7 red flags were issued and subsequently removed or inactivated, and 5 yellow flags were issued and remain active. Out of the 18 safety flags issued prior to the 2016 Special In-Lieu of Interim Inspection, all have been removed; there are no active safety flags.
Projects in the 2015-2019 Capital Program (or ongoing from 2010-2014 Capital Program) at the TNB:
• Anchorage Dehumidification – The construction contract was awarded in 2015. It is an on-going project and is projected to be complete in 2018.
• Approach Viaducts Seismic Retrofit & Structural Rehabilitation – Design was awarded in 2016 with construction award scheduled for 2018.
• Replacement of Grid Decks on Suspended Span and Painting on Suspended Span – Construction award is scheduled for 2018.
• Anchorage and Tower Protection (Design Only) – Design award is scheduled for 2018. • Study for Bronx-Queens Viaduct Replacement – Study award is scheduled for 2017.
Verrazano Narrows Bridge (VNB)
The 2016 Biennial Inspection was performed at the VNB. Three previously issued yellow flags have been re-issued in 2016 and 23 new yellow flags were found. Out of a total of 26 flags recorded under this facility, 14 yellow flags have been removed and 12 yellow flags remain active.
Projects in the 2015-2019 Capital Program (or ongoing from 2010-2014 Capital Program) at the VNB:
• Main Cable and Suspender Rope Testing Phase I – The scoping/ preliminary design contract was awarded in 2014 with the associated design-build contract for cable openings scheduled to be awarded in 2017.
• Steel Repairs, Concrete Rehabilitation and Repair/Rehabilitation of Drainage Systems – The construction contract was awarded in 2013. It is an ongoing project and is projected to be complete in 2017.
• Rehabilitation of the Brooklyn Ramps – The feasibility study and conceptual design for the reconstruction and reconfiguration of the ramps and approaches was awarded in 2013. Design award for Phase I – Replacement of Upper Level Elevated Approach and Anchorage Decks was awarded in 2016, with construction for Phase I scheduled for 2019.
• Replacement of the Upper Level Suspended Span Deck – The construction contract was awarded in 2012. It is an ongoing project and is projected to be complete in 2017.
HISTORY AND PROJECTION OF TRAFFIC, TOLL REVENUES AND EXPENSES AND REVIEW OF PHYSICAL CONDITIONS OF THE FACILITIES OF TRIBOROUGH BRIDGE AND TUNNEL AUTHORITY
83
• Bus and HOV Ramp Improvement – The construction contract was awarded in 2013. It is an ongoing project and is projected to be complete in 2017.
• Substation #1 Rehabilitation – The design-build contract was awarded in 2014 and was substantially complete in 2016.
• Anchorage & Piers Rehabilitation and Sealing – Construction award is scheduled for 2018. • Steel and Concrete Rehabilitation – Construction award is scheduled for 2019. • Tower Pedestal Rehabilitation/Mooring Platform – Design-Build award is scheduled for 2018.
Marine Parkway Bridge (MPB)
The next biennial inspection of the MPB will occur in 2017. Prior to the 2016 Special In-Lieu of Interim Inspection, one previously issued red flag was temporarily repaired and inactivated. The 5 previously issued yellow flags on the bridge remain active.
Projects in the 2015-2019 Capital Program (or ongoing from 2010-2014 Capital Program) at the MPB:
• Electrical and Mechanical Rehabilitation – Phase I Design-Build Contract was awarded in 2015. It is an on-going project and is projected to be complete 2018. Phase II construction contract was awarded in 2015. It is an on-going project and is projected to be complete in 2018.
• Miscellaneous Steel Repairs – Construction contract award was awarded in 2015. It is an on-going project and is projected to be complete in 2018.
• Rehabilitation and Painting of the Rockaway Point Boulevard overpass and the Jacob Riis Park Pedestrian Bridge – The Design-Build contract was awarded in 2015 and was substantially complete in 2016.
Cross Bay Bridge (CBB)
The next biennial inspection of the CBB will occur in 2017. During the 2016 Special In-Lieu of Interim Inspection, one yellow flag was issued and remains active.
Projects in the 2015-2019 Capital Program (or ongoing from 2010-2014 Capital Program) at the CBB:
• Rehabilitation of Pier Fender System at the MPB and CBB – Design-build award scheduled for 2018.
• Replace Mechanical and Electrical Equipment – Design-Build Contract was awarded in 2015 and is scheduled for completion in 2018.
• Rehabilitation/Reconstruction of Rockaway Crossings – Scoping study is underway and is projected to be complete in 2017.
Other Systemwide Improvements
Agency-Wide (AW) – Since the September 11th attack on the World Trade Center, TBTA has engaged consultants to assess security risks of their facilities. As a result of these risk assessments,
HISTORY AND PROJECTION OF TRAFFIC, TOLL REVENUES AND EXPENSES AND REVIEW OF PHYSICAL CONDITIONS OF THE FACILITIES OF TRIBOROUGH BRIDGE AND TUNNEL AUTHORITY
84
increased security improvements including various monitoring, surveillance and hardening projects have been implemented or will begin construction shortly at TBTA facilities. Video surveillance software and hardware upgrades have been installed at many facilities. TBTA has also maintained a security department and incorporates mitigation measures into their operations, capital and maintenance programs.
AW Projects in the 2015-2019 Capital Program:
Strategic Initiatives - This project will encompass planning, design and/or construction efforts to address a variety of planning and strategic initiatives, which may include ORT, customer information enhancements, and/or shared-use pathways.
Open Road Tolling - This project encompasses planning, design and/or construction efforts to address the implementation of ORT at all TBTA Facilities. In October 2016, Governor Andrew Cuomo announced a transformational plan to improve the TBTA customer experience – The New York Crossings Project. This plan includes a schedule to fully implement ORT at all TBTA crossings in one year. ORT eliminates traditional toll plazas and enables tolls to be collected in a free-flow environment through E-ZPass sensors and license-plate cameras mounted on overhead gantries. ORT had already been established as part of Phase I of Replacement of the Upper and Lower Plaza and Southbound Approach at the HHB, which was completed in 2016.
Intelligent Transportation System Enhancements – This project will complete the installation of CCTV cameras at the TNB and BWB, improving the monitoring and observation of traffic flow on these bridges. In addition, this project will design and install CCTV on the RFK. Hardware upgrades will also be made for the Advanced Traffic Management Systems (ATMS).
Hazardous Materials Abatement – This project will remove hazardous materials at various facility work sites.
Miscellaneous Agency-Wide Painting – This project provides for additional unplanned painting needs that may arise from ongoing biennial inspections. It also includes painting the HCT and QMT ventilation buildings and facility buildings, and emergency lead paint removal.
Additional projects:
• Traffic Detection/Incident Management Systems (design)
• Facility Monitoring & Safety Systems Replacement
• Bridge Structural Health Monitoring Initiatives
• Operations Command Center Rehabilitation/Replacement
As part of the Capital Program planning process, TBTA personnel conduct a 20-year capital needs assessment every five years. The assessment is compiled from data from biennial inspections and system improvements suggested by the Engineering and Construction department, and include factors such as service life of various structural components and normal replacement cycles. Scheduling of Major Maintenance projects is closely coordinated with the 20-year capital needs
HISTORY AND PROJECTION OF TRAFFIC, TOLL REVENUES AND EXPENSES AND REVIEW OF PHYSICAL CONDITIONS OF THE FACILITIES OF TRIBOROUGH BRIDGE AND TUNNEL AUTHORITY
85
assessment to ensure that the optimal level of service to the traveling public both locally and systemwide is maintained while balancing operating and capital expenditures.
Stantec’s review of pertinent sections of the recent facility inspection reports found them to be extensive and detailed. The reports, based on Stantec’s limited review, appear, in the opinion of Stantec, to be reasonable. The reviews proved informative. Facility projects and agency-wide projects specific to each structure were discussed.
It is important to note, however, that Stantec’s testing or inspection of portions of the work of other parties shall not relieve such other parties from their responsibility for performing their work in accordance with applicable requirements and the customary standard of care. Stantec shall not be responsible for the acts or omissions of other parties engaged by TBTA.
Long-Term Outlook for TBTA Facilities
The useful lives of bridges and tunnels, in general, could possibly be cut short for two main reasons: (a) they are geometrically and functionally unsatisfactory because they are too narrow, too steep, lacking in clearance or sufficient spatial capacity to handle the traffic; or (b) they are structurally unsafe because of deterioration or because their load-carrying capacity is inadequate to handle the loads imposed under current conditions. Deterioration may occur for a variety of reasons, including aging, but it will occur sooner if there has been inadequate or improper maintenance.
On the basis of the foregoing review and information available to us from reports of others, it is our opinion that the TBTA bridges, tunnels and approaches are all geometrically and functionally ade-quate and structurally sound and generally maintained to good standards. Ongoing maintenance requirements of the structures are assessed, prioritized and addressed in an appropriate manner by TBTA to maintain a high level of safety to the traveling public, and to maintain the structures for many years to come.
TBTA is looking forward, exploring ways to add capacity at its facilities (where possible) while maintaining and rehabilitating its structures in order to ensure their future serviceability. We are of the opinion that all the TBTA facilities are and will be physically capable of accommodating traffic volumes at the levels projected for 2027 through the duration of the outstanding bonds that have been issued and future bonds to be issued based on a pledge of TBTA revenues through 2047, assuming maintenance and rehabilitation consistent with past practice.
CONCLUDING REMARKS
It is Stantec’s opinion that the revenue projections are reasonable and have been prepared in accordance with accepted practice for investment-grade studies. However, given the uncertainties within the current international and economic climate, Stantec considers it is necessary to state that the traffic and revenue projections are based on the following caveats:
HISTORY AND PROJECTION OF TRAFFIC, TOLL REVENUES AND EXPENSES AND REVIEW OF PHYSICAL CONDITIONS OF THE FACILITIES OF TRIBOROUGH BRIDGE AND TUNNEL AUTHORITY
86
• This report presents the results of Stantec’s consideration of the information available to us as of the date hereof and the application of Stantec’s experience and professional judgment to that information. It is not a guarantee of any future events or trends.
• The traffic and revenue forecasts will be subject to future economic and social conditions and demographic developments that cannot be predicted with certainty.
• The projections contained in this report, while presented with numerical specificity, are based on a number of estimates and assumptions which, though considered reasonable to us, are inherently subject to significant economic and competitive uncertainties and contingencies, many of which will be beyond Stantec’s control and that of TBTA. In many instances, a broad range of alternative assumptions could be considered reasonable. Changes in the assumptions used could result in material differences in projected outcomes.
• If, for any reason, any of these conditions should change due to changes in the economy or competitive environment, or other factors, Stantec’s opinions or estimates may require amendment or further adjustments.
• Stantec’s toll revenue projections only represent its best judgment and Stantec does not warrant or represent that actual toll revenues will not vary from its projections, estimates and forecasts.
Many statements contained in this report that are not historical facts are forward-looking statements, which are based on Stantec’s opinions, as well as assumptions made by, and information currently available to, the management and staff of Stantec. Because the statements are based on expectations about future events and economic performance and are not statements of fact, actual results may differ materially from those projected. The words “anticipate”, “assume”, “estimate”, “expect”, “objective”, “projection”, “plan”, “forecast”, “goal”, “budget”, or similar words are intended to identify forward-looking statements. The words or phrases “to date”, “now”, “currently”, and the like are intended to mean as of the date of this report.
Respectfully,
Stantec Consulting Services 50 West 23rd Street New York, NY 10010
Steven Abendschein, P.E., ENV™ SP Senior Principal
HISTORY AND PROJECTION OF TRAFFIC, TOLL REVENUES AND EXPENSES AND REVIEW OF PHYSICAL CONDITIONS OF THE FACILITIES OF TRIBOROUGH BRIDGE AND TUNNEL AUTHORITY
87
Thomas Harknett, P.E. Senior Principal
Christopher Mojica, P.E., PTOE Transportation Engineer