Appendix E Technical Support Document and Assessment of Marine Emission Control Strategies, Zero-Emission, and Advanced Technologies for Commercial Harbor Craft Proposed Amendments to the Commercial Harbor Craft Regulation Date of Release: September 21, 2021 Date of Hearing: November 19, 2021
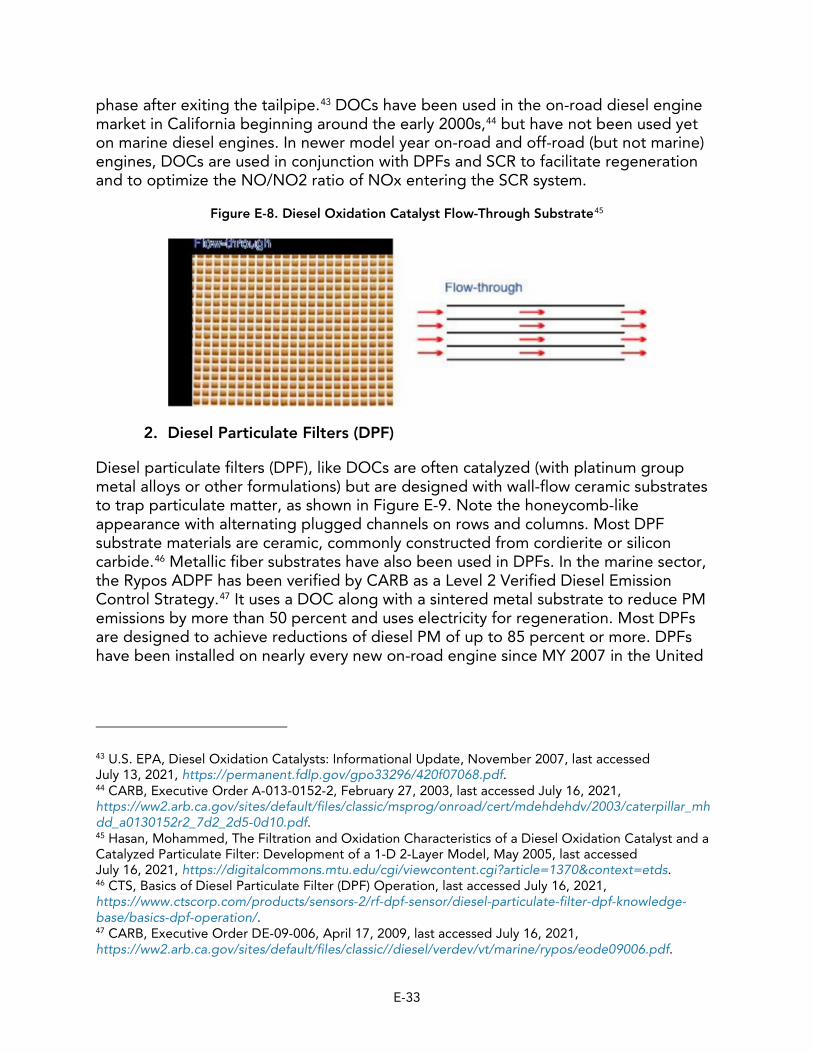
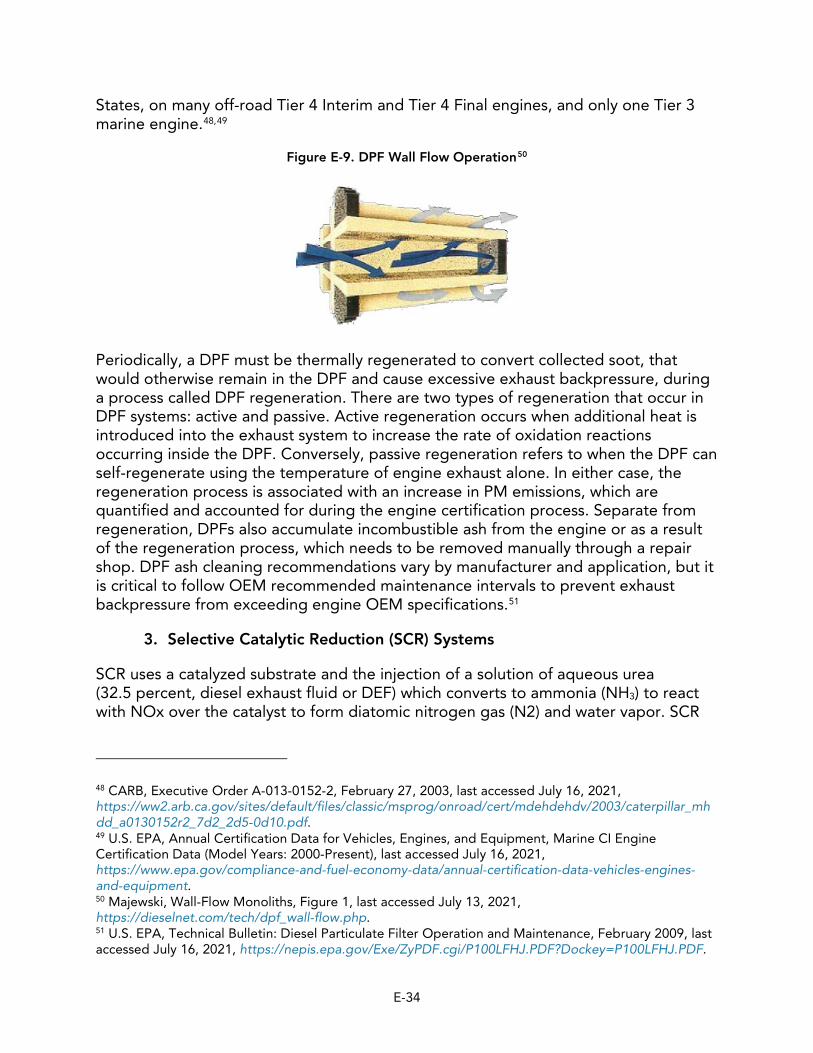
Transcript
Appendix E
Technical Support Document and Assessment of Marine Emission Control Strategies, Zero-Emission, and Advanced Technologies for Commercial Harbor
Craft
Proposed Amendments to the Commercial Harbor Craft Regulation
Date of Release: September 21, 2021 Date of Hearing: November 19, 2021
This Page Intentionally Left Blank.
Table of Contents
I. Introduction and Background ....................................................................... E-1
II. Existing Emission Standards for Marine Diesel Engines ................................ E-1
A.U.S. EPA Marine Standards............................................................................................. E-2 B. CARB and U.S. EPA Certification Standards Off-Road Compression Ignition
Engines ........................................................................................................................... E-8 C. International Marine Standards - Europe ...................................................................... E-11 D.International Maritime Organization (IMO) MARPOL.................................................... E-14
III. Engine Emission Control and On-Board Engine Technologies..................... E-16
a. Overview and Types of Turbocharging............................................................................................ E-23 b. Turbocharger Operation.................................................................................................................. E-28 c. Charge Air Cooling .......................................................................................................................... E-29 d. Contributors to Visible PM Emissions from Properly Functioning Marine Engines ......................... E-30
C.On-Board Diagnostics and Inspection and Maintenance .............................................. E-38
IV. Equipment Availability, Vessel Feasibility, and Shipyard Capacity ..................................................................................................... E-39
A.Availability of Engines and DPFs to Meet Proposed Performance Standards...................................................................................................................... E-39 1. Marine Engines Meeting Tier 4 Standards.............................................................................E-39 2. CARB Verified Level 3 VDECS (DPFs) ....................................................................................E-42
B. California Maritime Academy Feasibility Study ............................................................. E-42 C.U.S. Coast Guard (USCG) Regulations .......................................................................... E-44 D.Evaluation of Shipyard Capacity.................................................................................... E-46
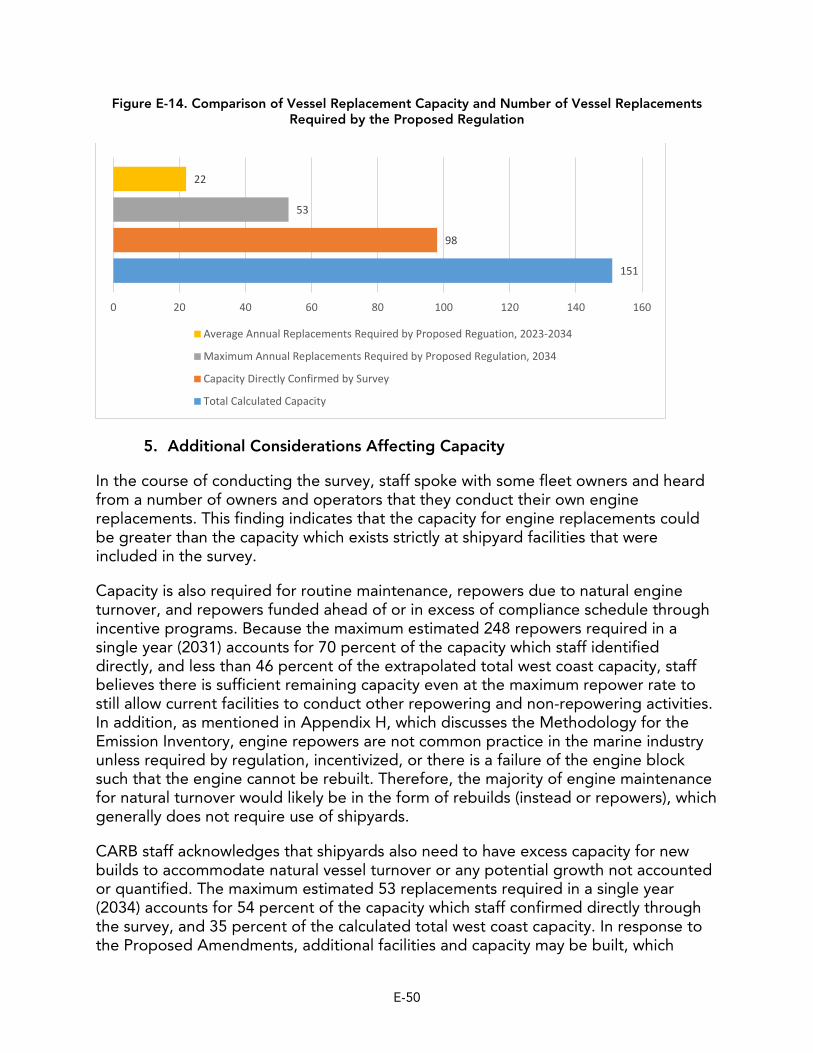
1. Determining Commercial Harbor Craft Shipyard Capacity ...................................................E-46 2. Survey Methodology and Results...........................................................................................E-46 3. Shipyard Survey Results..........................................................................................................E-47 4. Accounting for Capacity at Non-Responsive Shipyards ........................................................E-47 5. Additional Considerations Affecting Capacity.......................................................................E-50
V. Alternative Fuels ........................................................................................ E-52
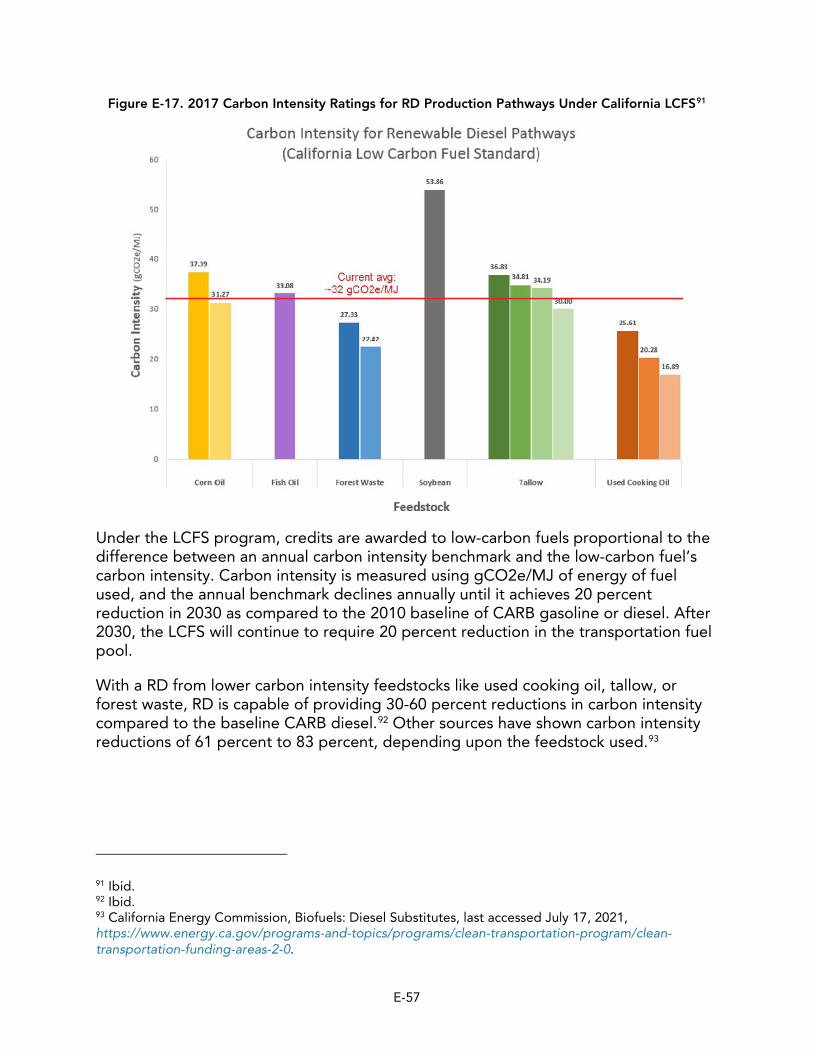
A.Biodiesel ....................................................................................................................... E-52 B. Renewable Diesel.......................................................................................................... E-54
1. General Description ...............................................................................................................E-54 2. CARB In-Use Emissions Testing of Harbor Craft Operating on Renewable and
Conventional CARB Diesel .........................................................................................................E-58 a. Emissions Testing Methods and Protocol ........................................................................................ E-58
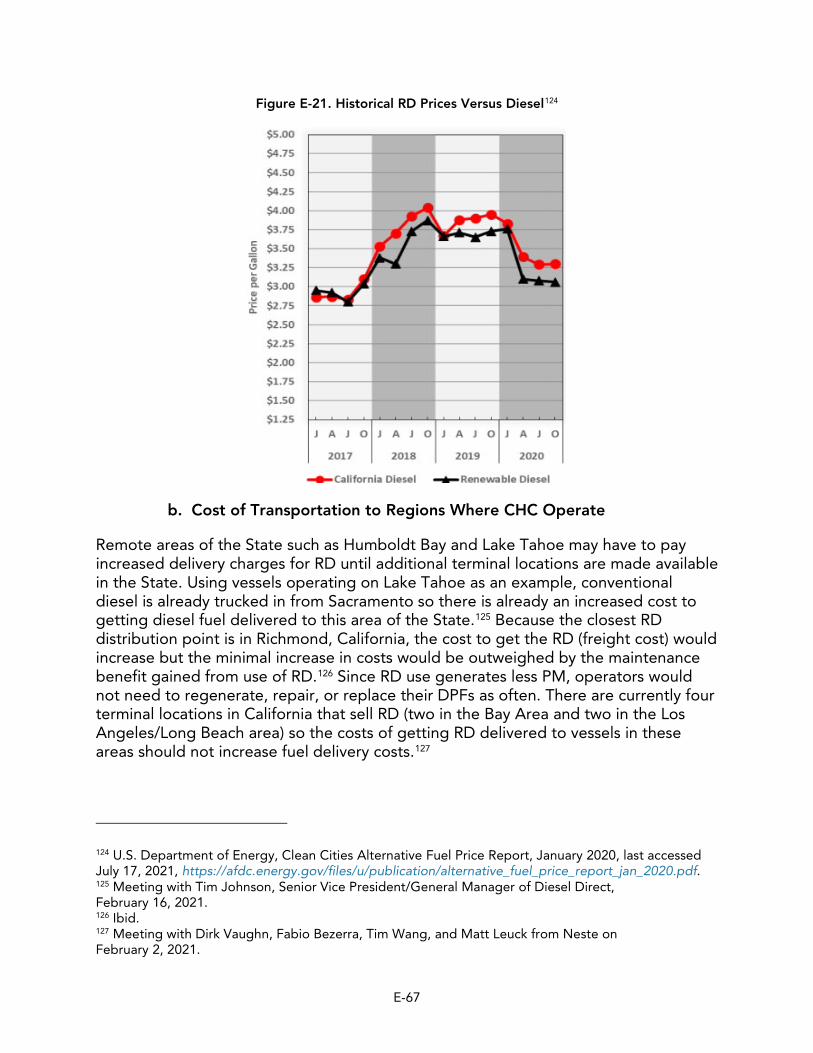
a. Analysis and Results ......................................................................................................................... E-59 3. Requirement to Use Renewable Diesel (R99) ........................................................................E-62 4. Evaluation of R99 Volume for CHC in California....................................................................E-62 5. Evaluation of R99 Distribution in California ...........................................................................E-64 6. Cost of R99 vs. CARB Diesel ..................................................................................................E-66
a. Cost of Fuel Production ................................................................................................................... E-66 b. Cost of Transportation to Regions Where CHC Operate ................................................................ E-67 c. Maintenance Benefits to Using RD .................................................................................................. E-68
C.Natural Gas ................................................................................................................... E-68 D.Hydrogen and Ammonia Combustion........................................................................... E-70
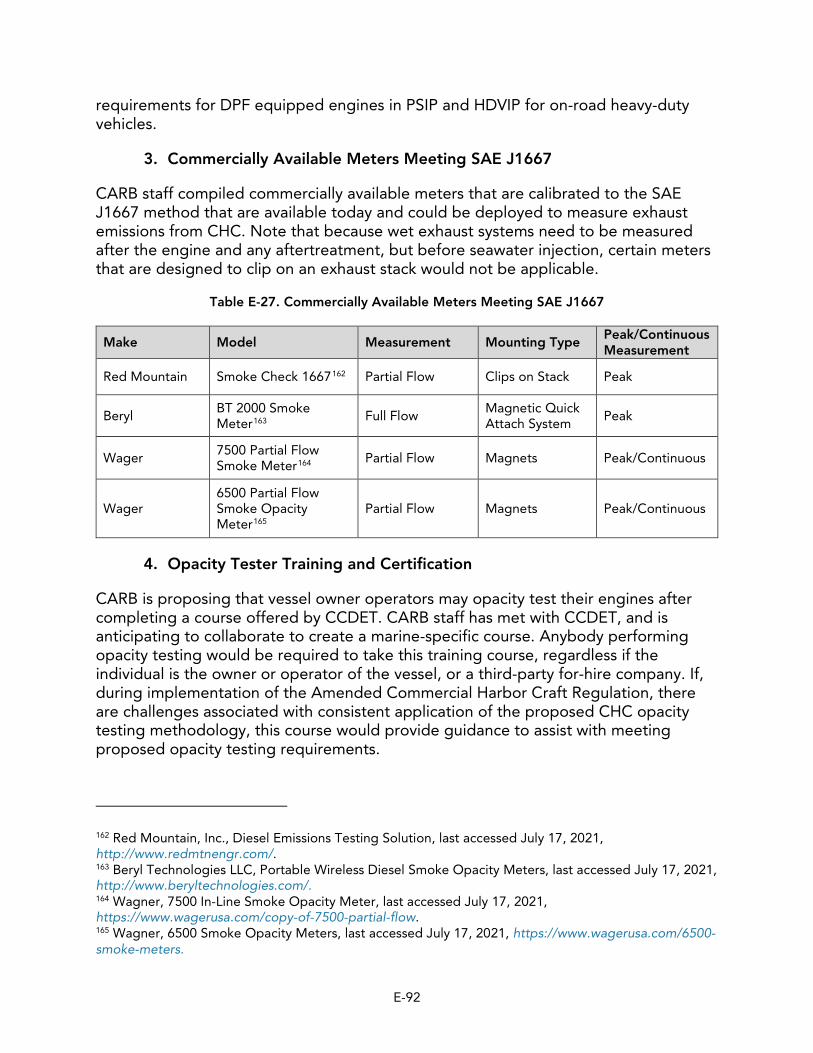
VI. Opacity Testing Methods Applicable to Harbor Craft................................. E-72
A.Background: Opacity Requirements for On-Road Diesel Trucks................................... E-72 B. Background: Opacity Requirements for Mobile Cargo Handling Equipment ............... E-73 C.Analysis of CHE Opacity Data Collected in 2017 and 2018 .......................................... E-74
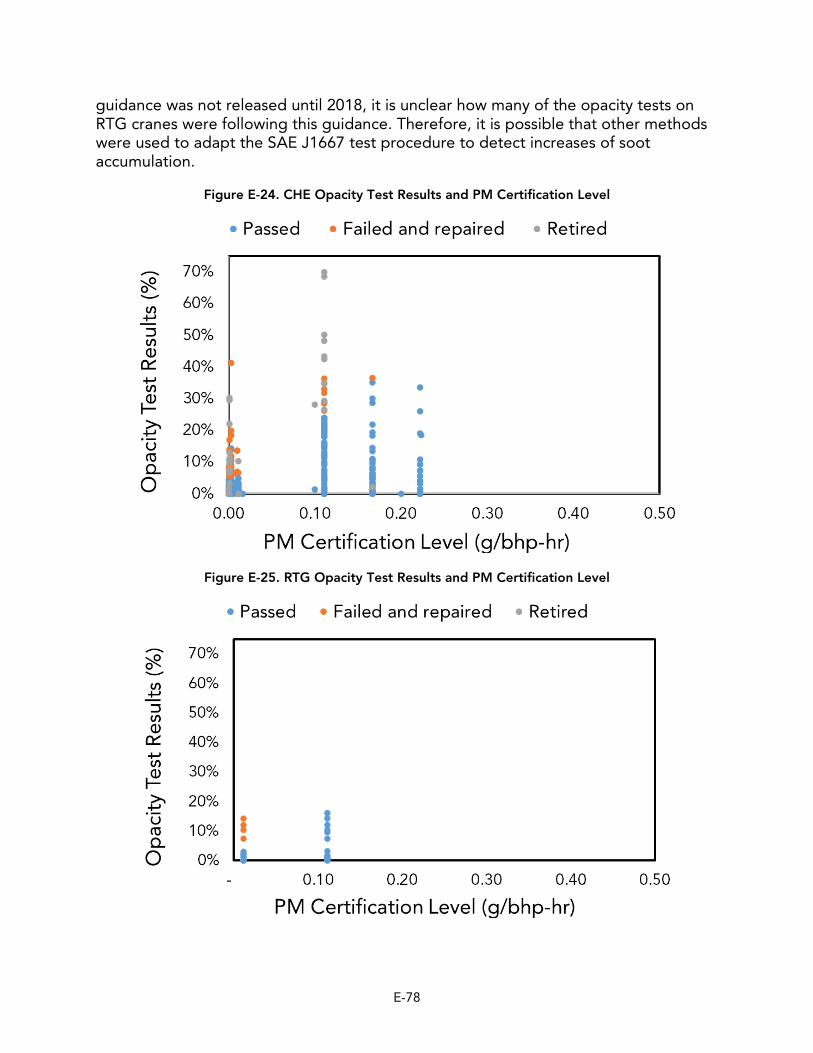
1. How Do the Engine’s PM Certification Standard and Certified PM Emissions Level Correlate to SAE J1667 Opacity Test Results? ..........................................................................E-75
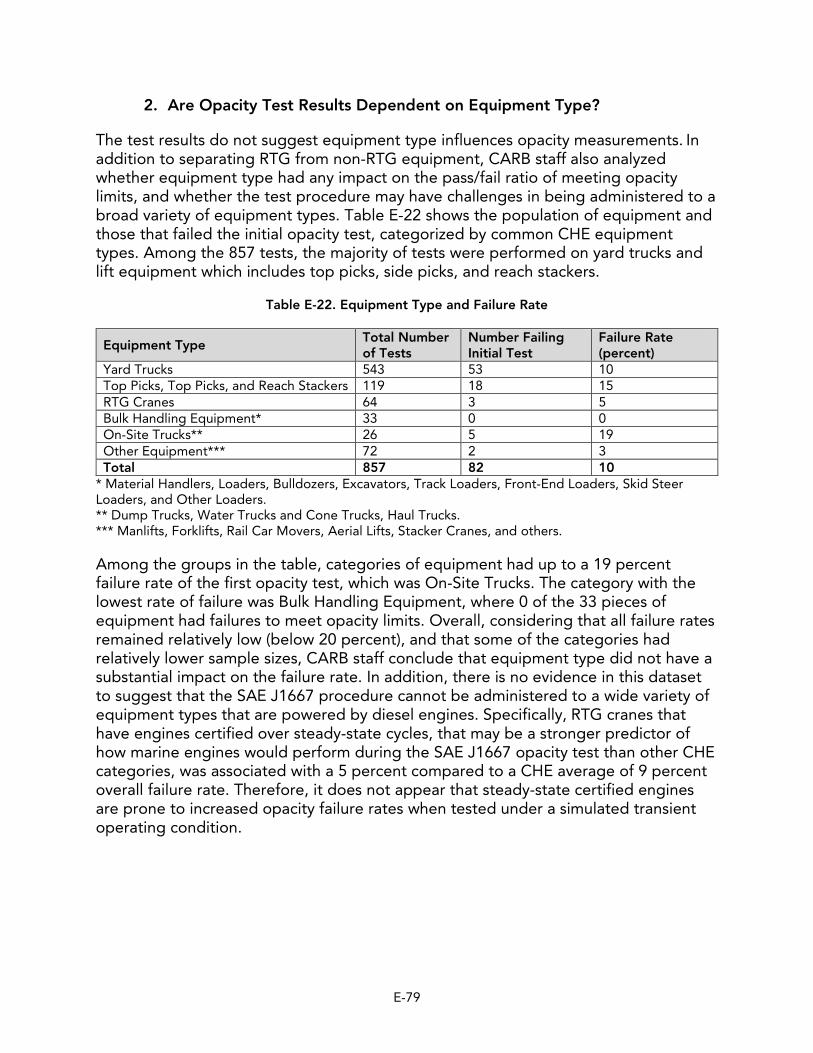
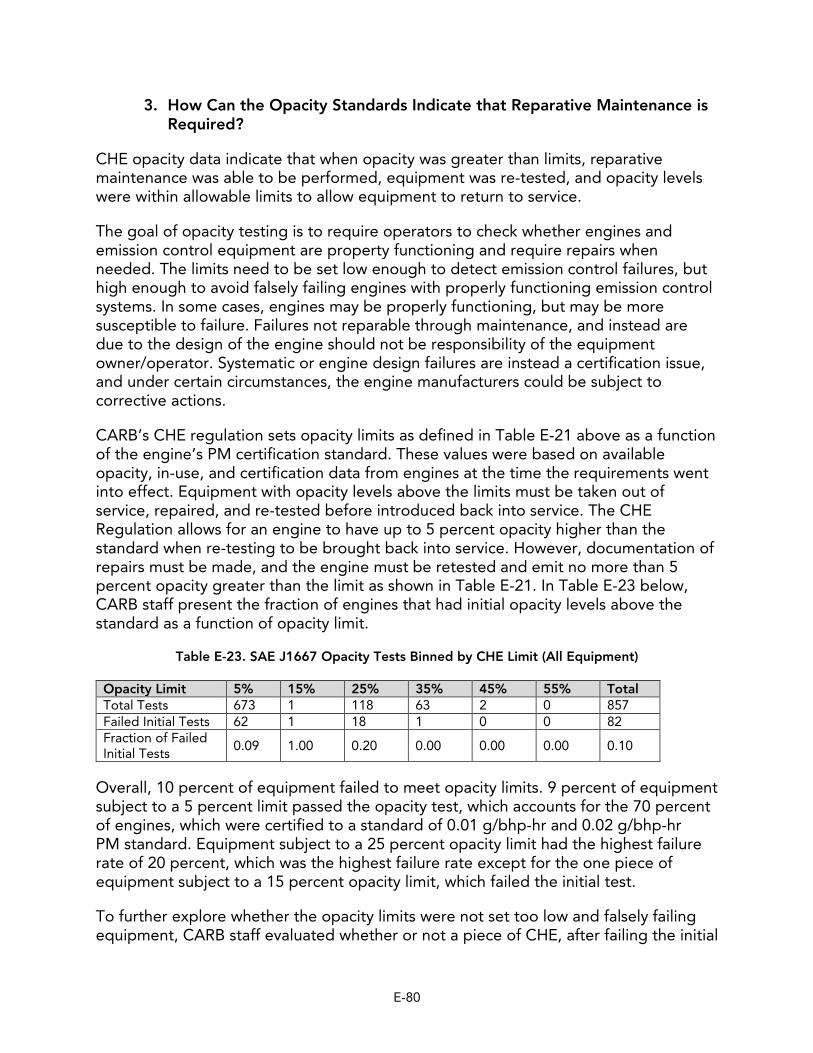
2. Are Opacity Test Results Dependent on Equipment Type? ......................................................E-79 3. How Can the Opacity Standards Indicate that Reparative Maintenance is
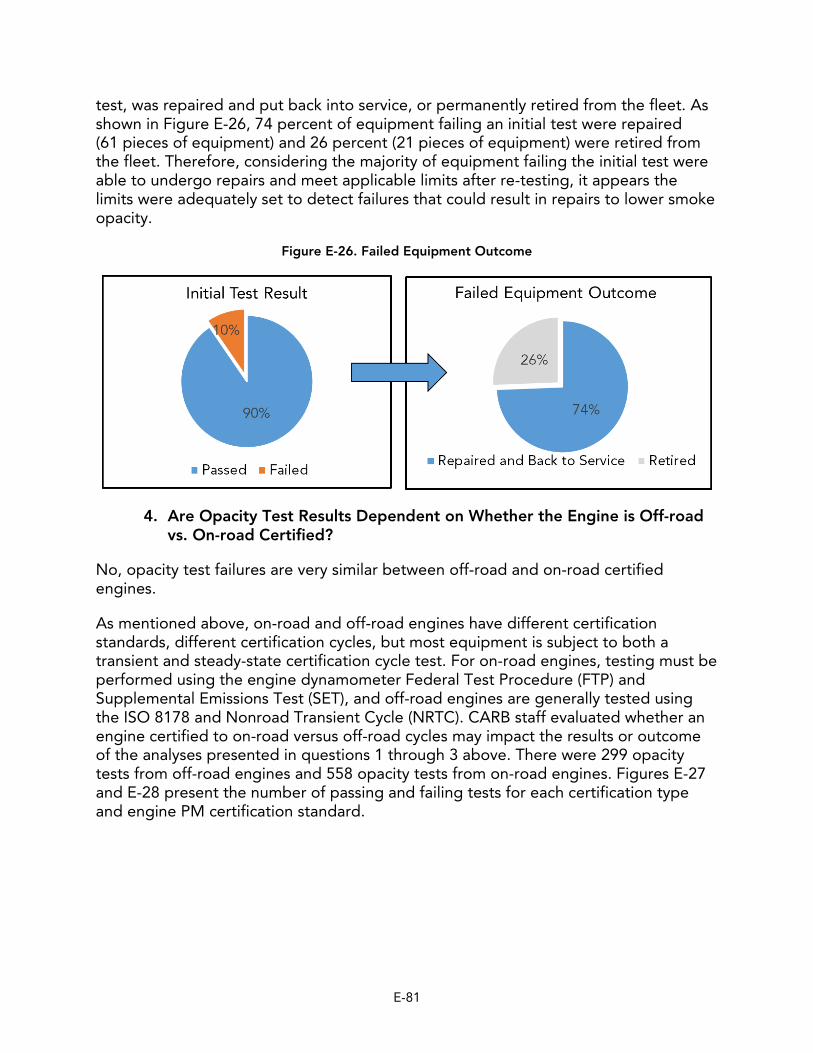
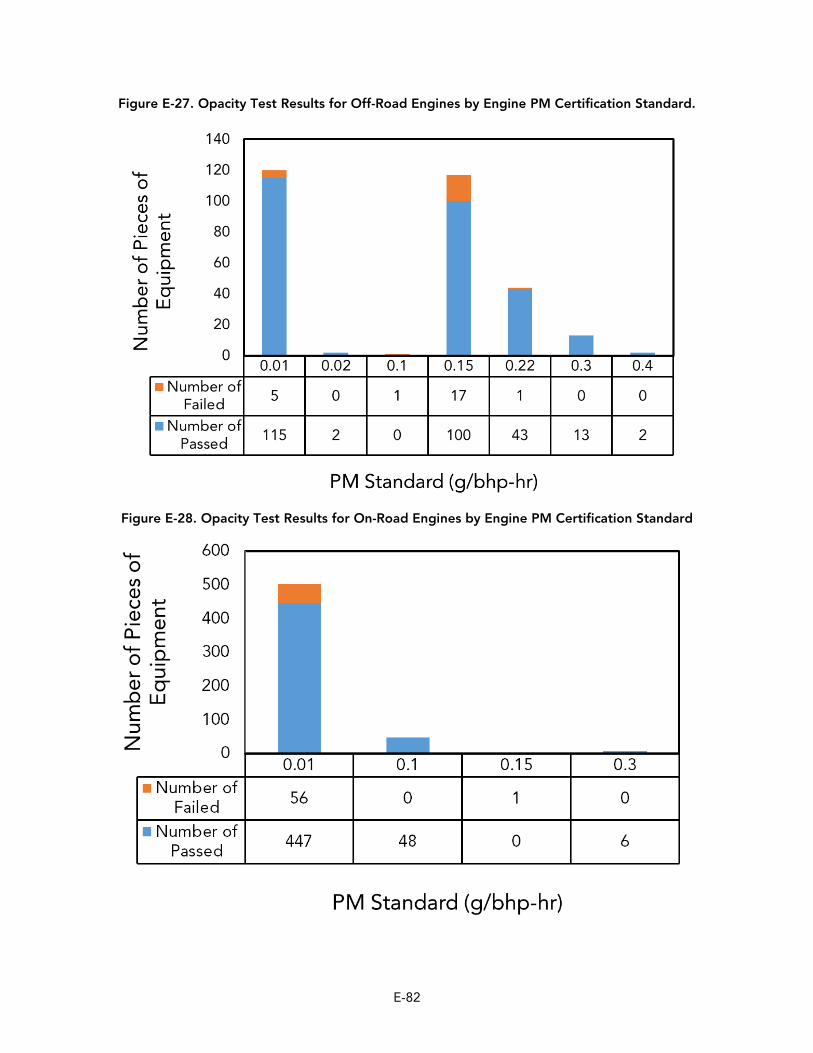
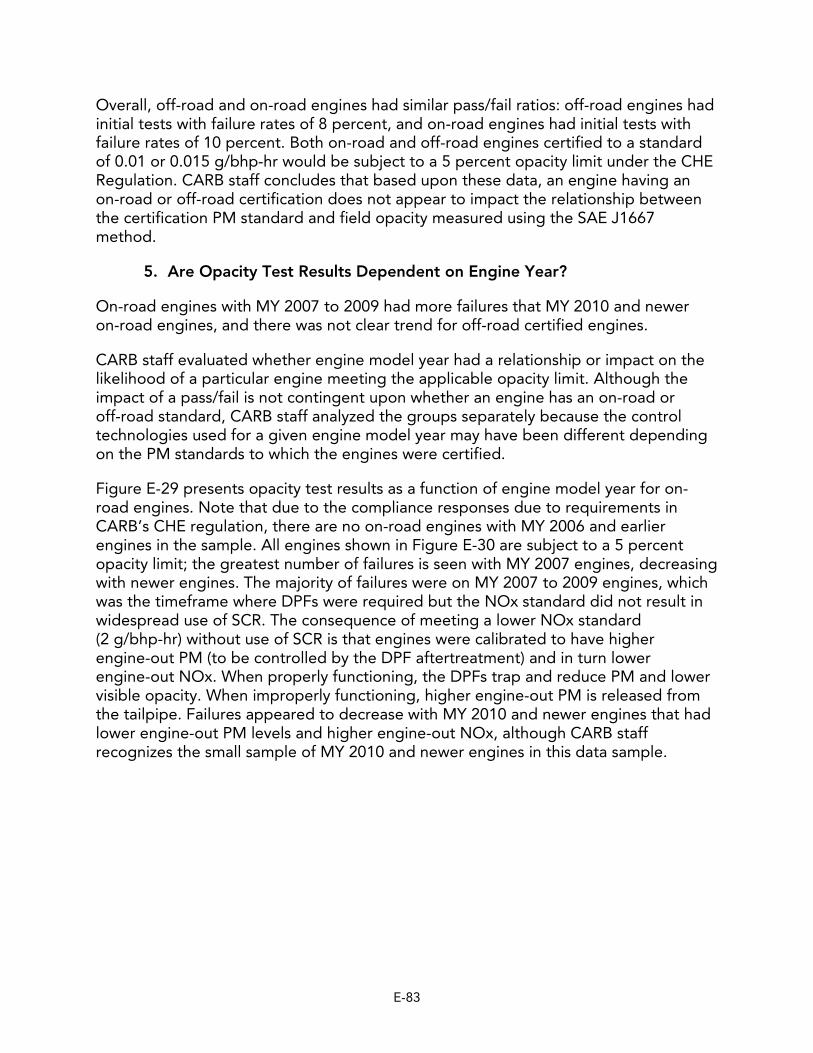
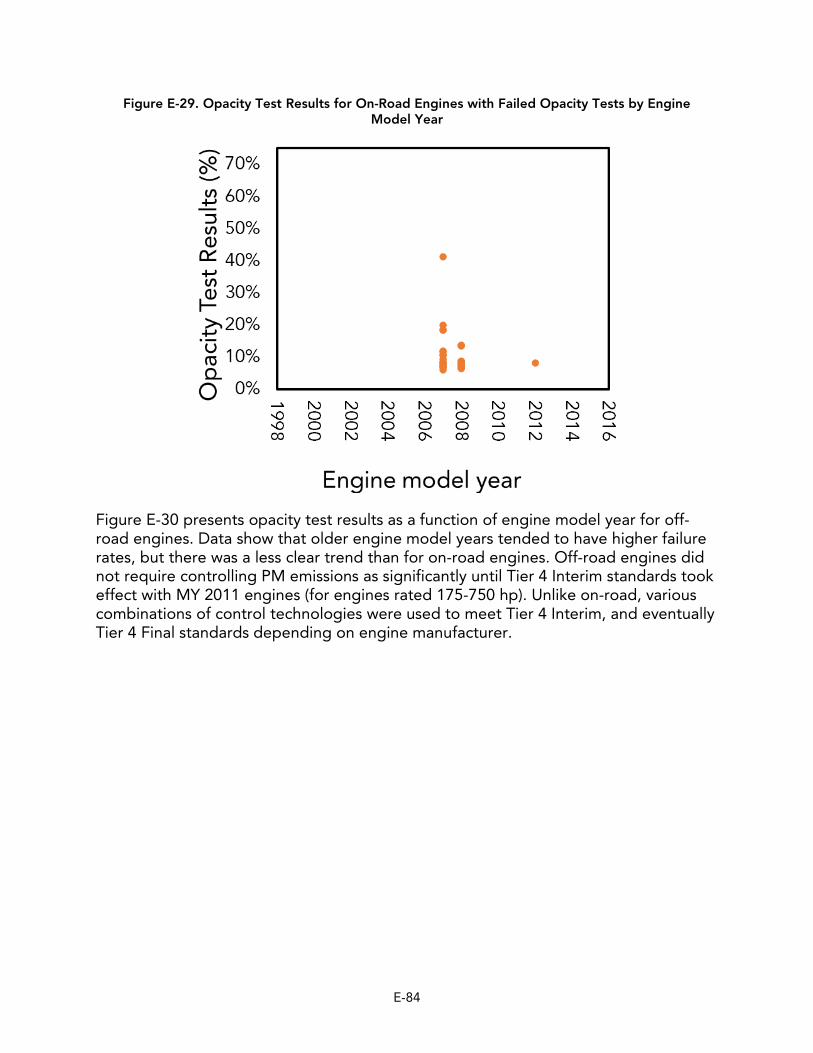
Required?....................................................................................................................................E-80 4. Are Opacity Test Results Dependent on Whether the Engine is Off-road vs. On-road Certified?........................................................................................................................................E-81 5. Are Opacity Test Results Dependent on Engine Year?..............................................................E-83
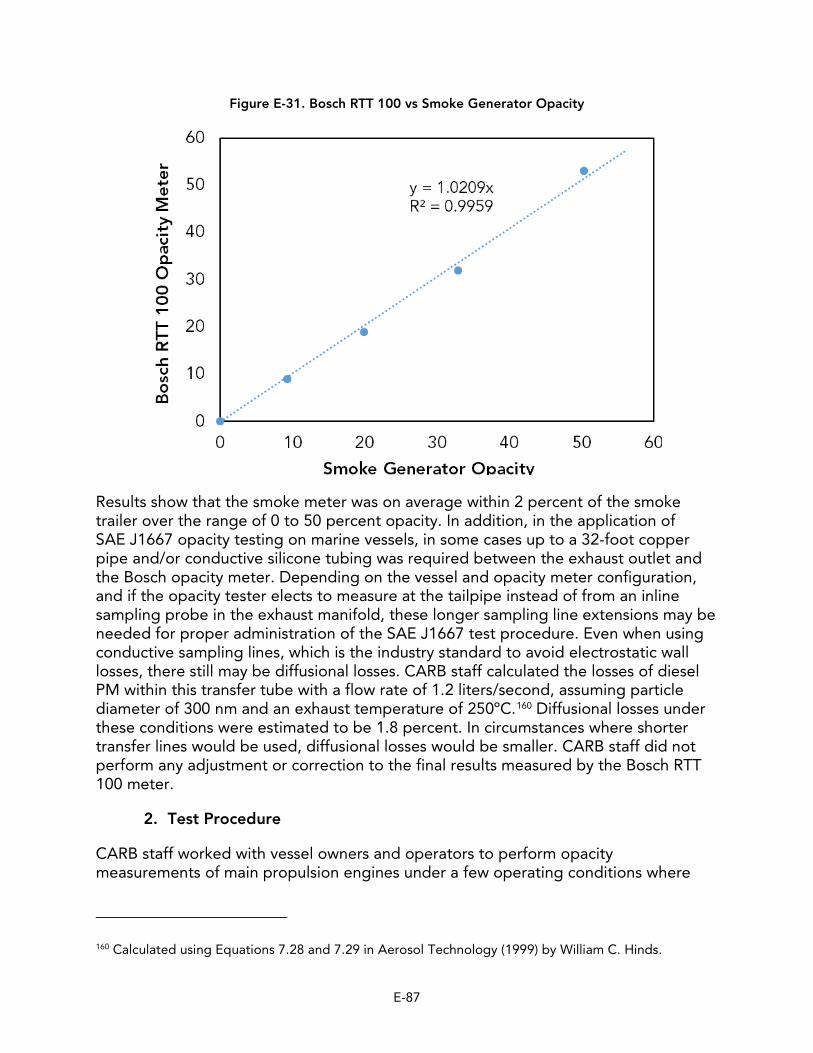
D.CHC: Field Opacity Collection Methods....................................................................... E-85 1. Instrumentation and Calibration ............................................................................................E-86 2. Test Procedure .......................................................................................................................E-87 3. Test Vessels ............................................................................................................................E-88
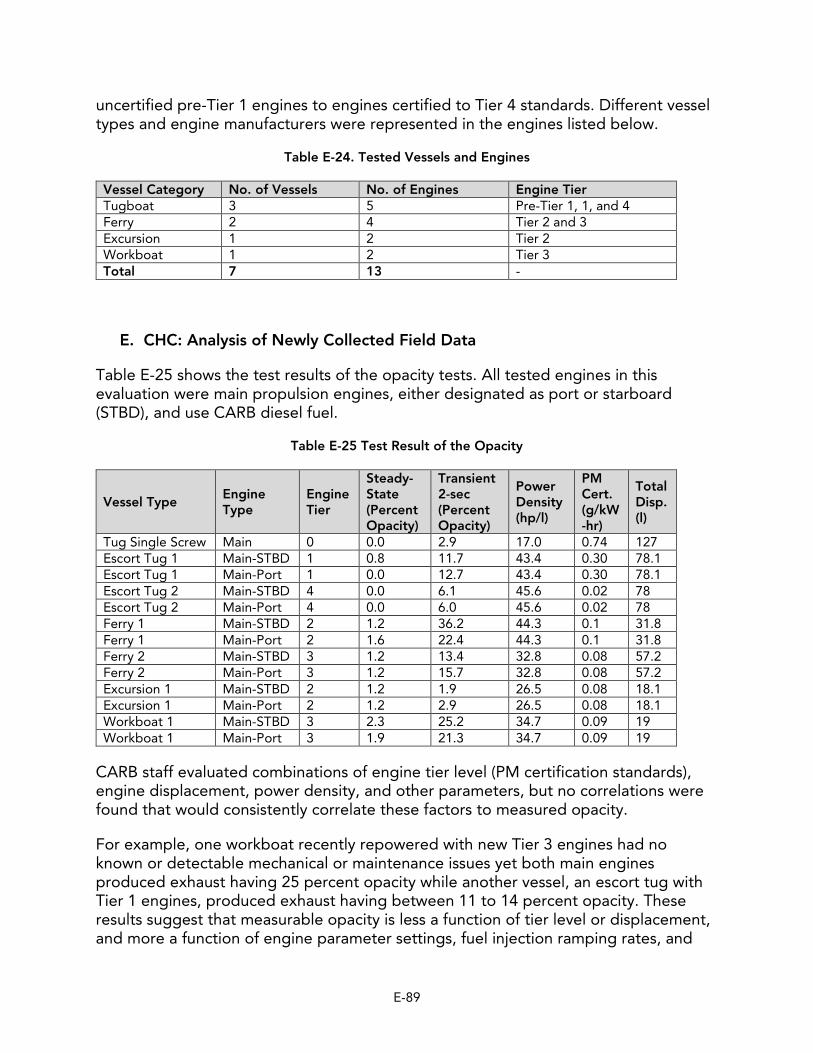
E. CHC: Analysis of Newly Collected Field Data ............................................................... E-89 F. CHC: Recommended Opacity Test Requirements for Harbor Craft.............................. E-90
1. Test Procedure: Applying SAE J1667 to Main and Auxiliary Engines...................................E-91 2. Proposed Opacity Limits ........................................................................................................E-91 3. Commercially Available Meters Meeting SAE J1667 ............................................................E-92 4. Opacity Tester Training and Certification..............................................................................E-92
VII. Zero-Emission and Advanced Technologies (ZEAT) in the Marine Sector......................................................................................................... E-93
A.Enhanced Efficiency Propulsion (EEP) System Configurations in CHC Applications .................................................................................................................. E-93 1. Diesel-Electric Propulsion Systems ........................................................................................E-93 2. Diesel-Electromechanical Propulsion .....................................................................................E-94
Diesel-hydrostatic propulsion.................................................................................................................... E-95 4. Discussion of Potential Benefits and Disbenefits of EEP in Marine Applications..................E-96
B. Zero-Emission Capable Hybrid Vessels and Systems .................................................... E-99 1. Serial Hybrid Propulsion .........................................................................................................E-99
Serial Hybrid Propulsion ............................................................................................................................ E-99 2. Parallel Hybrid Propulsion ....................................................................................................E-100
VIII. Infrastructure to Support Shore Power and ZEAT ................................. E-116
A.Shore Power................................................................................................................ E-116 1. Overview of Current Industry Practices ...............................................................................E-116 2. Summary of Existing Marinas and Ports with Shore Power in California.............................E-116 3. Case Study: Pacific Tugboat Service Project in San Diego..................................................E-117
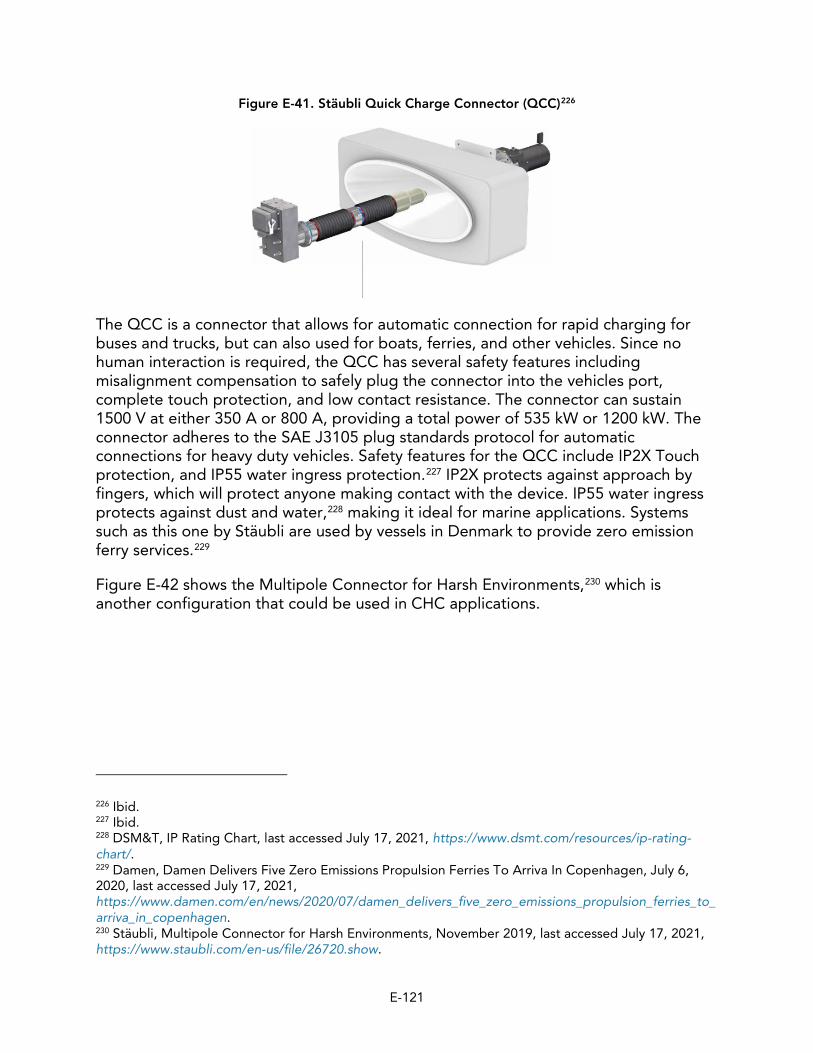
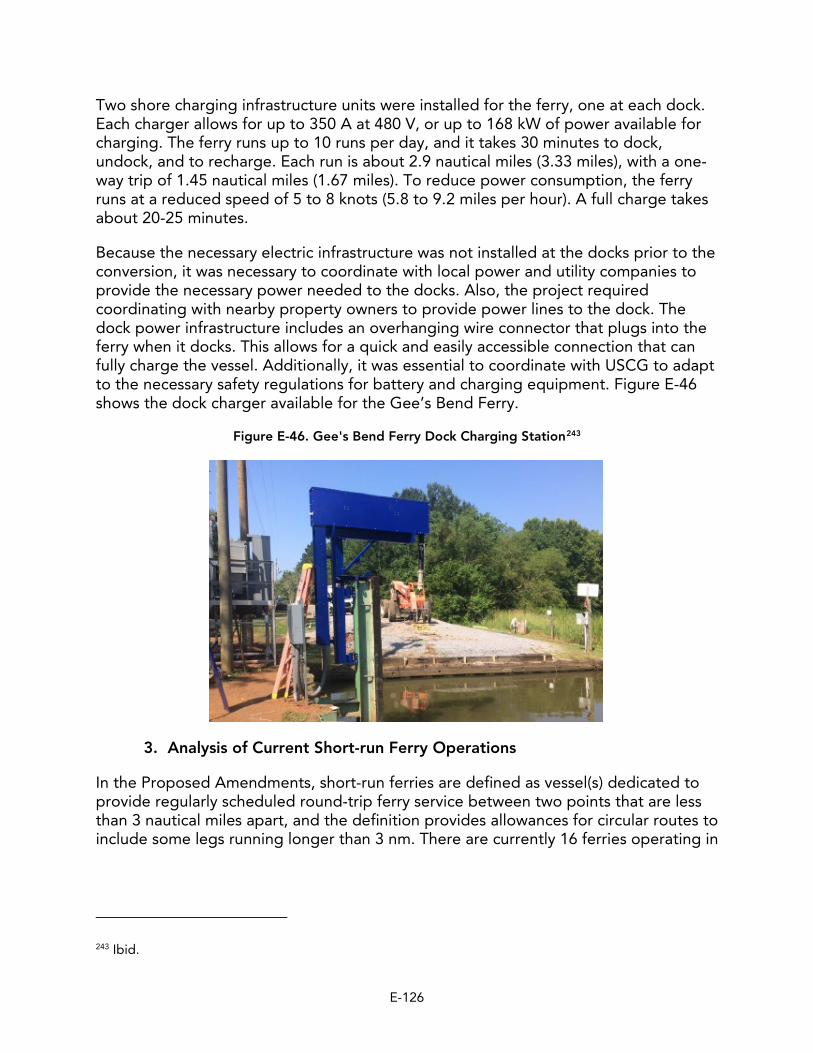
B. Charging and Fueling Infrastructure ........................................................................... E-118 1. Overview of Existing Charging and Fueling Infrastructure..................................................E-119 2. Zero--Emission Ferry Case Study: Gee’s Bend Ferry ...........................................................E-125 3. Analysis of Current Short-run Ferry Operations ..................................................................E-126
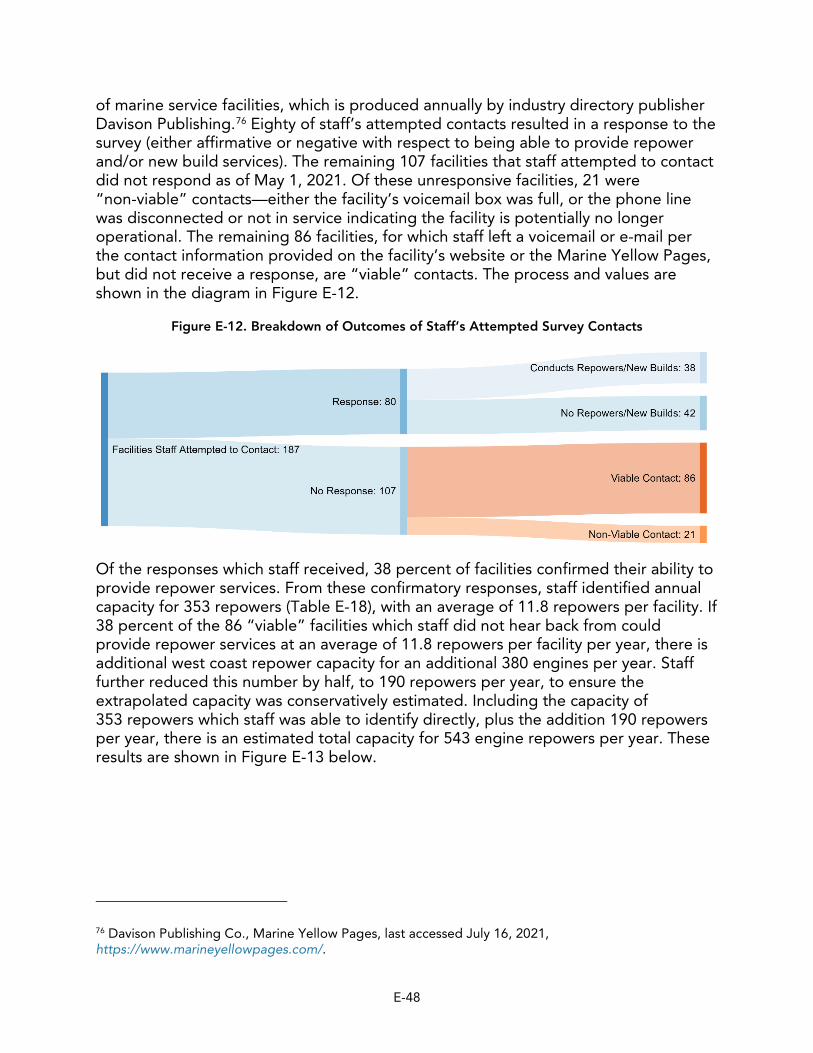
DOC, DPF, and SCR......................................................................................... E-41 Figure E-12. Breakdown of Outcomes of Staff’s Attempted Survey Contacts ...................... E-48
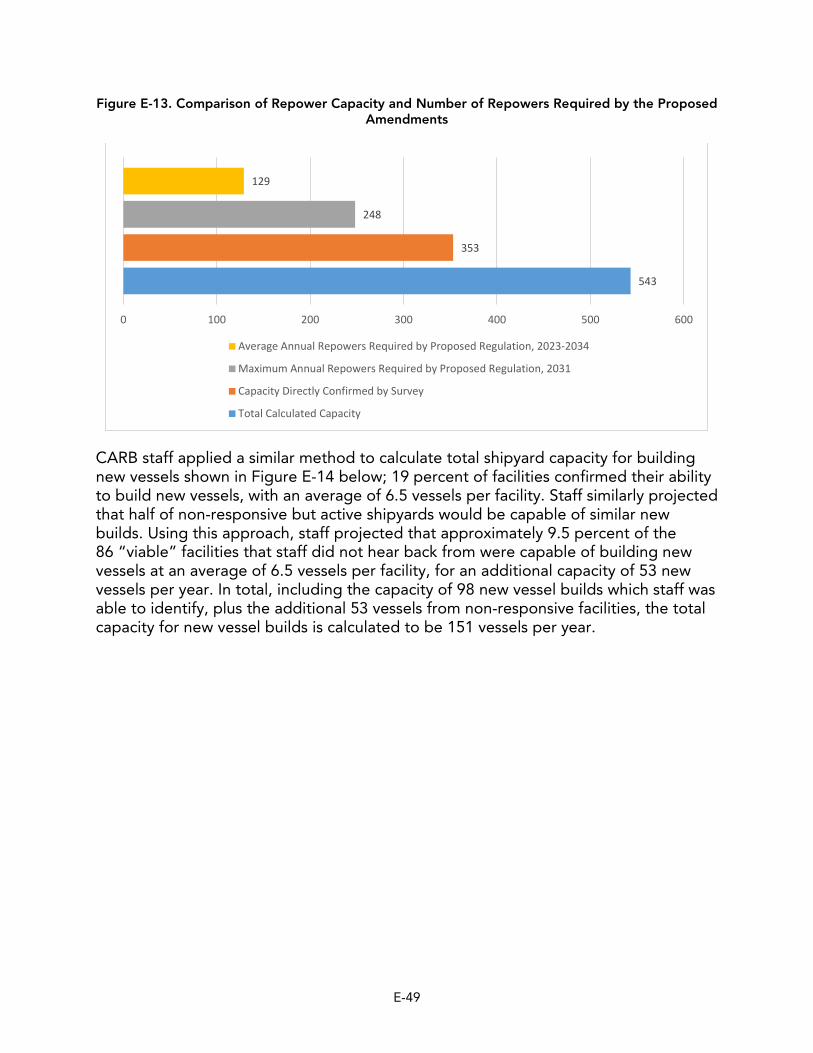
by the Proposed Amendments......................................................................... E-49
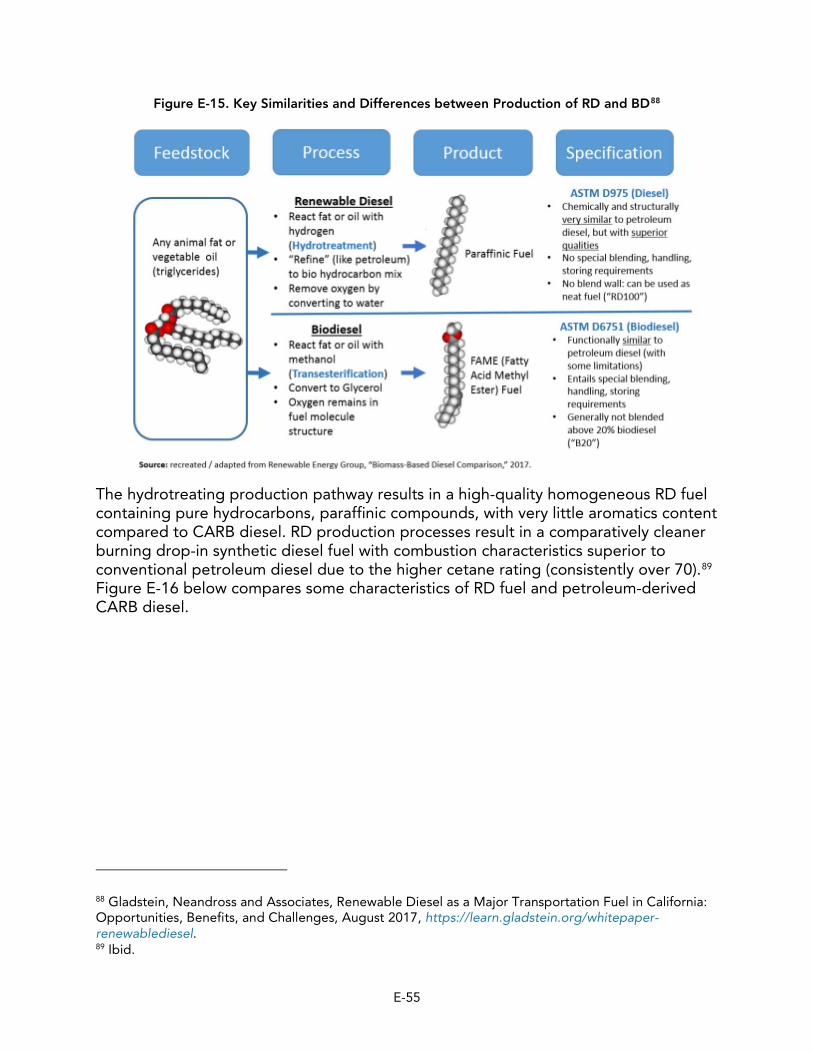
Replacements Required by the Proposed Regulation ...................................... E-50 Figure E- . Key Similarities and Differences between Production of RD and BD................ E-55
California LCFS................................................................................................. E-57
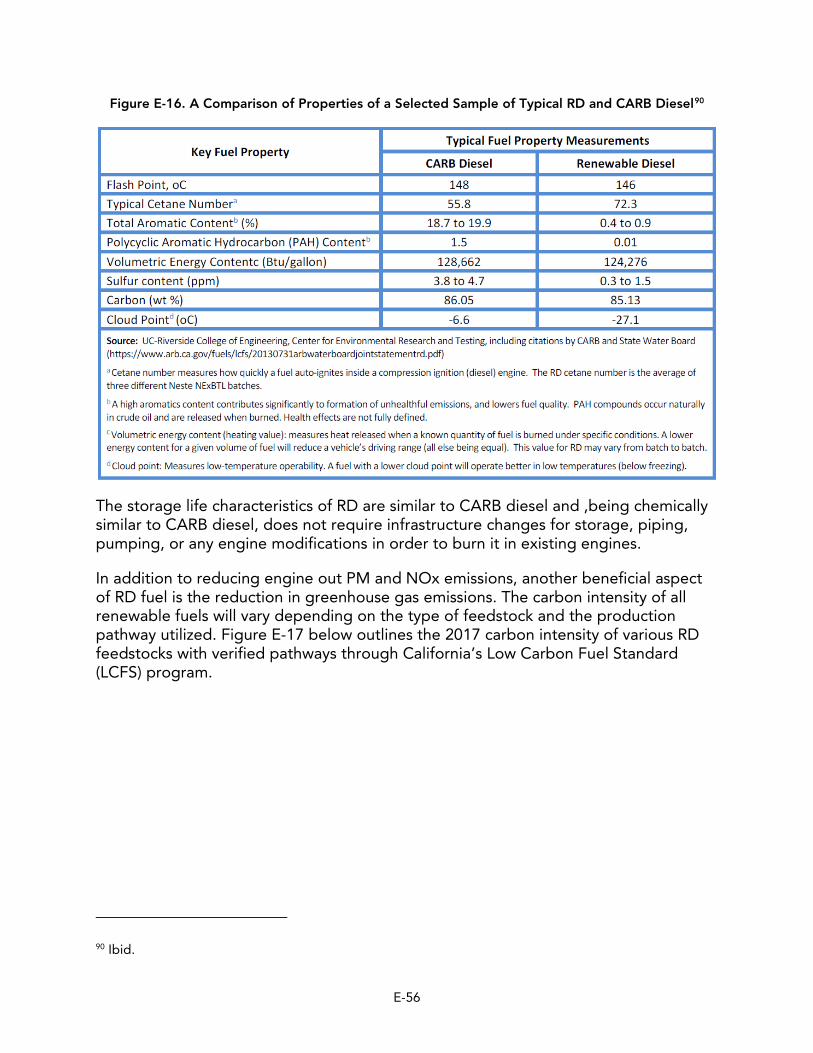
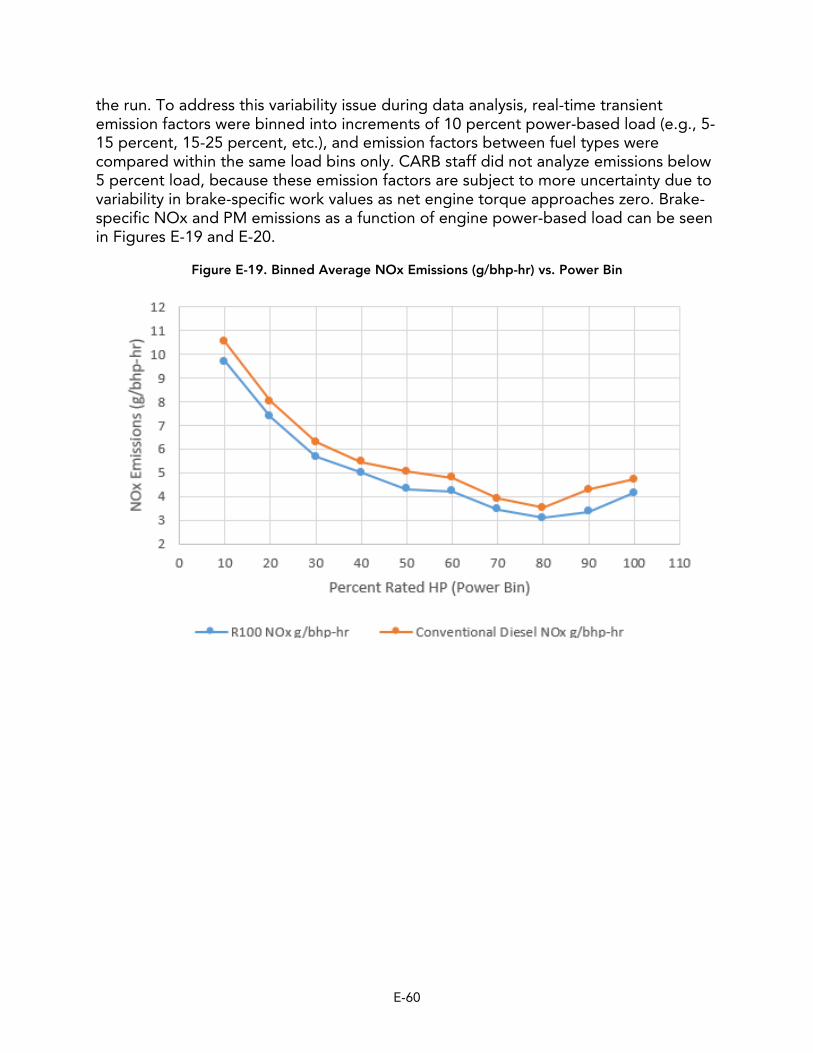
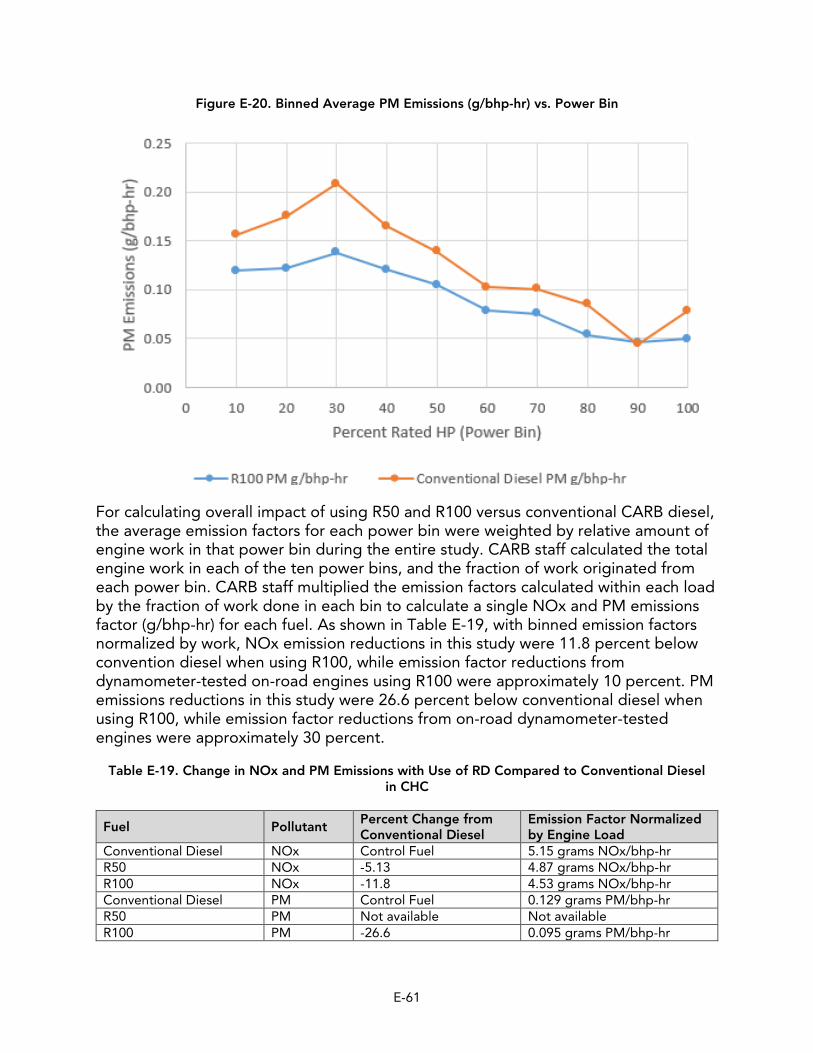
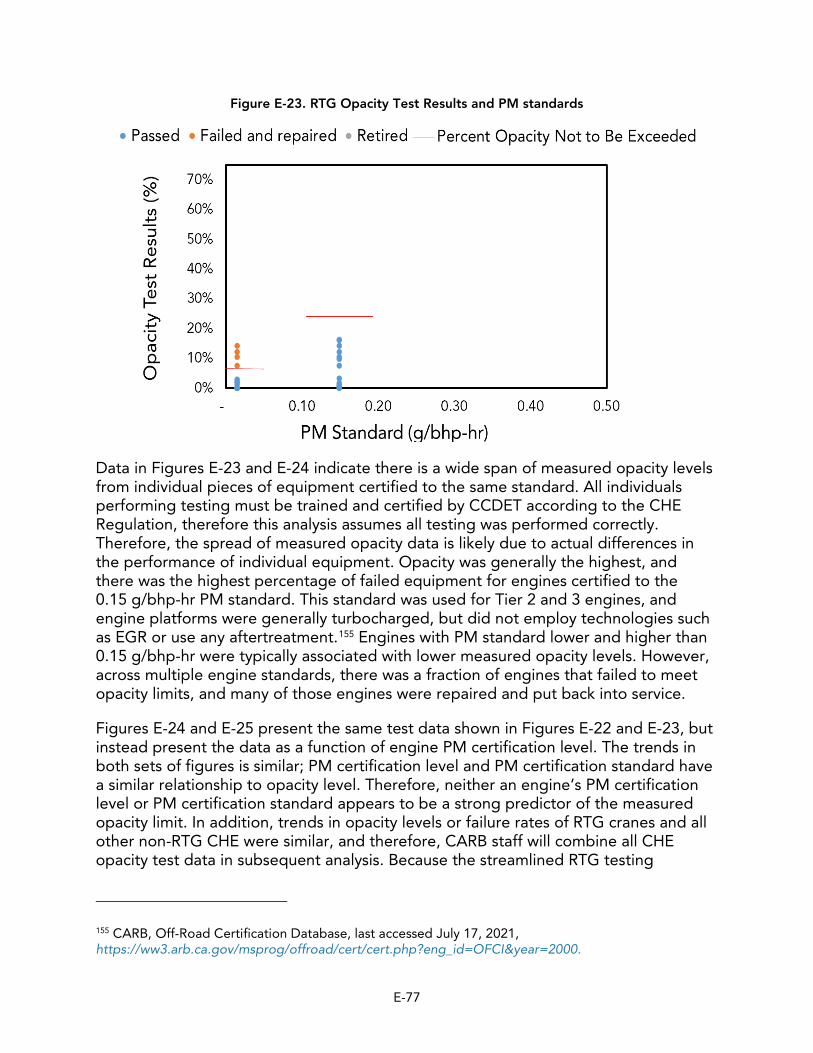
Cruise Route..................................................................................................... E-59 Figure E-19. Binned Average NOx Emissions (g/bhp-hr) vs. Power Bin................................ E-60 Figure E- . Binned Average PM Emissions (g/bhp-hr) vs. Power Bin .................................. E-61 Figure E-21. Historical RD Prices Versus Diesel .................................................................... E-67 Figure E-22. CHE Opacity Test Results and PM standards ................................................... E-76 Figure E-23. RTG Opacity Test Results and PM standards ................................................... E-77 Figure E-24. CHE Opacity Test Results and PM Certification Level ...................................... E-78 Figure E- . RTG Opacity Test Results and PM Certification Level ...................................... E-78 Figure E-26. Failed Equipment Outcome ............................................................................. E-81
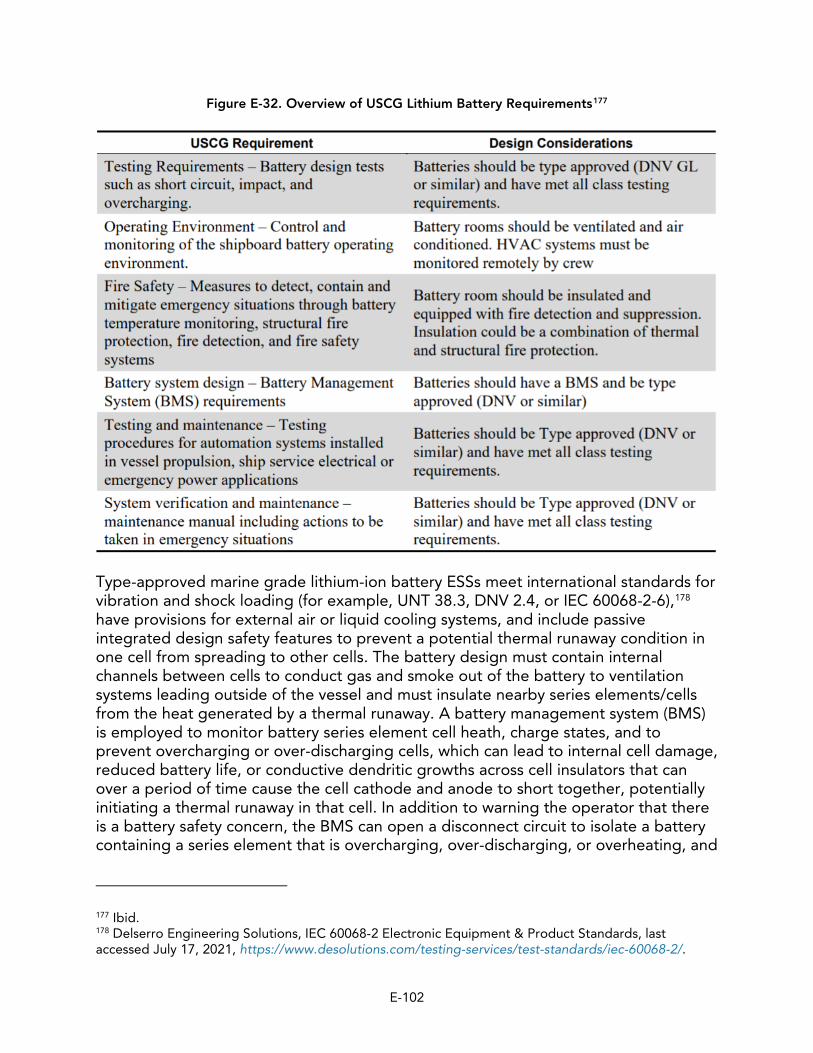
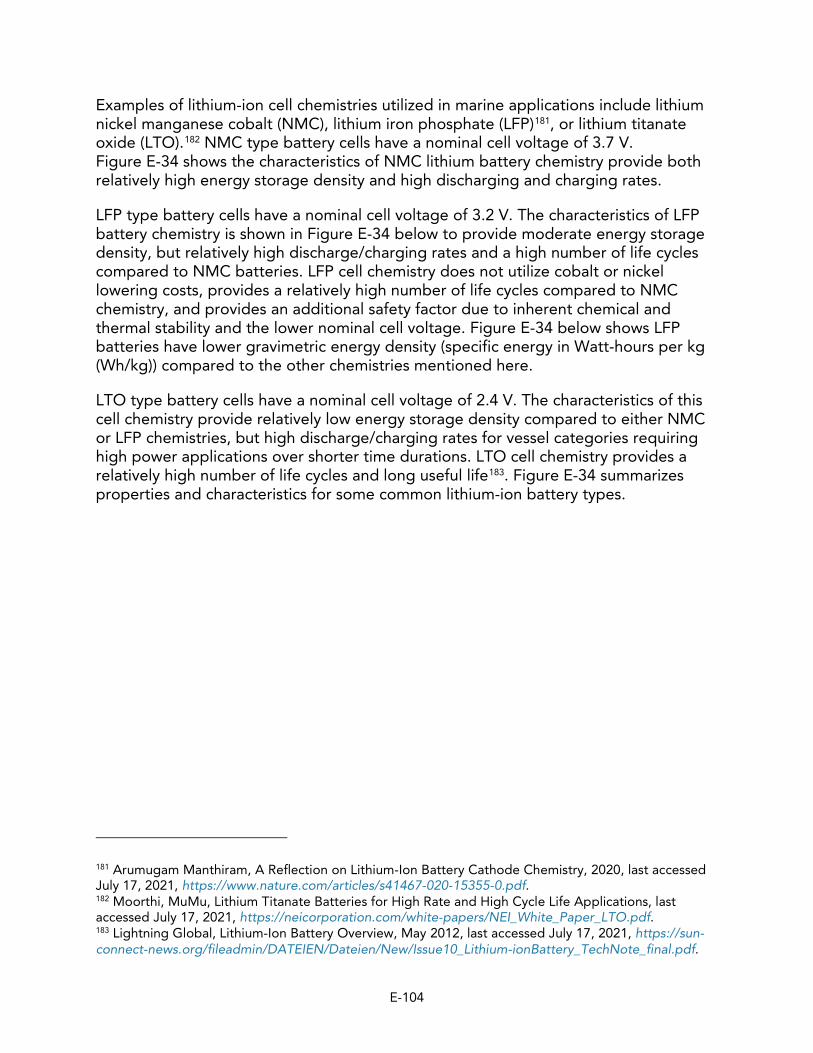
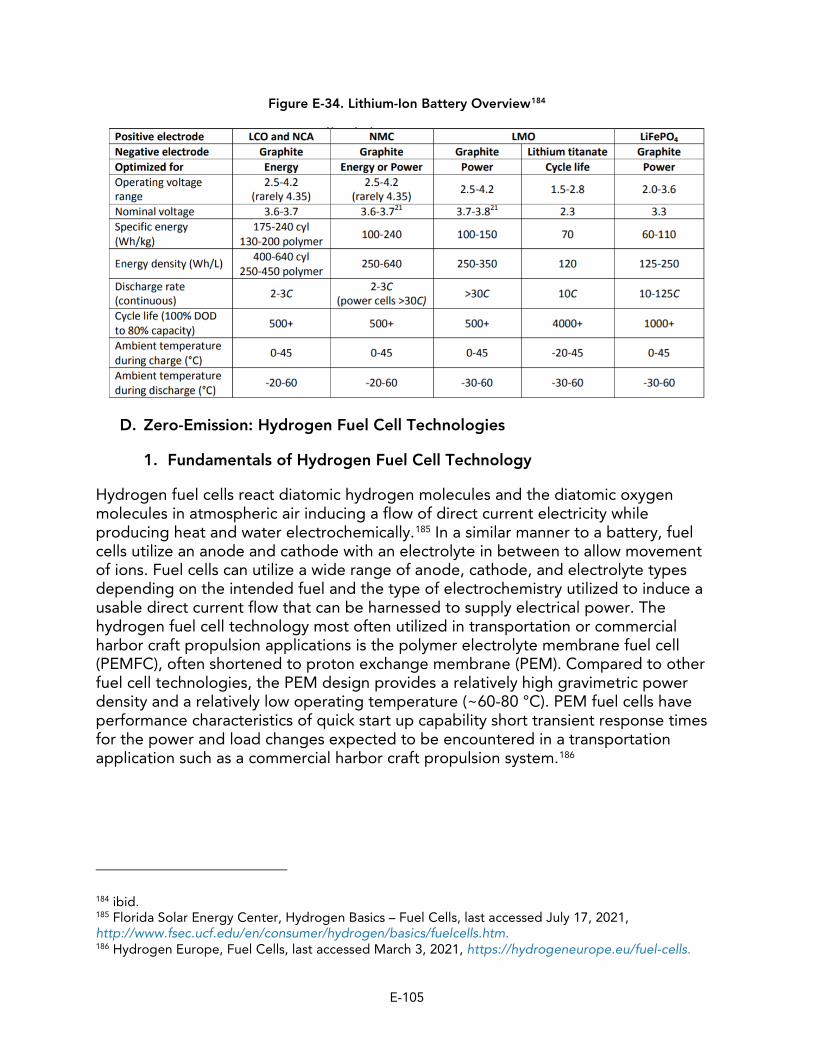
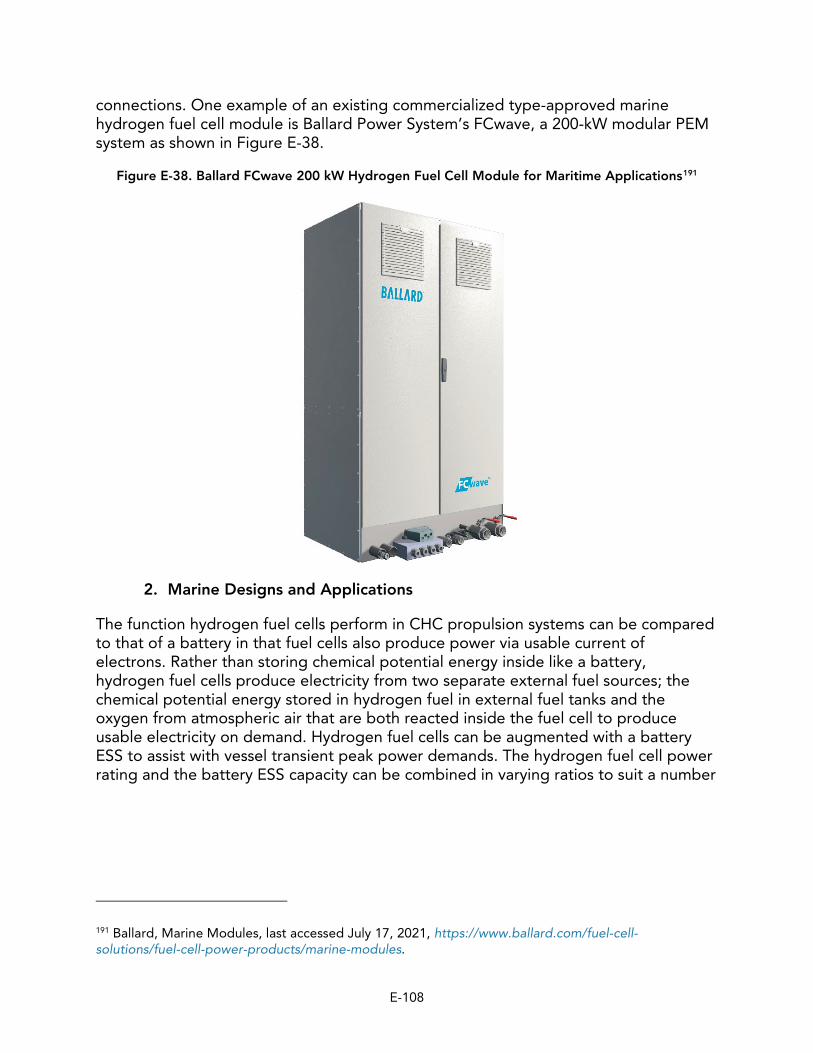
Figure E-34. Lithium-Ion Battery Overview ......................................................................... E-105 Figure E-35. PEM Fuel Cell Operation................................................................................ E-106 Figure E-36. Theoretical Hydrogen Fuel Cell Reaction Voltage Potential........................... E-107 Figure E-37. Hydrogen Fuel Cell Voltage Drop with Current Density Increase................... E-107 Figure E-38. Ballard FCwave 200 kW Hydrogen Fuel Cell Module for Maritime
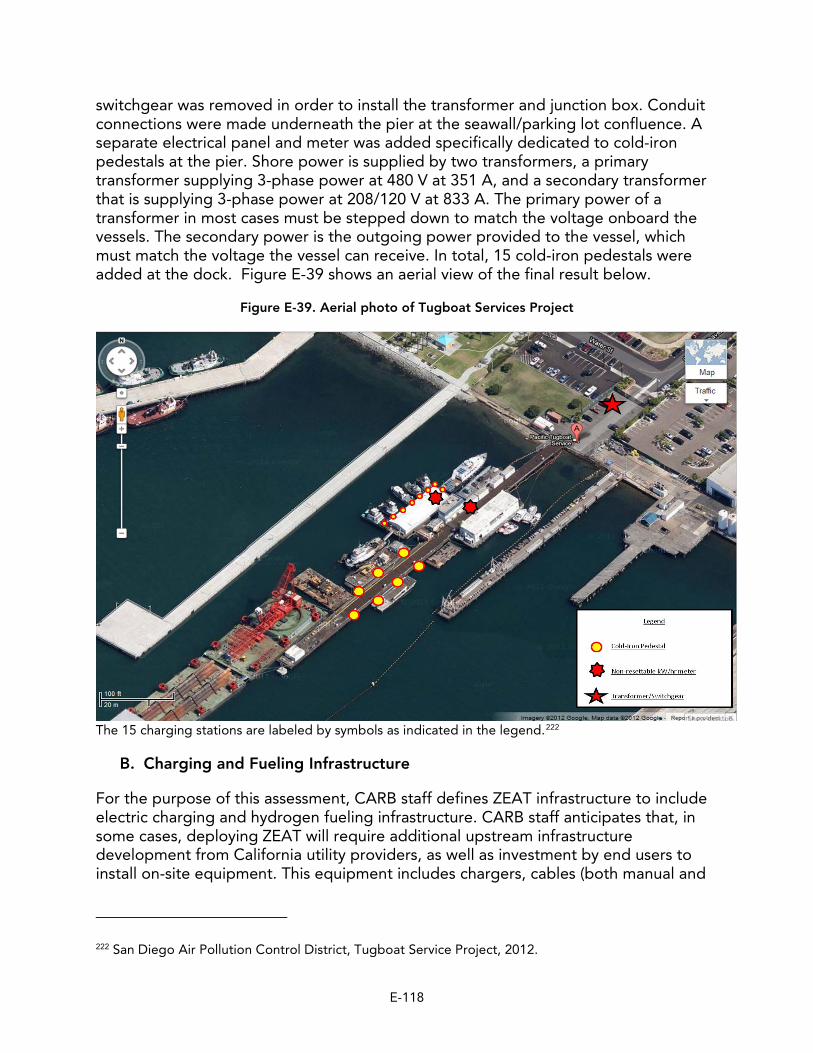
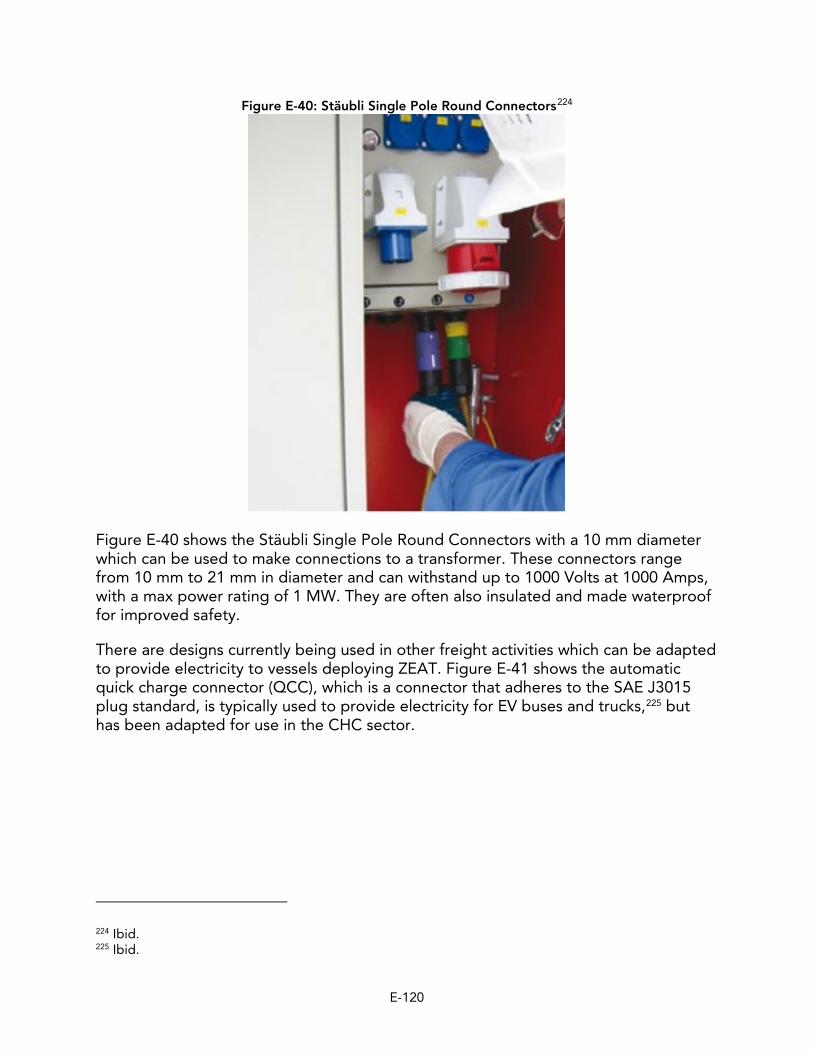
Applications ................................................................................................... E-108 Figure E-39. Aerial photo of Tugboat Services Project....................................................... E-118 Figure E-40: Stäubli Single Pole Round Connectors ........................................................... E-120 Figure E-41. Stäubli Quick Charge Connector (QCC) ......................................................... E-121 Figure E-42. Stäubli Multipole Connector for Harsh Environments .................................... E-122 Figure E-43a Cavotec Automatic Plug-in System and MoorMaster Stationed
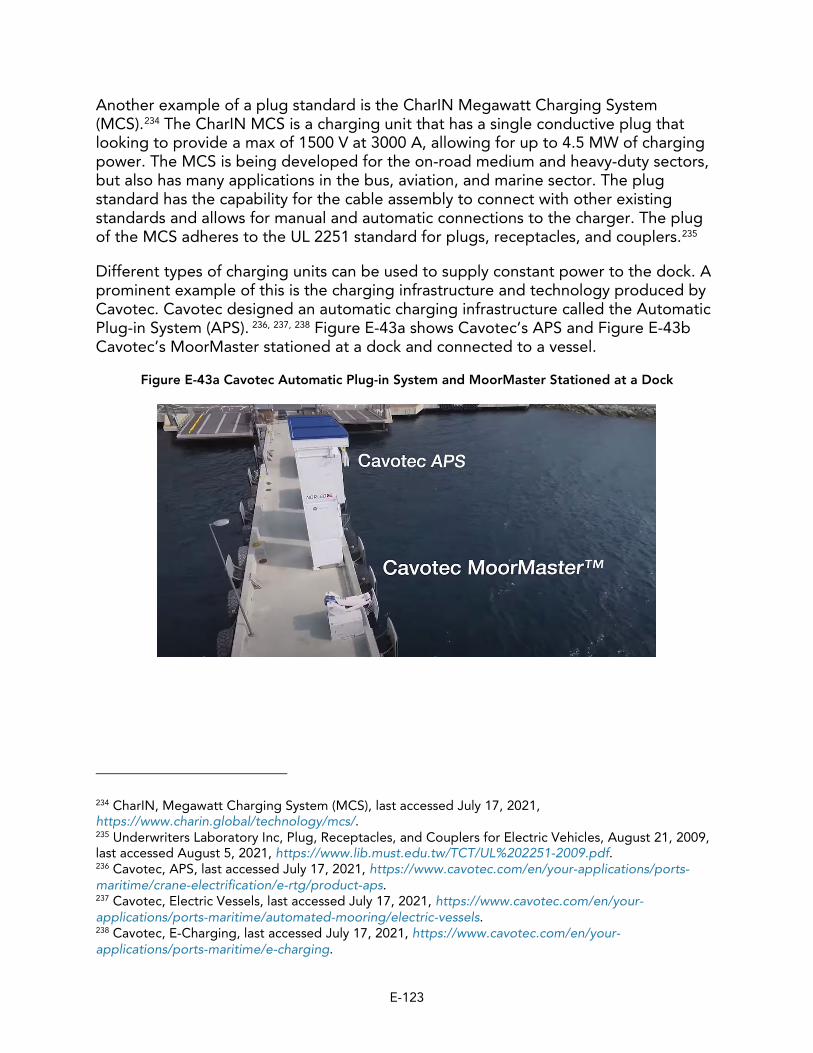
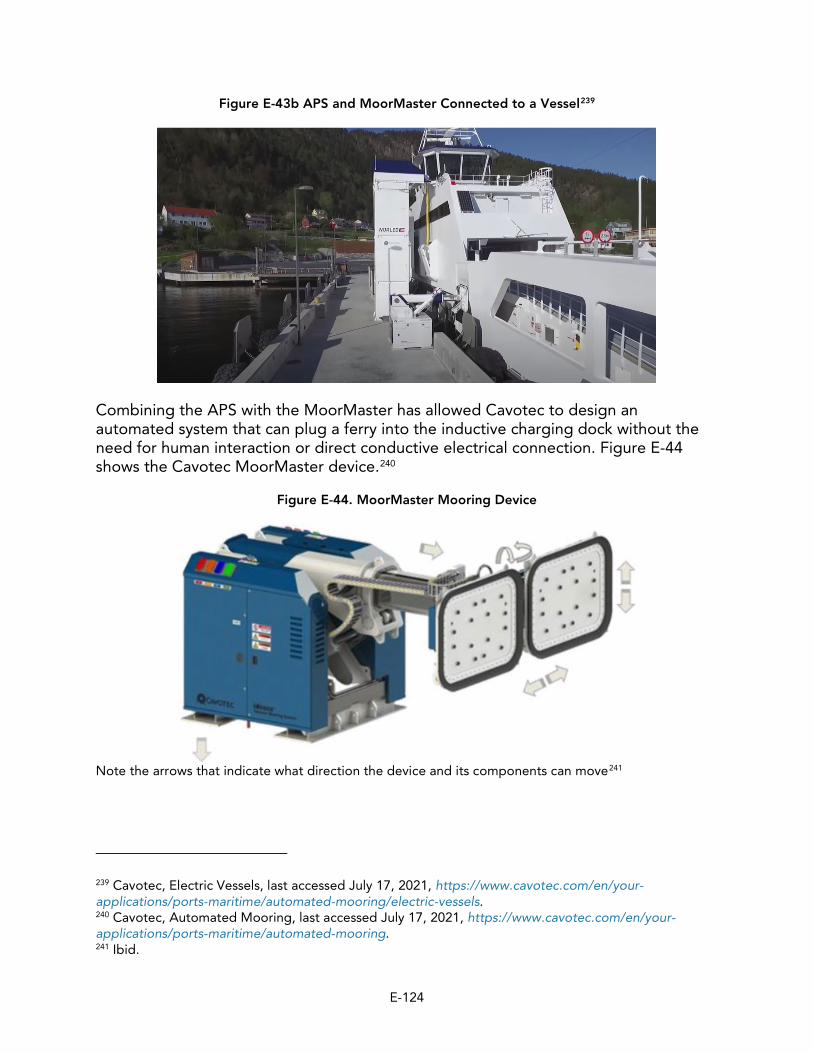
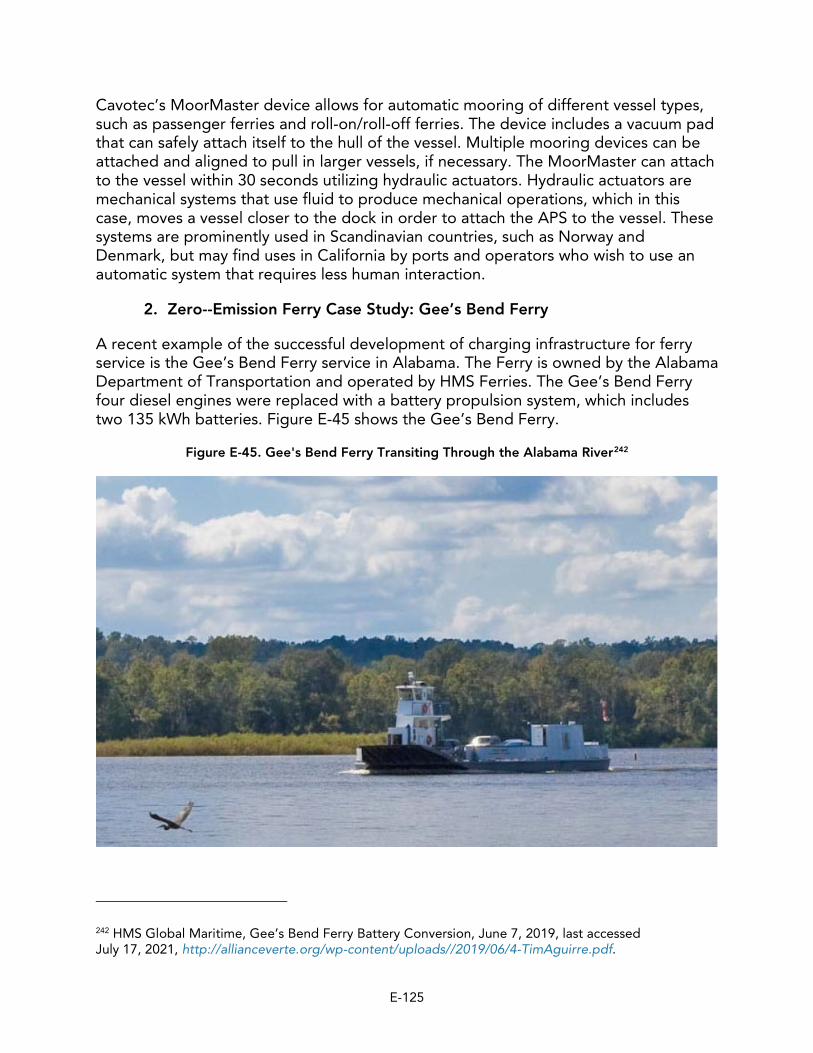
at a Dock ....................................................................................................... E-123 Figure E-43b APS and MoorMaster Connected to a Vessel ............................................... E-124 Figure E-44. MoorMaster Mooring Device ......................................................................... E-124 Figure E-45. Gee's Bend Ferry Transiting Through the Alabama River............................... E-125 Figure E-46. Gee's Bend Ferry Dock Charging Station....................................................... E-126
List of Tables
Table E-1. U.S. EPA Tier 1 Marine Engine Emission Standards (40 CFR Part 94) .................... E-4
Table E-3: U.S. EPA Tier 3 Marine Standards for Marine Diesel Category 1 Commercial
Table E-4: U.S. EPA Tier 3 Marine Standards for Marine Diesel Category 1 Recreational and Commercial High Power Density Engines below 3700 kW
Table E-5: U.S. EPA Tier 3 Marine Standards for Marine Diesel Category 2 Engines
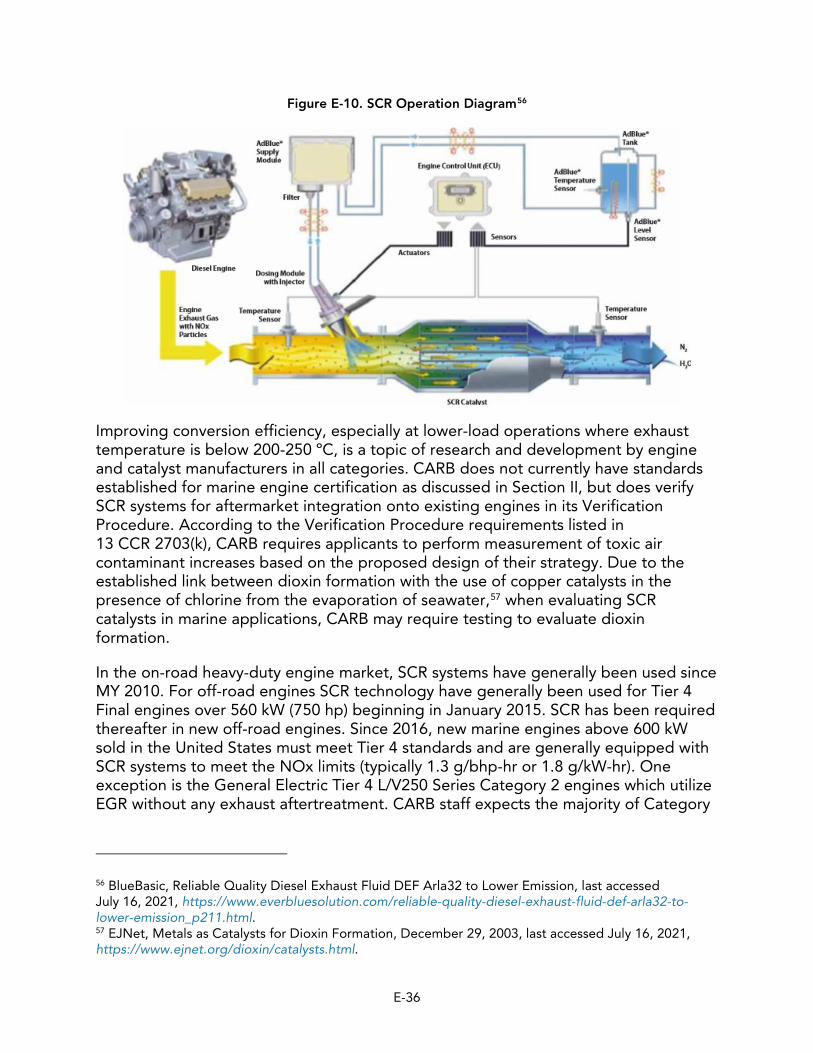
Table E-6: U.S. EPA Tier 4 Marine Standards for Marine Diesel Category 1 and
Table E-12. Stage III-A Emission Standards for EU Engines in Inland Waterway
Table E-13. EU Stage V Emission Standards for Engines in Inland Waterway Vessels
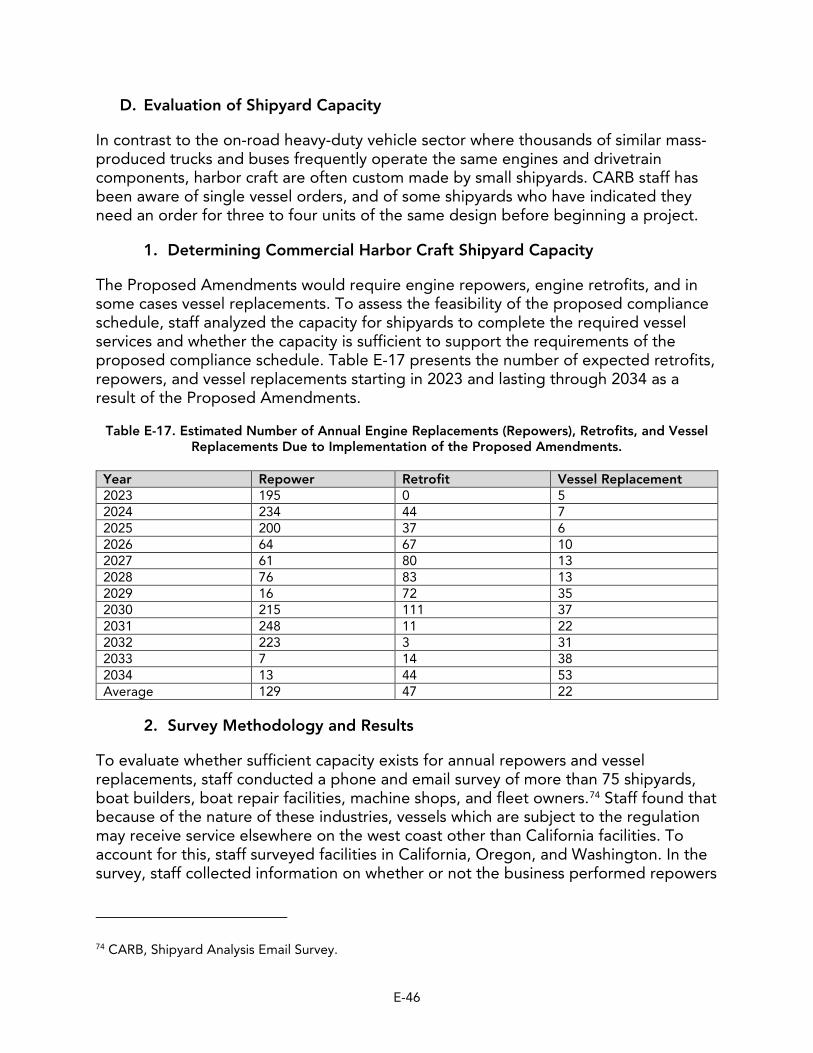
Table E-17. Estimated Number of Annual Engine Replacements (Repowers), Retrofits, and
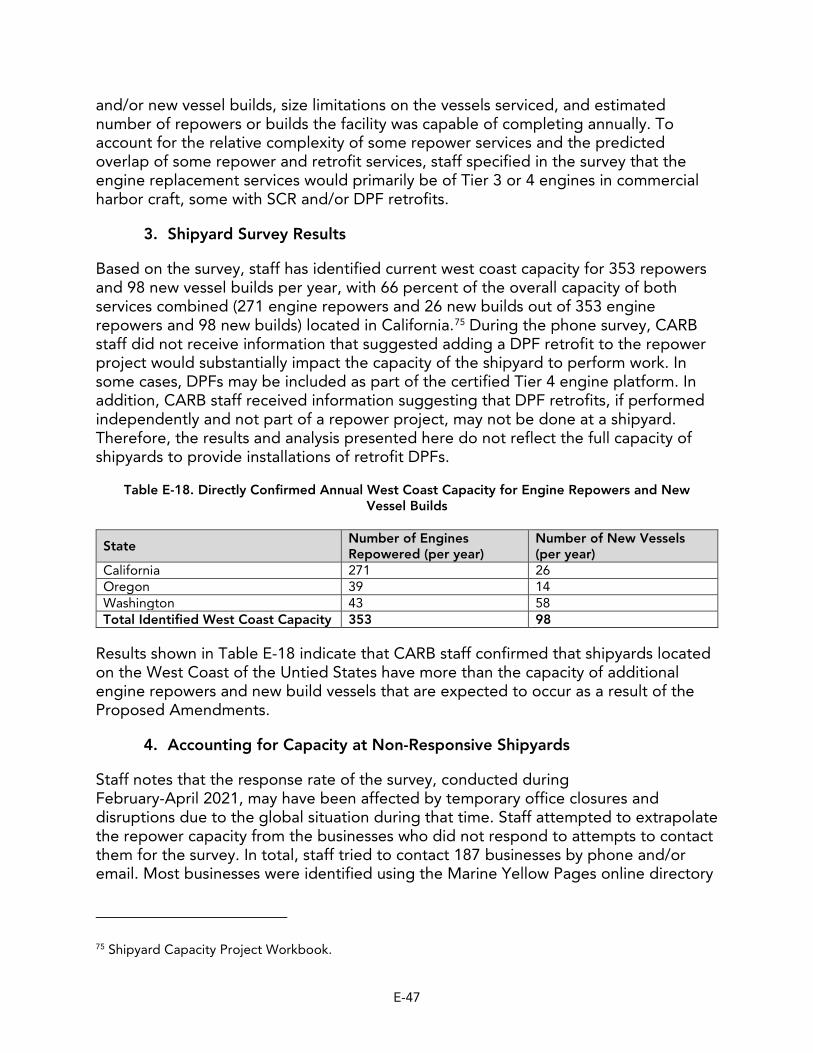
Table E-18. Directly Confirmed Annual West Coast Capacity for Engine Repowers and
Table E-19. Change in NOx and PM Emissions with Use of RD Compared to Conventional
Table E-2: U.S. EPA Tier 2 Marine Engine Emission Standards (40 CFR Part 94) .................... E-4
Standard Power Density Engines below 3700 kW (40 CFR Part 1042) .................. E-5
(40 CFR Part 1042) ................................................................................................ E-6
below 3700 kWa,b (40 CFR Part 1042).................................................................... E-6
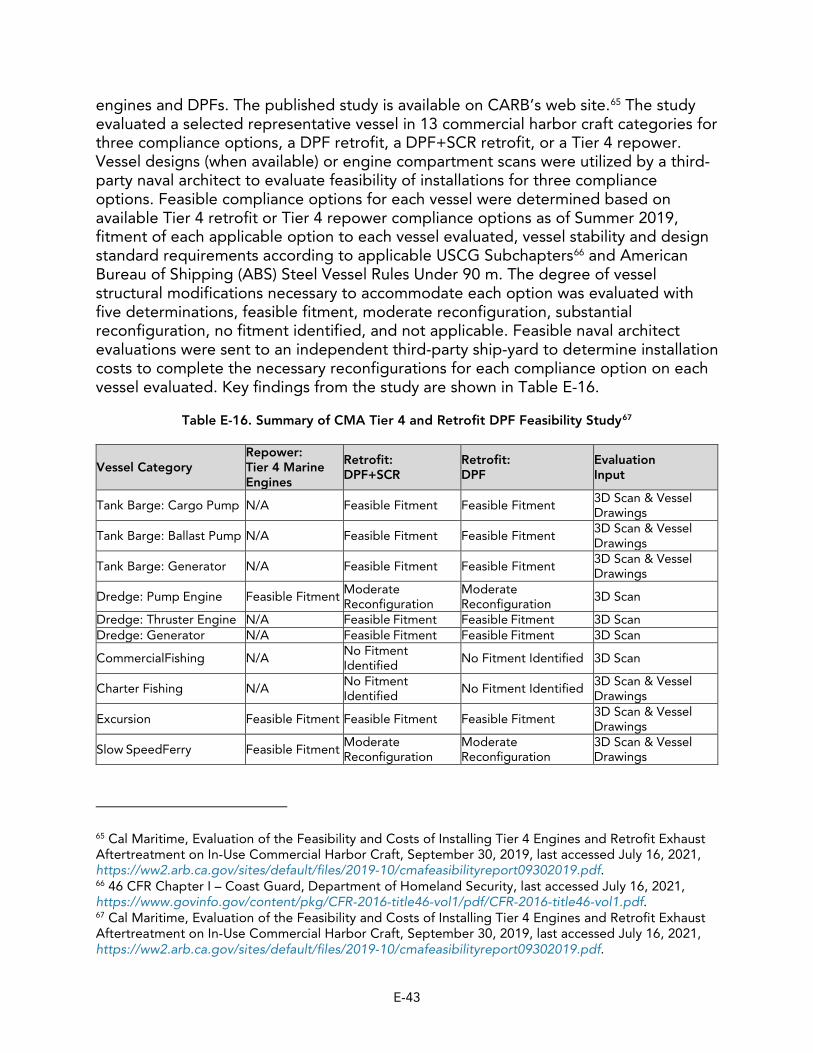
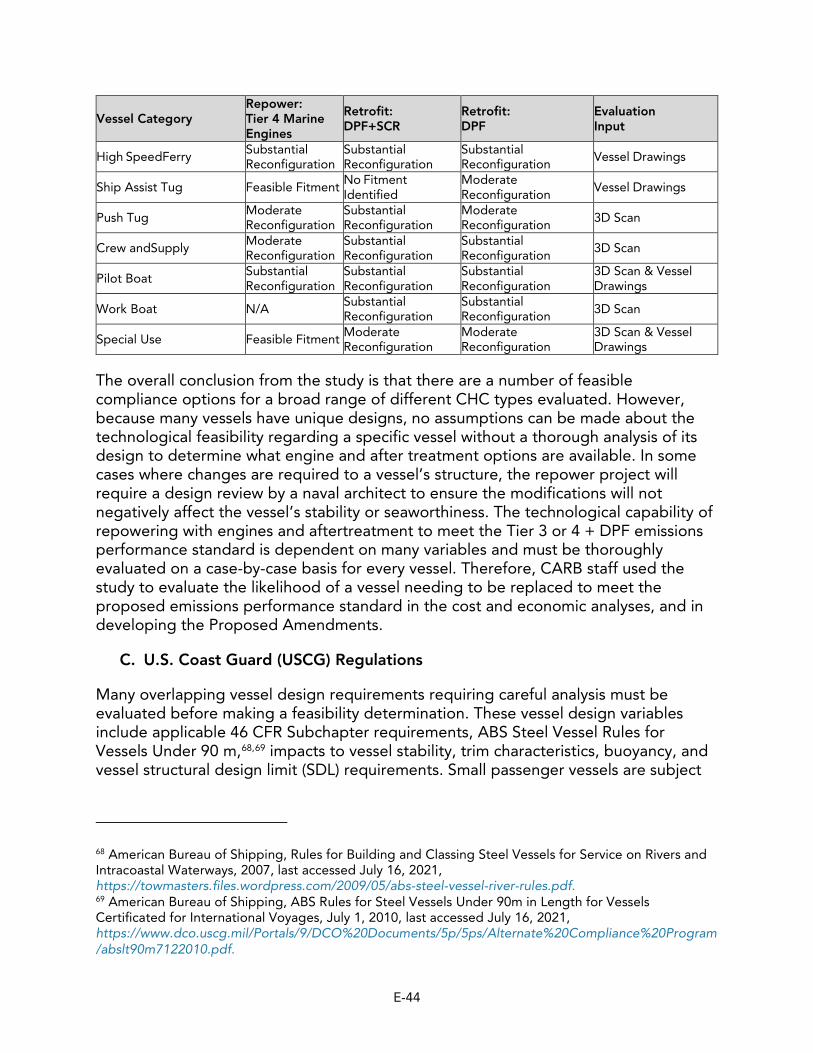
[Stage V Regulation (EU) 2016/1628, a].............................................................. E-13 Table E-14. MARPOL Annex VI NOx Emission Limits ........................................................... E-15 Table E-15. Currently Certified Tier 4 Marine Engines.......................................................... E-40 Table E-16. Summary of CMA Tier 4 and Retrofit DPF Feasibility Study.............................. E-43
Vessel Replacements Due to Implementation of the Proposed Amendments. .. E-46
New Vessel Builds .............................................................................................. E-47
Diesel in CHC.................................................................................................... E-61 Table E-20. Opacity for On-Road Vehicles in HDVIP and PSIP ............................................. E-73 Table E-21. CHE regulation Opacity Limits........................................................................... E-74
Table E-22. Equipment Type and Failure Rate...................................................................... E-79 Table E-23. SAE J1667 Opacity Tests Binned by CHE Limit (All Equipment)........................ E-80 Table E-24. Tested Vessels and Engines............................................................................... E-89 Table E-25. Test Result of the Opacity ................................................................................. E-89 Table E-26. Proposed Opacity Limits for Main Propulsion and Auxiliary Engines................. E-91 Table E-27. Commercially Available Meters Meeting SAE J1667 ......................................... E-92 Table E-28. Notable Commercial Harbor Craft Utilizing Zero-Emission and EEP
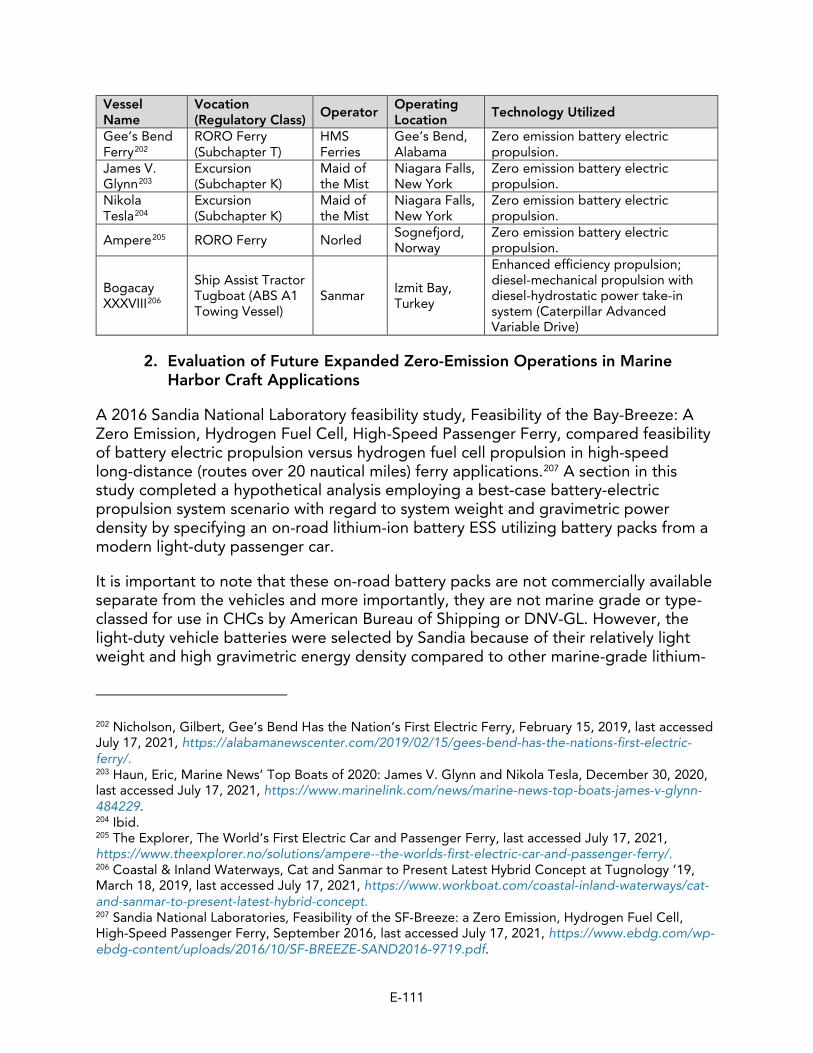
Technologies.................................................................................................... E-110 Table E-29. Comparison of Proposed Sandia Bay-Breeze Study Hydrogen Fuel Cell
System and Corvus Orca Battery ESS Relative to Conventional CARB Diesel When Evaluated for Deliverable Energy Content .................................. E-114
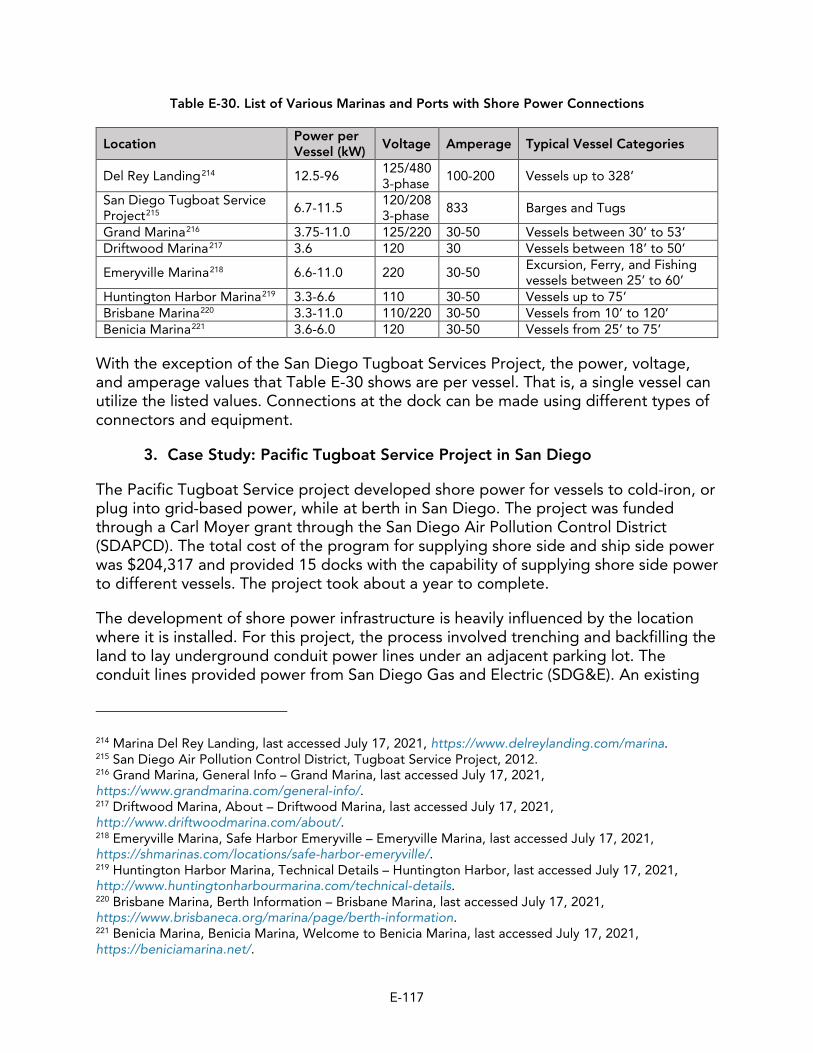
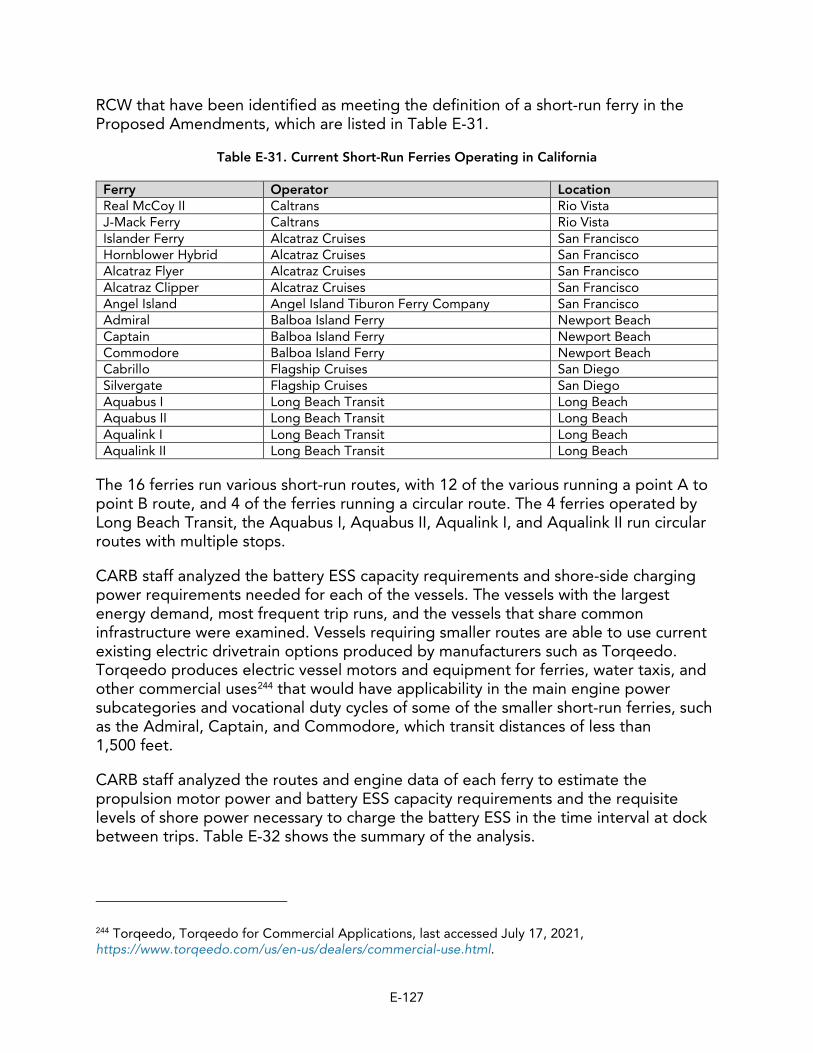
Table E-30. List of Various Marinas and Ports with Shore Power Connections ................... E-117 Table E-31. Current Short-Run Ferries Operating in California........................................... E-127 Table E-32. Analysis of Battery and Shore Power Infrastructure Power Requirements
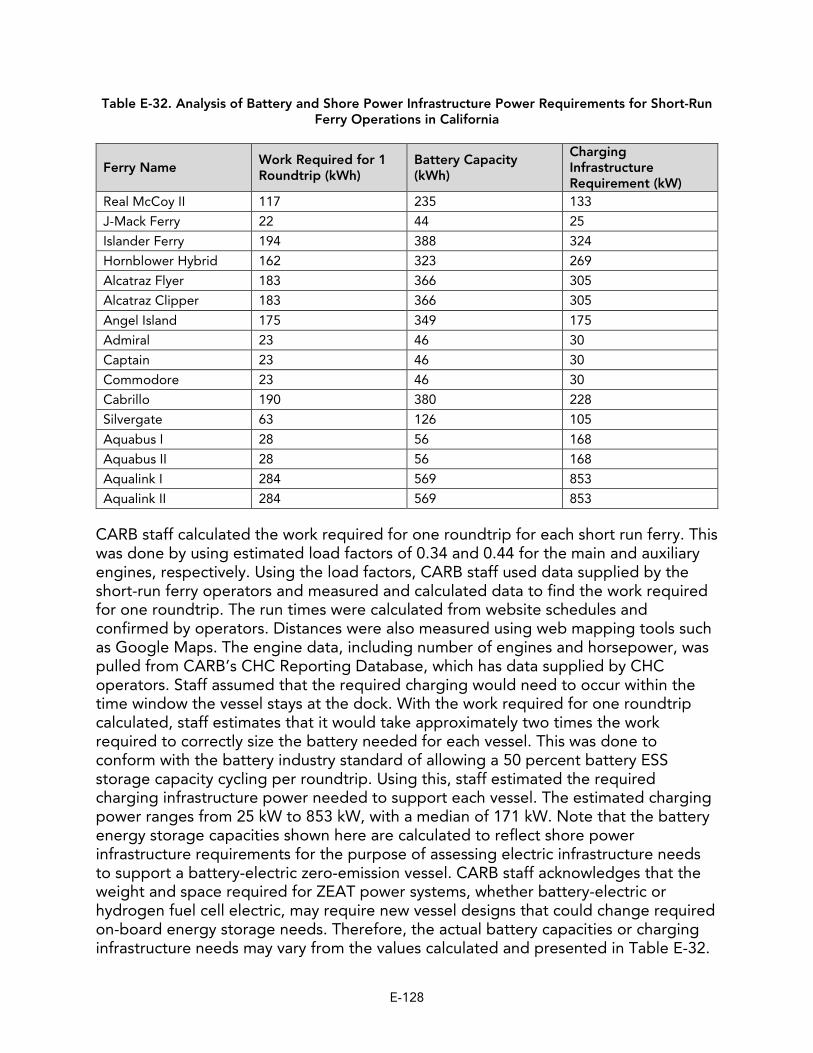
for Short-Run Ferry Operations in California .................................................... E-128
I. Introduction and Background
The purpose of this technology evaluation is to provide additional technical support and document California Air Resources Board (CARB) staff’s analysis of the emissions control technologies and opportunities to achieve reductions from the Commercial Harbor Craft (CHC) sector. CARB’s existing regulation for CHC in Title 17, California Code of Regulations (CCR) § 93118.5, broadly requires affected new and in-use CHC to meet performance standards.
After full implementation of the CHC regulation in 2022, achieving additional reductions will continue to require the use of lower-emitting diesel engines and other advanced technologies. There is a broad variety of harbor craft in California across a variety of vessel types including ferries, tugboats, fishing vessels, pilot vessels, barges, dredges, crew and supply vessels, workboats, and other types of special use vessels. Consequently, the engine and vessel configurations, and operational needs will vary widely across vessel categories, and also within each distinct vessel category. In addition, meeting proposed performance standards will require more stringency than U.S. EPA standards alone.
This appendix reviews and assesses the feasibility associated with the proposed performance standards for CHC, emission control strategies for marine engines; availability of equipment, vessel feasibility, and shipyard availability; fuels used on marine vessels; zero-emission and advanced technologies on marine vessels, and infrastructure required to support alternative fuel and zero-emission vessel operations.
E-1
II. Existing Emission Standards for Marine Diesel Engines
A. U.S. EPA Marine Standards
Diesel engines operating in harbor craft may be certified to one of many standards in effect depending on the jurisdiction and intended service of the engine. This section outlines the various standards of engines that may be used on CHC and contains discussion about differences in levels of stringency and opportunities for further control of emissions from marine engines on CHC in California.
Beginning with model year (MY) 2004 and newer engines, marine engines sold or intended for use in waters surrounding the United States (U.S.) must be certified to emission certification standards in effect as adopted by the U.S. Environmental Protection Agency (U.S. EPA). According to 40 Code of Federal Regulations (CFR) Part 1045, emission standards for spark-ignition marine propulsion engines at or above 250 kW maximum rated power are equivalent to the compression-ignition (diesel-cycle) marine engines as defined in 40 CFR Parts 94 and 1042. Virtually all reported CHC engines operating in Regulated California Waters (RCW) are compression-ignition to date, and therefore the focus of this document will be on compression-ignition engines.
U.S. EPA has adopted standards for marine compression-ignition engines, starting with Tier 1 engines beginning with MY 2004, and Tier 4 standards that phase in through MY 2017. Emission standards vary according to the model year, the engine category, power output, and cylinder displacement of the engine. Marine Tier 1 and 2 standards are codified in 40 CFR Part 94, and Marine Tier 3 and Tier 4 standards are codified in 40 CFR Part 1042. U.S. EPA Tier 4 marine standards apply only to engines with brake horsepower at or above 600 kW.
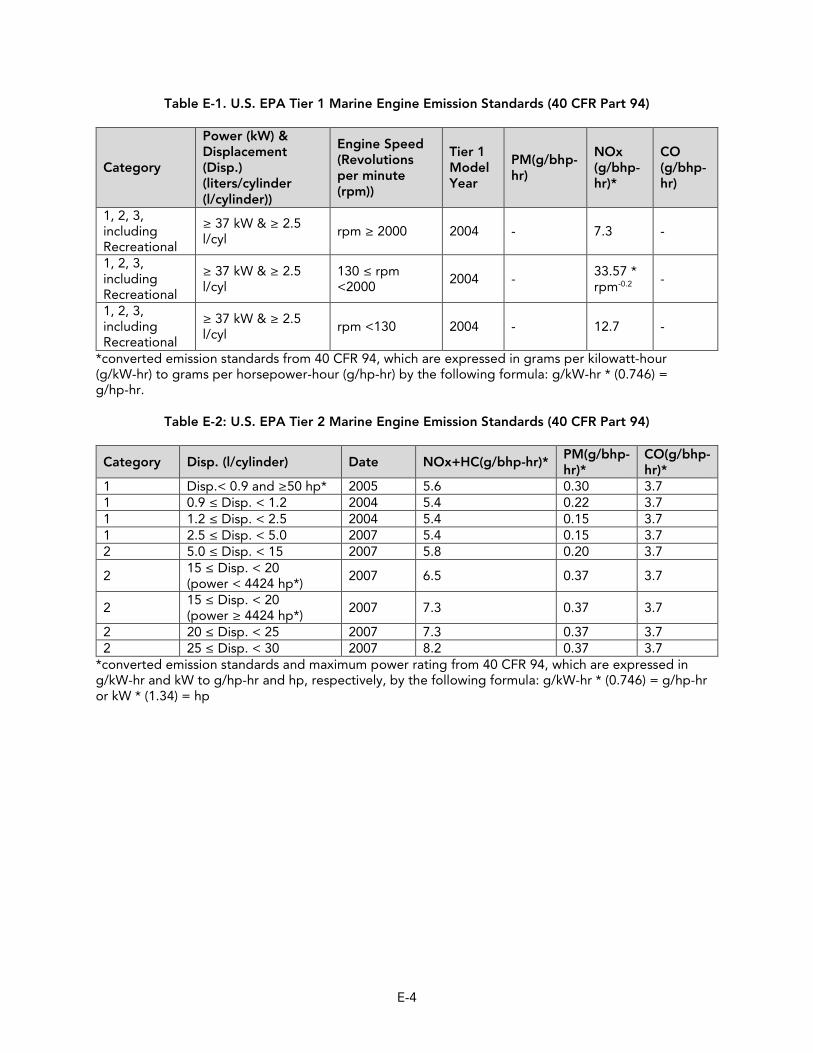
Engines are classified into three main categories according to engine cylinder displacement. Engine cylinder displacement refers to the theoretical swept air volume (at 100 percent volumetric efficiency) displaced by one of the engine pistons as it reciprocates through its full stroke as the engine crankshaft rotates one complete revolution. Although technically delineated by a range of cylinder displacements shown in Table E-2 below, Category 1 engines are classified as high-speed diesel engines (with typical operating engine speeds between 1000 and 1800 revolutions per minute (RPM), Category 2 are classified as medium speed (300-1000 RPM), and Category 3 are classified as low speed engines (80-300 RPM). Category 3 engines have cylinder displacements of 30 liters per cylinder or greater. Operational characteristics and throttle response of engines in different categories varies widely. For instance, Category 1 engines with either standard or high-power densities provide relatively fast response to throttle inputs for improved and safer vessel maneuvering. Larger displacement Category 2 and 3 engines are less responsive or unable to change engine torque and power as fast as Category 1 engines, which will impact vessel maneuverability. Low and medium-speed engines are considerably larger, heavier, and less responsive making them better suited for larger harbor craft. They
E-2
are often utilized in offshore towing and pushing applications or suction-hopper type dredging applications with extended periods of engine operation at high loads.
Based on regulatory reporting to CARB pursuant to 17 CCR 93118.5, over 95 percent of CHC engines are Category 1, although some larger vessels, such as ocean-going tugboats, anchor handling tugs/offshore supply, and articulated tug and barge combinations may be equipped with Category 2, and in some uncommon instances, Category 3 main propulsion engines. As will be discussed in later sections, Category 3 engines have no U.S. EPA particulate matter (PM) emission standards, and therefore PM control will need to be achieved by retrofit diesel particulate filter (DPF) aftertreatment alone in order to meet performance requirements of the Proposed Amendments.
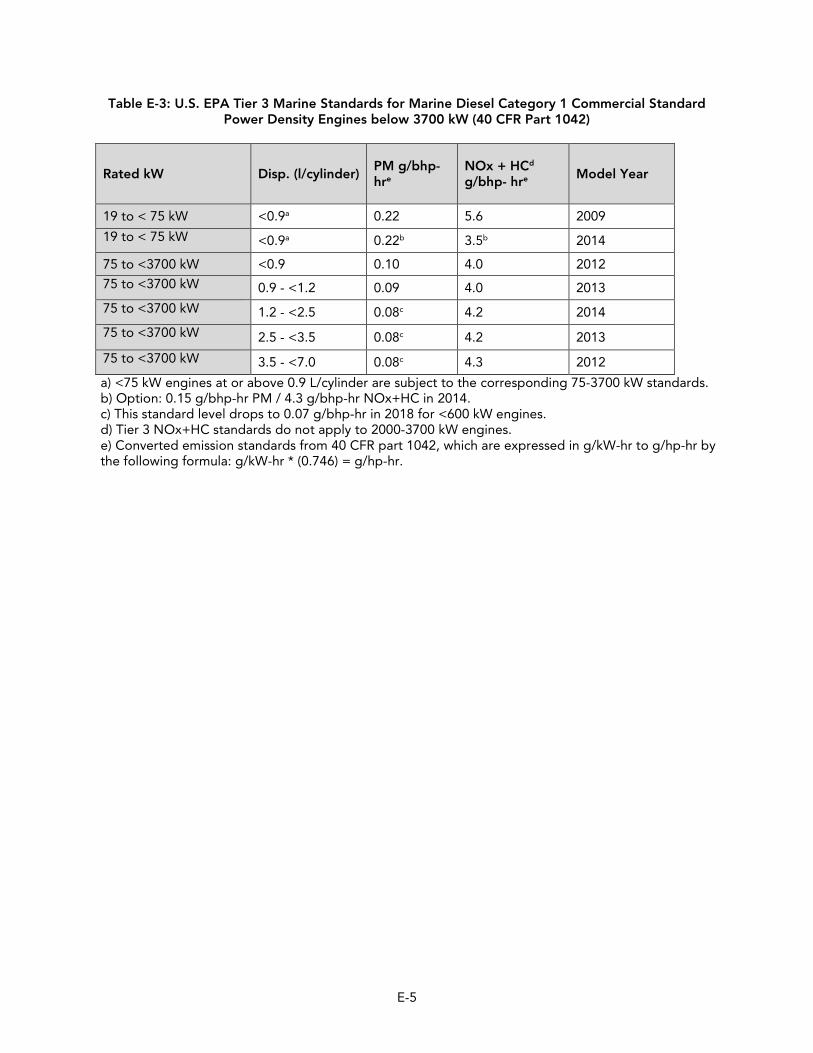
U.S. EPA Category 1, 2, and 3 marine compression ignition (CI) engines have emissions standards (Tier 1, 2, 3, and 4) for oxides of nitrogen (NOx), carbon monoxide (CO), hydrocarbons (HC), and particulate matter (PM) that become progressively cleaner as Tier levels increase. Tables E-1 through E-6 on the following pages detail the U.S. EPA Tier 1 through 4 marine emissions standards starting in 2004 through 2017 for both standard and high power density engines (power output >37 kW/L (>50 hp/L) displacement). As of the release of this document, Marine Tier 3 and Marine Tier 4 are fully in effect, and U.S. EPA has not adopted and does not have current plans to adopt more stringent certification standards for the marine sector. Numerical values in Tables E-1 – E-6 originate from 40 CFR Parts 94 and 1042 and are reproduced in the Current Regulation regulatory text as set forth in 17 CCR 93118.5. Certification emission testing procedures are set forth by U.S. EPA in 40 CFR Part 1065. For measuring PM emissions, 40 CFR Part 1065.145(f)(1) allows for the use of an optional cyclonic separator that must remove at least 50 percent of PM larger than 10 µm, and no more than 1 percent of PM smaller than 1 µm. Cyclonic separators are commonly used during certification because the infrequent stripping of particles from inside the exhaust transfer manifold or sampling systems can significantly contribute to increased variability and higher PM measurements. Although an imperfect comparison, the PM standards are more closely aligned with ambient PM2.5 measurements than PM1.0 or PM10 measurements. In the emission inventory, CARB staff uses certification PM values as PM10, see Appendix H for more details. In this document, CARB staff refers to PM as the U.S. EPA emission standards and does not specify size fraction.
E-3
Table E-1. U.S. EPA Tier 1 Marine Engine Emission Standards (40 CFR Part 94)
Category
Power (kW) & Displacement (Disp.) (liters/cylinder (l/cylinder))
Engine Speed (Revolutions per minute (rpm))
Tier 1 Model Year
PM(g/bhp-hr)
NOx (g/bhp-hr)*
CO (g/bhp-hr)
1, 2, 3, including Recreational
≥ 37 kW & ≥ 2.5 l/cyl
rpm ≥ 2000 2004 - 7.3 -
1, 2, 3, including Recreational
≥ 37 kW & ≥ 2.5 l/cyl
130 ≤ rpm <2000
2004 -33.57 * rpm-0.2 -
1, 2, 3, including Recreational
≥ 37 kW & ≥ 2.5 l/cyl
rpm <130 2004 - 12.7 -
*converted emission standards from 40 CFR 94, which are expressed in grams per kilowatt-hour (g/kW-hr) to grams per horsepower-hour (g/hp-hr) by the following formula: g/kW-hr * (0.746) = g/hp-hr.
Table E-2: U.S. EPA Tier 2 Marine Engine Emission Standards (40 CFR Part 94)
Category Disp. (l/cylinder) Date NOx+HC(g/bhp-hr)* PM(g/bhp-hr)*
*converted emission standards and maximum power rating from 40 CFR 94, which are expressed in g/kW-hr and kW to g/hp-hr and hp, respectively, by the following formula: g/kW-hr * (0.746) = g/hp-hr or kW * (1.34) = hp
E-4
Table E-3: U.S. EPA Tier 3 Marine Standards for Marine Diesel Category 1 Commercial Standard Power Density Engines below 3700 kW (40 CFR Part 1042)
Rated kW Disp. (l/cylinder) PM g/bhp-hre
NOx + HCd
g/bhp- hre Model Year
19 to < 75 kW <0.9a 0.22 5.6 2009
19 to < 75 kW <0.9a 0.22b 3.5b 2014
75 to <3700 kW <0.9 0.10 4.0 2012
75 to <3700 kW 0.9 - <1.2 0.09 4.0 2013
75 to <3700 kW 1.2 - <2.5 0.08c 4.2 2014
75 to <3700 kW 2.5 - <3.5 0.08c 4.2 2013
75 to <3700 kW 3.5 - <7.0 0.08c 4.3 2012
a) <75 kW engines at or above 0.9 L/cylinder are subject to the corresponding 75-3700 kW standards. b) Option: 0.15 g/bhp-hr PM / 4.3 g/bhp-hr NOx+HC in 2014. c) This standard level drops to 0.07 g/bhp-hr in 2018 for <600 kW engines. d) Tier 3 NOx+HC standards do not apply to 2000-3700 kW engines. e) Converted emission standards from 40 CFR part 1042, which are expressed in g/kW-hr to g/hp-hr by the following formula: g/kW-hr * (0.746) = g/hp-hr.
E-5
Table E-4: U.S. EPA Tier 3 Marine Standards for Marine Diesel Category 1 Recreational and Commercial High Power Density Engines below 3700 kW (40 CFR Part 1042)
Rated kW Disp. (l/cylinder)
PM g/bhp-hrc
NOx + HC g/bhp- hrc Model Year
19 to <75 kW <0.9a 0.22 5.6 2009
19 to <75 kW <0.9a 0.22b 3.5b 2014
75 to <3700 kW <0.9 0.11 4.3 2012
75 to <3700 kW 0.9 - <1.2 0.10 4.3 2013
75 to <3700 kW 1.2 - <2.5 0.09 4.3 2014
75 to <3700 kW 2.5 - <3.5 0.09 4.3 2013
75 to <3700 kW 3.5 - <7.0 0.08 4.3 2012
a) <75 kW engines at or above 0.9 L/cylinder are subject to the corresponding 75-3700 kW standards. b) Option: 0.15 g/bhp-hr PM / 4.3 g/bhp-hr NOx+HC in 2014. c) Converted emission standards, which are expressed in g/kW-hr to g/bhp-hr by the following formula: g/kW-hr * (0.746) = g/bhp-hr.
Table E-5: U.S. EPA Tier 3 Marine Standards for Marine Diesel Category 2 Engines below 3700 kWa,b (40 CFR Part 1042)
L/Cylinder Rated kW PM g/bhp- hrc
NOx+HC g/bhp-hrc Model Year
7 - <15 <2000 0.10 4.6 2013 7 - <15 ≥2000 0.10 5.8 2013 15 - <20a <2000 0.25 5.2 2014 20 - <25a <2000 0.20 7.3 2014 25 - <30a <2000 0.20 8.2 2014 d) No Tier 3 marine standards apply for Category 2 engines with per-cylinder displacement above 15.0 liters if maximum engine power is at or above 2000 kW. See “Tier 4 Marine Engine Emission Standards” for the standards that apply for these engines. e) For Category 2 engines at or above 1400 kW, optional f) Converted emission standards, which are expressed in g/kW-hr to g/bhp-hr by the following formula: g/kW-hr * (0.746) = g/bhp-hr.
Tier 3 and Tier 4 standards are available with some manufacturer restrictions, PM/NOx+HC at 0.10/5.8 g/bhp-hr in 2012, with Tier 4 standards in 2015.
E-6
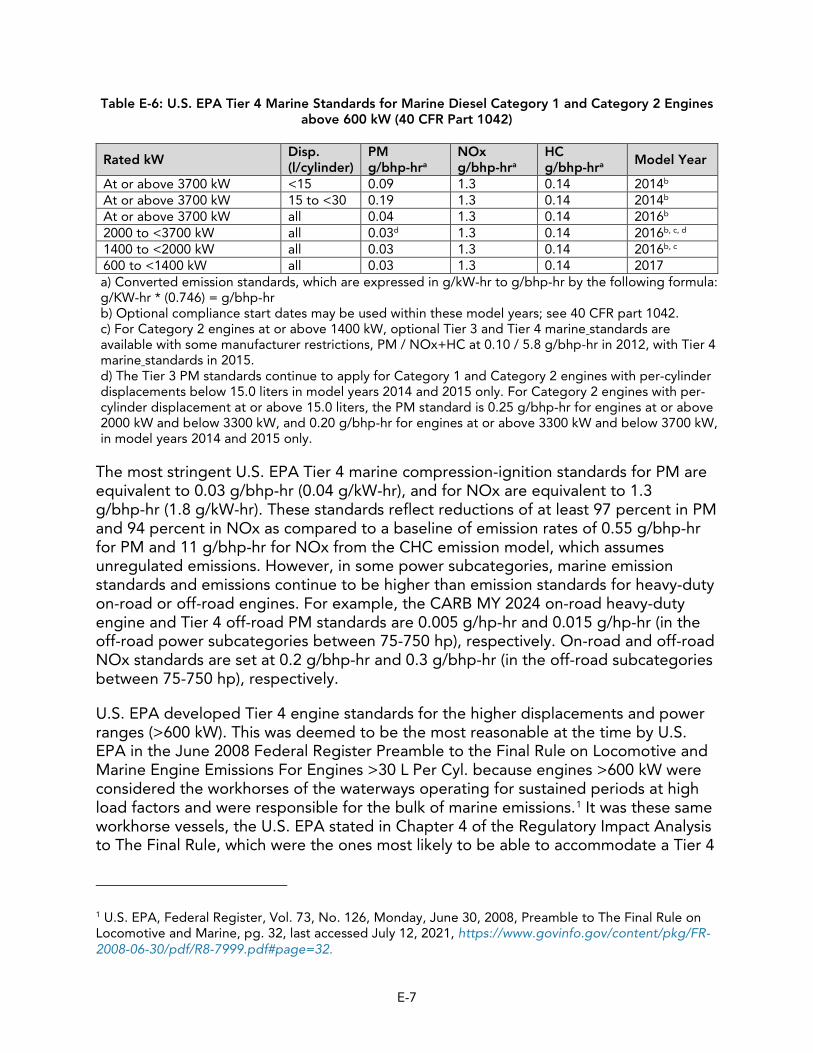
Table E-6: U.S. EPA Tier 4 Marine Standards for Marine Diesel Category 1 and Category 2 Engines above 600 kW (40 CFR Part 1042)
Rated kW Disp. (l/cylinder)
PM g/bhp-hra
NOx g/bhp-hra
HC g/bhp-hra Model Year
At or above 3700 kW <15 0.09 1.3 0.14 2014b
At or above 3700 kW 15 to <30 0.19 1.3 0.14 2014b
At or above 3700 kW all 0.04 1.3 0.14 2016b
2000 to <3700 kW all 0.03d 1.3 0.14 2016b, c, d
1400 to <2000 kW all 0.03 1.3 0.14 2016b, c
600 to <1400 kW all 0.03 1.3 0.14 2017 a) Converted emission standards, which are expressed in g/kW-hr to g/bhp-hr by the following formula: g/KW-hr * (0.746) = g/bhp-hr b) Optional compliance start dates may be used within these model years; see 40 CFR part 1042. c) For Category 2 engines at or above 1400 kW, optional Tier 3 and Tier 4 marine standards are available with some manufacturer restrictions, PM / NOx+HC at 0.10 / 5.8 g/bhp-hr in 2012, with Tier 4 marine standards in 2015. d) The Tier 3 PM standards continue to apply for Category 1 and Category 2 engines with per-cylinder displacements below 15.0 liters in model years 2014 and 2015 only. For Category 2 engines with per-cylinder displacement at or above 15.0 liters, the PM standard is 0.25 g/bhp-hr for engines at or above 2000 kW and below 3300 kW, and 0.20 g/bhp-hr for engines at or above 3300 kW and below 3700 kW, in model years 2014 and 2015 only.
The most stringent U.S. EPA Tier 4 marine compression-ignition standards for PM are equivalent to 0.03 g/bhp-hr (0.04 g/kW-hr), and for NOx are equivalent to 1.3 g/bhp-hr (1.8 g/kW-hr). These standards reflect reductions of at least 97 percent in PM and 94 percent in NOx as compared to a baseline of emission rates of 0.55 g/bhp-hr for PM and 11 g/bhp-hr for NOx from the CHC emission model, which assumes unregulated emissions. However, in some power subcategories, marine emission standards and emissions continue to be higher than emission standards for heavy-duty on-road or off-road engines. For example, the CARB MY 2024 on-road heavy-duty engine and Tier 4 off-road PM standards are 0.005 g/hp-hr and 0.015 g/hp-hr (in the off-road power subcategories between 75-750 hp), respectively. On-road and off-road NOx standards are set at 0.2 g/bhp-hr and 0.3 g/bhp-hr (in the off-road subcategories between 75-750 hp), respectively.
U.S. EPA developed Tier 4 engine standards for the higher displacements and power ranges (>600 kW). This was deemed to be the most reasonable at the time by U.S. EPA in the June 2008 Federal Register Preamble to the Final Rule on Locomotive and Marine Engine Emissions For Engines >30 L Per Cyl. because engines >600 kW were considered the workhorses of the waterways operating for sustained periods at high load factors and were responsible for the bulk of marine emissions.1 It was these same workhorse vessels, the U.S. EPA stated in Chapter 4 of the Regulatory Impact Analysis to The Final Rule, which were the ones most likely to be able to accommodate a Tier 4
1 U.S. EPA, Federal Register, Vol. 73, No. 126, Monday, June 30, 2008, Preamble to The Final Rule on Locomotive and Marine, pg. 32, last accessed July 12, 2021, https://www.govinfo.gov/content/pkg/FR-2008-06-30/pdf/R8-7999.pdf#page=32.
engine repower or retrofit to Tier 4 equivalency due to their larger engine compartments better suited to accommodating selective catalytic reduction (SCR) aftertreatment.2
B. CARB and U.S. EPA Certification Standards Off-Road Compression Ignition Engines
Both CARB and U.S. EPA have established off-road (CARB) or non-road (U.S. EPA) exhaust emission standards for a wide variety of heavy-duty off-road engines and equipment. A substantial fraction of the auxiliary engines operating on CHC in California are engines certified to the U.S. EPA or CARB off-road standards. Few or no off-road certified engines are currently used in main propulsion applications on CHC in (RCW).
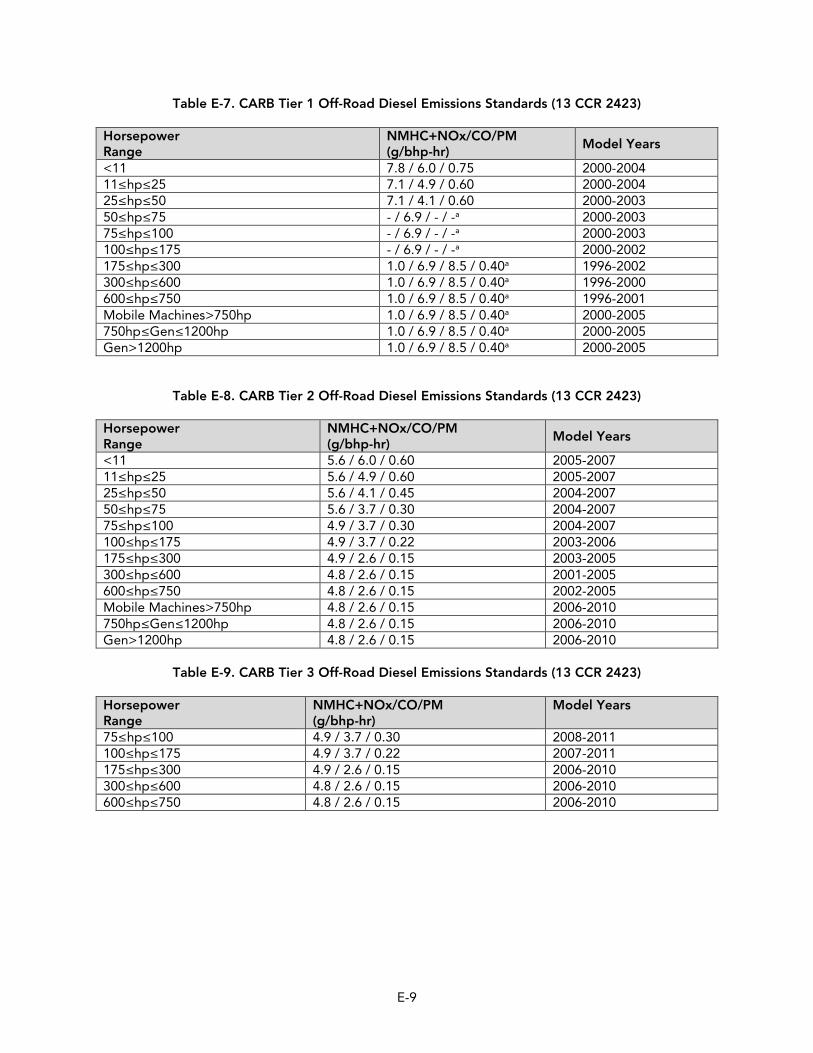
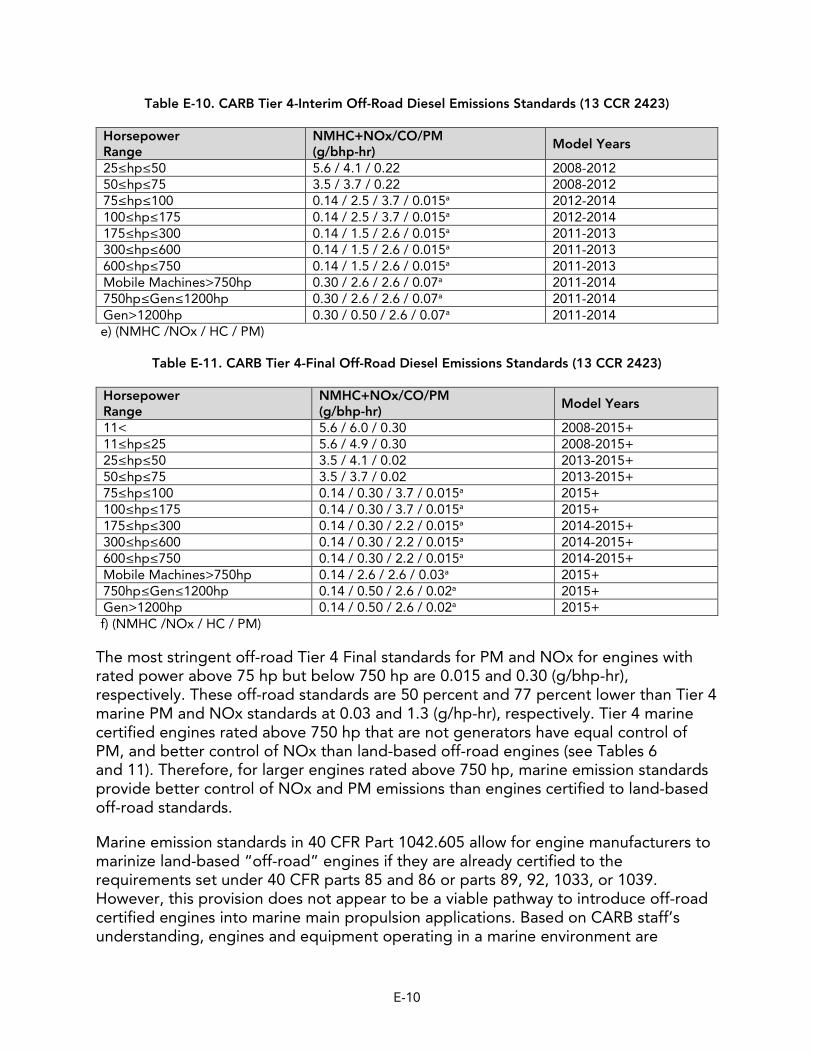
Tables E-7 through E-11 below present the Tier 1 through latest Tier 4 Final CARB Off-Road Diesel Emission Standards for non-methane hydrocarbons (NMHC), NOx, CO, and PM as set forth in 13 CCR 2423. As emissions standards become more stringent for multiple source categories, engine manufacturers typically utilize technologies and emission control strategies initially developed for the on-road sector to further reduce emissions from their off-road and marine diesel engine products. Note that like marine standards, off-road standards are dependent on engine power range, and standards in most horsepower subcategories are slightly lower for off-road than marine-certified engines for the same numerical engine tier level. Note that CARB Tier 4 Interim and Final off-road engines in mobile machines and generators >750 hp have more stringent emissions standards than engines in lower power subcategories of the same numerical engine tier level (see Tables E-10 and E-11). Additionally, new off-road emissions limits take effect at slightly earlier model years than marine engines.
2 U.S. EPA, Regulatory Impact Analysis: Control of Emissions of Air Pollution from Locomotive Engines and Marine Compression Ignition Engines Less than 30 Liters Per Cylinder, pg. 344, May 2008, last accessed July 12, 2021, https://nepis.epa.gov/Exe/ZyPDF.cgi/P10024CN.PDF?Dockey=P10024CN.PDF.
The most stringent off-road Tier 4 Final standards for PM and NOx for engines with rated power above 75 hp but below 750 hp are 0.015 and 0.30 (g/bhp-hr), respectively. These off-road standards are 50 percent and 77 percent lower than Tier 4 marine PM and NOx standards at 0.03 and 1.3 (g/hp-hr), respectively. Tier 4 marine certified engines rated above 750 hp that are not generators have equal control of PM, and better control of NOx than land-based off-road engines (see Tables 6 and 11). Therefore, for larger engines rated above 750 hp, marine emission standards provide better control of NOx and PM emissions than engines certified to land-based off-road standards.
Marine emission standards in 40 CFR Part 1042.605 allow for engine manufacturers to marinize land-based “off-road” engines if they are already certified to the requirements set under 40 CFR parts 85 and 86 or parts 89, 92, 1033, or 1039. However, this provision does not appear to be a viable pathway to introduce off-road certified engines into marine main propulsion applications. Based on CARB staff’s understanding, engines and equipment operating in a marine environment are
E-10
generally type classed by a classification society, such as the American Bureau of Shipping, and verified to be installed properly according to applicable 46 CFR Subchapters by a United States Coast Guard (USCG) Officer in Charge, Marine Inspection (OCMI) prior to an inspected vessel receiving USCG certification to operate in revenue service. Marinizing a land-based engine would require many component and design changes, including extensive hardware modifications, to enable the engine to meet the rigorous demands of a marine operating environment safely and reliably. For example, engine cooling systems may require design modification to handle high-power output for extended time periods and be converted to use raw-water heat exchangers rather than air passing through a radiator. These changes may consist of: liquid-cooled turbochargers; larger engine oil coolers; increases to oil pan capacity and oil pump capacity; higher capacity engine coolant pumps; new raw water pumps; different engine cooling system piping/castings; additional heat exchangers for engine coolant, oil, and charge air aftercooling; different camshafts; different injectors; different cylinder heads or block castings; a sealed non-sparking starter motor if electric starting is used; and possibly liquid-cooled exhaust manifolds to comply with surface temperature requirements. These marine-grade components and the castings required to interface to existing land-based engine blocks are different than those used on engines commercialized only in on-road or off-road applications. Therefore, installation of on-road and off-road land-based engines in most marine main propulsion applications is generally not a common occurrence, or possible in all CHC sectors.
C. International Marine Standards - Europe
The European Union (EU) has adopted emissions standards for non-road engines beginning in the 1990s. In the mid-2000s, the first standards took effect for engines operating in inland waterway vessels.3 Inland waterway vessels refers to floating commercial harbor craft designed for the carriage of goods or public transport of passengers by navigable inland waterways such as rivers, lakes, canals, and bays.
For larger bodies of water navigable by ocean-going vessels, only the International Maritime Organization (IMO) standards apply. For example, existing oxides of sulfur (SOx) standards were updated to include NOx standards in the Baltic Sea and North Sea emissions control areas (ECAs), which took effect on January 1, 2019. By January 1, 2021, all new ships built with engines over 130 kW will be required to meet
3 Official Journal of the European Union, Directive 2004/ 26/EC of the European Parliament and of the Council of 21 April, 2004, last accessed July 12, 2021, https://eur-lex.europa.eu/LexUriServ/LexUriServ.do?uri=OJ:L:2004:146:0001:0107:EN:PDF.
IMO III standards for both SOx and NOx.4 However, IMO III requirements are intended to control only NOx and SOx and do not contain PM standards.
Similar to U.S. EPA standards, the EU engine requirements are divided into categories based on the displacement per cylinder and net power output. The first inland waterway vessel emissions standards were established by EU Stage III-A. Stage I and II standards had PM limits, but only applied to non-road and not marine engines. There were no Stage III B or Stage IV standards set for inland waterway vessels. After Stage III-A, Inland waterway standards went straight to Stage V. EU Stage V requirements for inland waterway vessels were first implemented beginning January 1, 2019, for certain power subcategories. Tables E-12 and E-13 below present EU Stage III-A and Stage V standards for engines used in inland waterway vessels.
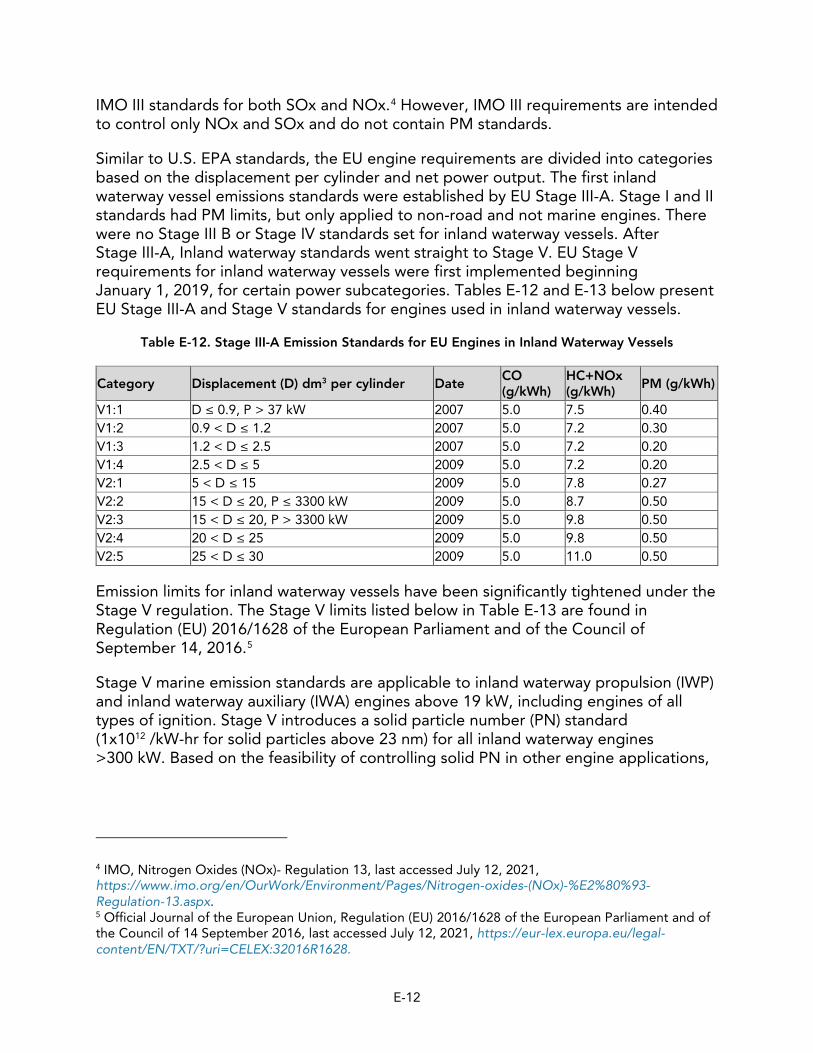
Table E-12. Stage III-A Emission Standards for EU Engines in Inland Waterway Vessels
Category Displacement (D) dm3 per cylinder Date CO (g/kWh)
HC+NOx (g/kWh) PM (g/kWh)
V1:1 D ≤ 0.9, P > 37 kW 2007 5.0 7.5 0.40 V1:2 0.9 < D ≤ 1.2 2007 5.0 7.2 0.30 V1:3 1.2 < D ≤ 2.5 2007 5.0 7.2 0.20 V1:4 2.5 < D ≤ 5 2009 5.0 7.2 0.20 V2:1 5 < D ≤ 15 2009 5.0 7.8 0.27 V2:2 15 < D ≤ 20, P ≤ 3300 kW 2009 5.0 8.7 0.50 V2:3 15 < D ≤ 20, P > 3300 kW 2009 5.0 9.8 0.50 V2:4 20 < D ≤ 25 2009 5.0 9.8 0.50 V2:5 25 < D ≤ 30 2009 5.0 11.0 0.50
Emission limits for inland waterway vessels have been significantly tightened under the Stage V regulation. The Stage V limits listed below in Table E-13 are found in Regulation (EU) 2016/1628 of the European Parliament and of the Council of September 14, 2016.5
Stage V marine emission standards are applicable to inland waterway propulsion (IWP) and inland waterway auxiliary (IWA) engines above 19 kW, including engines of all types of ignition. Stage V introduces a solid particle number (PN) standard (1x10¹² /kW-hr for solid particles above 23 nm) for all inland waterway engines >300 kW. Based on the feasibility of controlling solid PN in other engine applications,
4 IMO, Nitrogen Oxides (NOx)- Regulation 13, last accessed July 12, 2021, https://www.imo.org/en/OurWork/Environment/Pages/Nitrogen-oxides-(NOx)-%E2%80%93-Regulation-13.aspx. 5 Official Journal of the European Union, Regulation (EU) 2016/1628 of the European Parliament and of the Council of 14 September 2016, last accessed July 12, 2021, https://eur-lex.europa.eu/legal-content/EN/TXT/?uri=CELEX:32016R1628.
all EU Stage V engines MY 2020 and newer are anticipated to be originally equipped with a wall-flow DPF for power subcategories 300 kW or greater.
However, more efficient advanced combustion operating at higher injection pressures encountered in modern marine engines has also changed the characterization of engine-out PM which, is now often found to have a greater distribution of smaller ultra-fine solid particles. Use of a DPF will likely be required (where the PN standards are applicable) to meet the new solid PN standard introduced by EU Stage V for control of hazardous ultra-fine particulates. According to the International Council on Clean Transportation (ICCT) in 2016, the use of a DPF on modern non-road engines can further reduce PM emissions by a factor of four or five times compared to an identical engine without a DPF. Additionally, ICCT noted that a lack of DPFs on EU Stage IV and all previous EU Stage non-road engines presented the potential and significant risk of large uncontrolled releases of PM in the case of an engine or aftertreatment system malfunction. ICCT concluded that installing DPFs and implementing an in-use emissions monitoring and reporting program (managed by OEMs on applicable non-road and marine engines) would mitigate this risk.6
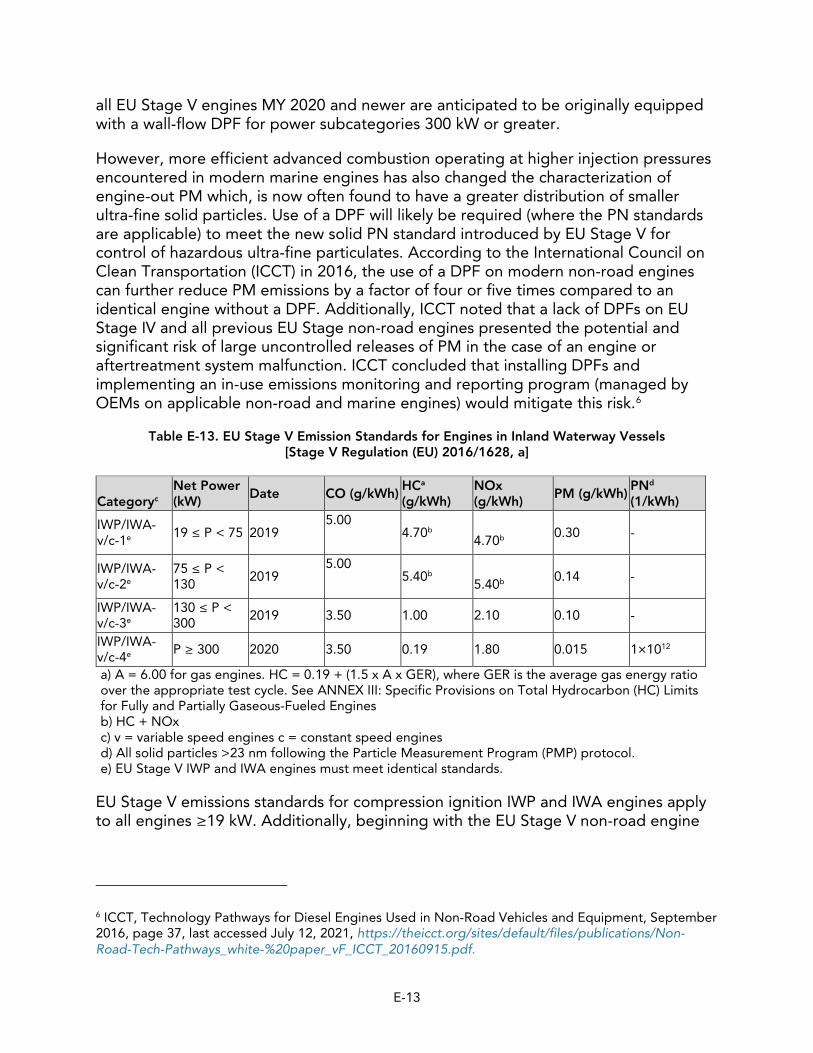
Table E-13. EU Stage V Emission Standards for Engines in Inland Waterway Vessels [Stage V Regulation (EU) 2016/1628, a]
Categoryc Net Power (kW) Date CO (g/kWh)
HCa
(g/kWh) NOx (g/kWh) PM (g/kWh)
PNd
(1/kWh)
IWP/IWA-v/c-1e 19 ≤ P < 75 2019
5.00 4.70b
4.70b 0.30 -
IWP/IWA-v/c-2e
75 ≤ P < 130
2019 5.00
5.40b
5.40b 0.14 -
IWP/IWA-v/c-3e
130 ≤ P < 300
2019 3.50 1.00 2.10 0.10 -
IWP/IWA-v/c-4e P ≥ 300 2020 3.50 0.19 1.80 0.015 1×10¹²
a) A = 6.00 for gas engines. HC = 0.19 + (1.5 x A x GER), where GER is the average gas energy ratio over the appropriate test cycle. See ANNEX III: Specific Provisions on Total Hydrocarbon (HC) Limits for Fully and Partially Gaseous-Fueled Engines b) HC + NOx c) v = variable speed engines c = constant speed engines d) All solid particles >23 nm following the Particle Measurement Program (PMP) protocol. e) EU Stage V IWP and IWA engines must meet identical standards.
EU Stage V emissions standards for compression ignition IWP and IWA engines apply to all engines ≥19 kW. Additionally, beginning with the EU Stage V non-road engine
6 ICCT, Technology Pathways for Diesel Engines Used in Non-Road Vehicles and Equipment, September 2016, page 37, last accessed July 12, 2021, https://theicct.org/sites/default/files/publications/Non-Road-Tech-Pathways_white-%20paper_vF_ICCT_20160915.pdf.
(NRE) standard and for these inland waterway engine standards, there are no longer separate standards delineating constant and variable speed engines.
Smaller Stage V IWP and IWA marine engines from 19-75 kW have PM standards 20 times higher (0.30 g/kW-hr) than engines in the ≥ 300 kW range (0.015 g/kW-hr). Smaller displacement compression ignition engines in lower power subcategories typically have basic fuel injection control systems, which rely on indirect injection or other lower-pressure fuel injection approaches, which tend to generate higher levels of PM and NOx. For engines in the 19 ≤ P < 75 kW power subcategory, the 0.30 g/kW-hr EU Stage V Standard range is roughly equivalent to U.S. EPA Tier 3 marine for PM at 0.22 g/hp-hr. Most of these small engines are only utilizing turbocharging and aftercooling and typically operate without exhaust aftertreatment. In 2016, the EU Stage V standards for IWP and IWA engines in the 19≤P<75 kW, 75≤P<130 kW, and 130≤P<300 kW power subcategories were deemed technologically achievable, not requiring additional time for technology transfer from other sectors, and were scheduled to be commercialized January 1, 2019, during the first phase-in period. Stage V standards for larger IWP and IWA engines in power subcategories ≥300 kW commercialized beginning January 1, 2020, during the second phase-in.7
D. International Maritime Organization (IMO) MARPOL
IMO is an agency of the United Nations formed to promote maritime safety and reduce harmful pollution from international shipping transportation. In 1973, IMO developed the international convention for the prevention of pollution from ships, MARPOL, subsequently modified by the protocol of 1978 and henceforth, known as MARPOL 73/78. In 1997, IMO created the MARPOL 73/78 Annex VI regulation to specifically target air pollution from international shipping. Annex VI entered into force on May 19, 2005, regulating NOx, SOx, PM, volatile organic compound (VOC) emissions, and shipboard incineration emissions. In 2008, revisions to MARPOL Annex VI that entered into force in 2010 created NOx emissions control areas (ECAs) surrounding the coastlines of signatory countries throughout the world representing 99.42 percent of all worldwide shipping.8 To reduce the environmental impact from acid rain, the 2008 amendments included a progressive reduction in fuel oil sulfur content worldwide reducing the global sulfur cap from the current 3.5 percent to 0.50 percent effective January 1, 2020. The United States is signatory to MARPOL Annex VI and there is a North American ECA from the coastline of the United States to a
7 Official Journal of the European Union, Regulation (EU) 2016/1628 of the European Parliament and of the Council of 14 September 2016, last accessed July 12, 2021, https://eur-lex.europa.eu/legal-content/EN/TXT/?uri=CELEX:32016R1628. 8 USCG, MARPOL Annex VI, (revised, 2008), last accessed July 12, 2021, https://homeport.uscg.mil/Lists/Content/Attachments/891/Brief%20on%20MARPOL%20Annex%20VI% 20(revised)_.pdf.
boundary line 200 nautical miles offshore. Table E-14 below shows the timeline of NOx requirements that are based on rated engine speed.
Table E-14. MARPOL Annex VI NOx Emission Limits
Tier Date NOx Limit, g/kWh, na < 130
NOx Limit, g/kWh, 130 ≤ n < 2000
NOx Limit, g/kWh, n ≥ 2000
Tier I 2000 17.0 45 · n -0.2 9.8 Tier II 2011 14.4 44 · n -0.23 7.7 Tier III 2016† 3.4 9 · n -0.2 1.96 a) n is the engine's maximum operating speed in revolutions per second (rpm). b) †Applies only in NOx Emission Control Areas (Tier II standards apply outside ECAs).
In California, some CHC such as ocean-going tugboats, articulated tug and barge combinations (ATBs), and some international ferries are required to operate engines certified to both IMO and U.S. EPA standards. Dual-certified marine diesel engines are not yet available in all power categories for Tier 4 and IMO III. Therefore, USCG, which is responsible for enforcing IMO MARPOL Annex VI in the North American ECA, has issued CVC-WI-014(1), a Work Instruction (WI), on an exemption from the IMO requirement pending commercialization of sufficient dual-certified marine engines.9
During this time, engines must still be certified by the U.S. EPA, which includes standards for NOx, PM, and other criteria pollutants. It is important to note that IMO III emission standards are aimed at reducing SOx and NOx pollution from engines used in international shipping, which are mostly larger category 3 engines, and do not address near-source health risks in coastal communities associated with PM emissions from harbor craft activity.
Because IMO engine emission requirements do not include a PM standard, there is little interest or opportunity for CARB to require engines certified to IMO standards to achieve additional control of PM emissions when operating in Regulated California Waters.
9 USCG Office of Commercial Vessel Compliance (CG-CVC) Mission Management System (MMS) Work Instruction, CVC-WI-014(1), Exercise of Enforcement Discretion With Regard to MARPOL Annex VI Regulation 13.5.1.2, October 7, 2018, last accessed July 12, 2021, https://www.dco.uscg.mil/Portals/9/DCO%20Documents/5p/CG-5PC/CG-CVC/CVC_MMS/CVC-WI-014(1).pdf.
III. Engine Emission Control and On-Board Engine Technologies
Implementation of CARB, U.S. EPA, EU, and IMO engine standards has resulted in a wide range of emission control strategies and engine design improvements that have been developed, refined, and incorporated into engines operating in on-road, off-road, marine, and other industrial applications. This section will highlight the strategies that either currently, or may in the future, be viable to incorporate into engines used in CHC. Because California currently does not set emissions standards for new marine engines, the focus of this section will be mostly on U.S. EPA marine emission standards. The overview will be presented in two sections: in-cylinder or engine component design strategies (generally used to meet U.S. EPA Marine Tier 1, 2, and 3 standards) and post-combustion or aftertreatment strategies (generally used to meet U.S. EPA Marine Tier 4 standards).
A. In-cylinder strategies
1. Retarded Injection Timing
Retarded injection timing is an in-cylinder strategy to reduce NOx emissions that is often used with other design changes to simultaneously meet more stringent PM standards. Retarded injection timing refers to the late injection of diesel fuel relative to the moment of maximum pressure of the cylinder during the combustion cycle, which decreases the amount of premixed air/fuel injected into the cylinder before combustion begins, and effectively reduces peak temperature and pressure of the cylinders to abate NOx formation.10
Injecting fuel into compression ignition engine cylinders at a later point in the compression stroke where higher compression-stroke temperatures and pressures occur tends to improve initial combustion of premixed air/fuel and lower peak combustion temperatures and pressures achieved. Lower peak cylinder pressures and temperatures reduce the formation of NOx; however, more fuel must be injected to offset efficiency losses and this may also simultaneously increase the PM formation from the engine under certain load conditions. The combination of retarded injection timing lowering NOx but requiring more fuel injected into cooler lower-pressure combustion chambers is one of the reasons why generally, engine-out PM and NOx are both generated during diesel fuel combustion with a somewhat inverse relationship. Moreover, engine manufacturers have developed other in-cylinder strategies to concurrently reduce PM emissions. For example, U.S. EPA Tier 4 marine engines operating today have relatively stringent PM emissions standards of 0.03 g/hp-hr (0.04 g/kW-hr) and utilize a number of in-cylinder strategies to control PM emissions that typically require the use of SCR aftertreatment or exhaust gas recirculation (EGR) to control the increased engine-out NOx resulting from the
10 Majewski and Khair, Diesel Emissions and Their Control, Print Edition, Published 2006, pgs. 111-112.
E-16
in-cylinder strategies to control PM. In-cylinder strategies to reduce NOx often increase PM and in-cylinder strategies to reduce PM raise peak cylinder pressures and temperatures increasing the formation of NOx. Retarded injection timing was introduced into marine engines starting around 2009 for Tier 3 marine engines, and is still used in many engines as a strategy to reduce in-cylinder formation of NOx emissions.
Significantly increased heat rejection is an important consideration in harbor craft applications when repowering or building vessels with modern marine diesel engines, which are designed to operate with retarded injection timing, EGR, or active aftertreatment systems that may require additional fuel consumption to keep exhaust aftertreatment systems above threshold temperatures. A vessel’s keel cooler or other cooling system components need to meet engine cooling system requirements and may require modification to handle increased heat rejection characteristic of some modern marine engines. Under the current CHC regulation in California, a significant number of vessels have been successfully repowered and/or rebuilt to engines certified to U.S. EPA Tier 2, Tier 3, and Tier 4 marine standards with various engine platforms and so the necessary modifications have been widely adopted and applied into in-use vessels.
2. Combustion Chamber Enhancements
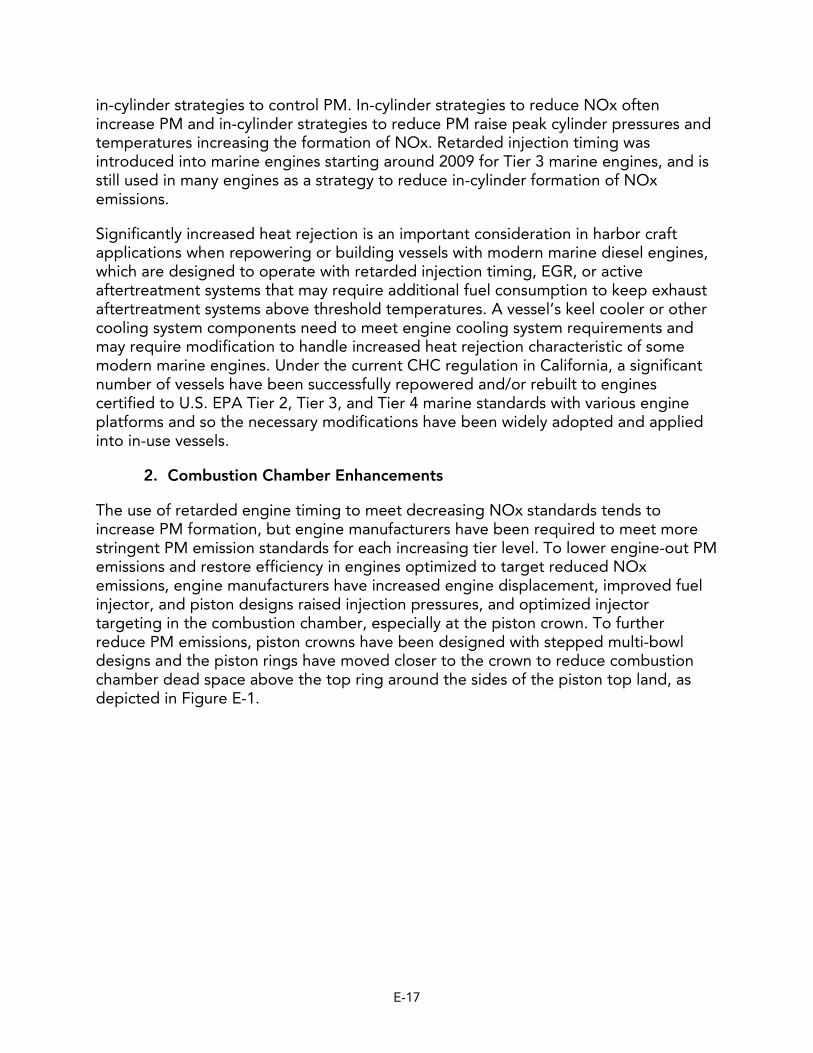
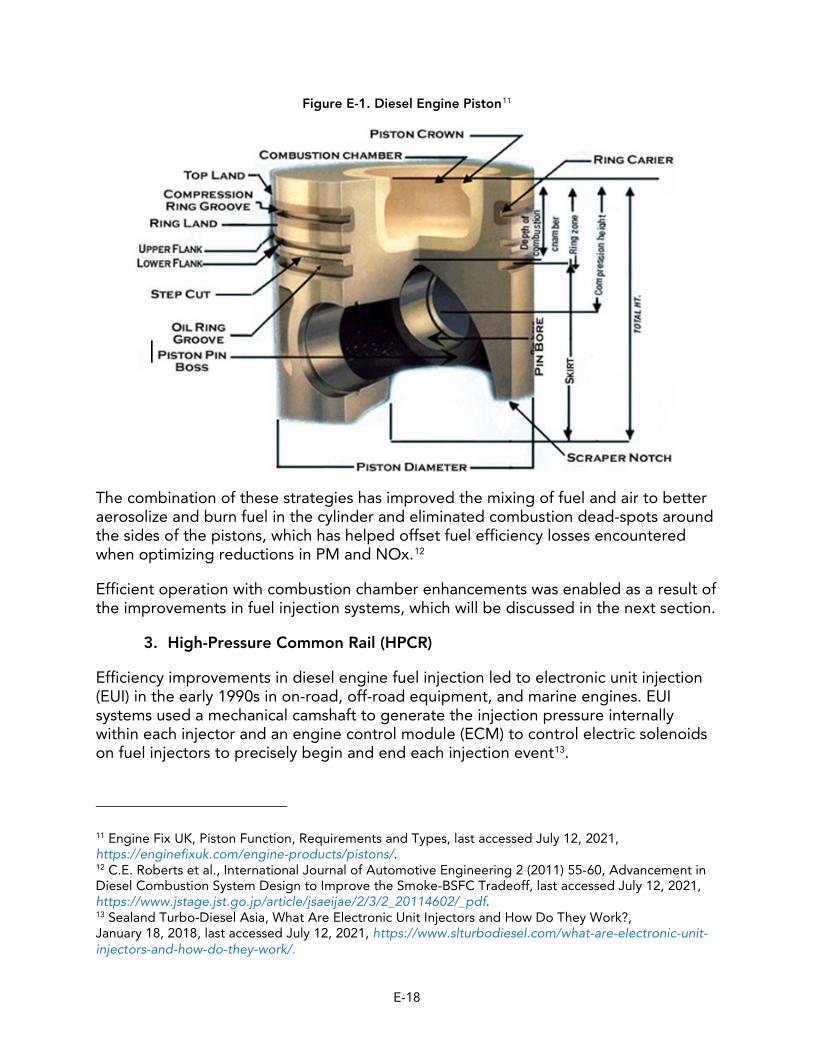
The use of retarded engine timing to meet decreasing NOx standards tends to increase PM formation, but engine manufacturers have been required to meet more stringent PM emission standards for each increasing tier level. To lower engine-out PM emissions and restore efficiency in engines optimized to target reduced NOx emissions, engine manufacturers have increased engine displacement, improved fuel injector, and piston designs raised injection pressures, and optimized injector targeting in the combustion chamber, especially at the piston crown. To further reduce PM emissions, piston crowns have been designed with stepped multi-bowl designs and the piston rings have moved closer to the crown to reduce combustion chamber dead space above the top ring around the sides of the piston top land, as depicted in Figure E-1.
E-17
CR,OWN ___ .,
COMBUSTION CH .M9ER---...,;
UPPERF'LANK---"' l.oWERFl.ANK,----
S'fEP CUT __ ,,
OIL.RING GROOVE I P,ISTON PIN ------P"""""""' Boss
·PISTON DIAM TER:----
Figure E-1. Diesel Engine Piston11
The combination of these strategies has improved the mixing of fuel and air to better aerosolize and burn fuel in the cylinder and eliminated combustion dead-spots around the sides of the pistons, which has helped offset fuel efficiency losses encountered when optimizing reductions in PM and NOx.12
Efficient operation with combustion chamber enhancements was enabled as a result of the improvements in fuel injection systems, which will be discussed in the next section.
3. High-Pressure Common Rail (HPCR)
Efficiency improvements in diesel engine fuel injection led to electronic unit injection (EUI) in the early 1990s in on-road, off-road equipment, and marine engines. EUI systems used a mechanical camshaft to generate the injection pressure internally within each injector and an engine control module (ECM) to control electric solenoids on fuel injectors to precisely begin and end each injection event13.
11 Engine Fix UK, Piston Function, Requirements and Types, last accessed July 12, 2021, https://enginefixuk.com/engine-products/pistons/. 12 C.E. Roberts et al., International Journal of Automotive Engineering 2 (2011) 55-60, Advancement in Diesel Combustion System Design to Improve the Smoke-BSFC Tradeoff, last accessed July 12, 2021, https://www.jstage.jst.go.jp/article/jsaeijae/2/3/2_20114602/_pdf. 13 Sealand Turbo-Diesel Asia, What Are Electronic Unit Injectors and How Do They Work?, January 18, 2018, last accessed July 12, 2021, https://www.slturbodiesel.com/what-are-electronic-unit-injectors-and-how-do-they-work/.
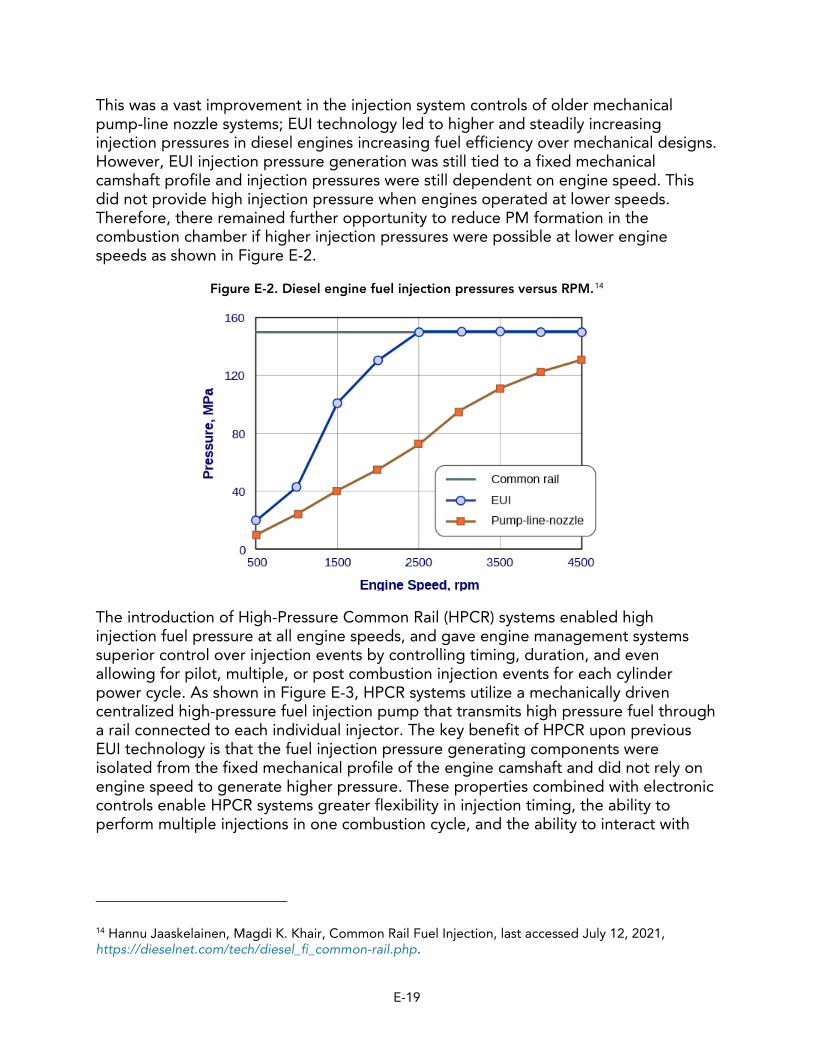
This was a vast improvement in the injection system controls of older mechanical pump-line nozzle systems; EUI technology led to higher and steadily increasing injection pressures in diesel engines increasing fuel efficiency over mechanical designs. However, EUI injection pressure generation was still tied to a fixed mechanical camshaft profile and injection pressures were still dependent on engine speed. This did not provide high injection pressure when engines operated at lower speeds. Therefore, there remained further opportunity to reduce PM formation in the combustion chamber if higher injection pressures were possible at lower engine speeds as shown in Figure E-2.
Figure E-2. Diesel engine fuel injection pressures versus RPM.14
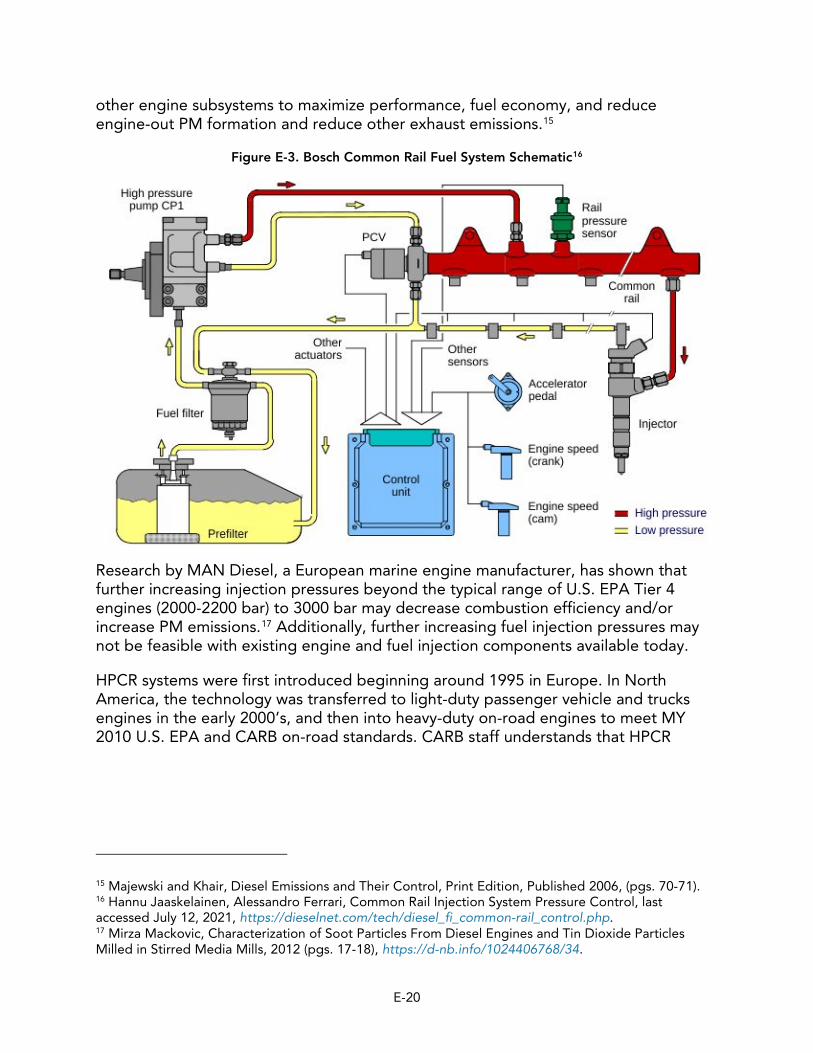
The introduction of High-Pressure Common Rail (HPCR) systems enabled high injection fuel pressure at all engine speeds, and gave engine management systems superior control over injection events by controlling timing, duration, and even allowing for pilot, multiple, or post combustion injection events for each cylinder power cycle. As shown in Figure E-3, HPCR systems utilize a mechanically driven centralized high-pressure fuel injection pump that transmits high pressure fuel through a rail connected to each individual injector. The key benefit of HPCR upon previous EUI technology is that the fuel injection pressure generating components were isolated from the fixed mechanical profile of the engine camshaft and did not rely on engine speed to generate higher pressure. These properties combined with electronic controls enable HPCR systems greater flexibility in injection timing, the ability to perform multiple injections in one combustion cycle, and the ability to interact with
14 Hannu Jaaskelainen, Magdi K. Khair, Common Rail Fuel Injection, last accessed July 12, 2021, https://dieselnet.com/tech/diesel_fi_common-rail.php.
other engine subsystems to maximize performance, fuel economy, and reduce engine-out PM formation and reduce other exhaust emissions.15
Figure E-3. Bosch Common Rail Fuel System Schematic16
igh pressure pump CPl
---,;::i:i
Prefilter
Olher acUJa:tors
Control unit
0
Engine speed (cam)
Injector
• High pressure
_ Low pressure
li
Research by MAN Diesel, a European marine engine manufacturer, has shown that further increasing injection pressures beyond the typical range of U.S. EPA Tier 4 engines (2000-2200 bar) to 3000 bar may decrease combustion efficiency and/or increase PM emissions.17 Additionally, further increasing fuel injection pressures may not be feasible with existing engine and fuel injection components available today.
HPCR systems were first introduced beginning around 1995 in Europe. In North America, the technology was transferred to light-duty passenger vehicle and trucks engines in the early 2000’s, and then into heavy-duty on-road engines to meet MY 2010 U.S. EPA and CARB on-road standards. CARB staff understands that HPCR
15 Majewski and Khair, Diesel Emissions and Their Control, Print Edition, Published 2006, (pgs. 70-71). 16 Hannu Jaaskelainen, Alessandro Ferrari, Common Rail Injection System Pressure Control, last accessed July 12, 2021, https://dieselnet.com/tech/diesel_fi_common-rail_control.php. 17 Mirza Mackovic, Characterization of Soot Particles From Diesel Engines and Tin Dioxide Particles Milled in Stirred Media Mills, 2012 (pgs. 17-18), https://d-nb.info/1024406768/34.
technology began to be more widely used on marine engines to meet U.S. EPA marine Tier 3 standards.18
Current levels of emission control from U.S. EPA Tier 4 marine engines can meet a 0.03 g PM/bhp-hr standard without aftertreatment such as DPFs. HPCR and other strategies have also been used to meet California off-road standards of 0.015 g/bhp-hr without using DPF aftertreatment.19 Achieving PM control significantly below 0.015 g/bhp-hr has not been widely demonstrated as of today. Meeting EU standards based on counting solid particles has also been shown to not be feasible with in-cylinder strategies alone.20 Aftertreatment options will be explored in the next section, which can provide additional reductions of diesel PM, NOx, and other toxic air contaminants to achieve additional health protections.
4. Exhaust Gas Recirculation
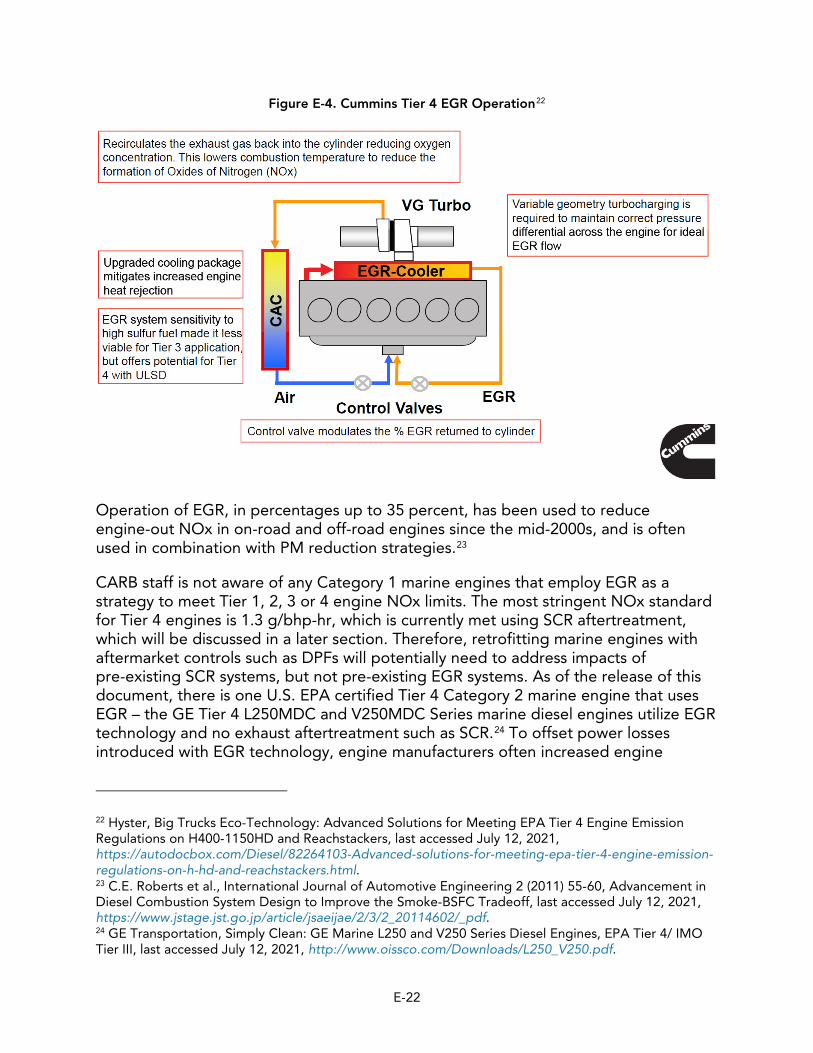
Exhaust Gas Recirculation (EGR) is a NOx emission control strategy that recirculates cooled exhaust back into the combustion chamber mixed with intake charge air. By recirculating exhaust gases containing primarily water vapor, carbon dioxide, and particulate matter back into the engine cylinders, EGR operation produces the combined effects of reducing the oxygen content in the charge air and effectively raising the combined specific heat of the mixed exhaust gases and charge air. Specific heat is defined as the amount of heat required to raise the temperature of a unit mass by one degree Celsius where Q (heat added) = mass (M) x specific heat (c) x the change in temperature in degrees Celsius:21
𝑄𝑄 = 𝑀𝑀𝑀𝑀∆𝑇𝑇
The higher specific heat of mixed exhaust gases and incoming charge air results in reducing the peak in-cylinder combustion temperatures achieved, thereby reducing NOx formation. See Figure E-4 below for a basic diagram of EGR operation.
18 Wollenhaupt, Gary, Marine Engine Makers Gear Up For Stiffer Emissions Standards, Professional Mariner, October 1, 2013, last accessed July 12, 2021, https://www.professionalmariner.com/marine-engine-makers-gear-up-for-stiffer-emissions-standards/?cparticle=1&siarticle=0#artanc. 19 Gladstein, Neandross & Associates, Ultrafine Particulate Matter and the Benefits of Reducing Particle Numbers in the United States, July 2013, last accessed July 12, 2021, http://www.meca.org/resources/meca_ufp_white_paper_0713_final.pdf. 20 Kittelson, et al., Prospects of Meeting EU Number Emission Standards With a Diesel Engine Without a DPF, University of Minnesota Center for Diesel Research, 27 June 2014, (Slide 16), last accessed July 12, 2021, https://a.storyblok.com/f/77802/x/3af092197f/cpm_kittelson_2014_prospects-of-meeting-eu-number-emission-standards-with-a-diesel-engine-without-a-dpf.pdf. 21 Hyperphysics, Specific Heat, last accessed July 12, 2021, http://hyperphysics.phy-astr.gsu.edu/hbase/thermo/spht.html.
the exhaust gas back into the cylinder reducing oxygen concentration . Th is lowers combustion temperature to reduce the formation of Oxides of Nitrogen (NOx)
EGR system sensitivity to high sulfur fuel made it less viable for Tier 3 appl ication, but offers potential for Tier 4 with ULSD
0 c( 0
Air
VG Turbo
000000
Control Valves
Variable geometry turbocharging is required to maintain correct pressure differential across the engine for ideal EGR flow
EGR
Control valve modulates the % EGR returned to cylinder C
Figure E-4. Cummins Tier 4 EGR Operation22
Operation of EGR, in percentages up to 35 percent, has been used to reduce engine-out NOx in on-road and off-road engines since the mid-2000s, and is often used in combination with PM reduction strategies.23
CARB staff is not aware of any Category 1 marine engines that employ EGR as a strategy to meet Tier 1, 2, 3 or 4 engine NOx limits. The most stringent NOx standard for Tier 4 engines is 1.3 g/bhp-hr, which is currently met using SCR aftertreatment, which will be discussed in a later section. Therefore, retrofitting marine engines with aftermarket controls such as DPFs will potentially need to address impacts of pre-existing SCR systems, but not pre-existing EGR systems. As of the release of this document, there is one U.S. EPA certified Tier 4 Category 2 marine engine that uses EGR – the GE Tier 4 L250MDC and V250MDC Series marine diesel engines utilize EGR technology and no exhaust aftertreatment such as SCR.24 To offset power losses introduced with EGR technology, engine manufacturers often increased engine
22 Hyster, Big Trucks Eco-Technology: Advanced Solutions for Meeting EPA Tier 4 Engine Emission Regulations on H400-1150HD and Reachstackers, last accessed July 12, 2021, https://autodocbox.com/Diesel/82264103-Advanced-solutions-for-meeting-epa-tier-4-engine-emission-regulations-on-h-hd-and-reachstackers.html. 23 C.E. Roberts et al., International Journal of Automotive Engineering 2 (2011) 55-60, Advancement in Diesel Combustion System Design to Improve the Smoke-BSFC Tradeoff, last accessed July 12, 2021, https://www.jstage.jst.go.jp/article/jsaeijae/2/3/2_20114602/_pdf. 24 GE Transportation, Simply Clean: GE Marine L250 and V250 Series Diesel Engines, EPA Tier 4/ IMO Tier III, last accessed July 12, 2021, http://www.oissco.com/Downloads/L250_V250.pdf.
displacements. For example, the Detroit Diesel Series 60 on-road non-EGR engine displaced either 11.1 L or 12.7 L until MY 2001, and the Series 60 EGR engine introduced during 2003-2004 to meet MY 2004 on-road standards displaced 14.0 L.25
To improve the durability of diesel engines using EGR systems and ensure engine systems do not overheat, manufacturers generally increase cooling system capacity to abate the additional heat introduced into the combustion chambers by increased fuel injection rates. Additionally, turbocharger improvements (such as variable geometric turbocharging, or VGT) and ECM modulated EGR valve actuators were needed because EGR performance is dependent upon balancing the pressure of recirculated exhaust gases with fresh engine intake air.26
EGR cooling required the use of low-sulfur diesel fuels for proper longevity and functionality. Diesel fuels high in sulfur were found to cause rapid corrosion and premature failures of early EGR system components, such as the EGR cooler, due to condensed water forming sulfuric and nitric acids as well as some organic acids such as formic, acetic, and butanoic acids with compounds found in cooled exhaust gases.27
Therefore, use of low sulfur diesel fuel is critical to ensure the in-field performance and longevity of a diesel engine utilizing cooled EGR. This will not be a challenge for California CHC because the Current Regulation has required the use of CARB Ultralow Sulfur Diesel (15 ppm S) since January 1, 2009.
5. Turbocharging
a. Overview and Types of Turbocharging
First patented in 1905 and eventually applied to marine diesel engine applications in a pair of German passenger vessels in 1923 by Swiss engineer, Alfred Buchi, turbocharging technology has been utilized in marine diesel applications for nearly a century.28 Diesel engine turbochargers harness residual kinetic energy from hot high-pressure exhaust gases to power a radial turbine to force more oxygen-containing charge air into the engine intake. Turbocharging increases diesel engine power and fuel efficiency by increasing engine volumetric efficiency the measurement of the ratio of induction air mass density an engine can draw into its cylinders compared to the mass density of air inside the engine intake manifold.29 The turbocharger is driven by engine exhaust gas flow, which turns a compressor that
25 CPTDB Wiki, Detroit Diesel Series 60, last accessed July 12, 2021, https://cptdb.ca/wiki/index.php/Detroit_Diesel_Series_60. 26 Majewski and Khair, Diesel Emissions and Their Control, Print Edition, Published 2006, (pg. 330). 27 M. Reissig, et al., Condensation-Fouling Interaction in Low-Temperature EGR-Coolers, 2014, last accessed July 12, 2021, https://www.matec-conferences.org/articles/matecconf/pdf/2014/09/matecconf_heat2014_03004.pdf. 28 Malcolm Latarche, The Basics and Origins of a Ship Turbocharger, September 19, 2017, last accessed March 4, 2021, http://178.62.53.118/articles/basics-origins-ship-turbocharger. 29 Majewski and Khair, Diesel Emissions and Their Control, Print Edition, Published 2006, (pg. 32).
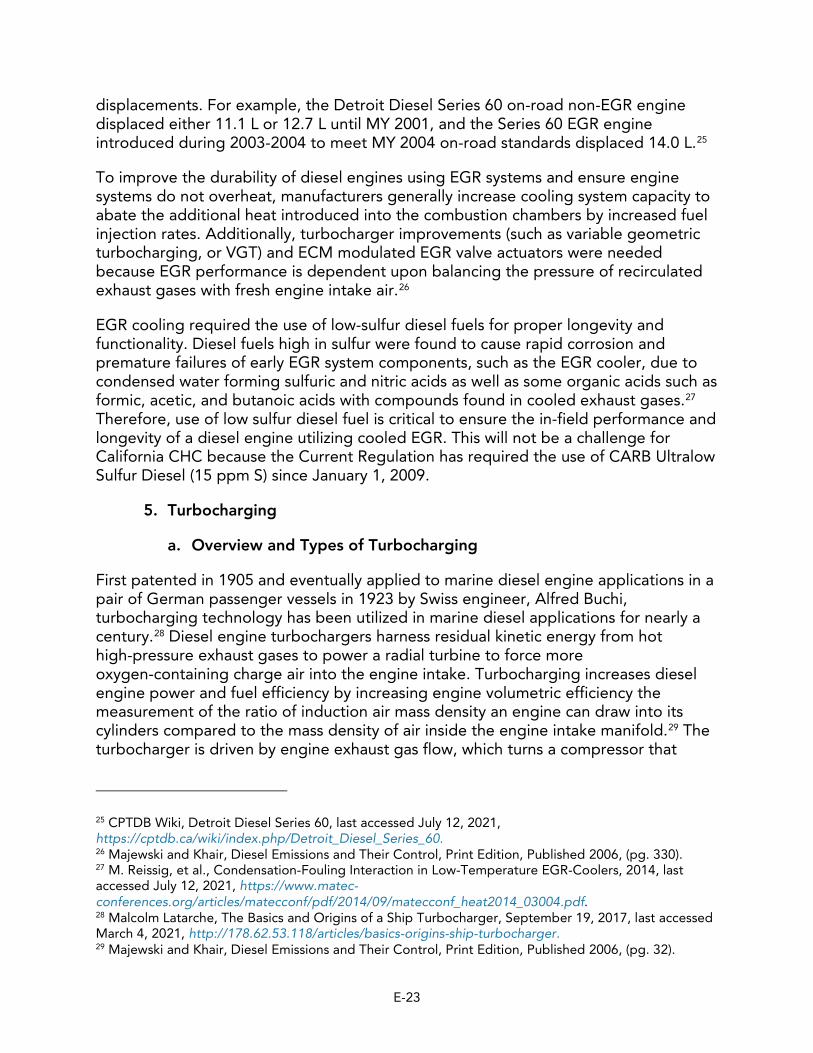
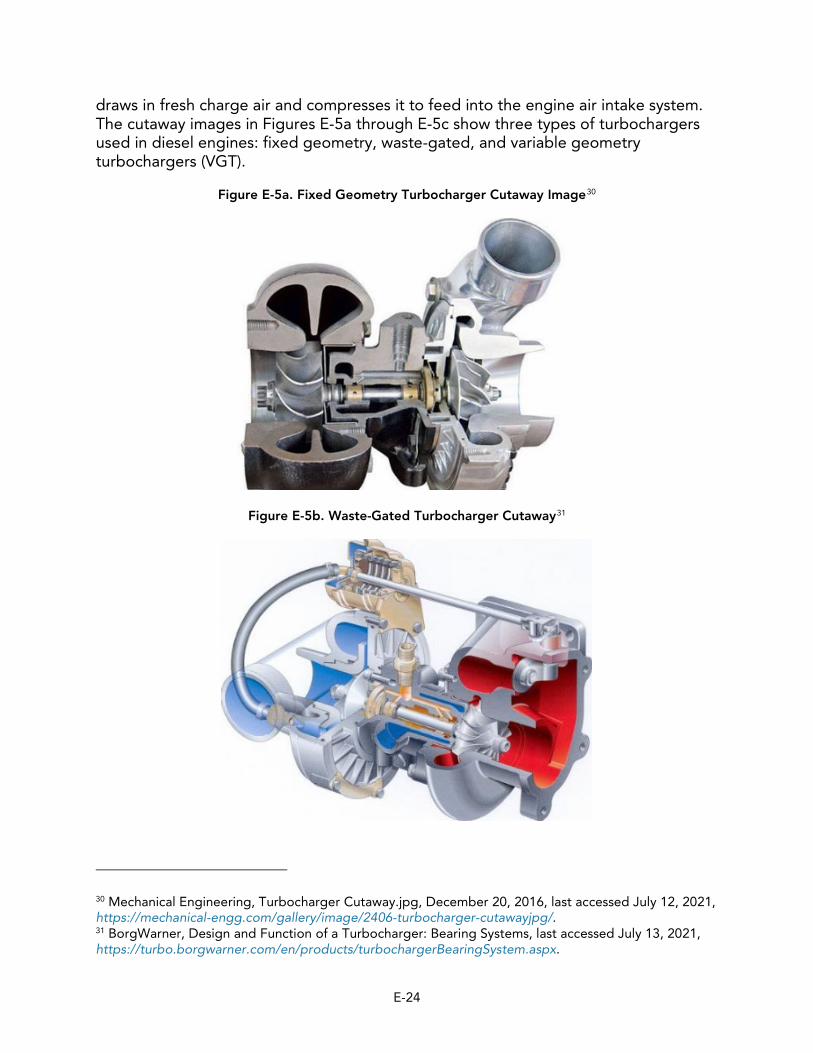
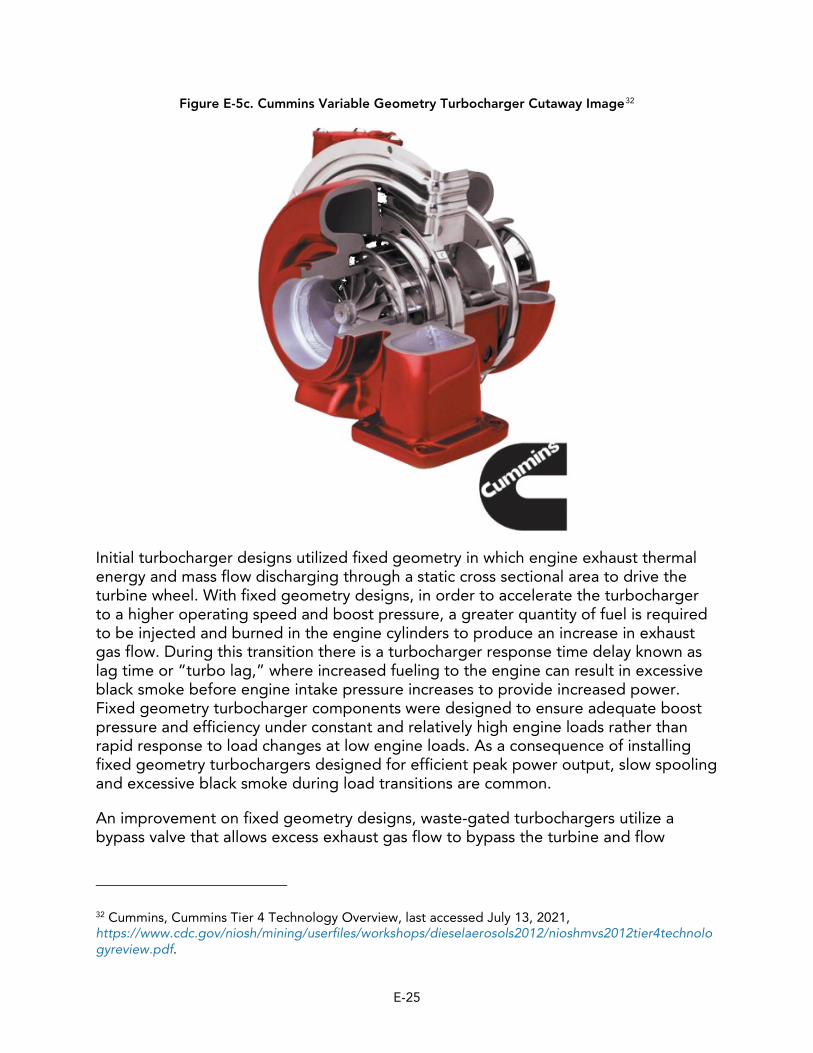
draws in fresh charge air and compresses it to feed into the engine air intake system. The cutaway images in Figures E-5a through E-5c show three types of turbochargers used in diesel engines: fixed geometry, waste-gated, and variable geometry turbochargers (VGT).
30 Mechanical Engineering, Turbocharger Cutaway.jpg, December 20, 2016, last accessed July 12, 2021, https://mechanical-engg.com/gallery/image/2406-turbocharger-cutawayjpg/. 31 BorgWarner, Design and Function of a Turbocharger: Bearing Systems, last accessed July 13, 2021, https://turbo.borgwarner.com/en/products/turbochargerBearingSystem.aspx.
Initial turbocharger designs utilized fixed geometry in which engine exhaust thermal energy and mass flow discharging through a static cross sectional area to drive the turbine wheel. With fixed geometry designs, in order to accelerate the turbocharger to a higher operating speed and boost pressure, a greater quantity of fuel is required to be injected and burned in the engine cylinders to produce an increase in exhaust gas flow. During this transition there is a turbocharger response time delay known as lag time or “turbo lag,” where increased fueling to the engine can result in excessive black smoke before engine intake pressure increases to provide increased power. Fixed geometry turbocharger components were designed to ensure adequate boost pressure and efficiency under constant and relatively high engine loads rather than rapid response to load changes at low engine loads. As a consequence of installing fixed geometry turbochargers designed for efficient peak power output, slow spooling and excessive black smoke during load transitions are common.
An improvement on fixed geometry designs, waste-gated turbochargers utilize a bypass valve that allows excess exhaust gas flow to bypass the turbine and flow
32 Cummins, Cummins Tier 4 Technology Overview, last accessed July 13, 2021, https://www.cdc.gov/niosh/mining/userfiles/workshops/dieselaerosols2012/nioshmvs2012tier4technolo gyreview.pdf.
directly into the exhaust system.33 Use of waste-gated turbocharging allows for using smaller more responsive turbochargers designed for improved response and efficiency, thereby reducing smoke formation. A secondary function of the bypass valve is to regulate or limit the amount of boost the turbocharger can produce by opening the bypass at a set boost pressure. The open bypass valve reduces exhaust backpressure at higher exhaust flow rates associated with operating relatively small turbochargers at high engine loads without a bypass. Use of waste-gated turbocharging allows for using smaller more responsive turbochargers designed for improved engine response and efficiency at all loads, thereby reducing smoke formation.
VGT, or variable geometry turbocharging, is capable of mechanically varying the cross-sectional area of the turbocharger turbine inlet and directing exhaust flow onto different sections of the turbine. This technology increases the velocity and energy of exhaust gas flow driving the turbine, without an increase in exhaust gas flow volume. VGT turbochargers are controlled by the ECM and typically operated with an electro-mechanical actuator. By varying the turbine inlet area, VGT turbochargers can generate higher boost pressures throughout the turbocharger speed range and are capable of quick boost pressure increases without the need for an increase in exhaust gas flow. Figure E-6 shows how VGT provides greater boost pressures than fixed geometry and waste-gated turbochargers at all turbocharger speeds, especially at lower speeds associated with low engine power output. With the capability of providing more intake air into the engine without a significant increase in the fuel rate, VGT turbochargers increase engine fuel efficiency and further reduce visible smoke. The rapid response of VGT turbochargers plays a critical role in balancing EGR flow with boosted intake charge air, if equipped on the diesel engine, as mentioned in the previous section.
33 Highway & Heavy Parts, How Does a Wastegate Work On a Diesel Engine Turbo?, last accessed July 13, 2021, https://highwayandheavyparts.com/n-12953-how-does-a-wastegate-work-on-a-diesel-engine-turbo.html.
Figure E-6. Cummins Turbocharger Performance: Boost Versus Turbine Speed in Fixed Geometry, Wastegated, and Variable Geometry Turbocharging (VGT)34
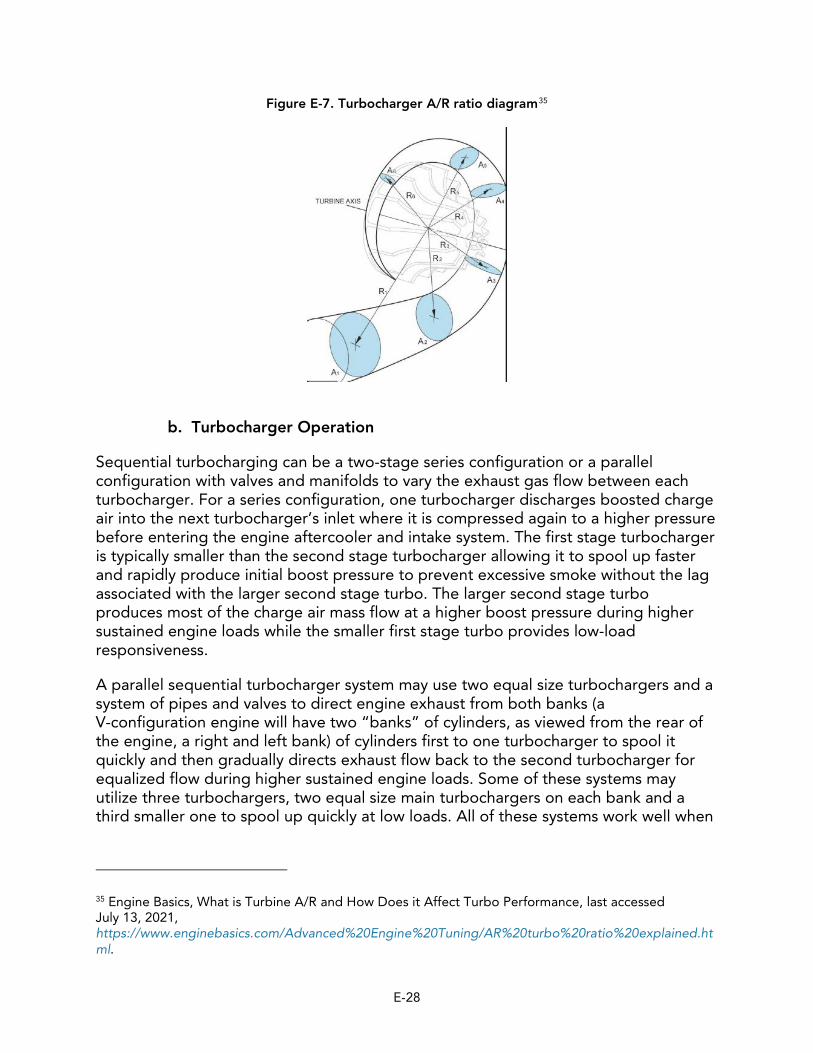
Turbocharger performance characteristics are measurable using the area-to-radius (AR) ratio of the cross-sectional area of the turbine inlet to the distance or radius from the center of the turbine shaft axis to the centroid of the cross-sectional turbine inlet area as shown in Figure E-7. A turbocharger with a lower AR will spool faster and have better response and performance at lower speeds and engine loads and power output but will restrict exhaust mass flow at higher engine loads and power output. Conversely, a turbocharger with a higher AR will perform better at higher engine loads/power output and increased exhaust mass flow rates without producing a restriction. However, a turbocharger with a larger AR will utilize larger heavier rotating components with greater rotational inertia, and reduced exhaust gas velocity entering a larger cross-sectional turbine inlet area will lower its kinetic energy before it drives the turbine, which together reduce spooling response and performance at lower engine loads and power output.
34 Cummins, Cummins Tier 4 Technology Overview, last accessed July 13, 2021, https://www.cdc.gov/niosh/mining/userfiles/workshops/dieselaerosols2012/nioshmvs2012tier4technolo gyreview.pdf.
Sequential turbocharging can be a two-stage series configuration or a parallel configuration with valves and manifolds to vary the exhaust gas flow between each turbocharger. For a series configuration, one turbocharger discharges boosted charge air into the next turbocharger’s inlet where it is compressed again to a higher pressure before entering the engine aftercooler and intake system. The first stage turbocharger is typically smaller than the second stage turbocharger allowing it to spool up faster and rapidly produce initial boost pressure to prevent excessive smoke without the lag associated with the larger second stage turbo. The larger second stage turbo produces most of the charge air mass flow at a higher boost pressure during higher sustained engine loads while the smaller first stage turbo provides low-load responsiveness.
A parallel sequential turbocharger system may use two equal size turbochargers and a system of pipes and valves to direct engine exhaust from both banks (a V-configuration engine will have two “banks” of cylinders, as viewed from the rear of the engine, a right and left bank) of cylinders first to one turbocharger to spool it quickly and then gradually directs exhaust flow back to the second turbocharger for equalized flow during higher sustained engine loads. Some of these systems may utilize three turbochargers, two equal size main turbochargers on each bank and a third smaller one to spool up quickly at low loads. All of these systems work well when
35 Engine Basics, What is Turbine A/R and How Does it Affect Turbo Performance, last accessed July 13, 2021, https://www.enginebasics.com/Advanced%20Engine%20Tuning/AR%20turbo%20ratio%20explained.ht ml.
properly maintained. However, the valves and actuators required to precisely direct exhaust flow will wear out and may begin to leak or hang up intermittently causing large emissions of excess smoke. This may occur during transitions from low to high load output accelerating a vessel.
New technology to mitigate the challenges involved in optimizing turbocharger response and performance at all engine loads is currently under development. The designs utilize an integrated high-torque electric motor connected to the turbocharger shaft. This allows the turbocharger to initially spool up independent of exhaust gas flow rate and will allow the turbocharger design to be optimized for high efficiency at high engine output while eliminating the need to compromise the design for low load response. This will likely reduce the added complexity and reliability problems of multiple valves and actuators found in sequential turbocharging systems.36
c. Charge Air Cooling
Turbocharging to boost pressures of 30-40 pounds per square-inch (PSI) without charge air cooling may raise the temperature of compressed charge air significantly lowering charge air density. Without cooling charge air, this results in decreased engine combustion efficiency, and potentially increased PM and/or NOx emissions.
To cool and restore charge air density, two main methods are used to cool turbocharger charge air: aftercooling and intercooling. Aftercooling utilizes an air to liquid (usually engine coolant) heat exchanger and is typically done on or inside the engine itself where coolant is routed to the aftercooler either inside the intake manifold or utilizing an accessory mounted aftercooler on the side of the engine. Intercooling utilizes an air-to-air heat exchanger and is typically done with an aluminum tube and fin charge air cooler (CAC). In on-road and off-road applications, charge air coolers are mounted in an area of sufficient air flow such as in front of a truck radiator or remote mounted with an electric or hydraulic fan on the side of a bus engine compartment. However, in marine applications aftercooling is the main strategy commonly used due to the availability of abundant raw-water cooling. Marine aftercooling and methods may lower charge air temperatures from as high as 200°C down to the 45-60 °C range,37 which restores efficiency to the combustion process by increasing charge air density and providing more oxygen.
36 Behrens, Rolf, Goodbye Turbo Lag!, July 2, 2018, last accessed July 13, 2021, https://www.mtu-solutions.com/au/en/stories/technology/research-development/goodbye-turbo-lag.html. 37 Applied Cooling Technology, Charge Air Coolers, last accessed July 13, 2021, http://appliedcool.com/products/charge-air-coolers/.
d. Contributors to Visible PM Emissions from Properly Functioning Marine Engines
Most marine engines are equipped with turbocharged engines, are used in vessels that require quick throttle response, and are certified by U.S. EPA using steady-state cycles according to the requirements in 40 CFR Parts 94 and 1042. Therefore, engine manufacturers are not required to control visible PM emissions during real-world transient operations. In some cases, quick throttle response is critical for ensuring vessel safety and for operators to accept the performance of an engine platform.
The engines utilized in certain harbor craft applications, such as high-speed ferries, offshore supply vessels, and tugboats can be considerably larger than those found in on-road and most off-road applications (with the exceptions of large construction or mining equipment) and are commonly rated with a maximum power over 2500 kW. Larger engine and turbocharger component masses compound the problems of excessive fuel smoke related to turbocharger lag because a larger quantity of injected fuel is required to accelerate a larger mass of engine pistons, connecting rods, and crankshaft from idle speed (around 600 RPM) turning over at the engine’s rated power (usually around 1800 RPM).
Additionally, in many modern harbor craft designs, there are also the parasitic loads of the engine gear trains, valve trains, water pumps, oil pumps and accessories, reduction gearboxes with hydraulic pumps, and the inertial mass of propeller shafts. Certain classes of vessels, such as modern escort tugs that are heavy, sit low in the water, and require a lot of power to move, there is a significant amount of power required to accelerate the vessel. On average, ship assist and escort tugs working in RCW have an average main engine load factor (average power divided by peak rated power) of 15-20 percent (see Appendix H). However, when making transient accelerations through the water to get underway or intermittently working at near-maximum to maximum engine power in a ship assisting or escorting work mode, large fuel injection rate increases must occur with the engines in constantly changing or transient load states to accelerate the rotating and reciprocating mass of the engines, gear boxes, propeller shafts, Z-drives, and propellers while also overcoming the rotational hydraulic resistance of the propellers in the water and frictional resistance on the tug and ship/barge hulls as the tug moves through the water displacing not only its own tonnage plus the potentially much larger tonnages of water displaced by assisted/escorted/towed ships or barges. If working to move a ship or barge, the high engine loads required may last for extended time periods. The relatively large fuel injection rate changes occurring during transient engine load changes and subsequent turbocharger lag phenomenon that results in increased PM and NOx emissions can potentially be further compounded with Category 2 marine engines displacing between 7 and 30 liters per cylinder. Some of these engines in harbor craft
E-30
applications can weigh 78,000 Ibs. or more.38 and may drive propellers over 12 feet in diameter on ocean going tugs or anchor-handling tugs/offshore supply vessels.39
In high-speed ferry operations, engines are commonly operated at lower loads while approaching or maneuvering away from docks. In rough conditions they may quickly transition to a high engine load state to move the vessel against a load from tidal currents or wind loading to avoid a collision while mooring in rough weather conditions. After maneuvering away from passenger terminals, high-speed ferries quickly accelerate to their intended design speed to transit over long distances according to their posted schedules. This rapid engine load state transition along with maneuvering in rough conditions are common causes of public smoke complaints submitted to CARB.
On modern electronically controlled marine engines (U.S. EPA Tier 1-4), manufacturers employ a number of strategies to reduce excessive, but not completely prevent, smoke output during transient operation. These strategies include programming engine parameters to control fuel rate ramping while using a boost pressure sensor monitored by the engine control module (ECM) or utilizing sequential turbocharging (see turbocharger section). Monitoring boost pressure inside the engine intake manifold allows the ECM to limit the maximum fuel injection rates until sufficient charge air and oxygen are present to efficiently combust fuel at higher or increasing injection rates without excessive smoke output. During steady-state certification testing, turbochargers have sufficient time to reach boost pressure equilibrium with the given fuel rates at the engine power output/load percentages of the ISO 8178 E-3 test cycle at 100 percent, 75 percent, 50 percent, and 25 percent loads. Without alternative strategies such as exhaust aftertreatment such as DPFs, CARB staff is not aware of a technical solution to eliminate visible diesel smoke under certain recurring normal operating conditions.
B. Aftertreatment Strategies
As opposed to in-cylinder or engine design parameters, the other approach to reducing emissions is through engine exhaust aftertreatment. After exhaust gases leave the engine and turbocharger, general types of aftertreatment solutions include use of diesel oxidation catalysts (DOCs) to reduce carbon monoxide (CO) and hydrocarbons (HC), DPFs to reduce PM emissions, and SCR systems to reduce NOx emissions.
38 GE Transportation, Simply Clean: GE Marine L250 and V250 Series Diesel Engines, EPA Tier 4/ IMO Tier III, last accessed July 12, 2021, http://www.oissco.com/Downloads/L250_V250.pdf. 39 Crowley Maritime, Ocean Class Tugboats DP1 & DP2, last accessed July 13, 2021, https://www.crowley.com/wp-content/uploads/sites/7/2020/04/CM_OceanClassTug_SpecSheet.pdf.
Many aftertreatment devices are catalyzed and must be used with CARB or other classifications of ULSD that was available in California starting in 2007.40 Catalyzed aftertreatment components also required development of specially formulated crankcase oils low in engine anti-wear zinc and phosphorus compounds such as zinc dialkyl dithiophosphate (ZDDP).41 Zinc metal, phosphorus compounds, and oxides of sulfur can physically plug or poison catalyst sites on wash-coated aftertreatment substrates. This reduces diesel PM oxidation or NOx reduction conversion efficiency and can lead to permanent catalyst deterioration requiring replacement.
Because aftertreatment systems are installed downstream of engines, they are sometimes designed and integrated by the original equipment manufacturers (OEMs), or in other cases designed by third parties and installed when the engine is new or after the engine has been operating in-use. CARB staff expects that vessel owner/operators will use aftertreatment – both OEM and retrofit – to meet the proposed performance standards. The following sections discuss the common types of aftertreatment that has been used in other sectors in California and beyond, and to what extent it has or is expected to be used on marine engines. Section III.B.5 provides an overview of the CARB Verification Procedure, which can be used for manufacturers of exhaust aftertreatment devices to become verified for use in specified (e.g., on-road, marine, etc.) applications.
1. Diesel Oxidation Catalysts
Diesel Oxidation Catalysts (DOC) are generally flow-through type modules typically containing a ceramic substrate wash-coated with palladium, platinum, and aluminum oxide which serve to catalyze or lower the temperature at which the oxidation of HCs and CO occurs. DOCs work like catalytic converters used in gasoline vehicles since the 1970s in the United States. In contrast, DOCs are designed with different catalytic formulations due to the higher amount of oxygen in diesel exhaust (less than 1 percent to 17 percent of diesel exhaust is oxygen depending on engine load conditions42). DOCs have also been associated with reduced PM concentrations due to the oxidation of the semi-volatile organic compounds that can condense into the PM
40 CARB, Final Regulation Order: Amendments to The Regulations to Reduce Emissions From Diesel Engines on Commercial Harbor Craft Operated Within California Waters and 24 Nautical Miles of The California Baseline, 2010, last accessed July 13, 2021, https://ww3.arb.ca.gov/regact/2010/chc10/frochc22995.pdf?_ga=2.194839917.1924282725.161429371 2-855995493.1604617821. 41 Watson, et al., Reducing Lubricant Ash Impact on Exhaust Aftertreatment With a Oil Conditioning Filter, August 6, 2009, last accessed July 13, 2021, https://www.energy.gov/sites/prod/files/2014/03/f8/deer09_watson.pdf. 42 Schrenk, et al., Composition of Diesel Engine Exhaust Gas, American Journal Of Public Health and The Nation’s Health, Volume 31, Number 7, July 1941, (pgs. 669-681), last accessed July 13, 2021, https://ajph.aphapublications.org/doi/pdf/10.2105/AJPH.31.7.669.
phase after exiting the tailpipe.43 DOCs have been used in the on-road diesel engine market in California beginning around the early 2000s,44 but have not been used yet on marine diesel engines. In newer model year on-road and off-road (but not marine) engines, DOCs are used in conjunction with DPFs and SCR to facilitate regeneration and to optimize the NO/NO2 ratio of NOx entering the SCR system.
Diesel particulate filters (DPF), like DOCs are often catalyzed (with platinum group metal alloys or other formulations) but are designed with wall-flow ceramic substrates to trap particulate matter, as shown in Figure E-9. Note the honeycomb-like appearance with alternating plugged channels on rows and columns. Most DPF substrate materials are ceramic, commonly constructed from cordierite or silicon carbide.46 Metallic fiber substrates have also been used in DPFs. In the marine sector, the Rypos ADPF has been verified by CARB as a Level 2 Verified Diesel Emission Control Strategy.47 It uses a DOC along with a sintered metal substrate to reduce PM emissions by more than 50 percent and uses electricity for regeneration. Most DPFs are designed to achieve reductions of diesel PM of up to 85 percent or more. DPFs have been installed on nearly every new on-road engine since MY 2007 in the United
43 U.S. EPA, Diesel Oxidation Catalysts: Informational Update, November 2007, last accessed July 13, 2021, https://permanent.fdlp.gov/gpo33296/420f07068.pdf. 44 CARB, Executive Order A-013-0152-2, February 27, 2003, last accessed July 16, 2021, https://ww2.arb.ca.gov/sites/default/files/classic/msprog/onroad/cert/mdehdehdv/2003/caterpillar_mh dd_a0130152r2_7d2_2d5-0d10.pdf. 45 Hasan, Mohammed, The Filtration and Oxidation Characteristics of a Diesel Oxidation Catalyst and a Catalyzed Particulate Filter: Development of a 1-D 2-Layer Model, May 2005, last accessed July 16, 2021, https://digitalcommons.mtu.edu/cgi/viewcontent.cgi?article=1370&context=etds. 46 CTS, Basics of Diesel Particulate Filter (DPF) Operation, last accessed July 16, 2021, https://www.ctscorp.com/products/sensors-2/rf-dpf-sensor/diesel-particulate-filter-dpf-knowledge-base/basics-dpf-operation/. 47 CARB, Executive Order DE-09-006, April 17, 2009, last accessed July 16, 2021, https://ww2.arb.ca.gov/sites/default/files/classic//diesel/verdev/vt/marine/rypos/eode09006.pdf.
States, on many off-road Tier 4 Interim and Tier 4 Final engines, and only one Tier 3 marine engine.48,49
Figure E-9. DPF Wall Flow Operation50
Periodically, a DPF must be thermally regenerated to convert collected soot, that would otherwise remain in the DPF and cause excessive exhaust backpressure, during a process called DPF regeneration. There are two types of regeneration that occur in DPF systems: active and passive. Active regeneration occurs when additional heat is introduced into the exhaust system to increase the rate of oxidation reactions occurring inside the DPF. Conversely, passive regeneration refers to when the DPF can self-regenerate using the temperature of engine exhaust alone. In either case, the regeneration process is associated with an increase in PM emissions, which are quantified and accounted for during the engine certification process. Separate from regeneration, DPFs also accumulate incombustible ash from the engine or as a result of the regeneration process, which needs to be removed manually through a repair shop. DPF ash cleaning recommendations vary by manufacturer and application, but it is critical to follow OEM recommended maintenance intervals to prevent exhaust backpressure from exceeding engine OEM specifications.51
3. Selective Catalytic Reduction (SCR) Systems
SCR uses a catalyzed substrate and the injection of a solution of aqueous urea (32.5 percent, diesel exhaust fluid or DEF) which converts to ammonia (NH3) to react with NOx over the catalyst to form diatomic nitrogen gas (N2) and water vapor. SCR
48 CARB, Executive Order A-013-0152-2, February 27, 2003, last accessed July 16, 2021, https://ww2.arb.ca.gov/sites/default/files/classic/msprog/onroad/cert/mdehdehdv/2003/caterpillar_mh dd_a0130152r2_7d2_2d5-0d10.pdf. 49 U.S. EPA, Annual Certification Data for Vehicles, Engines, and Equipment, Marine CI Engine Certification Data (Model Years: 2000-Present), last accessed July 16, 2021, https://www.epa.gov/compliance-and-fuel-economy-data/annual-certification-data-vehicles-engines-and-equipment. 50 Majewski, Wall-Flow Monoliths, Figure 1, last accessed July 13, 2021, https://dieselnet.com/tech/dpf_wall-flow.php. 51 U.S. EPA, Technical Bulletin: Diesel Particulate Filter Operation and Maintenance, February 2009, last accessed July 16, 2021, https://nepis.epa.gov/Exe/ZyPDF.cgi/P100LFHJ.PDF?Dockey=P100LFHJ.PDF.
catalysts typically are designed with transition metal oxides (such as vanadium, molybdenum, iron, or tungsten),52 which generally require exhaust temperatures above 200ºC for proper conversion of NOx. Within the operating exhaust temperature range of most marine SCR systems, vanadium pentoxide and molybdenum trioxide catalysts do not catalyze formation of nitrous oxide (N2O) and are preferable to tungsten along with many other transition metal catalysts which, will catalyze N2O at higher temperatures over 380°C.53 N2O, a potent GHG, is not regulated for marine engines by U.S. EPA and contributes to stratospheric ozone depletion.54 As discussed in Appendix H on the emission inventory methodology, the average increase of N2O emissions from marine engines with SCR systems has been considered in the overall GHG impacts of the Proposed Amendments.
Modern SCR systems can reach a NOx conversion efficiency of over 90 percent, but overall reductions in-use are dependent on the duty cycle, engine calibration, and other factors. For example, at temperatures below 200-250ºC, reduction of NOx generally declines. The amount of DEF consumed by the SCR system varies according to SCR system design, engine duty cycle, and engine NOx output, but is usually within the range of 3 to 8 percent of the diesel fuel consumed by the engine.55 Retrofit of engines using SCR onto harbor craft would therefore require installation of a DEF tank, typically sized at around 5 percent of the fuel capacity on the vessel.
52 Majewski and Khair, Diesel Emissions and Their Control, Print Edition, Published 2006, (pgs. 418-421). 53 Gang, L., Catalytic Oxidation of Ammonia to Nitrogen, page 8, table 3, January 1, 2002, last accessed July 16, 2021, https://pure.tue.nl/ws/files/1911936/200210267.pdf. 54 Ravishankara, et al., Nitrous Oxide (N₂O): The Dominant Ozone-Depleting Substance Emitted in the 21st Century, 2009, last accessed July 16, 2021, https://www.jstor.org/stable/pdf/40328592.pdf?refreqid=excelsior%3Acfff47a1ab5c46d1621fac8ee16f7 298. 55 CAT, Diesel Exhaust Fluid (DEF) FAQS, last accessed July 16, 2021, https://www.cat.com/en_US/by-industry/marine/tier-four/your-questions-answered/def-faqs.html.
Improving conversion efficiency, especially at lower-load operations where exhaust temperature is below 200-250 ºC, is a topic of research and development by engine and catalyst manufacturers in all categories. CARB does not currently have standards established for marine engine certification as discussed in Section II, but does verify SCR systems for aftermarket integration onto existing engines in its Verification Procedure. According to the Verification Procedure requirements listed in 13 CCR 2703(k), CARB requires applicants to perform measurement of toxic air contaminant increases based on the proposed design of their strategy. Due to the established link between dioxin formation with the use of copper catalysts in the presence of chlorine from the evaporation of seawater,57 when evaluating SCR catalysts in marine applications, CARB may require testing to evaluate dioxin formation.
In the on-road heavy-duty engine market, SCR systems have generally been used since MY 2010. For off-road engines SCR technology have generally been used for Tier 4 Final engines over 560 kW (750 hp) beginning in January 2015. SCR has been required thereafter in new off-road engines. Since 2016, new marine engines above 600 kW sold in the United States must meet Tier 4 standards and are generally equipped with SCR systems to meet the NOx limits (typically 1.3 g/bhp-hr or 1.8 g/kW-hr). One exception is the General Electric Tier 4 L/V250 Series Category 2 engines which utilize EGR without any exhaust aftertreatment. CARB staff expects the majority of Category
56 BlueBasic, Reliable Quality Diesel Exhaust Fluid DEF Arla32 to Lower Emission, last accessed July 16, 2021, https://www.everbluesolution.com/reliable-quality-diesel-exhaust-fluid-def-arla32-to-lower-emission_p211.html. 57 EJNet, Metals as Catalysts for Dioxin Formation, December 29, 2003, last accessed July 16, 2021, https://www.ejnet.org/dioxin/catalysts.html.
1 marine engines that meet Tier 4 standards to be certified with OEM SCR systems to meet NOx limits.
4. Ammonia Slip Catalysts (ASC)
Some SCR systems include a post-SCR ammonia oxidation catalyst or ammonia-slip catalyst (ASC) to prevent ammonia slip by oxidizing any excess ammonia not consumed by the reduction of NOx inside the SCR. Ammonia is a hazardous substance and ammonia emissions are regulated through engine certification and aftertreatment verification. In marine applications, CARB would not be certifying engines, but would be limiting ammonia to 25 ppm in the exhaust gases pursuant to 13 CCR 2706(b) of the Verification Procedure. ASCs are installed at the end of the aftertreatment system to oxidize any remaining ammonia leftover from urea dosing in the SCR process. Similar in honeycomb structure and substrate composition to a DOC, ASCs contain a catalyzed ceramic substrate to initiate ammonia oxidation within a temperature range of 200-450°C. The ASC substrate may be composed of cordierite wash-coated in multiple layers with base metal oxides and platinum group metals (PGM) in varying thicknesses; each layer varying in the ratios of its constituent oxides and PGM alloys.58
However, unlike DOCs, ASCs are engineered to favor selective catalytic oxidation (SCO) of NH3 into N2 under system operating conditions. Use of an ASC allows higher amounts of urea dosing in the preceding SCR process which, provides higher engine-out NOx conversion efficiency while simultaneously preventing excess ammonia emissions.
5. CARB’s Verification Procedure for Aftermarket Diesel Emission Control Strategies
In May 2002, CARB established the Verification Procedure for In-Use Strategies to Control Emissions from Diesel Engines as set forth in 13 CCR 2700-2711. The goal of this procedure is to ensure real emissions reductions, to verify the effectiveness and durability of commercialized exhaust aftertreatment devices, and to verify compatibility with certified engines in various applications. Once verified, the strategy is called a Verified Diesel Emission Control Strategy (VDECS), and it may be installed to comply with CARB regulations. The CARB Verification Procedure also creates an exemption for device manufacturers and end-users from the prohibitions against tampering, modifying, or altering vehicles, engines, or emission control devices (Vehicle Code Sections 27156, 38391 et seq.). U.S. EPA provides similar exemptions
58 Elena Sala Gil, Evaluation of Ammonia Slip Catalysts, Chalmers University of Technology, 2013, last accessed July 16, 2021, https://publications.lib.chalmers.se/records/fulltext/179045/179045.pdf.
from emissions system tampering if the modifications have a reasonable basis for conduct according to U.S. EPA’s recent November 2020 Tampering Policy.59
CARB's Verification Procedure ensures that emission reductions achieved by a control strategy are both real and durable and that production units in the field are achieving emission reductions which are consistent with their verification. In brief, the process begins where a device manufacturer submits a Preliminary Verification Application to CARB detailing the system design, a list of candidate engines, and a test plan for evaluation of emissions reduction capability and durability. After CARB approves the application, the manufacturer can proceed with installing their strategy to perform initial emissions testing and begin their durability period. The durability period is 1,000 hours for marine applications, after which the applicant must perform additional emissions testing to demonstrate that reductions are maintained over the 1,000 hours of durability testing. After submitting a Final Verification Application and demonstrating that the device meets the requirements in 13 CCR 2700-2711, the device manufacturers must report to CARB data on warranty claims annually, perform in-use compliance testing after selling a certain number of units, and offer a warranty. Any changes to the verified systems must be approved by CARB.
C. On-Board Diagnostics and Inspection and Maintenance
U.S. EPA certified marine engines are not required to conform to communications protocol standards imposed in engines sold in on-road cars and trucks. On-Board Diagnostic-I (OBD-I) was established in California for model years 1988 and newer to monitor engine control system performance in emissions related subsystems. OBD-II was established in 1996 to extend engine emissions controls monitoring to additional subsystems.60 OBD standardization in marine engines would provide service technicians with a more efficient user-friendly interface for diagnostic troubleshooting and repair purposes to maintain engine emission control system performance over the life of the engine. OBD is used in light-duty vehicle smog check programs and is currently being considered as an element of inspection and maintenance (I/M) requirements for heavy-duty on-road vehicles. I/M programs for marine vessels in the future may benefit from having marine engine OBD requirements; however, this would require establishing new requirements for marine engines, turning over the in-use fleet to use those engines, and finally developing I/M requirements that rely upon OBD systems. Without the introduction of OBD requirements on new marine engine certification, other approaches need to be used for I/M requirements on CHC.
59 U.S. EPA, The EPA Enforcement Policy on Vehicle and Engine Tampering and Aftermarket Defeat Devices under the Clean Air Act, November 23, 2020, PDF, last accessed July 16, 2021, https://www.epa.gov/sites/production/files/2020-12/documents/epatamperingpolicy-enforcementpolicyonvehicleandenginetampering.pdf. 60 CARB, On-Board Diagnostic II (OBD II) Systems Fact Sheet, September 19, 2019, last accessed July 16, 2021, https://ww2.arb.ca.gov/resources/fact-sheets/board-diagnostic-ii-obd-ii-systems-fact-sheet.
Therefore, the Proposed Amendments to the CHC Regulation will require marine engines to meet opacity limits to verify engine emissions controls are intact and functioning correctly. Additional detail on the Proposed Opacity Concept is discussed further in Chapter VI of this appendix.
IV. Equipment Availability, Vessel Feasibility, and Shipyard Capacity
A. Availability of Engines and DPFs to Meet Proposed Performance Standards
In this section, CARB staff will provide an overview of engines and DPFs that are available or will likely be available to meet the Proposed Tier 3 or Tier 4 + DPF performance standard, and the process for getting those engines installed in vessels to meet the requirements of the Proposed Amendments. In situations where equipment is not available or feasible by compliance dates, the Proposed Amendments include a number of compliance extensions (some with unlimited renewals) until equipment is available.
Generally speaking, marine engine manufacturers deploy factory trained engineers and service technicians to support their product lines and provide service upon demand every day of the year. This level of service is generally met with vertically integrated manufacturing, parts, and service industry from conceptualizing and designing to commercializing, repairing, and maintaining customers engines. Therefore, as documented in Appendix H regarding the Emission Inventory, installed marine engines are typically repaired and rebuilt to the original tier level throughout the lifetime of a vessel. Therefore, the availability of new Tier 4 engines is most common in new build vessels, and in the absence of the Proposed Amendments, the market for Tier 4 engines on in-use vessels is limited.
Engine manufacturers have generally indicated that they evaluate the costs to develop and certify a new marine engine versus the potential return on investment. Compared to larger volume markets such as for on-road and off-road engines, marine engines are typically smaller volume, but higher cost items. The following section outlines which areas Tier 4 engines are currently certified, and where stakeholders have indicated Tier 4 engines may be offered in the future–both above and below 600 kW.
1. Marine Engines Meeting Tier 4 Standards
Table E-15 below shows the currently certified Tier 4 marine engine models, as of June 2021. The Cummins, CAT, EMD, MTU, MAN, and Baudouin Tier 4 marine engines are all utilizing SCR technology to meet the Tier 4 Marine NOx emissions standards (1.3 g/bhp-hr or 1.8 g/kW-hr). The GE 250 MDC Series Tier 4 engines are utilizing EGR technology and do not require SCR aftertreatment. U.S. EPA Tier 4
E-39
marine engines can be found on U.S. EPA’s Annual Certification Data for Vehicles, Engines, and Equipment Website under Marine Compression-Ignition (CI) Engines.61
Table E-15. Currently Certified Tier 4 Marine Engines
Manufacturer Model U.S. EPA Category
Power Range (kW)
Weight (kg)
Cummins QSK38 1 746-1,119 5,270 Cummins QSK60 1 1,491-2,013 10,154 Caterpillar 3512E 1 1,000-1,901 8,193 Caterpillar 3516E 1 1,865-2,525 9,620 Caterpillar C32 1 746 3,248 Caterpillar C280-8 2 2,460-2530 19,000 Caterpillar C280-12 2 3,700-4,060 26,035 MTU 16V-4000M05 1 1,119-1,932 8,000 (engine only) MTU 16V-4000M05 1 1,840-2,576 9,300 (engine only) MTU 20V-4000M05 1 2,300-3,220 11,600 (engine only) MAN Diesel D2862 Series 1 882 2,270 Baudouin 6M-26.3 1 441-599 2,185 Baudouin 12M-26.3 1 883-1214 3,615 GE 6L250MDC 2 1,700-1,900 19,944 GE 8L250MDC 2 2,250-2,500 23,356 GE 12V250MDC 2 3,150-3,500 27,080 GE 16V250MDC 2 4,200-4,700 35,788 EMD 710 Series 8E 23 2 1,250 14,742 EMD 710 Series 12E 23 2 - 19,414 EMD 710 Series 12E 23B 2 - 23,133 EMD 710 Series 16E 23 2 - 22,589 EMD 710 Series 20E 23 2 3,729 25,719
M&H Engineering is a company based in the United Kingdom that is marinizing John Deere engines manufactured and U.S. EPA certified in the U.S. as Tier 3 and Tier 4 off-road engines with full DOC, DPF, and SCR exhaust aftertreatment for sale in the EU Stage V Inland Waterway propulsion and auxiliary engine market. Since the John Deere engines are already U.S. EPA Off-Road certified, M&H is in the process of obtaining U.S. EPA authorization to sell their marinized EU Stage V engines in the U.S. marine engine market in accordance with the requirements of 40 CFR 1042.605. Once certified to U.S. EPA Tier 4 Marine, the M&H Engineering marine engine line could provide CARB-compliant solutions for many in-use vessels with propulsion engine applications under 600 kW.
There are currently only a few Tier 4 engines rated below 600 kW because U.S. EPA does not have requirements for marine emissions to meet Tier 4 standards below
61 U.S. EPA, Annual Certification Data for Vehicles, Engines, and Equipment, Marine CI Engine Certification Data (Model Years: 2000-Present), last accessed July 16, 2021, https://www.epa.gov/compliance-and-fuel-economy-data/annual-certification-data-vehicles-engines-and-equipment.
Flow The following diagram illustrates the flow of exhaust through the DOC and DPF. Then where the DEF enters the hydrolysis pipe and eventually meets the exhaust in the SCR device. Detroit Diesel's dual parallel flow (ATD & SCR catalyst) reduces backp essure on the engine thus increasing fuel efficiency.
2
3 SCR Devices
4 DEF Hydrolysis Pipe
600 kW. However, some marine diesel engines rated under 600 kW have been certified to meet Tier 4 standards. Therefore, this demonstrates the ability to meet the Tier 4 marine standards on engines rated below 600 kW in marine applications. CARB’s Proposed Amendments would establish a Tier 4 + DPF emissions performance standard for engines below 600 kW if U.S. EPA Tier 4 engines become certified. At this time, Tier 4 marine engines are available down to 441 kW, and this may decrease with time depending on how engine manufacturers respond to the Proposed Amendments and California market. These engines’ contribution to the overall emissions inventory is substantial. Main propulsion engines rated under 600 kW operating on commercial harbor craft in Regulated California Waters are responsible for 41 percent of total PM emissions and 42 percent of total NOx in CARB’s CHC Emissions Inventory.
The technology to effectively control these significant emissions is already available and deployed on almost every on-road Class 8 heavy truck manufactured since 2010 in the United States. Additionally, similar aftertreatment controls are currently utilized in the off-road engine sector on Tier 4 Interim and Tier 4 Final engines. Engine manufacturers have designed their engines and aftertreatment system to be compact. For example, Detroit Diesel’s One-Box system seen below in Figure E-11 has been found to be a successful solution in reducing on-road emissions from Class 8 trucks. In the One-Box system, both the DPFs and SCR are contained inside of one serviceable modular housing with a DOC, two serviceable DPFs, and one SCR reactor vessel.
Figure E-11. Detroit Diesel One-Box Modular Exhaust Aftertreatment System With DOC, DPF, and SCR62
62 Scott, Fast, Freightliner of Arizona, EPA 2010/ GHG14 Emissions, slide 6, last accessed July 16, 2021, https://studylib.net/doc/5501882/presentation-on-federal-standards.
Additionally, other system components such as DEF storage tanks and SCR urea dosing systems have evolved into versatile and robust systems with modular components available in a variety of sizes and configurations to fit almost any on or off-road application. Systems are available with compact modular poly-tanks with reliable in-tank heaters and heated DEF injection lines for cold weather applications.
As discussed in Section II, EU Stage V non-road standards for inland waterway propulsion (IWP) and auxiliary (IWA) engines include a particle number (PN) standard of 1x10¹² particles/kW-hr, which is not attainable using in-cylinder emission reductions technologies. Therefore, DPF and other aftertreatment is being manufactured for marine applications in Europe for engine subcategories ≥ 300 kW. CARB staff is expecting that the Proposed Amendments establishing the Tier 4 + DPF emissions performance standard will continue to promote and encourage the transfer of more compact DPF and SCR aftertreatment systems into marine applications.
2. CARB Verified Level 3 VDECS (DPFs)
As of February 2021, CARB has verified a variety of devices for various sectors including on/off-road, stationary, transportation refrigeration unit (TRU), auxiliary power unit (APU), cargo handling equipment, and marine applications.63 There is one verified device for marine applications, the Rypos ADPF. CARB classifies the emissions reduction capability of VDECS by the Level of diesel PM reduction and the Mark of NOx reduction. There are three Levels and five Marks: Level 1 DPFs reduce PM 25 percent or higher, Level 2 is 50 percent or higher reduction, Level 3 is 85 percent or higher reduction, and similarly there is a scale from Mark 1 (25 percent) to Mark 5 (85 percent) reduction of NOx emissions.64
Success of possible retrofit requirements is contingent upon the technology developers applying for and receiving verification from CARB for their diesel emissions controls strategies (DECS). There are currently three established companies who are interested in submitting their products for CARB verification. The number of options for retrofits should increase as requirements for DPFs are adopted and more products penetrate the market.
B. California Maritime Academy Feasibility Study
CARB commissioned the California State University Maritime Academy (CMA) to evaluate the feasibility of repowering and retrofitting in-use harbor craft with Tier 4
63 CARB, Verification Procedure For In-Use Strategies to Control Emissions From Diesel Engines, last accessed July 16, 2021, https://ww2.arb.ca.gov/our-work/programs/verification-procedure-use-strategies-control-emissions-diesel-engines. 64 CARB, Heavy Duty DECS Installation and Maintenance: Frequently Asked Questions, last accessed July 16, 2021, https://ww2.arb.ca.gov/resources/fact-sheets/heavy-duty-decs-installation-and-maintenance-frequently-asked-questions.
engines and DPFs. The published study is available on CARB’s web site.65 The study evaluated a selected representative vessel in 13 commercial harbor craft categories for three compliance options, a DPF retrofit, a DPF+SCR retrofit, or a Tier 4 repower. Vessel designs (when available) or engine compartment scans were utilized by a third-party naval architect to evaluate feasibility of installations for three compliance options. Feasible compliance options for each vessel were determined based on available Tier 4 retrofit or Tier 4 repower compliance options as of Summer 2019, fitment of each applicable option to each vessel evaluated, vessel stability and design standard requirements according to applicable USCG Subchapters66 and American Bureau of Shipping (ABS) Steel Vessel Rules Under 90 m. The degree of vessel structural modifications necessary to accommodate each option was evaluated with five determinations, feasible fitment, moderate reconfiguration, substantial reconfiguration, no fitment identified, and not applicable. Feasible naval architect evaluations were sent to an independent third-party ship-yard to determine installation costs to complete the necessary reconfigurations for each compliance option on each vessel evaluated. Key findings from the study are shown in Table E-16.
Table E-16. Summary of CMA Tier 4 and Retrofit DPF Feasibility Study67
Vessel Category Repower: Tier 4 Marine Engines
Retrofit: DPF+SCR
Retrofit: DPF
Evaluation Input
Tank Barge: Cargo Pump N/A Feasible Fitment Feasible Fitment 3D Scan & Vessel Drawings
Tank Barge: Ballast Pump N/A Feasible Fitment Feasible Fitment 3D Scan & Vessel Drawings
Tank Barge: Generator N/A Feasible Fitment Feasible Fitment 3D Scan & Vessel Drawings
65 Cal Maritime, Evaluation of the Feasibility and Costs of Installing Tier 4 Engines and Retrofit Exhaust Aftertreatment on In-Use Commercial Harbor Craft, September 30, 2019, last accessed July 16, 2021, https://ww2.arb.ca.gov/sites/default/files/2019-10/cmafeasibilityreport09302019.pdf. 66 46 CFR Chapter I – Coast Guard, Department of Homeland Security, last accessed July 16, 2021, https://www.govinfo.gov/content/pkg/CFR-2016-title46-vol1/pdf/CFR-2016-title46-vol1.pdf. 67 Cal Maritime, Evaluation of the Feasibility and Costs of Installing Tier 4 Engines and Retrofit Exhaust Aftertreatment on In-Use Commercial Harbor Craft, September 30, 2019, last accessed July 16, 2021, https://ww2.arb.ca.gov/sites/default/files/2019-10/cmafeasibilityreport09302019.pdf.
Ship Assist Tug Feasible Fitment No Fitment Identified
Moderate Reconfiguration
Vessel Drawings
Push Tug Moderate Reconfiguration
Substantial Reconfiguration
Moderate Reconfiguration 3D Scan
Crew andSupply Moderate Reconfiguration
Substantial Reconfiguration
Substantial Reconfiguration
3D Scan
Pilot Boat Substantial Reconfiguration
Substantial Reconfiguration
Substantial Reconfiguration
3D Scan & Vessel Drawings
Work Boat N/A Substantial Reconfiguration
Substantial Reconfiguration 3D Scan
Special Use Feasible Fitment Moderate Reconfiguration
Moderate Reconfiguration
3D Scan & Vessel Drawings
The overall conclusion from the study is that there are a number of feasible compliance options for a broad range of different CHC types evaluated. However, because many vessels have unique designs, no assumptions can be made about the technological feasibility regarding a specific vessel without a thorough analysis of its design to determine what engine and after treatment options are available. In some cases where changes are required to a vessel’s structure, the repower project will require a design review by a naval architect to ensure the modifications will not negatively affect the vessel’s stability or seaworthiness. The technological capability of repowering with engines and aftertreatment to meet the Tier 3 or 4 + DPF emissions performance standard is dependent on many variables and must be thoroughly evaluated on a case-by-case basis for every vessel. Therefore, CARB staff used the study to evaluate the likelihood of a vessel needing to be replaced to meet the proposed emissions performance standard in the cost and economic analyses, and in developing the Proposed Amendments.
C. U.S. Coast Guard (USCG) Regulations
Many overlapping vessel design requirements requiring careful analysis must be evaluated before making a feasibility determination. These vessel design variables include applicable 46 CFR Subchapter requirements, ABS Steel Vessel Rules for Vessels Under 90 m,68,69 impacts to vessel stability, trim characteristics, buoyancy, and vessel structural design limit (SDL) requirements. Small passenger vessels are subject
68 American Bureau of Shipping, Rules for Building and Classing Steel Vessels for Service on Rivers and Intracoastal Waterways, 2007, last accessed July 16, 2021, https://towmasters.files.wordpress.com/2009/05/abs-steel-vessel-river-rules.pdf. 69 American Bureau of Shipping, ABS Rules for Steel Vessels Under 90m in Length for Vessels Certificated for International Voyages, July 1, 2010, last accessed July 16, 2021, https://www.dco.uscg.mil/Portals/9/DCO%20Documents/5p/5ps/Alternate%20Compliance%20Program /abslt90m7122010.pdf.
to 46 CFR Subchapter-T as well as 46 CFR 177 Subpart D - Fire Protection, 46 CFR 182.425 - Engine Exhaust Cooling, and 46 CFR 182.430 - Engine Exhaust Pipe Installation. In addition to meeting all of the applicable vessel design and safety standards, an engine repower option with feasible fitment must be able to efficiently work in the vessel vocation and must meet performance requirements including engine power density, duty cycle, matching old engine propeller curve and required operational characteristics such as vessel speed, range, engine throttle response times and vessel maneuvering characteristics, vessel design and structural layout, and possible changes to vessel gross register tonnage. New engine rated rpm, load factors, added weight, and propeller design affecting vessel efficiency must also be considered when repowering a vessel. If the repower engine is not a close enough match to the old engine, a gearbox and or propeller change may be required.
For example, a new engine with a torque and power curve above or below the old engine may not work as efficiently with a vessel’s existing gearboxes and propellers. When installing exhaust after treatment retrofit systems, exhaust temperature profiles at the required distance to any aftertreatment system will determine whether a passive or active DPF is required. The engine compartment dimensions and actual free space determine if any additional aftertreatment devices can fit on the vessel while still enabling certain vessel types with gross register tonnage requirements to maintain USCG compliance.70,71 According to the USCG Marine Safety Center (MSC) Marine Technical Note (MTN) 04-95, gross vessel displacement tonnage changes of plus or minus 2 percent may require a USCG review of a vessel stability evaluation performed by a third party naval architect or marine engineering firm.72 Vessel retrofit or repower compliance plans requiring vessel structural reconfiguration or gross weight changes exceeding the limits in MTN 04-95 should be reviewed by the USCG MSC before work begins. To obtain a certificate of inspection (COI) completed vessel reconfigurations must be inspected by a local USCG Sector Officer in Charge of Marine Inspections (OCMI) or an approved third-party surveying entity listed in 46 CFR 144.140.73
70 USCG, Tonnage Regulations Amendments, March 31, 2016, last accessed July 16, 2021, https://www.federalregister.gov/documents/2016/03/31/2016-05623/tonnage-regulations-amendments. 71 USCG, U.S. Department of Homeland Security, Navigation and Vessel Inspection Circular No. 11-93, Change 3, Applicability of Tonnage Measurement Systems to U.S. Flagged Vessels, November21, 2003, last accessed July 16, 2021, https://www.dco.uscg.mil/Portals/9/DCO%20Documents/5p/5ps/NVIC/1993/CH-3_11-93.pdf. 72 USCG, U.S. Department of Homeland Security, Marine Safety Center Technical Note (MTN) No. 04-95, CH-2, January 11, 2016, last accessed July 16, 2021, https://www.dco.uscg.mil/Portals/9/MSC/MTN/MTN.04-95.CH-2.2016.01.11.Lightship_Change_Determination.pdf. 73 46 CFR § 144.140 – Qualifications, last accessed July 16, 2021, https://www.law.cornell.edu/cfr/text/46/144.140.
In contrast to the on-road heavy-duty vehicle sector where thousands of similar mass-produced trucks and buses frequently operate the same engines and drivetrain components, harbor craft are often custom made by small shipyards. CARB staff has been aware of single vessel orders, and of some shipyards who have indicated they need an order for three to four units of the same design before beginning a project.
The Proposed Amendments would require engine repowers, engine retrofits, and in some cases vessel replacements. To assess the feasibility of the proposed compliance schedule, staff analyzed the capacity for shipyards to complete the required vessel services and whether the capacity is sufficient to support the requirements of the proposed compliance schedule. Table E-17 presents the number of expected retrofits, repowers, and vessel replacements starting in 2023 and lasting through 2034 as a result of the Proposed Amendments.
Table E-17. Estimated Number of Annual Engine Replacements (Repowers), Retrofits, and Vessel Replacements Due to Implementation of the Proposed Amendments.
To evaluate whether sufficient capacity exists for annual repowers and vessel replacements, staff conducted a phone and email survey of more than 75 shipyards, boat builders, boat repair facilities, machine shops, and fleet owners.74 Staff found that because of the nature of these industries, vessels which are subject to the regulation may receive service elsewhere on the west coast other than California facilities. To account for this, staff surveyed facilities in California, Oregon, and Washington. In the survey, staff collected information on whether or not the business performed repowers
74 CARB, Shipyard Analysis Email Survey.
E-46
and/or new vessel builds, size limitations on the vessels serviced, and estimated number of repowers or builds the facility was capable of completing annually. To account for the relative complexity of some repower services and the predicted overlap of some repower and retrofit services, staff specified in the survey that the engine replacement services would primarily be of Tier 3 or 4 engines in commercial harbor craft, some with SCR and/or DPF retrofits.
3. Shipyard Survey Results
Based on the survey, staff has identified current west coast capacity for 353 repowers and 98 new vessel builds per year, with 66 percent of the overall capacity of both services combined (271 engine repowers and 26 new builds out of 353 engine repowers and 98 new builds) located in California.75 During the phone survey, CARB staff did not receive information that suggested adding a DPF retrofit to the repower project would substantially impact the capacity of the shipyard to perform work. In some cases, DPFs may be included as part of the certified Tier 4 engine platform. In addition, CARB staff received information suggesting that DPF retrofits, if performed independently and not part of a repower project, may not be done at a shipyard. Therefore, the results and analysis presented here do not reflect the full capacity of shipyards to provide installations of retrofit DPFs.
Table E-18. Directly Confirmed Annual West Coast Capacity for Engine Repowers and New Vessel Builds
State Number of Engines Repowered (per year)
Number of New Vessels (per year)
California 271 26 Oregon 39 14 Washington 43 58 Total Identified West Coast Capacity 353 98
Results shown in Table E-18 indicate that CARB staff confirmed that shipyards located on the West Coast of the Untied States have more than the capacity of additional engine repowers and new build vessels that are expected to occur as a result of the Proposed Amendments.
4. Accounting for Capacity at Non-Responsive Shipyards
Staff notes that the response rate of the survey, conducted during February-April 2021, may have been affected by temporary office closures and disruptions due to the global situation during that time. Staff attempted to extrapolate the repower capacity from the businesses who did not respond to attempts to contact them for the survey. In total, staff tried to contact 187 businesses by phone and/or email. Most businesses were identified using the Marine Yellow Pages online directory
75 Shipyard Capacity Project Workbook.
E-47
Repowers/New Builds: 38
Response: 80 No Repowers/New Builds: 42
Facilities Staff Attempted to Contact: 187
Viable Contact: 86 No Response: 107
Non-Viable Contact: 21
of marine service facilities, which is produced annually by industry directory publisher Davison Publishing.76 Eighty of staff’s attempted contacts resulted in a response to the survey (either affirmative or negative with respect to being able to provide repower and/or new build services). The remaining 107 facilities that staff attempted to contact did not respond as of May 1, 2021. Of these unresponsive facilities, 21 were “non-viable” contacts—either the facility’s voicemail box was full, or the phone line was disconnected or not in service indicating the facility is potentially no longer operational. The remaining 86 facilities, for which staff left a voicemail or e-mail per the contact information provided on the facility’s website or the Marine Yellow Pages, but did not receive a response, are “viable” contacts. The process and values are shown in the diagram in Figure E-12.
Figure E-12. Breakdown of Outcomes of Staff’s Attempted Survey Contacts
Of the responses which staff received, 38 percent of facilities confirmed their ability to provide repower services. From these confirmatory responses, staff identified annual capacity for 353 repowers (Table E-18), with an average of 11.8 repowers per facility. If 38 percent of the 86 “viable” facilities which staff did not hear back from could provide repower services at an average of 11.8 repowers per facility per year, there is additional west coast repower capacity for an additional 380 engines per year. Staff further reduced this number by half, to 190 repowers per year, to ensure the extrapolated capacity was conservatively estimated. Including the capacity of 353 repowers which staff was able to identify directly, plus the addition 190 repowers per year, there is an estimated total capacity for 543 engine repowers per year. These results are shown in Figure E-13 below.
76 Davison Publishing Co., Marine Yellow Pages, last accessed July 16, 2021, https://www.marineyellowpages.com/.
Average Annual Repowers Required by Proposed Regulation, 2023-2034
Maximum Annual Repowers Required by Proposed Regulation, 2031
Capacity Directly Confirmed by Survey
Total Calculated Capacity
Figure E-13. Comparison of Repower Capacity and Number of Repowers Required by the Proposed Amendments
CARB staff applied a similar method to calculate total shipyard capacity for building new vessels shown in Figure E-14 below; 19 percent of facilities confirmed their ability to build new vessels, with an average of 6.5 vessels per facility. Staff similarly projected that half of non-responsive but active shipyards would be capable of similar new builds. Using this approach, staff projected that approximately 9.5 percent of the 86 “viable” facilities that staff did not hear back from were capable of building new vessels at an average of 6.5 vessels per facility, for an additional capacity of 53 new vessels per year. In total, including the capacity of 98 new vessel builds which staff was able to identify, plus the additional 53 vessels from non-responsive facilities, the total capacity for new vessel builds is calculated to be 151 vessels per year.
E-49
■
■
■
■
151
98
53
22
0 20 40 60 80 100 120 140 160
Average Annual Replacements Required by Proposed Reguation, 2023-2034
Maximum Annual Replacements Required by Proposed Regulation, 2034
Capacity Directly Confirmed by Survey
Total Calculated Capacity
-Figure E-14. Comparison of Vessel Replacement Capacity and Number of Vessel Replacements
Required by the Proposed Regulation
5. Additional Considerations Affecting Capacity
In the course of conducting the survey, staff spoke with some fleet owners and heard from a number of owners and operators that they conduct their own engine replacements. This finding indicates that the capacity for engine replacements could be greater than the capacity which exists strictly at shipyard facilities that were included in the survey.
Capacity is also required for routine maintenance, repowers due to natural engine turnover, and repowers funded ahead of or in excess of compliance schedule through incentive programs. Because the maximum estimated 248 repowers required in a single year (2031) accounts for 70 percent of the capacity which staff identified directly, and less than 46 percent of the extrapolated total west coast capacity, staff believes there is sufficient remaining capacity even at the maximum repower rate to still allow current facilities to conduct other repowering and non-repowering activities. In addition, as mentioned in Appendix H, which discusses the Methodology for the Emission Inventory, engine repowers are not common practice in the marine industry unless required by regulation, incentivized, or there is a failure of the engine block such that the engine cannot be rebuilt. Therefore, the majority of engine maintenance for natural turnover would likely be in the form of rebuilds (instead or repowers), which generally does not require use of shipyards.
CARB staff acknowledges that shipyards also need to have excess capacity for new builds to accommodate natural vessel turnover or any potential growth not accounted or quantified. The maximum estimated 53 replacements required in a single year (2034) accounts for 54 percent of the capacity which staff confirmed directly through the survey, and 35 percent of the calculated total west coast capacity. In response to the Proposed Amendments, additional facilities and capacity may be built, which
E-50
would further ensure that the State and west coast will have sufficient capacity to conduct the expected number of repowers and new vessel builds.
Staff acknowledges that some specialty vessels may have unique needs or require service from specialty shipyards, which could create local or niche market bottlenecks. Additionally, zero-emission and advanced technology repowers could be more complex than the Tier 3 or Tier 4 repowers with DPF and/or SCR which staff targeted in the survey, and require a greater share of the capacity for repowers identified here. However, the Proposed Amendments include a compliance extension should a short-term shipyard scheduling delay occur.
Overall, based on these findings, staff believes that shipyards, builders, repairers, and other marine services facilities currently have the capacity to absorb the number of engine and vessel replacements that would result from the implementation of the Proposed Amendments.
E-51
V. Alternative Fuels
In the Proposed Amendments, “Alternative Fuel” is defined as natural gas, propane, ethanol, methanol, gasoline, hydrogen, electricity, or other fuels that do not meet the definition of CARB diesel. This section will provide an overview of some alternative fuels that can be used in an internal combustion engine, which includes fuels such as hydrogen, but does not include electricity.
CARB staff first will discuss biodiesel (BD) and renewable diesel (RD), which are often used interchangeably and confused; however, these are two distinct fuels. RD is subject to the same ASTM international standard as petroleum derived diesel fuels like CARB diesel (ASTM D975) whereas BD is subject to a separate standard (ASTM D6751). RD and BD are both biomass-based diesel fuel replacements and can be confused with each other, but the distinctions are very important. Although the two fuels use the same feedstocks (e.g., animal tallow, used cooking oil, soybean oil), they are produced using different production processes with resulting products having different chemical properties, physical properties, and environmental attributes. RD consists solely of hydrocarbons and is chemically similar to conventional petroleum but has a greatly reduced content of aromatic hydrocarbons as shown in Figure E-16 below. RD has been shown to decrease emissions of GHGs, PM, hydrocarbons, and carbon monoxide and, in contrast to BD, RD has also been shown to reduce NOx.77
A. Biodiesel
Biodiesel (BD) is a mono-alkyl ester or “fatty acid methyl ester” (FAME) produced from renewable/sustainable non-petroleum derived feedstocks such as vegetable oil or animal fats by utilizing a catalyzed transesterification production pathway.78 Although biodiesel sustainable feedstocks may be similar or identical to those used to produce RD, the transesterification process utilized to produce biodiesel is not the same as the multiple production pathways that can be utilized to produce RD. RD is produced by hydrotreating sustainable or renewable non-petroleum feedstocks. Additionally, the resulting “biodiesel” methyl-ester end product is not chemically similar to and has different physical properties that produce different combustion characteristics compared to RD or to petroleum derived diesel fuels like CARB diesel. As an oxygenated methyl-ester fuel with different viscosities, bulk-densities, and bulk modulus (compressibility) than CARB diesel or RD, BD is typically capable of reducing engine out PM under certain engine load conditions. However, the extra oxygen atom in the methyl-ester molecule combined with the viscosity, bulk-density, and
77 CARB, Initial Statement of Reasons for Proposed Rulemaking: Proposed Regulation on the Commercialization of Alternative Diesel Fuels, January 2, 2015, last accessed July 16, 2021, https://www.arb.ca.gov/regact/2015/adf2015/adf15isor.pdf. 78 ETIP Bioenergy, Transesterification to Biodiesel, last accessed July 16, 2021, https://www.etipbioenergy.eu/value-chains/conversion-technologies/conventional-technologies/transesterification-to-biodiesel.
bulk-modulus differences compared to CARB or RD fuel may produce unintended injection timing advancement causing the undesirable characteristic of higher peak combustion pressures and temperatures increasing engine out NOx production under certain engine load conditions.79
In addition to the negative aspect of increased NOx emissions at higher engine loads, BD presents a number of additional logistical and technological challenges to end users. BD blends over 5 percent are not drop-in fuels for unmodified older engines or vessel fuel systems designed for use with petroleum diesel. BD has a material compatibility issue and may degrade certain elastomer seals, hoses, and O-rings that were utilized in older engine fuel systems not designed with synthetic Teflon or Viton elastomers. Fuel leaks, injection pump and injector malfunctions/failures, and internal engine fuel leaks into the crankcase potentially causing severe engine damage are all possible in older engines utilizing nitrile, nylon, or high density polypropylene elastomers in fuel system components.80 Additionally, BD has strong detergent properties that will scour accumulated residue and fuel tank/fuel line residue off of fuel tank walls and the inside surfaces of fuel lines and fittings where it may be drawn into fuel lines, filters, and even into the engine if permitted. Unless an older engine fuel system is completely modified to install Teflon or Viton elastomer seals, O-rings, and gaskets able to withstand BD and the entire fuel system is completely flushed out, BD in blends over 5 percent (B5+) will eventually damage the engine or related fuel systems, potentially causing numerous downtime events during the initial transition to operating with BD.
BD attracts and holds free water, has poor long-term storage properties, forms corrosive acids as aging products and is known to be supportive of microbial growth in storage tanks and vessel fuel systems that can cause expensive fuel system contamination problems.81 Poor quality fuel may contain trace amounts of sodium or potassium metals left over from the transesterification production pathway in sufficient quantity to block injector nozzles. Cold weather operation remains a challenge with BD due to high viscosity and gelling at lower temperatures. Free fatty acids present in low quality BD may corrode engine fuel injection equipment (FIE). The major manufacturers of FIE have reached a common position on the use of BD stating that blends of up to 5 percent in petroleum diesel should not create any serious engine problems provided the BD fuel meets existing national BD standards at the point of sale (ASTM D6751).82 BD has historically not been distributed through most pipelines
79 Mohamed Al-Dawody, Optimization Strategies to Reduce the Biodiesel NOx Effect in Diesel Engine with Experimental Verification, December 31, 2012, last accessed July 16, 2021, https://www.researchgate.net/publication/257051405_Optimization_strategies_to_reduce_the_biodiese l_NOx_effect_in_diesel_engine_with_experimental_verification. 80 Majewski and Khair, Diesel Emissions and Their Control, Print Edition, Published 2006, (pg. 253). 81 National Renewable Energy Laboratory, Biodiesel Storage and Use Guide (pg. 19), December 2009, last accessed July 16, 2021, https://www.nrel.gov/docs/fy09osti/43672.pdf. 82 Majewski and Khair, Diesel Emissions and Their Control, Print Edition, Published 2006, (pg. 253).
due to concern that it may contaminate jet fuel and may require specialized storage facilities, additives, or blending with conventional or RD to prevent the fuel from gelling in cold temperatures.83 The Proposed Amendments would not require vessel owner or operators to use BD, but it may be present in blends of up to 5 percent in CARB diesel or RD.
B. Renewable Diesel
1. General Description
Renewable Diesel (RD) fuel refers to a synthetic diesel fuel consisting of hydrocarbons and produced from non-petroleum renewable resources, but is not a mono-alkyl ester like BD. RD meets the ASTM International D975 standard specification for diesel fuel. An advantage of RD over BD is that the hydrogenation process used to produce RD removes all of the oxygen from the vegetable oils, leading to higher fuel efficiency84
and a much longer storage life as there is less opportunity for fuel oxidation. The feedstock used to produce RD need not be as high quality as that for BD, and the end product has much higher cetane number and energy density.85
RD can be produced from renewable feedstocks a number of different ways including, hydrotreating (a process already used in refineries to treat petroleum-derived diesel fuel to remove sulfur and reduce aromatic content), synthesis of hydrocarbons through enzymatic reactions, and the last method involves partially combusting bio-mass feedstocks to produce carbon monoxide and hydrogen (syngas) and then utilizing the Fisher-Tropsch Reaction to produce complex hydrocarbons.86, 87
83 U.S. EPA, Federal Register Vol. 81, No. 238, Renewable Fuel Standard Program: Standards for 2017 and Biomass-Based Diesel Volume for 2018, December 12, 2016, last accessed July 16, 2021, https://www.govinfo.gov/content/pkg/FR-2016-12-12/pdf/2016-28879.pdf. 84 CARB, Final Report: CARB Assessment of the Emissions from the Use of Biodiesel as a Motor Vehicle Fuel in California “Biodiesel Characterization and NOx Mitigation Study” (page 97-99), October 2011, last accessed July 16, 2021, https://www.arb.ca.gov/fuels/diesel/altdiesel/20111013_carb%20final%20biodiesel%20report.pdf. 85 IEA Bioenergy, Biofuels for the Marine Shipping Sector, October 2017, last accessed July 16, 2021, https://www.ieabioenergy.com/wp-content/uploads/2018/02/Marine-biofuel-report-final-Oct-2017.pdf. 86 CalEPA, Staff Report: Multimedia Evaluation of Renewable Diesel (pg. 4), May 21,2015, last accessed July 16, 2021, https://ww2.arb.ca.gov/sites/default/files/2018-08/Renewable_Diesel_Multimedia_Evaluation_5-21-15.pdf. 87 Valero, The Technical Side of Renewable Diesel, last accessed July 16, 2021, https://www.valero.com/renewables/renewable-diesel/renewable-diesel-science-process.
w ry ~imilar to petrofeum d Sc:!:1, out with superillr qual,lics
• No peci.-1 bl nding.. h~ndling, oring reciuiremeinl:s
• No blend \WII: can be used as
neat fuel ["R010trl
ASTM 06751 (Biodfe-selJ • FUlllCt ionall',I Slffll I to
pe olwm diesel (with some I mitatlon-s)
• Enta Is special blend ng. hiandlins, i!itDring
req ui remenls • Generally not ble1ullecl
aoo ... e 2cm biodiesel jNBllTI
Figure E-15. Key Similarities and Differences between Production of RD and BD88
The hydrotreating production pathway results in a high-quality homogeneous RD fuel containing pure hydrocarbons, paraffinic compounds, with very little aromatics content compared to CARB diesel. RD production processes result in a comparatively cleaner burning drop-in synthetic diesel fuel with combustion characteristics superior to conventional petroleum diesel due to the higher cetane rating (consistently over 70).89
Figure E-16 below compares some characteristics of RD fuel and petroleum-derived CARB diesel.
88 Gladstein, Neandross and Associates, Renewable Diesel as a Major Transportation Fuel in California: Opportunities, Benefits, and Challenges, August 2017, https://learn.gladstein.org/whitepaper-renewablediesel. 89 Ibid.
a Cetane number measures how quickly a fuel auto-ignites inside a compression ignit ion (diesel) engine. The RD cetane number is t he average of
t hree different Neste NExBTL batches.
b A high aromatics content cont ributes significantly to formation of unhea lthfu l emissions, and lowers fuel qual ity. PAH compounds occur natu rally
in crude oil and are released when burned. Health effect s are not fully defined.
cvolumetric energy content (heati ng value): measures heat released when a known quantity of fuel is bu rned under specific cond it ions. A lower energy content for a given volume of fuel w ill reduce a vehicle's driving range (a ll else being equal). This va lue for RD may vary from batch to batch.
dc loud point Measures low-temperature opera bility. A fuel with a lower cloud point w il l operate better in low temperatures (below freezing).
Figure E-16. A Comparison of Properties of a Selected Sample of Typical RD and CARB Diesel90
The storage life characteristics of RD are similar to CARB diesel and ,being chemically similar to CARB diesel, does not require infrastructure changes for storage, piping, pumping, or any engine modifications in order to burn it in existing engines.
In addition to reducing engine out PM and NOx emissions, another beneficial aspect of RD fuel is the reduction in greenhouse gas emissions. The carbon intensity of all renewable fuels will vary depending on the type of feedstock and the production pathway utilized. Figure E-17 below outlines the 2017 carbon intensity of various RD feedstocks with verified pathways through California’s Low Carbon Fuel Standard (LCFS) program.
Figure E-17. 2017 Carbon Intensity Ratings for RD Production Pathways Under California LCFS91
Under the LCFS program, credits are awarded to low-carbon fuels proportional to the difference between an annual carbon intensity benchmark and the low-carbon fuel’s carbon intensity. Carbon intensity is measured using gCO2e/MJ of energy of fuel used, and the annual benchmark declines annually until it achieves 20 percent reduction in 2030 as compared to the 2010 baseline of CARB gasoline or diesel. After 2030, the LCFS will continue to require 20 percent reduction in the transportation fuel pool.
With a RD from lower carbon intensity feedstocks like used cooking oil, tallow, or forest waste, RD is capable of providing 30-60 percent reductions in carbon intensity compared to the baseline CARB diesel.92 Other sources have shown carbon intensity reductions of 61 percent to 83 percent, depending upon the feedstock used.93
91 Ibid. 92 Ibid. 93 California Energy Commission, Biofuels: Diesel Substitutes, last accessed July 17, 2021, https://www.energy.ca.gov/programs-and-topics/programs/clean-transportation-program/clean-transportation-funding-areas-2-0.
2. CARB In-Use Emissions Testing of Harbor Craft Operating on Renewable and Conventional CARB Diesel
Previous engine dynamometer testing of on-road heavy-duty engines without emission controls resulted in a reduction of NOx emissions of approximately 10 percent and a reduction in PM emissions of approximately 30 percent using 100 percent RD (R100) compared to the use of conventional diesel.94,95 CARB staff further measured emissions due to use of RD compared to emissions from use of petroleum-based CARB) diesel (conventional diesel) as a fuel in CHC. CARB staff performed emissions testing using 100 percent conventional diesel, a blend of 50 percent RD and 50 percent conventional diesel (R50), and 100 percent RD (R100) in a marine-certified engine during real-world operation of an excursion vessel (a category of CHC). The goal of this study was to evaluate whether emissions reductions associated with using R100 and R50 in on-road engines translated to similar levels of reductions on marine-certified engines during normal revenue service.
a. Emissions Testing Methods and Protocol
This study evaluated the impact of R50 and R100 fuel on NOx and PM emissions when used in a CHC equipped with a Tier 2 marine-certified engine. Tier 2 engines are not originally equipped with aftertreatment to meet emission standards (i.e., they do not have SCR systems, DOCs, or DPFs. These tests were conducted in May 2019 during normal revenue service operation of a private excursion vessel operator in the San Francisco Bay (Red and White Fleet). The general location of the fleet’s operations and the route are shown in Figure E-18 below. The route heads west-northwest from Pier 43 ½, passes under the Golden Gate Bridge, and then turns towards the east-northeast, passing to the north of Alcatraz Island. The route then turns to the south and returns to Pier 43 ½. The cruise route typically takes approximately 60 minutes to complete, during which the speed is held as close to 10 knots as possible to ensure that the vessel passes specific geographical landmarks along the cruise route as they are described during the audio tour. This cruise route has the most frequent service of the cruises offered by the fleet, with approximately six departure times per day, and seven days per week operation.
94 CARB, Proposed Regulation on the Commercialization of Alternative Diesel Fuels – Staff Report: Initial Statement of Reasons (pp. 44-45), January 2, 2015, last accessed July 17, 2021, https://www.arb.ca.gov/regact/2015/adf2015/adf15isor.pdf. 95 Durbin, et al., CARB Assessment of the Emissions from the Use of Biodiesel as a Motor Vehicle Fuel in California “Biodiesel Characterization and NOx Mitigation Study”, October 2011, last accessed July 17, 2021, https://www.arb.ca.gov/fuels/diesel/altdiesel/20111013_carb%20final%20biodiesel%20report.pdf.
Figure E-18. Standard Path of Approximately One-hour of Golden Gate Bay Cruise Route
Compliance-grade portable emissions measurement systems (PEMS), meeting specifications in 40 Code of Federal Regulations (CFR) Part 1065, were used to measure NOx and PM emissions during real-world operation. One PEMS (SEMTECH-DS) determined grams NOx emitted over each second, with the other PEMS (AVL M.O.V.E. PM-PEMS 494) calculating grams PM emitted over each second during the course of each run. Engine control unit broadcast information was recorded by the PEMS systems to calculate brake-specific work from engine speed and engine torque. All three datasets were time aligned to provide real-time brake-specific emission factors.
During testing, both main propulsion engines (the engine on the port and starboard side of the vessel) were operated, but emissions were only measured from a single engine. A total of 48 test runs were made on the vessel, and fuel was supplied from the same tank, but the fuel was changed throughout the study. The first fuel tested was R100 (18 runs), the second fuel was ULSD (12 runs), and the third fuel was R50 (18 runs).
a. Analysis and Results
CARB staff and the excursion vessel operator attempted to ensure engine load and operating conditions were as close as possible among the 48 runs. However, analysis of average power and the distribution of power-based engine loads indicated that there were some differences between operating conditions of the three fuel types. These varying engine load factors were due to a multitude of constantly changing environmental conditions, including (but not limited to) strength and direction of the tide, wind speed and direction, and operating variables such as the captain piloting
the run. To address this variability issue during data analysis, real-time transient emission factors were binned into increments of 10 percent power-based load (e.g., 5-15 percent, 15-25 percent, etc.), and emission factors between fuel types were compared within the same load bins only. CARB staff did not analyze emissions below 5 percent load, because these emission factors are subject to more uncertainty due to variability in brake-specific work values as net engine torque approaches zero. Brake-specific NOx and PM emissions as a function of engine power-based load can be seen in Figures E-19 and E-20.
Figure E-19. Binned Average NOx Emissions (g/bhp-hr) vs. Power Bin
Figure E-20. Binned Average PM Emissions (g/bhp-hr) vs. Power Bin
For calculating overall impact of using R50 and R100 versus conventional CARB diesel, the average emission factors for each power bin were weighted by relative amount of engine work in that power bin during the entire study. CARB staff calculated the total engine work in each of the ten power bins, and the fraction of work originated from each power bin. CARB staff multiplied the emission factors calculated within each load by the fraction of work done in each bin to calculate a single NOx and PM emissions factor (g/bhp-hr) for each fuel. As shown in Table E-19, with binned emission factors normalized by work, NOx emission reductions in this study were 11.8 percent below convention diesel when using R100, while emission factor reductions from dynamometer-tested on-road engines using R100 were approximately 10 percent. PM emissions reductions in this study were 26.6 percent below conventional diesel when using R100, while emission factor reductions from on-road dynamometer-tested engines were approximately 30 percent.
Table E-19. Change in NOx and PM Emissions with Use of RD Compared to Conventional Diesel in CHC
Fuel Pollutant Percent Change from Conventional Diesel
Emission Factor Normalized by Engine Load
Conventional Diesel NOx Control Fuel 5.15 grams NOx/bhp-hr R50 NOx -5.13 4.87 grams NOx/bhp-hr R100 NOx -11.8 4.53 grams NOx/bhp-hr Conventional Diesel PM Control Fuel 0.129 grams PM/bhp-hr R50 PM Not available Not available R100 PM -26.6 0.095 grams PM/bhp-hr
E-61
The NOx emission factor of reduction of 11.8 percent in this in-use CHC testing correlates well to the approximately 10 percent reduction relative to conventional diesel when measured in on-road engines by dynamometer. Additionally, the R100 PM emission factor reduction of 26.6 percent correlates well to the approximately 30 percent reduction relative to conventional diesel when measured in on-road engines by dynamometer. These NOx and PM reductions correlate well to the on-road dynamometer-tested engines.
3. Requirement to Use Renewable Diesel (R99)
Based on the results of the confirmatory PEMS emissions testing in a marine application, CARB staff corroborated the emissions benefits of using RD translate to marine certified engines. Therefore, beginning January 1, 2023, all CHC will be required to use diesel fuel that is 99 percent or greater RD (R99).
4. Evaluation of R99 Volume for CHC in California
CARB staff evaluated the ability of petroleum refiners and marine fuel suppliers to provide the current volume of diesel fuel as estimated to be required under the Proposed Amendments (55 million gallons per year) in the form of R99 by January 1, 2023. RD is a commercial fuel produced in the United States and is also imported from Asia, largely from production plants in Singapore. Per publicly available information, five plants produce RD in the United States, with a combined capacity of nearly 400 million gallons per year. The U.S. Energy Information Administration (EIA) does not report RD production; however, U.S. EPA reports that the United States consumed over 900 million gallons in 2019.96 RD use at the federal level is incentivized through the federal Renewable Fuel Standard (RFS) program97 and the BD Income Tax Credit.98 The BD Income Tax Credit provides businesses using and dispensing BD or RD to claim a tax credit of $1.00 per gallon. However, most domestically produced and imported RD is used in California due to additional economic benefits under LCFS.99 Federal and State incentives due to RD’s low CI provide substantial economic value to low CI fuels such as RD for producers, importers, and blenders. For these reasons and others, production is expected to grow in the coming years due to expansions at existing plants and the construction of new plants, specifically:
96 U.S. Department of Energy, Renewable Hyrdrocarbon Biofuels, last accessed July 17, 2021, https://afdc.energy.gov/fuels/emerging_hydrocarbon.html. 97 U.S. EPA, Renewable Fuel Standard Program: Overview for Renewable Fuel Standard, last accessed July 17, 2021, https://www.epa.gov/renewable-fuel-standard-program/overview-renewable-fuel-standard. 98 U.S. Department of Energy, Biodiesel Income Tax Credit, last accessed July 17, 2021, https://afdc.energy.gov/laws/396. 99 U.S. Department of Energy, Renewable Hydrocarbon Biofuels, last accessed July 17, 2021, https://afdc.energy.gov/fuels/emerging_hydrocarbon.html.
• Phillips 66 announced in August 2020 that over the next three years it will idle crude processing at its San Francisco Bay Area (the city of Rodeo) refinery to produce 52,000 barrels per day of renewable fuels including RD, naphtha, and jet fuel.100 101 Once operational, the converted plant would be the world’s largest renewable fuels plant producing more than 800 million gallons of renewable gas, diesel, and jet fuel.102 Phillips 66 estimates the production of renewable fuels in Rodeo will result in 50 percent less carbon dioxide, 75 percent less sulfur dioxide, and fewer local emissions than the current crude oil refinery configuration.103
• Marathon Petroleum Corporation plans to convert its Martinez, California refinery to a RD facility starting in 2022 and reaching full capacity in 2023. At full capacity, Marathon would expect to produce about 736 million gallons per year of renewable fuels – primarily diesel- from such biobased feedstocks as animal fat, soybean oil and corn oil104. This change in production to RD is part of the Marathon’s commitment to reduce greenhouse gas emissions intensity by 30 percent below 2014 levels by 2030.
• Valero is the world’s second largest RD producer with a current production of 275 million gallons in Louisiana with the plans to expand production to 675 million gallons per year in 2021.105
• World Energy announced that it will invest $350 million to complete the conversion of its Paramount, California facility into one of the cleanest fuel refineries in the world. The project will enable World Energy to process 306 million gallons of renewable jet, diesel, gasoline, and propane annually;106, 107 and
100 Argus Media, Phillips 66 to convert refinery to renewables: Update, August 12, 2020, last accessed July 17, 2021, https://www.argusmedia.com/en/news/2131865-phillips-66-to-convert-refinery-to-renewables-update. 101 Phillips 66, Phillips 66 Plans World’s Largest Renewable Fuels Plant, August 12, 2020, last accessed July 17, 2021, https://www.phillips66.com/newsroom/rodeo-renewed. 102 Phillips 66, About Rodeo Renewed, last accessed July 17, 2021, https://www.rodeorenewed.com/about. 103 Green Car Congress, Phillips 66 to convert San Francisco Refinery into world’s largest renewable fuels plant; 800M+ gallons per year, August 13, 2020, last accessed July 17, 2021, https://www.greencarcongress.com/2020/08/20200813-rodeo.html. 104 Marathon Petroleum, Marathon Seeks Permits for Martinez Renewable Diesel Project, October 1, 2020, last accessed July 17, 2021, https://www.marathonpetroleum.com/Newsroom/Company-News/Marathon-seeks-permits-for-Martinez-renewable-diesel-project/. 105 Valero, Renewable Diesel, Innovation and Unmatched Execution, last accessed July 17, 2021, https://www.valero.com/renewables/renewable-diesel. 106 Biomass Magazine, World Energy Invests $350M to Expand Paramount Biofuel Production, October 24, 2018, last accessed July 17, 2021, http://biomassmagazine.com/articles/15699/world-energy-invests-350m-to-expand-paramount-biofuel-production. 107 Bioenergy International, World Energy to Complete Paramount Refinery Conversion to Renewable Fuels, October 30, 2018, last accessed July 17, 2021, https://bioenergyinternational.com/biofuels-oils/world-energy-to-complete-paramount-refinery-conversion-to-renewable-fuels.
• Global Clean Energy Holdings Inc. announced plans to convert its 70,000 barrels per day Bakersfield, California refinery into a RD production plant.108
Production of RD is expected to expand significantly in the near future due to refineries seeing the benefits in producing RD and switching traditional fossil fuel production over to RD. Other states in the U.S. that produce RD include Oklahoma, Nevada, North Dakota, Oregon, Wyoming, Texas, Kansas, and Louisiana.109 Existing and new RD production in California and the U.S. (potentially greater than five billion gallons per year) is sufficient to meet the total diesel demand in California. In addition, additional RD imports from outside of the U.S. may make additional volumes available to California, depending upon world demand.
In summary, CARB expect that there will be at least 55 million gallons per year of incremental R99 available for use in CHC to meet the Proposed Amendments.
5. Evaluation of R99 Distribution in California
The second question is whether the supply of 55 million gallons per year of R99 is available in all regions of California where CHC operate. RD is stored at the refinery and distributors are typically contracted to deliver the fuel to various customers throughout California. RD can also be transported via ship or railcar. There are several
108 Oil and Gas Journal, Global Clean Energy Lets Contract for Bakersfield Refinery Conversion Project, June 9, 2020, last accessed July 17, 2021, https://www.ogj.com/refining-processing/refining/article/14177460/global-clean-energy-lets-contract-for-bakersfield-refinery-conversion-project. 109 Biodiesel Magazine, Renewable Diesel’s Rising Tide, January 12, 2021, last accessed July 17, 2021, http://www.biodieselmagazine.com/articles/2517318/renewable-diesels-rising-tide.
examples of on-road and off-road fleets and operations, including CHC, that have switched over to and are operating on RD.110, 111, 112, 113, 114, 115, 116, 117, and 118
RD has also been used in CHC. In 2019, San Francisco Mayor Mark Farrell made the announcement that Bay Area ferries and excursion providers including Golden Gate Ferry, Hornblower Cruises, Blue and Gold Fleet, and the Water Emergency Transportation Authority to transition to the use of RD.119 Red and White Fleet in the Bay Area made the transition to RD as well.120
CARB learned from discussions with RD fuel distributors if local fuel storage is not available in an area of the State where CHC operate, the distributor could truck R99 to any location.121, 122 However, if R99 had to be trucked into an area, the user would pay an additional cost for the fuel to cover the distributors transportation costs.
110 City of Walnut Creek, City of Walnut Creek Sustainability Best Practices Activities, last accessed July 17, 2021, http://ca-ilg.org/sites/main/files/file-attachments/walnut_creek_2018.pdf. 111 DGS, Management Memo, Diesel, Biodiesel, and Renewable Hydrocarbon Diesel Bulk Fuel Purchases, MM 15-07, December 9, 2015, last accessed July 17, 2021, https://www.dgs.ca.gov/-/media/Divisions/OSPPR/Memos/MM15_07.pdf?la=en&hash=B72C4ED5D9C01190EE7DFDDAC4D36D 4A4CB85241. 112 City and County of San Francisco, Mayor Lee Announces San Francisco to Use Renewable Diesel in City Fleet, July 21, 2015, last accessed July 17, 2021, https://sfmayor.org/article/mayor-lee-announces-san-francisco-use-renewable-diesel-city-fleet. 113 City of Oakland, City of Oakland Drives Environmental Progress with New Renewable Diesel Model, April 18, 2019, last accessed July 17, 2021, https://www.oaklandca.gov/news/2019/city-of-oakland-drives-environmental-progress-with-new-renewable-diesel-model. 114 Bioenergy International, San Diego Latest Californian City to Run Municipal Fleet on Renewable Diesel, November 1, 2016, last accessed July 17, 2021, https://bioenergyinternational.com/biofuels-oils/san-diego-latest-californian-city-to-run-municipal-fleet-on-renewable-diesel. 115 Biomass Magazine, Carlsbad, California, City Fleet Fueling with Renewable Diesel, July 6, 2016, last accessed July 17, 2021, http://biomassmagazine.com/articles/13431/carlsbad-california-city-fleet-fueling-with-renewable-diesel. 116 Sacramento County, Media Release: Renewable Diesel, August 26, 2016, last accessed July 17, 2021, https://www.saccounty.net/news/latest-news/Pages/Press-Release-Renewable-Diesel.aspx. 117 Environment + Energy Leader, UPS, Google Fleets Cutting Emissions with Neste Renewable Diesel, March 10, 2017, last accessed July 17, 2021, https://www.environmentalleader.com/2017/03/ups-google-fleets-cutting-emissions-neste-renewable-diesel/. 118 Biodiesel Magazine, US Navy Completes Sea Trial with 100 Percent Renewable Diesel, August 8, 2016, last accessed July 17, 2021, http://www.biodieselmagazine.com/articles/1495553/us-navy-completes-sea-trial-with-100-percent-renewable-diesel. 119 NBC Bay Area, Bay Area to Become First U.S. Region to Use Renewable Diesel Ferries, April 12, 2018, last accessed July 17, 2021, https://www.nbcbayarea.com/news/local/bay-area-to-become-first-us-region-to-use-renewable-diesel-ferries/56739/. 120 Neste, Californian Cruise Company Red and White Fleet Switches to Neste MY Renewable Diesel, April 13, 2018, last accessed July 17, 2021, https://www.neste.com/releases-and-news/renewable-solutions/californian-cruise-company-red-and-white-fleet-switches-neste-my-renewable-diesel. 121 Meeting with Nathan Crum, VP/CEO of Valley Pacific Petroleum Services Inc., March 19, 2021. 122 Meeting with Tim Johnson, Senior Vice President/General Manager of Diesel Direct, February 16,2021.
In the cost analyses performed for the Proposed Amendments, CARB staff concluded that after factoring in various cost savings with using R99, the use of R99 would be cost neutral relative to a baseline of using CARB diesel. This conclusion was based on analysis that increased cost of production was offset by incentives, and that any cost associated with transportation would be offset by maintenance cost savings. This information is discussed qualitatively in the following subsections.
a. Cost of Fuel Production
RD costs more to produce than the fossil diesel it replaces. However, programs such as LCFS and RFS provide incentives that improve the financial viability of RD, making the fuel a viable and more cost-effective option than ULSD. The LCFS was enacted in 2007 by CARB and includes regulations with a Carbon Intensity reduction goal of 20 percent in 2030 when compared to a 2010 benchmark. The RFS is a federal mandate aimed at reducing the nation’s use of petroleum-based fuels by increasing the use of renewable fuels.
The U.S. Department of Energy (DOE) tracks the price of alternative and conventional fuels used in the United States and publishes this data in a quarterly report. In the October 2020 price report, DOE compared the average RD price in California with the average diesel prices in California. Figure E-21 below compares the average quarterly cost of diesel fuel versus RD in California from 2017-2020. As of October 2020, Clean Cities coordinators reported 46 RD prices, at an average price of $3.06/gallon, while average retail diesel price in California was $3.30/gallon.123
123 U.S. Department of Energy, Clean Cities Alternative Fuel Price Report, October 2020, last accessed July 17, 2021, https://afdc.energy.gov/files/u/publication/alternative_fuel_price_report_october_2020.pdf.
Figure E-21. Historical RD Prices Versus Diesel124
b. Cost of Transportation to Regions Where CHC Operate
Remote areas of the State such as Humboldt Bay and Lake Tahoe may have to pay increased delivery charges for RD until additional terminal locations are made available in the State. Using vessels operating on Lake Tahoe as an example, conventional diesel is already trucked in from Sacramento so there is already an increased cost to getting diesel fuel delivered to this area of the State.125 Because the closest RD distribution point is in Richmond, California, the cost to get the RD (freight cost) would increase but the minimal increase in costs would be outweighed by the maintenance benefit gained from use of RD.126 Since RD use generates less PM, operators would not need to regenerate, repair, or replace their DPFs as often. There are currently four terminal locations in California that sell RD (two in the Bay Area and two in the Los Angeles/Long Beach area) so the costs of getting RD delivered to vessels in these areas should not increase fuel delivery costs.127
124 U.S. Department of Energy, Clean Cities Alternative Fuel Price Report, January 2020, last accessed July 17, 2021, https://afdc.energy.gov/files/u/publication/alternative_fuel_price_report_jan_2020.pdf. 125 Meeting with Tim Johnson, Senior Vice President/General Manager of Diesel Direct, February 16, 2021. 126 Ibid. 127 Meeting with Dirk Vaughn, Fabio Bezerra, Tim Wang, and Matt Leuck from Neste on February 2, 2021.
Users of RD and engine manufacturers have seen additional benefits due to reduced maintenance required. Volvo Trucks North America was the first engine manufacturer to endorse the use of RD fuel.128 Volvo announced that its customers can substitute RD for petroleum diesel in all Volvo diesel engines, with no risk of losing warranty coverages. Soon after, Mack Trucks made a similar announcement.129 The Mack press release noted that” RD fuel delivers performance similar to diesel refined from petroleum, but with several additional customer benefits, including reduced greenhouse gas and particulate emissions, as well as decreased maintenance costs.”130
Another benefit is when engines equipped with DPFs use RD fuel. DPFs require “regeneration” events described in Section III.E.2. Because RD significantly reduces PM emissions, DPFs require less frequent regeneration. The result – as reported by the City of Knoxville131 and other RD end users – is that engines with DPF systems do not require as much maintenance when using RD compared to petroleum diesel, and DPF life may be extended. DPF maintenance will decrease with RD and will lessen the need to regenerate, repair, or replace DPFs as often.
C. Natural Gas
In 2018, the University of California, Riverside (UCR) College of Engineering-Center for Environmental Research and Technology (CE-CERT) completed a PEMS study on a 6,750 dead weight tons (DWT) hybrid diesel-electric commercial RORO (roll-on roll-off) cargo ferry in Vancouver, British Columbia, operating dual-fuel LNG/diesel engines.132
The main propulsion engines were U.S. EPA Category 3 Wartsila 9L-34DF models displacing 36 liters per cylinder operating on a four-stroke diesel-cycle with diesel pilot oil ignition coupled to constant speed generators. Fuels used in the study were an ULSD (<15 ppm) fuel commercially available in Vancouver and LNG supplied by the Fortis BC Tilbury LNG Plant. Main engine emissions were measured using the four test modes in the ISO 8178-4 E-2 test cycle, 25 percent, 50 percent, 75 percent, and
128 Volvo Trucks, Volvo Trucks Approves Use of Renewable Diesel Fuel for Proprietary Engines, December 9, 2015, last accessed July 17, 2021, https://www.volvotrucks.us/news-and-stories/press-releases/2015/december/volvo-trucks-approves-use-of-renewable-diesel-fuel-for-proprietary-engines/. 129 Mack Trucks, Mack Trucks Green-Lights Renewable Diesel Fuel for Use in Mack Engines, January 7, 2016, last accessed July 17, 2021, https://www.macktrucks.com/mack-news/2016/mack-trucks-green-lights-renewable-diesel-fuel/. 130 Ibid. 131 City of Knoxville Fleet Services, Renewable Diesel Test, June 15, 2017, last accessed July 17, 2021, https://tncleanfuels.org/docs/Renewable-Diesel-Report_City-of-Knoxville_6-15-17.pdf. 132 CARB, Local Air Benefits by Switching from Diesel Fuel to LNG on a Marine Vessel, March 2020, last accessed July 17, 2021, https://ww2.arb.ca.gov/sites/default/files/2021-01/LNG%20Ferry%20ARB%20Draft%20Report%20Final%20-%20CARB_ADA.pdf.
100 percent (although 90 percent was the highest actual main engine load attained during the test series).
Key findings from the study indicated that the Wartsila 9L-34DF dual-fuel diesel-cycle LNG engines reduced engine-out PM and NOx emissions by 93 percent and 92 percent, respectively. However, the actual overall ferry emissions factors calculated with LNG fuel for formaldehyde (HCHO) and methane (CH4) slip emissions occurred at 0.18 g/kW-hr (compared to 0.03 g/kW-hr with diesel fuel) and 11.52 g/kW-hr (compared to zero with diesel fuel), respectively. HCHO is a known carcinogen.133 The study proposed that an oxidation catalyst aftertreatment system could theoretically reduce 95 percent of formaldehyde and CO tailpipe emissions, however, this strategy cannot mitigate the methane slip problem.134 Methane is a GHG with a global warming potential (GWP) of 28-36 relative to CO2.135 In response to the findings of this study, the Proposed Amendments would establish a 1.0 g/bhp-hr limit for CH4, which would allow for engines of any fuel type to be used that still emit a small and less consequential amount of CH4.
While LNG/CNG engines have yet to be utilized in CHC operating in California, a number of engine manufacturers and third-party retrofit companies have, or are in the process of developing, LNG/CNG marine propulsion engine platforms. For example, Caterpillar offers the spark-ignited U.S. EPA Category 1 G3516 marine engine with 1550 kW at 1500 rpm.136 Optifuel Systems is a company marinizing land-based CNG/LNG engines for use in off-road and marine applications.137 For example, the Cummins ISX12N, a U.S. EPA Category 1 natural gas on-road engine with 320-400 hp (239-298 kW) and 1150-1450 Ib-ft of torque (1559-1966 N·m) at 2100 rpm could be used in a CHC application138.
When on-road natural gas engines are marinized according to the requirements of 40 CFR 1042.605, there could be significant opportunities for emissions reductions because of the CARB Low-NOx 0.02 g/bhp-hr NOx standards for on-road engines.139
133 American Cancer Society, Formaldehyde, last accessed July 17, 2021, https://www.cancer.org/cancer/cancer-causes/formaldehyde.html. 134 CARB, Local Air Benefits by Switching from Diesel Fuel to LNG on a Marine Vessel (pg.27), March 2020, last accessed July 17, 2021, https://ww2.arb.ca.gov/sites/default/files/2021-01/LNG%20Ferry%20ARB%20Draft%20Report%20Final%20-%20CARB_ADA.pdf. 135 U.S. EPA, Understanding Global Warming Potentials, last accessed July 17, 2021, https://www.epa.gov/ghgemissions/understanding-global-warming-potentials. 136 CAT, About Caterpillar, last accessed July 17, 2021, https://www.cat.com/en_US/news/engine-press-releases/-caterpillar-shipsfirstcat3500seriesmarinegasenginesfromlafayett.html. 137 OptiFuel Systems, About Us, last accessed July 17, 2021, https://optifuelsystems.com/optifuel. 138 Cummins, ISX12N Overview, last accessed July 17, 2021, https://www.cummins.com/engines/isx12n-2018. 139 Cummins Westport, Move to Zero: Setting New Standards for Performance and Reliability with Near Zero Emissions – ISX12N, last accessed July 17, 2021, https://www.cumminswestport.com/content/841/ISX12N_5544037_0418.pdf.
Globally, natural gas engines have been utilized in a number of different CHC categories including RORO cargo ferries, tugboats, suction-hopper type dredging vessels, offshore supply vessels, and in a specialized cement carrier vessel application.140 CARB staff acknowledges there could be some use of natural gas power in CHC applications in California in the future. However, use of natural gas fuel in marine applications presents a number of cost, feasibility, and emissions control challenges including methane slip and LNG fuel volumetric energy density being significantly lower at around one-third that of distillate fuels.141 The cost of retrofitting existing diesel-powered vessels to natural gas is relatively high. A study by the American Clean Skies Foundation found the cost of retrofitting an in-use tugboat to LNG was approximately $7M and the volume of LNG fuel required to store the energy equivalent of diesel fuel was approximately two to three times that of diesel fuel.142
Therefore, CARB expects any introduction of CNG/LNG fueling systems in CHC to be on new-build vessels.
D. Hydrogen and Ammonia Combustion
While both hydrogen (H2) and ammonia (NH3) can be used in fuel cells, ongoing research with internal combustion (IC) test engines is demonstrating the feasibility of burning H2 orNH3 in marine applications. NH3 is being evaluated in a number of studies and has shown it can, with the development of existing technologies, be used in fuel cells or in IC engines.143 However, NH3 is a toxic substance capable of causing death or serious injury to humans with exposure to high concentrations or extended periods of exposure at lower concentrations. NH3 is also a corrosive substance and presents a threat to aquatic marine life in the case of a spill as well as safety and engineering challenges with on-board fuel storage and distribution in the marine environment.144 NH3, like other fuels, may form explosive mixtures when mixed with air. Combustion of NH3 in IC engines requires significant amounts of ignition fuel such as hydrogen, diesel, or alcohols and produces various tailpipe criteria pollutants (depending on the ignition fuel utilized and the ignition method, compression ignition, CI or spark ignited, SI) such as NOx, and CO, as well as hydrocarbons (HC), and the greenhouse gases CO2 and N2O. NH3 slip is another challenge.145 Efficient renewable
140 Marine Insight, 10 Noteworthy LNG-Powered Vessels, November 5, 2020, last accessed July 17, 2021, https://www.marineinsight.com/tech/10-noteworthy-lng-fueled-vessels/. 141 DNV-GL, Comparison of Alternative Marine Fuels, July 5, 2019, last accessed July 17, 2021, https://sea-lng.org/wp-content/uploads/2020/04/Alternative-Marine-Fuels-Study_final_report_25.09.19.pdf. 142 American Clean Skies Foundation, Natural Gas Marine Vessels- U.S. Market Opportunities, April 2012, last accessed July 17, 2021, http://www.cleanskies.org/wp-content/uploads/2012/04/Marine_Vessels_Final_forweb.pdf. 143 MDPI, The Potential Role of Ammonia as Marine Fuel- Based on Energy Systems Modeling and Multi-Criteria Decision Analysis, April 17, 2020, last accessed July 17, 2021, https://www.mdpi.com/2071-1050/12/8/3265/pdf. 144 Ibid. 145 Ibid.
NH3 production pathways remain another challenge. Most industrial scale NH3 production utilizes the Haber-Bosch Process that requires hydrogen gas, most of which is obtained from steam reforming of petroleum-derived natural gas producing CO2 emissions.146 To date, few studies involving emissions measurements have been completed using NH3 fuel in IC engines. Although there are no commercialized applications to date, NH3 combustion is currently being tested in full-scale four-stroke marine engine applications by Wartsila. Testing is scheduled to commence during the first quarter of 2021. According to Wartsila, NH3 is expected to be a promising alternative carbon-free fuel for future marine engine applications.147
Hydrogen gas will be utilized as a combustion fuel in a pair of medium speed dual-fuel main propulsion engines aboard a new-build tug project at the Port of Antwerp. The vessel, Hydrotug, will utilize two 2000 kW main propulsion engines developed by BeHydro.148
CARB expects that these carbon-free alternative fuels will eventually be used in marine combustion engines in California and is expecting that these fuels will have varying amounts of tailpipe NOx or NH3 slip emissions depending on how they are utilized in dual-fuel engine operation. U.S. EPA limits NH3 slip to 10 parts per million (PPM).149
CARB will review emissions test data from these alternative fuels as it becomes available to evaluate their emissions reduction potential in marine applications.
Technological and regulatory challenges remain to utilizing these alternative fuels in commercial harbor craft applications in the United States. CARB expects that in a similar manner to LNG/CNG fueled vessels, new-build vessels will likely be required to accommodate these technologies. As of June, 2021 the USCG is nearly finished establishing the hydrogen design standards for Subchapter T passenger ferries as the Switch Maritime Seachange hydrogen ferry project is nearing completion.150 However, the USCG has yet to publish the Subchapter-T hydrogen design standards developed for this project to other 46 CFR Subchapters for vessels like towing vessels (Subchapter M) or offshore supply vessels (Subchapter L) that may utilize hydrogen fuel cells or hydrogen combustion technology in the future. Additionally, as of the
146 Ibid. 147 Wartsila, World’s First Full Scale Ammonia Engine Test- An Important Step Towards Carbon Free Shipping, June 30, 2020, last accessed July 17, 2021, https://www.wartsila.com/media/news/30-06-2020-world-s-first-full-scale-ammonia-engine-test---an-important-step-towards-carbon-free-shipping-2737809. 148 Riviera, New Four-Stroke Engine: Turning Hydrogen Sceptics into Believers, September 23, 2020, last accessed July 17, 2021, https://www.rivieramm.com/news-content-hub/new-four-stroke-engine-turning-hydrogen-sceptics-into-believers-61023. 149 U.S. EPA, Air Pollution Control Technology Fact Sheet, last accessed July 17, 2021, https://www3.epa.gov/ttncatc1/dir1/fsncr.pdf. 150 Switch Maritime, Zero-Carbon Vessels, last accessed July 17, 2021, https://www.switchmaritime.com/.
release of this rulemaking package, there are no USCG 46 CFR regulatory design standards for use of ammonia as a combustion fuel established.
VI. Opacity Testing Methods Applicable to Harbor Craft
CARB staff is proposing to include opacity testing requirements in the Proposed Amendments to ensure that end users properly maintain engines and aftertreatment systems. The proposal includes a biennial opacity testing requirement of main propulsion engines and responsibility to maintain all engines in compliance with opacity limits on a continuous basis. Analysis and testing performed to inform the procedure and limits will be discussed in the following subsections of this appendix. In this evaluation, CARB staff presents the opacity limits for on-road diesel trucks, analyzes test data collected from opacity testing cargo handling equipment (CHE), and also performs opacity measurements on CHC. Some CHE have engines that are steady-state certified, like marine engines. Many trucks and CHE are equipped with DPFs to meet an emissions standard of 0.015 g/bhp-hr of PM or less. Overall and fundamentally, all three of these source categories involve diesel engines and the same sorts of emission control strategies, such as those discussed in Section III of this appendix. Therefore, using information collected from all three of these sources, CARB staff proposes a test procedure and opacity limits that would apply to CHC under the Proposed Amendments for marine harbor craft.
A. Background: Opacity Requirements for On-Road Diesel Trucks
CARB’s Heavy-Duty Vehicle Inspection Program (HDVIP) and Periodic Smoke Inspection Program (PSIP), which apply to on-road heavy-duty trucks, require opacity testing using the Society of Automotive Engineers (SAE) Recommended Practice J1667 “Snap Acceleration Smoke Test Procedure for Heavy-Duty Powered Vehicles.”151 HDVIP and PSIP both apply to on-road heavy-duty diesel vehicles, and together ensure vehicle owner/operators are repairing emissions-related failures. PSIP is an annual self-testing program for smoke opacity and is applicable to California-based fleets of two or more heavy-duty diesel vehicles. HDVIP is a roadside inspection program conducted by CARB enforcement staff and is applicable to diesel and gasoline HD vehicles operating in California over 6,000 pounds gross vehicle weight rating (GVWR).
The SAE J1667 smoke opacity test procedure was established in 1996 through the work of a committee including CARB staff, the trucking industry, engine
151 Society of Automotive Engineers (SAE), J1667 Recommended Practice- Snap Acceleration Smoke Test Procedure for Heavy-Duty Powered Vehicles, 1996, last accessed July 17, 2021, https://ww2.arb.ca.gov/sites/default/files/2020-03/saej1667R.pdf.
manufacturers, and smoke meter manufacturers.152 The test procedure was intended to be a simple and low cost in-field test to indicate whether an engine’s emission control systems needed reparative maintenance. In brief, to perform the test, a driver rapidly accelerates a warmed-up engine, while in park and out of gear, six times. The final opacity result is the average of the 0.5-second maximum opacity readings of the last three snaps. In the SAE J1667 procedure, opacity is defined over a 5-inch pathlength. Therefore, regardless of exhaust stack diameter, all equipment is evaluated using the same metric or standard. In May 2018, CARB adopted more stringent limits for newer model year trucks as shown in Table E-20, which follows the same SAE J1667 recommended practice.
Table E-20. Opacity for On-Road Vehicles in HDVIP and PSIP153
PM Standard (g/bhp-hr) Engine Model Year / Configuration SAE J1667 Opacity Limit
0.60 MY 1990 and Earlier 40 percent 0.10-0.25 MY 1991 – 1996 30 percent 0.10 MY 1997 - 2006 20 percent 0.01 MY 2007 and Newer 5 percent N/A Level 3 VDECS 5 percent
B. Background: Opacity Requirements for Mobile Cargo Handling Equipment
CARB adopted the Cargo Handling Equipment (CHE) regulation (title 13, California Code of Regulations, § 2479) in December 2005 to reduce emission from mobile cargo handling equipment across ports and intermodal railyards. In 2011, CARB amended the CHE regulation, which among other changes required all equipment to perform opacity testing annually. The CHE Regulation also used the SAE J1667 test method originally developed and applied for on-road trucks since diesel engines operate similarly as used in a variety of applications. In the CHE Regulation, equipment failing to meet limits is required to be repaired and re-tested to demonstrate meeting applicable opacity limits before being reintroduced into service. The annual opacity monitoring applies to all types of CHE, including those powered by on-road or off-road certified engines. Table E-21 provides a summary of applicable limits, which are established as a function of the engine PM emission standard. According to the CHE Regulation, if the equipment fails to meet the opacity limit, the equipment must be repaired and retested. Post repair opacity can be up to 5 percent opacity above the nominal limits in the table.
152 CARB, Proposed Amendments to the Heavy-Duty Vehicle Inspection Program and Periodic Smoke Inspection Program, April 3, 2018, last accessed July 17, 2021, https://www.arb.ca.gov/regact/2018/hdvippsip18/isor.pdf. 153 Ibid.
U.S. EPA or CARB PM Emissions Standard (g/bhp-hr) Percent Opacity Not to Be Exceeded > 0.4 55 percent 0.31 ≤ to ≤ 0.4 45 percent 0.21 ≤ to ≤ 0.3 35 percent 0.11 ≤ to ≤ 0.2 25 percent 0.05 ≤ to ≤ 0.1 15 percent < 0.05 5 percent
Table E-21. CHE regulation Opacity Limits
Among various types of equipment, Rubber Tired Gantry (RTG) cranes are often operated by diesel generators, and do not have direct-drive engines that can be put into neutral and be rapidly accelerated. Therefore, RTG cranes are not directly compatible with the SAE J1667 test method because the engine speed cannot be rapidly accelerated. In cases where specific types of CHE cannot be tested using the typical SAE J1667 method, an alternative method must be proposed and used to meet opacity testing requirements.
During implementation of the CHE Regulation, CARB staff recognized that nearly all RTG cranes are powered by diesel generators and would be subject to an alternative test procedure. In effort to streamline the testing procedures for all RTG cranes operated at seaports and rail yards throughout the State, CARB entered into a contract with the California Council on Diesel Education and Technology (CCDET) to develop consistent guidance to apply the procedure to RTG cranes. CCDET faculty consulted multiple terminal operators, collecting data in the field, and worked with CARB to finalize suggested guidance to adapt the SAE J1667 procedure to RTG cranes.154 In brief, CCDET guidance suggests simulating a free unloaded acceleration by rapidly lifting and lowering the hoist mechanism of the RTG crane.
Since its release in 2018, terminal operators have followed this guidance and provided more consistent and uniform testing results from the RTG crane equipment type. To CARB staff’s knowledge, no other type of CHE is uniformly incompatible with the SAE J1667 test method. Regulated entities continue to perform opacity testing annually and make necessary repairs before bringing equipment back into service.
C. Analysis of CHE Opacity Data Collected in 2017 and 2018
Most CHE engines, with the exception of RTG cranes and other generators, are certified to PM standards using at least one transient certification cycle on an engine dynamometer. RTG cranes are powered by generators that are typically certified using steady-state certification cycles. Because marine engines used in CHC are certified over steady-state certification cycles (the ISO 8178 E3 and D2 cycles), it is important
154 California Council on Diesel Education and Technology, Applying the SAE J1667 Snap Acceleration Test Procedure to RTG Cranes, last accessed July 17, 2021, https://ww2.arb.ca.gov//sites/default/files/classic/ports/cargo/documents/saej1667rtg091118.pdf.
that CARB staff evaluates the relationship between opacity and PM emissions for engines that are both transient and steady-state certified.
Therefore, CARB staff has evaluated 857 opacity tests conducted by terminal operators during 2017 and 2018 to inform the development of the opacity limits and procedures that would apply to marine vessels under the Proposed Amendments. CARB staff obtained these test data as part of routine implementation and enforcement of the CHE regulation, and tests were performed on equipment types including but not limited to yard trucks, top picks, side picks, reach stackers, and RTG cranes. CARB staff acknowledge that marine vessel engines may still be different than engines operating in CHE, and therefore analyzed the data by responding to the following five specific questions in the sections below. In each of the five questions, CARB staff raise and response to a question, which is supported by additional analysis.
1. How Do the Engine’s PM Certification Standard and Certified PM Emissions Level Correlate to SAE J1667 Opacity Test Results?
The opacity limits for the CHE regulation appear to be adequately set to detect malfunctioning CHE, but in general, neither the engine PM certification standard or level appears to correlate or predict the measured opacity.
CARB staff analyzed the relationship between the engine PM certification standard, the engine PM certification level, and the opacity reading. Before presenting the analysis, it is important to distinguish between the PM certification standard and PM certification level. The PM certification standard is the regulatory limit for an engine to be certified to a given model year standard (on-road engines) or tier level (off-road engines). Engine manufacturers typically design engines to achieve better emission control than the standard. The certification level is the PM emission factor that an engine manufacturer actually measures and reports to CARB or U.S. EPA during engine certification. For example, an engine certified to a standard of 0.01 g/bhp-hr may have a certification level of 0.005 g/bhp-hr, half the value of the standard. This margin allows for varying levels of deterioration during the engine’s regulatory useful life and provides more certainty that the engine will meet in-use compliance requirements that may apply to engine manufacturers (not owners or operators) after engines are introduced into commerce.
First, CARB staff analyzed emissions according to their certification standard. Due to the finite number of tier levels and on-road emission standards, there were seven PM standards to which the pool of 857 equipment tests were certified. For all equipment except RTG cranes, there were 793 equipment tests as follows:
• 623, engines certified to a PM standard of 0.01 (g/bhp-hr); • 2, engines certified to a PM standard of 0.02 (g/bhp-hr); • 1, engines certified to a PM standard of 0.1 (g/bhp-hr); • 102, engines certified to a PM standard of 0.15 (g/bhp-hr); • 44, engines certified to a PM standard of 0.2 (g/bhp-hr);
E-75
Passed • Failed and repaired • Retired - Percent Opacity Not to Be Exceeded
(/) +-' :::J (/) Q)
0:::: +-' (/)
~ .£ u ro Q.
0
70%
60%
50%
40%
30%
20%
10%
•
• • I , ~1-
0% 0.00
I
I
• I I -
• I I •
• • • •
• 0.10 0.20 0.30 0.50
PM Standard (q/bhp-hr)
• 19, engines certified to a PM standard of 0.3 (g/bhp-hr); and • 2, engines certified to a PM standard of 0.4 (g/bhp-hr).
For RTG cranes, there were two standards to which the pool of 64 tests were certified:
• 48, engines certified to a PM standard of 0.01 (g/bhp-hr); and • 16, engines certified to a PM standard of 0.2 (g/bhp-hr).
Figure E-22 presents the PM emission standard versus measured opacity level for 793 tests of non-RTG equipment, and Figure E-23 shows the same relationship for the 64 tests on RTG cranes. Both figures indicate which equipment passed versus failed, and if equipment failed, whether it was repaired or permanently taken out of service (retired).
Figure E-22. CHE Opacity Test Results and PM standards
E-76
Passed • Failed and repaired • Retired - Percent Opacity Not to Be Exceeded
......... 70% cf-----V) 60% +-' ::J 50% V) (I)
e::: 40% +-' V)
~ 30%
>--~ 20% u I ro 10% i Q.
0 • 0%
0.10 0.20 0.30 0.40
PM Standard (g/bhp-hr)
Figure E-23. RTG Opacity Test Results and PM standards
Data in Figures E-23 and E-24 indicate there is a wide span of measured opacity levels from individual pieces of equipment certified to the same standard. All individuals performing testing must be trained and certified by CCDET according to the CHE Regulation, therefore this analysis assumes all testing was performed correctly. Therefore, the spread of measured opacity data is likely due to actual differences in the performance of individual equipment. Opacity was generally the highest, and there was the highest percentage of failed equipment for engines certified to the 0.15 g/bhp-hr PM standard. This standard was used for Tier 2 and 3 engines, and engine platforms were generally turbocharged, but did not employ technologies such as EGR or use any aftertreatment.155 Engines with PM standard lower and higher than 0.15 g/bhp-hr were typically associated with lower measured opacity levels. However, across multiple engine standards, there was a fraction of engines that failed to meet opacity limits, and many of those engines were repaired and put back into service.
Figures E-24 and E-25 present the same test data shown in Figures E-22 and E-23, but instead present the data as a function of engine PM certification level. The trends in both sets of figures is similar; PM certification level and PM certification standard have a similar relationship to opacity level. Therefore, neither an engine’s PM certification level or PM certification standard appears to be a strong predictor of the measured opacity limit. In addition, trends in opacity levels or failure rates of RTG cranes and all other non-RTG CHE were similar, and therefore, CARB staff will combine all CHE opacity test data in subsequent analysis. Because the streamlined RTG testing
155 CARB, Off-Road Certification Database, last accessed July 17, 2021, https://ww3.arb.ca.gov/msprog/offroad/cert/cert.php?eng_id=OFCI&year=2000.
guidance was not released until 2018, it is unclear how many of the opacity tests on RTG cranes were following this guidance. Therefore, it is possible that other methods were used to adapt the SAE J1667 test procedure to detect increases of soot accumulation.
Figure E-24. CHE Opacity Test Results and PM Certification Level
Figure E-25. RTG Opacity Test Results and PM Certification Level
E-78
2. Are Opacity Test Results Dependent on Equipment Type?
The test results do not suggest equipment type influences opacity measurements. In addition to separating RTG from non-RTG equipment, CARB staff also analyzed whether equipment type had any impact on the pass/fail ratio of meeting opacity limits, and whether the test procedure may have challenges in being administered to a broad variety of equipment types. Table E-22 shows the population of equipment and those that failed the initial opacity test, categorized by common CHE equipment types. Among the 857 tests, the majority of tests were performed on yard trucks and lift equipment which includes top picks, side picks, and reach stackers.
Table E-22. Equipment Type and Failure Rate
Equipment Type Total Number of Tests
Number Failing Initial Test
Failure Rate (percent)
Yard Trucks 543 53 10 Top Picks, Top Picks, and Reach Stackers 119 18 15 RTG Cranes 64 3 5 Bulk Handling Equipment* 33 0 0 On-Site Trucks** 26 5 19 Other Equipment*** 72 2 3 Total 857 82 10
* Material Handlers, Loaders, Bulldozers, Excavators, Track Loaders, Front-End Loaders, Skid Steer Loaders, and Other Loaders. ** Dump Trucks, Water Trucks and Cone Trucks, Haul Trucks. *** Manlifts, Forklifts, Rail Car Movers, Aerial Lifts, Stacker Cranes, and others.
Among the groups in the table, categories of equipment had up to a 19 percent failure rate of the first opacity test, which was On-Site Trucks. The category with the lowest rate of failure was Bulk Handling Equipment, where 0 of the 33 pieces of equipment had failures to meet opacity limits. Overall, considering that all failure rates remained relatively low (below 20 percent), and that some of the categories had relatively lower sample sizes, CARB staff conclude that equipment type did not have a substantial impact on the failure rate. In addition, there is no evidence in this dataset to suggest that the SAE J1667 procedure cannot be administered to a wide variety of equipment types that are powered by diesel engines. Specifically, RTG cranes that have engines certified over steady-state cycles, that may be a stronger predictor of how marine engines would perform during the SAE J1667 opacity test than other CHE categories, was associated with a 5 percent compared to a CHE average of 9 percent overall failure rate. Therefore, it does not appear that steady-state certified engines are prone to increased opacity failure rates when tested under a simulated transient operating condition.
E-79
3. How Can the Opacity Standards Indicate that Reparative Maintenance is Required?
CHE opacity data indicate that when opacity was greater than limits, reparative maintenance was able to be performed, equipment was re-tested, and opacity levels were within allowable limits to allow equipment to return to service.
The goal of opacity testing is to require operators to check whether engines and emission control equipment are property functioning and require repairs when needed. The limits need to be set low enough to detect emission control failures, but high enough to avoid falsely failing engines with properly functioning emission control systems. In some cases, engines may be properly functioning, but may be more susceptible to failure. Failures not reparable through maintenance, and instead are due to the design of the engine should not be responsibility of the equipment owner/operator. Systematic or engine design failures are instead a certification issue, and under certain circumstances, the engine manufacturers could be subject to corrective actions.
CARB’s CHE regulation sets opacity limits as defined in Table E-21 above as a function of the engine’s PM certification standard. These values were based on available opacity, in-use, and certification data from engines at the time the requirements went into effect. Equipment with opacity levels above the limits must be taken out of service, repaired, and re-tested before introduced back into service. The CHE Regulation allows for an engine to have up to 5 percent opacity higher than the standard when re-testing to be brought back into service. However, documentation of repairs must be made, and the engine must be retested and emit no more than 5 percent opacity greater than the limit as shown in Table E-21. In Table E-23 below, CARB staff present the fraction of engines that had initial opacity levels above the standard as a function of opacity limit.
Table E-23. SAE J1667 Opacity Tests Binned by CHE Limit (All Equipment)
Overall, 10 percent of equipment failed to meet opacity limits. 9 percent of equipment subject to a 5 percent limit passed the opacity test, which accounts for the 70 percent of engines, which were certified to a standard of 0.01 g/bhp-hr and 0.02 g/bhp-hr PM standard. Equipment subject to a 25 percent opacity limit had the highest failure rate of 20 percent, which was the highest failure rate except for the one piece of equipment subject to a 15 percent opacity limit, which failed the initial test.
To further explore whether the opacity limits were not set too low and falsely failing equipment, CARB staff evaluated whether or not a piece of CHE, after failing the initial
E-80
Test Result Failed Equipment Outcome
■ Passed ■ Failed ■ Repaired and Back t o Service Retired
test, was repaired and put back into service, or permanently retired from the fleet. As shown in Figure E-26, 74 percent of equipment failing an initial test were repaired (61 pieces of equipment) and 26 percent (21 pieces of equipment) were retired from the fleet. Therefore, considering the majority of equipment failing the initial test were able to undergo repairs and meet applicable limits after re-testing, it appears the limits were adequately set to detect failures that could result in repairs to lower smoke opacity.
Figure E-26. Failed Equipment Outcome
4. Are Opacity Test Results Dependent on Whether the Engine is Off-road vs. On-road Certified?
No, opacity test failures are very similar between off-road and on-road certified engines.
As mentioned above, on-road and off-road engines have different certification standards, different certification cycles, but most equipment is subject to both a transient and steady-state certification cycle test. For on-road engines, testing must be performed using the engine dynamometer Federal Test Procedure (FTP) and Supplemental Emissions Test (SET), and off-road engines are generally tested using the ISO 8178 and Nonroad Transient Cycle (NRTC). CARB staff evaluated whether an engine certified to on-road versus off-road cycles may impact the results or outcome of the analyses presented in questions 1 through 3 above. There were 299 opacity tests from off-road engines and 558 opacity tests from on-road engines. Figures E-27 and E-28 present the number of passing and failing tests for each certification type and engine PM certification standard.
E-81
'+-0 U') Q) u Q)
a.. '+-0 ~
Q)
..0 E :::J z
'+-0 (/) Q) u Q)
a.. '+-0 I... Q)
....0 E ::J
z
140
120
100 -+--' C 80 Q)
E 60 Q. ·-:::J
CY w 40
20
0
■ Number of Failed
■ Number of Passed
600
500 +-' C 400 Q)
E 300 0.. ·-::J O'" 200 w
100
0
■ Number of Failed
■ Number of Passed
-
0.01
5
115
0.01
56
447
.--
.--
n 0.02 0.1 0.15 0.22 0.3 0.4
0 1 17 1 0 0
2 0 100 43 13 2
PM Standard (g/bhp-hr)
I I
0.1 0.15 0.3
0 1 0
48 0 6
PM Standard (g/bhp-hr)
Figure E-27. Opacity Test Results for Off-Road Engines by Engine PM Certification Standard.
Figure E-28. Opacity Test Results for On-Road Engines by Engine PM Certification Standard
E-82
Overall, off-road and on-road engines had similar pass/fail ratios: off-road engines had initial tests with failure rates of 8 percent, and on-road engines had initial tests with failure rates of 10 percent. Both on-road and off-road engines certified to a standard of 0.01 or 0.015 g/bhp-hr would be subject to a 5 percent opacity limit under the CHE Regulation. CARB staff concludes that based upon these data, an engine having an on-road or off-road certification does not appear to impact the relationship between the certification PM standard and field opacity measured using the SAE J1667 method.
5. Are Opacity Test Results Dependent on Engine Year?
On-road engines with MY 2007 to 2009 had more failures that MY 2010 and newer on-road engines, and there was not clear trend for off-road certified engines.
CARB staff evaluated whether engine model year had a relationship or impact on the likelihood of a particular engine meeting the applicable opacity limit. Although the impact of a pass/fail is not contingent upon whether an engine has an on-road or off-road standard, CARB staff analyzed the groups separately because the control technologies used for a given engine model year may have been different depending on the PM standards to which the engines were certified.
Figure E-29 presents opacity test results as a function of engine model year for on-road engines. Note that due to the compliance responses due to requirements in CARB’s CHE regulation, there are no on-road engines with MY 2006 and earlier engines in the sample. All engines shown in Figure E-30 are subject to a 5 percent opacity limit; the greatest number of failures is seen with MY 2007 engines, decreasing with newer engines. The majority of failures were on MY 2007 to 2009 engines, which was the timeframe where DPFs were required but the NOx standard did not result in widespread use of SCR. The consequence of meeting a lower NOx standard (2 g/bhp-hr) without use of SCR is that engines were calibrated to have higher engine-out PM (to be controlled by the DPF aftertreatment) and in turn lower engine-out NOx. When properly functioning, the DPFs trap and reduce PM and lower visible opacity. When improperly functioning, higher engine-out PM is released from the tailpipe. Failures appeared to decrease with MY 2010 and newer engines that had lower engine-out PM levels and higher engine-out NOx, although CARB staff recognizes the small sample of MY 2010 and newer engines in this data sample.
E-83
----
Figure E-29. Opacity Test Results for On-Road Engines with Failed Opacity Tests by Engine Model Year
cfi 70% .......... tl 60%
~ 50% Cl)
a:::: 40% • +..J
~ 30%
c20% • ~ 10% I • I • Q_
0 0% ___.. N N N N N N N N N --0 0 0 0 0 0 0 0 0 0 --0 0 0 0 0 0 ___.. ___.. ___.. ___.. CX) 0 N +:>, °' CX) 0 N +:>, °'
Engine model year
Figure E-30 presents opacity test results as a function of engine model year for off-road engines. Data show that older engine model years tended to have higher failure rates, but there was a less clear trend than for on-road engines. Off-road engines did not require controlling PM emissions as significantly until Tier 4 Interim standards took effect with MY 2011 engines (for engines rated 175-750 hp). Unlike on-road, various combinations of control technologies were used to meet Tier 4 Interim, and eventually Tier 4 Final standards depending on engine manufacturer.
E-84
---Figure E-30. Opacity Test Results for Off-Road Engines with Failed Opacity Tests by Engine
Model Year
cf< 70% I -u, +-"
60% ::,
50% • u, • a, • a::: 40% • +-" • • u,
30% I
~ • • • • • • • ~ +-"
20% u 10% ro Q. • 0 0%
N N N N N N N N 0 0 0 0 0 0 0 0 0 0 0 0 0 --l. --l. --l.
0 N +::- °' CX) 0 N +::-
Engine model year
CARB staff concluded that a large number of engine model years are subject to failed opacity limits. Failures are not isolated to on-road or off-road certified engines, and do not appear to be related to a narrow range of model years. Data are not shown, but the failures were not concentrated on an engine manufactured by a single company over another.
Overall, analysis of opacity test data collected from several hundred pieces of CHE suggested that limits were likely set appropriately for the CHE program. However, lack of trends or associations with the application, age, or certification PM level of an engine suggested that further analysis is needed before proposing standards on marine engines. CARB staff performed additional opacity testing on marine engines directly, which is discussed in the next section.
D. CHC: Field Opacity Collection Methods
With the intent to further investigate the behavior of the SAE J1667 test procedure on marine steady-state certified engines, CARB staff performed additional opacity testing following the SAE J1667 test procedure and other testing approaches on a variety of types of CHC using various tiers of marine engines.
E-85
1. Instrumentation and Calibration
A Bosch opacity meter, model RTT 100, was used in this data collection effort.156 The Bosch RTT 100 model works by taking a partial flow sample from an external probe inserted into the exhaust stack. The opacimeter measures smoke concentration based on the strength of the absorbed and scattered light when light is transmitted directly through the sampled exhaust gas. The opacimeter is powered by 12 Volts (V) and can be powered either by a 12V battery or a 12V power supply that plugs into 120V line voltage. The RTT 100 takes roughly ten minutes to warm up and self-calibrate before it is ready to take a measurement and can be utilized with a few different operating modes including snap-idle, continuous measurement, and a rolling test mode where it collects and stores multiple data points continuously for up to 5 minutes and reports the maximum value during the interval of data logging.
Prior to use for testing, the Bosch RTT 100 was compared with an opacimeter on a mobile trailer-mounted Carson-Haley smoke generator, serial number: 1201639, operated by CARB’s Enforcement Division that generates a fixed and consistent concentration of smoke at specific percentages of opacity that is used to certify opacity testers on the Method 9 visual test for stationary sources.157 Prior to operation, on January 14, 2020 the smoke generator opacimeter was checked against a set of partially opaque National Institute of Standards and Technology (NIST)-traceable calibration lenses with 20 percent, 50 percent, and 70 percent Ringelmann opacity.158
The smoke generator utilizes a toluene burner for producing black smoke and a CARB diesel fuel evaporator for producing white smoke. The opacimeter utilized on the smoke generator trailer was a properly calibrated Environmental Monitor Service (EMS) M750 model, serial number: 20071526/629.159 Figure E-31 presents a scatter plot of the Bosch RTT 100 instrument outputs versus the output from the CARB smoke generator. Opacity levels have been normalized to a 5-inch path length using the Beer-Lambert Law to correspond with the standards and practices used for the SAE J1667 test procedure.
156 Bosch RTT-100 Diesel Smoke Opacimeter Operating Instructions 157 U.S. EPA, Method 9 - Visual Determination of the Opacity of Emissions from Stationary Sources, August 3, 2017, last accessed July 17, 2021, https://www.epa.gov/sites/production/files/2017-08/documents/method_9.pdf. 158 Bureau of Mines, Ringlemann Smoke Chart, May 1967, last accessed July 17, 2021, https://www.cdc.gov/niosh/mining/userfiles/works/pdfs/ic8333.pdf. 159 CARB, Evaluation of Opacity Filters by Pamela Niiya, December 4, 2019.
I- 20 .. I- .. •·• c:::: ..c V 10 .. V, ... 0 .. ca ..
0 ..
0 10 20 30 40 50 60 Smoke Generator Opacity
Figure E-31. Bosch RTT 100 vs Smoke Generator Opacity
Results show that the smoke meter was on average within 2 percent of the smoke trailer over the range of 0 to 50 percent opacity. In addition, in the application of SAE J1667 opacity testing on marine vessels, in some cases up to a 32-foot copper pipe and/or conductive silicone tubing was required between the exhaust outlet and the Bosch opacity meter. Depending on the vessel and opacity meter configuration, and if the opacity tester elects to measure at the tailpipe instead of from an inline sampling probe in the exhaust manifold, these longer sampling line extensions may be needed for proper administration of the SAE J1667 test procedure. Even when using conductive sampling lines, which is the industry standard to avoid electrostatic wall losses, there still may be diffusional losses. CARB staff calculated the losses of diesel PM within this transfer tube with a flow rate of 1.2 liters/second, assuming particle diameter of 300 nm and an exhaust temperature of 250ºC.160 Diffusional losses under these conditions were estimated to be 1.8 percent. In circumstances where shorter transfer lines would be used, diffusional losses would be smaller. CARB staff did not perform any adjustment or correction to the final results measured by the Bosch RTT 100 meter.
2. Test Procedure
CARB staff worked with vessel owners and operators to perform opacity measurements of main propulsion engines under a few operating conditions where
160 Calculated using Equations 7.28 and 7.29 in Aerosol Technology (1999) by William C. Hinds.
E-87
feasible for a given vessel. Testing was not performed during engine start up or until engines achieve their normal operating conditions to be ready for opacity tests. The testing procedures used in this initial test series vary from the final transient opacity testing procedure discussed in Section VI.D.2. below and in Appendix A. This test series utilized a snap test (where feasible), a steady state mode, and a transient test mode with multiple throttle control application times. On marine vessels, measurements of opacity were conducted during the following operations:
• Steady-state mode: Vessels operated main engines underway at the typical vessel steady-state transit speed until engine oil temperature reached 160°F. The vessel remained at the steady-state transit speed in a straight line for at least 60 seconds without turning or adjusting throttle positions before commencing the opacity measurements. Three consecutive 30-second steady state opacity tests were conducted on each main engine within a single ten-minute period and the maximum instantaneous value recorded by the chart recorder was recorded as the maximum opacity reading for each test. Final opacity was the average measurement of the three maximum opacity readings obtained.
• Transient mode: Vessel was accelerated from a stop with full engine power for 10 to 30 seconds depending on the time required to reach a constant vessel speed. This procedure was designed to measure opacity during the maximum power applied to the engine during any point in operation. Full throttle was maintained for 10-15 seconds. Three tests were performed on each main engine in series with three 1-second, t hree 2-second, and three 3-second throttle application times. The results of the three maximum opacity measurements obtained during each test were averaged to obtain the average opacity for three 1-second, three 2-second, and three 3-second throttle application times. The use of various throttle application times informed whether there were any significant changes in measurable opacity based on the rate of throttle control movement.
• Snap acceleration: Where technically feasible (where the engine can be revved up while gearboxes are in neutral, or disengaged from any propellers), a snap acceleration test following the SAE J1667 test procedure was administered. Three tests were performed on each engine and results were averaged.
Where logistically possible, auxiliary engines were tested using one or multiple of the test modes listed above. Most auxiliary engines are generators, and testing on two vessels were performed under steady-state conditions with a typical operational electrical or “house” load applied.
3. Test Vessels
CARB staff performed opacity tests on seven vessels that operated primarily in the Northern California region, which included tugboats, ferries, workboats, and excursion vessels. Table E-24 summarizes the number of vessels, number of engines, and marine engine tiers evaluated aboard those vessels. Vessels represent engines ranging from
E-88
uncertified pre-Tier 1 engines to engines certified to Tier 4 standards. Different vessel types and engine manufacturers were represented in the engines listed below.
Table E-24. Tested Vessels and Engines
Vessel Category No. of Vessels No. of Engines Engine Tier Tugboat 3 5 Pre-Tier 1, 1, and 4 Ferry 2 4 Tier 2 and 3 Excursion 1 2 Tier 2 Workboat 1 2 Tier 3 Total 7 13 -
E. CHC: Analysis of Newly Collected Field Data
Table E-25 shows the test results of the opacity tests. All tested engines in this evaluation were main propulsion engines, either designated as port or starboard (STBD), and use CARB diesel fuel.
CARB staff evaluated combinations of engine tier level (PM certification standards), engine displacement, power density, and other parameters, but no correlations were found that would consistently correlate these factors to measured opacity.
For example, one workboat recently repowered with new Tier 3 engines had no known or detectable mechanical or maintenance issues yet both main engines produced exhaust having 25 percent opacity while another vessel, an escort tug with Tier 1 engines, produced exhaust having between 11 to 14 percent opacity. These results suggest that measurable opacity is less a function of tier level or displacement, and more a function of engine parameter settings, fuel injection ramping rates, and
E-89
their response to input from integrated smoke control sensors and other emissions related engine subsystems.
One vessel in the test series had an intermittent failure mode in an emissions related engine subsystem actuator controlling a single-stage sequential turbocharger system related to smoke control.161 When functioning properly, the engine consistently produced a measurable opacity of 35-36 percent as shown by the Ferry 1 STBD Tier 2 engine in Table E-25. However, when the actuator failed to properly operate the sequential turbocharger system, the measured opacity would consistently increase to over 50-60 percent measured opacity (results not shown in Table E-25). This malfunction occurred about once every three tests, but not during the transient 2-second application of the throttle as shown in Table E-25. CARB staff retested this vessel and particular engine a second time to confirm the test result.
CARB staff also found that while some vessels had secondary electronic engine throttles in the engine room complementing those in the pilot house, only a low number of vessels are able to operate engine throttle controls independently of gearbox engagement, and many older vessels do not have this capability. Therefore, as a result of performing testing on these vessels, CARB staff determined that it would not be possible to apply the snap acceleration procedure on all types of CHC. Instead, CARB staff found the proposed transient testing procedure is an effective way to apply the SAE J1667 test procedure to marine engines used in CHC. Because vessels are designed to transit in the water, the procedure could be applicable to all main propulsion engines.
F. CHC: Recommended Opacity Test Requirements for Harbor Craft
The Proposed Amendments would require use of the SAE J1667 test procedure by measuring smoke opacity from main propulsion engines during the transient acceleration of the vessel over the water. Main propulsion engines would be subject to biennial self-testing, and be required to meet opacity limits at all times after January 1, 2023. Auxiliary engines would not be subject to biennial testing requirements, but would be subject to meeting the same opacity limits during inspections.
161 MTU Solutions, Turbocharging: Key technology for high-performance engines, January 2014, last accessed July 17, 2021, https://www.mtu-solutions.com/content/dam/mtu/download/technical-articles/3100641_MTU_General_WhitePaper_TurboCharging_2014.pdf/_jcr_content/renditions/original. /3100641_MTU_General_WhitePaper_TurboCharging_2014.pdf.
1. Test Procedure: Applying SAE J1667 to Main and Auxiliary Engines
Similar to the guidance and application of the SAE J1667 method for RTG cranes to meet the opacity limits of the CHE Regulation, CARB staff is proposing for CHC to adapt the SAE J1667 method using transient operation of the engines.
Under the Proposed Amendments, vessels would be required to accelerate from a standing stop to full engine power for 10 to 30 seconds depending on time required for the vessel to reach a constant speed. This procedure is designed to simulate the maximum power applied to the engine during any point in operation. A short series of three acceleration tests with the vessel operator required to move the main engine throttle controls from idle to full throttle in 2-seconds would be required to be performed in series. Results of the maximum recorded opacity for each test should be measured and the final opacity will be the average of the maximum recorded measurements from each of the three tests.
Auxiliary engines would also be subject to meeting proposed opacity limits according to the SAE J1667 test procedure. Due to the variety of applications, CARB is not proposing to require biennial opacity testing for auxiliary engines. However, operators would be subject to meeting opacity limits during any type of operation, steady-state and transient, for their particular individual applications as installed.
2. Proposed Opacity Limits
Staff is proposing the opacity limits shown in Table E-26, applicable to main propulsion and auxiliary engines. Engines equipped with a DPF tested under transient mode would be subject to a 5 percent opacity limit. Non-DPF equipped would be subject to 40 percent opacity limit.
Table E-26. Proposed Opacity Limits for Main Propulsion and Auxiliary Engines
Engine Standard Opacity Limit Any Tier, No DPF 40 percent Any Tier, With DPF 5 percent
All properly functioning marine engines tested and presented in Tables E-23 and E-24 would meet these proposed opacity limits by a margin of 15 percent opacity or more. All engines tested were not equipped with a DPF, and in some cases measured opacity at levels below 40 percent would still indicate there may be maintenance related issues with the engine or aftertreatment system. However, due to the variability in engine calibration between models and engine manufacturers, and the various approaches manufacturers have used to control transient smoke as discussed in Section III.A.5 of this appendix, CARB staff is not proposing a more stringent or lower opacity limits. Unlike the methodology in the CHE Regulation, there is no allowable margin or increased opacity allowed when retesting engines. For DPF equipped engines, a 5 percent opacity must be met, which is consistent with the latest
E-91
requirements for DPF equipped engines in PSIP and HDVIP for on-road heavy-duty vehicles.
3. Commercially Available Meters Meeting SAE J1667
CARB staff compiled commercially available meters that are calibrated to the SAE J1667 method that are available today and could be deployed to measure exhaust emissions from CHC. Note that because wet exhaust systems need to be measured after the engine and any aftertreatment, but before seawater injection, certain meters that are designed to clip on an exhaust stack would not be applicable.
Table E-27. Commercially Available Meters Meeting SAE J1667
Make Model Measurement Mounting Type Peak/Continuous Measurement
Red Mountain Smoke Check 1667162 Partial Flow Clips on Stack Peak
CARB is proposing that vessel owner operators may opacity test their engines after completing a course offered by CCDET. CARB staff has met with CCDET, and is anticipating to collaborate to create a marine-specific course. Anybody performing opacity testing would be required to take this training course, regardless if the individual is the owner or operator of the vessel, or a third-party for-hire company. If, during implementation of the Amended Commercial Harbor Craft Regulation, there are challenges associated with consistent application of the proposed CHC opacity testing methodology, this course would provide guidance to assist with meeting proposed opacity testing requirements.
162 Red Mountain, Inc., Diesel Emissions Testing Solution, last accessed July 17, 2021, http://www.redmtnengr.com/. 163 Beryl Technologies LLC, Portable Wireless Diesel Smoke Opacity Meters, last accessed July 17, 2021, http://www.beryltechnologies.com/. 164 Wagner, 7500 In-Line Smoke Opacity Meter, last accessed July 17, 2021, https://www.wagerusa.com/copy-of-7500-partial-flow. 165 Wagner, 6500 Smoke Opacity Meters, last accessed July 17, 2021, https://www.wagerusa.com/6500-smoke-meters.
VII. Zero-Emission and Advanced Technologies (ZEAT) in the Marine Sector
Governor Newsom’s Executive Order N-79-20, signed in September 2020, among other directives specifies that CARB shall develop and propose strategies to achieve 100 percent zero-emission operations from off-road vehicles and equipment by 2035. CHC are a type of off-road equipment, and at this time there is not widespread implementation of zero-emission operations in the sector. However, the Proposed Amendments will include requirements for using Zero-Emission and Advanced Technologies (ZEAT) for new excursion vessels by 2025 and for all short run ferries (defined as those traveling 3 nm or less on a single run) by 2026. In addition, the Proposed Amendments include additional provisions for introducing ZEAT into the sector through an Alternative Control of Emissions (ACE) compliance plan, where vessel owners and operators can propose an alternative plan to achieve equivalent emissions reductions compared to directly complying with the requirements, and also a credit for deploying ZEAT into their operations where not required. The following sections provide background on ZEAT technologies used in CHC and the basis for the staff proposal.
A. Enhanced Efficiency Propulsion (EEP) System Configurations in CHC Applications
A variety of Enhanced Efficiency Propulsion (EEP) system designs are currently available for use in several CHC categories. EEP technologies are projected to offer certain harbor craft operations a considerable reduction in fuel use and scheduled main propulsion engine maintenance. This could provide a positive percentage return on investment (ROI) over the life of the vessel. Fuel use reductions translate into criteria pollutant and GHG emissions reductions. However, significantly beneficial applicability of these systems is limited to a small number of CHC and each must be evaluated on a per-case basis to calculate potential benefits and determine economic and technological feasibility. CARB staff provides an overview of different enhanced efficiency configurations below.
1. Diesel-Electric Propulsion Systems
Diesel-electric propulsion systems may utilize multiple diesel engine driven generators to power electric motors connected through common switch gear to drive reduction gearboxes or directly to vessel propeller shafts. There are no direct mechanical connections between the diesel engines and the propellers. The generator engines may run at a constant speed or a more efficient variable-speed generator design may be utilized to produce usable power at any engine rpm depending on demand. Some diesel-electric systems may also utilize a variable pitch propeller in order to increase engine fuel efficiency. Diesel-electric drive is versatile in its ability to match efficient diesel engine loading to the vessel speed or power demands. For example, a diesel-electric vessel with two engines, generators, and shaft mounted electric motors can shut down one engine and power both propeller shafts at lower vessel speeds
E-93
with only one diesel engine running at a higher load where it is more efficient. Diesel engines are designed to have higher fuel efficiency at loads above 80 percent.166
However, vessel operating conditions do not always place a high demand for power on the engines. If both engines are operated at 20-30 percent load during low-speed vessel transit, engine fuel efficiency can potentially be reduced well below design capability. By running both electric drive motors from one main propulsion engine connected through propulsion system switch gear, the load on the single engine is increased, which raises its fuel efficiency. In some vessel operating circumstances, this increase in fuel efficiency may offset electrical system conversion losses. Another benefit to this design is having one engine shut down saves additional fuel and lowers operating hours and low-load engine wear. This reduces life cycle maintenance costs by increasing the amount of time between service or overhaul intervals.
Some “diesel-electric” vessel designs utilize an array of multiple generator engines, running on either diesel, natural gas, or other fuels. Each engine may operate with a variable speed generator connected to drive motors through common switch gear and motor controller systems. Depending on vessel power demand, numerous combinations of running engines at different power outputs can be arranged to meet the load requirement in the most fuel-efficient manner possible. By reducing low load engine hours and eliminating idle time on larger engines in conventional propulsion systems, fuel consumption and therefore criteria and GHG pollutants may be reduced by up to 50 percent.167
2. Diesel-Electromechanical Propulsion
The diesel-electromechanical propulsion configuration consists of either a diesel-mechanical propulsion system with clutches for the main engines and electric propulsion motors on the propeller or Z-drive shafts. If the system includes an onboard energy storage system (ESS, or battery bank), it can be considered a parallel hybrid propulsion system. Either of these two configurations can be combined with an additional diesel-electric power take in (PTI) system that takes over at vessel modes of operation with low power demand. The system can be used with or without a battery making it either a hybrid system or a diesel-electromechanical propulsion system.
Diesel-electromechanical propulsion system configurations are projected to be beneficial for ships such as ship assist and escort tugboats. The highly variable duty cycle of these vessels consists of roughly 30 percent idle time on standby maintaining position, low speed transit mode while traveling between jobs or to intercept ships,
166 Khan, et al., Effects of Diesel Addition on Viscosity of Linseed Oil and Consequent Effects on Performance Characteristics of CI Engine, last accessed July 17, 2021, https://www.researchgate.net/figure/Mechanical-Efficiency-V-s-Engine-Load_fig3_302991246. 167 CAT, Real-World Comparison Reveals Big Savings, last accessed July 17, 2021, https://www.cat.com/en_US/by-industry/marine/hybrid-propulsion/real-world-comparison-reveals-big-savings.html.
and then pushing hard to help large ships maneuver for approximately 1-2 percent of the time during work mode. Idling or running the large main engines at very low loads on standby to maintain position in currents was previously required by traditional tug designs to maintain vessel maneuverability at all times when the vessel is operational. Running the large main engines at idle or low loads consumes large amounts of fuel and accumulates operating hours very quickly. The large main engines are only needed at full power for a very small percentage of the overall operating duty cycle. However, when the tugs are working and must use their full bollard pull, large main engines are needed.
The emissions benefits of the PTI system comes from the ability to shut the large main engines down during standby and transit modes of operation, open their clutches, and then run any combination of diesel-electric generators and/or batteries to drive electric motors through switch gear into the PTI system. Batteries are not required for a diesel-electric PTI system to operate, or for the PTI systems to achieve emissions benefits. Contemporary tug designs in from circa 2017 onward are running full size main engines such as Caterpillar 3516E engines with three Caterpillar C-9 diesel electric generators and the two house-load generators through switch gear for the PTI system. Current diesel electromechanical tug designs have moved away from the cost and complexity of lithium-ion batteries making them diesel electromechanical propulsion configuration vessels as opposed to true hybrids. Initial hybrid tug designs from 2009-2012 were built or retrofitted by Foss Maritime to incorporate battery ESSs. Through research conducted by UCR in 2010, a side by side study between the Foss Carolyn Dorothy hybrid and diesel mechanical Alta June harbor tugs in Long Beach demonstrated an emissions benefit for the hybrid Carolyn Dorothy tug over the traditional diesel mechanical Alta June tug of 73 percent PM2.5, 51 percent NOx, and 27 percent CO2 over an evaluation of six discrete operating modes: shore power, dock, standby, transit, ship assist, and barge move.168 However, the study concluded the bulk of the emissions benefits came from the hybrid tug’s ability to operate as a diesel-electric tug during low power demand using the PTI system and not from the batteries. It was estimated the batteries only provided an additional 1-3 percent emissions benefit. Due to their high cost and feasibility concerns aboard a CHC with limited space, lithium-ion batteries have been omitted from current tug designs.
3. Diesel-Hydrostatic Propulsion
Diesel-hydrostatic propulsion configurations utilize a PTI system that is accomplished through the use of fluid power transfer. Without any motors, batteries, or switch gear, a third smaller engine is utilized to drive a variable displacement axial piston hydraulic
168 UCR, Evaluating Emission Benefits of a Hybrid Tug Boat, October 2010, last accessed July 17, 2021, https://ww2.arb.ca.gov/sites/default/files/2020-12/hybridreport1010_remediated.pdf.
pump similar to one in a large hydraulic excavator.169 A PTI system is arranged on each main engine gearbox where the main engines can be shut down, declutched, and the gear boxes can then be driven by hydraulic drive motors powered by a smaller pump engine. This saves fuel and reduces accumulation of operating hours on the main engines when their full power is not required by vessel power demand. While not as efficient as an electromechanical propulsion configuration, diesel-hydrostatic fluid power transfer accomplishes operating a PTI system without the complexity of switch gear, motor controllers, charge controllers, batteries, or electric motors. Diesel-hydrostatic drive configurations do not require careful electronic designs to withstand the seawater environment and may also have the benefit that fuel consumption efficiency improvements are not dependent upon access to the electrical grid for battery charging. However, there are currently very few of these systems operational, and CARB staff is not aware of any emissions testing demonstrating the emission benefits of diesel-hydrostatic propulsion systems.
Caterpillar, with their engineering expertise in hydraulic excavators, pumps, and large gearboxes, is commercializing a diesel-hydrostatic propulsion system for use in tugboats using 3512 or 3516 main engines with a third and smaller C-32 engine driving the hydrostatic PTI system. Caterpillar markets this system as the Advanced Variable Drive (AVD) propulsion system. Current systems are for relatively large Category 1 engines in tugboat propulsion applications. As of June 2021, Caterpillar has not indicated whether they will be producing smaller versions of this system for use in other CHC with variable duty cycles that may benefit from AVD use and that have engines in lower displacement and power subcategories. Potential duty cycles may include tugboats, potentially some offshore supply vessels that have extended periods of lower load while loading or offloading supplies, certain types of pilot station boats, and possibly some types of work boats. A Turkish ship builder, Sanmar, is currently building a tractor tug that will utilize Caterpillar’s AVD system. Analysis conducted by a Caterpillar engineer projected that this system may reduce fuel consumption by as much as 16 percent compared to traditional diesel-mechanical propulsion tugboat configurations and demonstrates that AVD technology is scalable to larger vessel applications such as a Royal Navy Type 45 Destroyer requiring >20 MW of output per propeller shaft.170
4. Discussion of Potential Benefits and Disbenefits of EEP in Marine Applications
EEP systems can reduce fuel consumption and emissions in vessels with highly variable duty cycles. For example, ship assist/escort tugboats and offshore supply vessels may
169 Powers, Judith, Cat Introduces AVD Scalable Power System, February 22, 2019, last accessed July 17, 2021, https://www.waterwaysjournal.net/2019/02/22/cat-introduces-avd-scalable-power-system/. 170 Strashny, Igor, The CAT Advanced Variable Drive Marine Propulsion System, last accessed July 17, 2021, https://s7d2.scene7.com/is/content/Caterpillar/CM20180906-23030-46993
utilize relatively high levels of power from main propulsion systems while working in specific modes, such as when assisting OGVs to dock or undock, helping OGVs maneuver through shipping channels, and moving offshore platforms. However, both assist/escort tugs and offshore supply vessels spend considerable operating time at low-speed transit or on standby with engines idling or using minimal power required for station keeping in tidal currents. In the operating modes requiring relatively lower power output, main propulsion diesel engines are run at inefficient low to medium loads or waste fuel idling.171 EEP systems are designed to reduce brake-specific fuel consumption by enabling vessels with highly variable duty cycles to shut down large main engines and power vessel propulsion with an array of smaller displacement diesel-electric generators operating at higher engine loads. As a result, this decreases brake specific fuel consumption in the low power demand modes of vessel operation. Additionally, the maintenance costs associated with operating smaller less expensive diesel-electric or diesel-hydrostatic PTI engines instead of wearing out the large diesel-mechanical main propulsion engines is an additional significant cost savings for vessel operators. Diesel-electric and diesel-electromechanical propulsion systems are expected to cost more than diesel-hydrostatic EEP systems due to the requirements for relatively large electric main propulsion motors and the complexity of integrated control systems with the diesel-electromechanical EEP systems. The large displacement main engines and their highly variable duty cycle in harbor and escort tug applications makes many of these vessels a good application for diesel-electric, diesel-electromechanical, and diesel-hydrostatic enhanced efficiency propulsion configurations. However, fuel consumption reductions and attainable emissions benefits with EEP are location and application specific.
Therefore, there are three reasons why CARB is not automatically including EEP systems as a ZEAT credit category. First, CARB staff has yet to obtain and review any data on the potential or measured decreases in tailpipe emissions of EEP systems. This may be due to the small number of EEP systems in operation in RCW and due to EEP systems being a relatively new technology. Second, CARB staff suspects the fuel savings projections and emissions benefits associated with EEP operation may be overestimated because electrical propulsion system power conversion losses and brake specific fuel consumption and emissions increases associated with the reduced operating efficiency of smaller displacement EEP PTI diesel engines compared to larger main propulsion engines with greater volumetric efficiency may offset potential emissions benefits. Third, the actual vessel fuel consumption and emissions reductions while operating an EEP system will vary considerably depending on the vessel design, operating location, and specific vocation of the vessel in question. For example, the vessel EEP system may be designed to work well in a sheltered bay or harbor with a vocation providing sufficient variability in the main engine duty cycle, but if the vessel changes vocations and propulsion system duty cycles or changes owners and moves to
171 UCR, Evaluating Emission Benefits of a Hybrid Tug Boat, October 2010, last accessed July 17, 2021, https://ww2.arb.ca.gov/sites/default/files/2020-12/hybridreport1010_remediated.pdf.
a new operating location, the EEP system may or may not be able to provide sufficient propulsion system power in strong winds and strong tidal currents associated with the new operating location and new vocation and this would necessitate operating the larger main engines more often or possibly all of the operating time in which case the EEP system components would be added weight to the vessel requiring greater fuel consumption and increased emissions, a possible disbenefit. This last worst-case scenario could potentially negate the EEP system emissions benefits based on the location/vocation of a vessel and so any ZEAT credits under the Proposed Amendments would be given on a case-by-case basis. CARB review of EEP systems as part of ZEAT credits and/or an ACE Plan would require demonstration that a particular vessel has, and would continue to, provide operational fuel savings and emission benefits.
Most CHC in California with relatively large Category 1 diesel engines other than harbor and escort tugs do not have an appropriate duty cycle that varies enough or a requirement for occasional high main engine power output for short time periods. The categories with potential disbenefits of EEP include vessels operating for extended time periods at constant high main engine loads. For example, high-speed ferries, low-speed ferries, excursion vessels, most pilot run-boat vessels, ocean towing/pushing tugboats including articulated tug barges, most crew and supply vessels, most workboats, most research vessels, and most fishing vessels (commercial fishing vessels and commercial passenger fishing vessels) that operate far from shore for considerable time periods.
High-speed ferries, such as the vessels commonly operated in the San Francisco Bay Area typically have a bi-modal load profile where they have a very high percentage of engine idle time and then, similar to harbor and escort tugs, require very high power output. However, high-speed ferries run their engines at high output for extended time periods while they transit at 27-36 knots. They are either idling or running at 90-100 percent throttle. A small amount of time is spent on standby station keeping while waiting for a passenger terminal to dock, slowing down, accelerating, or maneuvering to enter or depart passenger terminals. Ferries may also utilize a dock-push mode to maintain position of the vessel up against the dock for safety of passengers in rough weather as they embark/disembark the ferry. The large main engines aboard high-speed ferries are in the same large displacement range as the Category 1 engines that many harbor and escort tugs are running. However, the ferries run their engines at high power output where they consume fuel efficiently for extended time periods as opposed to just occasionally when a tug is in work mode. The time spent in low power demand modes, such as idling and maneuvering, could be an opportunity for reductions. However, any EEP system weight added to a high-speed ferry that may be able to provide fuel consumption and emissions reductions in some of the lower-power demand modes of operation would have to be carried by the main engines during high-speed transit and this would likely increase fuel consumption and associated emissions by a greater amount than could be saved in the lower-power modes of operation. Additionally, conversations with high-speed ferry operators have indicated that the power requirements of high-speed ferries during the
E-98
maneuvering/docking modes of operation can be a relatively high percentage of main engine power if strong weather or tidal currents are interfering with vessel operations; it is doubtful an EEP system would be able to provide the necessary power for safe vessel handling/maneuvering in all weather conditions. The Proposed Amendments will not allow for engines to idle longer than 15 or 30 minutes. Therefore, incremental benefits of using enhanced efficiency technologies is limited to reductions while maneuvering or transiting.
Towing vessels, including ATBs, which perform ocean towing or barge moves operate at a significantly higher average main engine load factor typically around 45-50 percent for extended time periods. The majority of operational time underway is at higher engine loads of 80-90 percent or above where little fuel efficiency and emissions benefit is possible from utilizing EEP. Depending on vessel design and propulsion system configuration, EEP systems may only generate 15-20 percent of the total vessel propulsion system power requirement. While EEP systems may be utilized to augment larger main engine power to boost total output in certain work modes, EEP system fuel consumption and emissions reductions are achieved in operational modes where the EEP system can meet vessel power requirements and allow larger main engines to be shut down.
B. Zero-Emission Capable Hybrid Vessels and Systems
By definition, a hybrid vessel propulsion system has two or more energy sources which can be utilized individually or in combination to power the vehicle or vessel utilizing mechanical propulsion, electrical propulsion, or a combination of both.172 For example, a diesel or natural gas engine in combination with a battery ESS or a hydrogen fuel cell in combination with a battery like the CARB/Switch Maritime Seachange E-Ferry #1 demonstration project.173
1. Serial Hybrid Propulsion
Serial Hybrid Propulsion systems are similar to a diesel-electric propulsion system in that they do not have a mechanical connection between the diesel engine and the propeller shaft. Serial hybrid systems are capable of operating similar to an EEP system. However, a serial hybrid is a true hybrid design in that it will have a battery to provide a means of energy storage allowing for additional modes of operation like energy buffering and the ability to complete zero emission battery electric propulsion. An example of vessel energy buffering would be running a generator at full load to charge the battery and propel the vessel. Then, the generator could shut down to
172 Geertsma, et al., Design and Control of Hybrid Power and Propulsion Systems for Smart Ships: A Review of Developments, 2017, last accessed July 17, 2021, https://www.sciencedirect.com/science/article/pii/S0306261917301940. 173 Switch Maritime, Zero-Carbon Vessels, last accessed July 17, 2021, https://www.switchmaritime.com/.
power the vessel with the battery while maintaining vessel speed and power demands until the battery needs to be charged again. By cycling the engine on and off and running it at a higher load by making it charge the battery while propelling the vessel, the engine fuel efficiency is increased. This ability makes a serial hybrid quite versatile. However, if the vessel vocation requires full power demands of the vessel to be met by the electrical battery portion of the system alone, then the motors and battery must be sized accordingly and the larger battery, motors, and ancillary components are more expensive. For this reason, serial hybrid systems are often designed to meet the energy needs of vessels having a highly variable duty cycle and are designed to function efficiently when the vessel is operating in modes requiring lower power. For example, standby and low-speed transit modes may be able to draw sufficient power from the battery ESS while high speed transit or work modes may require main engine power or main engine power supplemented by battery power in a boost mode. Another disadvantage of serial hybrids is because there is no mechanical connection between the engines and propellers, there is no way to drive propellers if there is a failure of the switch gear, battery management system , variable speed generator, variable frequency driver, propeller shaft motor, or other electrical system component.
2. Parallel Hybrid Propulsion
Parallel hybrid propulsion systems maintain the mechanical connection between the engine and propeller. By utilizing a battery or another diesel-electric or diesel-hydrostatic drive system with an electric or hydraulic motor or PTI on the propeller shaft, the hybrid battery or diesel electric/hydrostatic system can either supplement main engine power or the main engines can be shut down and clutches opened to disconnect them from the propeller. When the main engines are shut down and de-clutched, the hybrid system can propel the vessel at low power demand to save fuel and reduce emissions, main engine operating hours, wear, and maintenance. A combination of battery energy storage or any number of smaller diesel electric generators can be utilized to operate the vessel in the lower end of its power demand. At high vessel power demand, the parallel hybrid system can run the main engines with the direct connection to the propeller shafts operating at a higher efficiency than a serial hybrid system. If extra power is required, the battery and all of the auxiliary generators can put full power in to the PTI to boost the main engines. To save space and weight the PTI motors can also function as generators which can be used to vary the load on the main engines to charge the batteries while under way at medium speeds. This increases main engine fuel efficiency. The hybrid drive system PTI components in a parallel hybrid system are not designed to meet full vessel power demand. They are designed to take over at low to medium vessel power demands and sometimes to boost the main engines. They are smaller and less costly than the electrical drive components found in serial hybrid or diesel-electric propulsion systems. Additionally, parallel hybrid systems maintain the mechanical engine to propeller connection with a clutch and the vessel may not be completely disabled by an electrical system component failure. As long as the main engines and clutches are functional, so is the vessel.
E-100
C. Zero-Emission: Lithium-Ion Battery ESSs
Zero-emission and hybrid technologies in marine applications often utilize lithium-ion battery technology for onboard energy storage. Installation plans for marine grade battery ESSs in inspected commercial harbor craft applications must be approved by the USCG MSC. Approved battery systems must be type classed by either the American Bureau of Shipping (ABS) or other international type classification societies including Lloyd’s Register, DNV-GL, Bureau Veritas, and RINA.174 Installing a type-approved battery ESS according to an MSC-approved installation plan ensures that safety requirements and vessel design standards will be met for safe operation with on-board battery ESSs. In October 2019, USCG released an engineering policy letter regarding the installation of lithium batteries, CG-ENG-02-19.175 This policy letter references Title 46, Code of Federal Regulations, Subchapter J and ASTM F3353-19, Standard Guide for Shipboard Use of Lithium-Ion Batteries. Figure E-32 below provides an overview of USCG requirements for lithium-ion batteries and vessel design considerations.176
174 RINA, Type Approval and MED, last accessed July 17, 2021, https://www.rina.org/en/type-approval-med. 175 USCG, U.S. Department of Homeland Security, Design Guidance for Lithium-Ion Battery Installations Onboard Commercial Vessels, October 2, 2019, last accessed July 17, 2021, https://www.dco.uscg.mil/Portals/9/DCO%20Documents/5p/5ps/Design%20and%20Engineering%20St andards/Systems%20Engineering%20Division/ENG%20Policy%20Ltr_02-19%20Li-Ion%20Battery%20Policy_Signed.pdf?ver=2019-10-10-073508-267. 176 Sandia National Laboratories, Feasibility Study of Replacing the R/V Robert Gordon Sproul with a Hybrid Vessel Employing Zero-Emission Propulsion Technology, September 2020, last accessed July 17, 2021, https://www.osti.gov/servlets/purl/1670517.
Testing Requirements - Battery design tests such as short circuit, impact and overcharging.
Operating Environment - Control and monitoring of the hipboard battery operating environment.
Fire afety - Mea ure to detect contain and mitigate emergency ituation through battery temperature monitoring, tructural fire protection, fire detection, and fire afi ty y tern
Battery y tern de ign - Battery Management y tern (BM ) requirement
Testing and maintenance - Te ting procedures for automation systems installed in vessel propulsion, ship service electrical or emergency power applications
System verification and maintenance -maintenance manual including actions to be taken in emergency situations
Design Considerations
Batteries should be type approved (D GL or similar) and have met all class te ting requirements.
Battery room should be entilated and air conditioned. HV AC y tern mu t b monitor d r mot ly by crew
Battery room hould be in ulated and equipp d with fir det ction and uppr ion. In ulation could be a combination of thermal and tructural fire protection.
Batterie hould ha e a B and b typ approved (D or imilar)
Batterie should be Type approved (D similar) and have met all class testing requirements.
Batteries should be Type approved (D similar) and have met all class testing requirements.
or
or
Figure E-32. Overview of USCG Lithium Battery Requirements177
Type-approved marine grade lithium-ion battery ESSs meet international standards for vibration and shock loading (for example, UNT 38.3, DNV 2.4, or IEC 60068-2-6),178
have provisions for external air or liquid cooling systems, and include passive integrated design safety features to prevent a potential thermal runaway condition in one cell from spreading to other cells. The battery design must contain internal channels between cells to conduct gas and smoke out of the battery to ventilation systems leading outside of the vessel and must insulate nearby series elements/cells from the heat generated by a thermal runaway. A battery management system (BMS) is employed to monitor battery series element cell heath, charge states, and to prevent overcharging or over-discharging cells, which can lead to internal cell damage, reduced battery life, or conductive dendritic growths across cell insulators that can over a period of time cause the cell cathode and anode to short together, potentially initiating a thermal runaway in that cell. In addition to warning the operator that there is a battery safety concern, the BMS can open a disconnect circuit to isolate a battery containing a series element that is overcharging, over-discharging, or overheating, and
177 Ibid. 178 Delserro Engineering Solutions, IEC 60068-2 Electronic Equipment & Product Standards, last accessed July 17, 2021, https://www.desolutions.com/testing-services/test-standards/iec-60068-2/.
Fully Electric Hybrid Backup Systems Hybrid Energy Efficiency Charging
Zero Emissions
UPS / Fault Spinning Load Peak Transient FaSt Energy Ride-Through Reserve Leveling Shaving Load Recharge Recapture
Management Stations
High Energy Demand
will typically include a ground fault detection system to disconnect the battery from vessel load circuits if a short to ground is detected.179
Lithium-ion batteries employ a wide range of different cell chemistries. Each chemistry has inherent advantages and disadvantages making it suitable for certain applications. Depending on the individual cell chemistry and the proprietary design configuration of individual cells into series elements and series elements into modules and modules into battery packs, the commonly utilized lithium-ion battery types will have favorable properties for either high energy density (both gravimetric and volumetric ratings) and storage capacity or high-power discharge and charging rates. The maximum charging/discharging rate for lithium-ion batteries is referred to as the C-rating. The battery C-rating refers to the amount of current required to charge/discharge the battery in one hour; or 1-C. For example, 2-C would be the amount of current to charge/discharge the battery in 30 minutes, 3-C in 20 minutes, etc. It is important to select the correct battery chemistry according to the particular vessel vocation and duty cycle power demands. Figure E-33 below provides some guidance on applicability of lithium-ion cell chemistry to different types of commercial vessel categories or industrial applications.
Figure E-33. Corvus Orca Energy Storage Density Versus Power Demand Spectrum180
179 Corvus Energy, Corvus Orca Energy, last accessed July 17, 2021, https://corvusenergy.com/products/corvus-orca-energy/. 180 Corvus Energy, Energy or Power – Corvus Energy Orca ESS Product Line Meets Both Differing Demands, July 31, 2017, last accessed July 17, 2021, https://corvusenergy.com/energy-or-power-corvus-energy-orca-ess-product-line-meets-both-differing-demands/.
Examples of lithium-ion cell chemistries utilized in marine applications include lithium nickel manganese cobalt (NMC), lithium iron phosphate (LFP)181, or lithium titanate oxide (LTO).182 NMC type battery cells have a nominal cell voltage of 3.7 V. Figure E-34 shows the characteristics of NMC lithium battery chemistry provide both relatively high energy storage density and high discharging and charging rates.
LFP type battery cells have a nominal cell voltage of 3.2 V. The characteristics of LFP battery chemistry is shown in Figure E-34 below to provide moderate energy storage density, but relatively high discharge/charging rates and a high number of life cycles compared to NMC batteries. LFP cell chemistry does not utilize cobalt or nickel lowering costs, provides a relatively high number of life cycles compared to NMC chemistry, and provides an additional safety factor due to inherent chemical and thermal stability and the lower nominal cell voltage. Figure E-34 below shows LFP batteries have lower gravimetric energy density (specific energy in Watt-hours per kg (Wh/kg)) compared to the other chemistries mentioned here.
LTO type battery cells have a nominal cell voltage of 2.4 V. The characteristics of this cell chemistry provide relatively low energy storage density compared to either NMC or LFP chemistries, but high discharge/charging rates for vessel categories requiring high power applications over shorter time durations. LTO cell chemistry provides a relatively high number of life cycles and long useful life183. Figure E-34 summarizes properties and characteristics for some common lithium-ion battery types.
181 Arumugam Manthiram, A Reflection on Lithium-Ion Battery Cathode Chemistry, 2020, last accessed July 17, 2021, https://www.nature.com/articles/s41467-020-15355-0.pdf. 182 Moorthi, MuMu, Lithium Titanate Batteries for High Rate and High Cycle Life Applications, last accessed July 17, 2021, https://neicorporation.com/white-papers/NEI_White_Paper_LTO.pdf. 183 Lightning Global, Lithium-Ion Battery Overview, May 2012, last accessed July 17, 2021, https://sun-connect-news.org/fileadmin/DATEIEN/Dateien/New/Issue10_Lithium-ionBattery_TechNote_final.pdf.
Optimized for Energy Energy or Power Power Cycle life Power
Operating voltage 2.5-4.2 2.5-4.2 2.5-4.2 1.5-2.8 2.0-3.6
range (rarely 4.35) (rarely 4.35) Nominal voltage 3.6-3.7 3.6-3.7' 1 3.7-3.8' 1 2.3 3.3 Specific energy 175-240 cyl
100-240 100-150 70 60-110 (Wh/kg) 130-200 polymer
Energy density (Wh/L) 400-640 cyl
250-640 250-350 120 125-250 250-450 polymer
Discharge rate 2-3C
2-3C >30C 10C 10-125C
(continuous) (power cells >30C)
Cycle life (100% DOD 500+ 500+ 500+ 4000+ 1000+
to 80% capacity)
Ambient temperature 0-45 0-45 0-45 -20-45 0-45
during charge (0 C) Ambient temperature
-20-60 -20-60 -30-60 -30-60 -30-60 during discharge (°C)
Figure E-34. Lithium-Ion Battery Overview184
D. Zero-Emission: Hydrogen Fuel Cell Technologies
1. Fundamentals of Hydrogen Fuel Cell Technology
Hydrogen fuel cells react diatomic hydrogen molecules and the diatomic oxygen molecules in atmospheric air inducing a flow of direct current electricity while producing heat and water electrochemically.185 In a similar manner to a battery, fuel cells utilize an anode and cathode with an electrolyte in between to allow movement of ions. Fuel cells can utilize a wide range of anode, cathode, and electrolyte types depending on the intended fuel and the type of electrochemistry utilized to induce a usable direct current flow that can be harnessed to supply electrical power. The hydrogen fuel cell technology most often utilized in transportation or commercial harbor craft propulsion applications is the polymer electrolyte membrane fuel cell (PEMFC), often shortened to proton exchange membrane (PEM). Compared to other fuel cell technologies, the PEM design provides a relatively high gravimetric power density and a relatively low operating temperature (~60-80 °C). PEM fuel cells have performance characteristics of quick start up capability short transient response times for the power and load changes expected to be encountered in a transportation application such as a commercial harbor craft propulsion system.186
184 ibid. 185 Florida Solar Energy Center, Hydrogen Basics – Fuel Cells, last accessed July 17, 2021, http://www.fsec.ucf.edu/en/consumer/hydrogen/basics/fuelcells.htm. 186 Hydrogen Europe, Fuel Cells, last accessed March 3, 2021, https://hydrogeneurope.eu/fuel-cells.
Hydn)gen gas from M<p,nllneflowfNtl:I find• I PI-YI> c:e lywtloyor
GH
Elearic Cifcu~ (•0% - 60% efficier,cy)
.. e .
Oxygen gas (from air) input
~ H 1(8S •C)
Oxygen cathode
Ox)98ngnfrom air.., aetpintine -lllldft-•i,elhwll ID catalyst layer
y or water lrotnCII Mlay
Figure E-35. PEM Fuel Cell Operation187
Figure E-35 above shows a simplified and basic functioning mechanism for a generic PEM fuel cell utilizing hydrogen gas and atmospheric oxygen for fuel. On the left side pure, filtered, and humidified diatomic hydrogen gas is fed into a chamber where it passes through field flow plates and is then exposed to one side of the catalyzed anode consisting of carbon nanoparticles coated with platinum nanoparticles. The oxidation reaction occurring at the anode strips two electrons from each diatomic hydrogen gas molecule forming two hydrogen ions or positively charged protons. The electrolyte in a PEM fuel cell consists of a proprietary coated polymer that conducts positively charged protons through to the catalyzed carbon-platinum nanoparticle cathode where the protons are reduced in a reaction with atmospheric oxygen molecules and the electrons returning from the load circuit to form water and heat in an exothermic reaction. The PEM electrolyte material may utilize Dupont Nafion, a polytetrafluoroethylene polymer backbone coated with perfluorinated-vinyl-polyether
187 National Institute of Standards and Technology, PEM Fuel Cells, last accessed July 17, 2021, https://physics.nist.gov/MajResFac/NIF/pemFuelCells.html.
side chains containing sulphonic acid end groups.188 Hydrogen fuel cells utilize a pair of catalyzed reduction and oxidation reactions seen below in Figure E-36.
Figure E-36. Theoretical Hydrogen Fuel Cell Reaction Voltage Potential189
The theoretical voltage potential for each fuel cell element is 1.23 V. In practice, the operating voltage at higher current loads is reduced to 0.6-0.7 V. See Figure E-37 showing reduction in operating voltage potential as current density approaches 1 amp/cm2 of membrane surface area.
Figure E-37. Hydrogen Fuel Cell Voltage Drop with Current Density Increase190
To produce usable power, individual fuel cell membranes are stacked in many layers and connected in a series circuit to form series elements or stacks with increased operating voltage potential to meet the requirements of the electrical load. To generate greater current flow and power, multiple stacks may be connected in parallel to form a fuel cell module that is typically housed inside a cabinet structure having provisions for external load connections, air or liquid cooling system connections, an intake port and blower for atmospheric air, along with control and monitoring system
188 Science Direct, Nafion, last accessed March 3, 2021, https://www.sciencedirect.com/topics/engineering/nafion. 189 Shapley, Fuel Cells, last accessed July 17, 2021, http://butane.chem.uiuc.edu/pshapley/Environmental/L11/2.html. 190 Ibid.
connections. One example of an existing commercialized type-approved marine hydrogen fuel cell module is Ballard Power System’s FCwave, a 200-kW modular PEM system as shown in Figure E-38.
The function hydrogen fuel cells perform in CHC propulsion systems can be compared to that of a battery in that fuel cells also produce power via usable current of electrons. Rather than storing chemical potential energy inside like a battery, hydrogen fuel cells produce electricity from two separate external fuel sources; the chemical potential energy stored in hydrogen fuel in external fuel tanks and the oxygen from atmospheric air that are both reacted inside the fuel cell to produce usable electricity on demand. Hydrogen fuel cells can be augmented with a battery ESS to assist with vessel transient peak power demands. The hydrogen fuel cell power rating and the battery ESS capacity can be combined in varying ratios to suit a number
191 Ballard, Marine Modules, last accessed July 17, 2021, https://www.ballard.com/fuel-cell-solutions/fuel-cell-power-products/marine-modules.
of different CHC categories.192 Electrical power from hydrogen fuel cells can be utilized to power electric propulsion systems, provide auxiliary power, charge on-board battery ESSs, and power vessel house loads when underway or at berth in locations where no shore power is available for cold ironing.
Hydrogen fuel cell marine applications are an emerging technology and the USCG requirements and design standards for all commercial harbor craft regulatory classes have yet to be established. CARB funded a technology demonstration project for a hydrogen fuel cell ferry vessel, the Switch Maritime Seachange. Since the beginning of the design phase of this zero-emission commercial passenger vessel project, the owners, Switch Maritime193, along with project partners, ship builders, component venders, and systems integrators have all worked closely with USCG Sector Seattle and the USCG MSC in Washington D.C. to establish hydrogen safety requirements and design standards. The vessel is a zero-emission hybrid design utilizing propulsion and hotel power from a combination of hydrogen fuel cells and a lithium-ion battery ESS. The hydrogen fuel cells consume hydrogen and produce electricity to power the vessel’s electric propulsion motors, the vessel hotel load, and to charge the lithium-ion battery ESS if grid electricity cannot be utilized between trips. As a zero-emission hybrid vessel, Seachange will be able to operate on either hydrogen fuel or on electricity stored in the battery ESS. The vessel regulatory class is a 70-foot, 84-passenger Subchapter-T catamaran passenger ferry constructed from a marine grade aluminum, with 264 kg of compressed hydrogen gas capacity stored at 350 bar, two 300-kW electric propulsion motors, and two 50-kWh battery ESSs.194
After initial sea trials in Washington State, the vessel is scheduled to transit to San Francisco Bay in Q2 2021 to begin a demonstration period where it will undergo fuel cell and propulsion system data logging initially operating without passengers. The vessel will receive a final certificate of inspection (COI) from USCG after the demonstration in order to operate commercially with passengers.
192 Ballard, Fuel Cell Applications for Marine Vessels- Why Fuel Cells Make Sense, March 2019, last accessed July 17, 2021, https://www.ballard.com/docs/default-source/default-document-library/marine-informational-paper-final.pdf?sfvrsn=c1cec080_2#:~:text=Fuel%20cells%20operating%20on%20hydrogen,water%20vapor% 20and%20some%20heat. 193 Switch Maritime, Zero-Carbon Vessels, last accessed July 17, 2021, https://www.switchmaritime.com/. 194 Golden Gate Zero Emission Marine, Water-Go-Round Project, last accessed July 17, 2021, https://watergoround.com/.
Table E-28 lists examples of commercial harbor craft vessels and technology demonstration projects under construction utilizing ZEAT, including full zero-emission, zero-emission capable hybrid technologies, or EEP system configurations.
Plug-in Hybrid diesel electric propulsion; lithium-ion battery ESS; zero emission capable.
Switch Sea Change196
Passenger Ferry (Subchapter T)
Switch Maritime
San Francisco, California
Zero emission hybrid utilizing hydrogen fuel cells, lithium-ion ESS, and electric propulsion.
Carolyn Dorothy197
Ship Assist Tractor Tugboat (Subchapter M)
Foss Maritime
Portland, Oregon
Plug-in Hybrid diesel-electromechanical propulsion, Lead acid battery ESS
Delta Teresa198
Ship Escort Tractor Tugboat (Subchapter M)
Baydelta Maritime
Port of Los Angeles, California
Enhanced efficiency propulsion; diesel- electromechanical propulsion with diesel-electric power take-in system
Hornblower Hybrid199
Passenger Ferry (Subchapter K)
Alcatraz Cruises
San Francisco, California
Zero emission capable diesel-electric propulsion with lithium-ion battery energy storage, wind turbines, solar panels
Alcatraz Clipper200
Passenger Ferry (Subchapter K)
Alcatraz Cruises
San Francisco, California
Zero emission capable diesel-electric propulsion with lithium-ion battery energy storage, wind turbines, solar panels
Alcatraz Flyer201
Passenger Ferry (Subchapter K)
Alcatraz Cruises
San Francisco, California
Zero emission capable diesel-electric propulsion with lithium-ion battery energy storage, wind turbines, solar panels
195 Professional Mariner, 2019 Ship of the Year: Enhydra, November 5, 2018, last accessed July 17, 2021, https://www.professionalmariner.com/2019-ship-of-the-year-enhydra/. 196 Switch Maritime, Zero-Carbon Vessels, last accessed July 17, 2021, https://www.switchmaritime.com/. 197 Maritime Journal, Foss Unveils Carolyn Dorothy, last accessed July 17, 2021, https://www.maritimejournal.com/news101/tugs,-towing-and-salvage/foss_unveils_carolyn_dorothy. 198 Professional Mariner, Baydelta Brings Next-Gen Hybrid to the Bay Area, July 1, 2019, last accessed July 17, 2021, https://www.professionalmariner.com/baydelta-brings-next-gen-hybrid-to-the-bay-area/. 199 Hornblower Cruises & Events, The Hornblower Hybrid is a Model of Alternative Energy Innovation, last accessed July 17, 2021, https://www.alcatrazcruises.com/wp-content/uploads/2020/03/hybrid-vessel-release.pdf. 200 Ibid. 201 Ibid.
Enhanced efficiency propulsion; diesel-mechanical propulsion with diesel-hydrostatic power take-in system (Caterpillar Advanced Variable Drive)
2. Evaluation of Future Expanded Zero-Emission Operations in Marine Harbor Craft Applications
A 2016 Sandia National Laboratory feasibility study, Feasibility of the Bay-Breeze: A Zero Emission, Hydrogen Fuel Cell, High-Speed Passenger Ferry, compared feasibility of battery electric propulsion versus hydrogen fuel cell propulsion in high-speed long-distance (routes over 20 nautical miles) ferry applications.207 A section in this study completed a hypothetical analysis employing a best-case battery-electric propulsion system scenario with regard to system weight and gravimetric power density by specifying an on-road lithium-ion battery ESS utilizing battery packs from a modern light-duty passenger car.
It is important to note that these on-road battery packs are not commercially available separate from the vehicles and more importantly, they are not marine grade or type-classed for use in CHCs by American Bureau of Shipping or DNV-GL. However, the light-duty vehicle batteries were selected by Sandia because of their relatively light weight and high gravimetric energy density compared to other marine-grade lithium-
202 Nicholson, Gilbert, Gee’s Bend Has the Nation’s First Electric Ferry, February 15, 2019, last accessed July 17, 2021, https://alabamanewscenter.com/2019/02/15/gees-bend-has-the-nations-first-electric-ferry/. 203 Haun, Eric, Marine News’ Top Boats of 2020: James V. Glynn and Nikola Tesla, December 30, 2020, last accessed July 17, 2021, https://www.marinelink.com/news/marine-news-top-boats-james-v-glynn-484229. 204 Ibid. 205 The Explorer, The World’s First Electric Car and Passenger Ferry, last accessed July 17, 2021, https://www.theexplorer.no/solutions/ampere--the-worlds-first-electric-car-and-passenger-ferry/. 206 Coastal & Inland Waterways, Cat and Sanmar to Present Latest Hybrid Concept at Tugnology ’19, March 18, 2019, last accessed July 17, 2021, https://www.workboat.com/coastal-inland-waterways/cat-and-sanmar-to-present-latest-hybrid-concept. 207 Sandia National Laboratories, Feasibility of the SF-Breeze: a Zero Emission, Hydrogen Fuel Cell, High-Speed Passenger Ferry, September 2016, last accessed July 17, 2021, https://www.ebdg.com/wp-ebdg-content/uploads/2016/10/SF-BREEZE-SAND2016-9719.pdf.
ion battery types solely for the comparison with a hypothetical complete hydrogen fuel cell propulsion system with 1200 kg of liquid hydrogen storage capacity. In addition, a marine grade type-approved lithium battery ESS would add weight due to design requirements for a dedicated battery compartment, internal battery thermal runaway protection and insulation, internal battery and battery compartment ventilation systems, battery monitoring systems, and fire suppression equipment. The hypothetical analyses in the comparison revealed the complete hydrogen fuel cell propulsion system at an average fuel cell operating efficiency of 53 percent could deliver 76,294 MJ of usable energy with a total system weight of 44,547 kg for a total available gravimetric energy density of 76,294 MJ/44,547 kg = 1.71 MJ/kg. The study stated most lithium-ion battery ESSs are designed to cycle the battery charge state by 50 percent to avoid storage capacity deterioration or damage from deep-discharge states; however, the study assumed the batteries would be cycled by 80 percent of energy storage capacity to further reduce the size and weight of the battery ESS. At 80 percent capacity cycling, the battery system would have an energy storage capacity of 76,294 MJ/0.8 = 95,367.5 MJ. The study estimated each light-duty vehicle battery pack to weigh 540 kg and have the capacity to store 306 MJ of energy. To have a total system capacity of 95,367.5 MJ would require 312 vehicle batteries, which at 540 kg each, weighs approximately 168,480 kg. Therefore, the available gravimetric energy density of the light-duty vehicle batteries would be 95,367.5 MJ/168,480 kg = 0.566 MJ/kg, or roughly one-third the energy density available from the hydrogen fuel cell system.
Additionally, reducing the battery system energy storage capacity cycling to the more commonly used 50 percent in order to reduce the rate of battery ESS capacity deterioration over time in order to obtain a longer and more economically sound battery ESS life would require 499 light-duty vehicle batteries. 499 light-duty vehicle batteries would provide approximately 152,588 MJ of energy storage capacity, and would weigh approximately 269,273 kg. Note that this hypothetical analysis for the proposed Bay Breeze vessel project was intended for a Subchapter-T catamaran high-speed ferry designed to carry up to 149 passengers. High-speed passenger ferries are one of the CHC sectors facing the greatest feasibility challenges with added weight causing stability concerns, reduced passenger carrying capacity, and fuel efficiency reductions related to changes in vessel sea-handling/trim characteristics from added weight. It is not feasible to carry either 168,480 kg or 269,273 kg of batteries on a Subchapter-T high speed (V=3.7 x disp0.1667 where “disp” is displacement corresponding to the design waterline in cubic meters) catamaran ferry. 208 For example, if a Subchapter-T high speed vessel carried 149 passengers at 180 lbs. each, the total passenger load would be 26,820 lbs. (12,190 kg) and the total hypothetical weight of the light duty on-road batteries at 269,273 kg batteries / 12,190 kg of
208 46 CFR Subchapter T – Small Passenger Vessels (Under 100 Gross Tons), last accessed July 17, 2021, https://www.govinfo.gov/content/pkg/CFR-2012-title46-vol7/pdf/CFR-2012-title46-vol7-chapI-subchapT.pdf.
passengers = 22.1 times the weight of a full load of passengers and the weight of the batteries would far exceed the displacement tonnage of a Subchapter-T high-speed catamaran vessel.
Table E-29 below summarizes the relative volumetric and gravimetric energy density ratios of a hydrogen fuel cell ESS, marine-grade battery electric ESS, and a conventional diesel fuel system. This comparison includes all ancillary equipment necessary to store or produce deliverable energy in the form of electricity for the hydrogen fuel cell and battery ESSs but does not include the mass of a hypothetical electric propulsion system that would be required to produce usable power with the electricity produced from the fuel cells or batteries. Likewise, the diesel fuel ESS is assumed to consist of a quantity of diesel fuel with equivalent deliverable energy content (as a combustible fuel) to the other two systems at an assumed diesel engine thermal efficiency of 35 percent with no added weight for a diesel storage tank since most are integrated into vessel hull structures and no added weight for a diesel propulsion engine because the analysis of the other two systems stopped at deliverable stored chemical energy, and did not include the weight for electric propulsion components. It is important to note that both the hydrogen fuel cell and the battery ESS systems would likely require power inverters and variable frequency drivers (VFDs) along with other control system components to produce usable electricity for a vessel house load and propulsion motors. However, since no electric motors, inverters, VFDs, or other motor controls are specified in the Bay Breeze Study, the added weights of these ancillary components were left out of this hypothetical comparison. The diesel fuel in this comparison is assumed to have 135.5 MJ lower heating value (LHV) of energy content per U.S. gallon, which is then compared to a type-approved marine-grade Corvus Orca battery ESS,209 and to the deliverable energy content of the 1200 kg hydrogen storage capacity fuel cell system proposed in the Bay Breeze Study discussed above (see Reference 207).
209 Corvus Energy, Corvus Orca Energy, last accessed July 17, 2021, https://corvusenergy.com/products/corvus-orca-energy/.
Table E-29. Comparison of Proposed Sandia Bay-Breeze Study Hydrogen Fuel Cell System and Corvus Orca Battery ESS Relative to Conventional CARB Diesel When Evaluated for Deliverable
Energy Content
Energy Storage System (ESS)
Stored Energy Content
(LHV)
Deliverable Energyc ESS Mass (kg)
ESS Volume
(m3)
Volumetric Energy Density
Relative to Diesel Fuel
System
Gravimetric Energy Density
Relative to Diesel Fuel
1200 kg Liquid
Hydrogena
143,952 MJ
(39,986 kW-hr)
76,294 MJ (21,193 kW-
hr) 44,547 96.37 1:16 1:8.7
Corvus Orcab
Lithium-Ion Battery
ESS
152,588 MJ
(42,386 kW-hr)
76,294 MJ (21,193 kW-
hr) 556,487 489 1:81 1:109
Diesel Fuel
217,983 MJ
(60,551 kW-hr)
76,294 MJ (21,193 kW-
hr) 5,117d 6.06 1:1 1:1
a) Based on 2016 Sandia Bay-Breeze Feasibility Study proposed design with storage capacity for 1200 kg of liquid hydrogen. b) Corvus Orca Vertical Pack, 124 kW-hr, 1,628 kg/pack, dimensions: 2,241 mm x 865 mm x 738 mm (1.43 m3) c) Assuming 53 percent average fuel cell efficiency, design for typical 50 percent battery ESS stored charge use, 35 percent diesel engine average thermal efficiency, and a diesel fuel lower heating value of 42.6 MJ/kg210 d) Assuming diesel fuel LHV of 36.0 MJ/liter211
A Bloomberg article published on July 3, 2021, revealed that marine battery ESS technology has progressed from 12 kg/kW-hr to the current level of attaining approximately 8 kg/kW-hr and is looking to reach 6 kg/kW-hr in the near future. 212
According to the article, at 8 kg/kW-hr, low-speed (15 knots) battery electric ferries in Norwegian Fjords are able to operate on routes as long as 40 nautical miles. However, Norwegian ferry captains’ “rekkeviddeangst” or “range anxiety” remains a real fear on longer electric ferry routes where one new vessel, Rygerelektra, operating on a 40 nautical mile route typically has 85 percent charge at the beginning of a trip and only 15 percent remaining charge at the end of its route. The article states that while battery-electric passenger and vehicle ferries are operating in many fjords along the West Coast of Norway, virtually all of Norway’s long distance high-speed passenger
210 Engineering Toolbox, Fuels – Higher and Lower Calorific Values, last accessed July 22, 2021, https://www.engineeringtoolbox.com/fuels-higher-calorific-values-d_169.html. 211 Ibid. 212 Leigh, Gabriel, Travel Norway’s Fjords on a Quiet Electric Ferry, July 2, 2021, last accessed July 17, 2021, https://www.bloomberg.com/news/articles/2021-07-03/travel-norway-s-fjords-on-a-quiet-electric-ferry.
ferries, the kind that traverse the sea between large coastal cities, still run-on diesel. The article states that Norwegian coastal charging infrastructure and insufficient electrical grid capacity in remote locations are emerging as a serious potential issue standing in the way of all-electric transport well beyond shipping.
CARB staff recognizes that in a similar manner to the long-distance Norwegian ferry routes between large coastal cities, many of the passenger ferries operating in RCW service routes over relatively long distances running at high-speed to meet posted scheduling requirements. With the current state of marine battery energy storage technology and an eye on the development of hydrogen fuel cell marine technology, CARB staff recognizes that diesel engine ferries will still be required to service long distance high-speed ferry routes in RCW for the foreseeable future. Therefore, the Proposed Amendments would mandate that all short-run ferries transition to zero-emission by 2026, where analyses have demonstrated feasibility for electrification on ferry routes under 3 nautical miles with the current state of marine grade battery energy storage technology. There may be opportunities for ferry routes with slightly longer routes and other single vessel operations to adopt zero-emission technologies. To leverage these opportunities and maximize the adoption of zero-emission technology into the off-road and marine sector by 2035, the Proposed Amendments establish the ZEAT credit as an incentivize for ZEAT technology to be used as a compliance pathway under an alternative control of Emissions (ACE) plan. For more details on these alternative pathways that incentivize and encourage the use of ZEAT, refer to Chapters III and IV of the ISOR for the Proposed Amendments.
E-115
VIII. Infrastructure to Support Shore Power and ZEAT
This section will briefly discuss the infrastructure needs for vessels to adopt ZEAT and Shore Power required by the Proposed Amendments. Each of these will be discussed separately in the following sections.
A. Shore Power
For the purpose of this assessment, staff defines shore power infrastructure as the equipment at the dock needed to provide shore power to vessels. Equipment at the docks may include connectors, transformers, and frequency converters. CARB staff expects the incremental shore power demand to be relatively small to existing demand, thus staff does not expect additional upstream grid infrastructure to be required to meet the additional shore power requirements. However, additional on-site infrastructure may be required for the fraction of vessels that will comply with shore power.
1. Overview of Current Industry Practices
Shore power is widely used by the CHC sector. CARB staff conducted a survey in January 2018 and found that about 74 percent of vessels use shore power.213 To conduct the analysis on shore power requirements, CARB staff assumed that half of the vessels currently without shore power capabilities (or 13 percent of all vessels) will comply by not operating auxiliary engines at dock, and the other half will comply by installing additional shore power infrastructure. Use of shore power in CHC applications have been ongoing for several decades. However, some vessels continue to operate diesel engines when docked and on-board power is needed. The key reasons for using shore power in CHC applications are cost savings and emissions reductions from reduced fuel use. Shore power also results in less engine wear and reduced maintenance costs. Shore power use also results in less noise when vessels are at dock. That said, diesel engines are still used to supplement shore power when and where existing shore power capacity is not adequate.
2. Summary of Existing Marinas and Ports with Shore Power in California
There are over 250 marinas and ports in California that currently provide power to docked vessels. Table E-30 lists current power, voltage, and amperage supplied at a select few docks.
213 California Air Resources Board, 2019 Commercial Harbor Craft Survey, February 28, 2019
E-116
Table E-30. List of Various Marinas and Ports with Shore Power Connections
Location Power per Vessel (kW) Voltage Amperage Typical Vessel Categories
Del Rey Landing214 12.5-96 125/480 3-phase
100-200 Vessels up to 328’
San Diego Tugboat Service Project215 6.7-11.5
120/208 3-phase
833 Barges and Tugs
Grand Marina216 3.75-11.0 125/220 30-50 Vessels between 30’ to 53’ Driftwood Marina217 3.6 120 30 Vessels between 18’ to 50’
Emeryville Marina218 6.6-11.0 220 30-50 Excursion, Ferry, and Fishing vessels between 25’ to 60’
Huntington Harbor Marina219 3.3-6.6 110 30-50 Vessels up to 75’ Brisbane Marina220 3.3-11.0 110/220 30-50 Vessels from 10’ to 120’ Benicia Marina221 3.6-6.0 120 30-50 Vessels from 25’ to 75’
With the exception of the San Diego Tugboat Services Project, the power, voltage, and amperage values that Table E-30 shows are per vessel. That is, a single vessel can utilize the listed values. Connections at the dock can be made using different types of connectors and equipment.
3. Case Study: Pacific Tugboat Service Project in San Diego
The Pacific Tugboat Service project developed shore power for vessels to cold-iron, or plug into grid-based power, while at berth in San Diego. The project was funded through a Carl Moyer grant through the San Diego Air Pollution Control District (SDAPCD). The total cost of the program for supplying shore side and ship side power was $204,317 and provided 15 docks with the capability of supplying shore side power to different vessels. The project took about a year to complete.
The development of shore power infrastructure is heavily influenced by the location where it is installed. For this project, the process involved trenching and backfilling the land to lay underground conduit power lines under an adjacent parking lot. The conduit lines provided power from San Diego Gas and Electric (SDG&E). An existing
214 Marina Del Rey Landing, last accessed July 17, 2021, https://www.delreylanding.com/marina. 215 San Diego Air Pollution Control District, Tugboat Service Project, 2012. 216 Grand Marina, General Info – Grand Marina, last accessed July 17, 2021, https://www.grandmarina.com/general-info/. 217 Driftwood Marina, About – Driftwood Marina, last accessed July 17, 2021, http://www.driftwoodmarina.com/about/. 218 Emeryville Marina, Safe Harbor Emeryville – Emeryville Marina, last accessed July 17, 2021, https://shmarinas.com/locations/safe-harbor-emeryville/. 219 Huntington Harbor Marina, Technical Details – Huntington Harbor, last accessed July 17, 2021, http://www.huntingtonharbourmarina.com/technical-details. 220 Brisbane Marina, Berth Information – Brisbane Marina, last accessed July 17, 2021, https://www.brisbaneca.org/marina/page/berth-information. 221 Benicia Marina, Benicia Marina, Welcome to Benicia Marina, last accessed July 17, 2021, https://beniciamarina.net/.
switchgear was removed in order to install the transformer and junction box. Conduit connections were made underneath the pier at the seawall/parking lot confluence. A separate electrical panel and meter was added specifically dedicated to cold-iron pedestals at the pier. Shore power is supplied by two transformers, a primary transformer supplying 3-phase power at 480 V at 351 A, and a secondary transformer that is supplying 3-phase power at 208/120 V at 833 A. The primary power of a transformer in most cases must be stepped down to match the voltage onboard the vessels. The secondary power is the outgoing power provided to the vessel, which must match the voltage the vessel can receive. In total, 15 cold-iron pedestals were added at the dock. Figure E-39 shows an aerial view of the final result below.
Figure E-39. Aerial photo of Tugboat Services Project
The 15 charging stations are labeled by symbols as indicated in the legend.222
B. Charging and Fueling Infrastructure
For the purpose of this assessment, CARB staff defines ZEAT infrastructure to include electric charging and hydrogen fueling infrastructure. CARB staff anticipates that, in some cases, deploying ZEAT will require additional upstream infrastructure development from California utility providers, as well as investment by end users to install on-site equipment. This equipment includes chargers, cables (both manual and
222 San Diego Air Pollution Control District, Tugboat Service Project, 2012.
E-118
automatic), and anything else related to providing the power to charge on-vessel batteries.
Hydrogen infrastructure for commercial harbor craft is still in its nascent phase. Hydrogen is not widely available at ports and marinas as a transportation fuel and developing a reliable and economically viable hydrogen infrastructure will be essential if more vessels are to rely on hydrogen as a fuel for CHCs.
1. Overview of Existing Charging and Fueling Infrastructure
Charging infrastructure consists of equipment such as connectors, plug standards, and charging units. Hydrogen fueling infrastructure consist of equipment such as about storage tanks, valves, and hoses. For charging infrastructure, connectors are necessary for providing power to and from the vessel charging units. Different plug standards provide a safe and reliable way to supply power from the vessel charging unit to the vessel. The charging unit itself brings in the power to be supplied to the vessel. The charging unit typically allows for a range of voltages and amperages, allowing the vessel to charge at different levels of power. The charging unit may also be able to supply power to multiple vessels. CARB will continue to monitor the state of connection standards in the CHC sector. Currently, however, the present state of connection standards is nascent, so CARB is not currently proposing connection standards for CHC. Figure E-40 shows an example of a connector that is used to bring power to the charging unit, the Stäubli Single Pole Round Connectors.223
223 Stäubli, Single Pole Round Connectors, December 2019, last accessed July 17, 2021, https://ec.staubli.com/AcroFiles/Catalogues/IS_PL-Main-Insulated-10-21mm-11013982_(en)_hi.pdf.
Figure E-40: Stäubli Single Pole Round Connectors224
Figure E-40 shows the Stäubli Single Pole Round Connectors with a 10 mm diameter which can be used to make connections to a transformer. These connectors range from 10 mm to 21 mm in diameter and can withstand up to 1000 Volts at 1000 Amps, with a max power rating of 1 MW. They are often also insulated and made waterproof for improved safety.
There are designs currently being used in other freight activities which can be adapted to provide electricity to vessels deploying ZEAT. Figure E-41 shows the automatic quick charge connector (QCC), which is a connector that adheres to the SAE J3015 plug standard, is typically used to provide electricity for EV buses and trucks,225 but has been adapted for use in the CHC sector.
The QCC is a connector that allows for automatic connection for rapid charging for buses and trucks, but can also used for boats, ferries, and other vehicles. Since no human interaction is required, the QCC has several safety features including misalignment compensation to safely plug the connector into the vehicles port, complete touch protection, and low contact resistance. The connector can sustain 1500 V at either 350 A or 800 A, providing a total power of 535 kW or 1200 kW. The connector adheres to the SAE J3105 plug standards protocol for automatic connections for heavy duty vehicles. Safety features for the QCC include IP2X Touch protection, and IP55 water ingress protection.227 IP2X protects against approach by fingers, which will protect anyone making contact with the device. IP55 water ingress protects against dust and water,228 making it ideal for marine applications. Systems such as this one by Stäubli are used by vessels in Denmark to provide zero emission ferry services.229
Figure E-42 shows the Multipole Connector for Harsh Environments,230 which is another configuration that could be used in CHC applications.
226 Ibid. 227 Ibid. 228 DSM&T, IP Rating Chart, last accessed July 17, 2021, https://www.dsmt.com/resources/ip-rating-chart/. 229 Damen, Damen Delivers Five Zero Emissions Propulsion Ferries To Arriva In Copenhagen, July 6, 2020, last accessed July 17, 2021, https://www.damen.com/en/news/2020/07/damen_delivers_five_zero_emissions_propulsion_ferries_to_ arriva_in_copenhagen. 230 Stäubli, Multipole Connector for Harsh Environments, November 2019, last accessed July 17, 2021, https://www.staubli.com/en-us/file/26720.show.
Figure E-42. Stäubli Multipole Connector for Harsh Environments231
The Multipole Connector for Harsh Environments provides up to 1000 V for applications in several harsh environments, such as the railway and marine sector. It was designed to withstand strong temperature fluctuations, high mechanical strain, vibration, and contamination, including sea water. When mated, it conforms to the IP65 and IP69 safety protection protocols232, which includes protection against dust and low-pressure jets of water. The manufacturer does not specify the communication protocol that is used for this cable; however, this connector can also be custom designed based on each operator’s specific needs.
Plug standards allow for uniformity across different charging units and manufacturers so they can utilize the same charging connectors. There are a few plug standards in existence that can be utilized in the commercial harbor craft sector. One such example is the SAE J3105 configuration.233 The SAE J3105 is a standards protocol for heavy duty charging applications, such as Stäubli’s QCC. As with the QCC, the SAE J3105 was designed for the EV bus and truck sector, however, it has applications in the marine sector. Level 2 charging allows for 1000 V at 1200 A, for 1.2 MW of charging power. A control pilot and wireless communication is used to communicate between the vehicle and the charging system for seamless and safe delivery.
231 Ibid. 232 The Enclosure Company, What is an IP Rating?, last accessed July 17, 2021, https://www.enclosurecompany.com/ip-ratings-explained.php. 233 Electric Power Research Institute, SAE J-3105TM Heavy-Duty Conductive Automatic Charging Recommended Practice, March 10, 2021, last accessed July 17, 2021, https://assets.ctfassets.net/ucu418cgcnau/1Ktt4o78uHGFrzVB7p7BjK/416abbf7851dd964c1663ab69c0 82bcc/05_SAE_J3105_Review_Kosowski.pdf.
Another example of a plug standard is the CharIN Megawatt Charging System (MCS).234 The CharIN MCS is a charging unit that has a single conductive plug that looking to provide a max of 1500 V at 3000 A, allowing for up to 4.5 MW of charging power. The MCS is being developed for the on-road medium and heavy-duty sectors, but also has many applications in the bus, aviation, and marine sector. The plug standard has the capability for the cable assembly to connect with other existing standards and allows for manual and automatic connections to the charger. The plug of the MCS adheres to the UL 2251 standard for plugs, receptacles, and couplers.235
Different types of charging units can be used to supply constant power to the dock. A prominent example of this is the charging infrastructure and technology produced by Cavotec. Cavotec designed an automatic charging infrastructure called the Automatic Plug-in System (APS). 236, 237, 238 Figure E-43a shows Cavotec’s APS and Figure E-43b Cavotec’s MoorMaster stationed at a dock and connected to a vessel.
Figure E-43a Cavotec Automatic Plug-in System and MoorMaster Stationed at a Dock
234 CharIN, Megawatt Charging System (MCS), last accessed July 17, 2021, https://www.charin.global/technology/mcs/. 235 Underwriters Laboratory Inc, Plug, Receptacles, and Couplers for Electric Vehicles, August 21, 2009, last accessed August 5, 2021, https://www.lib.must.edu.tw/TCT/UL%202251-2009.pdf. 236 Cavotec, APS, last accessed July 17, 2021, https://www.cavotec.com/en/your-applications/ports-maritime/crane-electrification/e-rtg/product-aps. 237 Cavotec, Electric Vessels, last accessed July 17, 2021, https://www.cavotec.com/en/your-applications/ports-maritime/automated-mooring/electric-vessels. 238 Cavotec, E-Charging, last accessed July 17, 2021, https://www.cavotec.com/en/your-applications/ports-maritime/e-charging.
Figure E-43b APS and MoorMaster Connected to a Vessel239
Combining the APS with the MoorMaster has allowed Cavotec to design an automated system that can plug a ferry into the inductive charging dock without the need for human interaction or direct conductive electrical connection. Figure E-44 shows the Cavotec MoorMaster device.240
Figure E-44. MoorMaster Mooring Device
Note the arrows that indicate what direction the device and its components can move241
239 Cavotec, Electric Vessels, last accessed July 17, 2021, https://www.cavotec.com/en/your-applications/ports-maritime/automated-mooring/electric-vessels. 240 Cavotec, Automated Mooring, last accessed July 17, 2021, https://www.cavotec.com/en/your-applications/ports-maritime/automated-mooring. 241 Ibid.
Cavotec’s MoorMaster device allows for automatic mooring of different vessel types, such as passenger ferries and roll-on/roll-off ferries. The device includes a vacuum pad that can safely attach itself to the hull of the vessel. Multiple mooring devices can be attached and aligned to pull in larger vessels, if necessary. The MoorMaster can attach to the vessel within 30 seconds utilizing hydraulic actuators. Hydraulic actuators are mechanical systems that use fluid to produce mechanical operations, which in this case, moves a vessel closer to the dock in order to attach the APS to the vessel. These systems are prominently used in Scandinavian countries, such as Norway and Denmark, but may find uses in California by ports and operators who wish to use an automatic system that requires less human interaction.
2. Zero--Emission Ferry Case Study: Gee’s Bend Ferry
A recent example of the successful development of charging infrastructure for ferry service is the Gee’s Bend Ferry service in Alabama. The Ferry is owned by the Alabama Department of Transportation and operated by HMS Ferries. The Gee’s Bend Ferry four diesel engines were replaced with a battery propulsion system, which includes two 135 kWh batteries. Figure E-45 shows the Gee’s Bend Ferry.
Figure E-45. Gee's Bend Ferry Transiting Through the Alabama River242
242 HMS Global Maritime, Gee’s Bend Ferry Battery Conversion, June 7, 2019, last accessed July 17, 2021, http://allianceverte.org/wp-content/uploads//2019/06/4-TimAguirre.pdf.
Two shore charging infrastructure units were installed for the ferry, one at each dock. Each charger allows for up to 350 A at 480 V, or up to 168 kW of power available for charging. The ferry runs up to 10 runs per day, and it takes 30 minutes to dock, undock, and to recharge. Each run is about 2.9 nautical miles (3.33 miles), with a one-way trip of 1.45 nautical miles (1.67 miles). To reduce power consumption, the ferry runs at a reduced speed of 5 to 8 knots (5.8 to 9.2 miles per hour). A full charge takes about 20-25 minutes.
Because the necessary electric infrastructure was not installed at the docks prior to the conversion, it was necessary to coordinate with local power and utility companies to provide the necessary power needed to the docks. Also, the project required coordinating with nearby property owners to provide power lines to the dock. The dock power infrastructure includes an overhanging wire connector that plugs into the ferry when it docks. This allows for a quick and easily accessible connection that can fully charge the vessel. Additionally, it was essential to coordinate with USCG to adapt to the necessary safety regulations for battery and charging equipment. Figure E-46 shows the dock charger available for the Gee’s Bend Ferry.
Figure E-46. Gee's Bend Ferry Dock Charging Station243
3. Analysis of Current Short-run Ferry Operations
In the Proposed Amendments, short-run ferries are defined as vessel(s) dedicated to provide regularly scheduled round-trip ferry service between two points that are less than 3 nautical miles apart, and the definition provides allowances for circular routes to include some legs running longer than 3 nm. There are currently 16 ferries operating in
243 Ibid.
E-126
RCW that have been identified as meeting the definition of a short-run ferry in the Proposed Amendments, which are listed in Table E-31.
Table E-31. Current Short-Run Ferries Operating in California
Ferry Operator Location Real McCoy II Caltrans Rio Vista J-Mack Ferry Caltrans Rio Vista Islander Ferry Alcatraz Cruises San Francisco Hornblower Hybrid Alcatraz Cruises San Francisco Alcatraz Flyer Alcatraz Cruises San Francisco Alcatraz Clipper Alcatraz Cruises San Francisco Angel Island Angel Island Tiburon Ferry Company San Francisco Admiral Balboa Island Ferry Newport Beach Captain Balboa Island Ferry Newport Beach Commodore Balboa Island Ferry Newport Beach Cabrillo Flagship Cruises San Diego Silvergate Flagship Cruises San Diego Aquabus I Long Beach Transit Long Beach Aquabus II Long Beach Transit Long Beach Aqualink I Long Beach Transit Long Beach Aqualink II Long Beach Transit Long Beach
The 16 ferries run various short-run routes, with 12 of the various running a point A to point B route, and 4 of the ferries running a circular route. The 4 ferries operated by Long Beach Transit, the Aquabus I, Aquabus II, Aqualink I, and Aqualink II run circular routes with multiple stops.
CARB staff analyzed the battery ESS capacity requirements and shore-side charging power requirements needed for each of the vessels. The vessels with the largest energy demand, most frequent trip runs, and the vessels that share common infrastructure were examined. Vessels requiring smaller routes are able to use current existing electric drivetrain options produced by manufacturers such as Torqeedo. Torqeedo produces electric vessel motors and equipment for ferries, water taxis, and other commercial uses244 that would have applicability in the main engine power subcategories and vocational duty cycles of some of the smaller short-run ferries, such as the Admiral, Captain, and Commodore, which transit distances of less than 1,500 feet.
CARB staff analyzed the routes and engine data of each ferry to estimate the propulsion motor power and battery ESS capacity requirements and the requisite levels of shore power necessary to charge the battery ESS in the time interval at dock between trips. Table E-32 shows the summary of the analysis.
244 Torqeedo, Torqeedo for Commercial Applications, last accessed July 17, 2021, https://www.torqeedo.com/us/en-us/dealers/commercial-use.html.
Table E-32. Analysis of Battery and Shore Power Infrastructure Power Requirements for Short-Run Ferry Operations in California
Ferry Name Work Required for 1 Roundtrip (kWh)
Battery Capacity (kWh)
Charging Infrastructure Requirement (kW)
Real McCoy II 117 235 133
J-Mack Ferry 22 44 25
Islander Ferry 194 388 324
Hornblower Hybrid 162 323 269
Alcatraz Flyer 183 366 305
Alcatraz Clipper 183 366 305
Angel Island 175 349 175
Admiral 23 46 30
Captain 23 46 30
Commodore 23 46 30
Cabrillo 190 380 228
Silvergate 63 126 105
Aquabus I 28 56 168
Aquabus II 28 56 168
Aqualink I 284 569 853
Aqualink II 284 569 853
CARB staff calculated the work required for one roundtrip for each short run ferry. This was done by using estimated load factors of 0.34 and 0.44 for the main and auxiliary engines, respectively. Using the load factors, CARB staff used data supplied by the short-run ferry operators and measured and calculated data to find the work required for one roundtrip. The run times were calculated from website schedules and confirmed by operators. Distances were also measured using web mapping tools such as Google Maps. The engine data, including number of engines and horsepower, was pulled from CARB’s CHC Reporting Database, which has data supplied by CHC operators. Staff assumed that the required charging would need to occur within the time window the vessel stays at the dock. With the work required for one roundtrip calculated, staff estimates that it would take approximately two times the work required to correctly size the battery needed for each vessel. This was done to conform with the battery industry standard of allowing a 50 percent battery ESS storage capacity cycling per roundtrip. Using this, staff estimated the required charging infrastructure power needed to support each vessel. The estimated charging power ranges from 25 kW to 853 kW, with a median of 171 kW. Note that the battery energy storage capacities shown here are calculated to reflect shore power infrastructure requirements for the purpose of assessing electric infrastructure needs to support a battery-electric zero-emission vessel. CARB staff acknowledges that the weight and space required for ZEAT power systems, whether battery-electric or hydrogen fuel cell electric, may require new vessel designs that could change required on-board energy storage needs. Therefore, the actual battery capacities or charging infrastructure needs may vary from the values calculated and presented in Table E-32.
E-128
Staff expects the charging infrastructure needs to vary between each route depending on the energy needs, battery capacity, and the route configuration. Vessels with larger energy demands will require different infrastructure design than vessels with smaller designs to meet their higher power needs. Route configuration is also important. For example, ferries with multi-route stops can recharge more frequently per trip and thus reduce the required battery size on the vessel. For example, while the Aqualink I and Aqualink II have the largest energy demands of all the short-run ferries, their circular routes may allow them to charge multiple times per trip. On the other hand, there are ferries that are larger or may only charge at one location on its route. ABB, a zero-emission vessel infrastructure and battery ESS designer and integrator245, has also designed batteries and infrastructure that can work on the larger ferries. The two Caltrans ferries, the Real McCoy II and J-Mack, complete more frequent trip runs than the other short-run vessels, and operate 24 hours/day. Thus, the infrastructure must be able to deliver power consistently to these vessels with limited time periods for charging.
245 ABB, Electric, Digital and Connected Solutions for the Marine Industry, last accessed July 17, 2021, https://new.abb.com/marine/.