APPENDIX F 2014 TEXAS STATEWIDE COMMERCIAL MARINE VESSEL EMISSIONS INVENTORY AND 2008 THROUGH 2040 TREND INVENTORIES Emissions Inventory State Implementation Plan Revision for the 2015 Eight-Hour Ozone National Ambient Air Quality Standard Project Number 2019-111-SIP-NR Adoption June 10, 2020
Transcript
APPENDIX F
2014 TEXAS STATEWIDE COMMERCIAL MARINE VESSEL EMISSIONS INVENTORY AND 2008 THROUGH 2040 TREND INVENTORIES
Emissions Inventory State Implementation Plan Revision for the 2015 Eight-Hour Ozone
National Ambient Air Quality Standard
Project Number 2019-111-SIP-NR
Adoption June 10, 2020
2014 Texas Statewide Commercial Marine Vessel Emissions Inventory and 2008 through 2040 Trend Inventories
FINAL
Prepared for:
Texas Commission on Environmental Quality
Air Quality Division
Prepared by:
Eastern Research Group, Inc.
August 26, 2015
ERG No. 0345.00.001.002
2014 Texas Statewide Commercial Marine Vessel Emissions Inventory and 2008 through 2040
Trend Inventories
TCEQ Contract No. 582-15-50416 Work Order No. 582-15-51493-01 FY: 2015-10
Prepared for:
Cody McLain Texas Commission on Environmental Quality
Appendix A. CMV 2008 to 2040 Control Programs .................................................... A-1
ii
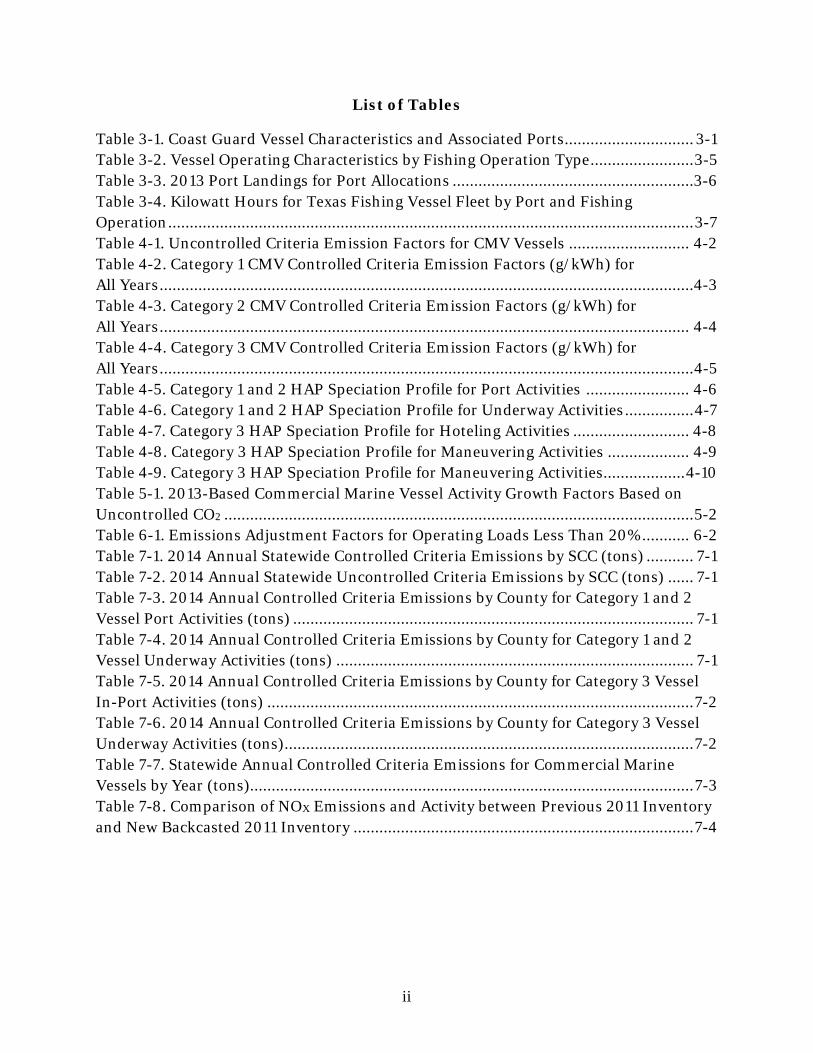
List of Tables
Table 3-1. Coast Guard Vessel Characteristics and Associated Ports .............................. 3-1 Table 3-2. Vessel Operating Characteristics by Fishing Operation Type ........................ 3-5 Table 3-3. 2013 Port Landings for Port Allocations ........................................................3-6 Table 3-4. Kilowatt Hours for Texas Fishing Vessel Fleet by Port and Fishing Operation .......................................................................................................................... 3-7 Table 4-1. Uncontrolled Criteria Emission Factors for CMV Vessels ............................ 4-2 Table 4-2. Category 1 CMV Controlled Criteria Emission Factors (g/kWh) for All Years ............................................................................................................................4-3 Table 4-3. Category 2 CMV Controlled Criteria Emission Factors (g/kWh) for All Years ........................................................................................................................... 4-4 Table 4-4. Category 3 CMV Controlled Criteria Emission Factors (g/kWh) for All Years ............................................................................................................................ 4-5 Table 4-5. Category 1 and 2 HAP Speciation Profile for Port Activities ........................ 4-6 Table 4-6. Category 1 and 2 HAP Speciation Profile for Underway Activities ................ 4-7 Table 4-7. Category 3 HAP Speciation Profile for Hoteling Activities ........................... 4-8 Table 4-8. Category 3 HAP Speciation Profile for Maneuvering Activities ................... 4-9 Table 4-9. Category 3 HAP Speciation Profile for Maneuvering Activities................... 4-10 Table 5-1. 2013-Based Commercial Marine Vessel Activity Growth Factors Based on Uncontrolled CO2 ............................................................................................................. 5-2 Table 6-1. Emissions Adjustment Factors for Operating Loads Less Than 20% ........... 6-2 Table 7-1. 2014 Annual Statewide Controlled Criteria Emissions by SCC (tons) ........... 7-1 Table 7-2. 2014 Annual Statewide Uncontrolled Criteria Emissions by SCC (tons) ...... 7-1 Table 7-3. 2014 Annual Controlled Criteria Emissions by County for Category 1 and 2 Vessel Port Activities (tons) ............................................................................................. 7-1 Table 7-4. 2014 Annual Controlled Criteria Emissions by County for Category 1 and 2 Vessel Underway Activities (tons) ................................................................................... 7-1 Table 7-5. 2014 Annual Controlled Criteria Emissions by County for Category 3 Vessel In-Port Activities (tons) ................................................................................................... 7-2 Table 7-6. 2014 Annual Controlled Criteria Emissions by County for Category 3 Vessel Underway Activities (tons) ............................................................................................... 7-2 Table 7-7. Statewide Annual Controlled Criteria Emissions for Commercial Marine Vessels by Year (tons)....................................................................................................... 7-3 Table 7-8. Comparison of NOX Emissions and Activity between Previous 2011 Inventory and New Backcasted 2011 Inventory ............................................................................... 7-4
1-1
1.0 Introduction
The objective of this Texas Commission on Environmental Quality (TCEQ) project is to develop the 2014 Air Emissions Reporting Requirements (AERR) commercial marine vessel (CMV) emissions inventory (EI) for actual annual and average summer weekday emissions as well as 2008 through 2040 CMV statewide actual annual and average summer weekday trend emission inventories. Data developed was for all criteria pollutants, ozone precursors, and hazardous air pollutants (HAPs). During project development, activity data for 2014 were not available. Therefore, Eastern Research Group, Inc. (ERG) obtained activity data from 2013 as this represented the most recent available data at the time the project began. ERG collected activity data for calendar year 2013 and used the data to develop actual and ozone season weekday emission inventories for CMVs using updated emissions and activity-based projection factors all coastal counties in Texas. ERG developed trend emissions inventory data for both controlled and uncontrolled criteria emissions for years 2008 to 2040.
The Texas CMV Emissions Inventory includes Category 1, 2, and 3 vessel activity and emissions by waterway for the entire state. Texas state waters extend 9 nautical miles (nm) from the coast into the Gulf of Mexico and include all waterways that extend inland, such as the upper reaches of the Houston Ship Channel. As such, this inventory examined activities in the following counties: Aransas, Brazoria, Calhoun, Cameron, Chambers, Galveston, Hardin, Harris, Jackson, Jasper, Jefferson, Kenedy, Kleberg, Liberty, Matagorda, Newton, Nueces, Orange, Refugio, San Patricio, Victoria, and Willacy.
The EPA marine category is divided into three groups based on engine cylinder displacement; Category 1 engines have a per cylinder displacement less than 5 liters, Category 2 engines have a per cylinder displacement greater than or equal to 5 liters and less than 30 liters, and Category 3 vessels have a per cylinder displacement greater than or equal to 30 liters. Category 1 and Category 2 marine diesel engines typically range in size from about 500 to 8,000 kW (700 to 11,000 hp). These engines are used to provide propulsion power on many kinds of vessels including tugboats, pushboats, supply vessels, fishing vessels, and other commercial vessels in and around ports. They are also used as stand-alone generators for auxiliary electrical power on many larger vessels. Category 3 marine diesel engines typically range in size from 2,500 to 70,000 kW (3,000 to 100,000 hp). These are very large marine diesel engines that run on residual fuel blends and are used for propulsion power on large ocean-going vessels such as container ships, oil tankers, bulk carriers, and cruise ships. The following sections describe the inventory approach, including initial collection of local data, emission calculations, and spatial allocations used to develop the CMV emissions inventory.
2-1
2.0 Data Collection
2.1 PortVision Automatic Identification System (AIS) Data
As a first step in data collection, ERG obtained Automatic Identification System (AIS) activity data for commercial marine vessels from PortVision. PortVision, a service of AIRSIS, Inc., is one of the largest international providers of satellite and terrestrial AIS data. AIS transponders serve as GPS units that report vessel location, speed, and other information every 2 seconds to nearby receivers and are available on most marine vessels due to increasing regulations and decreasing cost. AIS signals cover activities both in port as well as in state, federal, and international waters, providing a more complete picture of each vessel’s activity. While there are a number of vessel activity data sources available, many publicly available datasets are highly aggregated and include only vessel origins and destinations (or entrances and clearances) with no indication of how the distance was traversed. Hours of operation using these datasets can only be crudely estimated based on an estimate of vessel speed and the length of the shortest route between the origin and destination.
In contrast, AIS data provide individual vessel identification information along with both geographic location and time stamps, allowing for spatially and temporally accurate vessel routes. Using these data enables one to map individual trips for each vessel to calculate actual hours of operation resulting in a more refined estimate of CMV activity.
As AIS data is primarily geared toward traffic control and accident avoidance, it is not ideally formatted for use in inventory efforts. The dataset ERG obtained from PortVision for this effort includes observations every 15 minutes for every vessel in the area of interest during 2013 (31,841,919 unique observations associated with 9,584 vessels) to provide a comprehensive picture of vessel movement and to reduce potential data gaps.
2.2 Other Vessel Activity Data
AIS data, while far more comprehensive than in the past, may not capture all CMVs within the study area. In particular, smaller vessels that are not required to carry AIS transponders may not be well represented in the dataset. ERG identified three categories of vessels which may not be accurately represented in AIS: military, dredging, and commercial fishing vessels. The following sections describe the additional data sources that ERG used to complement, gap-fill, or replace AIS data where needed.
2.2.1 Government Vessels
The Department of Homeland Security limits the ability to collect activity data and estimate emissions. In the Gulf of Mexico, military vessel activity is implemented by the
2-2
U.S. Navy and the U.S. Coast Guard. ERG assumed that Navy vessel activities in Texas state waters were relatively few, since the last Navy base located in Texas was closed in 2006 and most military vessel exercises occur in federal waters.
ERG obtained information about Coast Guard vessels operating in Texas waters using fleet profiles obtained from their websites (USCG, 2014).
2.2.2 Dredging Activity
ERG obtained information concerning dredging operations occurring in Texas state waters from the U.S. Army Corps of Engineers Dredging Activity Database (USACE, 2014).
2.2.3 Commercial Fishing Activity
Commercial fishing activities can be difficult to estimate since fishing vessels tend to consider the locations of their fishing spots confidential business information. ERG estimated commercial fishing activity based on the following data sources. ERG obtained: fish landings from the National Marine Fisheries Service (NMFS, 2015), fishing vessel counts from the National Transportation Safety Board (NTSB, 2010), fishing vessel activity assumptions (Wells 2012) and values of fish landing from the Texas Parks and Wildlife (TPW, 2014). Using these four datasets, ERG estimated and spatially allocated commercial fishing activity.
2.3 Vessel Characteristics Data
In addition to activity data, emission calculations require information about the vessels themselves, particularly the engine category (derived from the cylinder displacement) and its kilowatt (kW) rating to determine which subset of emission factors to use. The kilowatt rating is multiplied by the hours of operation to estimate the kilowatt-hours (kWh), which can then be multiplied by the kWh-based emission factors. These data elements are available in the Information Handling Services (IHS) Vessel Database, which were purchased for use in this project.
3-1
3.0 Local Activity Data Processing
3.1 PortVision AIS
The AIS data file received from PortVision included 31,841,919 unique observations, in 15 minute intervals, associated with 9,584 vessels, provided in monthly files. Data were examined in their raw monthly format as both a QA check as well as to determine if there was significant seasonality between months. In terms of vessel observations, each month represented between 7.7 % to 8.8% of the total annual activity. The average was 8.3% with a standard deviation of 0.36%. The average summer month activity was 8.6%. This analysis indicated that the data files were complete and that commercial marine vessel traffic within the Gulf does not have a significant seasonal variation.
To obtain activity data that could be used for annual and daily estimates, data processing steps included consolidating monthly data files into a single dataset in Structured Query Language (SQL) Server and organizing the dataset by vessel and time stamp. ERG performed a quality assurance review of the records and removed records that could not be used, including the following:
• 12 records with no date; • 11 records with an invalid Maritime Mobile Service Identity (MMSI); and • 2,564 vessels had a single observation in the year, which is insufficient for
routing. ERG mapped the points in a geographic information system (GIS) and removed 2,523,130 records that plotted more than one nautical mile outside of Texas state waters. ERG selected a buffer distance of one nautical mile to ensure all vessel movements near the edge of the nine-mile state waters area were included. This method aimed to capture data points just outside of the area of interest in order to represent the movements as vessels enter and exit state waters.
Summary statistics performed on the AIS data in SQL server indicated that 72.8 percent of the records were associated with vessel speeds less than 0.2 knots. Discussions with PortVision clarified that speeds of 0.2 knots or less could indicate vessels maintaining position or otherwise not moving. As a result, ERG consolidated consecutive records with vessel speeds of less than or equal to 0.2 knots by averaging the coordinates and speeds to reduce the record count. These processing steps reduced the size of the dataset to 5,667,338 records.
3.1.1 Vessel Characteristics
The AIS data contain identifying information including International Maritime Organization (IMO) number, Maritime Mobile Service Identity (MMSI), vessel name,
3-2
and vessel type. ERG used these identifiers to match individual vessels to their characteristics in the IHS Vessel Database (IHS 2014). The best method to match vessels is by matching IMO numbers between the two datasets; however, the IMO number is not fully populated in AIS data. As a result, ERG conducted additional rounds of matching using vessel names, call signs, and vessel type to match as many vessels as possible to their detailed vessel characteristics and to validate matches made by IMO number.
Ultimately, ERG successfully matched 4,152 vessels of the 6,301 vessels (66% matched) to the IHS database to obtain kW ratings and maximum speeds. IHS data, while comprehensive, may not have fully populated engine characteristics. For vessels that matched to IHS but did not have kilowatt rating or maximum speed data, ERG calculated average values (excluding zeros) by vessel type and category. For vessels that lacked a category, ERG used the vessel type to assign a category, and average kW rating and maximum speeds were gap-filled based on the type and category.
Vessels that could still not be matched, for example, because they were lacking IMO number, vessel type, and vessel category, were considered most likely to be Category 2 vessels that do not travel internationally and do not require IMO identification, but have invested in AIS technology. Note that vessels equipped with Category 3 engines have a very high match rate as they tend to include IMO or MMSI codes and smaller Category 1 vessels are less likely to participate in the AIS. Therefore vessels that could not be matched, because they were lacking both vessel type and category, were considered to be Category 2 vessels. This assumption may potentially result in an overestimation of emissions as there are a few Category 1 vessels in the AIS dataset. ERG developed average values for Category 2 vessels to gap-fill engine data for the 2,155 vessels that could not be matched to detailed vessel characteristics or were missing data by averaging the kW and maximum speed data values for the 253 Category 2 vessels present in the Texas IHS data. Outliers were accounted for and removed before averaging. The resulting average values were 3,201 for engine kW rating and 12.68478 knots for maximum speed.
3.1.2 Load Factors
Previous inventories, including the 2011 TCEQ CMV inventory, used default load factors in estimating emissions. This is a common practice and has been the established practice for the TCEQ and the EPA for previous CMV emissions inventories.
Vessels tend to operate at an optimal and consistent load while cruising, but their engine loads can vary significantly while they are transiting reduced speed zones or shifting in a port area. AIS data include actual vessel speed, which ERG used in conjunction with the maximum vessel speed as provided in the IHS data to accurately calculate engine load using the Propeller law:
3-3
LF = (AS/MS)3
Where:
LF = Load factor AS = Actual vessel speed MS = Maximum vessel speed
After linking the vessels to the IHS database, ERG calculated load factors using the maximum vessel speed and the observed (actual) vessel speed for individual route segments. In some cases, however, the actual speed reported in AIS data exceeded the maximum speed reported in IHS data. In these cases, the actual speed was set equal to the maximum speed and their load factors, which exceeded 1.0, were replaced by averages derived from IHS data by vessel type. Load factors under 20% were rounded to the nearest percent for later processing as described in Section 6 to account for low load emissions.
3.1.3 Auxiliary Engines
Data on auxiliary engines were obtained for all Category 3 vessels from the IHS data. Category 1 and 2 vessels are smaller and as such tend not to have auxiliary engines or turn their engines off while dockside, so no gap-filling of Category 2 and 3 auxiliary engines was necessary.
3.1.4 Kilowatt-hour Calculations and Data Quality Checks
With kW ratings, maximum speeds, and loading factors fully populated, the kilowatt hours (kWh) were calculated as follows:
A = MCR x LF x H
Where:
A = Vessel activity in kWh MCR = Maximum continuous rated engine power, kW LF = Load factor H = Hours of operation
Activity for propulsion engines were calculated using the kW rating of the main engines for all records with an AIS-reported speed over ground greater than 0.2 knots. For Category 3 vessels, all records indicating movement were considered underway activities. For Category 1 and 2 vessels, the activity associated with speeds over 0.2 knots was split between port and underway Source Category Code (SCCs) to account for hoteling (operations while stationary at dock). 11.75% of the activity was considered
3-4
hoteling while the remaining 88.25% was considered underway as identified in a previous Category 2 Census Report from the EPA (U.S. EPA, 2007). Activity in the reduced speed zone (RSZ) was calculated using the kW rating of the auxiliary engines for all Category 3 vessels with a recorded speed greater than 0.2 knots. Hoteling activity was calculated using the kW rating of the auxiliary engines for all Category 3 AIS observations where the speed was less than or equal to 0.2 knots.
3.2 Government Vessels
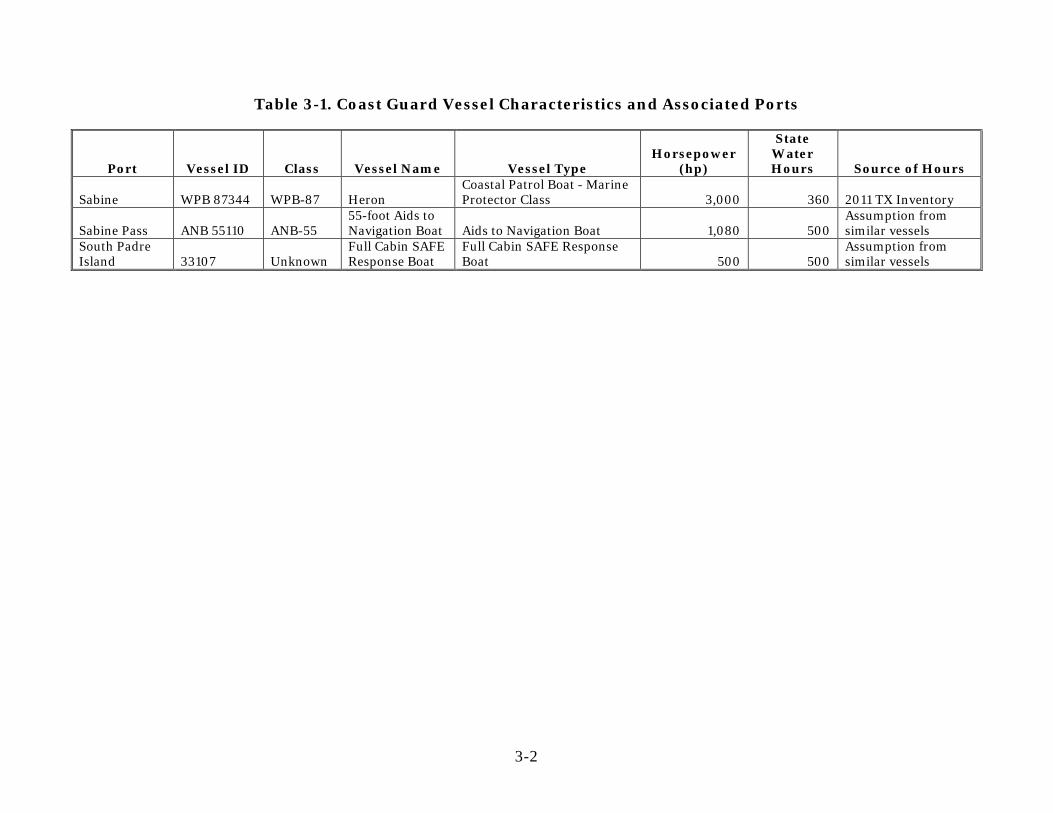
Table 3-1 shows information ERG obtained about Coast Guard vessels operating in Texas waters using fleet profiles obtained from their websites and from direct communication with Coast Guard staff in 2011 (USCG, 2014). ERG obtained the list of vessels in 2015 from the Coast Guard, but was not able to contact anyone at the Coast Guard to obtain or confirm activity information at this time. Therefore, ERG used the original assumptions which are listed in Table 3-1 from the 2011 inventory as surrogates. For the eight new vessels that were not included in the 2011 inventory, ERG assigned activity hours to these vessels to be consistent with other similar Coast Guard Classes. For example navigational aid boats were assumed to have annual operating hours less than larger vessels involved in inland construction and lighter faster medium response boats were assumed to be used slightly more often than larger coastal patrol boats.
The Coast Guard’s Eighth District is responsible for safety and security of the full length of the Mississippi River, as well as the Gulf of Mexico (Peschke, 2015). In Texas, the District operates 21 vessels, as listed in Table 3.1.
3-1
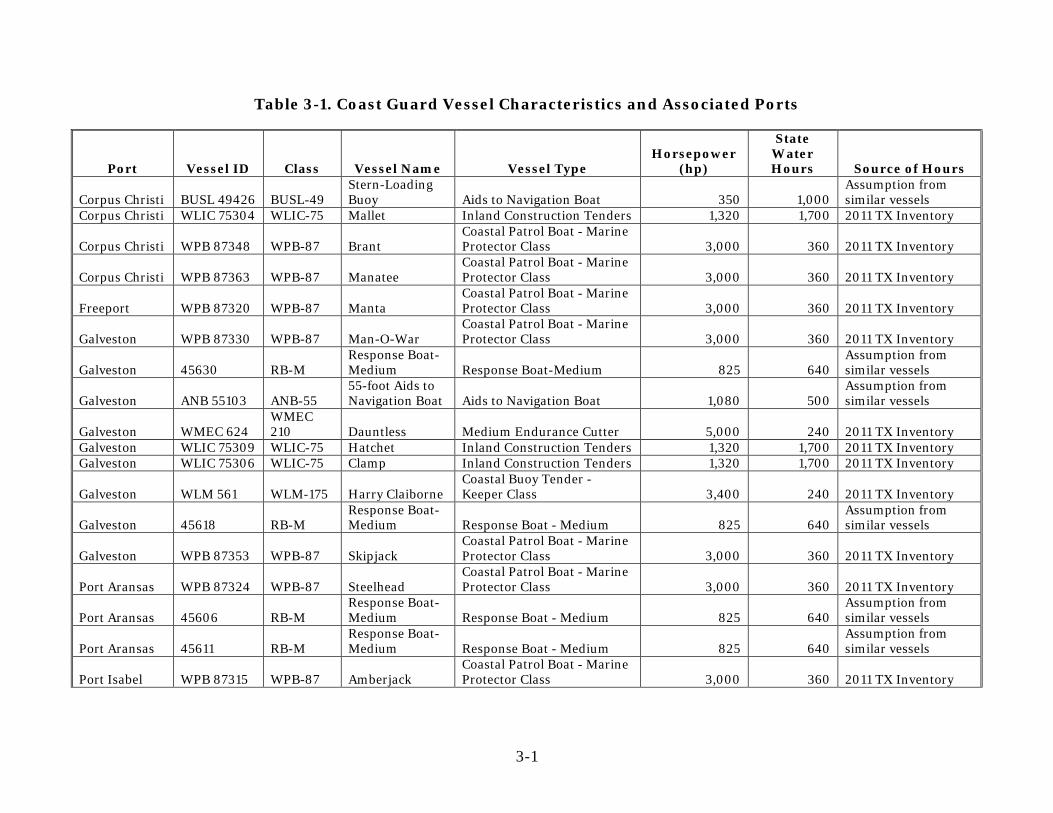
Table 3-1. Coast Guard Vessel Characteristics and Associated Ports
Port Vessel ID Class Vessel Name Vessel Type Horsepower
(hp)
State Water Hours Source of Hours
Corpus Christi BUSL 49426 BUSL-49 Stern-Loading Buoy Aids to Navigation Boat 350 1,000
Assumption from similar vessels
Corpus Christi WLIC 75304 WLIC-75 Mallet Inland Construction Tenders 1,320 1,700 2011 TX Inventory
Corpus Christi WPB 87348 WPB-87 Brant Coastal Patrol Boat - Marine Protector Class 3,000 360 2011 TX Inventory
Corpus Christi WPB 87363 WPB-87 Manatee Coastal Patrol Boat - Marine Protector Class 3,000 360 2011 TX Inventory
Sabine Pass ANB 55110 ANB-55 55-foot Aids to Navigation Boat Aids to Navigation Boat 1,080 500
Assumption from similar vessels
South Padre Island 33107 Unknown
Full Cabin SAFE Response Boat
Full Cabin SAFE Response Boat 500 500
Assumption from similar vessels
3-1
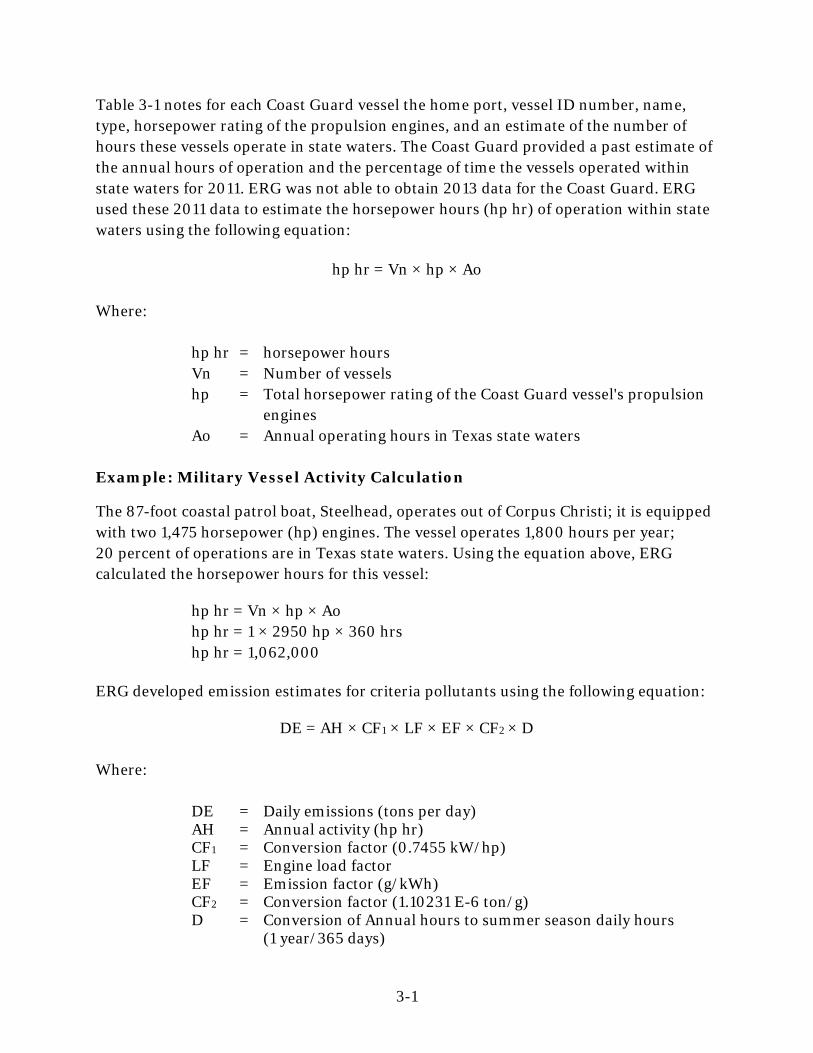
Table 3-1 notes for each Coast Guard vessel the home port, vessel ID number, name, type, horsepower rating of the propulsion engines, and an estimate of the number of hours these vessels operate in state waters. The Coast Guard provided a past estimate of the annual hours of operation and the percentage of time the vessels operated within state waters for 2011. ERG was not able to obtain 2013 data for the Coast Guard. ERG used these 2011 data to estimate the horsepower hours (hp hr) of operation within state waters using the following equation:
hp hr = Vn × hp × Ao Where:
hp hr = horsepower hours Vn = Number of vessels hp = Total horsepower rating of the Coast Guard vessel's propulsion engines Ao = Annual operating hours in Texas state waters
Example: Military Vessel Activity Calculation
The 87-foot coastal patrol boat, Steelhead, operates out of Corpus Christi; it is equipped with two 1,475 horsepower (hp) engines. The vessel operates 1,800 hours per year; 20 percent of operations are in Texas state waters. Using the equation above, ERG calculated the horsepower hours for this vessel:
hp hr = Vn × hp × Ao hp hr = 1 × 2950 hp × 360 hrs hp hr = 1,062,000
ERG developed emission estimates for criteria pollutants using the following equation:
DE = AH × CF1 × LF × EF × CF2 × D Where:
DE = Daily emissions (tons per day) AH = Annual activity (hp hr) CF1 = Conversion factor (0.7455 kW/hp) LF = Engine load factor EF = Emission factor (g/kWh) CF2 = Conversion factor (1.10231 E-6 ton/g) D = Conversion of Annual hours to summer season daily hours (1 year/365 days)
3-2
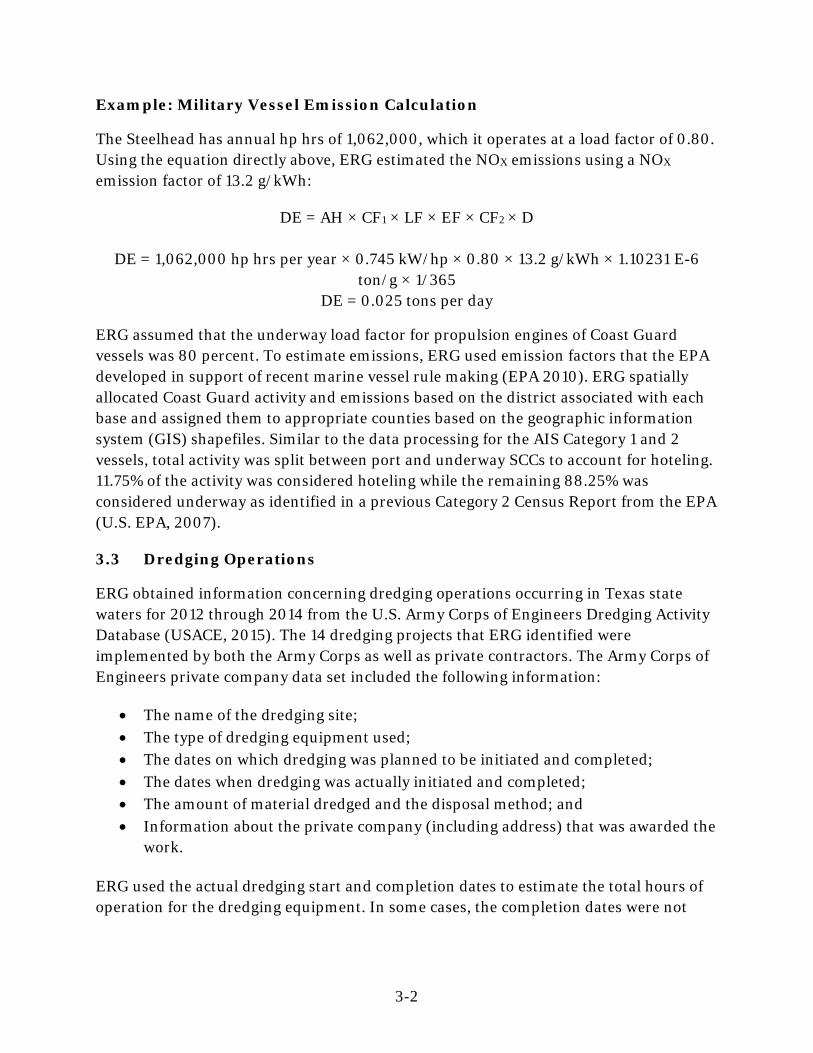
Example: Military Vessel Emission Calculation
The Steelhead has annual hp hrs of 1,062,000, which it operates at a load factor of 0.80. Using the equation directly above, ERG estimated the NOX emissions using a NOX
emission factor of 13.2 g/kWh:
DE = AH × CF1 × LF × EF × CF2 × D
DE = 1,062,000 hp hrs per year × 0.745 kW/hp × 0.80 × 13.2 g/kWh × 1.10231 E-6 ton/g × 1/365
DE = 0.025 tons per day
ERG assumed that the underway load factor for propulsion engines of Coast Guard vessels was 80 percent. To estimate emissions, ERG used emission factors that the EPA developed in support of recent marine vessel rule making (EPA 2010). ERG spatially allocated Coast Guard activity and emissions based on the district associated with each base and assigned them to appropriate counties based on the geographic information system (GIS) shapefiles. Similar to the data processing for the AIS Category 1 and 2 vessels, total activity was split between port and underway SCCs to account for hoteling. 11.75% of the activity was considered hoteling while the remaining 88.25% was considered underway as identified in a previous Category 2 Census Report from the EPA (U.S. EPA, 2007).
3.3 Dredging Operations
ERG obtained information concerning dredging operations occurring in Texas state waters for 2012 through 2014 from the U.S. Army Corps of Engineers Dredging Activity Database (USACE, 2015). The 14 dredging projects that ERG identified were implemented by both the Army Corps as well as private contractors. The Army Corps of Engineers private company data set included the following information:
• The name of the dredging site; • The type of dredging equipment used; • The dates on which dredging was planned to be initiated and completed; • The dates when dredging was actually initiated and completed; • The amount of material dredged and the disposal method; and • Information about the private company (including address) that was awarded the
work. ERG used the actual dredging start and completion dates to estimate the total hours of operation for the dredging equipment. In some cases, the completion dates were not
3-3
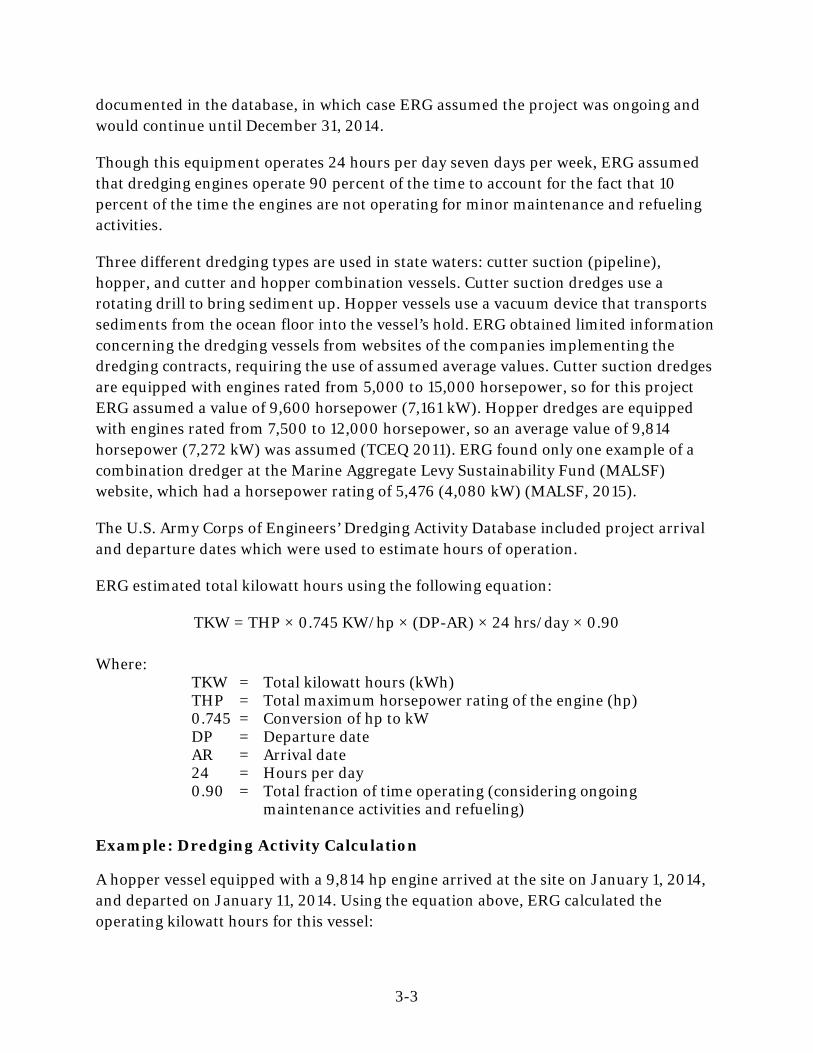
documented in the database, in which case ERG assumed the project was ongoing and would continue until December 31, 2014.
Though this equipment operates 24 hours per day seven days per week, ERG assumed that dredging engines operate 90 percent of the time to account for the fact that 10 percent of the time the engines are not operating for minor maintenance and refueling activities.
Three different dredging types are used in state waters: cutter suction (pipeline), hopper, and cutter and hopper combination vessels. Cutter suction dredges use a rotating drill to bring sediment up. Hopper vessels use a vacuum device that transports sediments from the ocean floor into the vessel’s hold. ERG obtained limited information concerning the dredging vessels from websites of the companies implementing the dredging contracts, requiring the use of assumed average values. Cutter suction dredges are equipped with engines rated from 5,000 to 15,000 horsepower, so for this project ERG assumed a value of 9,600 horsepower (7,161 kW). Hopper dredges are equipped with engines rated from 7,500 to 12,000 horsepower, so an average value of 9,814 horsepower (7,272 kW) was assumed (TCEQ 2011). ERG found only one example of a combination dredger at the Marine Aggregate Levy Sustainability Fund (MALSF) website, which had a horsepower rating of 5,476 (4,080 kW) (MALSF, 2015).
The U.S. Army Corps of Engineers’ Dredging Activity Database included project arrival and departure dates which were used to estimate hours of operation.
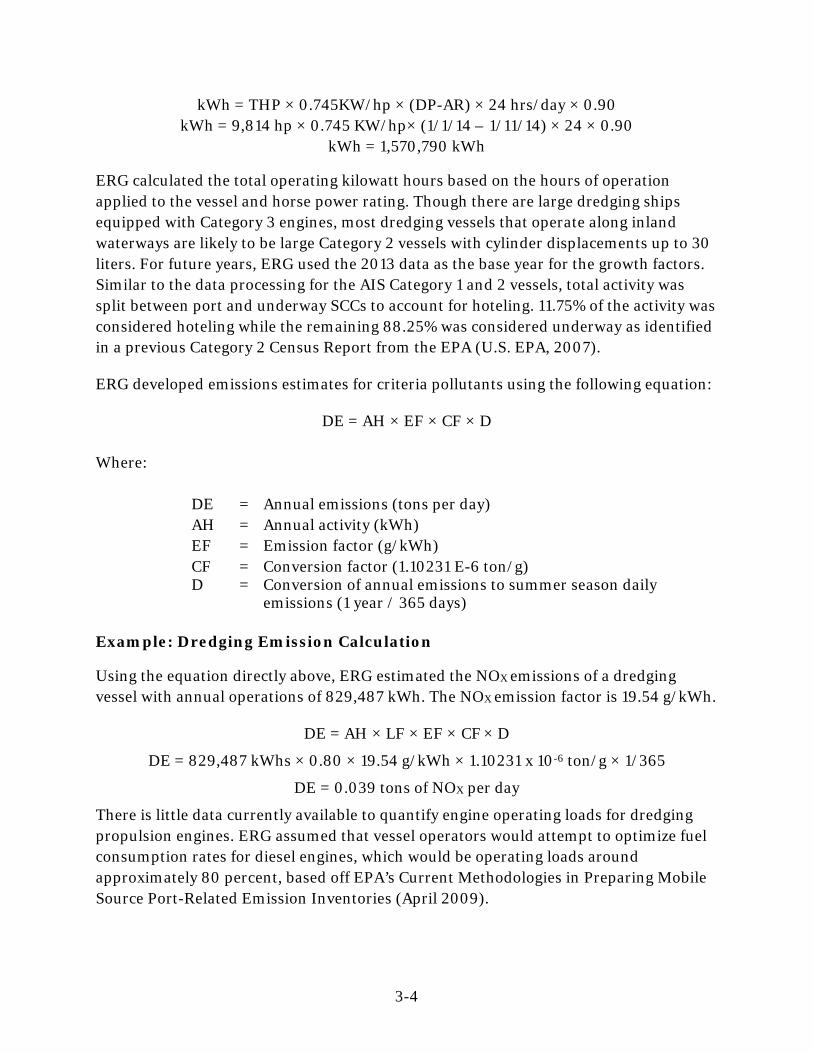
ERG estimated total kilowatt hours using the following equation:
TKW = Total kilowatt hours (kWh) THP = Total maximum horsepower rating of the engine (hp) 0.745 = Conversion of hp to kW DP = Departure date AR = Arrival date 24 = Hours per day 0.90 = Total fraction of time operating (considering ongoing maintenance activities and refueling)
Example: Dredging Activity Calculation
A hopper vessel equipped with a 9,814 hp engine arrived at the site on January 1, 2014, and departed on January 11, 2014. Using the equation above, ERG calculated the operating kilowatt hours for this vessel:
ERG calculated the total operating kilowatt hours based on the hours of operation applied to the vessel and horse power rating. Though there are large dredging ships equipped with Category 3 engines, most dredging vessels that operate along inland waterways are likely to be large Category 2 vessels with cylinder displacements up to 30 liters. For future years, ERG used the 2013 data as the base year for the growth factors. Similar to the data processing for the AIS Category 1 and 2 vessels, total activity was split between port and underway SCCs to account for hoteling. 11.75% of the activity was considered hoteling while the remaining 88.25% was considered underway as identified in a previous Category 2 Census Report from the EPA (U.S. EPA, 2007).
ERG developed emissions estimates for criteria pollutants using the following equation:
DE = AH × EF × CF × D Where:
DE = Annual emissions (tons per day) AH = Annual activity (kWh) EF = Emission factor (g/kWh) CF = Conversion factor (1.10231 E-6 ton/g) D = Conversion of annual emissions to summer season daily emissions (1 year / 365 days)
Example: Dredging Emission Calculation
Using the equation directly above, ERG estimated the NOX emissions of a dredging vessel with annual operations of 829,487 kWh. The NOX emission factor is 19.54 g/kWh.
DE = AH × LF × EF × CF × D
DE = 829,487 kWhs × 0.80 × 19.54 g/kWh × 1.10231 x 10⁻⁶ ton/g × 1/365
DE = 0.039 tons of NOX per day
There is little data currently available to quantify engine operating loads for dredging propulsion engines. ERG assumed that vessel operators would attempt to optimize fuel consumption rates for diesel engines, which would be operating loads around approximately 80 percent, based off EPA’s Current Methodologies in Preparing Mobile Source Port-Related Emission Inventories (April 2009).
3-5
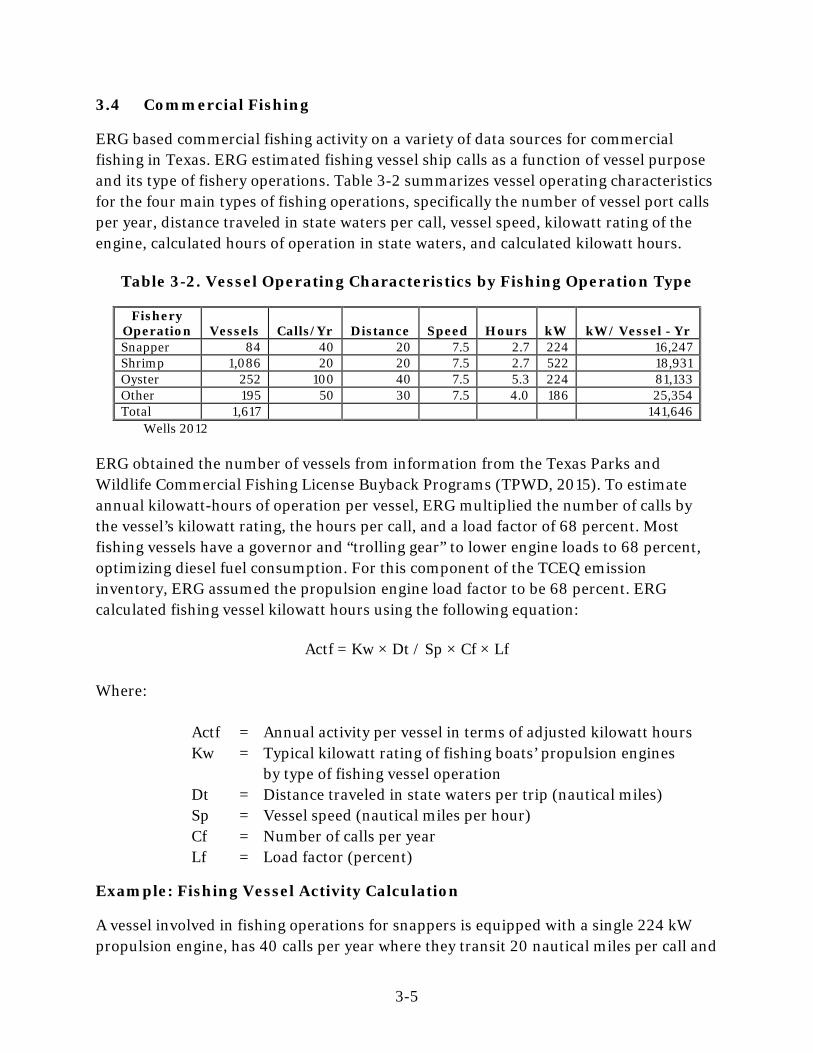
3.4 Commercial Fishing
ERG based commercial fishing activity on a variety of data sources for commercial fishing in Texas. ERG estimated fishing vessel ship calls as a function of vessel purpose and its type of fishery operations. Table 3-2 summarizes vessel operating characteristics for the four main types of fishing operations, specifically the number of vessel port calls per year, distance traveled in state waters per call, vessel speed, kilowatt rating of the engine, calculated hours of operation in state waters, and calculated kilowatt hours.
Wells 2012
ERG obtained the number of vessels from information from the Texas Parks and Wildlife Commercial Fishing License Buyback Programs (TPWD, 2015). To estimate annual kilowatt-hours of operation per vessel, ERG multiplied the number of calls by the vessel’s kilowatt rating, the hours per call, and a load factor of 68 percent. Most fishing vessels have a governor and “trolling gear” to lower engine loads to 68 percent, optimizing diesel fuel consumption. For this component of the TCEQ emission inventory, ERG assumed the propulsion engine load factor to be 68 percent. ERG calculated fishing vessel kilowatt hours using the following equation:
Actf = Kw × Dt / Sp × Cf × Lf Where:
Actf = Annual activity per vessel in terms of adjusted kilowatt hours Kw = Typical kilowatt rating of fishing boats’ propulsion engines
by type of fishing vessel operation Dt = Distance traveled in state waters per trip (nautical miles) Sp = Vessel speed (nautical miles per hour) Cf = Number of calls per year Lf = Load factor (percent)
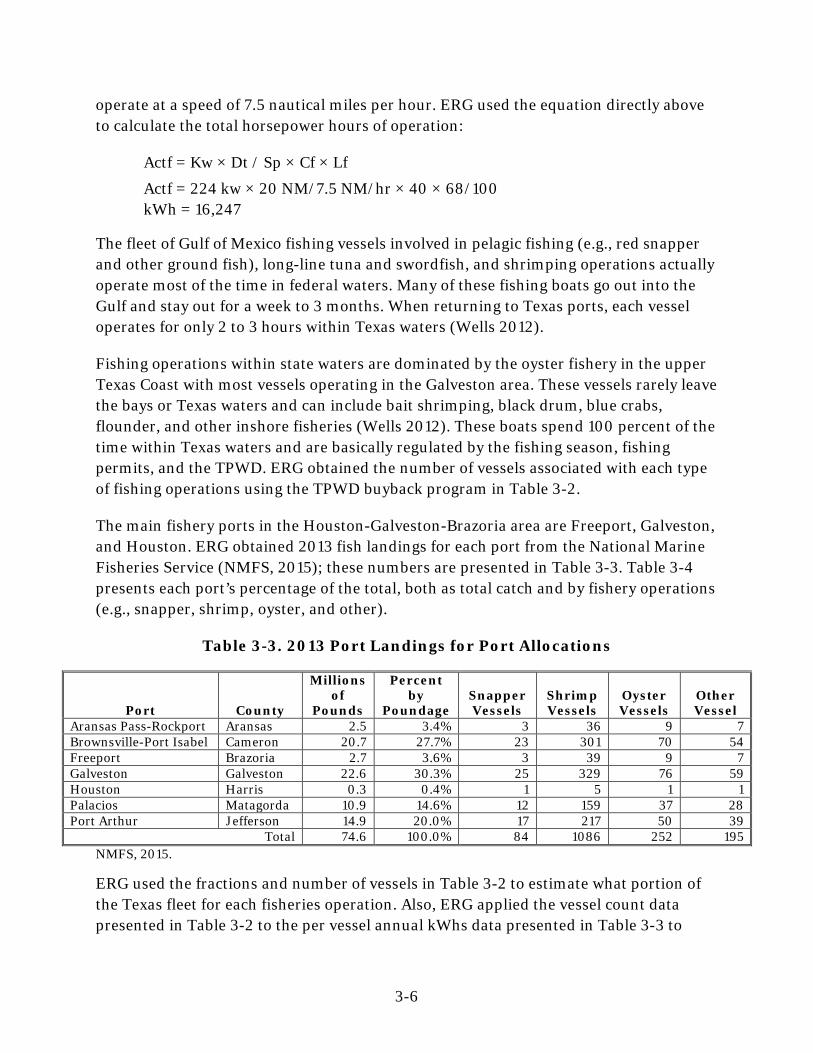
Example: Fishing Vessel Activity Calculation
A vessel involved in fishing operations for snappers is equipped with a single 224 kW propulsion engine, has 40 calls per year where they transit 20 nautical miles per call and
Table 3-2. Vessel Operating Characteristics by Fishing Operation Type
The fleet of Gulf of Mexico fishing vessels involved in pelagic fishing (e.g., red snapper and other ground fish), long-line tuna and swordfish, and shrimping operations actually operate most of the time in federal waters. Many of these fishing boats go out into the Gulf and stay out for a week to 3 months. When returning to Texas ports, each vessel operates for only 2 to 3 hours within Texas waters (Wells 2012).
Fishing operations within state waters are dominated by the oyster fishery in the upper Texas Coast with most vessels operating in the Galveston area. These vessels rarely leave the bays or Texas waters and can include bait shrimping, black drum, blue crabs, flounder, and other inshore fisheries (Wells 2012). These boats spend 100 percent of the time within Texas waters and are basically regulated by the fishing season, fishing permits, and the TPWD. ERG obtained the number of vessels associated with each type of fishing operations using the TPWD buyback program in Table 3-2.
The main fishery ports in the Houston-Galveston-Brazoria area are Freeport, Galveston, and Houston. ERG obtained 2013 fish landings for each port from the National Marine Fisheries Service (NMFS, 2015); these numbers are presented in Table 3-3. Table 3-4 presents each port’s percentage of the total, both as total catch and by fishery operations (e.g., snapper, shrimp, oyster, and other).
Table 3-3. 2013 Port Landings for Port Allocations
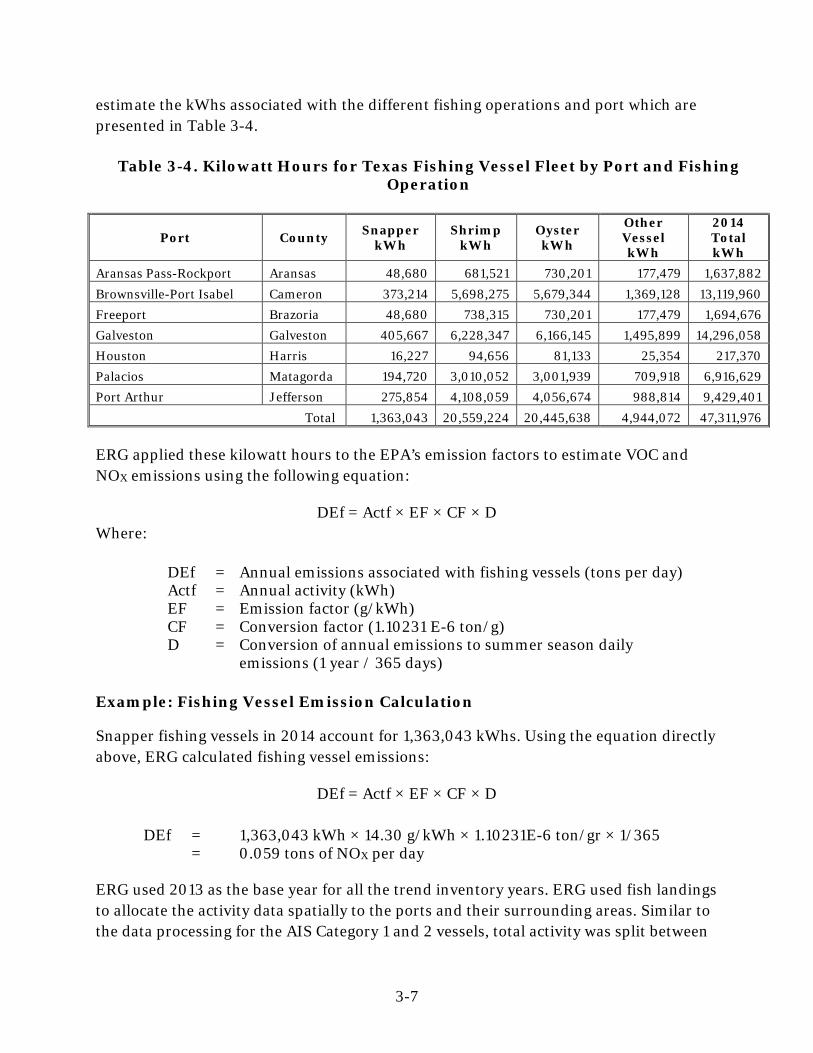
ERG used the fractions and number of vessels in Table 3-2 to estimate what portion of the Texas fleet for each fisheries operation. Also, ERG applied the vessel count data presented in Table 3-2 to the per vessel annual kWhs data presented in Table 3-3 to
3-7
estimate the kWhs associated with the different fishing operations and port which are presented in Table 3-4.
Table 3-4. Kilowatt Hours for Texas Fishing Vessel Fleet by Port and Fishing Operation
Total 1,363,043 20,559,224 20,445,638 4,944,072 47,311,976 ERG applied these kilowatt hours to the EPA’s emission factors to estimate VOC and NOX emissions using the following equation:
DEf = Actf × EF × CF × D Where:
DEf = Annual emissions associated with fishing vessels (tons per day) Actf = Annual activity (kWh) EF = Emission factor (g/kWh) CF = Conversion factor (1.10231 E-6 ton/g) D = Conversion of annual emissions to summer season daily
Snapper fishing vessels in 2014 account for 1,363,043 kWhs. Using the equation directly above, ERG calculated fishing vessel emissions:
DEf = Actf × EF × CF × D
DEf = 1,363,043 kWh × 14.30 g/kWh × 1.10231E-6 ton/gr × 1/365 = 0.059 tons of NOX per day
ERG used 2013 as the base year for all the trend inventory years. ERG used fish landings to allocate the activity data spatially to the ports and their surrounding areas. Similar to the data processing for the AIS Category 1 and 2 vessels, total activity was split between
3-8
port and underway SCCs to account for hoteling. 11.75% of the activity was considered hoteling while the remaining 88.25% was considered underway as identified in a previous Category 2 Census Report from the EPA (U.S. EPA, 2007).
4-1
4.0 Emission Factors
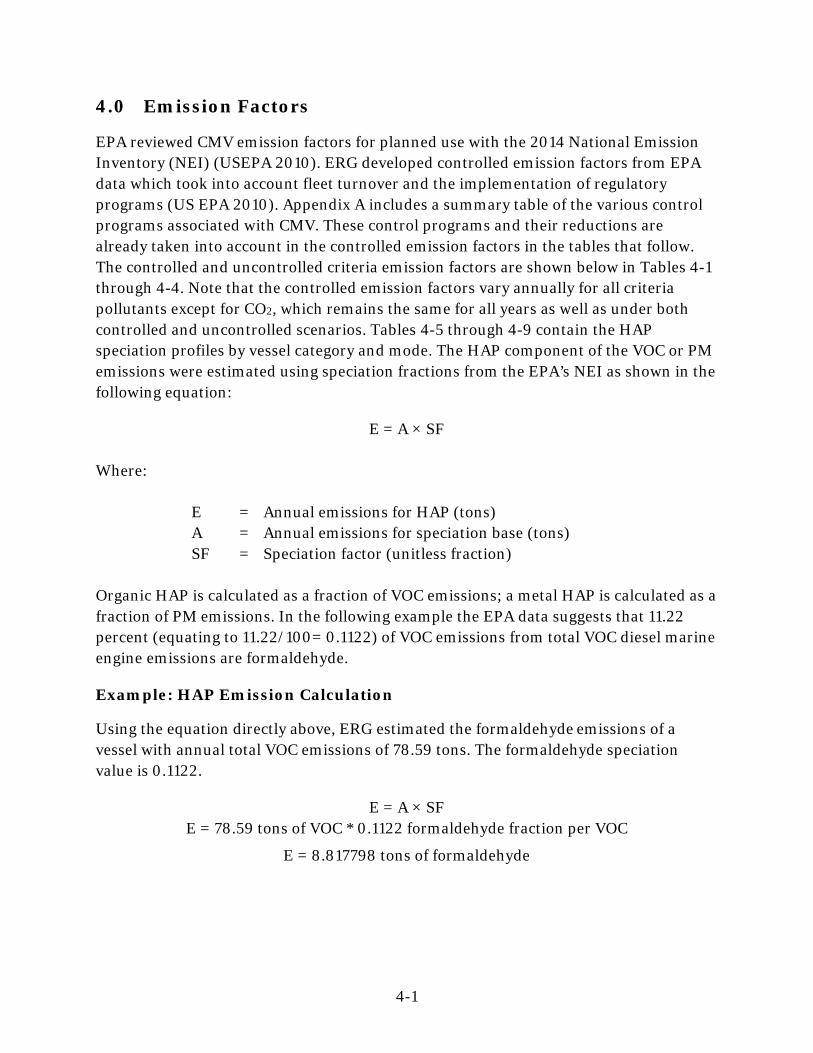
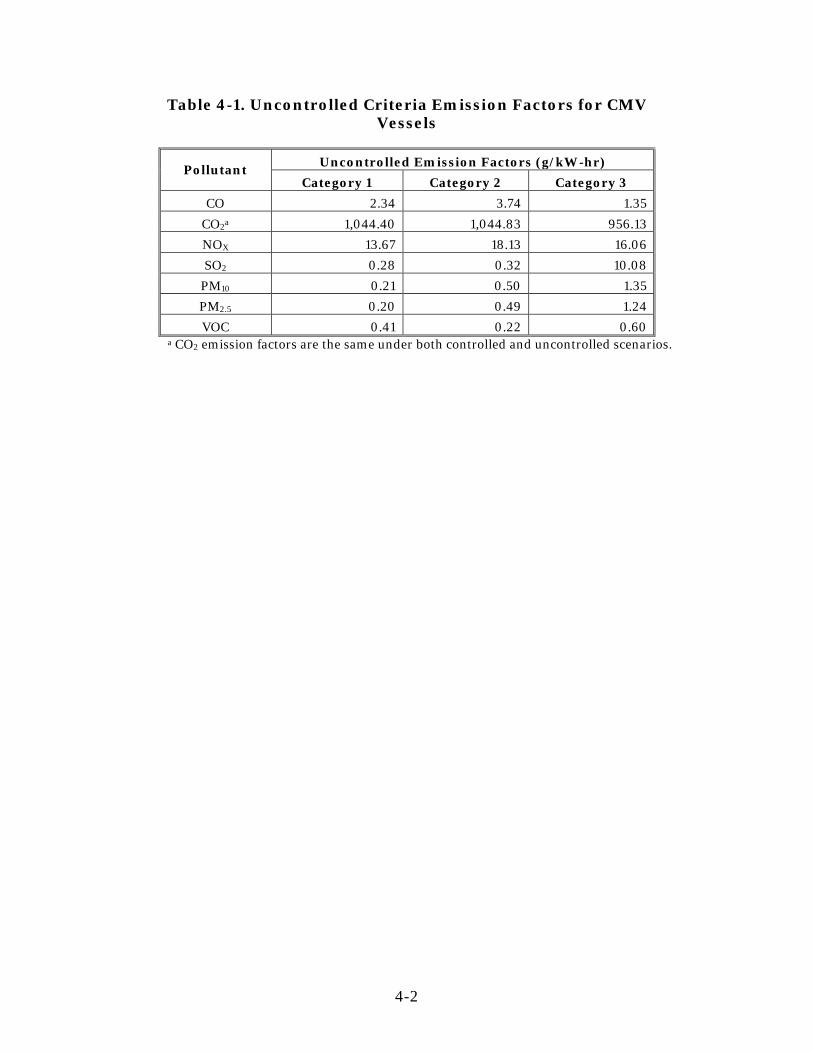
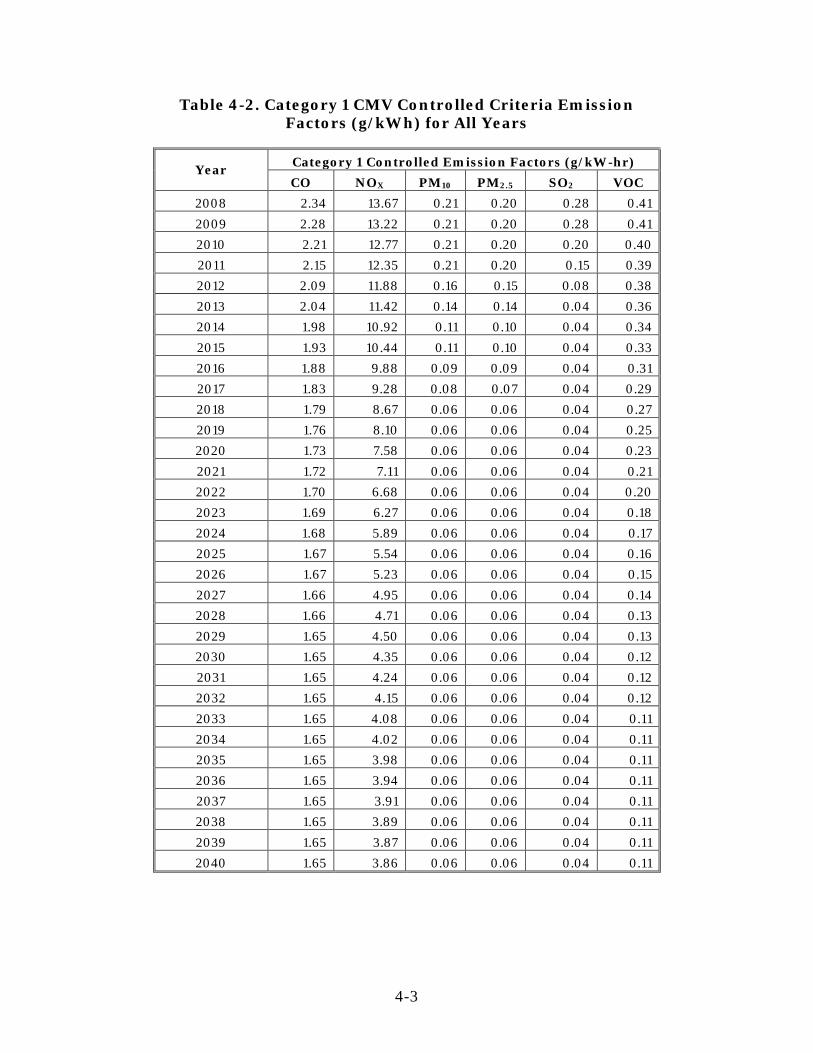
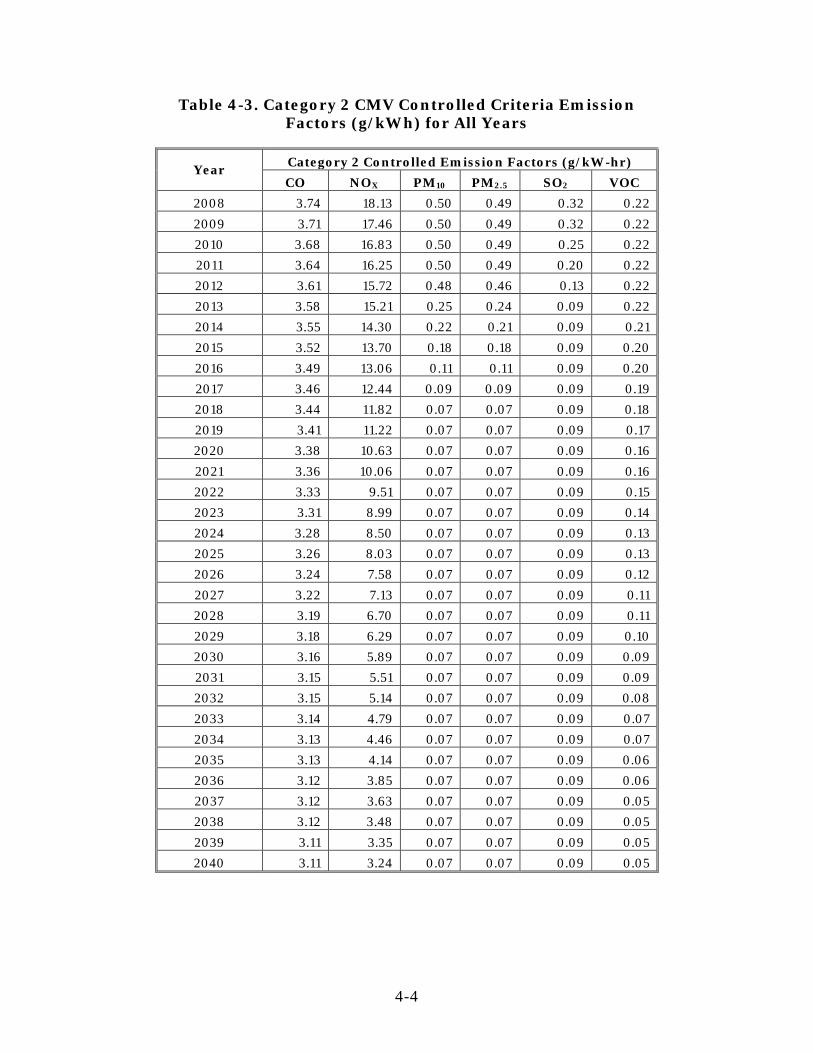
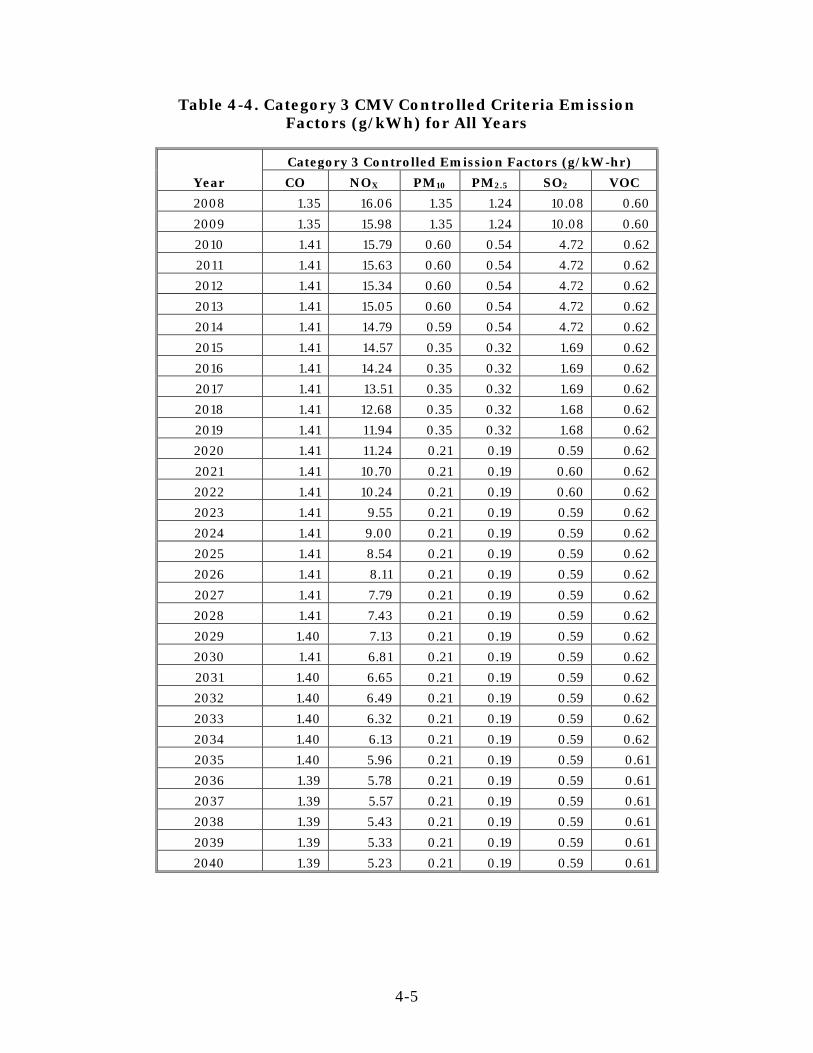
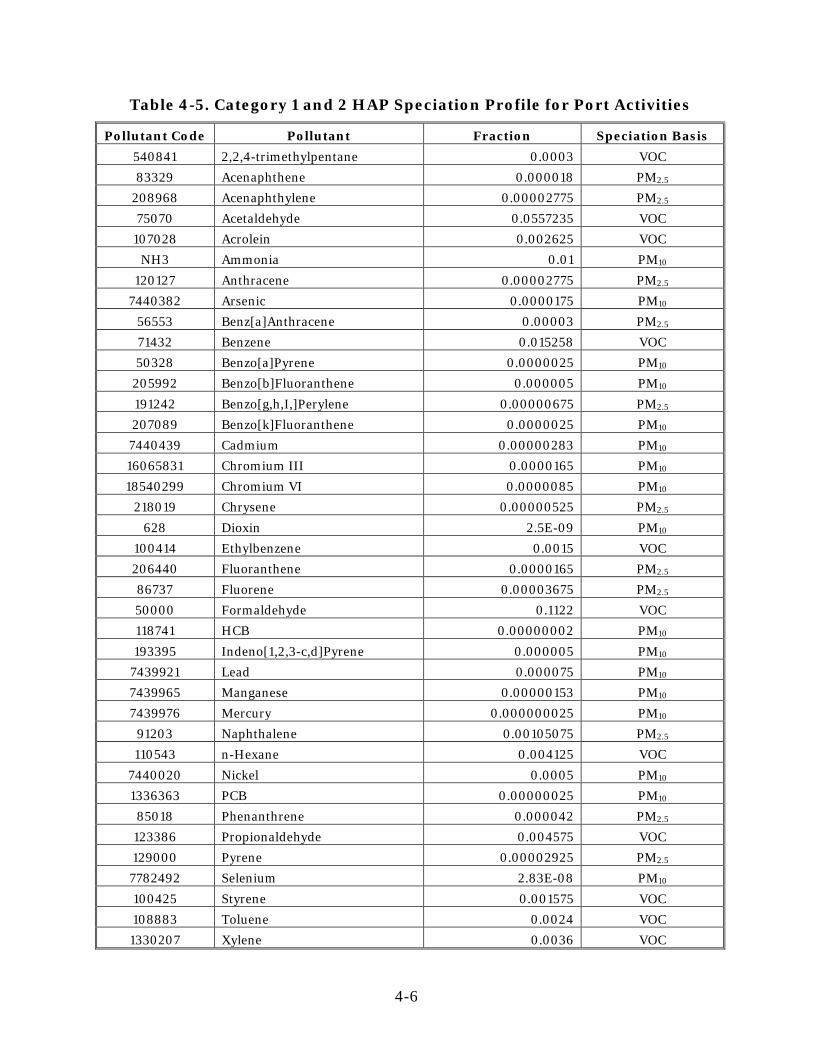
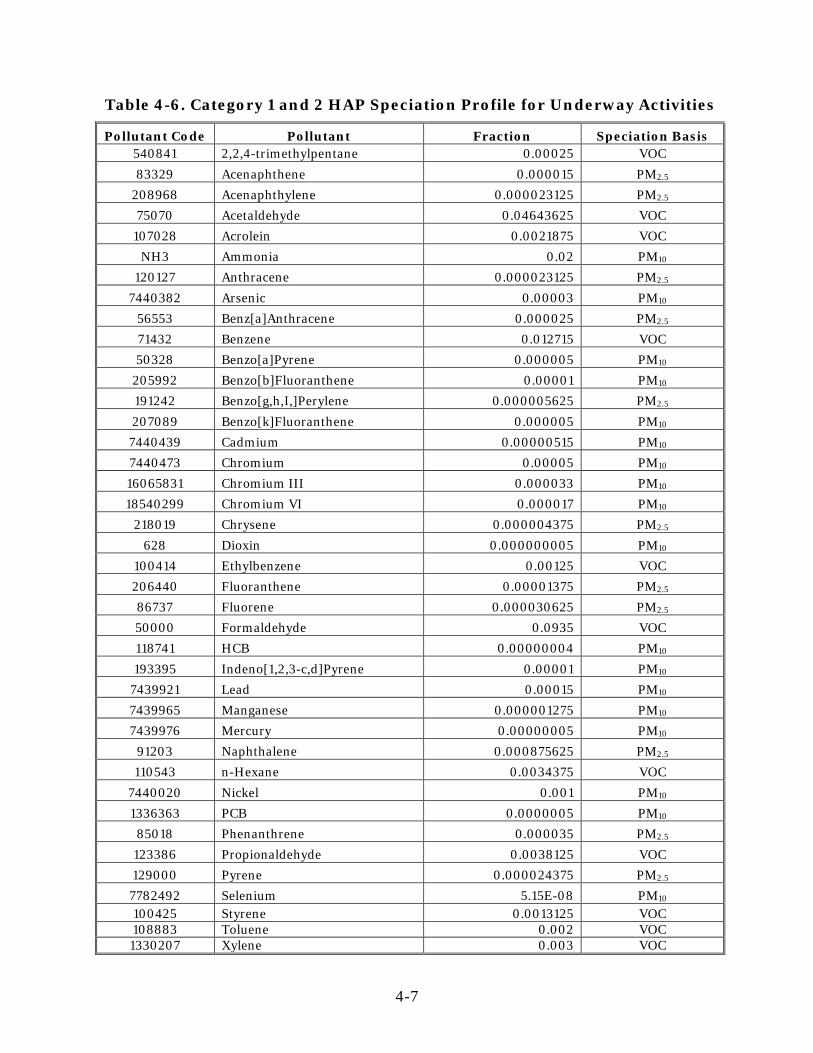
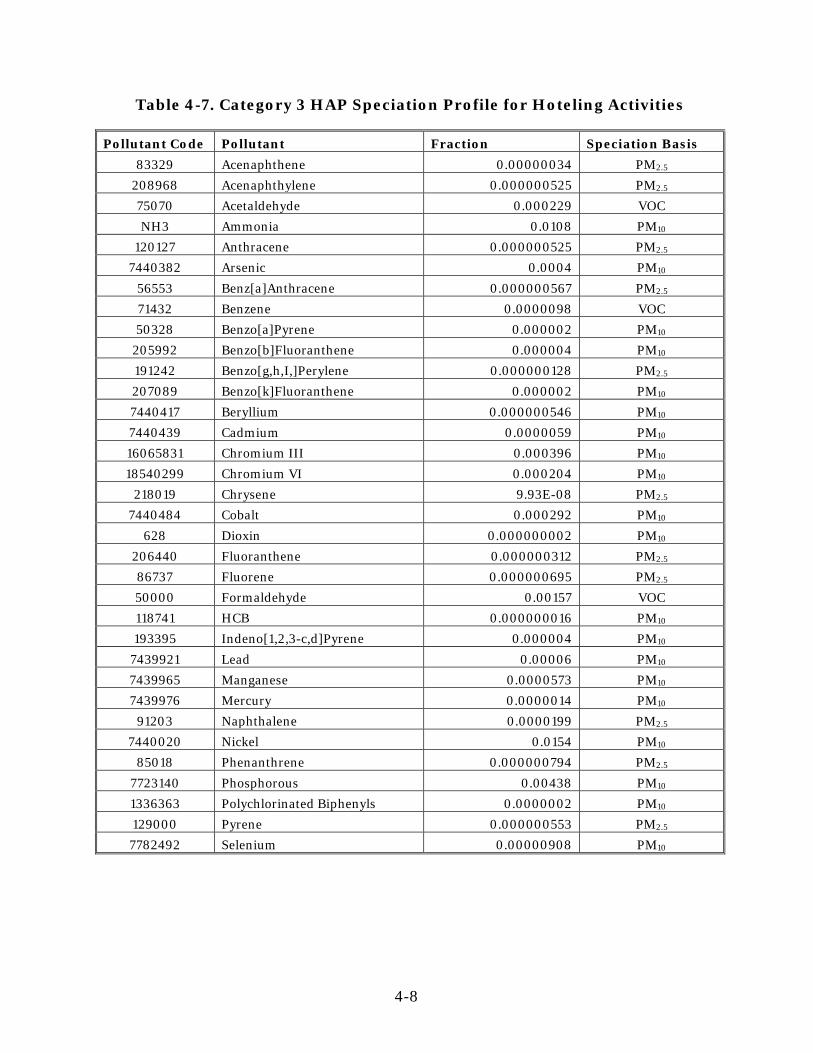
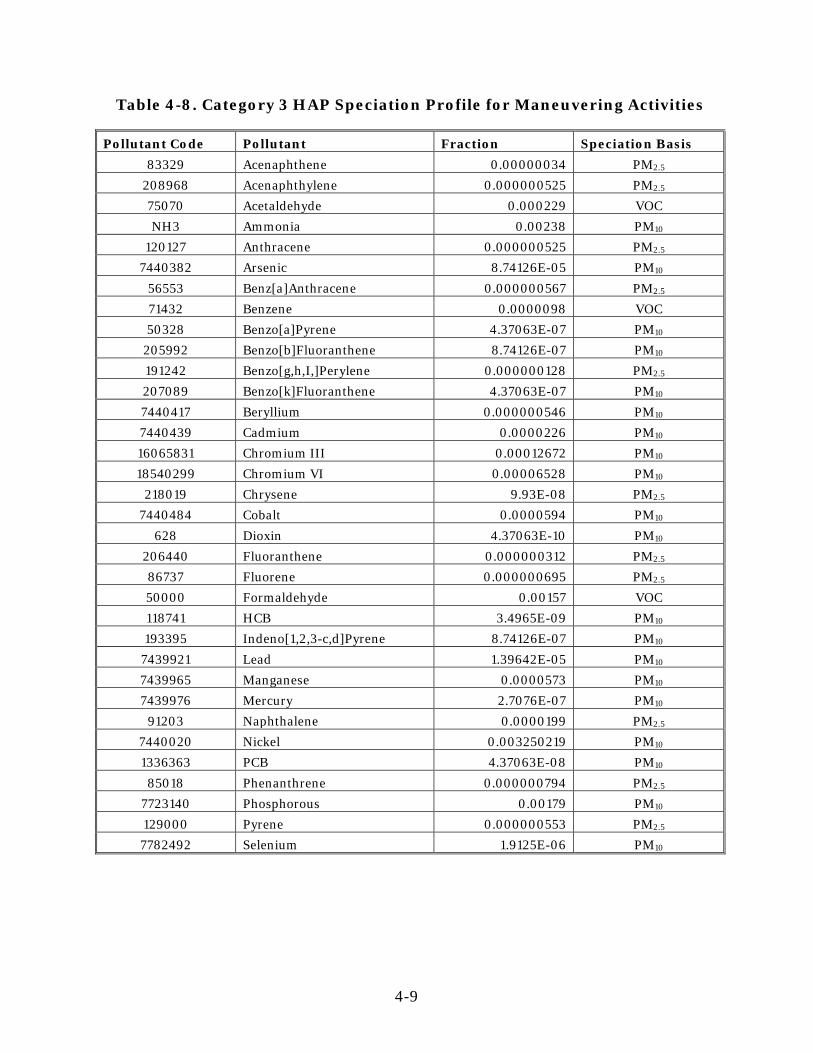
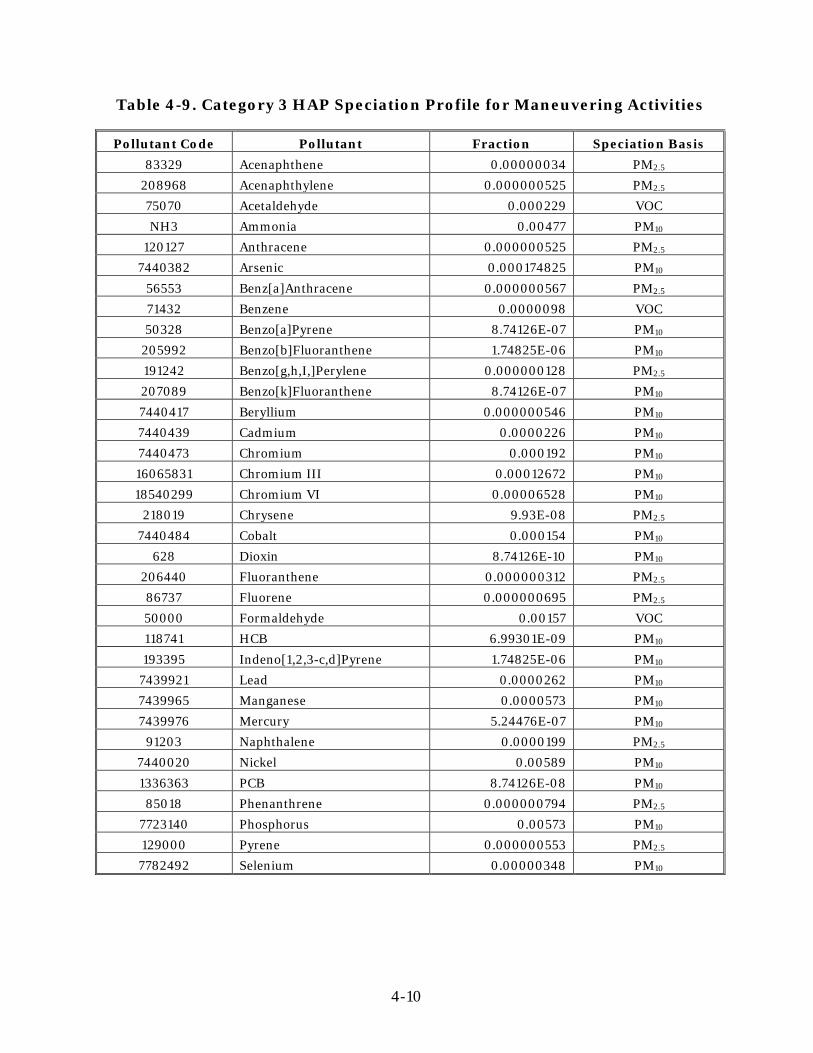
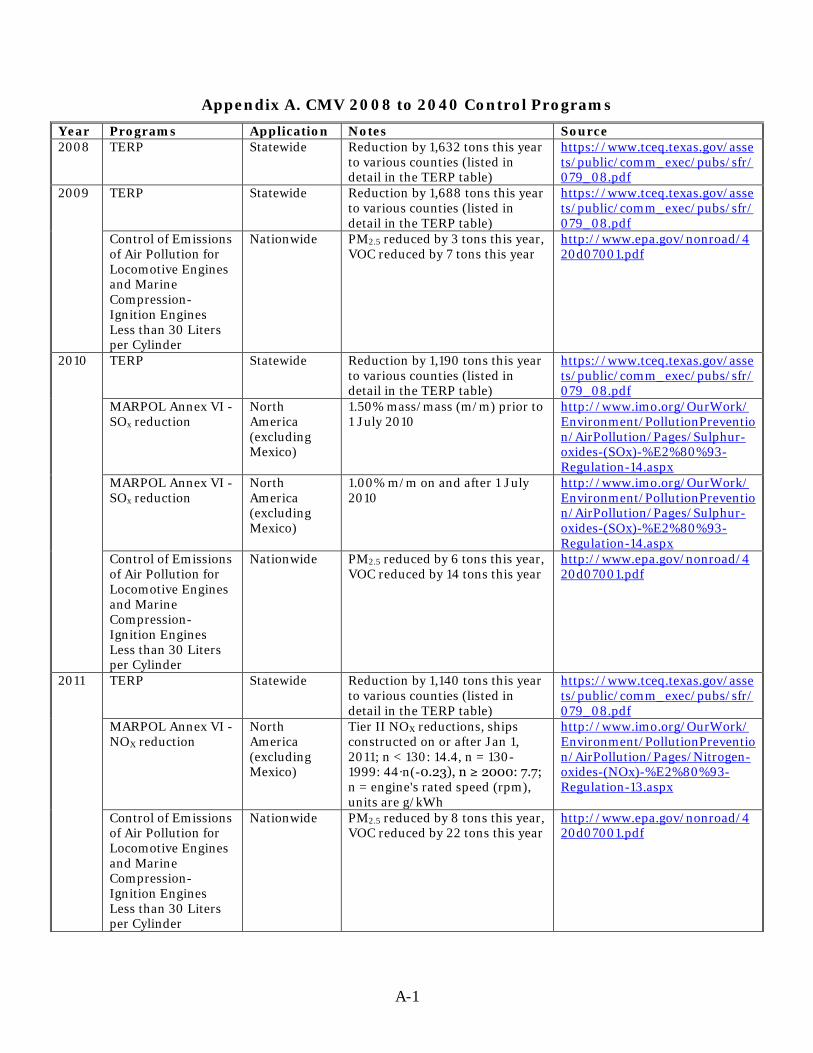
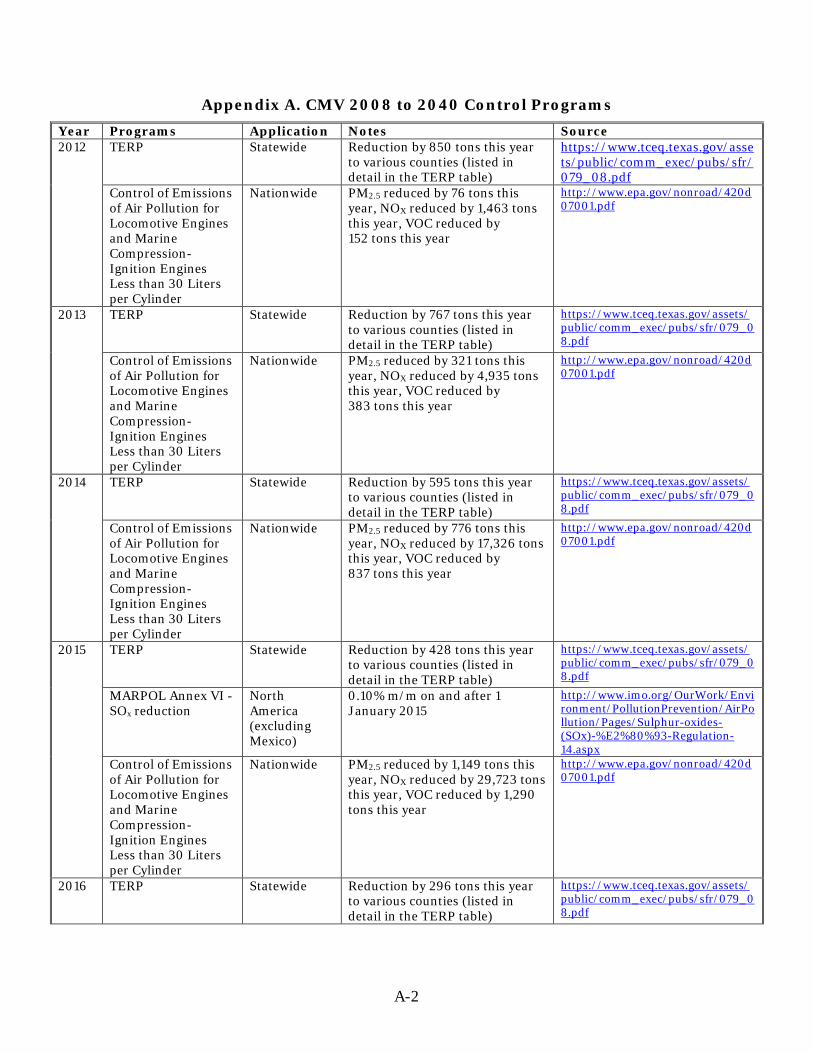
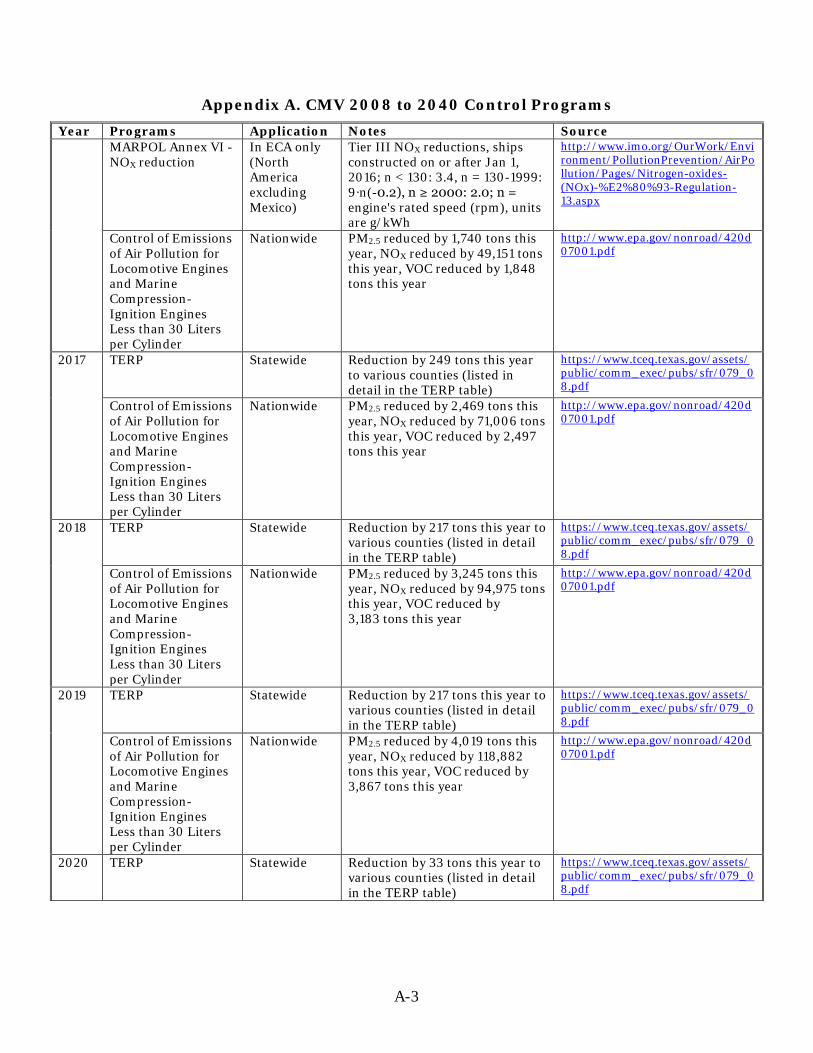
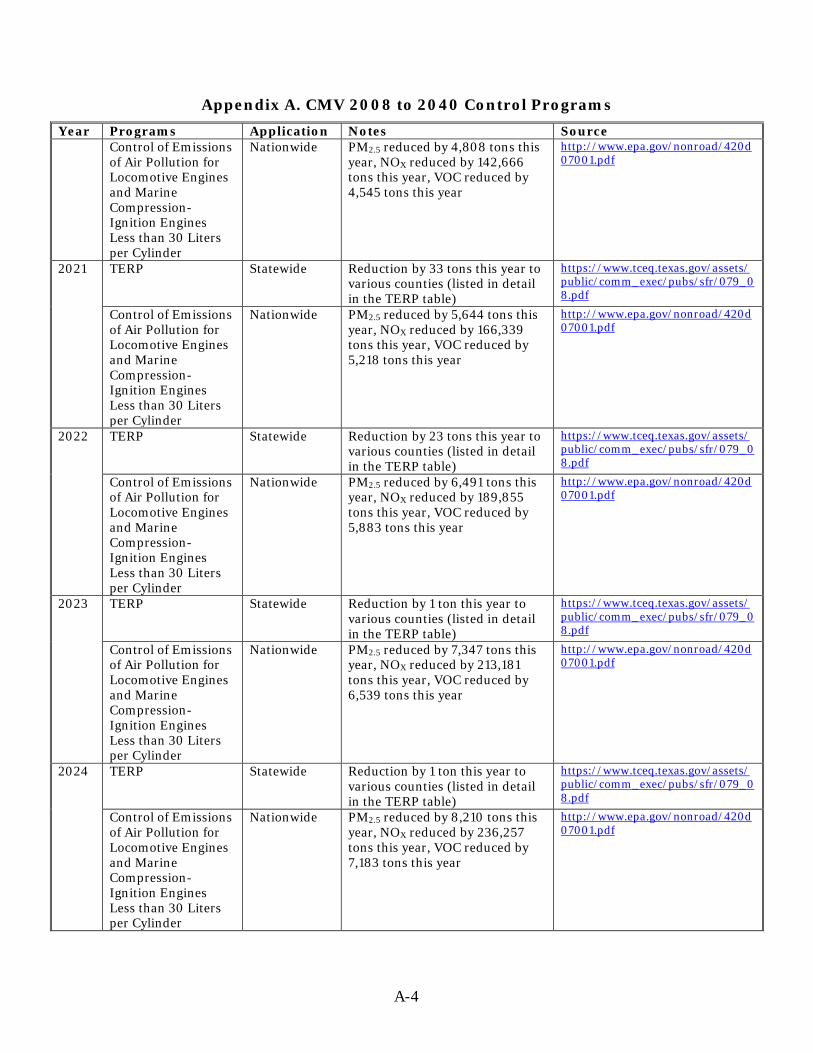
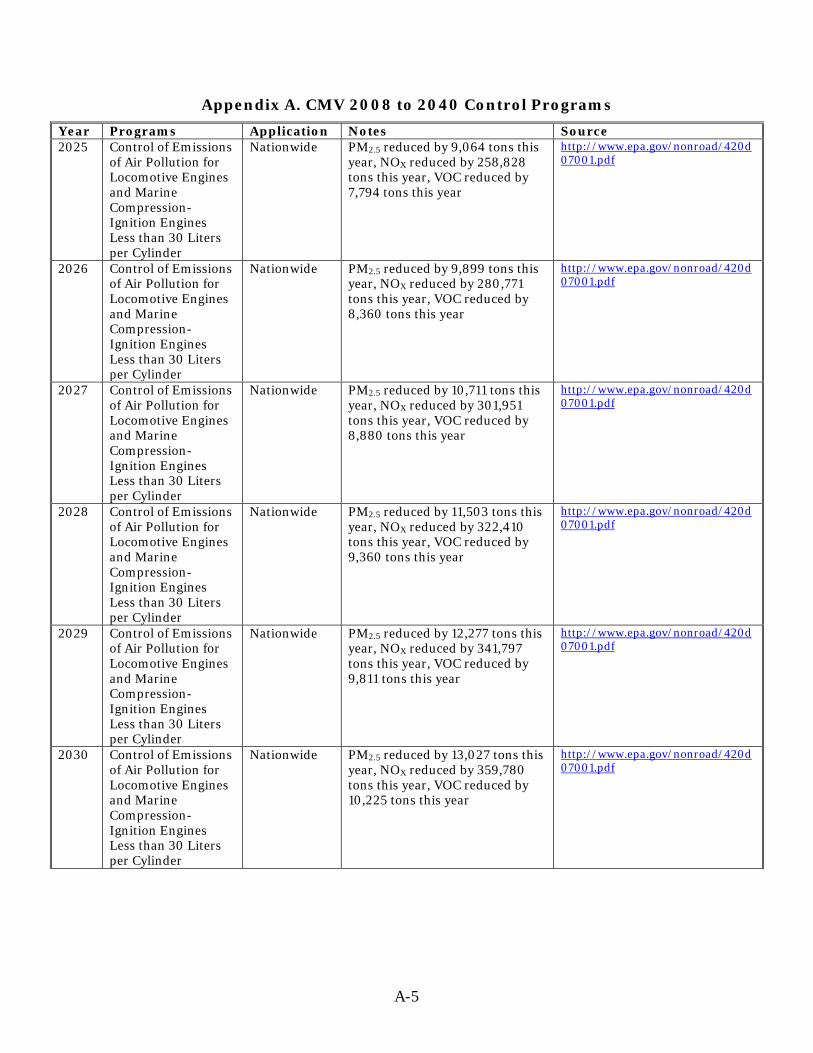
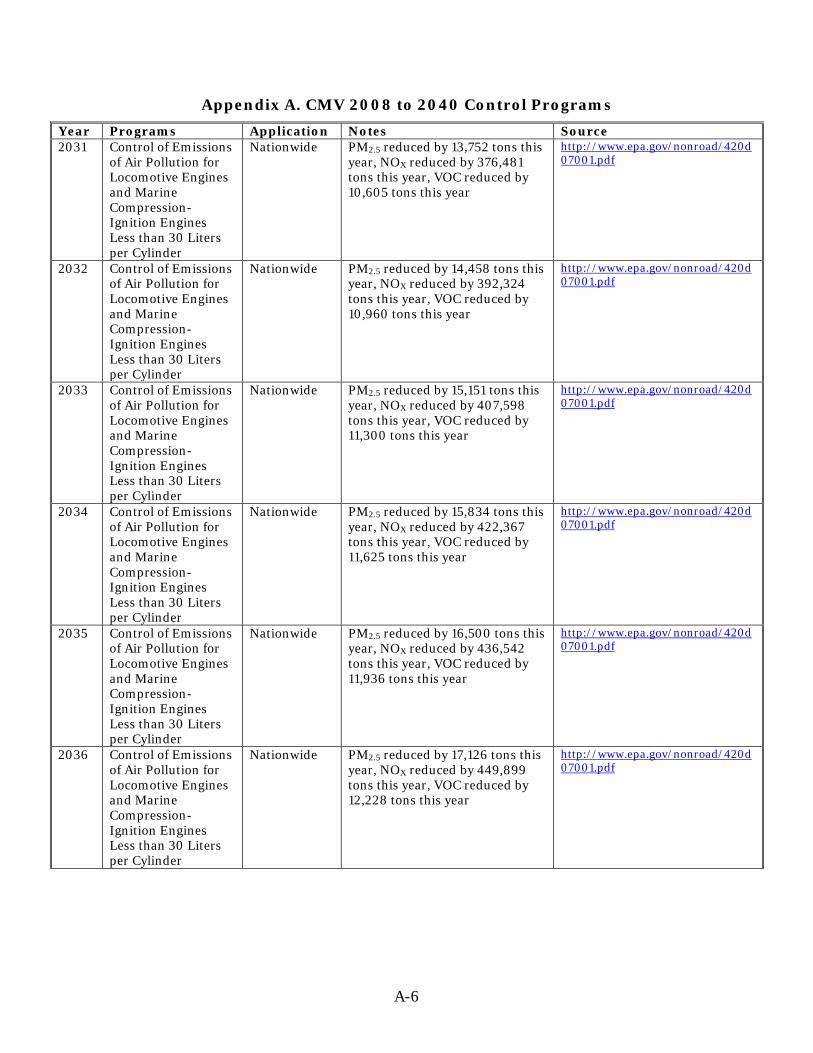
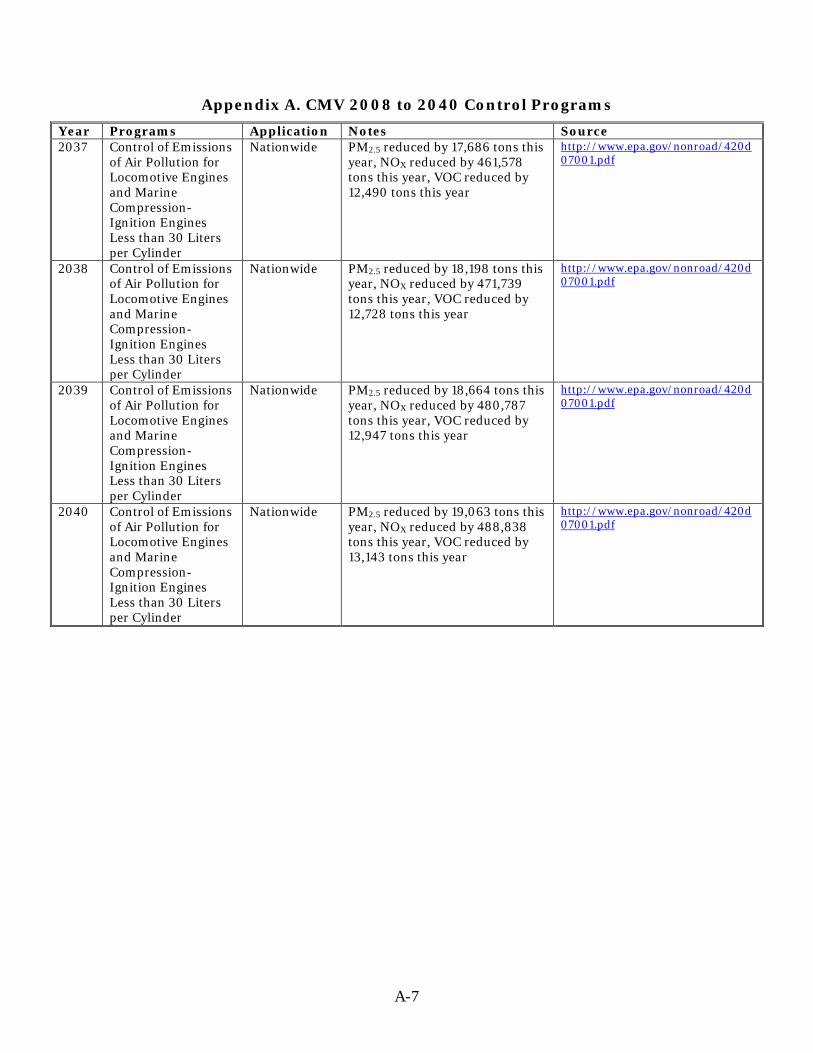
EPA reviewed CMV emission factors for planned use with the 2014 National Emission Inventory (NEI) (USEPA 2010). ERG developed controlled emission factors from EPA data which took into account fleet turnover and the implementation of regulatory programs (US EPA 2010). Appendix A includes a summary table of the various control programs associated with CMV. These control programs and their reductions are already taken into account in the controlled emission factors in the tables that follow. The controlled and uncontrolled criteria emission factors are shown below in Tables 4-1 through 4-4. Note that the controlled emission factors vary annually for all criteria pollutants except for CO2, which remains the same for all years as well as under both controlled and uncontrolled scenarios. Tables 4-5 through 4-9 contain the HAP speciation profiles by vessel category and mode. The HAP component of the VOC or PM emissions were estimated using speciation fractions from the EPA’s NEI as shown in the following equation:
E = A × SF Where:
E = Annual emissions for HAP (tons) A = Annual emissions for speciation base (tons) SF = Speciation factor (unitless fraction)
Organic HAP is calculated as a fraction of VOC emissions; a metal HAP is calculated as a fraction of PM emissions. In the following example the EPA data suggests that 11.22 percent (equating to 11.22/100= 0.1122) of VOC emissions from total VOC diesel marine engine emissions are formaldehyde.
Example: HAP Emission Calculation
Using the equation directly above, ERG estimated the formaldehyde emissions of a vessel with annual total VOC emissions of 78.59 tons. The formaldehyde speciation value is 0.1122.
E = A × SF E = 78.59 tons of VOC * 0.1122 formaldehyde fraction per VOC
E = 8.817798 tons of formaldehyde
4-2
Table 4-1. Uncontrolled Criteria Emission Factors for CMV Vessels
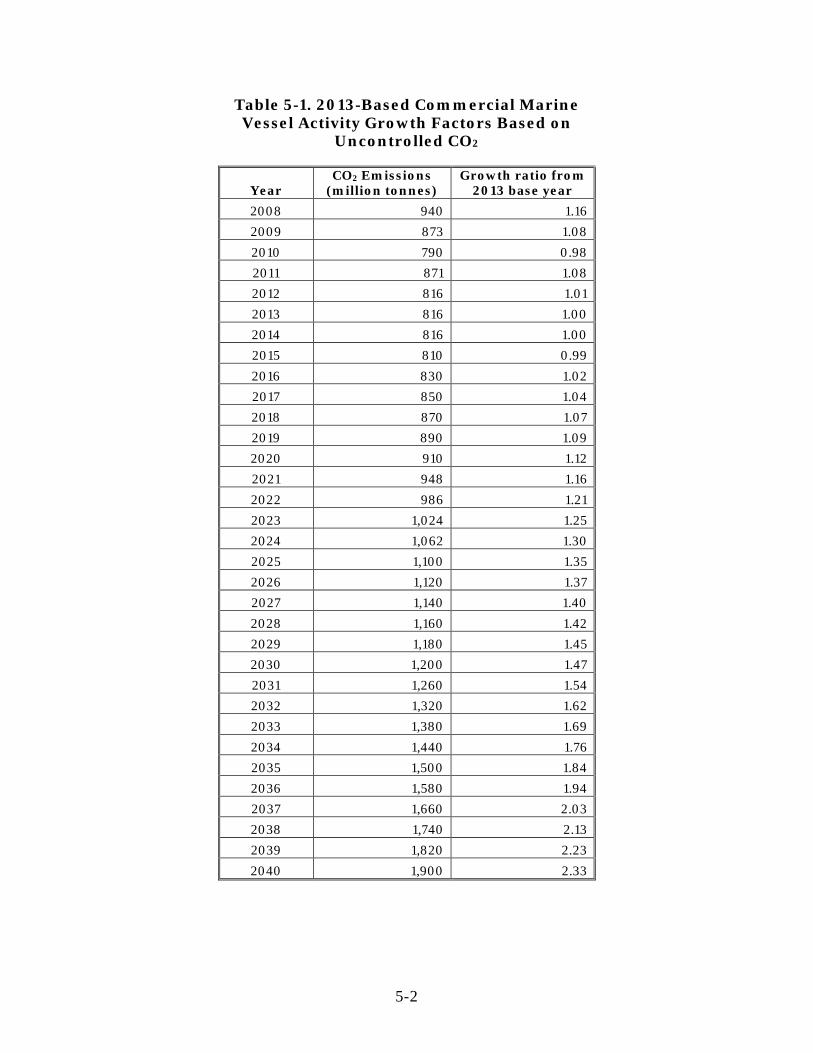
ERG based projected commercial marine vessel activities for Texas ports on the carbon dioxide (CO2) emission estimates from the business as usual (BAU) Global Scenario 13 developed in the International Maritime Organization’s (IMO) Third Green House Gas Study (2014). CO2 tends to be strongly correlated to fuel combustion as it is based on the carbon content of the fuel which tends to be relatively constant over time. It should be noted that the projection profiles in the IMO study represent the most current economic information on the marine vessel activities developed by an international consortium of leading experts. Studies that have been implemented prior to the global economic decline in 2008 and the uncertain period of recovery (2009-12) tend to overestimate projected growth in the sector. The IMO team addressed the still lingering uncertainties about future trends by providing four different BAU scenarios (13, 14, 15, and 16). All four of the BAU scenarios assumed modest engine efficiency improvement (no control options), no further expansion of global Emission Control Areas (ECA,) and limited use of liquefied natural gas (LNG). In the IMO report a wide range of control options were also included in BAU projection scenarios 1-12. It should be noted that none of these control options were used in projecting marine vessel activities for this TCEQ project. To insure that projected activities were not underestimated, BAU Scenario 13 was used as it assumed the highest level of projected growth.
Additional research supported this assessment, including the assessment developed by the Center for Transportation Research and Texas Transportation Institute for the “Trade Flows and Texas Gulf Ports: Panama Canal Expansion and South American Markets” (August 2013) report. This assessment suggests that international cargo volume will gradually increase as noted in the IMO BAU projections concurrent with an increase in vessel size due to the Panama Canal expansion, providing less vessel traffic with fewer emissions per cargo ton-mile. ERG reviewed other references such as the U.S. Department of Transportation Bureau of Transportation Statistics 2014 (TranStat 2014), the U.S. Department of Energy’s Annual Energy Outlook (EIA 2014), and the Organization for Economic Co-operation and Development (OECD) Economic Outlook (2014) to ensure that projected vessel traffic estimates are reasonable. Table 5-1 lists forecasting and backcasting factors.
Note the projections provided in the IMO report did not account for recent changes in fuel costs. ERG anticipates that these changes may have limited impact on marine vessel activities as projected fuel usage in Texas ports will require fuels that comply with recently implemented emissions control area standards. Conversely, if vessels use high sulfur content fuels, they will need to install scrubbers to ensure that emissions are comparable with those from the use of low sulfur fuels.
5-2
Table 5-1. 2013-Based Commercial Marine Vessel Activity Growth Factors Based on
ERG matched projected activity to the appropriate future year emission factors in Table 6-1 to account for federal rules that are implemented relative to the year that the marine engine was originally manufactured, such that full benefit of the rule would occur in the future once fleet turnover was completed. ERG made additional adjustments to future year emissions estimates to account for compliance with emissions control area fuel sulfur standards and Texas Emissions Reduction Plan (TERP) investments. The TERP program provides grants to eligible businesses to reduce emissions from polluting vehicles and equipment. Appendix A includes a complete list of control programs addressed in this inventory.
6-1
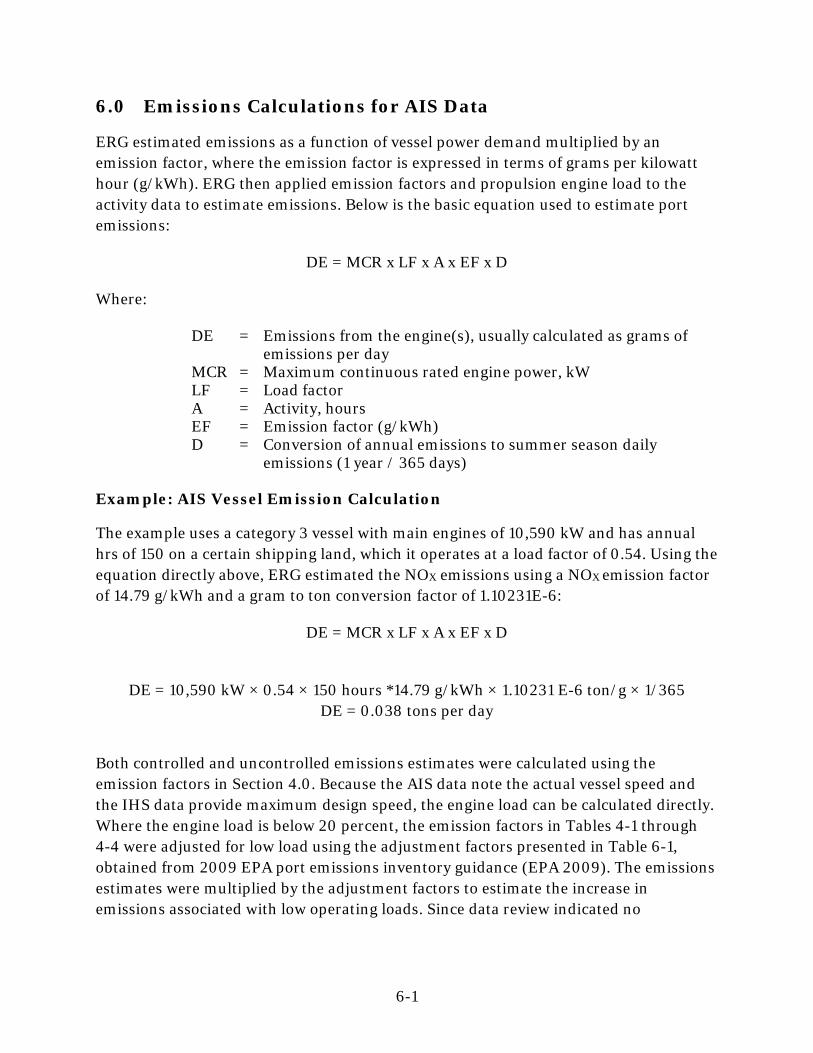
6.0 Emissions Calculations for AIS Data
ERG estimated emissions as a function of vessel power demand multiplied by an emission factor, where the emission factor is expressed in terms of grams per kilowatt hour (g/kWh). ERG then applied emission factors and propulsion engine load to the activity data to estimate emissions. Below is the basic equation used to estimate port emissions:
DE = MCR x LF x A x EF x D
Where:
DE = Emissions from the engine(s), usually calculated as grams of emissions per day MCR = Maximum continuous rated engine power, kW LF = Load factor A = Activity, hours EF = Emission factor (g/kWh) D = Conversion of annual emissions to summer season daily emissions (1 year / 365 days)
Example: AIS Vessel Emission Calculation
The example uses a category 3 vessel with main engines of 10,590 kW and has annual hrs of 150 on a certain shipping land, which it operates at a load factor of 0.54. Using the equation directly above, ERG estimated the NOX emissions using a NOX emission factor of 14.79 g/kWh and a gram to ton conversion factor of 1.10231E-6:
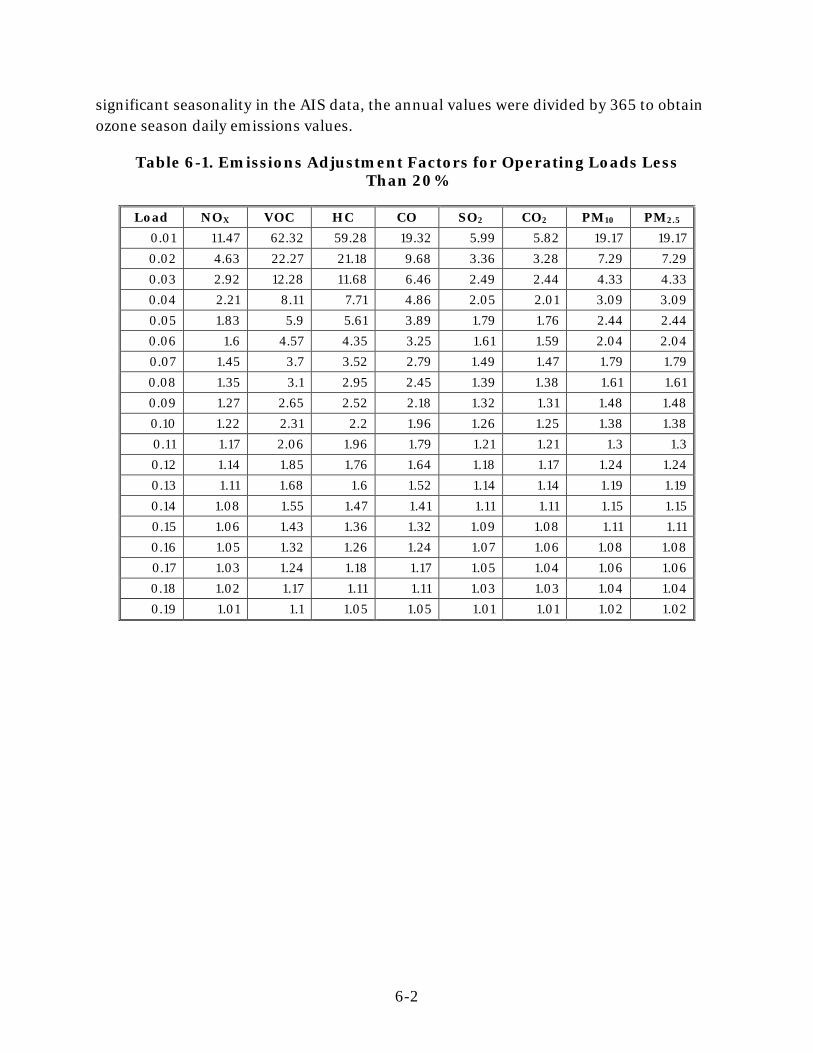
Both controlled and uncontrolled emissions estimates were calculated using the emission factors in Section 4.0. Because the AIS data note the actual vessel speed and the IHS data provide maximum design speed, the engine load can be calculated directly. Where the engine load is below 20 percent, the emission factors in Tables 4-1 through 4-4 were adjusted for low load using the adjustment factors presented in Table 6-1, obtained from 2009 EPA port emissions inventory guidance (EPA 2009). The emissions estimates were multiplied by the adjustment factors to estimate the increase in emissions associated with low operating loads. Since data review indicated no
6-2
significant seasonality in the AIS data, the annual values were divided by 365 to obtain ozone season daily emissions values.
Table 6-1. Emissions Adjustment Factors for Operating Loads Less Than 20%
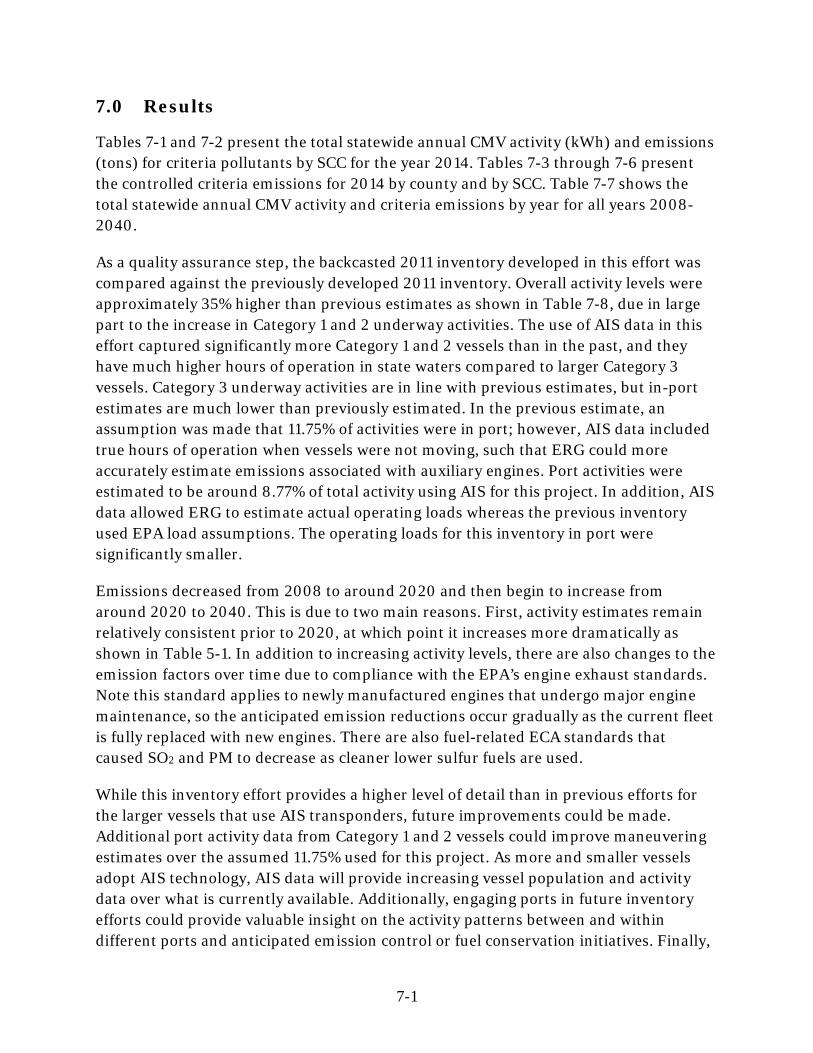
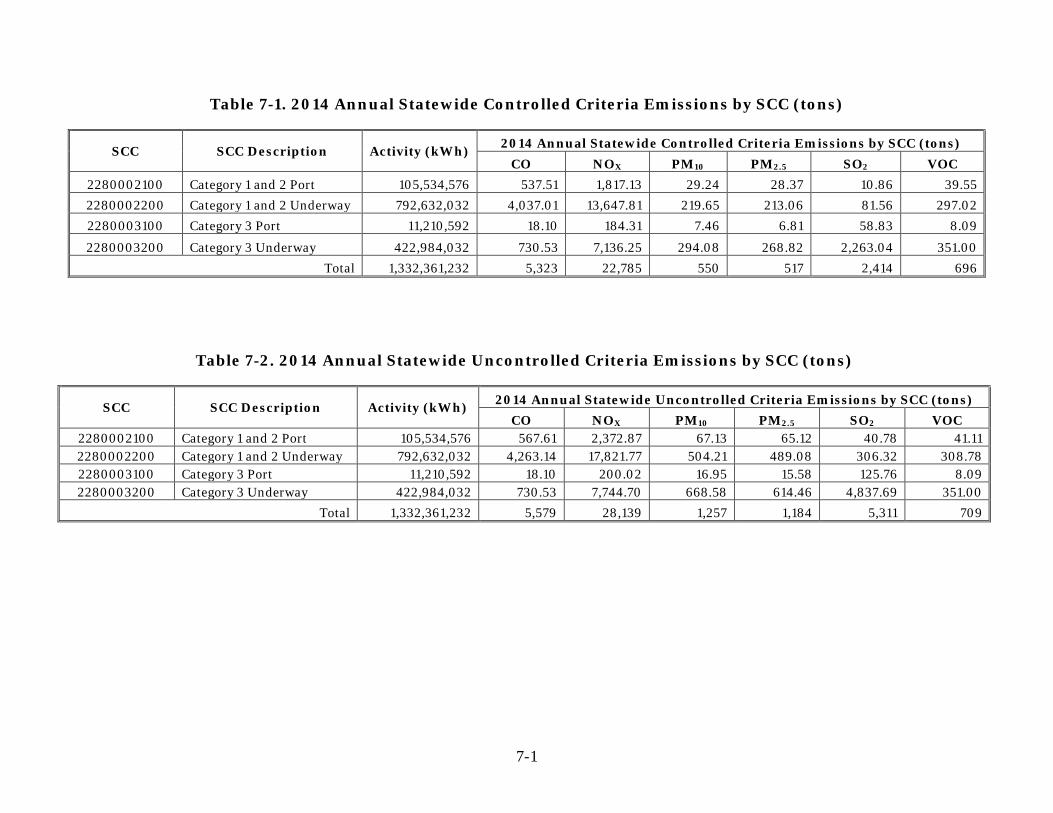
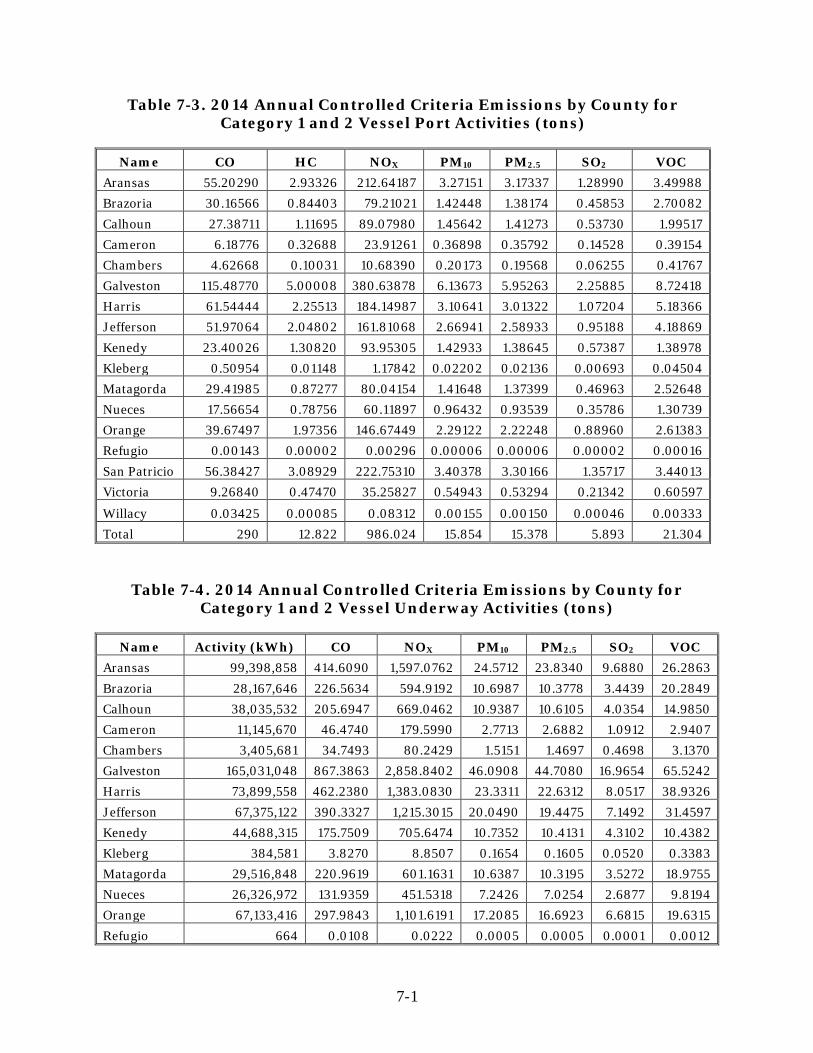
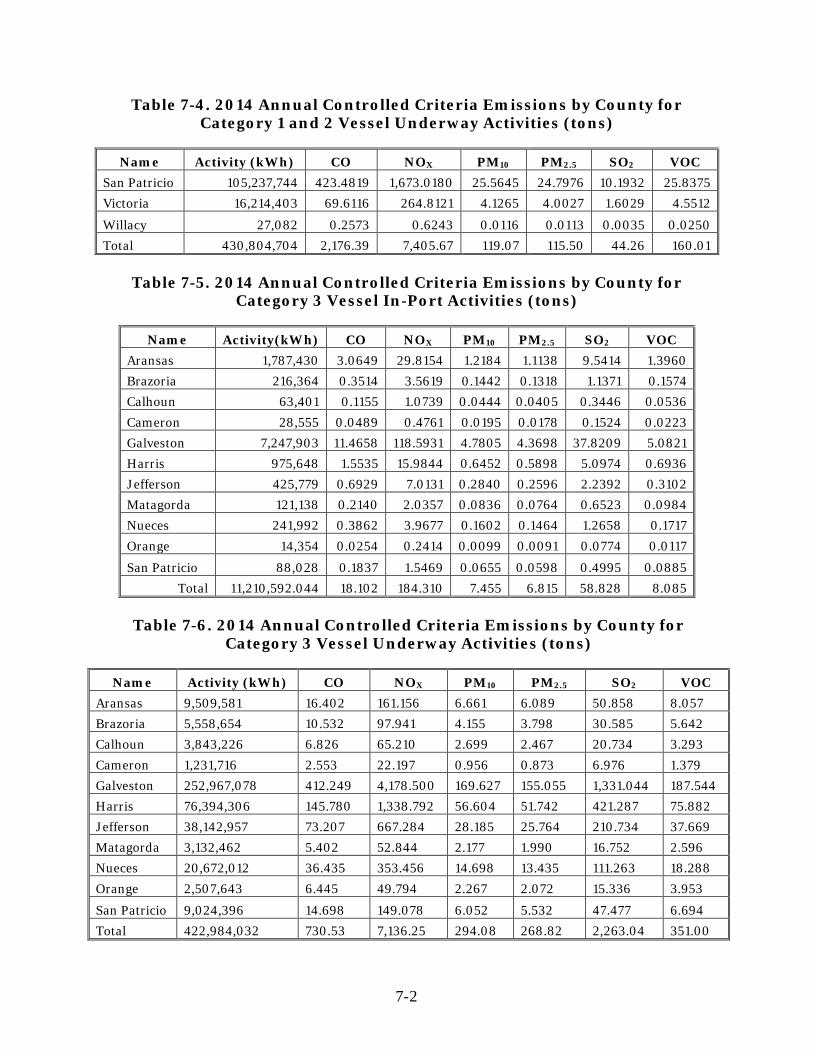
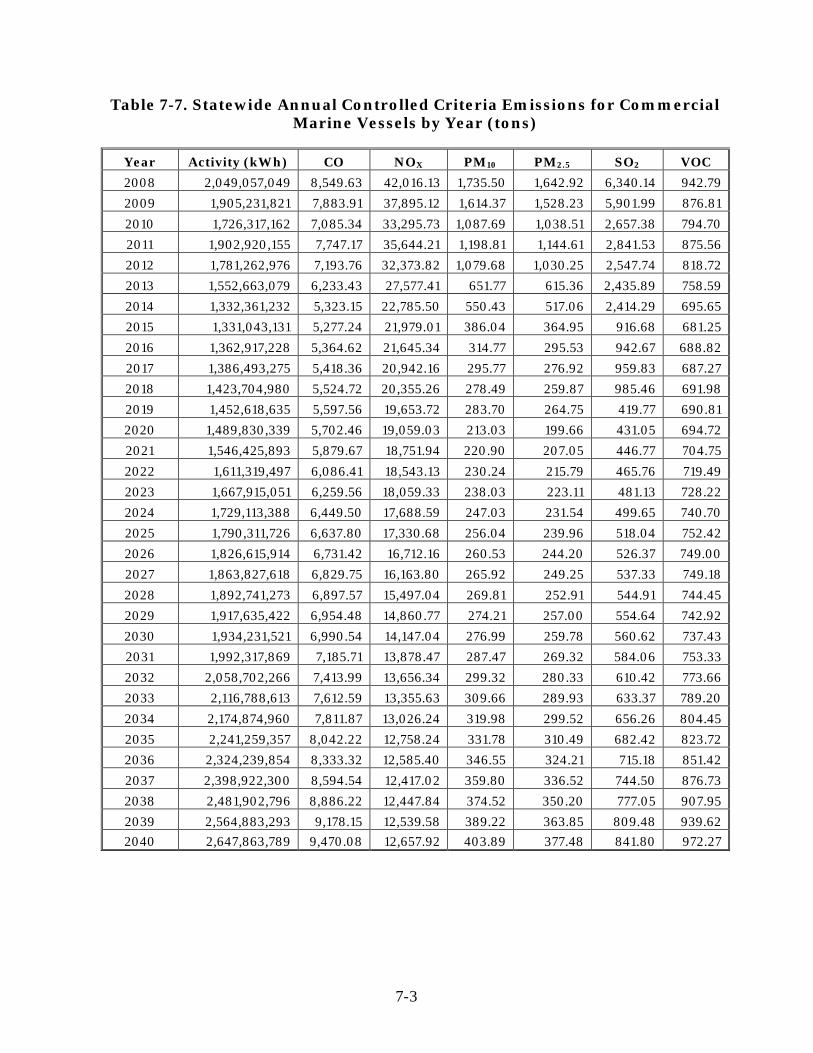
Tables 7-1 and 7-2 present the total statewide annual CMV activity (kWh) and emissions (tons) for criteria pollutants by SCC for the year 2014. Tables 7-3 through 7-6 present the controlled criteria emissions for 2014 by county and by SCC. Table 7-7 shows the total statewide annual CMV activity and criteria emissions by year for all years 2008-2040.
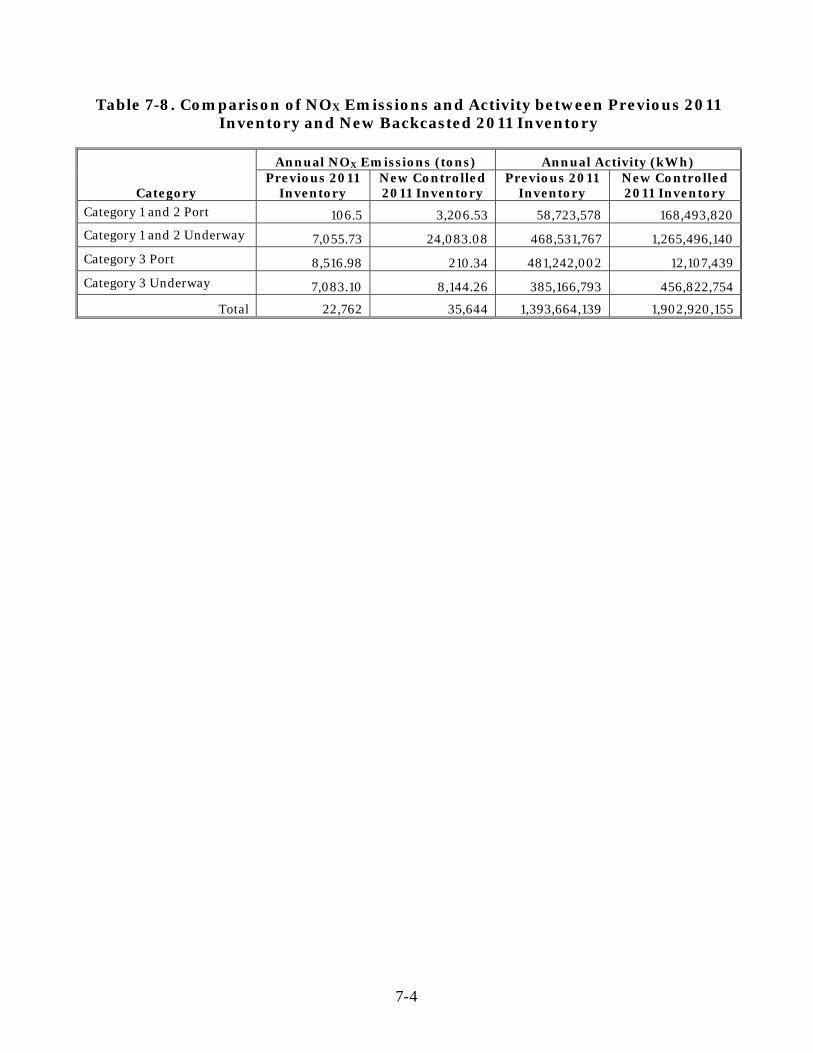
As a quality assurance step, the backcasted 2011 inventory developed in this effort was compared against the previously developed 2011 inventory. Overall activity levels were approximately 35% higher than previous estimates as shown in Table 7-8, due in large part to the increase in Category 1 and 2 underway activities. The use of AIS data in this effort captured significantly more Category 1 and 2 vessels than in the past, and they have much higher hours of operation in state waters compared to larger Category 3 vessels. Category 3 underway activities are in line with previous estimates, but in-port estimates are much lower than previously estimated. In the previous estimate, an assumption was made that 11.75% of activities were in port; however, AIS data included true hours of operation when vessels were not moving, such that ERG could more accurately estimate emissions associated with auxiliary engines. Port activities were estimated to be around 8.77% of total activity using AIS for this project. In addition, AIS data allowed ERG to estimate actual operating loads whereas the previous inventory used EPA load assumptions. The operating loads for this inventory in port were significantly smaller.
Emissions decreased from 2008 to around 2020 and then begin to increase from around 2020 to 2040. This is due to two main reasons. First, activity estimates remain relatively consistent prior to 2020, at which point it increases more dramatically as shown in Table 5-1. In addition to increasing activity levels, there are also changes to the emission factors over time due to compliance with the EPA’s engine exhaust standards. Note this standard applies to newly manufactured engines that undergo major engine maintenance, so the anticipated emission reductions occur gradually as the current fleet is fully replaced with new engines. There are also fuel-related ECA standards that caused SO2 and PM to decrease as cleaner lower sulfur fuels are used.
While this inventory effort provides a higher level of detail than in previous efforts for the larger vessels that use AIS transponders, future improvements could be made. Additional port activity data from Category 1 and 2 vessels could improve maneuvering estimates over the assumed 11.75% used for this project. As more and smaller vessels adopt AIS technology, AIS data will provide increasing vessel population and activity data over what is currently available. Additionally, engaging ports in future inventory efforts could provide valuable insight on the activity patterns between and within different ports and anticipated emission control or fuel conservation initiatives. Finally,
7-2
inclusion of visiting naval vessel activity could be an improvement if activity and vessel data can be obtained.
Category 1 and 2 Port 106.5 3,206.53 58,723,578 168,493,820 Category 1 and 2 Underway 7,055.73 24,083.08 468,531,767 1,265,496,140 Category 3 Port 8,516.98 210.34 481,242,002 12,107,439 Category 3 Underway 7,083.10 8,144.26 385,166,793 456,822,754
Total 22,762 35,644 1,393,664,139 1,902,920,155
8-1
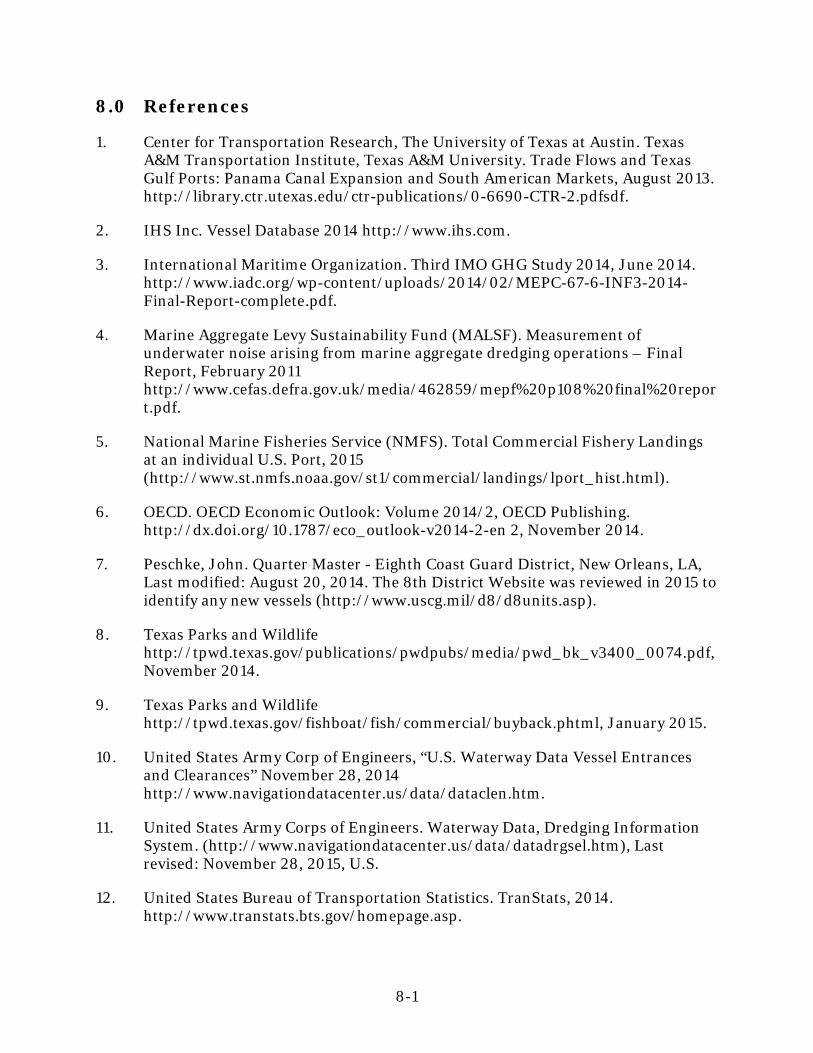
8.0 References
1. Center for Transportation Research, The University of Texas at Austin. Texas A&M Transportation Institute, Texas A&M University. Trade Flows and Texas Gulf Ports: Panama Canal Expansion and South American Markets, August 2013. http://library.ctr.utexas.edu/ctr-publications/0-6690-CTR-2.pdfsdf.
2. IHS Inc. Vessel Database 2014 http://www.ihs.com.
3. International Maritime Organization. Third IMO GHG Study 2014, June 2014. http://www.iadc.org/wp-content/uploads/2014/02/MEPC-67-6-INF3-2014-Final-Report-complete.pdf.
4. Marine Aggregate Levy Sustainability Fund (MALSF). Measurement of underwater noise arising from marine aggregate dredging operations – Final Report, February 2011 http://www.cefas.defra.gov.uk/media/462859/mepf%20p108%20final%20report.pdf.
5. National Marine Fisheries Service (NMFS). Total Commercial Fishery Landings at an individual U.S. Port, 2015 (http://www.st.nmfs.noaa.gov/st1/commercial/landings/lport_hist.html).
7. Peschke, John. Quarter Master - Eighth Coast Guard District, New Orleans, LA, Last modified: August 20, 2014. The 8th District Website was reviewed in 2015 to identify any new vessels (http://www.uscg.mil/d8/d8units.asp).
8. Texas Parks and Wildlife http://tpwd.texas.gov/publications/pwdpubs/media/pwd_bk_v3400_0074.pdf, November 2014.
9. Texas Parks and Wildlife http://tpwd.texas.gov/fishboat/fish/commercial/buyback.phtml, January 2015.
10. United States Army Corp of Engineers, “U.S. Waterway Data Vessel Entrances and Clearances” November 28, 2014 http://www.navigationdatacenter.us/data/dataclen.htm.
11. United States Army Corps of Engineers. Waterway Data, Dredging Information System. (http://www.navigationdatacenter.us/data/datadrgsel.htm), Last revised: November 28, 2015, U.S.
12. United States Bureau of Transportation Statistics. TranStats, 2014. http://www.transtats.bts.gov/homepage.asp.
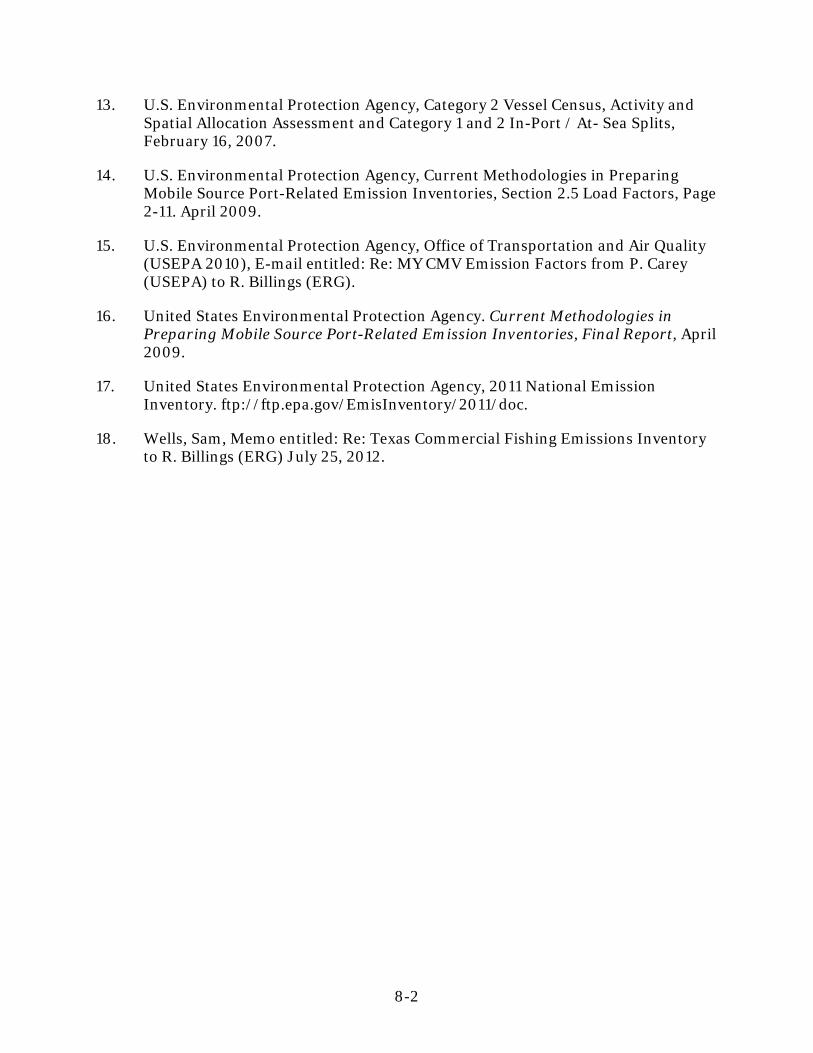
13. U.S. Environmental Protection Agency, Category 2 Vessel Census, Activity and Spatial Allocation Assessment and Category 1 and 2 In-Port / At- Sea Splits, February 16, 2007.
14. U.S. Environmental Protection Agency, Current Methodologies in Preparing Mobile Source Port-Related Emission Inventories, Section 2.5 Load Factors, Page 2-11. April 2009.
15. U.S. Environmental Protection Agency, Office of Transportation and Air Quality (USEPA 2010), E-mail entitled: Re: MY CMV Emission Factors from P. Carey (USEPA) to R. Billings (ERG).
16. United States Environmental Protection Agency. Current Methodologies in Preparing Mobile Source Port-Related Emission Inventories, Final Report, April 2009.
17. United States Environmental Protection Agency, 2011 National Emission Inventory. ftp://ftp.epa.gov/EmisInventory/2011/doc.
18. Wells, Sam, Memo entitled: Re: Texas Commercial Fishing Emissions Inventory to R. Billings (ERG) July 25, 2012.
A-1
Appendix A. CMV 2008 to 2040 Control Programs Year Programs Application Notes Source 2008 TERP Statewide Reduction by 1,632 tons this year
to various counties (listed in detail in the TERP table)
Tier II NOX reductions, ships constructed on or after Jan 1, 2011; n < 130: 14.4, n = 130-1999: 44·n(-0.23), n ≥ 2000: 7.7; n = engine's rated speed (rpm), units are g/kWh
Appendix A. CMV 2008 to 2040 Control Programs Year Programs Application Notes Source
MARPOL Annex VI - NOX reduction
In ECA only (North America excluding Mexico)
Tier III NOX reductions, ships constructed on or after Jan 1, 2016; n < 130: 3.4, n = 130-1999: 9·n(-0.2), n ≥ 2000: 2.0; n = engine's rated speed (rpm), units are g/kWh