ALASKA LNG PROJECT DOCKET NO. CP17-___-000 RESOURCE REPORT NO. 9 APPENDIX F – GAS TREATMENT PLANT AIR QUALITY MODELING REPORT DOC NO: USAI-PE-SRREG-00- 000009-000 DATE: APRIL 14, 2017 REVISION: 0 PUBLIC APPENDIX F GAS TREATMENT PLANT AIR QUALITY MODELING REPORT
Transcript
ALASKA LNG
PROJECT
DOCKET NO. CP17-___-000
RESOURCE REPORT NO. 9
APPENDIX F – GAS TREATMENT PLANT AIR
QUALITY MODELING REPORT
DOC NO: USAI-PE-SRREG-00-
000009-000
DATE: APRIL 14, 2017
REVISION: 0
PUBLIC
APPENDIX F GAS TREATMENT PLANT AIR QUALITY MODELING
REPORT
Public
GAS TREATMENT PLANT AIR QUALITY MODELING REPORT SUPPORTING
RESOURCE REPORT NO. 9
USAG-P1-SRZZZ-00-000001-000
Rev Date Rev ision Description Originator Rev iewer / Endorser
Response Code Approv er
0 11/7/15 Issued for Use A. Kieldsing
1 7-Oct-16 Issued for Use A. Kieldsing
Document Control No.
Country Facility Originator Discipline Type Sub-Type Location Sequence Identifier
US AG P1 S R ZZZ 00 000001 000
AIR QUALITY MODELING REPORT - GTP
USAG-P1-SRZZZ-00-000001-000 7-OCT-16
REVISION: 1
PUBLIC PAGE 2 OF 112
AUTHORIZATION
ENDORSED BY: DATE: SEPTEMBER 28, 2016 NAME: MIKE GRAY TITLE: AECOM PROGRAM MANAGER
REVIEW
REVIEWED BY: DATE: SEPTEMBER 28, 2016 NAME: TOM DAMIANA TITLE: AIR QUALITY ENGINEER
PREPARATION
PREPARED BY: DATE: SEPTEMBER 28, 2016 NAME: ADRIENNE KIELDSING TITLE: AIR QUALITY SCIENTIST
0 Global Draft to support initial review of Draft 2 of Resource Report No. 9
0A Global Release for additional review
AIR QUALITY MODELING REPORT - GTP
USAG-P1-SRZZZ-00-000001-000 7-OCT-16
REVISION: 1
PUBLIC PAGE 4 OF 112
TABLE OF CONTENTS 1.0 INTRODUCTION .............................................................................................................9
1.1 FACILITY DESCRIPTION ............................................................................................9 2.0 APPLICABLE AIR QUALITY STANDARDS AND EVALUATION CRITERIA ......................... 13
2.1 FEDERAL AND STATE AMBIENT AIR QUALITY STANDARDS............................................... 13 2.2 PSD CLASS I AND II INCREMENTS ............................................................................ 15 2.3 AIR QUALITY RELATED VALUES................................................................................ 16
2.3.1 Plume Impairment ................................................................................... 16 2.3.2 Regional Haze ........................................................................................ 16 2.3.3 Acid Deposition....................................................................................... 17 2.3.4 Class I and Sensitive Class II Areas for Air Quality Analysis........................... 18
3.0 BACKGROUND AIR QUALITY ....................................................................................... 20 3.1 AMBIENT DATA FOR BACKGROUND DEVELOPMENT ....................................................... 20 3.2 1-HOUR NO2 BACKGROUND DEVELOPMENT ............................................................... 20
5.1 MODEL SELECTION ............................................................................................... 49 5.2 MODEL OPTIONS .................................................................................................. 49 5.3 METEOROLOGICAL DATA ........................................................................................ 49
5.3.1 Surface Data .......................................................................................... 50 5.3.2 Upper Air Data........................................................................................ 50 5.3.3 Surface Characteristics ............................................................................ 51 5.3.4 Use of Vertical Wind Speed Standard Deviation (sigma-w) Measurements....... 51
5.4 RECEPTORS........................................................................................................ 55 5.5 ELEVATION DATA ................................................................................................. 55 5.6 BUILDING DOWNWASH AND STACK HEIGHT ................................................................. 56 5.7 NO2 MODELING APPROACH.................................................................................... 61 5.8 SHORELINE FUMIGATION ........................................................................................ 62
6.0 SENSITIVE CLASS II AREA MODELING METHODOLOGY ............................................... 64
6.1 MODEL SELECTION ............................................................................................... 64 6.2 MODEL INPUTS .................................................................................................... 64
AIR QUALITY MODELING REPORT - GTP
USAG-P1-SRZZZ-00-000001-000 7-OCT-16
REVISION: 1
PUBLIC PAGE 5 OF 112
6.3 MODEL OPTIONS .................................................................................................. 64 6.4 MODELING DOMAIN............................................................................................... 65 6.5 OZONE AND AMMONIA DATA ................................................................................... 65 6.6 VISIBILITY MODELING APPROACH ............................................................................. 68
8.3 A DESCRIPTION OF REGIONAL OZONE AND PM2.5 PRECURSOR EMISSIONS ........................ 92 8.3.1 Back trajectories analysis on days with elevated ozone concentrations............ 93 8.3.2 Back trajectories analysis on days with elevated PM2.5 concentrations ............ 93
8.4 OZONE AND PM2.5 ASSESSMENT.............................................................................. 98 8.4.1 Regional Modeling .................................................................................. 98 8.4.2 Analysis of the Contribution of GTP Emissions ............................................ 99
AIR QUALITY MODELING REPORT - GTP
USAG-P1-SRZZZ-00-000001-000 7-OCT-16
REVISION: 1
PUBLIC PAGE 6 OF 112
8.5 SUMMARY OF GTP OZONE AND SECONDARY PM2.5 IMPACTS........................................ 103 9.0 ACRONYMS AND TERMS ........................................................................................... 104 10.0 REFERENCES............................................................................................................ 107 11.0 APPENDICES............................................................................................................. 112
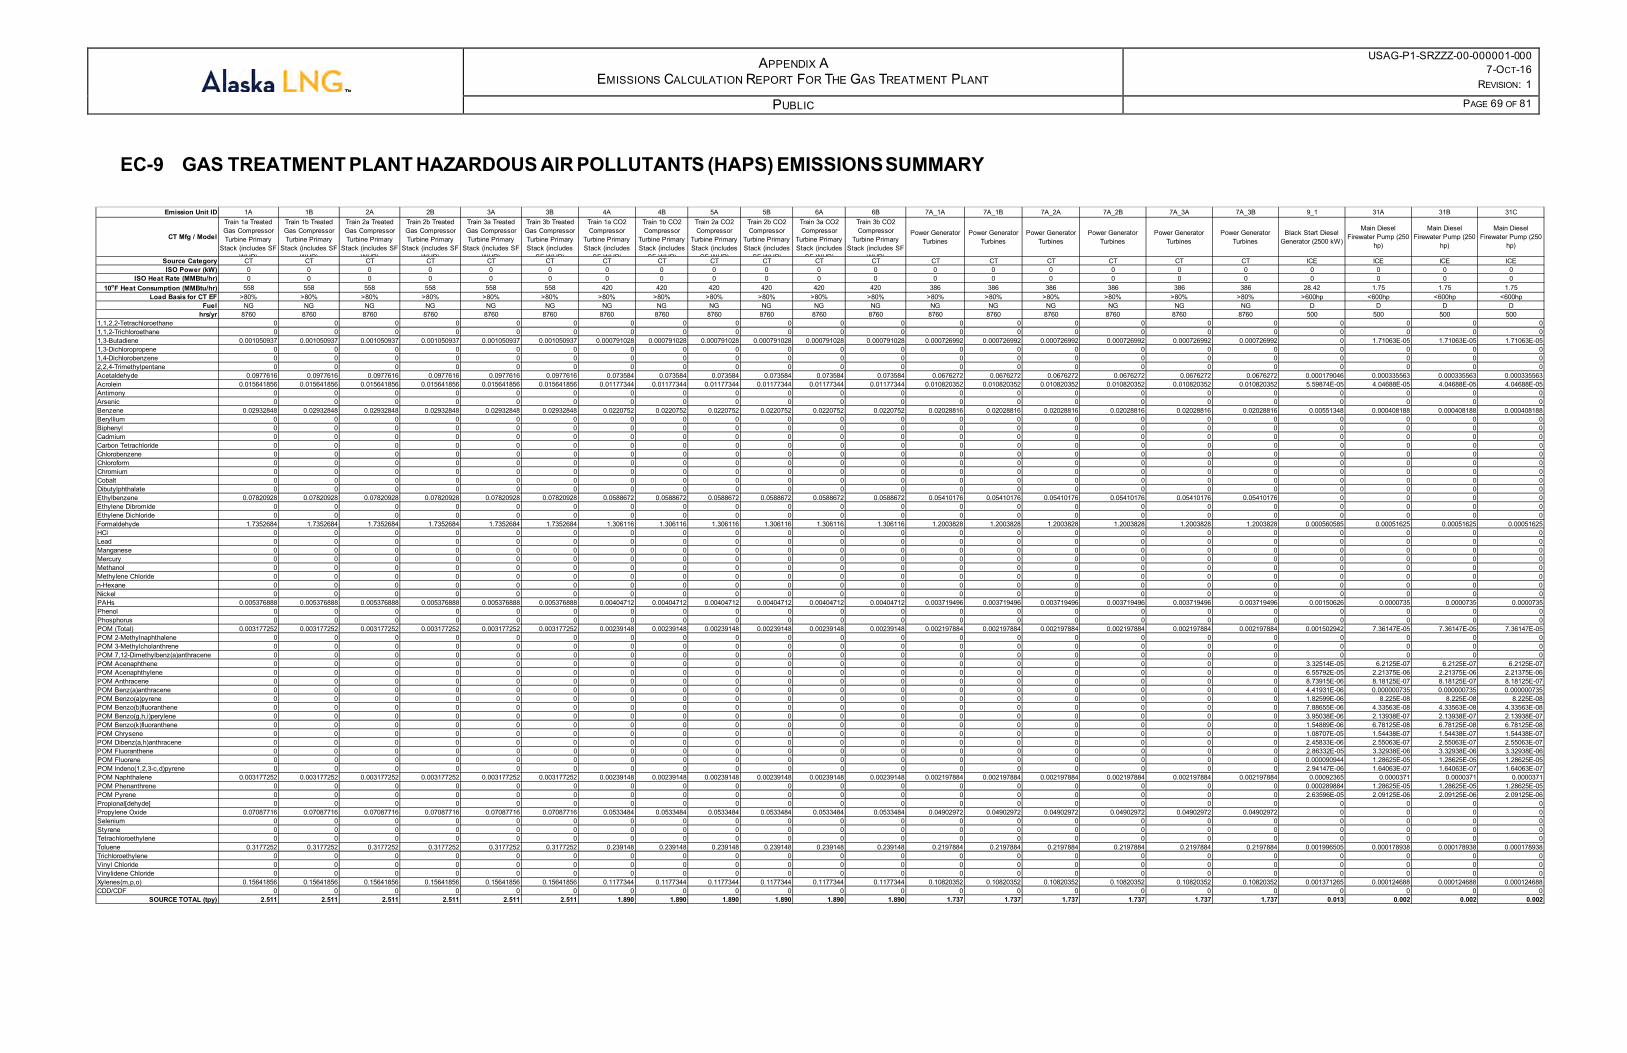
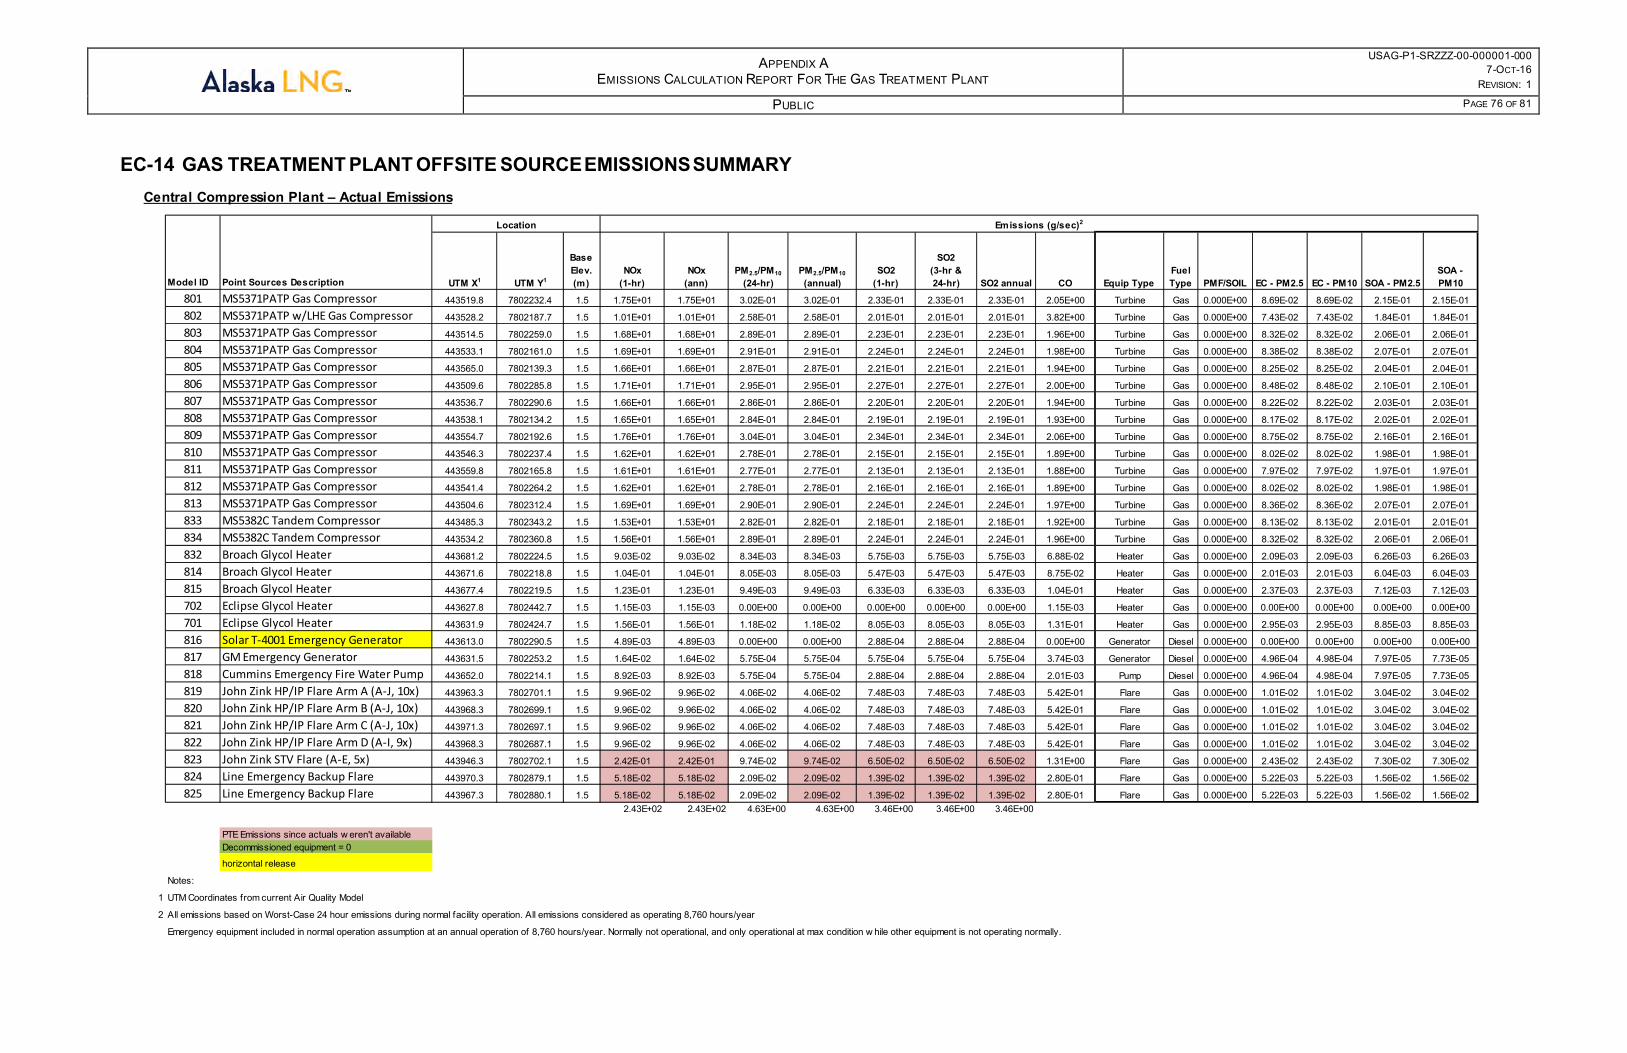
Appendix A – GTP Facility Air Emissions Inventory
AIR QUALITY MODELING REPORT - GTP
USAG-P1-SRZZZ-00-000001-000 7-OCT-16
REVISION: 1
PUBLIC PAGE 7 OF 112
LIST OF FIGURES Figure 1-1: Locations of Existing CCP and CGF Facilities and the Proposed GTP Facility ............ 11 Figure 1-2: Proposed GTP Site Plan.......................................................................................... 12 Figure 2-1: GTP Facility and Nearby Sensitive Class II Areas ..................................................... 19 Figure 3-1: Locations of Meteorological and Ambient Air Monitoring Stations............................. 23 Figure 3-2: Relationship between NO2 Concentrations and Wind Speed Measured at the A-Pad
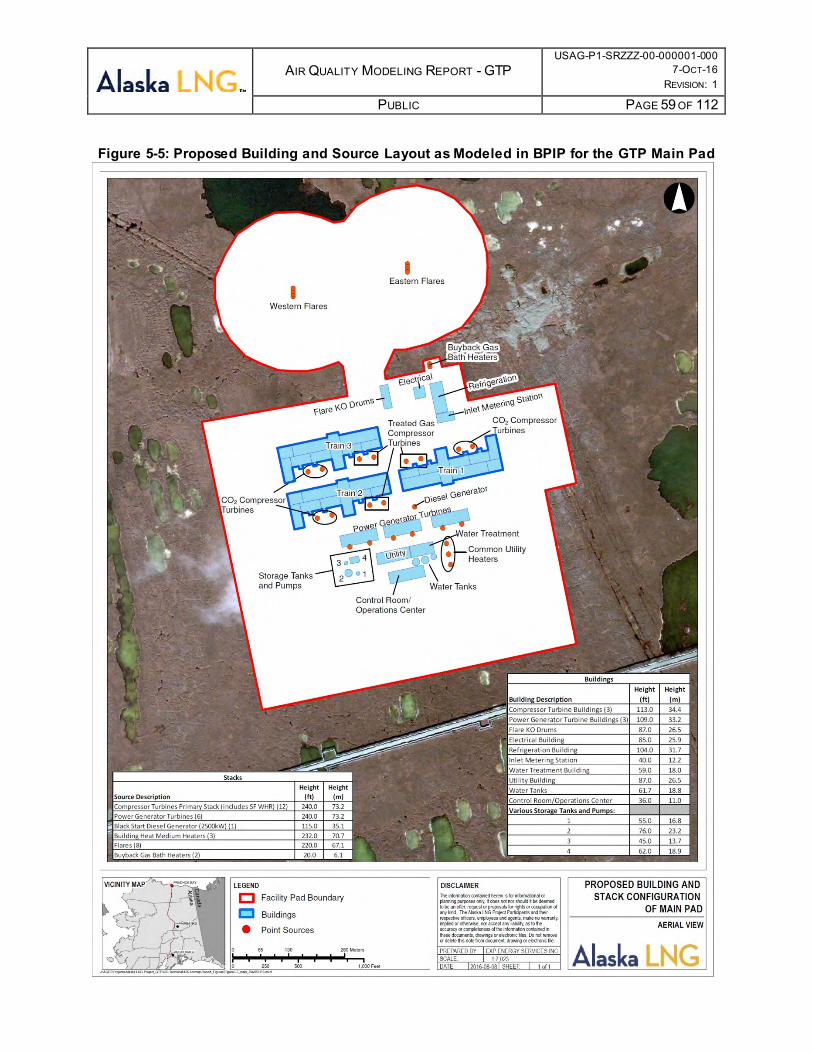
Monitoring Station from 2009 through 2013 ....................................................................... 24 Figure 4-1: Locations of Far-Field Existing and Reasonable Foreseeable Development Sources .. 47 Figure 5-1: Wind Rose of the A-Pad Meteorological Input Data ................................................... 53 Figure 5-2: Land Cover Surrounding the A-Pad and Betty Pingo Monitoring Locations................ 54 Figure 5-3: Near-Field Receptor Grid and Ambient Air Quality Boundary .................................... 57 Figure 5-4: Far-Field Receptor Grid .......................................................................................... 58 Figure 5-5: Proposed Building and Source Layout as Modeled in BPIP for the GTP Main Pad ...... 59 Figure 5-6: Proposed Building and Source Layout as Modeled in BPIP for the GTP Camp Pad ..... 60 60 Figure 6-1: Far-Field Modeling Domain ..................................................................................... 70 Figure 7-1: Locations of Cumulative Visibility Impacts above the 10% Visibility Screening
Threshold........................................................................................................................ 86 Figure 8-1: 72 Hour Back trajectories Arriving at the Project Location at (70.317N, 148.557 W)
March 21, 2011 ................................................................................................................ 94 Figure 8-2: 72 hour Back Trajectories Arriving at the Project Location at (70.317N, 148.557 W) April
23, 2013 .......................................................................................................................... 95 Figure 8-3: 72 Hour Back trajectories Arriving at the Project Location at (70.317N, 148.557 W) July
11, 2012 .......................................................................................................................... 96 Figure 8-4: 72 hour Back Trajectories Arriving at the Project Location at (70.317N, 148.557 W) April
28, 2013 .......................................................................................................................... 97 Figure 8-5: Relationship Between the Change in Daily Maximum 8-Hour Average O3 and Change in
NOx Precursor Emissions (TPY) (Baker et al. 2016) .......................................................... 101
LIST OF TABLES Table 2-1: Ambient Air Quality Standards in the Project Vicinity................................................. 14 Table 2-2: PSD Class I and Class II Increments.......................................................................... 15 Table 2-3: Plume Impairment Initial Screening Thresholds ......................................................... 16 Table 2-4: Regional Haze Initial Screening Thresholds............................................................... 17 Table 2-5: Deposition Analysis Thresholds ............................................................................... 18 Table 2-6: Class I and Sensitive Class II Areas included in AQRV Evaluation .............................. 18 Table 3-1: Background Air Quality Data in the Project Vicinity of the GTP ................................... 22 Table 3-2: 1-Hour NO2 Background Varying by Wind Speed ....................................................... 24 Table 4-1: Equipment to be Installed at GTP.............................................................................. 25 Table 4-2: List of Equipment Included in Modeled and Non-Modeled Operational Scenarios ........ 27 Table 4-3: Modeled GTP Source Emissions............................................................................... 32
AIR QUALITY MODELING REPORT - GTP
USAG-P1-SRZZZ-00-000001-000 7-OCT-16
REVISION: 1
PUBLIC PAGE 8 OF 112
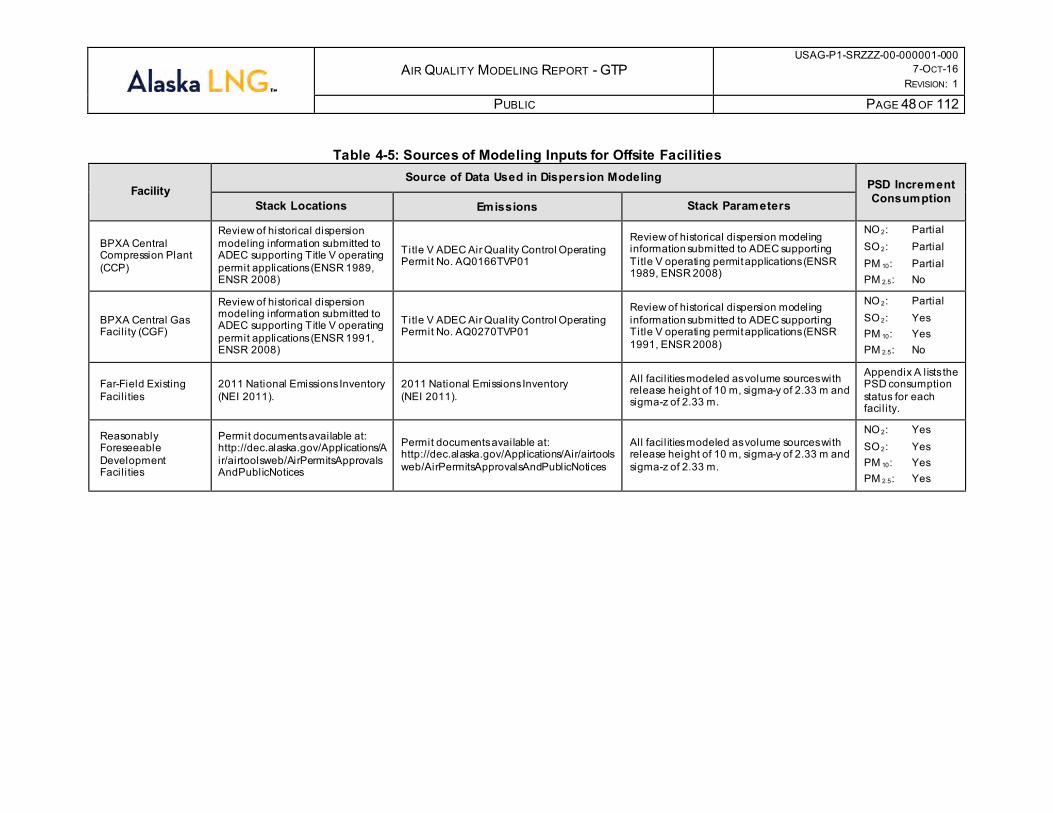
Table 4-4: Modeled GTP Source Physical Parameters ................................................................ 36 Table 4-5: Sources of Modeling Inputs for Offsite Facilities........................................................ 48 Table 5-1: Meteorological Input Data Percent Missing Hours after Processing with AERMET ....... 50 Table 5-2: ADEC Approved Surface Characteristics for the North Slope Coastal Plain ................. 51 Table 6-1: Summary of Ambient Ammonia Levels Literature Review........................................... 67 Table 6-2: 30-Year (1981-2010) Climatological Normal Temperatures in degrees Fahrenheit......... 67 Table 6-3: Proposed Ambient Ammonia Background Concentrations for Use in CALPUFF .......... 68 Table 7-1: GTP Facility-Only NAAQS/AAAQS Air Quality Compliance Analysis – Normal
Operations ...................................................................................................................... 72 Table 7-2: Comparison of GTP-Only Model-Predicted Concentrations to Increment Thresholds –
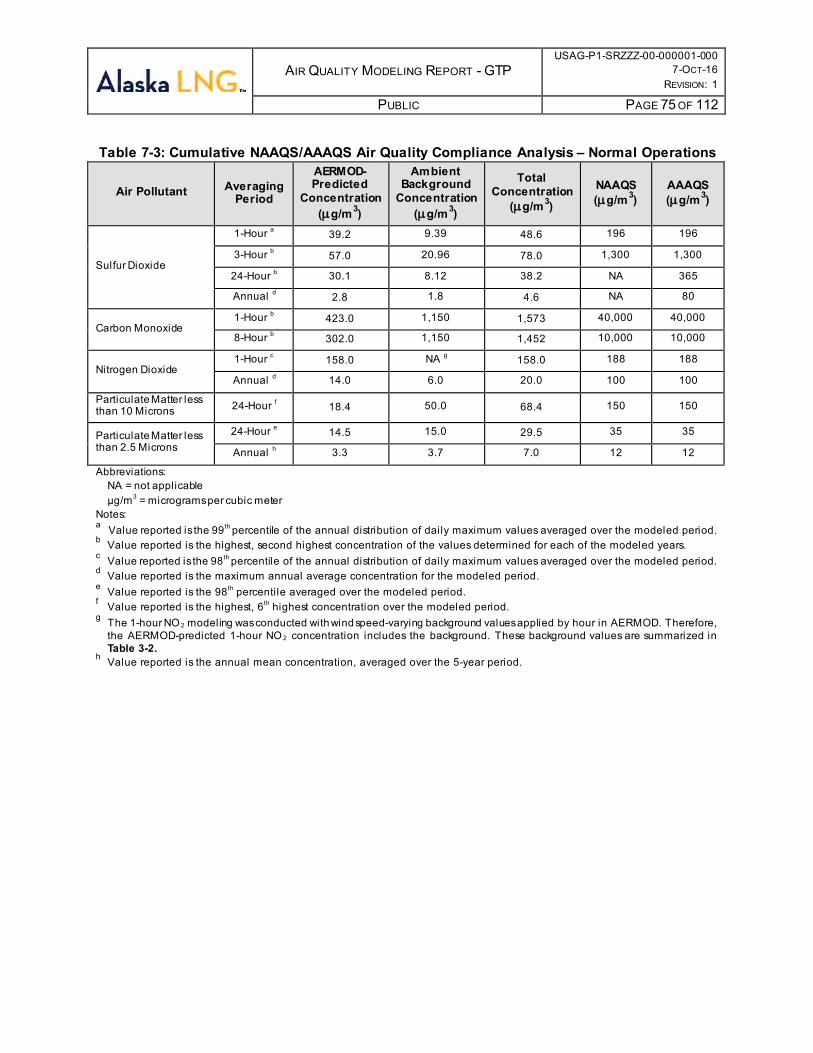
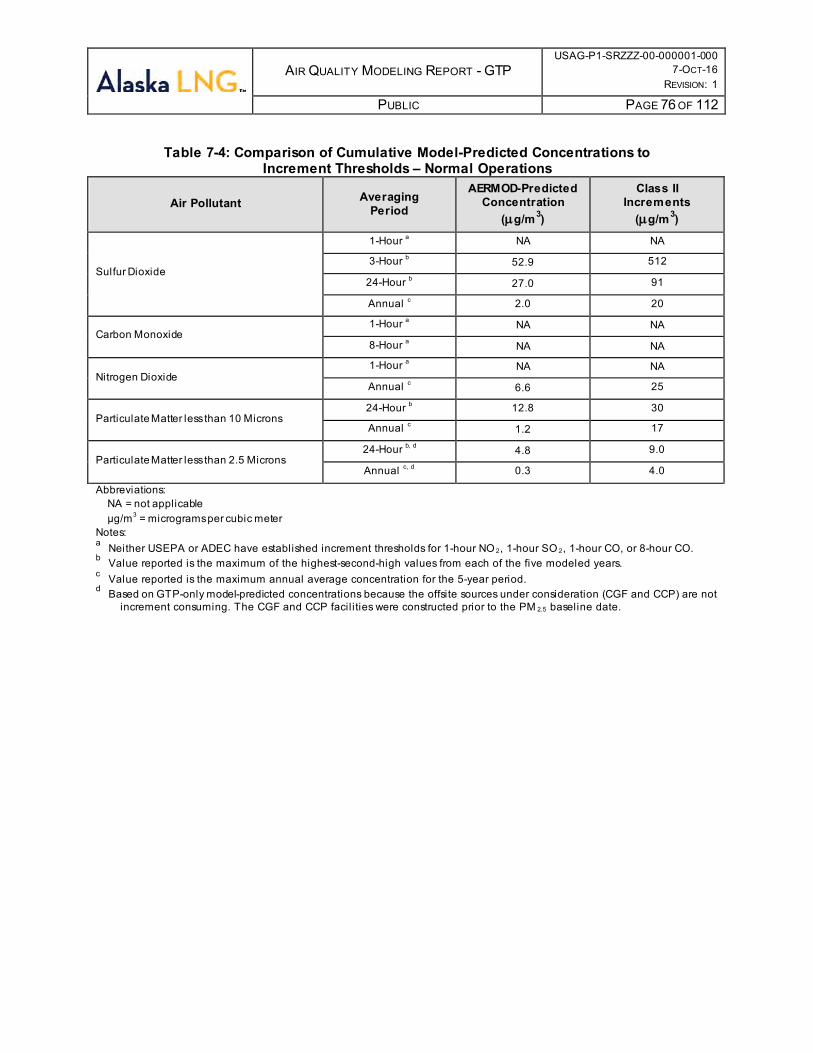
Normal Operations .......................................................................................................... 73 Table 7-3: Cumulative NAAQS/AAAQS Air Quality Compliance Analysis – Normal Operations ..... 75 Table 7-4: Comparison of Cumulative Model-Predicted Concentrations to Increment Thresholds –
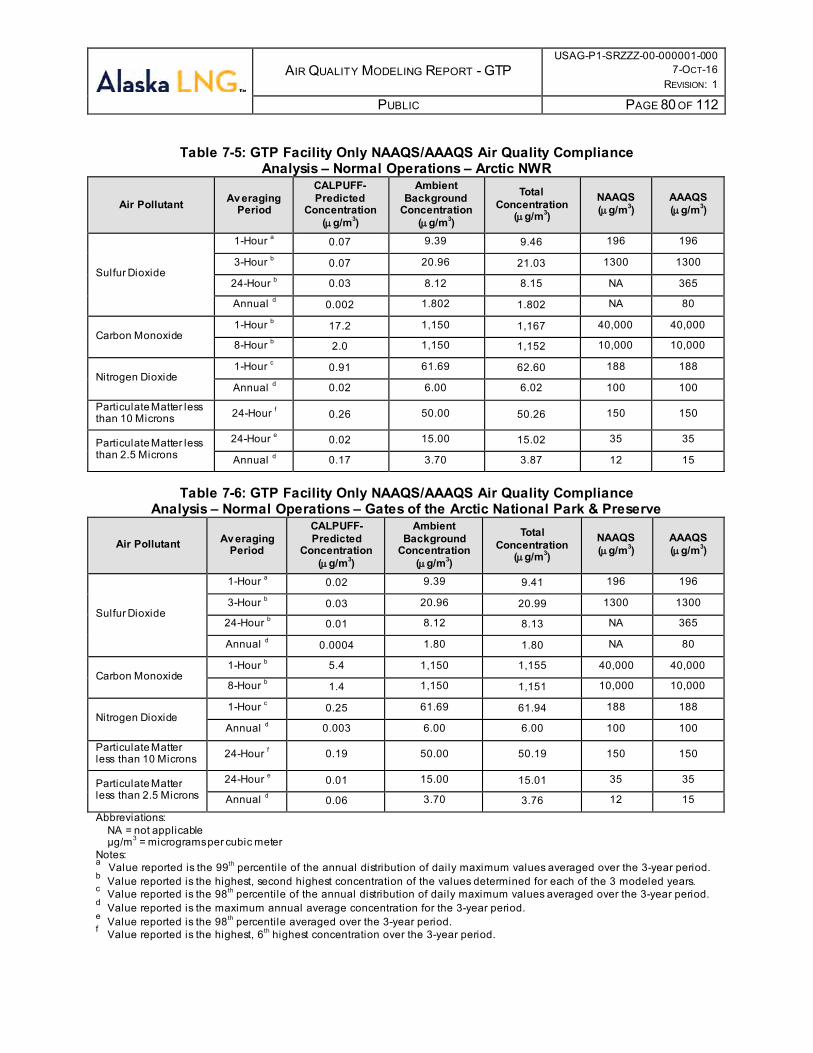
Normal Operations .......................................................................................................... 76 Table 7-5: GTP Facility Only NAAQS/AAAQS Air Quality Compliance Analysis – Normal Operations
– Arctic NWR ................................................................................................................... 80 Table 7-6: GTP Facility Only NAAQS/AAAQS Air Quality Compliance Analysis – Normal Operations
– Gates of the Arctic National Park & Preserve .................................................................. 80 Table 7-7: Comparison of GTP Facility Only Model Predicted Concentrations to Increment
Thresholds – Arctic NWR ................................................................................................. 81 Table 7-8: Comparison of GTP Facility Only Model Predicted Concentrations to Increment
Thresholds – Gates of the Arctic National Park & Preserve ................................................ 81 Table 7-9: Cumulative NAAQS/AAAQS Air Quality Compliance Analysis – Normal Operations
Scenario – Arctic NWR ..................................................................................................... 82 Table 7-10: Cumulative NAAQS/AAAQS Air Quality Compliance Analysis – Normal Operations
Scenario – Gates of the Arctic National Park & Preserve .................................................... 82 Table 7-11: Comparison of Cumulative Model Predicted Concentrations to Increment Thresholds –
Arctic NWR ..................................................................................................................... 83 Table 7-12: Comparison of Cumulative Model Predicted Concentrations to Increment Thresholds –
Gates of the Arctic National Park & Preserve ..................................................................... 83 Table 7-13: GTP-Only Regional Haze Results ............................................................................ 84 Table 7-14: Cumulative Regional Haze Results.......................................................................... 84 Table 7-15: Regional Haze Results for Offsite Existing and RFD Sources Only ............................ 84 Table 7-16: GTP-Only Sulfur Deposition Results ....................................................................... 85 Table 7-17: GTP-Only Nitrogen Deposition Results.................................................................... 85 Table 7-18: Cumulative Nitrogen Deposition Results ................................................................. 85 Table 8-1: Anthropogenic Emissions in the North Slope Borough .............................................. 92 Table 8-2: Compilation of 8-Hour Ozone Impacts (ppbv) from NOx Emissions (TPY) Reported in
Literature (Baker et al. 2016) ........................................................................................... 102
AIR QUALITY MODELING REPORT - GTP
USAG-P1-SRZZZ-00-000001-000 7-OCT-16
REVISION: 1
PUBLIC PAGE 9 OF 112
1.0 INTRODUCTION The Alaska Gasline Development Corporation (AGDC), BP Alaska LNG LLC, ConocoPhillips Alaska LNG Company, and ExxonMobil Alaska LNG LLC (EMALL), (Applicants) plan to construct one integrated liquefied natural gas (LNG) Project (Project) with interdependent facilities for the purpose of liquefying supplies of natural gas from Alaska. This Project includes a gas treatment plant (GTP) located on the North Slope. The GTP is the focus of this document.
As required by the Federal Energy Regulatory Commission (FERC) regulations, air dispersion modeling was utilized as a tool to demonstrate that the proposed GTP would comply with the National Ambient Air Quality Standards (NAAQS) and Alaska Ambient Air Quality Standards (AAAQS).
The purposes of this FERC Air Quality Modeling Report (Report) are to 1) outline the methodologies, assumptions, and input data used to conduct the air dispersion modeling analysis, and 2) provide the modeling analysis results to support discussions in Resource Report No. 9. The methodologies outlined are generally consistent with:
• USEPA’s Guideline on Air Quality Models, (“Modeling Guideline”) (40 CFR Part 51 Appendix W) (USEPA 2005),
• User’s Guide for the AMS/EPA Regulatory Model (AERMOD) (USEPA 2004, 2007, 2015a),
• User’s Guide for the AERMOD Terrain Preprocessor (AERMAP) (USEPA 2009a). • Interagency Workgroup on Air Quality Modeling (IWAQM) Phase I Report: Interim
Recommendation for Modeling Long Range Transport and Impacts on Regional Visibility. (IWAQM 1993),
• Interagency Workgroup on Air Quality Modeling (IWAQM) Phase 2 Summary Report and Recommendations for Modeling Long-Range Transport Impacts (IWAQM 1998).
• Federal Land Managers’ Air Quality Related Values Work Group (FLAG): Phase I Report (USDOI 2010), and
• Alaska Department of Environmental Conservation’s (ADEC) Modeling Review Procedures Manual (ADEC 2013).
Note that this report is written to address elements required by FERC for an air quality impact analysis as it relates to the National Environmental Policy Act (NEPA). Air quality impact analyses using dispersion modeling required by USEPA for a Prevention of Significant Deterioration analysis as it relates to the Clean Air Act (CAA) are generally a subset of those required for a FERC analysis.
1.1 FACILITY DESCRIPTION The GTP is designed to treat natural gas received from the Prudhoe Bay Unit (PBU) and Point Thomson Unit (PTU). The GTP would be constructed on the North Slope near the Beaufort Sea coast. The facility would be located in the PBU, which is located on State land within the North Slope Borough and is designated for oil and gas development. The GTP would process PBU and PTU gas into natural gas that exceeds pipeline quality gas; however, pipeline quality gas limits were used for this analysis as an upper limit. This gas would be shipped by pipeline to southeast Alaska on the Kenai Peninsula. Among other things processing includes removing CO2, H2S, and water (dehydration). The proposed design of GTP would have an average stream day inlet natural gas treating capacity of 3.7 BSCF/D (excluding planned/unplanned downtime) and a 3.9 BSCF/D peak capacity. GTP would be able to accommodate varying compositions of natural gas received from the PBU and PTU.
AIR QUALITY MODELING REPORT - GTP
USAG-P1-SRZZZ-00-000001-000 7-OCT-16
REVISION: 1
PUBLIC PAGE 10 OF 112
Because of its proximity to existing gas gathering infrastructure, the GTP is being sited west of Prudhoe Bay, 630 meters (2,070 feet) to the west-southwest of the existing BP Exploration (Alaska), Inc. (BPXA), Central Compression Plant (CCP), and the Central Gas Facility (CGF) as shown in Figure 1-1. The layout of the GTP facility was evaluated for all phases of the Project, as it relates to safety, accessibility (Emergency, Constructability, and Maintenance), plot space requirement, schedule, and execution certainty. The facility is restricted to the south by an existing road and pipeline corridor. The facility becomes limited to the north and west by existing bodies of water, where efforts are taken to minimize the impact to those bodies of water.
The GTP facility is comprised of a “main” pad where the natural gas would be treated and a “camp” pad which would house the workers. Building the GTP facility on gravel pads would protect the tundra and permafrost. Figure 1-2 shows a plot plan of the facility. The following types of emission units would be part of the GTP design:
• gas-fired turbines for power generation and compression, • gas-fired heaters for process heat and to heat fuel gas received from the sales pipeline, • flares for emergency control of excess gas, • diesel fuel-fired reciprocating internal combustion engines for back-up power generation, and • diesel fuel-fired fire water pumps for supplying water in case of fire.
AIR QUALITY MODELING REPORT - GTP
USAG-P1-SRZZZ-00-000001-000 7-OCT-16
REVISION: 1
PUBLIC PAGE 11 OF 112
Figure 1-1: Locations of Existing CCP and CGF Facilities and the Proposed GTP Facility
AIR QUALITY MODELING REPORT - GTP
USAG-P1-SRZZZ-00-000001-000 7-OCT-16
REVISION: 1
PUBLIC PAGE 12 OF 112
Figure 1-2: Proposed GTP Site Plan
AIR QUALITY MODELING REPORT - GTP
USAG-P1-SRZZZ-00-000001-000 7-OCT-16
REVISION: 1
PUBLIC PAGE 13 OF 112
2.0 APPLICABLE AIR QUALITY STANDARDS AND EVALUATION CRITERIA Federal and state air emissions regulations are designed to ensure that new sources do not cause or contribute to an exceedance of ambient standards for criteria air pollutants. The criteria pollutants are as follows:
• Sulfur dioxide (SO2); • Carbon monoxide (CO); • Nitrogen dioxide (NO2); • Ozone (O3); • Particulate matter having an aerodynamic diameter of 10 microns or less (PM10); • Particulate matter having an aerodynamic diameter of 2.5 microns or less (PM2.5); and • Lead (Pb). As a major source, as defined under federal New Source Review (NSR) regulations, the GTP would be required to demonstrate by modeling that the cumulative ambient impacts would conform to established regulatory criteria for those pollutants that are emitted above the Significant Emission Rate as defined in 40 CFR 52.21(b)(23)(i). These criteria are described in the following subsections.
2.1 FEDERAL AND STATE AMBIENT AIR QUALITY STANDARDS The U.S. Environmental Protection Agency (USEPA) has established NAAQS for these seven pollutants. The NAAQS are set at levels the USEPA believes are necessary to protect public health (primary standards) and welfare (secondary standards).
The ADEC has established similar ambient air quality standards referred to as AAAQS. AAAQS are similar to the federal NAAQS for criteria pollutants, except that ADEC has yet to remove the 24-hour and annual standards for SO2 and revise the ozone standard. ADEC also has an eight hour AAAQS for ammonia. Table 2-1 lists both the federal and state ambient air quality standards.
The federal Clean Air Act (CAA) requires geographic areas that do not meet a particular NAAQS to be designated as “non-attainment” for that individual standard. Other areas can be designated as “in attainment” if data show that the area meets the standard, as “unclassified,” or as “unclassified/attainment” with respect to the standards. An area may also be designated as a “maintenance” area if it has previously been in non-attainment for a pollutant but has since implemented a State Implementation Plan (SIP) that has brought the area back into attainment for the pollutant.
Alaska has one non-attainment area and four maintenance areas (ADEC 2015, USEPA 2014a, and 40 C.F.R 81.302). The area surrounding the GTP is currently designated as attainment or unclassified for all criteria pollutants.
AIR QUALITY MODELING REPORT - GTP
USAG-P1-SRZZZ-00-000001-000 7-OCT-16
REVISION: 1
PUBLIC PAGE 14 OF 112
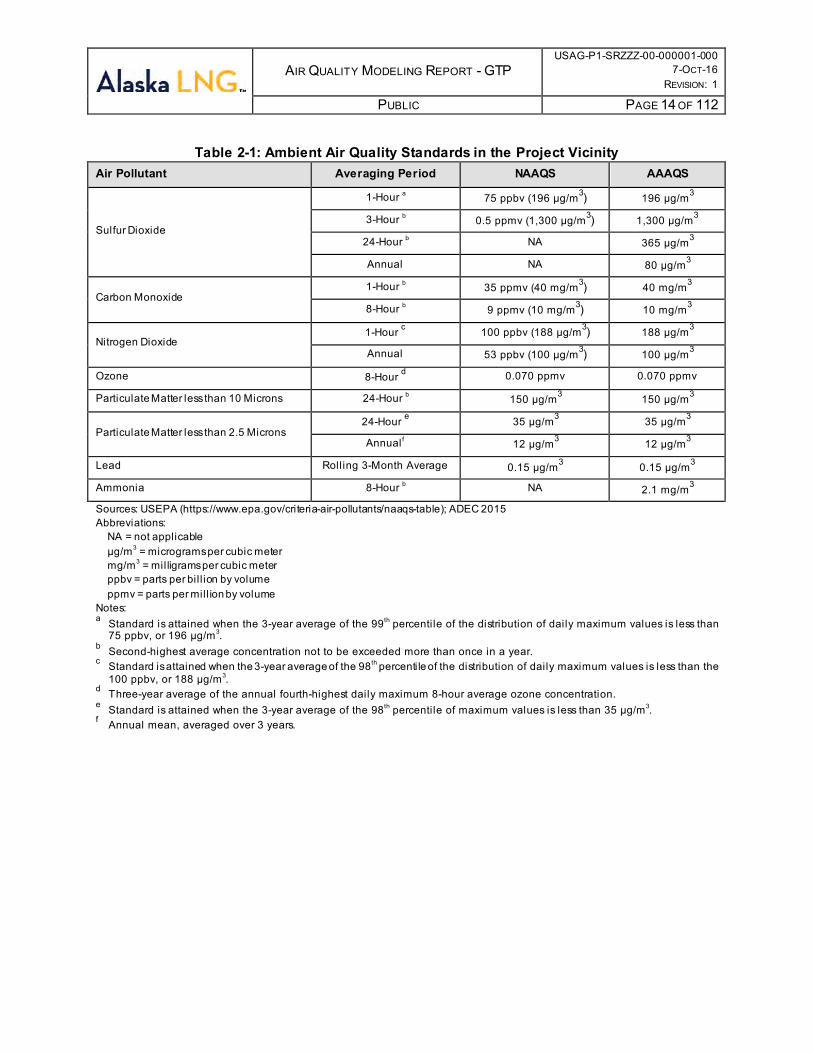
Table 2-1: Ambient Air Quality Standards in the Project Vicinity Air Pollutant Averaging Period NAAQS AAAQS
Sulfur Dioxide
1-Hour a 75 ppbv (196 µg/m3) 196 µg/m3
3-Hour b 0.5 ppmv (1,300 µg/m3) 1,300 µg/m3
24-Hour b NA 365 µg/m3
Annual NA 80 µg/m3
Carbon Monoxide 1-Hour b 35 ppmv (40 mg/m3) 40 mg/m3
8-Hour b 9 ppmv (10 mg/m3) 10 mg/m3
Nitrogen Dioxide 1-Hour c 100 ppbv (188 µg/m3) 188 µg/m3
Annual 53 ppbv (100 µg/m3) 100 µg/m3
Ozone 8-Hour d 0.070 ppmv 0.070 ppmv
Particulate Matter less than 10 Microns 24-Hour b 150 µg/m3 150 µg/m3
Particulate Matter less than 2.5 Microns 24-Hour e 35 µg/m3 35 µg/m3
Annualf 12 µg/m3 12 µg/m3
Lead Rolling 3-Month Average 0.15 µg/m3 0.15 µg/m3
NA = not applicable µg/m3 = micrograms per cubic meter mg/m3 = milligrams per cubic meter ppbv = parts per bil l ion by volume ppmv = parts per mill ion by volume
Notes: a Standard is attained when the 3-year average of the 99th percentile of the distribution of daily maximum values is less than
75 ppbv, or 196 µg/m3. b Second-highest average concentration not to be exceeded more than once in a year. c Standard is attained when the 3-year average of the 98th percentile of the distribution of daily maximum values is less than the
100 ppbv, or 188 µg/m3. d Three-year average of the annual fourth-highest daily maximum 8-hour average ozone concentration. e Standard is attained when the 3-year average of the 98th percentile of maximum values is less than 35 µg/m3. f Annual mean, averaged over 3 years.
AIR QUALITY MODELING REPORT - GTP
USAG-P1-SRZZZ-00-000001-000 7-OCT-16
REVISION: 1
PUBLIC PAGE 15 OF 112
2.2 PSD CLASS I AND II INCREMENTS In addition to the NAAQS and AAAQS, air quality is regulated by the CAA through the Prevention of Significant Deterioration (PSD) rules implemented in 40 CFR 52.21 and in 18 AAC 50.306. These regulations limit the future increases in ambient air concentrations of NO2, SO2, PM10, and PM2.5 and establish “minor source baseline dates” for determining the date after which the air quality deterioration must be within the “PSD Increments” to the extent that the NAAQS are not exceeded. Applicable Increments are shown in Table 2-2. While the current dispersion modeling analysis is not in support of a PSD permitting, FERC guidance for the preparation of Resource Report No. 9, Air and Noise Quality, requires evidence of a project’s ability to obtain required permits. In the case of the Project, this means demonstrating that the GTP can satisfy the source impact analysis requirements of the PSD review. As such, the dispersion modeling analysis also compared cumulative impacts to PSD Increments for informational purposes.
Table 2-2: PSD Class I and Class II Increments
Pollutant Av eraging Period
PSD Class I Increments (µg/m3)
PSD Class II Increments (µg/m3)
Sulfur Dioxide
1-hour NA NA
3-hour b 25 512
24-hour b 5 91
Annual a 2 20
Carbon Monoxide
1-hour NA NA
8-hour NA NA
Nitrogen Dioxide
1-hour NA NA
Annual a 2.5 25
Particulate Matter less than 10 Microns
24-hour b 8 30
Annual a 4 17
Particulate Matter less than 2.5 Microns
24-hour b 2 9
Annual a 1 4
Lead 3-month roll ing average NA NA
Abbreviations: NA = not applicable Notes: a Never to be exceeded. b Not to be exceeded more than once per year.
AIR QUALITY MODELING REPORT - GTP
USAG-P1-SRZZZ-00-000001-000 7-OCT-16
REVISION: 1
PUBLIC PAGE 16 OF 112
2.3 AIR QUALITY RELATED VALUES Air Quality Related Values (AQRVs) are resources, as defined by Federal Land Managers (FLMs), that may be adversely affected by a change in air quality, and include visibility (either regional haze or plume impairment) and sulfur and nitrogen deposition. The FLMs’ AQRV Work Group (FLAG) issued a guidance document (FLAG 2010) for the methodology and AQRV criteria used to evaluate adverse impacts. This guidance and associated screening thresholds were developed for Class I areas.
At the request of the FLMs, additional Class II areas deemed “sensitive” were also evaluated against Class I thresholds. Note that whether these Class II areas are in the near-field (within approximately 50 kilometers) or the far-field (beyond approximately 50 kilometers) changes the applicable model and AQRVs to evaluate, as in the case of visibility.
Because the AQRVs only have screening thresholds below which no concern exists, rather than regulatory standards, AQRV impacts are typically evaluated on a case-by-case basis by FLMs. As part of the impact evaluation, the FLMs consider such factors as magnitude, frequency, duration, location, geographic extent, timing of impacts and current and projected conditions of AQRVs. In practice, this methodology often results in the need to place AQRV impacts into context.
Plume Impairment 2.3.1Plume impairment is generally defined as the pollutant loading of a portion of the atmosphere such that it becomes visible, by contrast or color difference, against a viewed background such as a landscape feature or the sky. The evaluation criteria for plume impairment are the color difference index (ΔE) and plume contrast (│C│). Plume impairment below the values in Table 2-3 are considered negligible and no further analysis is warranted. This AQRV is generally applicable for near-field (approximately less than 50 kilometers) source-receptor distances and modeled using the VISCREEN screening model or the PLUVUE II model if more information is required.
According to FLAG 2010, if the screening thresholds are met with VISCREEN, the FLM is likely not to object to the project on the basis of near-field visibility. If screening thresholds are not met, then use of the more refined PLUVUE II model can be implemented. The PLUVUE analysis provides additional information designed to assess the magnitude and frequency of plume impairment.
Regional Haze 2.3.2Visibility impairment is also manifested by the general alteration in the appearance of landscape features or the sky as the light between the observer and target becomes scattered or absorbed by pollutant loading in the atmosphere. This impairment results in a reduction of contrast between distant landscape features causing features within the landscape to disappear from the view. This AQRV is generally applicable for far-field (greater than approximately 50 kilometers) source-receptor distances or for multiple source analyses. CALPUFF is currently the recommended
AIR QUALITY MODELING REPORT - GTP
USAG-P1-SRZZZ-00-000001-000 7-OCT-16
REVISION: 1
PUBLIC PAGE 17 OF 112
model to assess regional haze impacts using methodologies and inputs described in FLAG 2010. The regional haze evaluation criteria are change in deciview and change in light extinction due to pollutant loading. As shown in Table 2-4, a 5% and 10% change in extinction is approximately equal to 0.5 and 1.0 delta deciview, respectively. The changes (in either metric) represent the incremental increases above a reference background level. According to FLAG 2010, if the 98th percentile change in light extinction is less than 5%, the visibility threshold of concern is not exceeded. Regional haze impacts due to project sources alone that are below this threshold are considered negligible and often no further analysis is warranted.
Cumulative regional haze impacts due to both project and offsite sources are typically compared to a 10% change in light extinction. If this threshold is exceeded at an area being evaluated, the FLM may consider the impacts on a case-by-case basis by taking into account the context when making an adverse impact determination.
Cause Visibil ity Impairment 1.0 10 1 The 98th percentile v alue of maximum modeled impacts, by y ear, f or each area of concern.
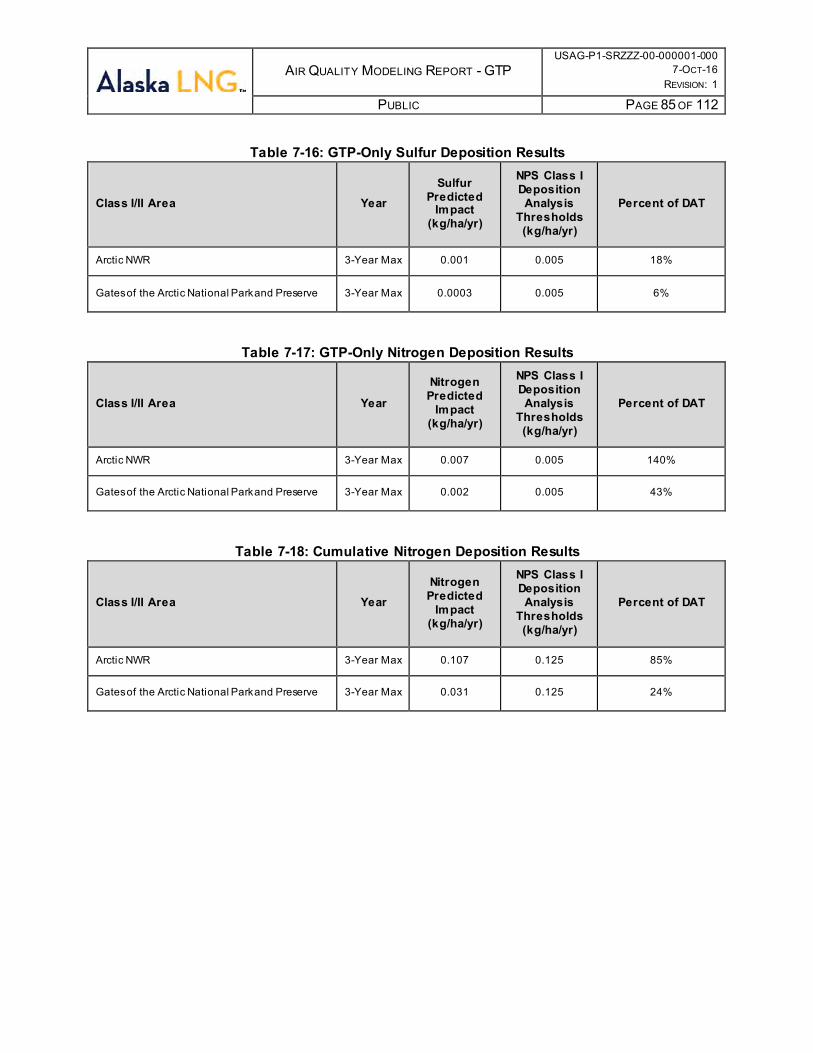
Acid Deposition 2.3.3Increased nitrogen (N) or sulfur (S) deposition may result from emissions from new facilities and have a negative impact on AQRVs sensitive to N or S deposition. Dry and wet atmospheric deposition of S and N compounds is also an AQRV that is discussed in FLAG 2010. FLMs have established Deposition Analysis Thresholds (DATs), listed in Table 2-5, to use as screening levels for incremental increases in S and N compounds due to project sources. Project deposition below DAT of 0.005 kg/ha/yr is considered negligible.
The N and S DAT of 0.005 kg/ha/yr for the western Class I areas is calculated as follows:
DAT = 0.25 kg/ha/yr x 0.5 x 0.04
Where: • 0.25 kg/ha/yr is the N and S western states natural background deposition
value,
• 0.5 is the variability factor, representing the maximum percentage of contribution by all combined anthropogenic sources to the conservative natural background value without triggering concerns regarding impacts, and
• 0.04 is the cumulative factor, representing a four percent safety factor to protect Class I areas from cumulative deposition impacts.
Consistent with FLAG guidance, the modeled deposition flux due to project sources alone was compared to the DAT of 0.005 kg/ha/yr. However, because project sources and offsite sources were explicitly modeled to evaluate cumulative deposition, it is overly conservative to include a four percent safety factor in the DAT. Therefore, the cumulative factor was removed from the DAT and the modeled cumulative deposition flux due to project and offsite sources was compared to a DAT of 0.125 kg/ha/yr (0.25 x 0.5). Table 2-5 summarizes the DATs that were used in the acid deposition evaluation.
AIR QUALITY MODELING REPORT - GTP
USAG-P1-SRZZZ-00-000001-000 7-OCT-16
REVISION: 1
PUBLIC PAGE 18 OF 112
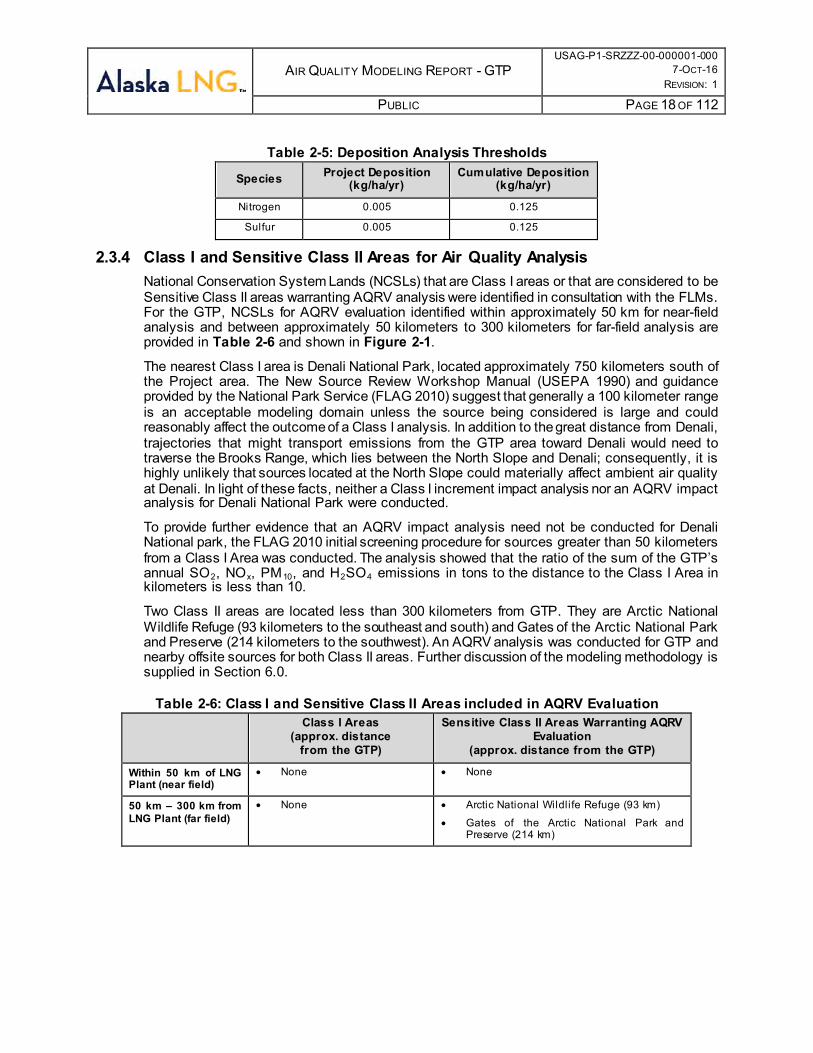
Table 2-5: Deposition Analysis Thresholds
Species Project Deposition (kg/ha/yr)
Cumulative Deposition (kg/ha/yr)
Nitrogen 0.005 0.125
Sulfur 0.005 0.125
Class I and Sensitive Class II Areas for Air Quality Analysis 2.3.4National Conservation System Lands (NCSLs) that are Class I areas or that are considered to be Sensitive Class II areas warranting AQRV analysis were identified in consultation with the FLMs. For the GTP, NCSLs for AQRV evaluation identified within approximately 50 km for near-field analysis and between approximately 50 kilometers to 300 kilometers for far-field analysis are provided in Table 2-6 and shown in Figure 2-1.
The nearest Class I area is Denali National Park, located approximately 750 kilometers south of the Project area. The New Source Review Workshop Manual (USEPA 1990) and guidance provided by the National Park Service (FLAG 2010) suggest that generally a 100 kilometer range is an acceptable modeling domain unless the source being considered is large and could reasonably affect the outcome of a Class I analysis. In addition to the great distance from Denali, trajectories that might transport emissions from the GTP area toward Denali would need to traverse the Brooks Range, which lies between the North Slope and Denali; consequently, it is highly unlikely that sources located at the North Slope could materially affect ambient air quality at Denali. In light of these facts, neither a Class I increment impact analysis nor an AQRV impact analysis for Denali National Park were conducted.
To provide further evidence that an AQRV impact analysis need not be conducted for Denali National park, the FLAG 2010 initial screening procedure for sources greater than 50 kilometers from a Class I Area was conducted. The analysis showed that the ratio of the sum of the GTP’s annual SO2, NOx, PM10, and H2SO4 emissions in tons to the distance to the Class I Area in kilometers is less than 10.
Two Class II areas are located less than 300 kilometers from GTP. They are Arctic National Wildlife Refuge (93 kilometers to the southeast and south) and Gates of the Arctic National Park and Preserve (214 kilometers to the southwest). An AQRV analysis was conducted for GTP and nearby offsite sources for both Class II areas. Further discussion of the modeling methodology is supplied in Section 6.0.
Table 2-6: Class I and Sensitive Class II Areas included in AQRV Evaluation Class I Areas
(approx. distance from the GTP)
Sensitive Class II Areas Warranting AQRV Evaluation
(approx. distance from the GTP)
Within 50 km of LNG Plant (near field)
• None • None
50 km – 300 km from LNG Plant (far field)
• None • Arctic National Wildlife Refuge (93 km)
• Gates of the Arctic National Park and Preserve (214 km)
AIR QUALITY MODELING REPORT - GTP
USAG-P1-SRZZZ-00-000001-000 7-OCT-16
REVISION: 1
PUBLIC PAGE 19 OF 112
Figure 2-1: GTP Facility and Nearby Sensitive Class II Areas
AIR QUALITY MODELING REPORT - GTP
USAG-P1-SRZZZ-00-000001-000 7-OCT-16
REVISION: 1
PUBLIC PAGE 20 OF 112
3.0 BACKGROUND AIR QUALITY In evaluating cumulative impacts of the GTP with respect to the NAAQS and AAAQS, the appropriate modeled impacts were added to representative ambient background concentrations. The ambient background concentrations shown in Table 3-1 were added to model-predicted impacts prior to comparison to the NAAQS/AAAQS.
3.1 AMBIENT DATA FOR BACKGROUND DEVELOPMENT According to USEPA’s Guideline on Air Quality Models (USEPA 2005), background concentrations should be representative of the following in the vicinity of the source(s) under consideration:
1. Natural sources,
2. Nearby sources other than the one(s) currently under consideration, and
3. Unidentified sources.
Ambient air quality data that can be demonstrated to meet these criteria and are of Prevention of Significant Deterioration (PSD)-quality should generally be acceptable as the basis for developing background concentrations to support modeling demonstrations.
Background data collected at the BPXA A-Pad monitoring station and the Central Compression Plant (CCP) monitoring station were used. All SO2, NO2, and O3 background values were calculated from data collected at the BPXA A-Pad monitoring station from 2010 through 2014. CO, PM10, and PM2.5 background values were calculated from data collected at the CCP monitoring station due to the fact that A-Pad does not measure these pollutants. All data from CCP was collected in 2014. Data collected at these stations are considered conservatively representative of the project area and non-modeled sources since all monitoring stations are located downwind of large stationary sources. Figure 3-1 shows the locations of the CCP and A-Pad monitoring stations with respect to the GTP. Table 3-1 summarizes the data.
Note that Table 3-1 gives a background concentration for 1-hour NO2. This concentration was used for the far-field CALPUFF modeling. However, a refined approach was used for the near-field AERMOD modeling as is described in Section 3.2.
3.2 1-HOUR NO2 BACKGROUND DEVELOPMENT Guidance memos published by the USEPA (2011, 2014b) outline a tiered approach to develop monitored NO2 background values to assess compliance with the 1-hour NO2 NAAQS. The following outlines the approaches for each tier:
First Tier Approach
Assume “a uniform monitored background contribution” by “[adding] the overall highest hourly background NO2 concentration (across the most recent three years) from a representative monitor to the modeled design value.” This approach may be applied without further justification (USEPA 2011).
A “Less Conservative” First Tier Approach
Assume “a uniform monitored background contribution based on the monitored design value” by adding the “monitored design value from a representative monitor” to the modeled design value, based on five years of modeling. “The monitored NO2 design value [is] the
AIR QUALITY MODELING REPORT - GTP
USAG-P1-SRZZZ-00-000001-000 7-OCT-16
REVISION: 1
PUBLIC PAGE 21 OF 112
98th-percentile of the annual distribution of daily maximum 1-hour values averaged across the most recent three years of monitored data” (USEPA 2011).
Second Tier Approach
“For shorter averaging periods, the meteorological conditions accompanying the concentrations of concern should be identified” (USEPA 2005). Assume a temporally varying background based on “multiyear averages of the 98th-percentile of the available background concentrations by season and hour-of-day, excluding periods when the source in question is expected to impact the monitored concentration” (USEPA 2011). In identifying meteorological conditions of concern, this tiered approach may also encompass approaches where backgrounds vary by wind direction, wind speed, day of week, or month of year as appropriate. This approach is representative “since the monitored values will be temporally paired with modeled concentrations based on temporal factors that are associated with the meteorological variability, but will also reflect worst-case meteorological conditions in a manner that is consistent with the probabilistic form of the 1-hour NO2 standard” (USEPA 2011).
Third Tier “Paired Sums” Approach
“Combine monitored background and modeled concentrations on an hour-by-hour basis, using hourly monitored background data collected concurrently with the meteorological data period being processed by the model.” This approach is only recommended “in rare cases of relatively isolated sources where the available monitor can be shown to be representative of the ambient concentration levels in the areas or maximum impact from the proposed new source…[or] where the modeled emission inventory clearly represents the majority or emissions that could potentially contribute to the cumulative impact assessment and where inclusion of the monitored background concentration is intended to conservatively represent the potential contribution from minor sources and natural or regional background levels not reflected in the modeled inventory” (USEPA 2011).
Due to the stringency of the 1-hour NO2 NAAQS, a refined second-tier technique was used to develop a representative ambient background concentration to combine with near-field cumulative AERMOD-predicted impacts. USEPA guidance provides that the second tier approach can be considered on a case-by-case basis. The second tier approach is a collection of background development procedures based on identifying “the meteorological conditions accompanying the concentrations of concern” (USEPA 2005, USEPA 2011, USEPA 2014b). For the Class I and Sensitive Class II area modeling, the second tier was used.
To identify these meteorological conditions of concern for this evaluation, an analysis was conducted with the meteorological and ambient air quality conditions at the A-Pad monitoring station between 2009 and 2013. These data indicated that measured NO2 concentrations were strongly dependent on wind speed. Figure 3-2 illustrates the relationship between hourly average NO2 and wind speed measurements collected at the A-Pad monitoring station. This figure indicates that NO2 concentrations decrease with increasing wind speeds. Therefore, low wind speeds are the “meteorological conditions accompanying the concentrations of concern” referenced in USEPA guidance. Developing a background that varies by wind speed is appropriate because the background values are temporally paired with model-predicted concentrations based on meteorological variability. This will reflect the worst-case meteorological conditions in a way that is consistent with the probabilistic form of the 1-hour NO2 standard.
Background concentrations varying by wind speed were determined by first sorting all hourly averaged NO2 measurements according to the accompanying wind speed using the categories listed in Table 3-2. These wind speed categories are defined in the AERMOD User’s Guide (USEPA 2004). Once the data had been sorted, the 98th percentile hourly average NO2 concentration was calculated from the data in each wind speed category. Table 3-2 summarizes
AIR QUALITY MODELING REPORT - GTP
USAG-P1-SRZZZ-00-000001-000 7-OCT-16
REVISION: 1
PUBLIC PAGE 22 OF 112
the resulting NO2 background concentrations calculated using hourly NO2 and wind speed data collected at A-Pad monitoring station between 2009 and 2013. Although the form of the 1-hour NO2 NAAQS is based on three years of monitored data, ADEC considers the use of five years of ambient data more robust than the three years required by USEPA guidelines. Therefore, the same five years of hourly NO2 and wind speed data were used for this analysis as the five meteorological years for modeling.
Once the background concentrations for each wind speed category were determined, the background values were input to the model. Therefore, an NO2 background concentration was assigned to all receptors for each hour of the meteorological input, with the selected background value being determined by the wind speed for that hour.
Table 3-1: Background Air Quality Data in the Project Vicinity of the GTP
Air Pollutant Averaging Period Concentration
ppbv µg/m3
Sulfur Dioxide
1-Hour a 3.58 9.39
3-Hour b 8.00 20.96
24-Hour b 3.10 8.12
Annual b 0.69 1.8
Carbon Monoxide 1-Hour b 1000 1150
8-Hour b 1000 1150
Nitrogen Dioxide 1-Hour c 32.80 61.69
Annual b 3.2 6.0
Ozone 8-Hour d 56.0 109.9
Particulate Matter less than 10 Microns 24-Hour b NA 50.0
Particulate Matter less than 2.5 Microns 24-Hour c NA 15.0
Annual b NA 3.7
Abbreviations: NA = not applicable µg/m3 = micrograms per cubic meter ppbv = parts per bil l ion by volume
Notes: a Value reported is the 99th percentile of the distribution of measured daily maximum values. b Value reported is the measured maximum average concentration. c Value reported is the 98th percentile of the distribution of measured daily maximum values. d Value reported is the fourth-highest measured daily maximum 8-hour average ozone concentration.
AIR QUALITY MODELING REPORT - GTP
USAG-P1-SRZZZ-00-000001-000 7-OCT-16
REVISION: 1
PUBLIC PAGE 23 OF 112
Figure 3-1: Locations of Meteorological and Ambient Air Monitoring Stations
CCP Meteorological and Ambient Air Quality Monitoring Station
Proposed Site of the Main GTP
Facil ity and Ancil lary Facil ities
A-Pad Meteorological and Ambient Air Quality Monitoring Station
AIR QUALITY MODELING REPORT - GTP
USAG-P1-SRZZZ-00-000001-000 7-OCT-16
REVISION: 1
PUBLIC PAGE 24 OF 112
Figure 3-2: Relationship between NO2 Concentrations and Wind Speed Measured at the A-Pad Monitoring Station from 2009 through 2013
Table 3-2: 1-Hour NO2 Background Varying by Wind Speed Wind Speed (WS) Category a
(m/s)
NO2 Concentration
ppbv µg/m3 WS < 1.54 25.9 48.8
1.54 ≤ WS < 3.09 22.3 41.9
3.09 ≤ WS < 5.14 15.9 29.9
5.14 ≤ WS < 8.23 10.3 19.4
8.23 ≤ WS < 10.8 10.7 20.1
WS ≥ 10.8 13.4 25.2
Abbreviations: NA = not applicable µg/m3 = micrograms per cubic meter ppbv = parts per bil l ion by volume
Notes: a AERMOD-default wind speed categories.
AIR QUALITY MODELING REPORT - GTP
USAG-P1-SRZZZ-00-000001-000 7-OCT-16
REVISION: 1
PUBLIC PAGE 25 OF 112
4.0 EMISSION INVENTORIES This section provides information regarding the emission inventories used in the dispersion modeling, which serves as an overview of the emission calculation details which are provided in Appendix A.
4.1 PROJECT EMISSION UNITS This section describes the emission data used to model project sources as well as the modeled scenarios. Table 4-1 lists the emission units to be installed at the GTP and those that were considered for modeling.
Table 4-1: Equipment to be Installed at GTP Description Number of Units
150 kW Communication Tower Generator 1 (Emergency Use)
250 hp Main Firewater Pump 3 (Emergency Use)
Notes: a Each compression turbine has an associated Supplemental Firing (SF) system and Waste Heat Recovery Unit (WHRU) to
meet the duty requirements of the Process Heat Medium system. SF duty would vary depending on season and load of each turbine. The SF duties for each operating turbine are a conservative estimate to account for this anticipated seasonal and load variation.
b Building Heat Medium Heater load would vary seasonally. A set of three heaters (225 MMBtu/hr each) are installed but only two heaters (450 MMBtu/hr total) are expected to operate at any one time. The third heater is a spare. This is a 3 x 50% operational configuration.
c Both sets of flares continuously operating with purge gas and pilot gas. d Each LP CO 2 has 3 tips. e Operational Camp Heater load would vary seasonally. A set of three heaters (25 MMBtu/hr each) are installed but only two
heaters (50 MMBtu/hr total) are expected to operate at any one time. The third heater is a spare. This is a 3 x 50% operational configuration.
AIR QUALITY MODELING REPORT - GTP
USAG-P1-SRZZZ-00-000001-000 7-OCT-16
REVISION: 1
PUBLIC PAGE 26 OF 112
Modeled Scenarios 4.1.1A conservative normal operations scenario was used to predict impacts from GTP sources. This scenario was selected because, when compared to other possible operating scenarios, the total emissions and assumed simultaneous equipment operation for this scenario would yield equivalent or higher modeled impacts than other scenarios. Table 4-2 lists the operational equipment for the selected scenario alongside the equipment for those scenarios that will not be modeled.
“Normal operations” corresponds to the emissions and stack parameters that are typical for the equipment, on a per unit basis. However, the following conservative assumptions for this scenario should be noted:
• All equipment located at the GTP is assumed to operate concurrently, even intermittently used equipment.
• Turbines were modeled at maximum emissions rates and minimum exhaust parameters. The additional supplemental firing flow rate and velocity were not included in the velocities modeled.
• Even though flare relief events would only occur during maintenance or upset conditions, they were conservatively modeled as part of normal operations.
Modeling the normal operations scenario was designed to be conservative, even though it is highly unlikely that all sources modeled concurrently would in fact be operating in that manner. The normal operations scenario for the GTP is detailed below.
AIR QUALITY MODELING REPORT - GTP
USAG-P1-SRZZZ-00-000001-000 7-OCT-16
REVISION: 1
PUBLIC PAGE 27 OF 112
Table 4-2: List of Equipment Included in Modeled and Non-Modeled Operational Scenarios
LP CO 2 Flares - Max. Relief Case Yes - - - - - - - LP CO 2 Flares - Relief Events assoc. with Startup (f ewer emissions than max relief case)
- Yes Yes Yes Yes - - -
LP CO 2 Flares - Relief Events assoc. with Turbine & Process System Maintenance (f ewer emissions than max relief case)
- - - - - Yes - -
HP CO 2 Flares - Pilot/Purge Yes Yes Yes Yes Yes - Yes Yes
HP CO 2 Flares - Max. Relief Case Yes - - - - - - - HP CO 2 Flares - Relief Events assoc. with Startup (f ewer emissions than max relief case)
- - - - - - - -
HP CO 2 Flares - Relief Events assoc. with Turbine & Process System Maintenance (f ewer emissions than max relief case)
- - - - - Yes - -
Notes: a. Turbines from Train 1, Train 2, or Train 3 could be offl ine during maintenance operations. It is l ikely that only a single
turbine would go offl ine at a time, but no more than 1 full train (2 turbines) would be offl ine. b. Only two Building Heat Medium Heaters will be operational during normal operations. When on heater goes down for
maintenance, the spare will be operating. c. Only two Operations Camp Heaters will be operational during normal operations. When one heater goes down for
maintenance, the spare will be operating.
AIR QUALITY MODELING REPORT - GTP
USAG-P1-SRZZZ-00-000001-000 7-OCT-16
REVISION: 1
PUBLIC PAGE 29 OF 112
4.1.1.1 Normal Operations It was assumed that the GTP would be running at full capacity, producing sales gas using all three production trains. These production trains would burn a blend of PBU and Point Thompson gas with a maximum sulfur content of 1 grain/100scf. A description of the equipment that was modeled is provided below. All emission units were modeled as vertical and uncapped point sources. All point source locations were referenced to NAD83 UTM Zone 6 coordinates. Additional details regarding normal operation of the units as well as the development of emissions and exhaust parameters can be found in Appendix A.
Compression Turbines
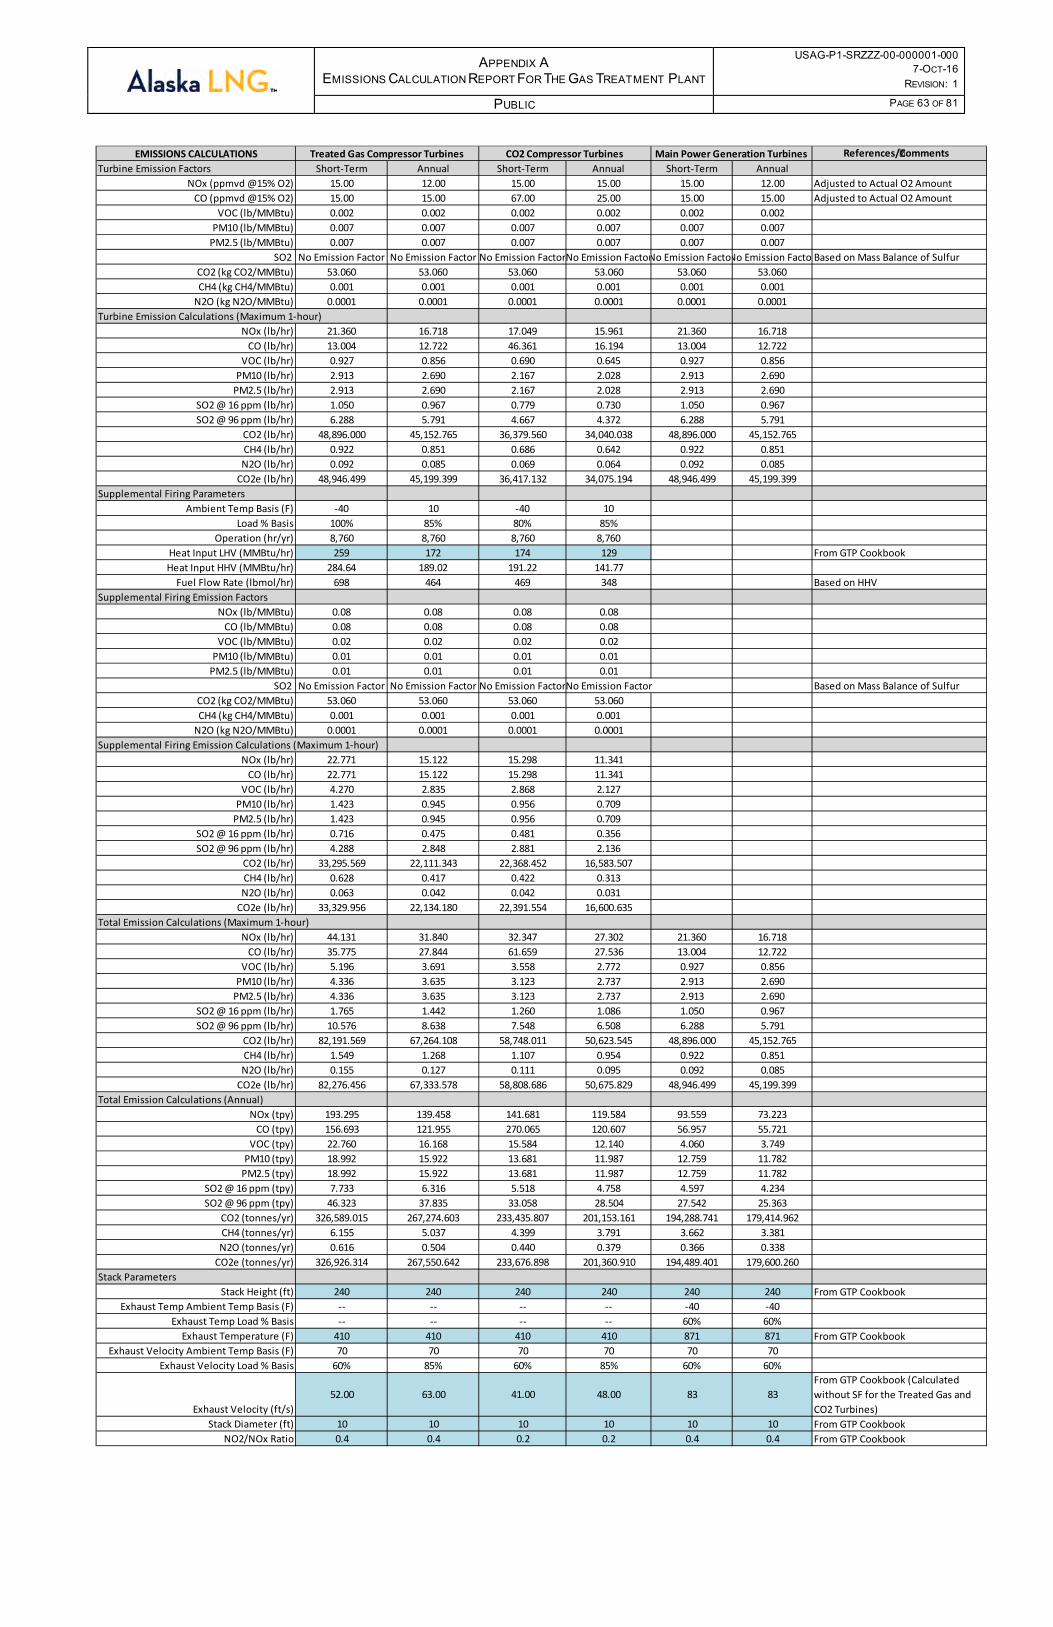
There would be a total of twelve gas compression turbines (six Treated Gas and six CO2 Compression turbines) located at the GTP. The turbines would be organized as two sets of two turbines per train (two Treated Gas compression turbines and two CO2 Compression turbines total per train) for the 3 trains. The turbines have been designed with spare capacity to allow the GTP to remain in operation during maintenance and upset scenarios. There is potential for the turbines to be operating anywhere from 85% load to 100% load, with either all twelve or fewer turbines operating. Typically, all twelve turbines would operate at 85% load.
To be conservative, the modeled normal operations scenario assumed that all twelve compression turbines operate at 100% load. The turbines would each be fitted with a Waste Heat Recovery Unit (WHRU) and associated Supplemental Firing (SF) system.
For modeling 1-hour SO2 and 1-hour NO2, emission rates for all of the turbines were conservatively increased by 10% in the model. This 10% safety factor accounts for short-term load variations in the modeled emissions. This was not applied to any other pollutant or averaging period.
Power Generation Turbines
The GTP main power generation system consists of six turbines total which create a common power supply for the facility. Individual power generation turbine load would fluctuate based on the needs of the process trains, and can range from 60% to 100%. Seasonal load variations would be the most common reason for differences in power generation equipment operation.
To ensure maximum model-predicted impacts, emissions rates corresponding to 100% load were conservatively paired with stack exhaust conditions associated with 60% load.
Heaters
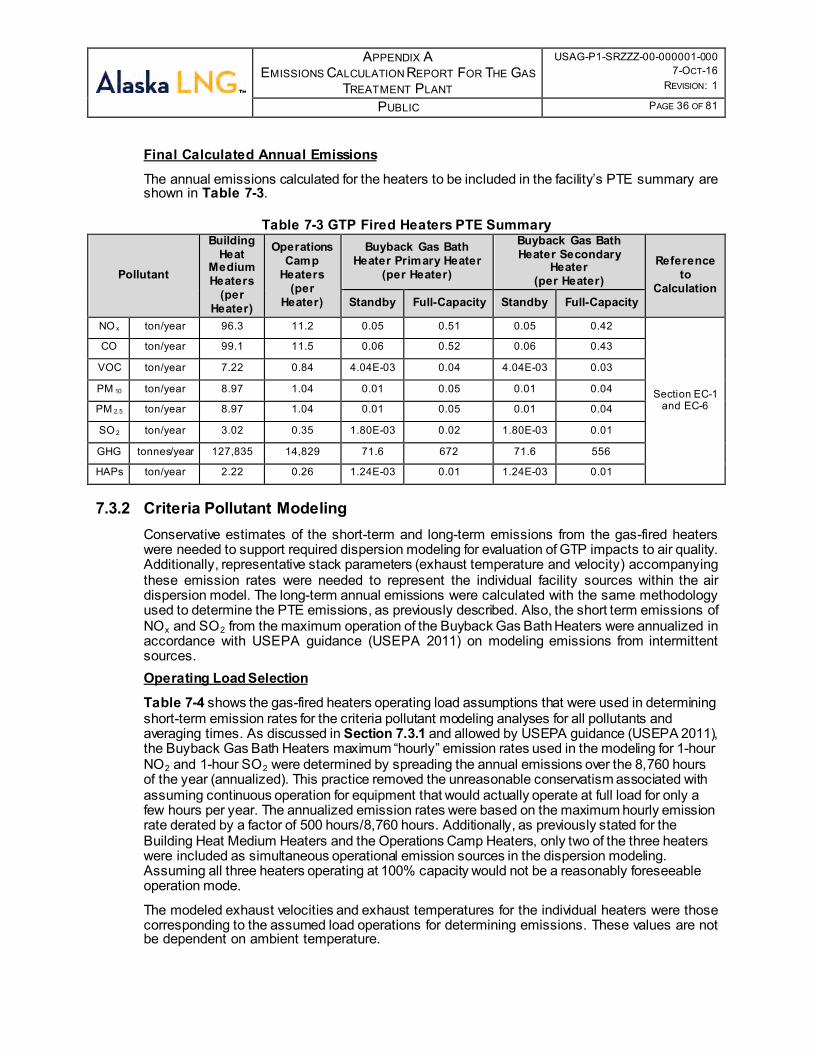
The GTP operation would include the installation of three Building Heat Medium Heaters to heat the process modules, utility modules, common areas, and other enclosed areas. Two of the heaters would operate continuously, and one would be a spare not normally in operation. Each heater has a design duty of 225 MMBtu/hr. The heaters are all sized for 50% of the required heat capacity needed at the facility, 3 x 50%. The load on the two operating heaters would fluctuate based on seasonal heat needs. To be conservative, the modeling assumed that the two heaters operate continuously at 100% load.
Operational heaters would be installed at the operations camp to heat the residences, offices, and other enclosed areas. Three heaters were included in the camp for air modeling purposes. Two of the heaters would operate continuously, and one would be a spare not normally in operation. Each heater has a design duty of 25 MMBtu/hr. The heaters are all sized for 50% of the required heat capacity needed at the facility, 3 x 50%. The load on the two operating heaters would fluctuate based on seasonal heat needs. To be conservative, the modeling assumed that the two heaters operate continuously at 100% load.
AIR QUALITY MODELING REPORT - GTP
USAG-P1-SRZZZ-00-000001-000 7-OCT-16
REVISION: 1
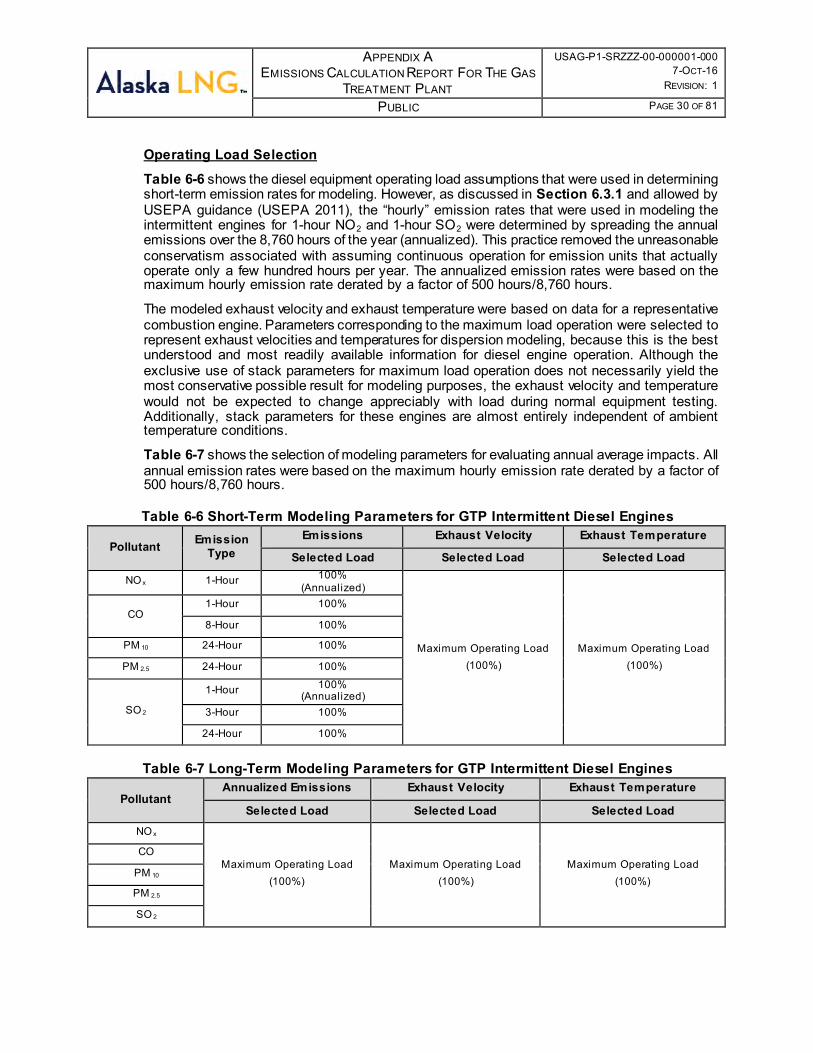
PUBLIC PAGE 30 OF 112
Buyback Gas Bath Heaters would also be installed that would heat any treated gas that is rerouted back from the sales gas pipeline, downstream of the Refrigeration System and metering station. The two heaters at the facility would be sized as 2 x 50% of the total fuel capacity. Typically, the heaters would operate in a standby low-load mode. Therefore, the units were modeled as operating continuously at 10% load. To account for infrequent instances where the heaters would operate at maximum load, the units were also modeled as intermittent sources operating at 100% load for 500 hours/year.
Reciprocating Internal Combustion Engines
One essential diesel power generator would be installed at the GTP to assist in the initial black start of the main power generation turbines. The GTP would also include a dormitory emergency diesel generator that would have the ability to provide the worker camp with some energy in the event of an emergency plant shut down.
There would be three main diesel firewater pumps which would be located at the man camp facilities, not within the process trains. The pumps are attached to specific Camp Firewater Storage Tanks that would house water only for a fire emergency system.
The Communications Tower generator would be installed at the GTP to allow for supply of power to the Communication System during emergencies and down operation of the power generation turbines.
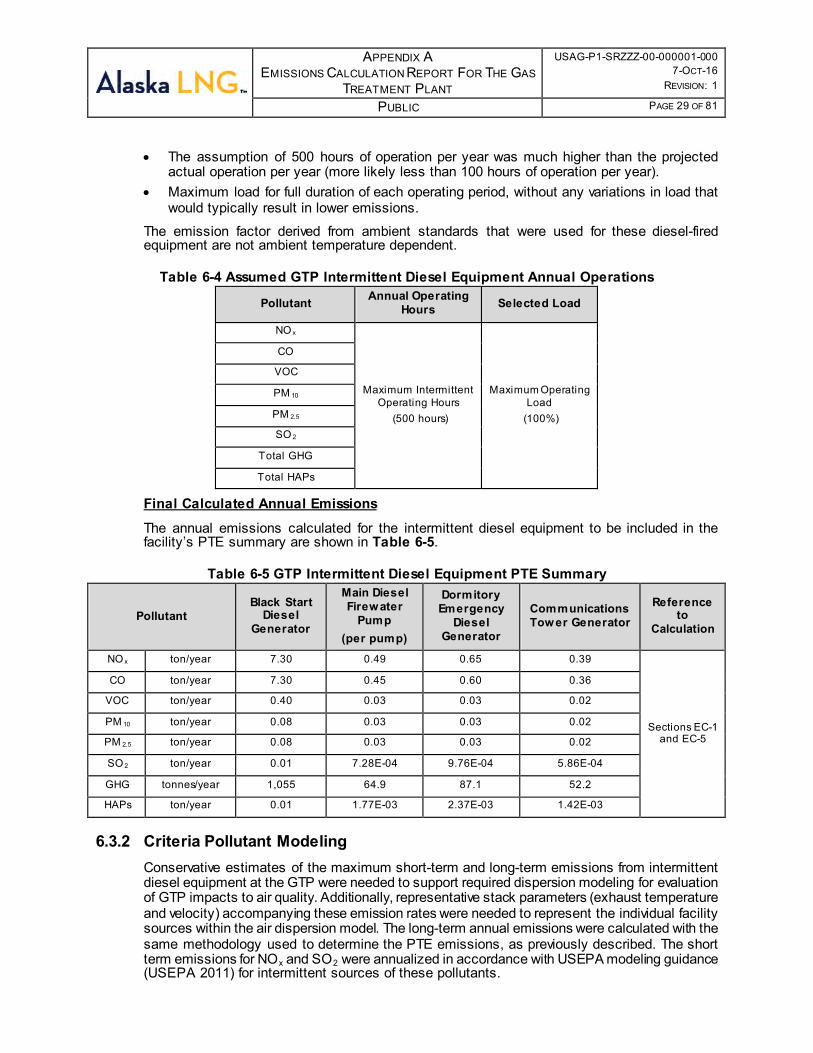
While the generators and firewater pumps are not technically a part of everyday normal operations, they were all conservatively included in the modeling as intermittently operated sources, operating for 500 hours per year.
Flares
The GTP would have two sets of emergency flares, one operational and one spare. Each set includes a High Pressure (HP) hydrocarbon flare, a Low Pressure (LP) hydrocarbon flare, an HP CO2 flare, and a LP CO2 flare. As part of normal operations, pilot and purge gas would be continuously combusted at each of the eight flares and was included in the dispersion modeling.
Emergency flaring (maximum relief events) would occur infrequently and while not part of everyday normal operations, maximum flaring from each of the four operational flares were conservatively included in the normal operations scenario as intermittent sources, operating for 500 hours per year. The four maximum flaring cases were included in all cumulative and PSD Increment modeling for both near-field and far-field areas.
For the AQRV analyses, however, only the hydrocarbon flares were modeled with a maximum flaring case representing an emergency scenario. The reasoning behind this is that it is unlikely that an emergency or malfunction would occur that would cause process gas to be sent to both sets of flares at the same time. The CO2 compression system and treated gas compression system operate independently from one another. For instance, if the outlet of the CO2 compressors is blocked, all of the CO2 gas located within the compressors and associated piping would be routed to the CO2 flares. However, the feed gas could still be treated in the Acid Gas Removal System (AGRU) and sent to the treated gas compression system, and the hydrocarbon flares would still operate under normal operations, i.e. under pilot/purge. All CO2 gas produced during the shutdown of the CO2 compression system while the treated gas was still being processed would be sent directly to the flares.
Each emission unit was modeled at an operating condition specifically chosen to result in conservative model-predicted impacts. The conditions selected were generally 100% load, continuous operation with short-term and annual emissions based on the ambient temperature, leading to a conservative modeling estimate. In the case of CO emissions, the 8-hour emissions were conservatively set to the 1-hour emissions. In the cases of NO2 and SO2 emissions the
AIR QUALITY MODELING REPORT - GTP
USAG-P1-SRZZZ-00-000001-000 7-OCT-16
REVISION: 1
PUBLIC PAGE 31 OF 112
3-hour and 24-hour emissions were all conservatively set to the 1-hour emissions. The only exceptions to this was the emergency diesel generators, firewater pumps, maximum buyback gas bath heater conditions, and maximum flaring conditions which are deemed intermittent sources. The 1-hour averaged emissions and annual emissions for these sources were based on operations of 500 hours per year.
All liquid fuel fired equipment is assumed to combust Ultra Low Sulfur Diesel fuel, and all other emission units are assumed to combust treated gas. For conservatism and to account for potential start-up scenarios, the treated gas was assumed to have a total sulfur content of 96 ppmv.
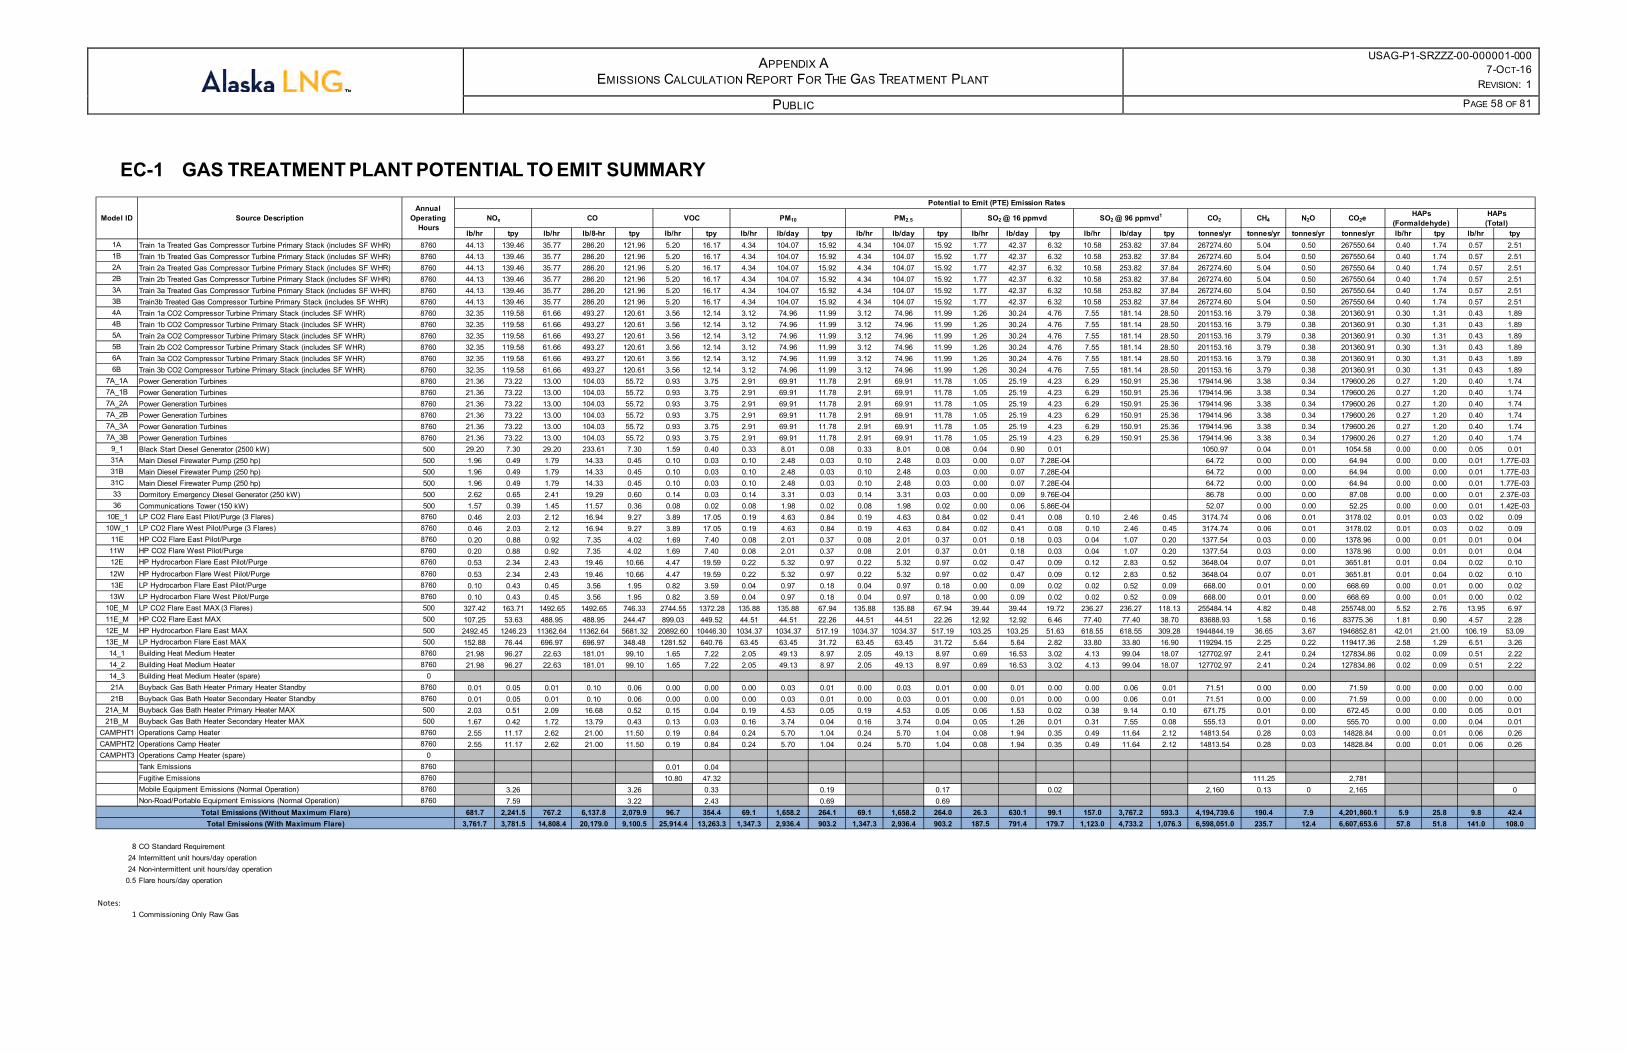
Point source parameters and emissions rates used to model the normal operations scenario for the GTP are provided in Table 4-3 and Table 4-4. These data were developed based on USEPA emission factors (AP-42) and vendor data, where possible. Detailed calculations are documented in Appendix A. All emission units were modeled as vertical and uncapped point sources, and all point source locations were referenced to NAD83 UTM Zone 6 coordinates.
AIR QUALITY MODELING REPORT - GTP
USAG-P1-SRZZZ-00-000001-000 7-OCT-16
REVISION: 1
PUBLIC PAGE 32 OF 112
Table 4-3: Modeled GTP Source Emissions
Modeled ID Source Description
Emission Rates (g/s)
NO x (g/sec) SO 2 (g/sec) PM 10 (g/sec) PM 2.5 (g/sec) CO (g/sec)
14_1 Building Heat Medium Heater 2.77E+00 2.77E+00 5.20E-01 5.20E-01 5.20E-01 2.58E-01 2.58E-01 2.58E-01 2.58E-01 2.85E+00 2.85E+00
14_2 Building Heat Medium Heater 2.77E+00 2.77E+00 5.20E-01 5.20E-01 5.20E-01 2.58E-01 2.58E-01 2.58E-01 2.58E-01 2.85E+00 2.85E+00
21A Buy back Gas Bath Heater Pre-Let Down Heater Standby b 1.55E-03 1.55E-03 3.09E-04 3.09E-04 3.09E-04 1.44E-04 1.44E-04 1.44E-04 1.44E-04 1.60E-03 1.60E-03
21B Buy back Gas Bath Heater Pre-Let Down Heater Standby b 1.55E-03 1.55E-03 3.09E-04 3.09E-04 3.09E-04 1.44E-04 1.44E-04 1.44E-04 1.44E-04 1.60E-03 1.60E-03
21A_M Buy back Gas Bath Heater Pre-Let Down Heater MAXIMUM b 1.46E-02 1.46E-02 2.74E-03 4.80E-02 2.74E-03 2.38E-02 1.36E-03 2.38E-02 1.36E-03 2.63E-01 2.63E-01
21B_M Buy back Gas Bath Heater Post-Let Down Heater MAXIMUM b 1.20E-02 1.20E-02 2.26E-03 3.96E-02 2.26E-03 1.96E-02 1.12E-03 1.96E-02 1.12E-03 2.17E-01 2.17E-01
Notes: a The 10% safety factor for the turbines was included in AERMOD as an input and is not reflected in this Table. b Intermittently operating unit. Emissions set equal to annual emission rate per USEPA guidance (USEPA 2011).
AIR QUALITY MODELING REPORT - GTP
USAG-P1-SRZZZ-00-000001-000 7-OCT-16
REVISION: 1
PUBLIC PAGE 36 OF 112
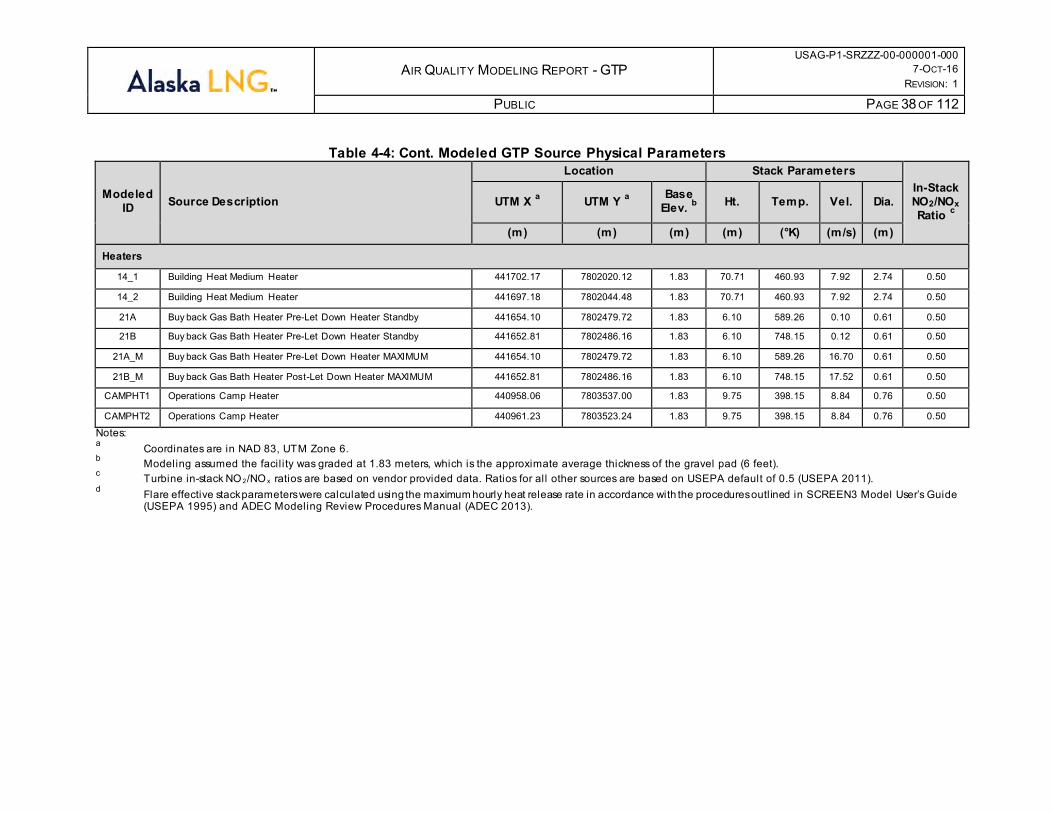
Table 4-4: Modeled GTP Source Physical Parameters
Modeled ID Source Description
Location Stack Parameters In-Stack NO2/NOx Ratio c
Notes: a Coordinates are in NAD 83, UTM Zone 6. b Modeling assumed the facil ity was graded at 1.83 meters, which is the approximate average thickness of the gravel pad (6 feet). c Turbine in-stack NO 2/NO x ratios are based on vendor provided data. Ratios for all other sources are based on USEPA default of 0.5 (USEPA 2011). d Flare effective stack parameters were calculated using the maximum hourly heat release rate in accordance with the procedures outlined in SCREEN3 Model User’s Guide
(USEPA 1995) and ADEC Modeling Review Procedures Manual (ADEC 2013).
AIR QUALITY MODELING REPORT - GTP
USAG-P1-SRZZZ-00-000001-000 7-OCT-16
REVISION: 1
PUBLIC PAGE 39 OF 112
Non-Modeled Scenarios 4.1.2In addition to normal operations, there are several other reasonably anticipated operational scenarios that were considered for the GTP dispersion modeling. However, when compared to the conservative normal operations scenario described above, these scenarios would yield lower modeled impacts due to lower emissions, less equipment operating, and/or fewer operating hours. The subsections below describe these scenarios and why modeled impacts would be lower than that from the normal operations scenario. Table 4-2 lists the operational equipment that was included in the modeled normal operations scenario versus equipment associated with those operational scenarios that were not modeled.
4.1.2.1 Plant Start-Up Existing facility gas would be required for the start-up of the GTP. The gas would either come from the PBU or the Point Thomson Unit (PTU). The untreated cold gas may need to be filtered for any liquids before being used during start up. A separate line off of the untreated gas feed to the new facility would be fed directly to the flares for immediate start-up and commissioning of the flare pilot system. The untreated gas would then be used to purge the fuel gas system and would need to be warmed before being used by any other equipment at GTP. Directly following the start-up of the fuel gas system, the flare header purge lines would be pressurized and begin a constant flow of untreated gas.
The Black Start Diesel Generator would be started to supply power to essential power users as well as the starting load required by one Main Power Generator Turbine. The Main Power Generation gas turbine drivers would be initially fueled by the untreated gas. The Treated Gas and CO2 Compressor Turbines in the first train would be started using power from the Main Power Generator and using untreated gas. The initial exhaust flow from the compressor turbines would be sent through a bypass stack. The WHRU cannot be utilized until the associated turbine has established stable exhaust flow. The Process Heat Medium system, which consists of large fuel gas burning process heaters, would be started next. This system would establish normal flow through the process heat medium users and through the compressor turbine’s WHRUs, slowly increasing the heat medium temperature. A trim cooler has been provided within the process heat medium system to balance the heat input and output of the system. With the process heat medium system established, Train 1 process systems can start accepting feed gas, including the Acid Gas Removal Unit, the Treated Gas Dehydration Unit, and the CO2 Dehydration Unit. All initial off-spec gas production would be sent to the flare until the H2S and CO2 specifications for the pipeline are met.
While the process systems are coming online and before GTP-produced treated gas and CO2 can be fed to the compressors, the compressors would be run in full recycle within the train. Untreated gas would be run within the CO2 Compressor and an inert or third party-provided natural gas would be run within the Treated Gas Compressor. Once the produced, i.e. treated gas, and CO2 are available at the facility (the process equipment is no longer creating off-spec gas), it would be fed to the compressors and mixed with these recycled gases. The mixed gas from the compressors would be sent to the flares, since it would not meet treated gas pipeline or CO2 injection specifications. Flaring the gas from the compressors would be required as long as needed to remove all inert gas from within the compressors.
Note: the turbines are still running on the untreated gas, only the treated gases are being fed to the compressors.
In preparation for the treated gas being fed to the pipeline, propane gas from the nearby CGF facility would be used to fill the Treated Gas Chilling Refrigeration System. Initial emissions from purging and filling of this system would be sent to the flares. The purging and filling of the
AIR QUALITY MODELING REPORT - GTP
USAG-P1-SRZZZ-00-000001-000 7-OCT-16
REVISION: 1
PUBLIC PAGE 40 OF 112
Refrigeration System will result in a much smaller volume of gas considered during the maximum flaring case currently modeled in the compliance demonstration. Additionally, the duration of time required to purge the Refrigeration system will be much smaller than the assumed 500 hours for the max flaring rate currently being used.
Start-up of Train 1 would expect to be relieving 525 MMSCFD of off-spec gas through the HP HC Flare. The LP CO2 Flare would be relieving 65 MMSCFD of CO2 plus 30 MMSCFD of assist gas. All other flares would be combusting pilot and purge gas only. Start-up of Train 1 and the facility safety equipment would produce fewer emissions in one year than what has been considered in the potential-to-emit. The use of raw gas during this short time duration would result in higher SO2 and GHG emissions than during normal operations. However, the total amount of SO2 and GHG emitting is still likely to be less than the assumed potential-to-emit.
In this scenario only one train would be starting up. The two remaining trains would be offline. In reality only one train would be starting up at any one time. Under the normal operations scenario which has been modeled, all three trains, and therefore, all six CO2 compressor turbines, all six treated gas turbines, and all six power generator turbines are running at full capacity. The emissions were based on 100% load even though typically the turbines would run at 85% load. The flares were modeled for the normal operations scenario as if all eight were running continuously. In addition, the operational flares were also modeled at maximum emissions for 500 hours per year, which brings an added level of conservatism to the normal operations scenario. The two flares that would be relieving gases during start-up operations would not be emitting continuously. They would be emitting for less than 500 hours. The amount of emissions being sent to the flares would be less than the amount of emissions being sent to all turbines under normal operating conditions.
4.1.2.2 Early Plant Operations Phase 1: GTP is running at 1/3rd capacity, producing 1.3 billion standard cubic feet per day (BSCF/D) of sales gas in one production train. This production train would be burning untreated feed gas during start-up operations because there is no other fuel available for start-up. The train would continue to burn the untreated feed gas until the compression turbine operations became stable and the treated gas system is able to produce treated gas in a uniform and stable way. The duration of operation on untreated feed gas is assumed to be up to 6 months. Once the treated gas system operations have stabilized the turbines would be switched over to burning the treated gas. The turbines will require adjustments to the combustion equipment and controls prior to using treated gas as fuel. Additionally, the treated gas would be used to fill and pressurize the pipeline which will require a considerable amount of gas. The two Treated Gas and two CO2 Compression turbines would operate between 85% and 100% and two power generation gas turbines would operate between 60% and 100% capacity depending on demand. The gas compression turbines would each be fitted with a WHRU and associated SF system. One Building Heat Medium Heater would be in continuous operation at 100% load. Diesel emergency equipment would not be in operation, but would be tested periodically. Pilot and purge gas would be combusted at all flares. No additional flaring scenarios are reasonably foreseeable.
Phase 2: Train 2 start-up would commence after approximately the first year of facility operation, and would be similar to the start-up of Train 1 based on treated gas being available and initially fed to all equipment for purging and startup as discussed in Section 4.1.2.1. The flaring that occurs during start-up operations of Train 2 would coincide with the normal purge/pilot fuel gas flaring associated with Train 1 in normal operations, but would not be continuous.
Once Train 2 is fully up and running, GTP would be running at 2/3rds capacity, producing 2.5 BSCFD of sales gas in two production trains. The four Treated Gas turbines, four CO2 Compression turbines would operate between 85% and 100%, and four power generation gas turbines would operate between 60% and 100% capacity depending on demand. The gas
AIR QUALITY MODELING REPORT - GTP
USAG-P1-SRZZZ-00-000001-000 7-OCT-16
REVISION: 1
PUBLIC PAGE 41 OF 112
compression turbines would each be fitted with WHRU and SF system. Two Building Heat Medium Heaters would be in continuous operation. Diesel emergency equipment would not be in operation, but would be tested periodically. Pilot and purge gas would be combusted at flares.
Phase 3: Train 3 start-up would commence after approximately the second year of facility operation and would be similar to the start-up of Train 1 based on treated gas being available and initially fed to all equipment for purging and startup as discussed in Section 4.1.2.1. The flaring that occurs during start-up operations of Train 3 would coincide with the normal purge/pilot fuel gas flaring associated with Trains 1 and 2 in normal operations, but would not be continuous.
Once Train 3 is fully up and running, GTP would be running at full capacity and considered to be operating normally, producing 3.7 BSCFD of sales gas in three production trains. All six Treated Gas turbines, six CO2 Compression turbines would operate between 85% to 100%, and six power generation gas turbines would operate between 60% and 100% capacity depending on demand. The gas compression turbines would each be fitted with a WHRU and associated SF system. Two Building Heat Medium Heaters would be in continuous operation. Diesel emergency equipment would be operational and available if needed, though not anticipated to be used. Pilot and purge gas would be combusted at flares.
No scenario specific to early plant operation was included in the dispersion modeling analysis because, if modeled, it would produce lower impacts than the conservative normal operations scenario described in Section 4.1.1. Considering the compressor and power generation turbines, Table 4-2 shows that all phases of the Early Operations scenario include fewer turbines and/or lower turbine loads than the normal operations scenario which would result in lower emissions and lower modeled impacts on both a short-term and long-term basis. There would be no difference in stack parameters thus modeled dispersion of the exhaust would be equivalent between the two scenarios. Furthermore, the Early Operations scenario includes a lower amount of flared gas than the Normal operations scenario because included the normal operations scenario is 500 hours per year of emergency flaring on top of the continuous pilot/purge flaring. Lastly, intermittent IC engines are not anticipated to operate during early plant operations and thus would not contribute to any modeled impacts. However, emissions from this equipment was conservatively included in the in the modeled impacts of the normal operations scenario.
Both the Treated Gas and CO2 Compressors are equipped with spare capacity higher than what the GTP typically operates at, and the trains are interconnected. Two sets (one for treated gas and the other for CO2) of 6 x 20% compressors (i.e., 6 compressors each capable of handling 20% of the GTP requirements) would be provided within the three GTP trains. This allows for a total overall compression capacity at the facility of 120%, and allows for one full compressor to be offline with the GTP to still be operating at 100%. Normally, all compressors would be operating at a reduced load, roughly 85%, for the plant to operate at full compression capacity. In the event that one compressor needs to be shut down, the remaining compressors would be able to keep the overall GTP compression capacity at 100%. The compressors are installed as two per train; however the trains have the flexibility to share feed gas across all inlets. The compressor turbines are equipped with waste heat recovery units to supply the process systems with the required heat. When one turbine is offline, it may be required to artificially increase the load through recycling gas for the remaining train-specific compressors to achieve the required heat transfer to the process heat medium system.
For example, consider that all 12 turbines are running at 85% load in a normal operating scenario. If the Train 1 associated Treated Gas Compressor needs to be shut down for emergency or maintenance reasons; the five operating Treated Gas Compressors would increase
AIR QUALITY MODELING REPORT - GTP
USAG-P1-SRZZZ-00-000001-000 7-OCT-16
REVISION: 1
PUBLIC PAGE 42 OF 112
in load up to 100% to maintain the same facility capacity. Then, additionally, the Train 1 associated CO2 Compressors may also be artificially loaded up to 100% to add more heat to the Train 1 system. Artificially increasing the CO2 Compressor load may result in more CO2 being transferred to the Train 1 compressors, but more than likely, the remaining CO2 Compressors would stay at their normally operating load and only the Train 1 CO2 Compressors would increase through manual CO2 recycling to the inlet of the compressors. In this event, five Treated Gas Compressors are operating at 100% load, one Treated Gas Compressor is not operating at all, four CO2 Compressors are operating at 85% load, and the two CO2 Compressors in Train 1 are operating at 100% load for the duration of this emergency or maintenance operation, which are usually short-term operations lasting a few hours to a few days for emergencies and 2 to 8 weeks for maintenance. The GTP potential-to-emit emissions that are modeled in the normal operations scenario include all 12 compressors operating at 100% load for the entire year. Any changes to the load or operation within the normal operating range of the compressor turbines (85% to 100%) would result in fewer emissions from what is assumed as the potential-to-emit, and modeled in the normal operations scenario. Therefore, the normal operations scenario is the most conservative scenario, and these maintenance operations do not need to be modeled since they would result in lower impacts. Building Heat Medium Heaters
The Building Heat Medium Heaters configuration is 3 x 50%. This means that each of the 3 heaters, are capable of handling 50% of the total building heat requirement for the entire process area. The third heater is assumed to be completely offline when not in use. During normal operations, only two would be running. When maintenance or shutdown of one of the operating heaters is required, the spare heater would need to come online before the original heater is shut down. However, a trim cooler has not been provided within the Building Heat Medium System. This relies on the heaters being controlled to not supply more heat than what is required by the buildings. In the event that the spare heater needs to come online, the heater being shut down would most likely begin to offload at the same time to produce the same total outlet heat. This overlap would result in varying emissions from all three heaters most likely not exceeding a total load equivalent of two heaters operating. Since the GTP potential-to-emit has been calculated based on two heaters operating at 100% for the entire year, there is no need to model such a maintenance situation.
General Maintenance
The power generation turbines and compressor turbines would need maintenance roughly every 3 years. The duration of the maintenance event can range between 2 to 8 weeks. Process system maintenance and shutdown (heat exchangers, columns, air coolers, etc.) would coincide with turbine maintenance. During maintenance events, the equipment would be purged of gas and opened to the atmosphere for inspection.
While the turbines are being shut down, there would be an increase in emissions when the turbines are below the load where the control technology functions as it is shutting down, roughly at 50% turbine load. However, the amount of time spent outside of the control technology functional range would be less than a few hours. Also, at the same time, the exit temperature and exit velocity would be decreasing, which would lead to more conservative dispersion conditions than those modeled during normal operations. While these dispersion conditions can produce more downwash, which could lead to higher impacts in the short-term, the mass of pollutants emitted from the turbines would be decreasing. In all likelihood the normal operations scenario with all the turbines operating at 100% load emissions, exit velocity, and exit temperature would still be considered the worst-case scenario.
Once the equipment is ready to be placed back in service, the equipment would need to be purged of the air by an inert gas before feed gas can be reintroduced to the system. The purge
AIR QUALITY MODELING REPORT - GTP
USAG-P1-SRZZZ-00-000001-000 7-OCT-16
REVISION: 1
PUBLIC PAGE 43 OF 112
gas and the initial feed gas would be sent to the flare while the equipment is brought back online. The start-up of the equipment would take less time and would be less involved, not requiring as much recycling and flaring as for the initial start-up process described in Section 4.1.2.1. Thus, start-up after maintenance work would have lower emissions than the initial start-up process. While emissions from bringing a train back online after routine maintenance may result in higher short-term emissions from equipment purging and gas reintroduction, the downtime while the equipment is offline would allow for the overall emissions to be smaller than the assumed facility potential-to-emit.
Maintenance of equipment systems and trains would be staggered to keep the facility operating at a high capacity. Additionally, maintenance of equipment at the GTP may be synchronized with maintenance at the Liquefaction Facility to keep the treated gas and Liquefied Natural Gas (LNG) production coordinated.
4.1.2.4 Seasonal Effects on Emissions Power Generation Turbines
Winter operation of the GTP requires less power than the summer operation due to reduced demand from the Air Coolers within all systems. During the winter, operation of the power generation turbines may be at a decreased load, or even result in one of the power generation turbines being taken offline. A turbine would be taken offline if the load required by the facility drops to a level that would require all six of the turbines to operate outside of the stable operation load range. The power generation turbines are designed to be operating in a load range from 60% to 100%, with optimal design being 85% on all turbines. The emissions control technology on the turbines is rated to maintain NOx and CO2 emissions down to approximately 40% load. The number of turbines would be reduced until the outlet power required by the facility could be produced from the remaining turbines within their stable operation load range. The normal operations scenario includes all six turbines at their maximum emission rates throughout the year. Therefore, the scenario that was modeled is more conservative than this reduced operating scenario and these seasonal effects do not need to be explicitly modeled.
Supplemental Firing
Supplemental Firing has been included in the potential-to-emit calculations at 100% load. The Supplemental Firing emissions assume the heat required by the process system would require all of the heat from the turbine exhaust gas, plus additional heat from supplemental firing. The heat required for the supplemental firing flow is based off of the worst case heat duty required by the process systems at GTP. If any fluctuations in operation or ambient temperature occur that would cause the process systems at GTP to need less heat input, the supplemental firing fuel rate and emissions would be decreased until there is a heat balance within the facility.
This scenario was not modeled because the normal operations scenario is conservatively modeled by assuming maximum supplemental firing.
Building Heat Medium Heaters
There are currently three Building Heat Medium Heaters located within the GTP process area to heat the inside of the buildings. The buildings would be heated to a constant temperature year-round. During the winter, the heat required from heaters is at a maximum. During the summer, machinery within the equipment modules may supply enough heat to buildings to reduce the heat needed from the Building Heat Medium Heaters. However, the Building Heat Medium Heaters most likely would never be turned off completely as the ambient temperature at night could drop enough to require heat within the buildings. Warmer summer ambient temperatures would reduce the load at the Building Heat Medium Heaters which would result in
AIR QUALITY MODELING REPORT - GTP
USAG-P1-SRZZZ-00-000001-000 7-OCT-16
REVISION: 1
PUBLIC PAGE 44 OF 112
reduced emissions from the heaters. The potential-to-emit has been calculated based on two heaters running at 100% all year long, which leads to more conservative impacts.
Seasonal effects on emissions from the GTP Building Heat Medium Heaters were accounted for in the modeling of the normal operations. The modeled emissions and stack parameters were based on the worst-case (100%) operation.
Construction Emissions 4.1.3Construction of the GTP would occur over an estimated eight-year span, beginning in the first year following Project authorization. Construction activities would begin with site clearing and stabilization, roadway and surface preparation and construction, and include heavy equipment associated with scrapers, dozers, trenching, and stockpiling any soil. A worker camp would be constructed and operated during most of this construction period, and could include sources related to power generation, incineration, food preparation and refrigeration, heating, ventilation, and air conditioning. Site construction would include use of heavy equipment such as cranes and heavy transport vehicles, concrete and asphalt batch plants, additional excavation, welding, seasonal heaters, and the use of power equipment such as engines associated with pneumatic systems, power generation, and support of construction camp activities.
Depending on the type of activity, construction of the GTP main pad and camp pad would occur on different temporary time scales from several months to several years and would be spread over multiple locations around the proposed site. Given these complexities, it is not possible to predict with precision which of these activities would actually overlap in time, or to know the relative locations of the associated equipment for different activities when they do overlap. These limitations would pose great difficulties for any attempt to predict ambient air quality impacts due to emissions from such equipment by means of standard dispersion models. Such models have been designed to estimate impacts from stationary sources, and the usefulness of their predictions is substantially diminished when detailed information on emission source geometry and temporal patterns cannot be provided.
The only recourse for modeling with incomplete emission source data is to resort to hypothetical worst-case assumptions that produce the highest possible predicted impacts for each of the averaging times covered in the ambient air quality standards. This approach is very likely to over-predict actual impacts by a wide margin, which is contrary to the purpose of the impact analysis. Also, by providing only absolute maximum impact estimates, such results are particularly unsuitable for comparison with several of the short-term National Ambient Air Quality Standards that are based on multiple-year averages of certain percentile concentrations.
The difficulties described above, in addition to the fact that construction emissions are not subject to the same federal and state permitting rules as operational emissions, help to explain why dispersion modeling has not been used to characterize construction air quality impacts in any of the recent NEPA documents that have been prepared by the FERC for other LNG projects across the U.S. Following the same logic, the Project did not model construction activities, but rather is proposing mitigations and best management practices (BMPs) for controlling construction emissions. Some BMPs that are being developed and submitted for FERC review include:
• Construction emission control plan • Fugitive dust control plan • Open burning control plan.
While construction activities will not be included in the dispersion modeling analyses, emissions from the construction operations and construction camp activities will be included in the criteria pollutant emissions documented in one of the other appendices to Resource Report No. 9.
In addition to modeling project sources associated with the GTP, the dispersion analysis also addressed the cumulative ambient air quality impacts from the Project and nearby offsite sources. The following lists the offsite sources included in the analysis:
• BPXA’s Central Compression Plant (CCP), and • BPXA’s Central Gas Facility (CGF).
Figure 1-1 shows the locations of these facilities in relation to the GTP. Emissions from the CCP and CGF sources generally consist of gas-fired compressor turbines, gas-fired heaters, and emergency equipment. For conservatism in this modeling demonstration, these offsite sources were modeled at their potential-to-emit.
No other sources were explicitly modeled because they are either not expected to produce a significant concentration gradient in the vicinity of the GTP or are included implicitly as part of the background concentration.
Modeled emissions and stack parameters for the CCP and CGF emission units were developed from the respective facility’s most recent Title V operating permits and a review of historical dispersion modeling information submitted to ADEC supporting various permit applications. Table 4-5 lists the data sources used to develop modeling inputs for the offsite sources. Additional details regarding the development of modeled emissions and parameters for these sources can be found in Appendix A. However, given the proximity of these facilities to the GTP, certain assumptions were revisited based on more recent available data to appropriately characterize impacts and reduce over-predicting impacts from these offsite sources. The following model inputs were revisited:
• Turbine in-stack NO2/NOx ratios were developed based on recent available data in USEPA and ADEC databases (final values listed in Appendix A) since they has not been previously developed for this source.
• Effective Building Dimensions (EBDs) were revisited due to complex building arrangements at CGF and CCP which create high aspect ratios of width and/or length to height for the buildings, and due to stacks which are short relative to the adjacent buildings. The USEPA default method of developing EBDs with BPIPPRM is known to over predict impacts for high aspect ratio buildings and this was occurring for the CCP and CGF. Therefore a standard, approach using a wind tunnel evaluation of the CGF and CCP was conducted to refine some EBDs. Scale models of both facilities were evaluated in the wind tunnel and EBDs were developed for the stacks and wind directions that were found through AERMOD modeling to be most likely to produce the greatest over-prediction of ground-level pollutant concentrations. This evaluation was conducted in coordination with CPP Wind.
4.2.2 Far-Field Existing Sources In addition to the above near-field sources, the far-field modeling analysis also included existing sources not close enough to cause a significant concentration gradient in the near-field, but which could create such gradients within the far-field modeling domain. Figure 4-1 lists the sources included in the modeling and plots their proximity to Sensitive Class II areas as well as the GTP. Table 4-5 lists the data sources used to develop the modeling inputs for the far-field existing offsite sources. Additional details regarding the development of modeled emissions and parameters can be found in Appendix A.
AIR QUALITY MODELING REPORT - GTP
USAG-P1-SRZZZ-00-000001-000 7-OCT-16
REVISION: 1
PUBLIC PAGE 46 OF 112
4.2.3 Reasonably Foreseeable Development In order to ensure that potential impacts in the Sensitive Class II areas would be fully addressed, ADEC was contacted regarding other new projects throughout the state that are currently engaged in the permitting process or in construction, and may become operational over the next several years. Lists of such projects were developed following review of Resource Report No. 1 and in consultation with ADEC for the modeling domain containing the Project’s GTP. Figure 4-1 lists the Reasonably Foreseeable Development (RFD) sources included in the modeling and displays their proximity to Sensitive Class II areas as well as the proposed GTP. Table 4-5 lists the data sources used to develop the modeling inputs for the far-field existing offsite sources. Details regarding the development of modeled emissions and parameters can be found in Appendix A.
Note that compressor and heater stations associated with the Project pipeline were not included as RFD sources and were not modeled as part of the cumulative impact analysis. This is because emissions from these Project sources would not be large enough to significantly contribute to maximum far-field impacts dominated by the GTP nor are impacts from these sources likely to be collocated in space and time with those from the GTP. Furthermore, the Project is submitting a separate near-field air quality analysis to specifically address impacts from those compressor and heater stations that are close enough to Sensitive Class II areas to warrant modeling obviating the need to address them in this analysis.
AIR QUALITY MODELING REPORT - GTP
USAG-P1-SRZZZ-00-000001-000 7-OCT-16
REVISION: 1
PUBLIC PAGE 47 OF 112
Figure 4-1: Locations of Far-Field Existing and Reasonable Foreseeable Development Sources
AIR QUALITY MODELING REPORT - GTP
USAG-P1-SRZZZ-00-000001-000 7-OCT-16
REVISION: 1
PUBLIC PAGE 48 OF 112
Table 4-5: Sources of Modeling Inputs for Offsite Facilities
Facility Source of Data Used in Dispersion Modeling PSD Increment
Review of historical dispersion modeling information submitted to ADEC supporting Title V operating permit applications (ENSR 1989, ENSR 2008)
Title V ADEC Air Quality Control Operating Permit No. AQ0166TVP01
Review of historical dispersion modeling information submitted to ADEC supporting Title V operating permit applications (ENSR 1989, ENSR 2008)
NO 2: Partial SO 2: Partial PM 10: Partial PM 2.5: No
BPXA Central Gas Facil ity (CGF)
Review of historical dispersion modeling information submitted to ADEC supporting Title V operating permit applications (ENSR 1991, ENSR 2008)
Title V ADEC Air Quality Control Operating Permit No. AQ0270TVP01
Review of historical dispersion modeling information submitted to ADEC supporting Title V operating permit applications (ENSR 1991, ENSR 2008)
NO 2: Partial SO 2: Yes PM 10: Yes PM 2.5: No
Far-Field Existing Facil ities
2011 National Emissions Inventory (NEI 2011).
2011 National Emissions Inventory (NEI 2011).
All facil ities modeled as volume sources with release height of 10 m, sigma-y of 2.33 m and sigma-z of 2.33 m.
Appendix A lists the PSD consumption status for each facil ity.
Reasonably Foreseeable Development Facil ities
Permit documents available at: http://dec.alaska.gov/Applications/Air/airtoolsweb/AirPermitsApprovalsAndPublicNotices
Permit documents available at: http://dec.alaska.gov/Applications/Air/airtoolsweb/AirPermitsApprovalsAndPublicNotices
All facil ities modeled as volume sources with release height of 10 m, sigma-y of 2.33 m and sigma-z of 2.33 m.
NO 2: Yes SO 2: Yes PM 10: Yes PM 2.5: Yes
AIR QUALITY MODELING REPORT - GTP
USAG-P1-SRZZZ-00-000001-000 7-OCT-16
REVISION: 1
PUBLIC PAGE 49 OF 112
5.0 NEAR-FIELD MODELING METHODOLOGY This section describes the methodology used to model the GTP and background source emissions with the purpose to assess ambient concentrations to a distance of approximately 10 kilometers.
5.1 MODEL SELECTION Selection of the appropriate dispersion model for use in the required ambient air quality impact analysis is based on the available meteorological input data, the physical characteristics of the emission units that are to be simulated, the land use designation in the vicinity of the source under consideration, and the complexity of the nearby terrain. The USEPA-approved American Meteorological Society/USEPA Regulatory Model (AERMOD) modeling system was used to assess the potential impacts from the proposed Project. AERMOD is recommended for use in modeling multi-source emissions, and can account for plume downwash, stack tip downwash, and point, area, and volume sources (USEPA 2004, 2007). AERMOD also has the ability to simulate impacts at both flat and complex terrain receptors.
The version numbers of the AERMOD model and pre-processors that will be used include:
• AERMET version 15181 • AERMOD version 15181 • Building Profile Input Program, PRIME version, (BPIPPRM) version 04274
5.2 MODEL OPTIONS AERMOD model input options for Project sources were set to their regulatory default values (USEPA 2015a) with the exception of the NO2 modeling methodology, discussed below in Section 5.7.
The BETA AERMOD model option was used for all averaging periods and pollutants in the cumulative modeling to apply USEPA-recommended adjustments to buoyancy and dispersion for horizontal stacks located at CGF and CCP. These adjustments were invoked in AERMOD through the use of the POINTHOR keyword.
The use of these non-default BETA options currently requires case-by-case approval from USEPA. However, ADEC prefers applicants use these options as it ensures correct adjustments are made to stack characteristics and prevents any errors that could be made by manually implementing the stack adjustments (ADEC 2016). Note that USEPA has proposed these options be adopted as regulatory defaults options in their recently proposed revisions to the Modeling Guideline (USEPA 2015b).
5.3 METEOROLOGICAL DATA Hourly meteorological data used for air quality dispersion modeling must be spatially and climatologically representative of the area of interest. The Modeling Guideline recommends a minimum of one year of site specific meteorological data or five consecutive years of representative data collected at the nearest National Weather Service (NWS) station. Required surface meteorological data inputs to the AERMOD meteorological processor (AERMET) include, at a minimum, hourly observations of wind speed, wind direction, temperature, and cloud cover (or solar radiation and low-level vertical temperature difference data in lieu of cloud cover). Morning upper air sounding data from a representative NWS station is also required to generate daytime convective parameters and a complete meteorological dataset.
AIR QUALITY MODELING REPORT - GTP
USAG-P1-SRZZZ-00-000001-000 7-OCT-16
REVISION: 1
PUBLIC PAGE 50 OF 112
Required surface meteorological data and upper air data were processed into a model ready input file using AERMET following the procedures and using the individual datasets described below.
5.3.1 Surface Data The Project area is located approximately six miles northeast of the A-Pad meteorological and air quality monitoring station as shown in Figure 3-1. Because there are no significant terrain features between the A-Pad station and GTP, and due to their close proximity and similar surface characteristics, A-Pad is representative of the conditions at GTP. The A-Pad hourly meteorological data were collected and validated as part of an approved Prevention of Significant Deterioration (PSD) monitoring program following ADEC and USEPA quality assurance guidelines. Five years of recent available A-Pad data were used in this modeling (2009-2013) following Alaska and federal permitting guidance. This exceeds the USEPA requirement of at least one year of on-site data discussed in the Modeling Guideline. The processing of this data is provided below. Note that the processed 2009 through 2011 dataset has been approved for use by ADEC for projects located in the Prudhoe Bay area and has been posted on their website for public use. It can be readily accessed at: https://dec.alaska.gov/air/ap/AERMOD_Met_Data.htm. The 2012-2013 dataset has been processed in an identical manner to the 2009-2011 dataset.
Wind speed, wind direction, sigma-theta, sigma-w, dry bulb temperature, delta temperature, and solar insolation were used from the A-Pad measurements. All parameters with the exception of temperature were recorded at a single 10-meter level. Temperature data recorded both at 2 meter and 10-meter levels were used. These five years all meet the 90 percent per calendar quarter data capture and quality assurance PSD requirements for the aforementioned parameters required for AERMOD (USEPA 2000).
A wind rose for the five years of A-Pad meteorological data after processing is shown in Figure 5-1. Table 5-1 lists the joint data capture for each of the five years after the substitutions discussed below.
Table 5-1: Meteorological Input Data Percent Missing Hours after Processing with AERMET Modeled Period
5.3.2 Upper Air Data The temperature structure of the atmosphere prior to sunrise is required by AERMET to estimate the growth of the convective boundary layer for the day. AERMET uses the 1200 Greenwich Mean Time upper air sounding from the nearest NWS upper air observing station for this purpose. The nearest NWS station to the project area is in Barrow, Alaska, which is located approximately 320 kilometers northwest of the project area. Concurrent upper air data was obtained from the National Oceanic and Atmospheric Administration Earth System Research Laboratory Radiosonde Database1 and provided as input to AERMET.
1 http://w w w.esrl.noaa.gov/raobs/
AIR QUALITY MODELING REPORT - GTP
USAG-P1-SRZZZ-00-000001-000 7-OCT-16
REVISION: 1
PUBLIC PAGE 51 OF 112
5.3.3 Surface Characteristics Surface characteristics including surface roughness length, Bowen ratio, and albedo must be provided to AERMET. A summary of the surface characteristics to be used as input to AERMET is provided in Table 5-2.
Table 5-2: ADEC Approved Surface Characteristics for the North Slope Coastal Plain Surface Parameter Winter Value a Summer Value a
Albedo 0.8 0.18
Bowen Ratio 1.5 0.80
Surface Roughness Length (meters) 0.004 0.02
Notes: a Winter is defined as occurring from October through May and summer is defined as
occurring from June through September. Values and definition of the seasons were provided by ADEC (ADEC 2007a).
These values were applied seasonally over all sectors surrounding the monitoring site. As recommended by ADEC, these values are to be applied on a seasonal basis with summer defined as June through September; and winter defined as October through May.
These values are representative of locations classified as Coastal Wet Tundra. These land use types are specific to the North Slope coastal plain at low elevations near the coast, which are classified as wet sedge tundra and forb tundra dominated by thaw lakes, ice-wedge polygons, frost boils, water tracks, and bogs. Data used to support the values selected were either measured at the Betty Pingo location, or chosen based on a comparison to values measured there. As shown in Figure 5-2, the Betty Pingo location is approximately 8 kilometers east of A-Pad, and both lie within a band of homogenous land cover that extends as much as 30 kilometers inland from the coast. Within this band, there is some variation in the size and density of water features; however, the variation is likely too small to affect the surface characteristics from one site to the next within the band.
The representativeness of the values provided by ADEC have been re-evaluated in light of 2009 USEPA guidance (USEPA 2009), which revised the size of the domain over which the land use surrounding a monitoring site is evaluated. However, since the land cover within 15 kilometers of the monitoring site is homogenous and classified as Coastal Wet Tundra, the revised guidance does not affect the values recommended, or the way they are used in meteorological data processing.
5.3.4 Use of Vertical Wind Speed Standard Deviation (sigma-w) Measurements Additional data processing was performed on site-specific sigma-w measurements that are extremely low (near or at zero and below instrument threshold values). Following recommendations provided by USEPA’s AERMOD modeling contractor (Brode 2005) any reported values of site-specific sigma-w below 0.1 m/s were set to missing as discussed below.
The reason for eliminating zero or near-zero values of sigma-w input to AERMOD is to avoid an anomalous problem in the model that can be caused by inappropriate input data. According to information provided by USEPA’s AERMOD modeling contractor, in the absence of observed sigma-w data, the sigma-w profile is calculated in AERMOD based on the boundary-layer parameters, convective velocity scale (w*), and friction velocity (u*). A problem can occur if there is an inconsistent observed sigma w value that causes an inconsistency between the observed sigma-w values and the calculated w* values. Such an inconsistency between w* and observed sigma-w can result in extremely large and unrealistic values of the skewness in convective conditions, which is proportional to (w*/sigma-w)3. This can lead to anomalous plume height and
AIR QUALITY MODELING REPORT - GTP
USAG-P1-SRZZZ-00-000001-000 7-OCT-16
REVISION: 1
PUBLIC PAGE 52 OF 112
sigma-z values for the updraft and downdraft portions of the direct plume in AERMOD. According to Brode, there is no simple solution to the problem without incorporating a feedback loop between the measured sigma-w and the calculation of w*, which is not part of the current AERMOD model. He suggests that users should avoid inputs of anomalously low (especially below instrument threshold) input values of sigma-w to AERMOD. Given that the USEPA recommended vertical wind speed measurement resolution is 0.1 m/s as listed in Table 5-1 of USEPA’s Meteorological Monitoring Guidance for Regulatory Modeling Applications (USEPA 2000), setting input values of measured sigma-w less than 0.1 m/s to missing is consistent with that advice.
AIR QUALITY MODELING REPORT - GTP
USAG-P1-SRZZZ-00-000001-000 7-OCT-16
REVISION: 1
PUBLIC PAGE 53 OF 112
Figure 5-1: Wind Rose of the A-Pad Meteorological Input Data
AIR QUALITY MODELING REPORT - GTP
USAG-P1-SRZZZ-00-000001-000 7-OCT-16
REVISION: 1
PUBLIC PAGE 54 OF 112
Figure 5-2: Land Cover Surrounding the A-Pad and Betty Pingo Monitoring Locations
AIR QUALITY MODELING REPORT - GTP
USAG-P1-SRZZZ-00-000001-000 7-OCT-16
REVISION: 1
PUBLIC PAGE 55 OF 112
5.4 RECEPTORS USEPA regulations define ambient air is as “that portion of the atmosphere, external to buildings, to which the general public has access” (40 CFR 50.1(e)). For the purposes of air quality dispersion modeling, the ambient air quality boundary is typically set around an area to which a source has the ability and right to exclude public access.
The GTP gravel pad edge is a readily identifiable boundary between the sources and the surrounding area and represents a restriction to public access. Furthermore, the GTP would control the gravel pad area and would limit public access. Therefore, that barrier was defined using the gravel pad edge as identified on the facility site plan (Alaska LNG 2016) and was used as the ambient air quality boundary around the facility.
When conducting cumulative modeling, impacts from an offsite source are not included on totals at receptors within that source’s ambient boundary. Therefore, modeling for the GTP alone included receptors within offsite sources; however cumulative modeling of the GTP sources plus offsite sources did not include receptors within offsite source ambient boundaries.
Cartesian receptor grids centered on the GTP were defined using Universal Transverse Mercator (UTM) coordinates. The grids were designed to accurately resolve the highest predicted pollutant impacts while at the same time minimizing model execution time. Several receptor grids of varying resolution were defined for the required model analyses. Experience from previous GTP screening dispersion modeling studies indicates that the highest predicted concentrations would occur well within 10 kilometers of the facility. Therefore, the grids consist of receptors placed as follows:
• 25-meter spacing along the edge of the gravel pad of each stationary source, • 25-meter spacing from the pad edge to at least 100 meters from the pad edge at each
stationary source, • 50-meter spacing from 100 meters to 300 meters from the pad edge at each stationary
source, • 100-meter spacing from 300 meters to 1 kilometer in each cardinal direction from each
stationary source, • 250-meter spacing from 1 kilometer to 5 kilometers in each cardinal direction from each
stationary source, and • 500-meter spacing extending from 5 to 10 kilometers in each direction from the ambient air
boundary (or to the significant impact radius, whichever is less).
As discussed above, the area surrounding the project area is considered featureless. Therefore, all receptor elevations and hill heights were set to zero meters and the AERMAP terrain processor were not required for this analysis. Figure 5-3 depicts the receptor grid in the near field. Figure 5-4 shows the receptor grid out to the 10 kilometer modeling limit. Note that while there are no receptors located in the identified offsite source boundaries, receptors were included within these facility boundaries when determining GTP-only impacts.
5.5 ELEVATION DATA The tundra surrounding the project impact area is relatively flat with few topographic features exceeding more than a few feet in elevation. Therefore, the ground level elevation throughout the entire modeling domain was set to 0 meters. This procedure is a standard modeling protocol for sources located within the Alaska North Slope coastal plain.
The base elevations for all source structures were set to the average elevation of the ambient boundary (gravel pad edge) (assumed to be 0 meters; see Section 5.4), plus 6 feet to account for
AIR QUALITY MODELING REPORT - GTP
USAG-P1-SRZZZ-00-000001-000 7-OCT-16
REVISION: 1
PUBLIC PAGE 56 OF 112
the thickness of the gravel pad. Stack base elevations were set equal to the structure base elevations which accounted for the fact that most facility buildings sit approximately 13 feet off of the ground on pilings (i.e., this 13 feet was included as part of the solid structure). This distance is included in the overall building heights used in the BPIP analysis discussed in Section 5.6.
5.6 BUILDING DOWNWASH AND STACK HEIGHT Building structures that obstruct wind flow near emission points may cause stack discharges to become entrained in the turbulent wakes of these structures leading to downwash of the plumes. Wind blowing around a building creates zones of turbulence that are more intense than if the building were absent. These effects generally can cause excessive ground‐level pollutant concentrations from elevated stack discharges. For this reason, building downwash algorithms are considered an integral component of the selected model.
The modeling analysis followed the guidance provided in the USEPA Guidelines for Determination of Good Engineering Practice (GEP) Stack Height (USEPA 1985). The USEPA GEP regulations specify that the GEP stack height is calculated in the following manner:
HGEP = HB + 1.5L HB = the height of adjacent or nearby structures L = the lesser dimension (height or projected width) of the adjacent or nearby structures).
The effects of plume downwash were considered for all emission units. Direction-specific building dimensions were calculated using the current version of the USEPA-approved Building Profile Input Program (Version 04274). Building dimensions were obtained from Project engineers.
In addition to calculating direction-specific building dimensions, the Building Profile Input Program program also calculates the Good Engineering Practice (GEP) stack height. All stack heights were checked to verify that they are within the GEP stack height limit. A GEP stack height is defined as the greater of 65 meters (213 feet), measured from the ground elevation of the stack, or the formula height (HGEP), as determined from the above equation.
The proposed facility layout is shown in Figure 5-5 and Figure 5-6 for the main pad and camp pad, respectively. The figure details how the actual buildings and structures were simulated in the building downwash analysis and also depicts the proposed ambient boundary.
AIR QUALITY MODELING REPORT - GTP
USAG-P1-SRZZZ-00-000001-000 7-OCT-16
REVISION: 1
PUBLIC PAGE 57 OF 112
Figure 5-3: Near-Field Receptor Grid and Ambient Air Quality Boundary
AIR QUALITY MODELING REPORT - GTP
USAG-P1-SRZZZ-00-000001-000 7-OCT-16
REVISION: 1
PUBLIC PAGE 58 OF 112
Figure 5-4: Far-Field Receptor Grid
AIR QUALITY MODELING REPORT - GTP
USAG-P1-SRZZZ-00-000001-000 7-OCT-16
REVISION: 1
PUBLIC PAGE 59 OF 112
Figure 5-5: Proposed Building and Source Layout as Modeled in BPIP for the GTP Main Pad
AIR QUALITY MODELING REPORT - GTP
USAG-P1-SRZZZ-00-000001-000 7-OCT-16
REVISION: 1
PUBLIC PAGE 60 OF 112
Figure 5-6: Proposed Building and Source Layout as Modeled in BPIP for the GTP Camp Pad
AIR QUALITY MODELING REPORT - GTP
USAG-P1-SRZZZ-00-000001-000 7-OCT-16
REVISION: 1
PUBLIC PAGE 61 OF 112
5.7 NO2 MODELING APPROACH The NAAQS and AAAQS for nitrogen oxides (NOx) are expressed in terms of NO2. For modeling purposes, additional calculations and modeling approaches are used to determine NO2 impacts from modeled NOx emissions. The USEPA Modeling Guideline presents a three-tiered approach that may be applied to modeling 1-hour and annual NO2 impacts. These three tiers are:
• Tier 1: assume full conversion of NO to NO2. In other words, it assumes that all NOx is emitted as NO2.
• Tier 2: multiply the Tier 1 result by an empirically derived ambient NO2/NOx ratio, with 0.80 as the 1-hour national default and 0.75 as the annual national default.
• Tier 3: detailed screening methods may be considered on a case-by-case basis, with the Ozone Limiting Method (OLM) and the Plume Volume Molar Ratio Method (PVMRM) identified as detailed screening techniques.
Preliminary modeling indicated that both the Tier 1 and Tier 2 approaches are too conservative for this analysis. Therefore, a Tier 3 (PVMRM2) approach was implemented in accordance with the following USEPA guidance memos:
• Applicability of Appendix W Modeling Guidance for the 1-hour NO2 National Ambient Air Quality Standard (June 28, 2010);
• Additional Clarification Regarding Application of Appendix W Modeling Guidance for the 1 hour NO2 National Ambient Air Quality Standard (March 1, 2011);
• Clarification on the Use of AERMOD Dispersion Modeling for Demonstrating Compliance with the NO2 National Ambient Air Quality Standard (September 30, 2014); and
• Proposed Revisions to the Appendix W Modeling Guidance for the 1-hour NO2 National Ambient Air Quality Standard (July 14, 2015).
The PVMRM2 approach is a non-default, beta model option that is recommended in the proposed revisions to the Appendix W Modeling Guidance for the 1-hour NO2 National Ambient Air Quality Standard signed on July 14, 2015.
The PVMRM2 option simulates the NOx to NO2 conversion by calculating a ratio of the amount of O3 available to the amount of NOx emitted into a plume at the downwind distance of a receptor from a source. This ratio is then multiplied by the AERMOD-predicted NOx concentrations to determine the NO2 concentrations in the plume. This method also utilizes dispersion coefficients to differentiate between stable and unstable conditions and simulates how plumes from multiple sources may merge or combine downwind of the sources.
Use of PVMRM2 requires that the in-stack NO2/NOx ratio be specified for each NOx-emitting emission unit. USEPA (2011) provides for a default in-stack ratio of 0.5 in the absence of more appropriate source-specific information. Details regarding the NO2/NOx ratio used for each modeled emission unit can be found in Section 4.1.1.1. PVMRM2 was applied prior to comparing all modeled NO2 impacts to applicable standards and thresholds.
To implement the PVMRM2 option, concurrent hourly ozone data is also required. The ozone data file was created by combining five years of ambient measurements (2009 through 2013) from the BPXA A-Pad monitoring station into two conservatively representative composite years of ozone data, a leap year and a non-leap year. The composite years were created by selecting the maximum ozone concentration for a given day and hour across five years of site-specific data collected at A-Pad between January 1, 2009 and December 31, 2013. Hourly concentrations that are either missing or invalid were filled in with the seasonal maximum for the given hour. The seasons were defined as follows:
AIR QUALITY MODELING REPORT - GTP
USAG-P1-SRZZZ-00-000001-000 7-OCT-16
REVISION: 1
PUBLIC PAGE 62 OF 112
• Winter – January 1 through May 31 as well as October 1 through December 31 of a given year; and,
• Summer – June 1 through September 30 of a given year.
5.8 SHORELINE FUMIGATION Shoreline fumigation can occur when a plume is emitted from a tall emissions source, such as a power plant stack, under unique meteorological conditions along a coastal boundary. When a plume is emitted in a stable offshore boundary layer with flow onto the shore, fumigation occurs when the plume impacts an unstable onshore boundary layer, known as the thermal internal boundary layer (TIBL). As shown in Figure 5-7 when the plume in the stable air layer interacts with the TIBL, that layer is mixed to the ground and can result in elevated concentrations of ground-level pollutants from both near-shoreline plumes and other regional sources of emissions.
USEPA’s Modeling Guideline advises that air quality modeling analyses should address conditions when fumigation is expected to occur from sources near or just inland of the shoreline. The GTP facility is located in relative close proximity to the shoreline at a distance of approximately 2,150 meters. However, it is expected that the TIBL height at this distance would be well above the plume height for any of the GTP emission sources. In that case, there would be no interaction between the plume and the TIBL and thus no fumigation would occur.
AERMOD does not have the ability to evaluate fumigation impacts. Therefore, understand if fumigation would occur, an analysis using TIBL height equations from the SCREEN3, OCD, and SDM (i.e., dispersion models that include fumigation algorithms) models was conducted and compared to the expected final plume height for the various GTP emission sources. The GTP is approximately 2,150 meters from the shoreline. The tallest stacks are the treated gas compressor turbine stacks, the CO2 compressor turbine stacks, and the power generator turbine stacks, which are all 73.15 meters tall, as well as the building heat medium heaters which are all at 70.71 meters tall. Calculations of the TIBL height gave a TIBL height over 200 meters at a distance of 2,150 meters inland. This height leads to a reasonable assumption that fumigation would not occur for the GTP emission sources. This was confirmed by a screening fumigation analysis conducted with AERSCREEN (version15181). The analysis indicated that for 73.15 meter tall stacks located at a distance of 2,150 meters from the shoreline, the TIBL height would be well over 200 meters and the final plume height would be below 200 meters. For the remaining sources with shorter stacks, i.e., emergency diesel equipment, flares, operations camp heaters, and buyback gas bath heaters, their plumes will be well below the TIBL as well. As a result, it is conclusive to say that fumigation will not occur at GTP and a detailed fumigation analysis is not needed.
AIR QUALITY MODELING REPORT - GTP
USAG-P1-SRZZZ-00-000001-000 7-OCT-16
REVISION: 1
PUBLIC PAGE 63 OF 112
Figure 5-7: Depiction of Typical Shoreline Fumigation (Stunder et al. 1986)
AIR QUALITY MODELING REPORT - GTP
USAG-P1-SRZZZ-00-000001-000 7-OCT-16
REVISION: 1
PUBLIC PAGE 64 OF 112
6.0 SENSITIVE CLASS II AREA MODELING METHODOLOGY This section describes the methodology of modeling GTP and background source emissions with the purpose to assess ground-level ambient concentrations, visibility, and acidic deposition in Sensitive Class II areas (Arctic National Wildlife Refuge and Gates of the Arctic National Park and Preserve/Wilderness).
6.1 MODEL SELECTION The analyses was performed using the USEPA-approved version of the CALPUFF modeling system (Version 5.8) that was modified by the U.S. Fish and Wildlife Services (USFWS) to account for Polar Stereographic coordinate system (BLM 2012). This modeling system includes the following processors:
• CALPUFF – Version 5.8.4 – Level 130731 • CALMET – Version 5.8 – Level 070623 • POSTUTIL – Version 1.56 – Level 070627 • CALPOST – Version 6.221 – Level 082724
At the time that this analysis was complete, with the exception of CALMET which was modified by USFWS to account for Polar Stereographic coordinate system (BLM 2012), these were the most current USEPA-approved versions of the CALPUFF modeling system. Since that time USEPA released updated versions of CALPUFF and CALMET. Version 5.8.5 (Level 151214) replaces Version 5.8.4 (Level 130731). The USEPA-approved version of CALPOST remains at Version 6.221 (Level 080724). CALPUFF and CALMET were updated to incorporate minor bug fixes. For this analysis, these new versions will result in negligible differences from those predicted with the previous versions; hence were not incorporated into this analysis which would delay submittal.
6.2 MODEL INPUTS Point source parameters and emissions rates that were used to model GTP sources are provided in Table 4-3 and Table 4-4. In addition to the above sources, the far-field modeling analysis also included existing sources and reasonably foreseeable development sources. Table 4-5 lists the data sources used to develop the modeling inputs for these sources.
For visibility modeling, particulate matter emissions were speciated into filterable (elemental carbon) and condensable (secondary organic aerosol) according to the AP-42 for each source type. Detailed emissions calculations are documented in Appendix A.
All source locations were referenced to Polar Stereographic coordinate system, centered at 71.3ºN, 155ºW. Building downwash parameters were used for the Project sources as described in Section 5.6 and modeled with the PRIME algorithm.
6.3 MODEL OPTIONS All CALPUFF model options that were used conform to the USEPA guidance (USEPA 2006) or defaults (“MREG = 1” option in CALPUFF). Ammonia-limiting method in POSTUTIL program was used to repartition nitric acid and nitrate on a receptor-by-receptor and hour-by-hour basis to account for over-prediction due to overlapping puffs in CALPUFF. It was accomplished by turning on the option “MNITRATE” to 1 and “NH3TYP” to 3.
AIR QUALITY MODELING REPORT - GTP
USAG-P1-SRZZZ-00-000001-000 7-OCT-16
REVISION: 1
PUBLIC PAGE 65 OF 112
The CALPOST model options and inputs followed the FLAG 2010 guidance and inputs (USDOI 2010). Visibility modeling used “MVISBK = 8” and “M8_MODE= 5” options to compute background extinction. The extinction coefficients for the modeled Sensitive Class II areas are not provided in the FLAG 2010 document. Due to coastal location of the Class II areas and high natural concentration of sea salt, values for the coastally located Tuxedni Wilderness Area natural conditions from FLAG 2010 were used for visibility modeling of the two Sensitive Class II areas. For comparison, FLAG 2010 reports a sea salt concentration of 0.38 µg/m3 at Tuxedni and the limited monitoring data (2/2012-12/2012) from Deadhorse indicates a similar concentration of 0.4 µg/m3.
The annual average concentrations, Rayleigh scattering coefficient, and sea salt concentrations were taken from FLAG 2010 Table 6. The monthly relative humidity adjustment factors for large sulfate and nitrate particles were taken from FLAG 2010 Table 7 and for small particles from FLAG 2010 Table 8. The sea salt relative humidity adjustment factors were taken from FLAG 2010 Table 9.
6.4 MODELING DOMAIN The modeling domain was limited by the gridded meteorological input data obtained for use on this project (reference Section 6.6). The modeling domain is 620 460 kilometers, which is large enough to encompass the GTP, cumulative sources, and receptors at Sensitive Class II areas within 300 kilometers of the GTP. The domain used a Polar Stereographic coordinate system centered at (71.3ºN, 155ºW) with a 10-kilometer grid size. Where possible, the edge of the domain was extended at least 50 kilometers from the nearest receptor to ensure the model captured potential recirculation effects.
The horizontal resolution and geographic projection and datum was based on the Weather Research and Forecasting (WRF) meteorological data grid. The following vertical layers were used:
The modeling domain along with source locations, ozone monitoring site, and Sensitive Class II receptors is provided in Figure 6-1.
6.5 OZONE AND AMMONIA DATA Representative ozone and ammonia data are required for use in the chemical transformation of primary pollutant emissions. Hourly ozone is used by CALPUFF to account for the oxidation of NOx and SO2 emissions to nitric acid and sulfuric acid, respectively. The predicted nitric acid and sulfuric acid are then partitioned in CALPUFF between the gaseous and particulate nitrate and sulfate phases based on the available ammonia, and ambient temperature and relative humidity.
Hourly ozone data for 2007-2009 from A-Pad monitor was used in CALPUFF. Missing data were filled with the seasonal maximum values. The ozone station location is depicted in Figure 6-1.
The Western Regional Air Partnership (WRAP)2 and USEPA (in its Best Achievable Retrofit Technology (BART) rule3) have acknowledged the limitations of CALPUFF chemistry for predicting wintertime nitrates. This is especially true for the very cold Alaskan winters, in which the temperatures are often well below the 50ºF that the CALPUFF MESOPUFF-II chemistry is
2 See slide # 9 at http://www.wrapair.org/forums/ssjf/meetings/050907/WRAP_Regional_Modeling_SSJF2.pdf. 3 Federal Register, July 6, 2005, Volume 70, pages 39121 and 39123.
AIR QUALITY MODELING REPORT - GTP
USAG-P1-SRZZZ-00-000001-000 7-OCT-16
REVISION: 1
PUBLIC PAGE 66 OF 112
based upon. The independent evaluations 4 of just nitrate formation show an over-prediction factor ranging from 2 to 4 for just this issue unless very low ammonia background concentrations are input to CALPUFF.
Typically, smaller ammonia concentration results in less secondary particle formation from a modeled source’s SO2 and NOx emissions and would produce less visibility degradation. The Federal Land Managers’ Air Quality Related Values Work Group (FLAG 2010) document suggests using 10 ppbv for grassland, 0.5 ppbv for forests, and 1 ppbv for arid lands, unless better data is available for a specific modeling domain. Despite its importance in atmospheric chemistry and CALPUFF model sensitivity to ammonia levels, ammonia is not routinely measured by any national monitoring network.
The WRAP Modeling Protocol for BART Exemption Screening Analysis for Class I Areas in the Western United States recommends a much smaller background NH3 value of 0.1 ppbv for Alaska (WRAP 2006). This recommendation was used for the WRAP Regional Modeling Center (RMC) BART modeling for sources Alaska as well as for the BART determination modeling for Golden Valley Electric Association (GVEA) Healey Plant 5.
Table 6-1 summarizes predicted and measured ammonia in the western United States and Alaska. Although the values represent many different assumptions (models, resolution, time frame, averaging period) they all indicate a generally low ammonia background value in Alaska with concentrations consistently much lower than 1 ppbv during cold months and higher concentrations during warmer months (note that CALPUFF is not sensitive to ammonia concentrations during warmer temperatures). In addition, an analysis of the satellite data over Alaska conducted for this project found a clear indication of seasonality in measured ammonia levels. Ammonia levels are affected by changes in temperature because vegetation acts as a main source of atmospheric ammonia (besides relatively constant source of livestock waste and fertilizers). As shown in Table 6-2, 30 years of normal temperature data collected from the stations in the North Slope area suggests that the growing season starts in June and lasts through September (temperatures above freezing). The remaining months have freezing temperatures with little to no vegetation on the ground.
These findings, in conjunction with an understanding of CALPUFF’s inherent limitations and conservatisms regarding ammonia and in-transit chemistry, support the use of seasonal rather than annual uniform concentrations of ammonia in the model. Based on seasonality of measured ammonia in the atmosphere and CALPUFF sensitivity of ammonia levels during cold temperatures, a seasonal value of 0.1 ppbv in winter cold months (October – May) and 1.0 ppbv in warmer months (June – September) was used in CALPUFF, as shown in Table 6-3.
4 See Figure 1 and Figure 2 http://mycommittees.api.org/rasa/amp/CALPUFF%20Projects%20and%20Studies/CALPUFF%20Evaluation%20with%20SWWYTAF,%202009,%20Kharamchandani%20et%20al.pdf 5 See page 30 https://dec.alaska.gov/air/ap/docs/GVEA%20BART%20Final%20Determination%20Report%202-5-10.pdf
AIR QUALITY MODELING REPORT - GTP
USAG-P1-SRZZZ-00-000001-000 7-OCT-16
REVISION: 1
PUBLIC PAGE 67 OF 112
Table 6-1: Summary of Ambient Ammonia Levels Literature Review
Source of Estimate NH3 (ppb) Description Location Year(s)
Adams et al. (1999) Plate 3 0.003-0.01 Modeled annual
average North Slope, Alaska 1990s
Chen et al. (2011) Figure 1
Low est at Yellow stone, WY (monthly average of 0.1-0.4 ppb) and highest at Cedar Bluff, KY (1.7-4.6 ppb) and Bondville, IL (1.2-5.2 ppb)
Collected NH3 concentrations at 9 existing IMPROV E monitoring sites
Rocky Mountains region in the w estern US
2010-2012
Osada et al. (2011) <0.224
Suggested conclusion from marine modeling studies
“Remote” Marine Regions 2000s
Dentener and Crutzen (1994) Figure 2a and Fig. 3a
0.06-0.1 Modeled annual average North Slope, Alaska 1980/1990s
Schirokauer et al. (2014) Table 3 and Figure 12
0-14 ppm in May-August, 14-95 ppbv during May-October
Measured NH3 at 7 sites during May-October
Southeast Alaska 2008-2009
Shepard et al. (2011) Figure 2 0.0-1.25
Modeled monthly average for most months
North Slope, Alaska 2000s
Xu and Penner (2012) Fig. 2 and Fig. 5 0.001-0.01 Modeled annual
average North Slope, Alaska 1990/2000s
Table 6-2: 30-Year (1981-2010) Climatological Normal Temperatures in degrees Fahrenheit Station Jan Feb Mar Apr May Jun Jul Aug Sep Oct Nov Dec CHANDALAR LAKE -15 -11 -2 16 38 53 56 48 35 15 -6 -10
Temperature data obtained from the National Climatic Data Center
AIR QUALITY MODELING REPORT - GTP
USAG-P1-SRZZZ-00-000001-000 7-OCT-16
REVISION: 1
PUBLIC PAGE 68 OF 112
Table 6-3: Proposed Ambient Ammonia Background Concentrations for Use in CALPUFF Jan Feb Mar Apr May Jun Jul Aug Sep Oct Nov Dec Monthly Ammonia Concentration (ppb) 0.1 0.1 0.1 0.1 0.1 1.0 1.0 1.0 1.0 0.1 0.1 0.1
No near-field visibility modeling is required for GTP because all Class I and Sensitive Class II areas are more than 50 kilometers away from the site.
6.6.2 Far-Field Analysis As noted in Section 6.5 above, CALPUFF uses measurements of background ammonia concentrations to estimate secondary particulate formation which contributes to the amount of regional haze and visibility degradation predicted by the model. CALPUFF simulates each modeled source individually; thus, the background ammonia concentration is assumed by the model to be fully available to react with emissions from each source. This can lead to the model overestimating secondary particulate formation and regional haze impacts because, in reality, the total emissions from the combination of emission units compete for the available ammonia. Therefore actual secondary particulate formation would be less due to less background ammonia availability. Despite the inherent conservatism in the model, far-field cumulative regional haze impacts were determined by conventional utilization of CALPUFF.
Regional haze impacts due to the GTP were refined by subtracting the existing regional haze impact from the cumulative regional haze impact, as shown below. This was accomplished by conventional utilization of CALPUFF for the cumulative and existing source groups noted below and post-processing using the POSTUTIL program.
This refined method better accounts for the fact that the available background ammonia is partially consumed by the existing emission source inventory.
6.7 METEOROLOGICAL DATA 6.7.1 Prognostic Meteorological Data
The latest available three-year (2007-2009) Weather Research and Forecasting Model (WRF) dataset developed for the Bureau of Ocean Energy Management (BOEM) (Zhang et al. 2013) were used as the gridded, domain-wide prognostic meteorological dataset. This dataset has been previously used for the far-field dispersion modeling for the ConocoPhillips Alaska, Inc. Greater Mooses Tooth 1 Air Quality Impact Analysis (AECOM 2013). This report is listed on the U.S. Department of the Interior’s Bureau of Land Management’s (BLM) NEPA register.
6.7.2 MMIF The WRF meteorological data was processed using the latest version of the Mesoscale Model Interface Program (MMIF), currently Version 3.2 (ENVIRON 2015), to develop a meteorological wind field. The MMIF/CALPUFF modeling domain is shown by the blue line in Figure 6-1.
Project Regional Haze Impact (GTP
Sources Only) = Cumulativ e Regional Haze Impact
(Offsite Sources + GTP Sources)
- Background Sources Regional
Haze Impact (Offsite
Sources Only)
AIR QUALITY MODELING REPORT - GTP
USAG-P1-SRZZZ-00-000001-000 7-OCT-16
REVISION: 1
PUBLIC PAGE 69 OF 112
The WRF model output was processed with MMIF with the following options selected:
• Output for CALPUFF version 5.8, • The WRF vertical layers were interpolated to the FLM/USEPA-recommended (USEPA 2006)
vertical layers using the TOP option, as follows: o 20, 40, 80, 160, 320, 640, 1200, 2000, 3000, 4000, and
• The Pasquill-Gifford stability classes were calculated with the Golder option.
6.8 RECEPTORS Receptor placement for Sensitive Class II areas was designed similar to receptors developed by the National Park Service for Class I areas. Receptors were placed every 6 kilometers vertically and every 3 kilometers horizontally. Receptors beyond 300 kilometers of the GTP were not modeled. The receptors are shown in Figure 6-1.
6.9 ELEVATION DATA The terrain data for Sensitive Class II receptors were extracted from GTOPO30 30-sec data (about 900 meter resolution) using TERREL program (CALMET pre-processor).
6.10 NO2 MODELING APPROACH Section 5.7 discusses the three-tiered approach that may be applied to modeling 1-hour and annual NO2 impacts. Preliminary modeling indicated that assuming full conversion of NO to NO2 (Tier 1) was too conservative for the Sensitive Class II Area modeling analysis. Therefore, consistent with recent USEPA guidance (USEPA 2014b), Tier 2 (ARM) was implemented where Tier 1 results will be multiplied by the default 1-hour and annual NO2/NOx ratios of 0.80 and 0.75, respectively.
AIR QUALITY MODELING REPORT - GTP
USAG-P1-SRZZZ-00-000001-000 7-OCT-16
REVISION: 1
PUBLIC PAGE 70 OF 112
Figure 6-1: Far-Field Modeling Domain
AIR QUALITY MODELING REPORT - GTP
USAG-P1-SRZZZ-00-000001-000 7-OCT-16
REVISION: 1
PUBLIC PAGE 71 OF 112
7.0 MODELING RESULTS The results of the ambient air quality modeling analyses for the GTP are presented in this Section. Both near-field and Sensitive Class II area analyses are discussed below. The analyses were conducted according to the technical approaches, source emission rates, and stack parameters presented in previous sections.
Electronic input and output files for all model runs used to develop the results in the tables that follow are transmitted digitally with this report (Doc. No. USAG-P1-SRZZZ-00-000001-001).
7.1 NEAR-FIELD DISPERSION MODEL IMPACTS This section presents results for modeled receptors within approximately 50 kilometers of the GTP.
7.1.1 Criteria Pollutant Project Only Impacts Modeled impacts resulting from the normal operations scenario developed for the GTP were compared to applicable standards discussed in Section 2.0. Model-predicted concentrations from only the GTP sources are compared to the NAAQS and AAAQS in Table 7-1 and the PSD Increments in Table 7-2 for information purposes since it is more appropriate to compare cumulative impacts to these standards. Note that modeling of the facility alone included receptor locations within the ambient boundaries of offsite sources.
AIR QUALITY MODELING REPORT - GTP
USAG-P1-SRZZZ-00-000001-000 7-OCT-16
REVISION: 1
PUBLIC PAGE 72 OF 112
Table 7-1: GTP Facility-Only NAAQS/AAAQS Air Quality Compliance Analysis – Normal Operations
Air Pollutant Averaging Period
Modeled Concentration
(µg/m3)
Ambient Background
Concentration (µg/m3)
Total Concentration
(µg/m3)
NAAQS (µg/m3)
AAAQS (µg/m3)
Sulfur Dioxide
1-Hour a 11.2 9.39 20.6 196 196
3-Hour b 37.7 20.96 58.7 1,300 1,300
24-Hour b 11.2 8.12 19.3 NA 365
Annual d 0.5 1.8 2.3 NA 80
Carbon Monoxide 1-Hour b 366.0 1,150 1,516 40,000 40,000
8-Hour b 139.0 1,150 1,289 10,000 10,000
Nitrogen Dioxide 1-Hour c 65.0 NA g 65.0 188 188
Annual d 2.6 6.0 8.6 100 100
Particulate Matter less than 10 Microns 24-Hour f 3.8 50.0 53.8 150 150
Particulate Matter less than 2.5 Microns
24-Hour e 3.3 15.0 18.3 35 35
Annual h 0.2 3.7 3.9 12 12
Abbreviations: NA = not applicable µg/m3 = micrograms per cubic meter
Notes: a Value reported is the 99th percentile of the annual distribution of daily maximum values averaged over the modeled period. b Value reported is the highest, second highest concentration of the values determined for each of the modeled period. c Value reported is the 98th percentile of the annual distribution of daily maximum values averaged over the modeled period. d Value reported is the maximum annual average concentration for the modeled period. e Value reported is the 98th percentile averaged over the modeled period. f Value reported is the highest, 6th highest concentration over the modeled period. g The 1-hour NO 2 modeling was conducted with wind speed-varying background values applied by hour in AERMOD. Therefore,
the AERMOD-predicted 1-hour NO 2 concentration includes the background. These background values are summarized in Table 3-2.
h Value reported is the annual mean concentration, averaged over the 5-year period.
AIR QUALITY MODELING REPORT - GTP
USAG-P1-SRZZZ-00-000001-000 7-OCT-16
REVISION: 1
PUBLIC PAGE 73 OF 112
Table 7-2: Comparison of GTP-Only Model-Predicted Concentrations to Increment Thresholds – Normal Operations
Air Pollutant Averaging Period
AERMOD-Predicted Concentration
(µg/m3)
Class II Increments
(µg/m3)
Sulfur Dioxide
1-Hour a NA NA
3-Hour b 37.7 512
24-Hour b 11.2 91
Annual c 0.5 20
Carbon Monoxide 1-Hour a NA NA
8-Hour a NA NA
Nitrogen Dioxide 1-Hour a NA NA
Annual c 2.6 25
Particulate Matter less than 10 Microns 24-Hour b 4.8 30
Annual c 0.3 17
Particulate Matter less than 2.5 Microns 24-Hour b 4.8 9.0
Annual c 0.3 4.0
Abbreviations: NA = not applicable µg/m3 = micrograms per cubic meter
Notes: a Neither USEPA nor ADEC have established increment thresholds for 1-hour NO 2, 1-hour SO 2, 1-hour CO, or 8-hour CO. b Value reported is the maximum of the highest-second-high values from each of the five modeled years. c Value reported is the maximum annual average concentration for the 5-year period.
AIR QUALITY MODELING REPORT - GTP
USAG-P1-SRZZZ-00-000001-000 7-OCT-16
REVISION: 1
PUBLIC PAGE 74 OF 112
7.1.2 Criteria Pollutant Cumulative Impacts Cumulative model-predicted concentrations from the GTP and offsite sources at Potential to Emit (PTE) were compared to the NAAQS and AAAQS in Table 7-3. Cumulative model-predicted concentrations were also compared to PSD Class II increments in Table 7-4. All model-predicted impacts are below the applicable standards and increments outlined in Section 2.0.
Lead and ammonia emissions are either negligible or not emitted at all from the GTP; therefore, they were not addressed as part of the dispersion modeling analysis.
Predicted cumulative impacts indicate compliance with all applicable standards and thresholds. This was possible even in light of the following conservative assumptions:
• All gas-fired emission units combust a gaseous fuel with up to 5.6 grains sulfur/100 scf, or 96 ppmv sulfur content, which is conservatively representative of PBU raw fuel gas which is likely only to occur during start-up. The GTP would typically operate on treated gas which will have a much lower sulfur content.
• With the exception of intermittently-used emergency equipment, all emission sources are assumed to be operating at all times.
• 500 hours per year of emergency maximum flaring is included in the modeling demonstration in addition to continuous pilot purge and all other equipment operating. While emergency flaring is inevitable, it is unlikely to occur as much as 500 hours per year and is unlikely to occur with all other equipment operating.
• A worst-case background ozone dataset was developed for the NO2 modeling based on the maximum ozone concentration observed for a given day and hour. Any hours with missing or invalid data were replaced with a seasonal maximum.
Refinement of any of these assumptions would certainly result in lower facility impacts. Electronic input and output files for all model runs used to develop the results will be transmitted digitally with this modeling report.
AIR QUALITY MODELING REPORT - GTP
USAG-P1-SRZZZ-00-000001-000 7-OCT-16
REVISION: 1
PUBLIC PAGE 75 OF 112
Table 7-3: Cumulative NAAQS/AAAQS Air Quality Compliance Analysis – Normal Operations
Air Pollutant Averaging Period
AERMOD-Predicted
Concentration (µg/m3)
Ambient Background
Concentration (µg/m3)
Total Concentration
(µg/m3)
NAAQS (µg/m3)
AAAQS (µg/m3)
Sulfur Dioxide
1-Hour a 39.2 9.39 48.6 196 196
3-Hour b 57.0 20.96 78.0 1,300 1,300
24-Hour b 30.1 8.12 38.2 NA 365
Annual d 2.8 1.8 4.6 NA 80
Carbon Monoxide 1-Hour b 423.0 1,150 1,573 40,000 40,000
8-Hour b 302.0 1,150 1,452 10,000 10,000
Nitrogen Dioxide 1-Hour c 158.0 NA g 158.0 188 188
Annual d 14.0 6.0 20.0 100 100
Particulate Matter less than 10 Microns 24-Hour f 18.4 50.0 68.4 150 150
Particulate Matter less than 2.5 Microns
24-Hour e 14.5 15.0 29.5 35 35
Annual h 3.3 3.7 7.0 12 12
Abbreviations: NA = not applicable µg/m3 = micrograms per cubic meter
Notes: a Value reported is the 99th percentile of the annual distribution of daily maximum values averaged over the modeled period. b Value reported is the highest, second highest concentration of the values determined for each of the modeled years. c Value reported is the 98th percentile of the annual distribution of daily maximum values averaged over the modeled period. d Value reported is the maximum annual average concentration for the modeled period. e Value reported is the 98th percentile averaged over the modeled period. f Value reported is the highest, 6th highest concentration over the modeled period. g The 1-hour NO 2 modeling was conducted with wind speed-varying background values applied by hour in AERMOD. Therefore,
the AERMOD-predicted 1-hour NO 2 concentration includes the background. These background values are summarized in Table 3-2.
h Value reported is the annual mean concentration, averaged over the 5-year period.
AIR QUALITY MODELING REPORT - GTP
USAG-P1-SRZZZ-00-000001-000 7-OCT-16
REVISION: 1
PUBLIC PAGE 76 OF 112
Table 7-4: Comparison of Cumulative Model-Predicted Concentrations to Increment Thresholds – Normal Operations
Air Pollutant Averaging Period
AERMOD-Predicted Concentration
(µg/m3)
Class II Increments
(µg/m3)
Sulfur Dioxide
1-Hour a NA NA
3-Hour b 52.9 512
24-Hour b 27.0 91
Annual c 2.0 20
Carbon Monoxide 1-Hour a NA NA 8-Hour a NA NA
Nitrogen Dioxide 1-Hour a NA NA Annual c 6.6 25
Particulate Matter less than 10 Microns 24-Hour b 12.8 30
Annual c 1.2 17
Particulate Matter less than 2.5 Microns 24-Hour b, d 4.8 9.0
Annual c, d 0.3 4.0
Abbreviations: NA = not applicable µg/m3 = micrograms per cubic meter
Notes: a Neither USEPA or ADEC have established increment thresholds for 1-hour NO 2, 1-hour SO 2, 1-hour CO, or 8-hour CO. b Value reported is the maximum of the highest-second-high values from each of the five modeled years. c Value reported is the maximum annual average concentration for the 5-year period. d Based on GTP-only model-predicted concentrations because the offsite sources under consideration (CGF and CCP) are not
increment consuming. The CGF and CCP facil ities were constructed prior to the PM 2.5 baseline date.
AIR QUALITY MODELING REPORT - GTP
USAG-P1-SRZZZ-00-000001-000 7-OCT-16
REVISION: 1
PUBLIC PAGE 77 OF 112
7.2 SENSITIVE CLASS II AREA DISPERSION MODEL -PREDICTED IMPACTS This section presents results for modeled receptors within selected Sensitive Class II areas. Two different emissions cases were modeled based on the sulfur content of the fuel gas combusted by GTP emissions sources. The cases include a 16 ppmv sulfur content case typical of long-term GTP operations where the treated gas produced by the GTP is combusted by the source and a 96 ppmv sulfur content case representative of early GTP operation when the facility is combusting untreated gas. The latter case would occur during the first six months following commissioning of the first gas treatment train. The more conservative 96 ppmv sulfur case was modeled in the near-field AERMOD modeling, and these emissions are presented in Table 4-3. The 16 ppmv sulfur case was the focus of the Sensitive Class II Area dispersion modeling since it is representative of long-term operations and not a transient event during facility commissioning.
7.2.1 Criteria Pollutant Project Only Impacts Modeled impacts resulting from the GTP normal operations scenario are compared to applicable standards discussed in Section 2.0. Model-predicted concentrations from only the GTP are compared to the NAAQS and AAAQS for each of the selected Sensitive Class II areas in Table 7-5 through Table 7-6 and to the PSD Class II increments in Table 7-7 through Table 7-8 for informational purposes only since it is more appropriate to compare cumulative impacts to these standards.
7.2.2 Criteria Pollutant Cumulative Impacts Cumulative CALPUFF-predicted concentrations from the GTP, existing offsite sources, RFD sources, and other non-modeled sources (represented by ambient background concentrations) are compared to the NAAQS and AAAQS for each Sensitive Class II area in Table 7-9 through Table 7-10. The modeling results indicate that the cumulative air quality impacts, combined with representative background air quality data, are well below the NAAQS and AAAQS at all Sensitive Class II areas modeled for all pollutants and averaging periods modeled. Cumulative model-predicted concentrations are compared to PSD Class II Increments in Table 7-11 through Table 7-12. The modeling, which included only increment consuming sources, indicates impacts less than the PSD increment at all Sensitive Class II areas modeled for all pollutants and averaging period.
7.2.3 Ambient Ozone Cumulative Impacts Because ozone is a regional pollutant, the information provided in Section 8.0 is also applicable to the Class I and Sensitive Class II areas included in the air quality modeling analysis. Refer to that section for details.
7.2.4 Secondary PM2.5 and PM10 Formation CALPUFF simulates simple, in-transit transformation of SO2 emissions to ammonia sulfate and NOx emissions to ammonium nitrate. Project PM2.5 and PM10 impacts were calculated using IWAQM guidance and the POSTUTIL processor to include both direct PM impacts along with the modeled ammonia sulfate and ammonium nitrate concentrations. These total PM concentrations are included in the PM2.5 and PM10 concentrations in the NAAQS and PSD increment results tables.
7.2.5 AQRV Visibility Assessment
7.2.5.1 Near-Field Analysis As discussed in Section 5.8, a near-field visibility analysis was not required for GTP.
AIR QUALITY MODELING REPORT - GTP
USAG-P1-SRZZZ-00-000001-000 7-OCT-16
REVISION: 1
PUBLIC PAGE 78 OF 112
7.2.5.2 Far-Field Analysis As shown in Table 7-13, the predicted visibility impacts (reported as the 8th highest percent change in visibility extinction) from the GTP emissions sources at all modeled receptors are below the 5% threshold at Gates of the Arctic National Park and Preserve for all years modeled. Predicted GTP-only visibility impacts of less than 5% demonstrate that the project has an insignificant effect on visibility impairment at this Class II Area.
The predicted visibility impacts from the GTP at all modeled Arctic NWR receptors are below the source-only threshold for two of the three years modeled. With the 2008 meteorological input data, the predicted visibility extinction is higher than the threshold and is equal to 5.5%. Section 7.3.1 provides a discussion of the modeling conservatism and a possibility of lowering the visibility impacts below the 5% threshold.
As shown in Table 7-14, cumulative visibility impacts are higher than the 10% threshold at both Sensitive Class II areas examined for all years modeled. Given the results of the GTP-only modeling and limited culpability assessments, these elevated cumulative impacts are attributed to the offsite sources. In order to demonstrate that the background sources cause the visibility impairment, modeling consisting of only the background sources was conducted and the results are presented in Table 7-15. The background model-predicted visibility impacts (i.e., those predicted without the presence of the GTP) are essentially equal to the cumulative visibility results. This demonstrates that the offsite sources dominate the cumulative results and the GTP is an insignificant contributor. As a further indication of the culpability of the offsite sources in the visibility impacts; Figure 7-1 has been developed to show the location of receptors where impacts are above the 10% cumulative visibility threshold over all three modeled years at Arctic NWR. The figure indicates that the majority of the high impacts occur in the northern part of the Class II Area in the region of the Point Thompson Facility and Kaktovik Power Plant. While cumulative impacts are predicted to be higher than the screening level visibility threshold at some receptors, this should not be taken to indicate there is an existing visibility issue, only that the simple way in which the offsite sources were simulated is resulting in modeling conservatism and elevated impacts and that emissions from GTP sources are a negligible portion of those impacts.
AQRV Acidic Deposition Modeling 7.2.6As shown in Table 7-16 the maximum sulfur deposition flux predicted from the GTP is well below the DAT at all Sensitive Class II areas modeled. Predicted project-only deposition impacts of less than 0.005 demonstrate that the project has an insignificant effect on sulfur deposition at the modeled Class II areas and a cumulative sulfur deposition analysis was not conducted.
Table 7-17 shows that the maximum model-predicted nitrogen deposition flux from only GTP emissions exceeds the DAT at some locations within the Arctic NWR while it is below the DAT at all receptors within the Gates of the Arctic National Park and Preserve.
The maximum predicted cumulative nitrogen deposition flux is presented in Table 7-18 and shows that the cumulative nitrogen deposition flux at both modeled Class II Areas is well below the DAT.
7.3 MODELING CONCLUSIONS This section discusses conclusions based on modeled impacts at near-field receptors as well as at selected Sensitive Class II areas.
AIR QUALITY MODELING REPORT - GTP
USAG-P1-SRZZZ-00-000001-000 7-OCT-16
REVISION: 1
PUBLIC PAGE 79 OF 112
7.3.1 Project-Only Source Modeling Model-predicted impacts due to only emissions from the GTP are below all air quality standards and increments at near-field receptor locations and modeled Sensitive Class II area. This is in spite of the following conservative assumptions that are part of the model simulation: • All equipment located at the GTP is assumed to operate concurrently, even intermittently
used equipment. • Short-term turbine emissions are based on worst-case, rather than average, ambient
temperatures. • 500 hours per year of maximum relief flaring has been assumed in addition to continuous
pilot purge and all other equipment operating. While maximum relief flaring is inevitable, it is unlikely to occur as much as 500 hours per year and is unlikely to occur with all other equipment operating.
Far-field visibility impairment resulting from only GTP emissions are below the 5% threshold at Gates of the Arctic National Park and Preserve, but are slightly above the source-only threshold at Arctic NWR. While the sulfur deposition flux from only GTP emissions is well below the DAT at both Sensitive Class II areas, the nitrogen deposition flux exceeds the DAT at Arctic NWR. These elevated visibility and deposition impacts are likely artifacts of the conservatism built into the model simulation. If the assumptions listed above were refined to reduce conservatism, it is expected that both visibility and deposition impacts from only GTP emissions would be below their respective screening thresholds.
7.3.2 Cumulative Source Modeling Cumulative model-predicted impacts demonstrate compliance with the NAAQS/AAAQS, PSD Increments, and DATs in all Sensitive Class II areas. However, the cumulative visibility impacts exceeded the visibility extinction thresholds at some locations within both the Sensitive Class II areas modeled. Based on analyses conducted, it is apparent these elevated cumulative impacts are attributable to the offsite sources. The modeled cumulative impacts from the offsite sources are likely elevated because of the following: • Elevated visibility impacts due to the Point Thompson Facility and Kaktovik Power Plant
occur in the near-field of these facilities. Because of close proximity of these sources (0.0 to 12.4 kilometers) to the Arctic NWR modeled receptors, AERMOD, rather than CALPUFF would be a better suited model for a short-distance transport.
• Due to lack of readily available data, such as exhaust parameters, existing far-field offsite and RFD sources were modeled with a simplified approach using volume sources, which is very conservative. Refined modeling of these sources using actual stack information would likely lead to lower impacts.
• The deposition thresholds used in this modeling analysis are screening thresholds protective of the most sensitive areas. If better data were available on the deposition impacts of the area modeled, there would be a possibility to refine and increase the acceptable thresholds.
Therefore, there are many ways to reduce conservatism in elevated impacts caused by offsite sources, and as those impacts are decreased, impacts from the GTP will also likely decrease and would remain a small percentage of those impacts.
AIR QUALITY MODELING REPORT - GTP
USAG-P1-SRZZZ-00-000001-000 7-OCT-16
REVISION: 1
PUBLIC PAGE 80 OF 112
Table 7-5: GTP Facility Only NAAQS/AAAQS Air Quality Compliance Analysis – Normal Operations – Arctic NWR
Air Pollutant Av eraging Period
CALPUFF-Predicted
Concentration (µg/m3)
Ambient Background
Concentration (µg/m3)
Total Concentration
(µg/m3)
NAAQS (µg/m3)
AAAQS (µg/m3)
Sulfur Dioxide
1-Hour a 0.07 9.39 9.46 196 196
3-Hour b 0.07 20.96 21.03 1300 1300
24-Hour b 0.03 8.12 8.15 NA 365
Annual d 0.002 1.802 1.802 NA 80
Carbon Monoxide 1-Hour b 17.2 1,150 1,167 40,000 40,000
8-Hour b 2.0 1,150 1,152 10,000 10,000
Nitrogen Dioxide 1-Hour c 0.91 61.69 62.60 188 188
Annual d 0.02 6.00 6.02 100 100
Particulate Matter less than 10 Microns 24-Hour f 0.26 50.00 50.26 150 150
Particulate Matter less than 2.5 Microns
24-Hour e 0.02 15.00 15.02 35 35
Annual d 0.17 3.70 3.87 12 15
Table 7-6: GTP Facility Only NAAQS/AAAQS Air Quality Compliance Analysis – Normal Operations – Gates of the Arctic National Park & Preserve
Air Pollutant Av eraging Period
CALPUFF-Predicted
Concentration (µg/m3)
Ambient Background
Concentration (µg/m3)
Total Concentration
(µg/m3)
NAAQS (µg/m3)
AAAQS (µg/m3)
Sulfur Dioxide
1-Hour a 0.02 9.39 9.41 196 196
3-Hour b 0.03 20.96 20.99 1300 1300
24-Hour b 0.01 8.12 8.13 NA 365
Annual d 0.0004 1.80 1.80 NA 80
Carbon Monoxide 1-Hour b 5.4 1,150 1,155 40,000 40,000
8-Hour b 1.4 1,150 1,151 10,000 10,000
Nitrogen Dioxide 1-Hour c 0.25 61.69 61.94 188 188
Annual d 0.003 6.00 6.00 100 100
Particulate Matter less than 10 Microns 24-Hour f 0.19 50.00 50.19 150 150
Particulate Matter less than 2.5 Microns
24-Hour e 0.01 15.00 15.01 35 35
Annual d 0.06 3.70 3.76 12 15
Abbreviations: NA = not applicable µg/m3 = micrograms per cubic meter
Notes: a Value reported is the 99th percentile of the annual distribution of daily maximum values averaged over the 3-year period. b Value reported is the highest, second highest concentration of the values determined for each of the 3 modeled years. c Value reported is the 98th percentile of the annual distribution of daily maximum values averaged over the 3-year period. d Value reported is the maximum annual average concentration for the 3-year period. e Value reported is the 98th percentile averaged over the 3-year period. f Value reported is the highest, 6th highest concentration over the 3-year period.
AIR QUALITY MODELING REPORT - GTP
USAG-P1-SRZZZ-00-000001-000 7-OCT-16
REVISION: 1
PUBLIC PAGE 81 OF 112
Table 7-7: Comparison of GTP Facility Only Model Predicted Concentrations to Increment Thresholds – Arctic NWR
Air Pollutant Averaging Period
CALPUFF-Predicted Concentration
(µg/m3)
Class II Increments
(µg/m3)
Sulfur Dioxide
1-Hour a NA NA
3-Hour b 0.07 512
24-Hour b 0.03 91
Annual c 0.002 20
Carbon Monoxide 1-Hour a NA NA
8-Hour a NA NA
Nitrogen Dioxide 1-Hour a NA NA
Annual c 0.02 25
Particulate Matter less than 10 Microns 24-Hour b 0.26 30
Annual c 0.02 17
Particulate Matter less than 2.5 Microns 24-Hour b 0.27 9
Annual c 0.02 4
Table 7-8: Comparison of GTP Facility Only Model Predicted Concentrations to Increment Thresholds – Gates of the Arctic National Park & Preserve
Air Pollutant Averaging Period
CALPUFF-Predicted Concentration
(µg/m3)
Class II Increments
(µg/m3)
Sulfur Dioxide
1-Hour a NA NA
3-Hour b 0.03 512
24-Hour b 0.01 91
Annual c 0.0004 20
Carbon Monoxide 1-Hour a NA NA
8-Hour a NA NA
Nitrogen Dioxide 1-Hour a NA NA
Annual c 0.003 25
Particulate Matter less than 10 Microns 24-Hour b 0.19 30
Annual c 0.01 17
Particulate Matter less than 2.5 Microns 24-Hour b 0.20 9
Annual c 0.01 4 Abbreviations:
NA = not applicable µg/m3 = micrograms per cubic meter Notes: a Neither USEPA nor ADEC have established increment thresholds for 1-hour NO 2, 1-hour SO 2, 1-hour CO, or 8-hour CO. b Value reported is the maximum of the highest-second-high values from each of the five modeled years. c Value reported is the maximum annual average concentration for the 5-year period.
AIR QUALITY MODELING REPORT - GTP
USAG-P1-SRZZZ-00-000001-000 7-OCT-16
REVISION: 1
PUBLIC PAGE 82 OF 112
Table 7-9: Cumulative NAAQS/AAAQS Air Quality Compliance Analysis – Normal Operations Scenario – Arctic NWR
Air Pollutant Av eraging Period
CALPUFF-Predicted
Concentration (µg/m3)
Ambient Background
Concentration (µg/m3)
Total Concentration
(µg/m3)
NAAQS (µg/m3)
AAAQS (µg/m3)
Sulfur Dioxide
1-Hour a 4.3 9.39 13.7 196 196
3-Hour b 4.06 20.96 25.02 1300 1300
24-Hour b 1.20 8.12 9.32 NA 365
Annual d 0.052 1.80 1.85 NA 80
Carbon Monoxide 1-Hour b 53.04 1,150 1,203 40,000 40,000
8-Hour b 16.16 1,150 1,166 10,000 10,000
Nitrogen Dioxide 1-Hour c 16.81 61.69 78.50 188 188
Annual d 0.37 6.00 6.37 100 100
Particulate Matter less than 10 Microns 24-Hour f 4.60 50.00 54.60 150 150
Particulate Matter less than 2.5 Microns
24-Hour e 0.3 15.00 15.3 35 35
Annual d 2.14 3.70 5.84 12 15
Table 7-10: Cumulative NAAQS/AAAQS Air Quality Compliance Analysis – Normal Operations Scenario – Gates of the Arctic National Park & Preserve
Air Pollutant Av eraging Period
CALPUFF-Predicted
Concentration (µg/m3)
Ambient Background
Concentration (µg/m3)
Total Concentration
(µg/m3)
NAAQS (µg/m3)
AAAQS (µg/m3)
Sulfur Dioxide
1-Hour a 0.16 9.39 9.55 196 196
3-Hour b 0.2 20.96 21.1 1300 1300
24-Hour b 0.10 8.12 8.22 NA 365
Annual d 0.003 1.80 1.80 NA 80
Carbon Monoxide 1-Hour b 18.08 1,150 1,168 40,000 40,000
8-Hour b 6.56 1,150 1,157 10,000 10,000
Nitrogen Dioxide 1-Hour c 2.86 61.69 64.6 188 188
Annual d 0.04 6.00 6.04 100 100
Particulate Matter less than 10 Microns 24-Hour f 1.67 50.00 51.7 150 150
Particulate Matter less than 2.5 Microns
24-Hour e 0.08 15.00 15.08 35 35
Annual d 0.73 3.70 4.43 12 15
Abbreviations: NA = not applicable µg/m3 = micrograms per cubic meter
Notes: a Value reported is the 99th percentile of the annual distribution of daily maximum values averaged over the 3-year period. b Value reported is the highest, second highest concentration of the values determined for each of the 3 modeled years. c Value reported is the 98th percentile of the annual distribution of daily maximum values averaged over the 3-year period. d Value reported is the maximum annual average concentration for the 3-year period. e Value reported is the 98th percentile averaged over the 3-year period. f Value reported is the highest, 6th highest concentration over the 3-year period.
AIR QUALITY MODELING REPORT - GTP
USAG-P1-SRZZZ-00-000001-000 7-OCT-16
REVISION: 1
PUBLIC PAGE 83 OF 112
Table 7-11: Comparison of Cumulative Model Predicted Concentrations to Increment Thresholds – Arctic NWR
Air Pollutant Averaging Period
CALPUFF-Predicted Concentration
(µg/m3)
Class II Increments
(µg/m3)
Sulfur Dioxide
1-Hour a NA NA
3-Hour b 4.06 512
24-Hour b 1.20 91
Annual c 0.05 20
Carbon Monoxide 1-Hour a NA NA
8-Hour a NA NA
Nitrogen Dioxide 1-Hour a NA NA
Annual c 0.36 25
Particulate Matter less than 10 Microns 24-Hour b 4.27 30
Annual c 0.29 17
Particulate Matter less than 2.5 Microns 24-Hour b 4.49 9
Annual c 0.29 4
Table 7-12: Comparison of Cumulative Model Predicted Concentrations to Increment Thresholds – Gates of the Arctic National Park & Preserve
Air Pollutant Averaging Period
CALPUFF-Predicted Concentration
(µg/m3)
Class II Increments
(µg/m3)
Sulfur Dioxide
1-Hour a NA NA
3-Hour b 0.20 512
24-Hour b 0.10 91
Annual c 0.003 20
Carbon Monoxide 1-Hour a NA NA
8-Hour a NA NA
Nitrogen Dioxide 1-Hour a NA NA
Annual c 0.04 25
Particulate Matter less than 10 Microns 24-Hour b 1.58 30
Annual c 0.08 17
Particulate Matter less than 2.5 Microns 24-Hour b 1.55 9
Annual c 0.08 4 Abbreviations:
NA = not applicable µg/m3 = micrograms per cubic meter Notes: a Neither USEPA nor ADEC have established increment thresholds for 1-hour NO 2, 1-hour SO 2, 1-hour CO, or 8-hour CO. b Value reported is the maximum of the highest-second-high values from each of the five modeled years. c Value reported is the maximum annual average concentration for the 5-year period.
AIR QUALITY MODELING REPORT - GTP
USAG-P1-SRZZZ-00-000001-000 7-OCT-16
REVISION: 1
PUBLIC PAGE 84 OF 112
Table 7-13: GTP-Only Regional Haze Results
Class II Area Year
Number of Days with Extinction Above 8th Highest
Change in Extinction (%)
Visibility Extinction
Threshold for a Project (%) 5% 10%
Arctic NWR
2007 4 1 3.0 5.0
2008 15 0 5.5 5.0
2009 4 1 4.5 5.0
Gates of the Arctic National Park and Preserve
2007 1 1 1.6 5.0
2008 2 0 2.8 5.0
2009 5 1 2.8 5.0
Table 7-14: Cumulative Regional Haze Results
Class II Area Year
Number of Days with Extinction Above 8th Highest
Change in Extinction (%)
Cumulativ e Visibility
Extinction Threshold (%) 5% 10%
Arctic NWR
2007 142 88 38.7 10.0
2008 197 131 71.3 10.0
2009 162 122 49.3 10.0
Gates of the Arctic National Park and Preserve
2007 76 36 23.0 10.0
2008 94 55 35.9 10.0
2009 69 44 32.5 10.0
Table 7-15: Regional Haze Results for Offsite Existing and RFD Sources Only
Class II Area Year
Number of Days with Extinction Above 8th Highest
Change in Extinction (%)
Cumulativ e Visibility
Extinction Threshold (%) 5% 10%
Arctic NWR
2007 138 87 36.3 10.0
2008 192 129 66.2 10.0
2009 156 119 44.6 10.0
Gates of the Arctic National Park and Preserve
2007 70 33 21.3 10.0
2008 92 50 32.6 10.0
2009 67 41 29.6 10.0
AIR QUALITY MODELING REPORT - GTP
USAG-P1-SRZZZ-00-000001-000 7-OCT-16
REVISION: 1
PUBLIC PAGE 85 OF 112
Table 7-16: GTP-Only Sulfur Deposition Results
Class I/II Area Year Sulfur
Predicted Impact
(kg/ha/yr)
NPS Class I Deposition Analysis
Thresholds (kg/ha/yr)
Percent of DAT
Arctic NWR 3-Year Max 0.001 0.005 18%
Gates of the Arctic National Park and Preserve 3-Year Max 0.0003 0.005 6%
Table 7-17: GTP-Only Nitrogen Deposition Results
Class I/II Area Year
Nitrogen Predicted
Impact (kg/ha/yr)
NPS Class I Deposition Analysis
Thresholds (kg/ha/yr)
Percent of DAT
Arctic NWR 3-Year Max 0.007 0.005 140%
Gates of the Arctic National Park and Preserve 3-Year Max 0.002 0.005 43%
Gates of the Arctic National Park and Preserve 3-Year Max 0.031 0.125 24%
AIR QUALITY MODELING REPORT - GTP
USAG-P1-SRZZZ-00-000001-000 7-OCT-16
REVISION: 1
PUBLIC PAGE 86 OF 112
Figure 7-1: Locations of Cumulative Visibility Impacts above the 10% Visibility Screening Threshold
AIR QUALITY MODELING REPORT - GTP
USAG-P1-SRZZZ-00-000001-000 7-OCT-16
REVISION: 1
PUBLIC PAGE 87 OF 112
8.0 ASSESSMENT OF OZONE AND SECONDARY PARTICULATE IMPACTS
8.1 UNDERSTANDING OZONE CONCENTRATIONS Ozone Chemical Processes 8.1.1
Ozone is not directly omitted from the GTP, therefore, any impacts to ambient ozone as a result of GTP precursor emissions requires an understanding of conditions resulting in ozone formation and destruction in the project area and the possible role that source emissions could play in that formation.
8.1.1.1 Conditions for Ozone Formation Ground level ozone is more accurately referred to as tropospheric ozone. Tropospheric ozone is formed from the chemical reaction between Volatile Organic Compounds (VOC) and NOx. In general ozone concentrations tend to peak near urban-suburban areas, where there are higher amounts of VOC and NOx emissions. Ozone concentrations tend to decrease in rural locations and more remote locations. Since ozone is formed in the atmosphere, rather than directly emitted, VOC and NOx emissions are referred to as ozone precursor emissions or ‘ozone precursors’.
Energy is required to initiate the chemical reactions that form ozone. Commonly this energy is provided by solar radiation. The chemical reaction is initiated by a process called photolysis, which is when molecules are separated by the action of light. Since the reactions that form ozone are driven by solar radiation, ozone is formed more rapidly on sunny days. In the northern hemisphere available solar energy peaks during the summer, although during other times of the year if the surface is highly reflective (such as when there is snow cover) the solar energy can be high enough to form ozone in the presence of ozone precursors.
8.1.1.2 Ozone Formation Chemical Mechanisms Tropospheric ozone formation is initiated by photolysis of NO2. This step begins a series of complex and highly diverse chemical reactions that both produce and destroy ozone in the atmosphere. The exact chemical reactions depend on the presence of multiple chemical compounds in the atmosphere. At the heart of the ozone formation process is the hydroxyl radical (OH). The OH radical can react with either VOC or NOx. When there is more VOC in the atmosphere than NOx (which is referred to as a high VOC-to-NOx ratio) the OH radical will mainly react with VOC, at low VOC-to-NOx ratios the OH radical predominately reacts with NOx.
At a given VOC-to-NOx ratio, the OH will react equally with both compounds. This given value represents the maximum ozone formation, for ratios of VOC-to-NOx less than this optimum ratio, OH reacts predominantly with NO2 removing radicals and retarding ozone formation. Under these conditions a reduction of NOx favors ozone formation. On the other hand, under very low NOx concentrations (high VOC-to-NOx ratios) a decrease in NOx favors certain reactions among peroxy radicals which retard ozone formation.
This complex chemistry implies that ozone production is not simply proportional to the amount of NOx present. At a given level of VOC, there is a NOx concentration that will maximize ozone production that is an optimum VOC-to-NOx ratio. For ratios less than this optimum ratio NOx increases lead to ozone decreases. Urban centers and areas immediately downwind of recently emitted NOx (which is predominately emitted in the form of nitrogen oxide [NO]) tend to have sufficiently low VOC-to-NOx ratios that ozone is destroyed rather than formed. In contrast, rural environments tend to have higher VOC-to-NOx ratios due to the predominance of natural VOC
AIR QUALITY MODELING REPORT - GTP
USAG-P1-SRZZZ-00-000001-000 7-OCT-16
REVISION: 1
PUBLIC PAGE 88 OF 112
emissions from plants (referred to as “biogenic” sources). In effect in most areas, except in areas with fresh NOx emissions, the availability of NOx governs ozone production.
8.1.1.3 Ozone Destruction Processes Ozone formation has a non-linear relationship with its precursors. In particular for NOx, a process called NOx titration occurs in the immediate vicinity of NO sources. Fresh NO emissions are emitted from combustion sources such as power plants and mobile sources. When NOx titrates ozone, ozone is removed by reaction with NO to regenerate nitrogen dioxide (NO2) following this reaction: O3 + NO → NO2 + O
During the daytime this reaction is normally balanced by the photolysis of NO2 that produces atomic oxygen and subsequent ozone. However in the vicinity of large NO emissions during nighttime, the result is the net conversion of ozone to NO2. This process can be considered as an ozone sink. In addition, high NO2 concentrations deflect the initial oxidation step of VOCs by forming other products such as nitric acid (HNO3) which prevent the net formation of ozone.
In addition to the destruction paths indicated above, in Polar Regions during the springtime unique photochemistry converts inert halide salt ions into reactive halogen species that deplete ozone in the boundary layer to near zero levels (Simpson et al. 2007, Oltmans et al. 2012, Helmig et al. 2012, Thompson et al. 2015). These ozone depletion events (ODEs) were first discovered in the 1980s and great advances have been made to understand their dynamics, but many key processes remain poorly understood. It is known that the ODEs are caused by active halogen photochemistry resulting from halogen atom precursors emitted from snow, ice or aerosol surfaces. The role of bromine has been generally accepted, but much less is known about the roles of chlorine and iodine radicals in the ozone depletion chemistry (Simpson et al. 2007, Thompson et al. 2015). The main source of reactive bromine species is bromide from sea salt that is released via a series of photochemical and heterogeneous reactions known as the bromine explosion. ODEs can influence the chemistry in the polar troposphere as it leads to a shift in oxidants and oxidation products. In particular, ozone depletion and halogen chemistry have a significant impact on VOC photochemistry by leading to the rapid destruction of alkanes, alkenes and most aromatics.
Ozone lifetimes 8.1.2
8.1.2.1 Ozone lifetime Tropospheric ozone has two main sources: transport from upper levels of the atmosphere (stratospheric ozone) and photochemical production near the surface. The two main processes involved in the loss of tropospheric ozone are: chemical destruction and uptake of ozone at the surface of the earth (dry deposition). Ozone lifetimes in the troposphere vary significantly depending on altitude, latitude and season. Ozone lifetimes could easily vary between 5 to 30 days. Stevenson et al. (2006) analyzed global tropospheric ozone distributions and lifetimes using an ensemble of 26 atmospheric chemistry models and found a mean ozone lifetime of 22 days. These values imply that once formed, ozone could be subjected to meteorological transport over significant regional scales.
Stohl (2006) developed a climatology of transport in and to the Artic based on a Lagrangian particle dispersion model. Stohl found that the time spent by air masses continuously north of 70°N or Artic Age is highest near the surface in North America. North of 80°N, near the surface the mean Artic age is 1 week in winter and 2 weeks in summer. For ozone in particular, sunlight fuels photolysis reactions and plays an important role in the atmospheric chemistry. In the Arctic winter, however its absence completely inhibits the photochemistry and is then important to
AIR QUALITY MODELING REPORT - GTP
USAG-P1-SRZZZ-00-000001-000 7-OCT-16
REVISION: 1
PUBLIC PAGE 89 OF 112
estimate how long Arctic air is exposed to continuous darkness and how frequently it travels south escaping polar night. Stohl found that the time in complete darkness spent by an air mass in North America is about 10 to 14 days during December. Importantly Stohl also was able to determine three major pathways in which air pollution can be transported into the Arctic: low-level transport followed by ascent in the Arctic, low-level transport alone, and uplift outside the Arctic, followed by descent in the Arctic. Sensitivities of Arctic masses to air pollutant emissions indicate that they are the highest over Siberia and Europe in winter and over the oceans in summer. Stratospheric intrusion was found to be much slower in the Arctic than in midlatitudes.
8.1.2.2 Source and Distance Relationship on Ozone Concentrations Typically as an air mass moves away from an urban center, the VOC-to-NOx ratio changes due to further photochemical reactions, meteorological processes and the influence of fresh emissions. Usually the concentrations of NOx decrease faster than that of VOC because of the presence of fresh biogenic emissions. Thus the VOC-to-NOx ratios increase as one moves away from urban centers and in more suburban, rural, and remote regions the formation of ozone becomes mainly NOx limited. The photochemistry in urban plumes proceeds relatively fast as the oxidation of VOCs leads to increased ozone over a short period of time and to a faster removal of NOx. Hence the regime where ozone formation is controlled by the concentration of NOx is reached sooner.
Baker et al. (2016) performed photochemical modeling simulations of 24 hypothetical single sources in the continental United States to estimate their impacts in ozone concentrations. The modeling showed that downwind impacts varied directionally from each source due to differences in meteorology and chemical environment near the source. An aggregate analysis of maximum daily 8-hour ozone impacts as a function of the distance from the source shows that maximum impacts are not located in close proximity to the modeled emissions sources, but after the peak impact is reached, the ozone concentrations decrease as the distance increases.
Existing Ozone Concentrations 8.1.3At remote locations, natural background ozone concentrations can range between 20 and 40 ppbv. Sources of natural ozone include stratospheric intrusions, wildfires, lightning and vegetation (a.k.a. biogenic sources). Also it is recognized that even sites located in remote regions can measure ozone which originated from manmade sources. Detailed analysis on the sources contributing to background ozone using a combination of measurements and photochemical grid modeling does not exist for the state of Alaska; however, observations (Vingarzan 2004) show that hourly median ozone concentrations in Denali National Park range between 29 and 34 ppbv, while the ozone annual means range between 23 and 29 ppbv at Point Barrow, AK.
8.2 UNDERSTANDING SECONDARY PARTICULATE CONCENTRATIONS Aerosols also known as particulate matter (PM) are solids or liquids suspended in the atmosphere that have diameters that range from 0.001 up to 100 micrometers (µm). Although aerosols could have multiple sizes, generally those that have diameters less than 2.5 µm are classified as “fine”, while anything larger than 2.5 µm would be known as “coarse”. The sources and chemical compositions of fine and coarse particles are different. In general coarse particles are produced by mechanical processes and consist of soil dust, sea salt, fly ash, etc. Fine particles consist of both primary particles from combustion and secondary particles that are formed in the atmosphere as the results of various chemical reactions and gas-to-particle conversion; it consists of sulfates, nitrates, ammonium, secondary organics, etc. USEPA has developed standards for particulate with a diameter less than 10 µm (PM10) and those with a
AIR QUALITY MODELING REPORT - GTP
USAG-P1-SRZZZ-00-000001-000 7-OCT-16
REVISION: 1
PUBLIC PAGE 90 OF 112
diameter less than 2.5 µm (PM2.5). This Section focuses on secondary particles since these cannot be modeled in the near-field using models approved in the Modeling Guideline.
Particle Formation and Lifetimes 8.2.1Fine particles undergo a series of complex processes that ultimately lead to their formation and establish their atmospheric lifetimes. Generally, fine particles are subject to the general formation and removal pathways:
Nucleation. This process describes the rate at which a transformation of phase occurs as the very first small nuclei appear. The nucleation of trace substances and water from the vapor phase to the liquid or solid phase is of primary concern in the atmosphere. Heterogeneous nucleation is the nucleation on a foreign surface or substance and it readily allows the formation in air of water droplets when the relative humidity is only slightly above 100%.
Chemical reactions. A significant amount of chemical reactions occur between gas phase precursors that eventually lead to the formation of particulate matter in the atmosphere. Generally hundreds to thousands of chemical reactions occur depending on the chemical species involved. The ultimate compositions of these particulates in the atmosphere include sulfate, nitrate, ammonium, elemental carbon, organic compounds, water, and metals.
Condensation. This process involves particle populations and it refers to vapor that condenses on particles or when material evaporates from the aerosol to the gas phase. This process tends to change the size of the particles, usually the growth of the particles is govern by the diffusion coefficient for each species as well as the vapor pressure difference between chemical species and the equilibrium vapor pressure.
Coagulation. This process involves particle growth as the result of one or more particles suspended in the atmosphere colliding as a result of Brownian motion or other hydrodynamic, electrical, gravitational or other forces.
Cloud processing and removal. Aerosols can activate under supersaturation conditions and lead to the formation of cloud droplets, in other words they act as cloud condensation nuclei. Once processed in this manner they could be removed from the atmosphere following precipitation events or they could also undergo aqueous phase chemistry. Finally, precipitation can also remove a significant number of particles from the atmosphere as the cloud droplets interact with aerosols.
Fine particles are usually the result of the processes mentioned above and in many instances they are formed in the atmosphere. PM2.5 generally is composed of particles that had multiple sources such as combustion (coal, oil, gasoline, diesel, wood, etc.) and gas to particle conversion of precursors such as NOx, SO2 and VOCs.
PM2.5 Lifetimes 8.2.2
8.2.2.1 PM2.5 Lifetime The estimated lifetime of PM2.5 in the troposphere varies significantly depending on altitude, latitude and season. PM2.5 lifetimes could easily vary between a few days up to several weeks. Once formed, particles could be subjected to meteorological transport over significant regional scales that range from hundreds to thousands of miles.
A summary of the characteristics of atmospheric transport of precursors into the Artic troposphere was presented in Section 8.1.2.1 above. Those same characteristics affect the lifetime of particulates in the Arctic. An important consideration in the lifetime of particulate nitrate and sulfate, which are PM components usually associated to anthropogenic sources, is the availability of ammonia. Ammonia is the dominant alkaline gas in the atmosphere and plays and important
AIR QUALITY MODELING REPORT - GTP
USAG-P1-SRZZZ-00-000001-000 7-OCT-16
REVISION: 1
PUBLIC PAGE 91 OF 112
role in the formation of ammonium nitrate or sulfate, thus is important to quantify its magnitude and location. In midlatitudes major sources of ammonia include agriculture, vegetation, transport and industry, but these are expected to contribute minimally in the Arctic Circle. Ammonia is short lived in the atmosphere so is unlikely that long range transport would bring significant amounts of ammonia from lower latitudes. Biomass burning could inject important amounts of ammonia, so wildfires could play an important episodic role. In remote marine environments, the ocean is the dominant source of ammonia by remineralization of organic matter by bacteria and phytoplankton excretion (Carpenter et al., 2012). During the summertime, it is expected that this also will be the most important source of ammonia in the Arctic. Wentworth et al., 2016 have been able to determine that ammonia concentrations in the Arctic could range between 0.03 and 0.6 µg/m3 (0.040 – 0.87 ppbv) during the summer, which is 1 to 2 orders of magnitude lower than typical ammonia concentrations over the continental U.S (0.1 to 10 ppbv).
8.2.2.2 Source and Distance Relationship on PM2.5 Concentrations The spatial distribution of PM2.5 over large distances from a single source is in part a function of the chemical species involved. For instance particles that contain significant amounts of sulfate will be longer lived in the atmosphere than those with only nitrate, because nitrate is semi-volatile and thus able to convert back into the gas phase. Other more inert species like fine dust will be subjected to dispersion and gravitational settling without their lifetimes being significantly affected by chemical processes.
Baker et al. (2016) performed photochemical modeling simulations of 24 hypothetical single sources in the continental United States to estimate their impacts in ozone and PM2.5 concentrations. The modeling showed that downwind impacts varied directionally from each source due to differences in meteorology and chemical environment near the source. An aggregate analysis of daily maximum 24-hour average PM2.5 impacts as a function of the distance from the source shows that maximum impacts from secondary formation are not located in close proximity to the modeled emissions sources, but after the peak direct PM2.5 impact is reached but somewhere less than 50 kilometers downwind, the PM2.5 concentrations decrease as the distance increases.
Existing PM2.5 Concentrations 8.2.3There is no typical or uniform ambient background concentration of PM2.5 given that it could be composed by multiple chemical species. Urban environments’ in the continental U.S. typically have some of the highest PM2.5 concentrations that could exceed more than 12 µg/m3 on an annual average. Rural and remote environments will usually show both different compositions and lower annual concentrations that could range from 5 to 10 µg/m3. However some areas might be influenced by desert aerosols, which originate in deserts from wind disturbance but could extend considerably over adjacent regions. It is well documented that dust storms from the Sahara could transfer material across the Atlantic Ocean and affect the east coast of the United States. Also coastal areas might be influenced by marine aerosols.
Polar aerosols, found close to the surface in the Arctic, are usually aged particles with very low concentrations. Arctic aerosols during the winter and early spring are significantly influenced by anthropogenic sources located at mid-latitudes. During this period aerosol number concentrations increase substantially. Polar aerosol contains a complex mixture of different species: carbonaceous and sulfate material from midlatitude pollution sources, sea salt from surrounding oceans and mineral dust from arid regions. VanCuren and Cahill, 2002 have found that dust transported from Asia to midlatitude North America occurs on a frequent, consistent pattern. PM2.5 Asian dust is a regular component of the troposphere over the eastern Pacific and western North America. Typical dust monthly concentrations range between 0.1 and 0.5 µg/m3 in Denali, Alaska. The largest concentrations are observed between March and June, which exhibits a
AIR QUALITY MODELING REPORT - GTP
USAG-P1-SRZZZ-00-000001-000 7-OCT-16
REVISION: 1
PUBLIC PAGE 92 OF 112
‘conventional’ springtime pattern and is similar to the temporal pattern observed at Mauna Loa, Hawaii. Polissar et al. (1998) analyzed the chemical composition data for seven National Park locations in Alaska from 1986 to 1995. Polissar et al. found seasonal variations in the PM2.5 concentrations and composition, but that the maxima concentrations occurred in the winter and spring season with minima in the summer for non-marine sulfate but not for black carbon. Sulfate concentrations were always higher in northwestern Alaska, while black carbon peaked in central Alaska during the summer as a result of active forest fires. Polissar et al. concluded that sulfate concentrations were related to variations in long-range midlatitude anthropogenic emissions located to the north and northwest of Alaska.
8.3 A DESCRIPTION OF REGIONAL OZONE AND PM2.5 PRECURSOR EMISSIONS Emissions of ozone precursors from the North Slope Borough are summarized in Table 8-1 based on the most recent National Emission Inventory (NEI) (USEPA 2016b) which was compiled for 2011. The NEI is a comprehensive and detailed estimate of air emissions of criteria pollutants, criteria precursors, and hazardous air pollutants from air emissions sources. Among all the emission sectors, the petroleum and related industries are the largest NOx emissions contributors while the combustion processes associated to industrial processes are the largest VOCs emissions contributors throughout the area. Other anthropogenic VOC emissions in the area are primarily from combustion from electric utilities and other sources. While other sources of NOx are emitted mostly by stationary sources associated to industrial processes and also mobile sources.
Table 8-1: Anthropogenic Emissions in the North Slope Borough
Emission Inventory Sector NOx (TPY)
VOCs (TPY)
Primary PM 2.5 (TPY)
FUEL COMB. ELEC. UTIL. 60 3,757 91.8
FUEL COMB. INDUSTRIAL 328 33,013 765.3
FUEL COMB. OTHER 41 80 12.5
PETROLEUM & RELATED INDUSTRIES 125,041 1,271 97.2
OTHER INDUSTRIAL PROCESSES 5 55 4.4
SOLVENT UTILIZATION 55 -- --
STORAGE & TRANSPORT 64 -- 0.0
WASTE DISPOSAL & RECYCLING 6 6 16.8
HIGHWAY VEHICLES 43 167 6.0
OFF-HIGHWAY 526 9,470 313.6
MISCELLA NEOUS 8 1 175.3
Total 126,177 47,821 1,483
Data based on EPA’s 2011 National Emissions Inventory (NEI) available at https://w ww.epa.gov/air-emissions-inventories/2011-national-emissions-inventory-nei-data
AIR QUALITY MODELING REPORT - GTP
USAG-P1-SRZZZ-00-000001-000 7-OCT-16
REVISION: 1
PUBLIC PAGE 93 OF 112
The table also presents the level of primary PM2.5 emissions associated to different sectors on the North Slope. In general the largest source of PM2.5 is related to industrial combustion processes followed by the off-road emissions.
Back trajectories analysis on days with elevated ozone concentrations 8.3.1To better characterize periods of elevated ozone concentrations, it is helpful to understand the history of these air masses. Back trajectories derived using the HYSPLIT model (NOAA: http://www.arl.noaa.gov/hysplit) were used to further analyze periods with elevated ozone concentrations near the project area as indicated by available monitoring data. Figure 8-1 shows back trajectories displaying a 72 hour time period ending at hours 0:00, 6:00, 12:00 and 18:00 AKT for March 21, 2011 when regional measurements indicate that 8-hour average ozone concentrations in the Project area could be as high as 0.0561 ppmv. The figures show that for most of the day, air masses get to the GTP from the south, traveling over vast regions of Alaska, possibly transporting ozone and ozone precursors from Anchorage and Fairbanks. The spatial extent of the trajectories suggests that for the most part, the observed concentrations are the result of transported ozone into the region more than locally formed ozone.
Figure 8-2 shows back trajectories displaying a 72 hour time period ending at hours 0:00, 6:00, 12:00 and 18:00 AKT for April 23, 2013 when regional measurements indicate that 8 hour average ozone concentrations in the Project area could be as high as 0.0556 ppmv. The figures show that for most of the day, air masses are transported to the GTP from the west, traveling from as far as Russia. The spatial extent of the trajectories suggests that for the most part, the observed concentrations are the result of transported ozone into the region more than locally formed ozone.
Back trajectories analysis on days with elevated PM2.5 concentrations 8.3.2To better characterize periods of elevated PM2.5 concentrations, it is helpful to understand the history of these air masses. Back trajectories derived using the HYSPLIT model (NOAA: http://www.arl.noaa.gov/hysplit) were used to further analyze periods with elevated PM2.5 concentrations near the Project area as indicated by available monitoring data. Figure 8-3 shows back trajectories displaying a 72 hour time period ending at hours 0:00, 6:00, 12:00 and 18:00 AKT for July 11, 2012 when the Nuiqsut monitor indicates that 24 hour PM2.5 concentrations could be as high as 8 µg/m3. The figures show that for this day during the summer, air masses tend to arrive at the monitor location from the east. The back trajectories suggest that at least some of the measured concentrations are the result of photochemical transformation from precursors’ sources along the northern coast of Alaska from existing oil and gas activity. The spatial extent of the trajectories also suggests that at least part of the observed concentrations is the result of particles undergoing long range transport.
Figure 8-4 shows back trajectories displaying a 72 hour time period ending at hours 0:00, 6:00, 12:00 and 18:00 AKT for April, 28 2013 when the Nuiqsut monitor indicates that 24 hour PM2.5 concentrations could be as high as 11 µg/m3. The figures show that for this day during the early spring, air masses tend to arrive at the monitor location from the west. During spring a more active photochemistry coupled with predominant westerly transport lead to ‘Arctic Haze’ episodes. The spatial extent of the trajectories during this day in April suggests that most, if not all, of the observed PM2.5 concentrations are the result of pollution from Europe and Asia undergoing long range transport.
AIR QUALITY MODELING REPORT - GTP
USAG-P1-SRZZZ-00-000001-000 7-OCT-16
REVISION: 1
PUBLIC PAGE 94 OF 112
Figure 8-1: 72 Hour Back trajectories Arriving at the Project Location at (70.317N, 148.557 W) March 21, 2011
Top row shows hours 0:00 and 6:00 AKT, while the bottom row shows hours 12:00 and 18:00 AKT. Global Data Assimilation System (GDAS) meteorological data was used to derive the HYSPLIT back trajectories results.
AIR QUALITY MODELING REPORT - GTP
USAG-P1-SRZZZ-00-000001-000 7-OCT-16
REVISION: 1
PUBLIC PAGE 95 OF 112
Figure 8-2: 72 hour Back Trajectories Arriving at the Project Location at (70.317N, 148.557 W) April 23, 2013
Top row shows hours 0:00 and 6:00 AKT, while the bottom row shows hours 12:00 and 18:00 AKT. Global Data Assimilation System (GDAS) meteorological data was used to derive the HYSPLIT back trajectories results.
AIR QUALITY MODELING REPORT - GTP
USAG-P1-SRZZZ-00-000001-000 7-OCT-16
REVISION: 1
PUBLIC PAGE 96 OF 112
Figure 8-3: 72 Hour Back trajectories Arriving at the Project Location at (70.317N, 148.557 W) July 11, 2012
Figure 3.4-3 72 hour back trajectories arriving at the monitor location during July 11, 2012. Top row shows hours 0:00 and 6:00 AKT, while the bottom row shows hours 12:00 and 18:00 AKT. Global Data Assimilation System (GDAS)
meteorological data was used to derive the HYSPLIT back trajectories results.
AIR QUALITY MODELING REPORT - GTP
USAG-P1-SRZZZ-00-000001-000 7-OCT-16
REVISION: 1
PUBLIC PAGE 97 OF 112
Figure 8-4: 72 hour Back Trajectories Arriving at the Project Location at (70.317N, 148.557 W) April 28, 2013
Figure 3.4-3 72 hour back trajectories arriving at the monitor location during April, 28, 2013. Top row shows hours 0:00 and 6:00 AKT, while the bottom row shows hours 12:00 and 18:00 AKT. Global Data Assimilation System (GDAS)
meteorological data was used to derive the HYSPLIT back trajectories results.
AIR QUALITY MODELING REPORT - GTP
USAG-P1-SRZZZ-00-000001-000 7-OCT-16
REVISION: 1
PUBLIC PAGE 98 OF 112
8.4 OZONE AND PM2.5 ASSESSMENT Currently, there is insufficient guidance to assess both ozone and PM2.5 impacts for this project. The most recent guidance is the “Proposed Approach for Demonstrating Ozone PSD Compliance” (USEPA 2015c) (referred to hereafter as the “Guidance”), which is currently a proposed approach that has not been formally accepted. In this current stage of uncertainty regarding ozone assessment, the following section describes a variety of approaches to understand potential project impacts to existing ambient ozone. From this analysis it is clear that regional ozone concentrations are low, well below the NAAQS/AAAQS. The small increase in regional precursor emissions that occur as a result of the project will have a negligible effect on existing ozone and PM2.5 concentrations and therefore, regional pollution levels will still remain well below the NAAQS/AAAQS.
Regional Modeling 8.4.1
8.4.1.1 Overview of PGM models Photochemical grid models (PGM) describe atmospheric concentrations in an array of fixed computational grid cells; PGMs are also called Eulerian models. Eulerian models are formulated to solve the pollutant continuity equation, where the pollutants concentrations enter and leave each of the modeling cells species concentrations are estimates as function of space and time. The continuity equation is numerically solved and calculates the changes to the concentrations by the following major processes: advection, turbulent and molecular diffusion, emissions, chemistry and removal (wet and dry). The two state-of-the-science grid models currently used are USEPA’s CMAQ and RAMBOLL ENVIRON’s CAMx:
The USEPA Community Multiscale Air Quality (CMAQ) modeling system is designed for applications ranging from regulatory and policy analysis to understanding the complex interactions of atmospheric chemistry and physics. It is a three-dimensional Eulerian atmospheric chemistry and transport modeling system that simulates ozone, particulate matter (PM), toxic airborne pollutants, visibility, and acidic and nutrient pollutant species throughout the troposphere. Designed as a “one-atmosphere” model, CMAQ can address the complex couplings among several air quality issues simultaneously across spatial scales ranging from local to hemispheric.
The Comprehensive Air Quality Model with Extensions (CAMx) modeling system is a publicly available multi-scale photochemical/aerosol grid modeling system developed and maintained by RAMBOLL ENVIRON. CAMx was developed with new codes during the late 1990s using modern and modular coding practices. This has made the model an ideal platform to treat a variety of air quality issues including ozone, condensable PM, visibility, and acid deposition. The flexible CAMx framework also makes it a convenient and robust host model for the implementation of a variety of mass balance and sensitivity analysis techniques.
A number of studies have been performed since 2008 using both CMAQ and CAMx to estimate the impacts on ozone and PM2.5 from single source emissions and also other types of applications. Both models are capable of providing a more realistic chemical and physical environment to evaluate these impacts. These studies show that PGMs are appropriate to establish the impacts from secondary formed pollutants for single sources but also from a vast array of emissions. One recent analysis presented by Baker et al. (2016) provides a more robust range of impacts covering a diverse set of sources, chemical environments and time scales. Baker et al. used CAMx to simulate the evolution of 24 hypothetical sources added to a baseline and evaluated the corresponding perturbation to ozone and PM2.5 concentrations. The analysis contributes more information about the downwind effects of single sources, but concludes that further investigation would be needed to fully assess the variability in single source impacts from a range of chemical and physical conditions. Also the analysis performed by Baker et al. focuses exclusively on the potential impacts in the continental U.S and a similar effort would be important
AIR QUALITY MODELING REPORT - GTP
USAG-P1-SRZZZ-00-000001-000 7-OCT-16
REVISION: 1
PUBLIC PAGE 99 OF 112
to establish impacts in regions like Alaska; however this study serves as an important point of reference.
8.4.1.2 PGM Model limitations Although PGMs can evaluate the impacts of secondary formed pollutants, there are several factors that limit their applications. For instance depending on the spatial resolution of the modeling grid cells, the plumes from the sources could get immediately diffused through the cell and this could impact ozone peak impacts and their spatial distribution. Also there are known limitations and uncertainties in the performance of these models, which require additionally analysis to characterize the potential biases of the pollutants predictions. PGMs usually require adequate modeling platforms and inputs (emissions and meteorology) which could be costly to develop if none exist in the area or region of interest. Also PGM simulations are computationally intensive and require significant amounts of time to complete depending on the application. Finally depending on the magnitude of emissions, estimating the ozone and PM2.5 impacts from an individual source may not be appropriate for a PGM application. Also, neither CAMx nor CMAQ include any of the halogen chemistry resulting in ozone depletion events in polar regions previously described.
Analysis of the Contribution of GTP Emissions 8.4.2
8.4.2.1 GTP Emissions The total potential GTP project emissions of ozone precursors from stationary emissions would be approximately 2,200 tons per year (TPY)of NOx and 400 TPY of VOC. The potential GTP emissions would represent approximately 2% of the total NOx and less than 1% of the total VOC emissions in the North Slope Borough (Table 8-1). These values reflect the potential to contribute to ozone formation by GTP, but as has been shown in this analysis most of the observed concentrations near the GTP are more likely to be the result of long range transport.
8.4.2.2 Potential Impacts Ozone
Determination of ozone and PM2.5 impacts due to emissions from single sources is a very active area of research and model development. Information obtained from a PGM is appropriate to consider since they include a representation of the physical and chemical processes undergone by the atmospheric pollutants. Importantly they account for the photochemical reactions that lead to ozone formation. PGMs have been typically used to investigate the impacts from NOx sources larger than 1,000 TPY. Another consideration is the lack of representative modeling platforms to be used for specific applications and the elaborate and computationally more expensive needs to perform PGM simulations. For this particular project, the direct application of PGM would not be appropriate given that is not expected that the precursor emissions would lead to the formation of ozone and PM2.5 concentrations that contribute to any exceedances of the NAAQS/AAAQS. This section reviews some of the available PGM applications and shows the approximate peak ozone impacts that would be expected from the GTP based on applying the PGM model based on single source analyses.
Baker et al. (2016) provide the most comprehensive up-to-date evaluation and application of PGMs for single source impacts on ozone and PM2.5. Baker et al. present a compilation of 8-hour ozone impacts from NOx emissions as reported in the literature from multiple studies in addition to their own modeling. It should be expected that given the differences among modeling studies and different geographic areas that similar NOx emissions would not necessarily lead to identical ozone impacts. However, Baker et al. are able to show consistently that single source NOx
AIR QUALITY MODELING REPORT - GTP
USAG-P1-SRZZZ-00-000001-000 7-OCT-16
REVISION: 1
PUBLIC PAGE 100 OF 112
emissions less than 5,000 TPY will not lead to ozone impacts larger than approximately 7 ppbv as illustrated in Figure 8-5. Table 8-2 (adapted from Baker et al. 2016) shows the ozone concentrations predicted from studies in which single sources emitted less than 3,000 TPY of NOx.
Table 8-2 shows that it can be expected that for NOx sources in the range of 1,000 to 3,000 TPY, the peak ozone impacts estimated by PGM have ranged from 0.9 to 14 ppbv. This range of information provides an approximate estimate of the potential ozone impact associated with the emissions from the GTP. Furthermore, Baker et al. found that peak impacts for the sources included in their assessment and from other studies are typically closer than 50 kilometers downwind from the source but rarely in the same grid cell as the source. Based on this information, peak ozone impacts associated with the GTP are unlikely to occur near the neighboring areas of the project and will not result in attainment issues.
PM2.5
PM2.5 concentrations are more difficult to evaluate as particulates are formed by multiple chemical species. However Baker et al. investigated the model peak 24-hour PM2.5 sulfate and nitrate concentrations response to the emissions of SO2 and NOx. Baker et al. found that the 24-hour PM2.5 nitrate concentrations would increase between 0.1 and 1 µg/m3 when the emissions of a single source range between 1,000 and 3,000 TPY. The potential to emit NOx from GTP is approximately 2,200 TPY. Baker et al. also found that for SO2 emissions in the range of 500 to 1,000 TPY, would result in sulfate ion 24-hour PM2.5 concentrations range between 0.2 and 8 µg/m3. The potential to emit SO2 from GTP is less than 100 TPY. Baker et al. also show that typical impacts for sulfate PM2.5 tend to peak at a distance of approximately 10 kilometers from the source with values of 5 to 8 µg/m3 and then rapidly decrease with distance with almost no impacts after 20 or 30 kilometers from the source. Nitrate impacts are the largest at a distance of about 5 to 10 kilometers from the source with values of 0.6 to 1.2 µg/m3 and decrease with distance but impacts could be as large as 0.2 µg/m3 at a distance of 100 kilometers from the source.
AIR QUALITY MODELING REPORT - GTP
USAG-P1-SRZZZ-00-000001-000 7-OCT-16
REVISION: 1
PUBLIC PAGE 101 OF 112
Figure 8-5: Relationship Between the Change in Daily Maximum 8-Hour Average O3 and Change in NOx Precursor Emissions (TPY) (Baker et al. 2016)
AIR QUALITY MODELING REPORT - GTP
USAG-P1-SRZZZ-00-000001-000 7-OCT-16
REVISION: 1
PUBLIC PAGE 102 OF 112
Table 8-2: Compilation of 8-Hour Ozone Impacts (ppbv) from NOx Emissions (TPY) Reported in Literature (Baker et al. 2016)
Reference Location Time Period Modeled
Year Modeled
Type of Source
Method Used
Model Resolution
(km)
Stack Height
(m)
Annual NOx
Emissions (TPY)
8-hr O3 delta
(ppbv)
ENVIRON, 2005 Houston, TX Summer
episodes 1999 Single e EGU CAMx brute force 4 Not
know n 2,665 0.9
Castell et al., 2010 Spain Summer
episodes 2003 & 2004 Single e EGU CAMx brute
force 2 65 1,789 1.9-5.1
ENVIRON, 2012a New Mexico Full year 2005 Single e EGU CAMx APCA 4 137.2 3,797 6.1
This w ork eastern US Full year 2011 Hypothetical Source CAMx OSAT 12 1 and 90 1,000 1.3-7.5
This w ork eastern US Full year 2011 Hypothetical Source CAMx OSAT 12 90 3,000 2.6-14.7
8.5 SUMMARY OF GTP OZONE AND SECONDARY PM2.5 IMPACTS This analysis reviewed the processes involved in the formation and loss of ozone and secondary PM2.5. This information is presented to help with the understanding of these processes in general but also in relation to the specific characteristics of the Arctic atmosphere. A review of available monitoring data near the project area showed that neither ozone nor PM2.5 current concentrations are or have been in exceedance of the NAAQS/AAAQS despite continual development in the region. Furthermore, back trajectory analysis for selected episodes identified from the monitoring data suggest that observed concentrations could be the at least in part the result of pollution transported from midlatitude regions.
Using available tools, a conservative quantification of the potential regional impact of GTP in both ozone and PM2.5 was developed. The information provided in this analysis is very conservative as it relies on photochemical modeling performed for the continental U.S, which does not account for the chemical complexities (halogen chemistry), the seasonal pattern (photochemical shutdown in the winter) and the global boundary influences (long range transport contribution to pollution from Asia and Europe) that is known to occur in Alaska.
The analysis presented indicates that emissions from GTP would at most lead to ozone increments of about 7 ppbv. Notice that this increase is not additive, otherwise the cumulative effect of existing sources would have already affected the monitoring record. Also, the location of peak impact is likely to be variable in space and time. This maximum increase of 7 ppbv in a region where ozone design values currently range around 0.045 ppmv would not lead to nonattainment issues in the region.
For PM2.5, the analysis presented indicates that emissions from GTP would at most lead to nitrate increments of about 1 µg/m3 and sulfate increments of less than 8 µg/m3 for the 24-hour concentrations. This would be the expected PM2.5 impacts that are not expected to occur near the source, but downwind as the result of secondary formation. Just as with ozone this increase is not additive and the location of peak impact likely to be variable in space and time. This maximum increase of less than 10 µg/m3 in a region where PM2.5 concentrations range around 10 µg/m3 would not lead to nonattainment issues in the region. Furthermore, the formation of ammonium sulfate and nitrate would be significantly limited by the availability of ammonia as previously discussed.
AIR QUALITY MODELING REPORT - GTP
USAG-P1-SRZZZ-00-000001-000 7-OCT-16
REVISION: 1
PUBLIC PAGE 104 OF 112
9.0 ACRONYMS AND TERMS AAAQS Alaska Ambient Air Quality Standards ADEC Alaska Department of Environmental Conservation AERMET AERMOD Meteorological Processor AERMOD American Meteorological Society/USEPA Regulatory Model AGDC Alaska Gasline Development Corporation AGRU Acid Gas Removal System APCA CAMx Anthropogenic Precursor Culpability Assessment APP Alaska Pipeline Project AQRVs Air Quality Related Values ARM Ambient Ratio Method ARM2 Ambient Ratio Method 2 BART Best Available Retrofit Technology BLM Bureau of Land Management BMPs Best Management Practices BOEM Bureau of Ocean Energy Management BPIPPRM Building Profile Input Program BPXA BP Exploration (Alaska), Inc. BSCF/D Billion Standard Cubic Feet per Day CAA Clean Air Act CALMET CALPUFF meteorology preprocessor CALPOST CALPUFF post-processor CALPUFF Gaussian puff dispersion model used for far-field modeling CCP Central Compression Plant CGF Central Gas Facility CO Carbon Monoxide CMAQ Community Multiscale Air Quality CAMx Comprehensive Air Quality Model with Extensions CO2 Carbon Dioxide Cp Plume Contrast DATs Deposition Analysis Thresholds DDM Decoupled Direct Method EGU Electric Generation Units EMALL ExxonMobil Alaska LNG LCC FERC Federal Energy Regulatory Commission FLAG Federal Land Manager's Air Quality related Values Work Group FLMs Federal Land Managers GEP Good Engineering Practice GTP Gas Treatment Plant H2S Hydrogen Sulfide H2SO4 Sulfuric Acid HP High Pressure IWAQM Interagency Workgroup on Air Quality Modeling LNG Liquefied Natural Gas LP Low Pressure mg/m3 Milligrams per Cubic Meter MMIF Mesoscale Model Interface Program MMSCFD Million Standard Cubic Feet of Gas per Day N Nitrogen NAAQS National Ambient Air Quality Standards NAD83 North American Datum 1983
AIR QUALITY MODELING REPORT - GTP
USAG-P1-SRZZZ-00-000001-000 7-OCT-16
REVISION: 1
PUBLIC PAGE 105 OF 112
NCSLs National Conservation System Lands NEPA National Environmental Policy Act NEI National Emissions Inventory NGA Natural Gas Act NO Nitrogen Oxide/ Nitric Oxide NO2 Nitrogen Dioxide North Slope Alaska's north slope NOx Nitrogen Oxides HNO3 Nitric Acid NSR New Source Review NWS National Weather Service O3 Ozone OCD Offshore and Coastal Dispersion Model; Includes fumigation algorithms ODEs Ozone Depletion Events OH Hydroxyl Radical OLM Ozone Limiting Method OSAT CAMx Ozone Source Apportionment Technology Pb Lead PBU Prudhoe Bay Unit PGM Photochemical Grid Models PLUVUE II Plume visibility model used for near-field visual impact modeling PM Particulate Matter PM2.5 Particulate matter having an aerodynamic diameter of 2.5 microns or less PM10 Particulate matter having an aerodynamic diameter of 10 microns or less POSTUTIL CALPUFF post-processor ppbv Parts per Billion by Volume ppmv Parts per Million by Volume Project Alaska LNG Project PSD Prevention of Significant Deterioration PTE Potential-to-Emit PTU Point Thomson Unit PVMRM Plume Volume Molar Ratio Method PVMRM2 Plume Volume Molar Ratio Method 2 Report FERC air quality modeling report RFD Reasonable Foreseeable Development RMC Regional Modeling Center S Sulfur Dioxide SCREEN3 A screening dispersion model that includes fumigation algorithms SDM Shoreline Dispersion Model; Includes fumigation algorithms SF Supplemental Firing SIP State Implementation Plan SO2 Sulfur Dioxide TPY Ton per Year TIBL Thermal Internal Boundary Layer µg/m3 Micrograms per Cubic Meter USDOI U.S. Department of the Interior USEPA U.S. Environmental Protection Agency USFWS U.S. Fish and Wildlife Services UTM Universal Transverse Mercator VISCREEN A screening model used for near-field visual impact modeling VOC Volatile Organic Compound WHRU Waste Heat Recovery Unit
AIR QUALITY MODELING REPORT - GTP
USAG-P1-SRZZZ-00-000001-000 7-OCT-16
REVISION: 1
PUBLIC PAGE 106 OF 112
WRAP Western Regional Air Partnership WRF Weather Research and Forecasting E Plume Perceptibility
AIR QUALITY MODELING REPORT - GTP
USAG-P1-SRZZZ-00-000001-000 7-OCT-16
REVISION: 1
PUBLIC PAGE 107 OF 112
10.0 REFERENCES Adams, P.J., J.H. Seinfeld, and D.M. Koch. 1999. Global concentrations of tropospheric sulfate, nitrate,
and ammonium aerosol simulated in a general circulation model. Journal of Geophysical Research, 104, D11, 13,791-13,823.
AECOM. 2013. Conoco Phillips Alaska, Inc. Greater Mooses Tooth 1 Air Quality Impact Analysis. October 2013.
Alaska Department of Environmental Conservation (ADEC). 2016. ADEC Modeling Review Procedures Manual. May 12, 2016.
______. 2015. 18 AAC 50, Air Quality Control, as amended through April 17, 2015.
______. 2013. ADEC Modeling Review Procedures Manual. June 30, 2013.
______. 2007a. ADEC Comments re: A-Pad Data Review Findings and Request for Revised WRDx Modeling Protocol. Letter from Alan Schuler (ADEC) to Jim Pfeiffer (BPXA). July 19, 2007.
Alaska LNG. 2016. Gas Treatment Plant Site Plan. Document no. USAG-EC-LDLAY-00-001004-000. April 13, 2016.
Arya, S.P. 1999. Air Pollution Meteorology and Dispersion. Oxford University Press, Inc.; New York, New York.
Baker, K. R., Kelly, J. T. “Single source impacts estimated with photochemical model source sensitivity and apportionment approaches”, Atmos. Environ.,2014, 96, 266‐274.
Baker, K.R., Robert A. Kotchenruther, Rynda C. Hudman. “Estimating ozone and secondary PM2.5 impacts from hypothetical single source emissions in the central and eastern United States”. Atmospheric Pollution Research, 2016. 7(1), pp 122-133.
Bergin, M., A. G. Russell , M. T. Odman , Daniel S. Cohan & William L. Chameides. “Single-Source Impact Analysis Using Three-Dimensional Air Quality Models”, Journal of the Air & Waste Management Association, 2008, 58:10, 1351-1359.
Briant, R.; Seigneur, C. “Multi-scale modeling of roadway air quality impacts: Development and evaluation of a Plume-in-Grid model”. Atmospheric Environment, 2013, 68, 162Bureau of Land Management (BLM). 2012. Final National Petroleum Reserve-Alaska Integrated Activity Plan/ Environmental Impact Statement. Department of Interior, Bureau of Land Management, Anchorage, Alaska. November 2012.
Brode, R. 2005. Email from Roger Brode of Pacific Environmental Services, Inc. (PES) to Bob Paine of ENSR Regarding the Use of Concurrent Meteorological Observations for AERMET Processing. September 1, 2005.
Carpenter, L. J., Archer, S. D., and Beale, R.: Ocean-atmosphere trace gas exchange, Chem. Soc. Rev., 41, 6473–6506, doi:10.1039/c2cs35121h, 2012.
Chen Xi, Derek Day, Bret Schichtel, William Malm, Jose Mojica, Chuck McDade, Eva Hardison, Sonia M. Kreidenweis, and Jeffrey L. Collett, Jr. 2011. A Pilot Monitoring Study of Atmospheric NHx at Selected IMPROVE sites. https://science.nature.nps.gov/im/units/sean/AuxRep/AC/AC_Schirokauer_NRTR_2014-839.pdf.
Chowdhury, B.; Karamchandani, P. K.; Sykes, R. I.; Henn, D. S.; Knipping. E.”Reactive puff model SCICHEM: Model enhancements and performance studies”. Atmospheric Environment. 2015, 117, 242-258.
AIR QUALITY MODELING REPORT - GTP
USAG-P1-SRZZZ-00-000001-000 7-OCT-16
REVISION: 1
PUBLIC PAGE 108 OF 112
Cohan, A., Leopold, S., Yarwood, G., and Baker, K. “Development of an ozone screening tool for the Midwest”. Paper presented at the 12th Annual CMAS Conference, Chapel Hill, NC, Oct. 28-30, 2013.
D S. Cohan , A. Hakami , Y. Hu ,and A. G. Russell, “Nonlinear Response of Ozone to Emissions: Source Apportionment and Sensitivity Analysis”. Environ. Sci. Technol., 2005, 39 (17), pp 6739–6748
Dentener, F.J. and P.J. Crutzen. 1994. A Three-Dimension Model of the Global Ammonia Cycle. Journal of Atmospheric Chemistry, 19, 331-369.
ENSR. 2008. Application to Add an Owner Requested Liquid Fuel Sulfur Limit to Air Quality Operating/ Construction Permit No. AQ0166TVP01 [for the] Prudhoe Bay Unit Central Compressor Plant [and] Minor Title I Permit Application to Revise and Rescind Fuel Sulfur Limits for Air Quality Operating/ Construction Permit No. AQ0270TVP01 [for the] Prudhoe Bay Unit Central Gas Facility. September 2008.
______. 1991. PSD Permit Application for Prudhoe Bay Unit GHX-2 Project: Central Gas Facility. June 1991.
______. 1989. Application to Modify PSD Permit for Prudhoe Bay Unit Central Compressor Plant (GHX-1 Project). June 1989.
ENVIRON, 2014. User's Guide Comprehensive Air Quality Model with Extensions Version 6. ENVIRON International Corporation, Novato. www.Camx.Com.
ENVIRON. 2015. The Mesoscale Model Interface Program (MMIF) Version 3.2. Prepared for Environmental Protection Agency Office of Air Quality Planning and Standards, Air Quality Assessment Division, Air Quality Modeling Group, Research Triangle Park, North Carolina. July 24, 2015.
Helmig, D., Patrick Boylan, Bryan Johnson, Sam Oltmans, Chris Fairall, Ralf Staebler, Andrew Weinheimer, John Orlando, David J. Knapp, Denise D. Montzka, Frank Flocke, Udo Frieß, Holger Sihler, and Paul B. Shepson. Ozone dynamics and snow-atmosphere exchanges during ozone depletion events at Barrow, Alaska. Journal of Geophysical Research, VOL. 117, D20303, doi:10.1029/2012JD017531, 2012.
Interagency Workgroup on Air Quality Modeling (IWAQM). 1998. Phase II Summary Report and Recommendations for Modeling Long Range Transport Impacts. EPA-454/R-98-019. December 1998.
Interagency Workgroup on Air Quality Modeling (IWAQM). 1993. Phase I Report: Interim Recommendation for Modeling Long Range Transport and Impacts on Regional Visibility. EPA-454/R-93-015. April 1993.
Karamchandan, P. R. Morris, B. Brashers, G. Yarwood, L. Parker and E. Knipping. “Using SCICHEM-2012 to determine single-source secondary impacts and comparisons with other modeling approaches”. Proceedings in A&WMA Air Quality Modeling Conference, March 19-21, 2013, Raleigh, North Carolina.
Kelly, J., K. Baker, S. Napelenok,and S. Roselle. “Examining single-source secondary impacts estimated from brute-force, decoupled direct method, and advanced plume treatment approaches”. Atmos. Environ. 2015, 111, pp.10-19.
Kirk R. Baker, Robert A. Kotchenruther, Rynda C. Hudman. “Estimating ozone and secondary PM2.5 impacts from hypothetical single source emissions in the central and eastern United States”. Atmospheric Pollution Research, 2016. 7(1), pp 122-133
Kwok, R., Baker, K., Napelenok, S., Tonnesen, G. “Photochemical grid model implementation of VOC, NOx, and O3 source apportionment”. 2015, Geosci. Model Dev. 8, 99-114.
AIR QUALITY MODELING REPORT - GTP
USAG-P1-SRZZZ-00-000001-000 7-OCT-16
REVISION: 1
PUBLIC PAGE 109 OF 112
National Emissions Inventory (NEI). 2011. National Emissions Inventory, available at https://www.epa.gov/air-emissions-inventories/2011-national-emissions-inventory-nei-data.
Oltmans, S. J., Bryan J. Johnson, and Joyce M. Harris. Springtime boundary layer ozone depletion at Barrow, Alaska: Meteorological influence, year-to-year variation and long-term change. Journal of Geophysical Research, VOL. 117, D00R18, doi:10.1029/2011JD016889, 2012.
Osada, K., S. Ueda, T. Egashira, A. Takami, and N. Kaneyasu. 2011. Measurements of Gaseous NH3 and Particulate NH4+ in the Atmosphere by Fluorescent Detection after Continuous Air-water Droplet Sampling. Aerosol and Air Quality Research, 11, 170-179, doi:10.4209/aaqr.2010.11.0101.
Polissar, A. V., P. K. Hopke, W. C. Malm, and J. F. Sisler (1998), Atmospheric aerosol over Alaska: 1. Spatial and seasonal variability, J. Geophys. Res., 103(D15), 19035–19044, doi:10.1029/98JD01365.
Schirokauer, D., L. Geiser, A. Bytnerowicz, M. Fenn, and K. Dillman. 2014. Monitoring air quality in Southeast Alaska’s National Parks and Forests: Linking atmospheric pollutants with ecological effects. Natural Resource Technical Report NPS/SEAN/NRTR—2014/839. National Park Service, Fort Collins, Colorado.
Schere, K. AND K. Demerjian. A PHOTOCHEMICAL BOX MODEL FOR URBAN AIR QUALITY SIMULATION. U.S. Environmental Protection Agency, Washington, D.C., EPA/600/J-78/003 (NTIS PB280366).
Shengxin Jin, Kenneth Demerjian, “A Photochemical Box Model for Urban Air Quality Study”. Atmospheric Environment, 1993, 27(4), p371-387.
Shephard, M.W., K.E. Cady-Pereira, M. Lou, D.K. Henze, R.W. Pinder, J.T. Walker, C.P. Rinsland, J.O. Bash, L. Zhu, V.H. Payne, and L. Clarisse. 2011. TES ammonia retrieval strategy and global observations of the spatial and seasonal variability of ammonia. Atmospheric Chemistry and Physics, 11, 10743-10763, doi:10.5194/acp-11-10743-2011.
Simpson, W. R., R. von Glasow, K. Riedel, P. Anderson, P. Ariya, J. Bottenheim, J. Burrows, L. J. Carpenter, U. Frieß, M. E. Goodsite, D. Heard, M. Hutterli, H.-W. Jacobi, L. Kaleschke, B. Neff, J. Plane, U. Platt, A. Richter, H. Roscoe, R. Sander, P. Shepson, J. Sodeau, A. Steffen, T. Wagner, and E.Wolff. Halogens and their role in polar boundary-layer ozone depletion. Atmos. Chem. Phys., 7, 4375–4418, 2007.
Stunder, M., S. Sethuraman, P.K. Misra, and H. Sahota. “Downwind Non-Uniform Mixing in Shoreline Fumigation Processes.” Boundary Layer Meteorology 34 (1986). 177-184.
Stevenson, D. S., et al. (2006), Multimodel ensemble simulations of present-day and near-future tropospheric ozone, J. Geophys. Res., 111, D08301, doi:10.1029/2005JD006338.
Stohl, A. (2006), Characteristics of atmospheric transport into the Arctic troposphere, J. Geophys. Res., 111, D11306, doi:10.1029/2005JD006888.
Thompson, C. R., P. B. Shepson, J. Liao, L. G. Huey, E. C. Apel, C. A. Cantrell, F. Flocke, J. Orlando, A. Fried, S. R. Hall, R. S. Hornbrook, D. J. Knapp, R. L. Mauldin III,d, D. D. Montzka, B. C. Sive, K. Ullmann, P. Weibring, and A. Weinheimer. Interactions of bromine, chlorine, and iodine photochemistry during ozone depletions in Barrow, Alaska. Atmos. Chem. Phys., 15, 9651–9679, 2015.
Uarporn Nopmongcol, Chris Emery, Tanarit Sakulyanontvittaya, Jaegun Jung, Eladio Knipping, Greg Yarwood. “A modeling analysis of alternative primary and secondary US ozone standards in urban and rural areas”, 2014, Atmos. Environ. 99, 266-276.
AIR QUALITY MODELING REPORT - GTP
USAG-P1-SRZZZ-00-000001-000 7-OCT-16
REVISION: 1
PUBLIC PAGE 110 OF 112
United States Department of the Interior (USDOI), 2010. Federal Land Managers’ Air Quality Related Values Work Group (FLAG). Phase I Report – Revised (2010). Natural Resources Report NPS/NRPC/NRR-2010/232. October 2010.
United States Environmental Protection Agency (USEPA). 2016a. Air Quality System. Accessed April 12, 2016 at https://www3.epa.gov/airquality/airdata/index.html.
______. 2016b. National Emissions Inventory. Accessed April 12, 2016 at https://www.epa.gov/air-emissions-inventories/national-emissions-inventory.
______. 2015a. Addendum to the User’s Guide for the AMS/EPA Regulatory Model - AERMOD (EPA-454/B-03-001). Office of Air Quality Planning and Standards. June 2015.
______. 2015b. Proposed Revision to the Guideline on Air Quality Models. EPA-HQ-OAR-2015-0310; FRL-9930-11-OAR. July 2015.
______. 2015c. “Memorandum Proposed Approach for Demonstrating Ozone PSD Compliance”. Proposed Regulatory Docket No. EP A-HQ-OAR-2015-0310. June 30, 2015.
______. 2014a. EPA Green Book. http://www.epa.gov/airquality/greenbook/rindex.html.
______. 2014b. Clarification on the Use of AERMOD Dispersion Modeling for Demonstrating Compliance with the NO2 National Ambient Air Quality Standard, September 30, 2014.
______. 2011. Additional Clarification Regarding Application of Appendix W Modeling Guidance for the 1 hour NO2 National Ambient Air Quality Standard. Memorandum from Tyler Fox (EPA) to Regional Air Division Directors. March 1, 2011.
______. 2010. Applicability of Appendix W Modeling Guidance for the 1-hour NO2 National Ambient Air Quality Standard. Memorandum from Tyler Fox (EPA) to Regional Air Division Directors. June 28, 2010.
______. 2009. AERMOD Implementation Guide. March 19, 2009.
______. 2009a. Addendum to the User’s Guide for the AERMOD Terrain Preprocessor (AERMAP). February 2009.
______. 2007. AERMOD Implementation Guide. Available at https://www3.epa.gov/ttn/scram/7thconf/aermod/archive/aermod_implmtn_guide_19oct2007.pdf. October 19, 2007.
______. 2006. Dispersion Coefficients for Regulatory Air Quality Modeling in CALPUFF. Environmental Protection Agency Office of Air Quality Planning and Standards, Research Triangle Park, North Carolina. March 16, 2006.
______. 2005. Guideline on Air Quality Models. Published as 40 CFR 58 Appendix W. November 9, 2005.
______. 2004. User’s Guide for the AMS/EPA Regulatory Model - AERMOD (EPA-454/B-03-001). Office of Air Quality Planning and Standards. September 2004.
______. 2000. Meteorological Monitoring Guidance for Regulatory Modeling Applications. EPA 454/R 99 005. Office of Air Quality Planning and Standards, Research Triangle Park, NC. February 2000.
______. 1995. SCREEN3 Model User’s Guide. EPA 454/B 94 004. Office of Air Quality Planning and Standards, Research Triangle Park, NC. September 1995.
______. 1990. New Source Review Workshop Manual – Prevention of Significant Deterioration and Nonattainment Area Permitting. Office of Air Quality Planning and Standards. October 1990.
______. 1985. Guideline for Determination of Good Engineering Practice Stack Height (Technical Support Document for the Stack Height Regulations). Office of Air Quality Planning and Standards. U.S. EPA-450/4-80-023R, June, 1985.
Vingarzan, R. A review of surface ozone background levels and trends. Atmospheric Environment 38 (2004) 3431–3442.
VanCuren, R., and T. Cahill, Asian aerosols in North America: Frequency and concentration of fine dust, J. Geophys. Res., 107(D24), 4804, doi:10.1029/2002JD002204, 2002.
Wentworth, G. R., Murphy, J. G., Croft, B., Martin, R. V., Pierce, J. R., Côté, J.-S., Courchesne, I., Tremblay, J.-É., Gagnon, J.,Thomas, J. L., Sharma, S., Toom-Sauntry, D., Chivulescu, A.,Levasseur, M., and Abbatt, J. P. D.: Ammonia in the summertime Arctic marine boundary layer: sources, sinks, and implications, Atmos. Chem. Phys., 16, 1937–1953, doi:10.5194/acp-16-1937-2016, 2016.
Western Regional Air Partnership Air Quality Forum Regional Modeling Center (WRAP). 2006. CALMET/CALPUFF Protocol for BART Exemption Screening Analysis for Class I Areas in the Western United States. August 15, 2006.
Xu, L. and J.E. Penner. 2012. Global simulations of nitrate and ammonium aerosols and their radiative effects. Atmospheric Chemistry and Physics, 12, 9479-9504, doi:10.5194/acp-12-9479-2012.
Zhang, X., J. Zhang, J. Krieger, M. Shulski, F. Liu, S. Stegall, W. Tao, J. You, W. Baule, and B. Potter, 2013: Beaufort and Chukchi Seas Mesoscale Meteorology Modeling Study, Final Report. U.S. Department of the Interior, Bureau of Ocean Energy Management, Alaska OCS Region, Anchorage, AK. OCS Study BOEM 2013-0119, 204 pp.
AIR QUALITY MODELING REPORT - GTP
USAG-P1-SRZZZ-00-000001-000 7-OCT-16
REVISION: 1
PUBLIC PAGE 112 OF 112
11.0 APPENDICES
AIR QUALITY MODELING REPORT - GTP
USAG-P1-SRZZZ-00-000001-000 7-OCT-16
REVISION: 1
PUBLIC
APPENDIX A – GTP FACILITY AIR EMISSIONS INVENTORY
Public
EMISSIONS CALCULATION REPORT FOR THE ALASKA LNG GAS TREATMENT PLANT
USAG-P1-SRZZZ-00-000001-000 APPENDIX A
APPENDIX A EMISSIONS CALCULATION REPORT FOR THE GAS
TREATMENT PLANT
USAG-P1-SRZZZ-00-000001-000 7-OCT-16
REVISION: 1
PUBLIC PAGE 2 OF 81
TABLE OF CONTENTS 1.0 OBJECTIVE OF EMISSIONS CALCULATION REPORT ......................................................6 2.0 GAS TREATMENT PLANT FACILITY DESCRIPTION..........................................................7 3.0 DESCRIPTION OF EMISSIONS DATA NEEDS ...................................................................9
3.1 PREVENTION OF SIGNIFICANT DETERIORATION (PSD) APPLICABILITY AND REVIEW.................9 3.2 FEDERAL ENVIRONMENTAL REGULATORY COMMISSION (FERC) IMPACT ASSESSMENT ...........9 3.3 PSD DISPERSION MODELING .................................................................................. 10 3.4 AIR QUALITY RELATED VALUES (AQRV) MODELING (EVALUATING IMPACTS TO VISIBILITY AND
DEPOSITION)....................................................................................................... 10 4.0 DEVELOPMENT OF EMISSIONS AND MODELED STACK PARAMETERS: COMPRESSION
4.1 OPERATIONS DESCRIPTION..................................................................................... 11 4.2 EMISSIONS DATA SOURCES .................................................................................... 11 4.3 EMISSION CALCULATION METHODOLOGY FOR DETERMINATION OF POTENTIAL TO EMIT AND
MODELING .......................................................................................................... 12 4.3.1 Potential to Emit for PSD Applicability and FERC Impact Assessment ............. 12 4.3.2 Criteria Pollutant Modeling........................................................................ 15 4.3.3 AQRV Modeling ...................................................................................... 20
5.0 DEVELOPMENT OF EMISSIONS AND MODELED STACK PARAMETERS: POWER GENERATION TURBINES ............................................................................................. 21
5.1 OPERATIONS DESCRIPTION..................................................................................... 21 5.2 EMISSIONS DATA SOURCES .................................................................................... 21 5.3 EMISSION CALCULATION METHODOLOGY FOR DETERMINATION OF POTENTIAL TO EMIT AND
MODELING .......................................................................................................... 22 5.3.1 Potential to Emit for PSD Applicability and FERC Impact Assessment ............. 22 5.3.2 Criteria Pollutant Modeling........................................................................ 23 5.3.3 AQRV Modeling ...................................................................................... 25
6.0 DEVELOPMENT OF EMISSIONS AND MODELED STACK PARAMETERS: RECIPROCATING INTERNAL COMBUSTION ENGINES (EMERGENCY/NON-EMERGENCY) .......................... 26
6.1 OPERATIONS DESCRIPTION..................................................................................... 26 6.2 EMISSIONS DATA SOURCES .................................................................................... 26 6.3 EMISSION CALCULATION METHODOLOGY FOR DETERMINATION OF POTENTIAL TO EMIT AND
MODELING .......................................................................................................... 28 6.3.1 Potential to Emit for PSD Applicability and FERC Impact Assessment ............. 28 6.3.2 Criteria Pollutant Modeling........................................................................ 29 6.3.3 AQRV Modeling ...................................................................................... 32
7.0 DEVELOPMENT OF EMISSIONS AND STACK PARAMETERS: FUEL GAS HEATERS ........ 33
7.1 OPERATIONS DESCRIPTION..................................................................................... 33 7.2 EMISSIONS DATA SOURCE...................................................................................... 33 7.3 EMISSION CALCULATION METHODOLOGY FOR DETERMINATION OF POTENTIAL TO EMIT AND
APPENDIX A EMISSIONS CALCULATION REPORT FOR THE GAS
TREATMENT PLANT
USAG-P1-SRZZZ-00-000001-000 7-OCT-16
REVISION: 1
PUBLIC PAGE 3 OF 81
7.3.1 Potential to Emit for PSD Applicability and FERC Impact Assessment ............. 34 7.3.2 Criteria Pollutant Modeling........................................................................ 36 7.3.3 AQRV Modeling ...................................................................................... 41
8.0 DEVELOPMENT OF EMISSIONS AND MODELED STACK PARAMTERS: FLARES ............. 42
8.1 OPERATIONS DESCRIPTION..................................................................................... 42 8.2 EMISSIONS DATA SOURCE...................................................................................... 42 8.3 EMISSION CALCULATION METHODOLOGY FOR DETERMINATION OF POTENTIAL TO EMIT AND
MODELING .......................................................................................................... 43 8.3.1 Potential to Emit for PSD Applicability and FERC Impact Assessment ............. 43 8.3.2 Criteria Pollutant Modeling........................................................................ 45 8.3.3 AQRV Modeling ...................................................................................... 48
9.0 GTP MOBILE SOURCES ............................................................................................... 49
9.1.1 On Land ................................................................................................ 49 9.1.2 Marine ................................................................................................... 50 9.1.3 Final Mobile Emissions ............................................................................ 50
10.1 EMISSIONS DATA FOR NEAR-FIELD IMPACT ANALYSES .................................................. 51 10.1.1 Cumulative Modeling ............................................................................... 51
10.2 EMISSIONS DATA FOR FAR-FIELD IMPACT ANALYSES .................................................... 52 10.2.1 Emissions Databases to Support Far-Field Modeling .................................... 53 10.2.2 Identifying Off-Site Sources ...................................................................... 53 10.2.3 Modeling Representation of Off-Site Sources .............................................. 54 10.2.4 Final Offsite Sources with Emissions .......................................................... 55
11.0 ACRONYMS AND TERMS ............................................................................................. 56 12.0 REFERENCES.............................................................................................................. 57 EC-1 GAS TREATMENT PLANT POTENTIAL TO EMIT SUMMARY............................................ 58 EC-2 GAS TREATMENT PLANT MODELED EMISSIONS SUMMARY ......................................... 59 EC-3 GAS TREATMENT PLANT FUEL SPECIFICATIONS......................................................... 61 EC-4 GAS TREATMENT PLANT FUEL GAS-DRIVEN TURBINES .............................................. 62 EC-5 GAS TREATMENT PLANT DIESEL EQUIPMENT ............................................................. 64 EC-6 GAS TREATMENT PLANT FUEL GAS HEATERS ............................................................ 65 EC-7 GAS TREATMENT PLANT FLARES ............................................................................... 66 EC-8 GAS TREATMENT PLANT MISCELLANEOUS SOURCES ................................................ 68 EC-9 GAS TREATMENT PLANT HAZARDOUS AIR POLLUTANTS (HAPS) EMISSIONS SUMMARY69 EC-10 GAS TREATMENT PLANT EMISSION FACTOR SUMMARY.............................................. 71 EC-11 GAS TREATMENT PLANT ANNUAL FUEL CONSUMPTION ............................................. 73 EC-12 GAS TREATMENT PLANT MOBILE SOURCE EMISSIONS SUMMARY .............................. 74 EC-13 GAS TREATMENT PLANT NON-ROAD/PORTABLE EMISSIONS SUMMARY ..................... 75 EC-14 GAS TREATMENT PLANT OFFSITE SOURCE EMISSIONS SUMMARY ............................. 76
APPENDIX A EMISSIONS CALCULATION REPORT FOR THE GAS
TREATMENT PLANT
USAG-P1-SRZZZ-00-000001-000 7-OCT-16
REVISION: 1
PUBLIC PAGE 4 OF 81
List of Figures Figure 1: Treated Gas Compressor Turbine Load vs Supplemental Firing Needs at Ambient
Average Temperature (10°F) ............................................................................................. 14 Figure 2: CO2 Compressor Turbine Load vs Supplemental Firing Needs at Ambient Average
Temperature (10°F) .......................................................................................................... 15 Figure 3: Treated Gas Compressor Turbine Load vs Supplemental Firing Needs at Lowest Ambient
Temperature (-40°F) ......................................................................................................... 18 Figure 4: Treated Gas Compressor Turbine Load vs Supplemental Firing Needs at Lowest Ambient
Temperature (-40°F) ......................................................................................................... 19
LIST OF TABLES Table 2-1 GTP Emitting Equipment Type and Count ....................................................................8 Table 2-2 Ambient Temperatures Used for GTP Emissions Calculations .......................................8 Table 4-1 Data Sources for GTP Compression Turbines Emissions Estimation ........................... 12 Table 4-2 Assumed GTP Compression Turbine Annual Operations ............................................ 13 Table 4-3 GTP Compression Turbines/Supplemental Firing PTE Summary ................................. 15 Table 4-4 GTP Short-Term Modeling Parameters for Compression Turbines with WHRU ............. 16 Table 4-5 Long-Term Modeling Parameters for GTP Compression Turbines with WHRU .............. 16 Table 4-6 Modeling Emissions Summary for GTP Compression Turbines with WHRU ................. 20 Table 4-7 AQRV PM Speciation for GTP Compression Turbines with WHRU................................ 20 Table 5-1 Data Sources for GTP Power Generation Turbine Emissions Estimation ...................... 21 Table 5-2 Assumed GTP Power Generation Turbine Annual Operations...................................... 22 Table 5-3 GTP Power Generation Turbines PTE Summary.......................................................... 23 Table 5-4 Short-Term Modeling Parameters for GTP Power Generation Turbine .......................... 24 Table 5-5 Long-Term Modeling Parameters for GTP Power Generation Turbine........................... 24 Table 5-6 Modeling Emissions Summary for GTP Power Generation Turbine .............................. 25 Table 5-7 AQRV PM Speciation for GTP Power Generation Turbines .......................................... 25 Table 6-1 Data Sources for GTP Non-Emergency Diesel Equipment Emissions Estimation .......... 27 Table 6-2 Data Sources for GTP Emergency Diesel Equipment Emissions Estimation ................. 27 Table 6-3 Data Sources for GTP Diesel-Fired Fire Water Pump Emissions Estimation.................. 28 Table 6-4 Assumed GTP Intermittent Diesel Equipment Annual Operations ................................ 29 Table 6-5 GTP Intermittent Diesel Equipment PTE Summary ...................................................... 29 Table 6-6 Short-Term Modeling Parameters for GTP Intermittent Diesel Engines ......................... 30 Table 6-7 Long-Term Modeling Parameters for GTP Intermittent Diesel Engines ......................... 30 Table 6-8 Modeling Emissions Summary for GTP Intermittent Diesel Equipment ......................... 31 Table 6-9 AQRV PM Speciation for GTP Intermittent Diesel Engines ........................................... 32 Table 7-1 Data Sources for GTP Fired Heaters Emissions Estimation ......................................... 34 Table 7-2 Assumed GTP Fired Heaters Annual Operations......................................................... 35 Table 7-3 GTP Fired Heaters PTE Summary .............................................................................. 36 Table 7-4 Short-Term Modeling Parameters for GTP Fired Heaters ............................................. 38 Table 7-5 Long-Term Modeling Parameters for GTP Fired Heaters.............................................. 38 Table 7-6 Modeling Emissions Summary GTP Fired Heaters ...................................................... 39 Table 7-7 Modeling Emissions Summary GTP Fired Heaters ...................................................... 40 Table 7-8 AQRV PM Speciation for GTP Fired Heaters ............................................................... 41
APPENDIX A EMISSIONS CALCULATION REPORT FOR THE GAS
TREATMENT PLANT
USAG-P1-SRZZZ-00-000001-000 7-OCT-16
REVISION: 1
PUBLIC PAGE 5 OF 81
Table 8-1 Data Sources for GTP Flare Equipment Emissions Estimation..................................... 43 Table 8-2 Assumed GTP Flare Annual Operations ..................................................................... 44 Table 8-3 GTP Flare PTE Summary ........................................................................................... 45 Table 8-4 Short-Term Modeling Parameters for GTP Flares ........................................................ 46 Table 8-5 Long-Term Modeling Parameters for GTP Flares......................................................... 46 Table 8-6 Modeling Emissions Summary for GTP CO2 Flares ..................................................... 47 Table 8-7 Modeling Emissions Summary for GTP Hydrocarbon Flare ......................................... 48 Table 8-8 AQRV PM Speciation for GTP Flares .......................................................................... 48 Table 9-1 GTP Emitting Mobile and Non-Road Equipment Types ................................................ 50 Table 10-1 In-Stack NO2/NOx Ratios for Use in Modeling CCP and CGF Turbines for Different
Operating Loads .............................................................................................................. 52 Table 10-2 In-Stack NO2/NOx Ratios Assumed for Other CCP and CGF Combustion Equipment... 52 Table 10-3 PM Speciation Assumed for CCP and CGF Equipment .............................................. 52 Table 10-4 Far-Field Modeling Volume Source Dimensions ........................................................ 55
APPENDIX A EMISSIONS CALCULATION REPORT FOR THE GAS
TREATMENT PLANT
USAG-P1-SRZZZ-00-000001-000 7-OCT-16
REVISION: 1
PUBLIC PAGE 6 OF 81
1.0 OBJECTIVE OF EMISSIONS CALCULATION REPORT The Alaska Gasline Development Corporation, BP Alaska LNG LLC, ConocoPhillips Alaska LNG Company, and ExxonMobil Alaska LNG LLC (Applicants) plan to construct one integrated liquefied natural gas (LNG) Alaska LNG Project (Project). The project contains two separate facilities, the Gas Treatment Plant (GTP) and the Liquefaction Facility.
The purpose of this Emissions Calculation Report (Report) is to present the methodologies that were used to calculate the air pollutant emissions from sources at the GTP. Quantitative emissions data is needed to demonstrate that these facilities would adhere to the applicable Clean Air Act (CAA) requirements as administered by the Environmental Protection Agency (USEPA) and the Alaska Department of Environmental Conservation (ADEC), and to support the assessment of air quality impacts for the Federal Energy Regulatory Commission (FERC) application and the associated National Environmental Policy Act (NEPA) process. Specifically presented are the methods proposed for developing emissions data to support the following analyses:
• Determining applicable permitting requirements triggered by the proposed facilities • Assessment of the facilities’ air quality impacts for the project’s FERC application and in the
subsequent NEPA analyses • Dispersion modeling to evaluate the project’s compliance with applicable state and federal
ambient air quality standards and related thresholds • Additional modeling to evaluate the facility’s impacts to air quality-related values (AQRVs),
including visibility, acid deposition, and impacts to soils, flora and fauna
This document explains the emission calculations located in the sections at the end of this report. The explanations located in this report provide a basis for the values and methods used within the calculations, both items should be reviewed simultaneously. The calculations are represented by document sections prefixed with EC (Emission Calculation). The tables located within this report reference both the summary tables and the individual equipment calculation sections.
APPENDIX A EMISSIONS CALCULATION REPORT FOR THE GAS
TREATMENT PLANT
USAG-P1-SRZZZ-00-000001-000 7-OCT-16
REVISION: 1
PUBLIC PAGE 7 OF 81
2.0 GAS TREATMENT PLANT FACILITY DESCRIPTION The Gas Treatment Plant (GTP) would be designed to treat natural gas received from the PBU and the Point Thomson Unit (PTU). The GTP would be constructed on the North Slope near the Beaufort Sea coast and in the PBU. According to the current design, the GTP would have an annual average inlet gas treating capacity of up to 3.7 billion standard cubic feet per day (BSCFD), and would be able to accommodate varying compositions of gas received from the PBU and PTU.
Primary emission sources at the GTP would include gas turbines, boilers/heaters, diesel internal combustion engines and flares. The design for the GTP would consist of three parallel natural gas treatment trains, each sized to process a roughly one-third portion of the inlet untreated feed gas. The process would remove most of the CO2 and H2S from the feed gas to meet the specification of the Liquefaction Facility, and some of the water (to a dew point specification for the Mainline). The gas then would be compressed in stages and routed to a gas chilling unit which utilizes a refrigerant to cool the gas. Cooling the gas would help to maintain the stability of the thaw-sensitive soils along sections of the Mainline.
The GTP would include facilities to collect the CO2 and H2S by-product streams from the three treatment units. These streams would also contain water and some hydrocarbons. The by-product streams from each train would be compressed and treated to remove water. The gaseous by-product stream (CO2) would then be transported to the PBU via an approximately one mile pipeline.
The fuel gas to be used for equipment operation at the GTP facility would be the produced treated gas that has had CO2 and H2S reduced to Mainline specifications. The treated gas product specifications have a maximum limit of 4 ppmv H2S, 1 grain sulfur/100 standard cubic feet of gas, and 50 ppmv CO2. A level of 16 ppmv of sulfur was assumed for the GTP emission calculations described in this Report in order to provide a conservative estimate of the sulfur content that accounts for H2S and mercaptans that could be present in the treated gas. While this is the case for normal operation, a 96 ppmv total sulfur assumption was applied to early operations and startup of the equipment in the first train, based on the assumed utilization of untreated gas from the CGF prior to commencement of GTP treated gas production.
Table 2-1 lists the major air emissions emitting equipment at the GTP. Information on mobile and non-road equipment of the operational GTP and the associated emissions calculations is provided in Section 9.0 of this Report. Table 2-2 shows ambient temperature data for the Prudhoe Bay Area which was used in developing emissions data for certain equipment (see Sections 4.0 through 8.0).
Ambient temperature data was obtained from the Cooperative Observer Network (COOP) summaries for Alaska from the Western Regional Climate Center (WRCC 2006). Regional temperature data are based on measurements from Prudhoe Bay (1986-1999), Deadhorse Airport station (1999-2010), and Umiat Air Field (1949-2001). Data from these locations was assumed to be representative for the GTP facility location. The COOP information from all locations show annual average temperatures around 10°F; Prudhoe Bay is 11.7°F, Deadhorse Airport is 12.1°F, and Umiat Air Field is 10.7°F. A mean temperature value of 10°F was selected as a calculation basis, since it is representative and has been historically used for calculating emissions from sources operating within the PBU. Table 2-2 lists the values that were used to represent minimum and maximum probable temperatures during normal operations at the site. Extreme temperature values that have rarely been recorded were not used in the emissions calculations. A representative low ambient temperature of -40°F was selected based on the very small reasonably foreseeable probability of the ambient temperature remaining below -40°F for any extended period of time. A review of the 25-year daily average of the regional temperature data which shows only a 0.6% likelihood that the ambient temperature would be below -40°F.
APPENDIX A EMISSIONS CALCULATION REPORT FOR THE GAS
TREATMENT PLANT
USAG-P1-SRZZZ-00-000001-000 7-OCT-16
REVISION: 1
PUBLIC PAGE 8 OF 81
Similarly a value of 70°F was selected for the representative highest ambient temperature, based on the review of the 25-year daily average regional data which shows less than 0.1% probability of an ambient temperature higher than 70°F.
Table 2-1 GTP Emitting Equipment Type and Count Equipment Type Facility Count
Table 2-2 Ambient Temperatures Used for GTP Emissions Calculations Temperature (°F)
Lowest Ambient -40
Highest Ambient 70
Annual Average Ambient 10
APPENDIX A EMISSIONS CALCULATION REPORT FOR THE GAS
TREATMENT PLANT
USAG-P1-SRZZZ-00-000001-000 7-OCT-16
REVISION: 1
PUBLIC PAGE 9 OF 81
3.0 DESCRIPTION OF EMISSIONS DATA NEEDS
3.1 PREVENTION OF SIGNIFICANT DETERIORATION (PSD) APPLICABILITY AND REVIEW The federal PSD permitting program applies to major new stationary sources and major modifications of existing sources that are proposed to be located in areas that are in compliance with the National Ambient Air Quality Standards (NAAQS). A source is “major” for a given pollutant if the maximum expected facility-wide emissions of that pollutant from a new facility will exceed 250 tons per year (tpy), or 100 tpy for 28 named facility categories. New sources with potential emissions in excess of the 100/250 thresholds are subject to PSD review. If a facility is major for at least one pollutant, then other pollutants emitted in amounts above their respective Significant Emission Rates (SERs) are also subject to the PSD process. The SERs are 40 tpy for NOx, SOx, and VOCs, 15 tpy for PM10, and 10 tpy for PM2.5.
The Project would be required to apply for PSD permit reviews for the GTP facility on the North Slope (see Section 2.0). Maximum possible annual emissions for all criteria pollutants were calculated for individual equipment and then summed to provide facility-wide emissions for comparison with the major source thresholds and applicable Significant Emission Rate (SER) limits.
Assumed maximum hourly emission rates and the maximum foreseeable facility operating hours per year were used to calculate maximum annual emissions for these applicability determinations. The calculated annual pollutant rates from each stationary source should be conservative enough that they would never be exceeded during normal operations. Emission factors derived from vendors, source tests for comparable equipment or from standard references, such as the USEPA’s AP-42 Compilation of Air Pollutant Emission Factors (USEPA 2009), may be used for certain pollutants if suitable vendor data are not available.
3.2 FEDERAL ENVIRONMENTAL REGULATORY COMMISSION (FERC) IMPACT ASSESSMENT The Federal Energy Regulatory Commission (FERC) requires a full assessment of all emissions sources associated with the proposed facilities, including sources that are not normally included in the PSD review, such as mobile sources and construction emissions 1.
Inasmuch as the focus of the FERC environmental review is on assessing a proposed Project’s anticipated actual impacts, it might be assumed that only expected actual emissions data would be required. However, FERC guidance for the preparation of Resource Report No. 9, Air and Noise Quality, also requires evidence of a Project’s ability to obtain required permits. In the case of the Project, this includes showing that the GTP can satisfy the requirements of the PSD review, which mostly evaluates impacts for maximum potential facility emissions. Thus, the emissions data required for preparation of the Project FERC submittal will rely primarily on the same assumptions as that for PSD permitting.
Assumed maximum emission rates and the maximum foreseeable facility operating hours per year were used to calculate maximum annual emissions for the FERC submittal. The calculated annual pollutant rates from each stationary source should be conservative enough that they would never be exceeded during normal operations. Emission factors derived from source tests for comparable equipment or from standard references, such as the USEPA’s AP-42 Compilation
1 The development of construction emissions estimates for the Project is not addressed in this Report.
APPENDIX A EMISSIONS CALCULATION REPORT FOR THE GAS
TREATMENT PLANT
USAG-P1-SRZZZ-00-000001-000 7-OCT-16
REVISION: 1
PUBLIC PAGE 10 OF 81
of Air Pollutant Emission Factors (USEPA 2009), may be used if suitable vendor data are not available.
Emission rates required for the dispersion modeling analyses presented in this Project submittal to FERC were calculated using the same methodology as described for PSD modeling in the next section.
3.3 PSD DISPERSION MODELING Under the PSD program, a proposed new major stationary source or major modification must complete a series of air quality impact analyses that includes a comprehensive, cumulative air quality impact analysis to demonstrate that the source's emissions will not cause or contribute to a modeled violation of any NAAQS. This means the applicant will need to model its own source’s emissions, as well as those from other existing facilities in the area near the proposed Project facilities, to show compliance with the NAAQS and PSD increments.
The modeling analyses described above is required to evaluate maximum potential impacts for comparison with the NAAQS and PSD increment thresholds. In general, this means that the corresponding modeling analyses must use maximum emission rates for short and long-term averaging times corresponding to these ambient criteria. However, for some types of equipment, most notably gas-fired turbines, pollutant emissions vary for different loads and ambient temperature conditions. For these sources, peak impacts may be predicted to occur at other than peak load operations.
Emissions rates to support the PSD modeling analyses were derived from equipment vendor data, where possible. Such data may be available from manufacturers of turbines, reciprocating engines and boilers/heaters, but may not be forthcoming for flares. Where necessary, source test data from comparable equipment or emission factors from established reference compilations, like USEPA’s AP-42 Compilation of Air Pollutant Emission Factors (USEPA 2009) were used.
3.4 AIR QUALITY RELATED VALUES (AQRV) MODELING (EVALUATING IMPACTS TO VISIBILITY AND DEPOSITION) Emission rates to support the AQRV modeling analysis for the new facilities were based on the same methodology as those used in the PSD dispersion modeling assessment. The assumed maximum hourly emission rates and the maximum foreseeable facility operating hours per year were used to calculate maximum annual emissions for the AQRV modeling analysis. There is an additional requirement to speciate the particulate matter for these analyses into the filterable or elemental carbon (EC) portion, as well as the condensable or secondary organic aerosols (SOA). The PM emissions for each type of equipment were speciated based on the USEPA’s AP-42 Compilation of Air Pollutant Emission Factors (USEPA 2009). The calculated PM10 and PM2.5 rates from each stationary source should be conservative enough that they would never be exceeded during normal operations.
Visibility modeling is based on the maximum 24-hour NOx, SOx and PM emission rates from the proposed new facility of interest. To ensure that the resulting impacts are conservative, it is common for these simulations to assume 24 consecutive hours of operation at the maximum possible hourly emission rates for these pollutants. The deposition modeling is based on reasonably foreseeable annual NOx and SOx emission rates from the proposed facility.
The impacts to the region’s air quality and AQRVs in Class I PSD areas and sensitive Class II areas were developed using the actual emissions from the existing sources, as provided by the ADEC. These actual emissions data on existing facilities were augmented with maximum allowable emissions for reasonably foreseeable future sources that are currently undergoing permitting or construction in the areas potentially impacted by emissions of the Project’s GTP.
APPENDIX A EMISSIONS CALCULATION REPORT FOR THE GAS
TREATMENT PLANT
USAG-P1-SRZZZ-00-000001-000 7-OCT-16
REVISION: 1
PUBLIC PAGE 11 OF 81
4.0 DEVELOPMENT OF EMISSIONS AND MODELED STACK PARAMETERS: COMPRESSION TURBINES
4.1 OPERATIONS DESCRIPTION The compression turbines at the GTP would be designed with spare capacity to allow the GTP to remain in operation during maintenance and upset scenarios. The Treated Gas and CO2 Compressors would be sized for a 6 x 20% configuration, meaning each compressor would have a maximum capacity representing 20% of the total facility design throughput. This would result in full facility compression capability of roughly 120%, and would allow for one turbine to shut down completely with the facility still able to operate at the 100% design throughput. The turbines would be organized as two sets of two turbines per train (four compression turbines total per train) for the 3 trains.
There would be potential for the turbines to be operating anywhere from 85% load to 100% load, with either all 12 or fewer turbines operating. The normal operating assumption is that all turbines would be operating at reduced capacity. This method of operation is accepted as the simplest way to provide the necessary heat to the trains from the waste heat recovery units (WHRUs) located on the turbine exhaust side. Flexibility would be designed into the trains to allow gas to be passed between trains and compressed by any compressor in any train; however, the heat medium would be specific to each train, as the heat medium systems for the individual trains are not interconnected.
The compressor turbines at the GTP would all be equipped with WHRUs, as well as supplemental firing to ensure the ability to meet each individual trains’ heat requirements. The WHRUs would operate by transferring the heat from the hot turbine exhaust gas to the process train heat medium fluid. Supplemental firing is the addition of fuel gas combustion in the turbine exhaust gas to add more heat ahead of the process heat medium fluid heat exchanger in cases when the turbine exhaust does not supply enough heat.
The amount of supplemental firing and the flow rate of the process heat medium fluid through the WHRU would be determined by the needs of the process train, not by the turbine exhaust. The WHRU would be designed to always accept the full exhaust flow from the compressor turbines. Downstream of the WHRU, the system exhaust stack would be the actual emission point. There would be a WHRU bypass stack included in the design that would only be used when there is a need for the WHRU to be shut down. This is provided mostly to account for the possibility of an unexpected tube rupture within the WHRU. All maintenance shutdowns would be assumed to be coordinated with turbine downtime, further reducing the likelihood that the bypass stack would be used.
The WHRU would be designed to transfer the heat duty of the exhaust gas and supplemental firing that corresponds to an exhaust temperature loss from about 1,650°F down to 410°F which would be the exhaust temperature regardless of turbine operating conditions. This design condition would be based on the heat needs of the process trains. The supplemental firing flow rate would be determined by how much fuel gas combustion is required to raise the exhaust gas temperature (typically in the 900°F to 1,100°F range) to 1,650°F.
4.2 EMISSIONS DATA SOURCES The turbine vendor provided performance estimates (fuel usage, exhaust gas properties) and emission concentration estimates for certain pollutants in the exhaust for the compression turbines currently proposed for the GTP. See Section 2.0 and Table 2-2 for a discussion on selection of a representative ambient temperature range at the GTP site. The vendor created the operating and emissions profiles based on the design specifications for the fuel gas to be utilized
APPENDIX A EMISSIONS CALCULATION REPORT FOR THE GAS
TREATMENT PLANT
USAG-P1-SRZZZ-00-000001-000 7-OCT-16
REVISION: 1
PUBLIC PAGE 12 OF 81
at the GTP facility, as well as specific ambient temperatures and typical ambient pressure at the proposed facility location.
Table 4-1, lists the sources of the emission factors that were used to calculate turbine emissions, including a mix of vendor estimates and factors from public sources.
Table 4-1 Data Sources for GTP Compression Turbines Emissions Estimation Pollutant Data Source Description
PM 2.5 Assumed same value as PM 10 for the most conservative estimate
SO 2 Mass balance assuming all sulfur in the fuel becomes SO 2 (H2SO 4 emissions included in SO 2)
Lead2 Negligible
Total GHG 40 CFR Part 98 Subpart C (USEPA 2011)
Total HAPs AP-42 equipment emission factors, Section 3.1 (USEPA 2009)
NO 2/NO x Ratio Vendor Data
Note 1: AP-42 emission factor was assumed to be sufficiently conservative for this equipment so that additional particulate matter resulting from the small percentage of sulfur compounds in the fuel were not added. Note 2: The primary source of lead emissions from combustion sources would be lead additives contained in some fuels that could subsequently be emitted during combustion. Since lead is not an additive to any GTP source fuels, it would only be present at negligible trace levels as a result of engine lubricant constituents or due to engine wear. Therefore, lead emissions are negligible, and the source emissions do not cause or contribute to an exceedance of the lead NAAQS.
4.3 EMISSION CALCULATION METHODOLOGY FOR DETERMINATION OF POTENTIAL TO EMIT AND MODELING Information on maximum foreseeable annual emissions was needed to determine the individual equipment and total facility potential to emit (PTE). Calculating annual tons per year per pollutant was needed for determining PSD Applicability and for FERC Impact Assessment of facility impacts. Additionally, short-term and long-term emissions were calculated for predicting near-field and far-field air quality impacts by means of dispersion modeling. The following sections describe the calculation methods for determining annual tons per year and emissions for other appropriate averaging times as required for modeling.
4.3.1 Potential to Emit for PSD Applicability and FERC Impact Assessment Annual emission rates used to support FERC Impact Assessment were estimated in the same manner used to quantify emissions for comparison with New Source Review PSD Applicability thresholds. Considerations that drove the emission calculations for the compression turbines include the assumed operating load, ambient temperature, and the contribution of supplemental firing.
APPENDIX A EMISSIONS CALCULATION REPORT FOR THE GAS
TREATMENT PLANT
USAG-P1-SRZZZ-00-000001-000 7-OCT-16
REVISION: 1
PUBLIC PAGE 13 OF 81
Operating Load and Ambient Temperature Selection
Table 4-2 provides the assumed operating hours, as well as the assumed turbine loads and ambient temperatures corresponding to the maximum annual emission rates for all pollutants. The selected emissions and operating conditions provided conservative estimates of the compression turbines PTE values for PSD Applicability and FERC Impact Assessment because of the following:
• Operation at maximum load was assumed for a full year, without any variations that would typically result in lower emissions.
• Use of the emission rates corresponding to the annual average ambient temperature provided the best annual estimate across all operating temperatures that would affect the turbine operation and therefore the emissions.
The annual emissions for the supplemental firing were assumed as a constant rate for the year. The rate selected was based on the maximum supplemental firing duty required to meet the process heat needs for each process train with an additional margin to add conservativism to account for annual variability. The supplemental firing emissions were added to the turbine emissions that were based on 100% turbine load operation at 10°F.
The supplemental firing duty would be the duty to increase the turbine exhaust temperature to the required inlet WHRU temperature of 1650°F. This duty was determined based on the fuel gas higher heating value at the GTP. The vendor-provided emission factors related pounds of pollutant to the heat duty of the supplemental firing additional heat.
The required supplemental firing duty is not a linear relationship with turbine load because both turbine exhaust flow rate and temperature impact supplemental firing duty. The heat recovery from both turbines occurs simultaneously and in parallel. Heat recovery is required from both the treated gas compressor turbines and CO2 compressor turbines to be able to supply the necessary heat to the process train. Since the turbines are different types of machines, they do not necessarily have the same worst-case operations. For determining the emissions, the operation of the turbines was decoupled from each other.
To determine the maximum required supplemental firing duty for the treated gas compressor turbines, the load of the CO2 compressor turbines were held constant at the normal annual operating load of 85% at 10°F, while the load of the treated gas compressor turbine was varied between 55% and 100% in order to find the peak supplemental firing rate. As shown in Figure 1, the maximum required supplemental firing duty occurs at approximately 90% turbine load in combination with the CO2 compressor turbine operating at 85% load. A margin was added to the maximum required duty and this duty was used for the entire operating year regardless of load
APPENDIX A EMISSIONS CALCULATION REPORT FOR THE GAS
TREATMENT PLANT
USAG-P1-SRZZZ-00-000001-000 7-OCT-16
REVISION: 1
PUBLIC PAGE 14 OF 81
and at the annual ambient temperature. The same method was applied to determine the maximum required supplemental firing for the CO2 compressor turbine, which occurs at approximately 80% turbine load with the treated gas compressor turbine held constant at 85% (see Figure 2). For each criteria pollutant, the supplemental firing emissions rate was added to the turbine exhaust emission rate to provide the total pollutant emission rate at the stack.
Figure 1: Treated Gas Compressor Turbine Load vs Supplemental Firing Needs at Ambient Average Temperature (10°F)
0
50
100
150
200
250
55% 65% 75% 85% 95%
Duty
(MM
Btu/
hr)
Turbine Operating Load Percent (%)
Available SF Duty
Required SF Duty
Note: CO2 Compressor Turbine operating at a constant load of 85%.
APPENDIX A EMISSIONS CALCULATION REPORT FOR THE GAS
TREATMENT PLANT
USAG-P1-SRZZZ-00-000001-000 7-OCT-16
REVISION: 1
PUBLIC PAGE 15 OF 81
Figure 2: CO2 Compressor Turbine Load vs Supplemental Firing Needs at Ambient Average Temperature (10°F)
Final Calculated Annual Emissions The annual emissions calculated for the compression turbines to be included in the facility’s PTE summary are shown in Table 4-3.
4.3.2 Criteria Pollutant Modeling Conservative estimates of maximum short-term and long-term emissions were needed to support required dispersion modeling for evaluation of GTP impacts to air quality. Additionally, representative stack parameters (exhaust temperature and velocity) accompanying these
0
20
40
60
80
100
120
140
160
180
55% 65% 75% 85% 95%
Duty
(MM
Btu/
hr)
Turbine Operating Load Percent (%)
Available SF Duty
Required SF Duty
Note: Treated Gas Compressor Turbine operating at a constant load of 85%.
APPENDIX A EMISSIONS CALCULATION REPORT FOR THE GAS
TREATMENT PLANT
USAG-P1-SRZZZ-00-000001-000 7-OCT-16
REVISION: 1
PUBLIC PAGE 16 OF 81
emission rates were needed to represent the individual facility sources within the air dispersion model. The long-term annual emissions were calculated with the same methodology used to determine the PTE emissions, as previously described.
Operating Load and Ambient Temperature Selection
Table 4-4 shows the operational loads and ambient temperatures used to determine the compression turbine emission rates and stack parameters that were assumed in the dispersion modeling to evaluate short-term criteria pollutant impacts (averaging times of 1 to 24 hours). The following conventions were used to provide this information in support of the modeling analyses:
• The exhaust velocity used was the minimum velocity across the range of turbine loads and ambient temperatures, this corresponded to operation at the lowest operating load with the maximum ambient temperature.
• The exhaust temperature used was the minimum temperature across the range of turbine loads and ambient temperatures, this corresponded with the WHRU outlet temperature that is much lower than the turbine exhaust temperature.
• Maximum impacts were predicted conservatively by the model using the maximum emission rates in combination with the minimum exhaust velocities and exhaust temperatures.
Table 4-5 provides similar information relating to the emission rates and stack parameters that were assumed for modeling long-term (i.e., annual average) turbine impacts.
Table 4-4 GTP Short-Term Modeling Parameters for Compression Turbines with WHRU
Pollutant Emission Type
Maximum Emissions Minimum Exhaust Velocity
Minimum Exhaust Temperature
Selected Load
Selected Ambient
Temperature Selected
Load Selected Ambient
Temperature Selected
Load Selected Ambient
Temperature
NO x 1-Hour
Maximum Operating
Load (100%)
Minimum Ambient
Temperature (-40°F)
Minimum Operating
Load (60%)
Maximum Ambient
Temperature (70°F)
Constant for all Turbine Loads and Ambient Temperatures
(Based on Process Heat Medium Needs, Minimum
Exhaust Temperature of 410°F considered)
CO 1-Hour
8-Hour
PM 10 24-Hour
PM 2.5 24-Hour
SO 2
1-Hour
3-Hour
24-Hour
Table 4-5 Long-Term Modeling Parameters for GTP Compression Turbines with WHRU
Pollutant
Annual Emissions Annual Average Exhaust Velocity
Minimum Exhaust Temperature
Selected Load
Selected Ambient
Temperature Selected
Load Selected Ambient
Temperature Selected
Load Selected Ambient
Temperature
NO x
Maximum Operating
Load (100%)
Annual Average Temperature
(10°F)
Average Operating
Load (85%)
Maximum Ambient
Temperature (70°F)
Constant for all Turbine Loads and Ambient Temperatures (Based on
Process Heat Medium Needs, Minimum Exhaust Temperature of
410°F considered)
CO
PM 10
PM 2.5
SO 2
APPENDIX A EMISSIONS CALCULATION REPORT FOR THE GAS
The emissions used for modeling short-term impacts assumed the maximum available supplemental firing duty at the lowest ambient average temperature (-40°F). Available supplemental firing was used for short-term emissions because there is a greater potential for short-term excursions from the required duty. The available supplemental firing duty is the maximum duty of the system and cannot be exceeded without causing damage to the equipment. The supplemental firing emissions were added to the turbine emissions that are based on 100% turbine load operation at -40°F. The lowest ambient temperature provides the most conservative (highest emissions) supplemental firing duty and turbine duty. At warmer ambient temperatures, the exhaust from the turbine is warmer and the system material is warmer, therefore the maximum heat able to be added to the system by supplemental firing would be lower in the summer.
The supplemental firing duty would be the duty to increase the turbine exhaust temperature to the required inlet WHRU temperature of 1650°F. This duty was determined based on the fuel gas higher heating value at the GTP. The vendor-provided emission factors related pounds of pollutant to the heat duty of the supplemental firing additional heat.
The required supplemental firing duty is not a linear relationship with turbine load because both turbine exhaust flow rate and temperature impact supplemental firing duty. The heat recovery from both turbines occurs simultaneously and in parallel. Heat recovery is required from both the treated gas compressor turbines and CO2 compressor turbines to be able to supply the necessary heat to the process train. Since the turbines are different types of machines, they do not necessarily have the same worst-case operations. For determining the emissions, the operation of the turbines was decoupled from each other.
Similarly to how the annual/long-term emissions were calculated, the turbine supplemental firing duties were determined individually as the load of the other turbine was held at a constant normal annual operating load. To determine the maximum available supplemental firing duty for the treated gas compressor turbines, the CO2 compressor turbines were held at their normal operating load of 85% at -40°F, while the load of the treated gas compressor turbine was varied between 55% and 100% in order to find the peak supplemental firing rate. As shown in Figure 3, the maximum available supplemental firing duty occurs at 100% treated gas compressor turbine load in combination with the CO2 compressor turbine operating at 85% consistently. The maximum possible supplemental firing duty was selected to model a maximum short-term value, a margin was not added to this value as the maximum available duty cannot be exceeded. The same method was applied to determine the maximum available supplemental firing for the CO2 compressor turbine, while varying its load as the treated gas compressor turbine is held constant at 85%. As shown in Figure 4, the maximum available supplemental firing duty occurs at 80% for the CO2 compressor turbine. For each criteria pollutant, the supplemental firing emissions rate was added to the turbine exhaust emission rate to provide the total pollutant emission rate at the stack.
For both annual and short-term modeling, the velocity used to represent the exhaust flow out of the turbine and WHRU stack combination did not include the additional flow from the supplemental firing fuel combustion. Without the flow caused by the supplemental firing, the exit velocities are minimized resulting in conservative model-predicted impacts. As previously described in Section 4.3.2, the minimum, and most conservative, exhaust temperature corresponds with the WHRU outlet temperature which is constant regardless of turbine operating loads and supplemental firing duty.
APPENDIX A EMISSIONS CALCULATION REPORT FOR THE GAS
TREATMENT PLANT
USAG-P1-SRZZZ-00-000001-000 7-OCT-16
REVISION: 1
PUBLIC PAGE 18 OF 81
Figure 3: Treated Gas Compressor Turbine Load vs Supplemental Firing Needs at Lowest Ambient
Temperature (-40°F)
0
50
100
150
200
250
300
55% 65% 75% 85% 95%
Duty
(MM
Btu/
hr)
Turbine Operating Load Percent (%)
Available SF Duty
Required SF Duty
Note: CO2 Compressor Turbine operating at a constant load of 85%.
APPENDIX A EMISSIONS CALCULATION REPORT FOR THE GAS
TREATMENT PLANT
USAG-P1-SRZZZ-00-000001-000 7-OCT-16
REVISION: 1
PUBLIC PAGE 19 OF 81
Figure 4: Treated Gas Compressor Turbine Load vs Supplemental Firing Needs at Lowest Ambient Temperature (-40°F)
0
20
40
60
80
100
120
140
160
180
200
55% 65% 75% 85% 95%
Duty
(MM
Btu/
hr)
Turbine Operating Load Percent (%)
Available SF Duty
Required SF Duty
Note: Treated Gas Compressor operating at a constant load of 85%.
APPENDIX A EMISSIONS CALCULATION REPORT FOR THE GAS
TREATMENT PLANT
USAG-P1-SRZZZ-00-000001-000 7-OCT-16
REVISION: 1
PUBLIC PAGE 20 OF 81
Final Calculated Modeling Emissions
The short-term and long-term emissions calculated for the compression turbines to be included in the facility’s modeling compliance demonstration are shown in Table 4-6.
Table 4-6 Modeling Emissions Summary for GTP Compression Turbines with WHRU
Pollutant
Treated Gas Compressor Turbine (per turbine)
CO2 Compressor Turbine (per turbine) Reference
to Calculation Emission
(g/s)
Exhaust Temp (°K)
Exhaust Velocity
(m/s) Emission
(g/s)
Exhaust Temp (°K)
Exhaust Velocity
(m/s)
NO x Short-Term 5.56
483 15.85
4.08
483 12.5 Sections EC-2 and
EC-4
Long-Term 4.01 3.44
CO Short-Term 4.51 7.77
PM 10 Short-Term 0.55 0.39
Long-Term 0.46 0.34
PM 2.5 Short-Term 0.55 0.39
Long-Term 0.46 0.34
SO 2 @ 16 ppmv
Short-Term (Hourly) 0.22 0.16
Short-Term (Daily)
0.22 0.16
Long-Term 0.18 0.14
SO 2 @ 96 ppmv
Short-Term (Hourly) 1.33 0.95
Short-Term (Daily) 1.33 0.95
Long-Term 1.09 0.82
4.3.3 AQRV Modeling AQRV modeling is different from criteria pollutant modeling, in that it includes additional attention to acid deposition and visibility impacts. Emissions for gaseous pollutants in the AQRV impact assessments were the same as those used in the short-term impact modeling described in Section 4.3.2. The short-term particulate matter emissions were speciated for the AQRV analyses as described in the following subsection.
PM Speciation Breakdown
Table 4-7 shows the assumed breakdown and basis for the short-term compression turbine emissions of the PM10 and PM2.5 into filterable and condensable fractions, as required for AQRV modeling.
Table 4-7 AQRV PM Speciation for GTP Compression Turbines with WHRU
APPENDIX A EMISSIONS CALCULATION REPORT FOR THE GAS
TREATMENT PLANT
USAG-P1-SRZZZ-00-000001-000 7-OCT-16
REVISION: 1
PUBLIC PAGE 21 OF 81
5.0 DEVELOPMENT OF EMISSIONS AND MODELED STACK PARAMETERS: POWER GENERATION TURBINES
5.1 OPERATIONS DESCRIPTION The GTP main power generation system would consist of six turbines total, which would create a common power supply for the facility. Individual power generation turbine load would fluctuate based on the needs of the process trains, and could range from 60% to 100%. Seasonal load variations would be the most common reason for differences in power generation equipment operation. For example, air cooler fans would have a much higher energy demand during the summer months than in winter, thus requiring a higher power generation turbine output. During, typical winter operation, it is estimated that only five or fewer of the six power generation turbines would be required. However, during the summer months, all six turbines would be expected to be operating.
5.2 EMISSIONS DATA SOURCES The turbine vendor provided performance estimates (fuel usage, exhaust gas properties) and emission concentration estimates for certain pollutants in the exhaust for the power generation turbines currently proposed for the GTP. See Section 2.0 and Table 2-2 for a discussion on selection of a representative ambient temperature range at the GTP site. The vendor created the operating and emissions profiles based on the design specifications for the fuel gas to be utilized at the GTP facility, as well as the specific ambient temperatures and typical ambient pressure at the proposed facility location.
Table 5-1 lists the sources of the emission factors that were used to calculate turbine emissions, including a mix of vendor estimates and factors from public sources.
Table 5-1 Data Sources for GTP Power Generation Turbine Emissions Estimation Pollutant Data Source Description
PM 2.5 Assumed same value as PM 10 for the most conservative estimate
SO 2 Mass balance assuming all sulfur in the fuel becomes SO 2 (H2SO 4 emissions included in SO 2)
Lead2 Negligible
Total GHG 40 CFR Part 98 Subpart C (USEPA 2011)
Total HAPs AP-42 equipment emission factors, Section 3.1 (USEPA 2009)
NO 2/NO x Ratio Vendor Data
Note 1: AP-42 emission factor was assumed to be sufficiently conservative for this equipment so that additional particulate matter resulting from the small percentage of sulfur compounds in the fuel were not added. Note 2: The primary source of lead emissions from combustion sources would be lead additives contained in some fuels that could subsequently be emitted during combustion. Since lead is not an additive to any GTP source fuels, it would only be present at negligible trace levels as a result of engine lubricant constituents or due to engine wear. Therefore, lead emissions are negligible, and the source emissions do not cause or contribute to an exceedance of the lead NAAQS.
APPENDIX A EMISSIONS CALCULATION REPORT FOR THE GAS
TREATMENT PLANT
USAG-P1-SRZZZ-00-000001-000 7-OCT-16
REVISION: 1
PUBLIC PAGE 22 OF 81
5.3 EMISSION CALCULATION METHODOLOGY FOR DETERMINATION OF POTENTIAL TO EMIT AND MODELING Information on maximum foreseeable annual emissions was needed to determine the individual equipment and total facility PTE. Calculating the annual tons per year per pollutant was needed for PSD Applicability and for FERC Impact Assessment of facility impacts. Additionally, short-term and long-term emissions were calculated for predicting near-field and far-field air quality impacts by means of dispersion modeling. The following sections describe the calculation methods for determining annual tons per year and emissions for other appropriate averaging times as required for modeling.
5.3.1 Potential to Emit for PSD Applicability and FERC Impact Assessment Annual emission rates to support FERC Impact Assessment were estimated in the same manner used to quantify emissions for comparison to New Source Review PSD Applicability thresholds. Considerations that drove the emission calculations for the power generation turbines include operating load and ambient temperature.
Operating Load and Ambient Temperature Selection
Table 5-2 provides the assumed operating hours, as well as the assumed turbine loads and ambient temperatures corresponding to the maximum annual emission rates for all pollutants. The selected emissions and operating conditions provided a conservative estimate of the power generation turbines PTE values for PSD Applicability and FERC Impact Assessment because of the following:
• Operation at maximum load was assumed for a full year without any variations in load, which typically results in fewer emissions.
• Use of the emission rates corresponding to the annual average ambient temperature provided the best annual estimate across all operating temperatures that would affect the turbine operation and therefore the emissions.
Table 5-2 Assumed GTP Power Generation Turbine Annual Operations
Supplemental Firing Considerations Annual Emissions Calculations Supplemental firing was not utilized in the design of the GTP power generation turbines.
APPENDIX A EMISSIONS CALCULATION REPORT FOR THE GAS
TREATMENT PLANT
USAG-P1-SRZZZ-00-000001-000 7-OCT-16
REVISION: 1
PUBLIC PAGE 23 OF 81
Final Calculated Annual Emissions
The annual emissions calculated for the power generation turbines to be included in the facility’s PTE summary are shown in Table 5-3.
Table 5-3 GTP Power Generation Turbines PTE Summary
Pollutant Power Generation Turbine (per turbine)
Reference to Calculation
NO x ton/year 73.2
Sections EC-1 and EC-4
CO ton/year 104
VOC ton/year 3.75
PM 10 ton/year 11.8
PM 2.5 ton/year 11.8
SO 2 ton/year 4.23
GHG tonnes/year 179,600
HAPs ton/year 1.74
5.3.2 Criteria Pollutant Modeling Conservative estimates of maximum short-term and long-term emissions were needed to support required dispersion modeling for evaluation of GTP impacts to air quality. Additionally, representative stack parameters (exhaust temperature and velocity) accompanying these emission rates were needed to represent the individual facility sources within the air dispersion model. The long-term annual emissions for modeling were calculated with the same methodology used to determine the PTE emissions, as previously described.
Operating Load and Ambient Temperature Selection
Table 5-4 shows the operational loads and ambient temperatures used to determine the power generation turbine emission rates and stack parameters that were assumed in the dispersion modeling to evaluate maximum short-term impacts (averaging times of 1 to 24 hours). The following conventions were used to provide this information to support the modeling analyses:
• The exhaust velocity used was the minimum velocity across the range of turbine loads and ambient temperatures, this corresponded to operation at the lowest operating load with the maximum ambient temperature.
• The exhaust temperature used was the minimum temperature across the range of turbine loads and ambient temperatures, this corresponded to operation at the lowest operating load with the minimum ambient temperature.
• Maximum impacts were predicted conservatively by the model using the maximum emission rates in combination with the minimum exhaust velocities and exhaust temperatures.
Table 5-5 provides similar information relating to the emission rates and stack parameters that were assumed for modeling long-term (i.e., annual average) turbine impacts.
APPENDIX A EMISSIONS CALCULATION REPORT FOR THE GAS
TREATMENT PLANT
USAG-P1-SRZZZ-00-000001-000 7-OCT-16
REVISION: 1
PUBLIC PAGE 24 OF 81
Table 5-4 Short-Term Modeling Parameters for GTP Power Generation Turbine
Pollutant Emission Type
Maximum Emissions Minimum Exhaust Velocity
Minimum Exhaust Temperature
Selected Load
Selected Ambient
Temperature
Selected Load
Selected Ambient
Temperature
Selected Load
Selected Ambient
Temperature NO x 1-Hour
Maximum Operating
Load (100%)
Minimum Ambient
Temperature (-40°F)
Minimum Operating
Load (60%)
Maximum Ambient
Temperature (70°F)
Minimum Operating
Load (60%)
Minimum Ambient
Temperature (-40°F)
CO 1-Hour
8-Hour
PM 10 24-Hour
PM 2.5 24-Hour
SO 2
1-Hour
3-Hour
24-Hour
Table 5-5 Long-Term Modeling Parameters for GTP Power Generation Turbine
Pollutant
Annual Emissions Minimum Exhaust Velocity Minimum Exhaust Temperature
Selected Load
Selected Ambient
Temperature
Selected Load
Selected Ambient
Temperature
Selected Load
Selected Ambient
Temperature NO x
Maximum Operating
Load (100%)
Annual Average Temperature
(10°F)
Minimum Operating
Load (60%)
Maximum Ambient
Temperature (70°F)
Minimum Operating
Load (60%)
Minimum Ambient Temperature
(-40°F)
CO
PM 10
PM 2.5
SO 2
Supplemental Firing Considerations Modeling Emissions Calculations Supplemental firing was not utilized in the design of the GTP power generation turbines. Accordingly, no consideration of potential effects of supplemental firing on the emission rates and stack parameters of these turbines were needed.
APPENDIX A EMISSIONS CALCULATION REPORT FOR THE GAS
TREATMENT PLANT
USAG-P1-SRZZZ-00-000001-000 7-OCT-16
REVISION: 1
PUBLIC PAGE 25 OF 81
Final Calculated Modeling Emissions
The short-term and long-term emissions calculated for the power generation turbines to be included in the facility’s modeling compliance demonstration are shown in Table 5-6.
Table 5-6 Modeling Emissions Summary for GTP Power Generation Turbine
Pollutant Power Generation Turbine
(per turbine) Reference to Calculation Emission
(g/s) Exhaust Temp
(°K) Exhaust Velocity
(m/s)
NO x Short-Term 2.69
739 25.3 Sections EC-2 and EC-4
Long-Term 2.11
CO Short-Term 1.64
PM 10 Short-Term 0.37
Long-Term 0.34
PM 2.5 Short-Term 0.37
Long-Term 0.34
SO 2
@ 16 ppmv
Short-Term (Hourly)
0.13
Short-Term (Daily)
0.13
Long-Term 0.12
SO 2
@ 96 ppmv
Short-Term (Hourly)
0.79
Short-Term (Daily)
0.79
Long-Term 0.73
5.3.3 AQRV Modeling AQRV modeling is different from criteria pollutant modeling as it includes additional attention to acid deposition and visibility impacts. Emissions for gaseous pollutants in the AQRV impact assessments were the same as those used in the short-term impact modeling described in Section 5.3.2. The short-term particulate matter emissions were speciated for the AQRV analyses as described in the following subsection.
PM Speciation Breakdown
Table 5-7 shows the assumed breakdown and basis for the short-term power generation turbine emissions of the PM10 and PM2.5 into filterable and condensable fractions, as required for AQRV modeling.
Table 5-7 AQRV PM Speciation for GTP Power Generation Turbines
APPENDIX A EMISSIONS CALCULATION REPORT FOR THE GAS
TREATMENT PLANT
USAG-P1-SRZZZ-00-000001-000 7-OCT-16
REVISION: 1
PUBLIC PAGE 26 OF 81
6.0 DEVELOPMENT OF EMISSIONS AND MODELED STACK PARAMETERS: RECIPROCATING INTERNAL COMBUSTION ENGINES (EMERGENCY/NON-EMERGENCY)
6.1 OPERATIONS DESCRIPTION The following reciprocating diesel internal combustion engines are expected to be installed at the GTP.
Black Start Diesel Generator
The Black Start Diesel Generator would be provided to assist in the black start of the main power generation turbines. The Black Start Diesel Generator would be capable of providing rapid start power for the black start of one of the power generation turbines. The Black Start Diesel Generator would only be used if all power generation turbines are shut down at once and then brought back online. Dormitory Emergency Diesel Generator
The Dormitory Emergency Diesel Generator would have the ability to provide the worker camp with partial power if line power is lost. This generator would only feed the man camp with limited capacity, but would be sized to provide power to essential functions.
Diesel Firewater Pump Engines
There would be three Main Diesel Firewater Pumps which would be located at the man camp facilities, not within the process trains. The pumps would be attached to specific Camp Firewater Storage Tanks that would house water only for a fire emergency system. Communications Tower Generator
The Communications Tower Generator would be provided to allow for supply of power to the Communication System during loss of line power. The communications tower would be located at the man camp.
6.2 EMISSIONS DATA SOURCES Common industry standards for specific equipment types were used to provide emission factors that were used with engine operating data to estimate the maximum criteria pollutant emission rates allowable under these standards. The tiered engine standards have been provided to vendors as a way to characterize average emissions, rather than “not to exceed” emissions. Because of this, an additional 25% margin was added to the emission factors derived from the standards in order to represent conservative, “not to exceed” emission rates.
Non-Emergency Diesel-Fired Generators
40 CFR Part 60 Subpart IIII (USEPA 2013) was the applicable standard for stationary emergency engines. Per the directions in 40 CFR Part 60 Subpart IIII Section 60.4201 Rule (a) based on the size and build date of the equipment, 40 CFR Part 1039 Subpart B, 1039.102: Control of Emissions from New and In-Use Nonroad Compression-Ignition Engines (USEPA 2010) was the applicable standard for non-emergency engines. The Tier 4 level of emission control was assumed for these units since the equipment would not be installed until 2025. (See Table 6-1) Emergency Diesel-Fired Generators
40 CFR Part 60 Subpart IIII (USEPA 2013) was the applicable standard for stationary emergency engines. Per the directions in 40 CFR Part 60 Subpart IIII Section 60.4202 Rule (a-2) based on the size and build date of the equipment, 40 CFR Part 89 Subpart B, 89.112: Control of
APPENDIX A EMISSIONS CALCULATION REPORT FOR THE GAS
TREATMENT PLANT
USAG-P1-SRZZZ-00-000001-000 7-OCT-16
REVISION: 1
PUBLIC PAGE 27 OF 81
Emissions from New and In-Use Nonroad Compression-Ignition Engines (USEPA 2005) was used. The Tier 2 level of emission control was assumed for these units since the equipment would not be installed until 2025. (See Table 6-2)
Emergency Diesel-Fired Fire Water Pumps
40 CFR Part 60 Subpart IIII, Appendix Table 4: Emission Standards for Stationary Fire Pump Engines (USEPA 2013) was the applicable standard for fire water pumps. The Tier 2 level of emission control was assumed since the equipment would not be installed until 2025. (See Table 6-3)
Table 6-1 Data Sources for GTP Non-Emergency Diesel Equipment Emissions Estimation Pollutant Data Source Description
NO x 40 CFR Part 1039 Subpart B, 1039.102 (95% of NO x+NMHC) (USEPA 2010)
CO 40 CFR Part 1039 Subpart B, 1039.102 (USEPA 2010)
VOC 40 CFR Part 1039 Subpart B, 1039.102 (5% of NO x+NMHC) (USEPA 2010)
PM 2.5 Assumed same value as PM 10 for the most conservative estimate
SO 2 Mass balance assuming all sulfur in the fuel becomes SO 2 (H2SO 4 emissions included in SO 2)
Lead2 Negligible
Total GHG 40 CFR 98 Subpart C (USEPA 2011)
Total HAPs AP-42 equipment emission factors, Section 3.4 (USEPA 2009)
NO 2/NO x Ratio USEPA’s default accepted ratio of 0.5 (USEPA 2011)
Note 1: AP-42 emission factor was assumed to be sufficiently conservative for this equipment so that additional particulate matter resulting from the small percentage of sulfur compounds in the fuel were not added. Note 2: The primary source of lead emissions from combustion sources would be lead additives contained in some fuels that could subsequently be emitted during combustion. Since lead is not an additive to any GTP source fuels, it would only be present at negligible trace levels as a result of engine lubricant constituents or due to engine wear. Therefore, lead emissions are negligible, and the source emissions do not cause or contribute to an exceedance of the lead NAAQS.
Table 6-2 Data Sources for GTP Emergency Diesel Equipment Emissions Estimation Pollutant Data Source Description
NO x 40 CFR Part 89 Subpart B, 89.112 (95% of NO x+NMHC) (USEPA 2005)
CO 40 CFR Part 89 Subpart B, 89.112 (USEPA 2005)
VOC 40 CFR Part 89 Subpart B, 89.112 (5% of NO x+NMHC) (USEPA 2005)
PM 2.5 Assumed same value as PM 10 for the most conservative estimate
SO 2 Mass balance assuming all sulfur in the fuel becomes SO 2 (H2SO 4 emissions included in SO 2)
Lead2 Negligible
Total GHG 40 CFR 98 Subpart C (USEPA 2011)
Total HAPs AP-42 equipment emission factors, Section 3.4 (USEPA 2009)
NO 2/NO x Ratio USEPA’s default accepted ratio of 0.5 (USEPA 2011)
Note 1: AP-42 emission factor was assumed to be sufficiently conservative for this equipment so that additional particulate matter resulting from the small percentage of sulfur compounds in the fuel were not added. Note 2: The primary source of lead emissions from combustion sources would be lead additives contained in some fuels that could subsequently be emitted during combustion. Since lead is not an additive to any GTP source fuels, it would only be present at negligible trace levels as a result of engine lubricant constituents or due to engine wear. Therefore, lead emissions are negligible, and the source emissions do not cause or contribute to an exceedance of the lead NAAQS.
APPENDIX A EMISSIONS CALCULATION REPORT FOR THE GAS
TREATMENT PLANT
USAG-P1-SRZZZ-00-000001-000 7-OCT-16
REVISION: 1
PUBLIC PAGE 28 OF 81
Table 6-3 Data Sources for GTP Diesel-Fired Fire Water Pump Emissions Estimation Pollutant Data Source Description
NO x 40 CFR Part 60 Subpart IIII, Appendix Table 4 (95% of NO x+NMHC) (USEPA 2013)
CO 40 CFR Part 60 Subpart IIII, Appendix Table 4 (USEPA 2013)
VOC 40 CFR Part 60 Subpart IIII, Appendix Table 4 (5% of NO x+NMHC) (USEPA 2013)
PM 2.5 Assumed same value as PM 10 for the most conservative estimate
SO 2 Mass balance assuming all sulfur in the fuel becomes SO 2 (H2SO 4 emissions included in SO 2)
Lead2 Negligible
Total GHG 40 CFR Part 98 Subpart C (USEPA 2011)
Total HAPs AP-42 equipment emission factors, Section 3.3 (USEPA 2009)
NO 2/NO x Ratio USEPA’s default accepted ratio of 0.5 (USEPA 2011)
Note 1: AP-42 emission factor was assumed to be sufficiently conservative for this equipment so that additional particulate matter resulting from the small percentage of sulfur compounds in the fuel were not added. Note 2: The primary source of lead emissions from combustion sources would be lead additives contained in some fuels that could subsequently be emitted during combustion. Since lead is not an additive to any GTP source fuels, it would only be present at negligible trace levels as a result of engine lubricant constituents or due to engine wear. Therefore, lead emissions are negligible, and the source emissions do not cause or contribute to an exceedance of the lead NAAQS.
6.3 EMISSION CALCULATION METHODOLOGY FOR DETERMINATION OF POTENTIAL TO EMIT AND MODELING Information on maximum foreseeable annual emissions was needed to determine the individual equipment and total facility PTE. Calculating the annual tons per year per pollutant was needed for PSD Applicability determination and for FERC Impact Assessment of facility impacts. Additionally, short-term and long-term emissions were calculated for predicting near-field and far-field air quality impacts by means of dispersion modeling. The following sections describe the calculation methods for determining annual tons per year and emissions for other appropriate averaging times as required for modeling.
6.3.1 Potential to Emit for PSD Applicability and FERC Impact Assessment Annual emission rates to support FERC Impact Assessment were estimated in the same manner used to quantify emissions for comparison with New Source Review PSD Applicability thresholds. Considerations that drove the emission calculations for the diesel-driven engines include annual operating hours and operating load.
Operating Hours and Operating Load
Diesel firewater pump engines and emergency generators would typically be run only during short periodic tests to ensure their operability in an emergency. Recognizing that modeled impacts from such sources would be greatly overestimated if they were assumed to operate continuously at maximum capacity, USEPA has issued guidance (USEPA 2011) that allows a less conservative approach for modeling the NOx and SO2 impacts from such sources against the short-term ambient standards. Accordingly, the NOx and SO2 modeling impacts for these sources may use “annualized” emissions, i.e., total annual emissions can be assumed to be spread over all hours of the year to calculate a much lower equivalent hourly rate.
Table 6-4 provides the assumed operational characteristics chosen for the calculation of the annual emission rates for intermittent diesel equipment to provide a conservative estimate of PTE values for PSD Applicability and FERC Impact Assessment. This approach was conservative for the following reasons:
APPENDIX A EMISSIONS CALCULATION REPORT FOR THE GAS
TREATMENT PLANT
USAG-P1-SRZZZ-00-000001-000 7-OCT-16
REVISION: 1
PUBLIC PAGE 29 OF 81
• The assumption of 500 hours of operation per year was much higher than the projected actual operation per year (more likely less than 100 hours of operation per year).
• Maximum load for full duration of each operating period, without any variations in load that would typically result in lower emissions.
The emission factor derived from ambient standards that were used for these diesel-fired equipment are not ambient temperature dependent.
6.3.2 Criteria Pollutant Modeling Conservative estimates of the maximum short-term and long-term emissions from intermittent diesel equipment at the GTP were needed to support required dispersion modeling for evaluation of GTP impacts to air quality. Additionally, representative stack parameters (exhaust temperature and velocity) accompanying these emission rates were needed to represent the individual facility sources within the air dispersion model. The long-term annual emissions were calculated with the same methodology used to determine the PTE emissions, as previously described. The short term emissions for NOx and SO2 were annualized in accordance with USEPA modeling guidance (USEPA 2011) for intermittent sources of these pollutants.
APPENDIX A EMISSIONS CALCULATION REPORT FOR THE GAS
TREATMENT PLANT
USAG-P1-SRZZZ-00-000001-000 7-OCT-16
REVISION: 1
PUBLIC PAGE 30 OF 81
Operating Load Selection
Table 6-6 shows the diesel equipment operating load assumptions that were used in determining short-term emission rates for modeling. However, as discussed in Section 6.3.1 and allowed by USEPA guidance (USEPA 2011), the “hourly” emission rates that were used in modeling the intermittent engines for 1-hour NO2 and 1-hour SO2 were determined by spreading the annual emissions over the 8,760 hours of the year (annualized). This practice removed the unreasonable conservatism associated with assuming continuous operation for emission units that actually operate only a few hundred hours per year. The annualized emission rates were based on the maximum hourly emission rate derated by a factor of 500 hours/8,760 hours.
The modeled exhaust velocity and exhaust temperature were based on data for a representative combustion engine. Parameters corresponding to the maximum load operation were selected to represent exhaust velocities and temperatures for dispersion modeling, because this is the best understood and most readily available information for diesel engine operation. Although the exclusive use of stack parameters for maximum load operation does not necessarily yield the most conservative possible result for modeling purposes, the exhaust velocity and temperature would not be expected to change appreciably with load during normal equipment testing. Additionally, stack parameters for these engines are almost entirely independent of ambient temperature conditions.
Table 6-7 shows the selection of modeling parameters for evaluating annual average impacts. All annual emission rates were based on the maximum hourly emission rate derated by a factor of 500 hours/8,760 hours.
Table 6-6 Short-Term Modeling Parameters for GTP Intermittent Diesel Engines
Pollutant Emission Type
Emissions Exhaust Velocity Exhaust Temperature
Selected Load Selected Load Selected Load
NO x 1-Hour 100% (Annualized)
Maximum Operating Load (100%)
Maximum Operating Load (100%)
CO 1-Hour 100%
8-Hour 100%
PM 10 24-Hour 100%
PM 2.5 24-Hour 100%
SO 2
1-Hour 100% (Annualized)
3-Hour 100%
24-Hour 100%
Table 6-7 Long-Term Modeling Parameters for GTP Intermittent Diesel Engines
Pollutant Annualized Emissions Exhaust Velocity Exhaust Temperature
Selected Load Selected Load Selected Load NO x
Maximum Operating Load (100%)
Maximum Operating Load (100%)
Maximum Operating Load (100%)
CO
PM 10
PM 2.5
SO 2
APPENDIX A EMISSIONS CALCULATION REPORT FOR THE GAS TREATMENT PLANT
USAG-P1-SRZZZ-00-000001-000 7-OCT-16
REVISION: 1
PUBLIC PAGE 31 OF 81
Final Calculated Modeling Emissions The short-term and long-term emissions calculated for the intermittent diesel equipment to be included in the facility’s modeling compliance demonstration are shown in Table 6-8.
Table 6-8 Modeling Emissions Summary for GTP Intermittent Diesel Equipment
APPENDIX A EMISSIONS CALCULATION REPORT FOR THE GAS
TREATMENT PLANT
USAG-P1-SRZZZ-00-000001-000 7-OCT-16
REVISION: 1
PUBLIC PAGE 32 OF 81
6.3.3 AQRV Modeling AQRV modeling is different from criteria pollutant modeling as it includes additional attention to acid deposition and visibility impacts. Emissions for gaseous pollutants in the AQRV impact assessments were the same as those used in the other short-term impact modeling described in Section 6.3.2. The short-term particulate matter emissions used for the AQRV analyses were speciated as described in the following subsection.
PM Speciation Breakdown Table 6-9 shows the assumed breakdown and basis for the short-term GTP diesel engine emissions of the PM10 and PM2.5 into filterable and condensable fractions, as required for AQRV modeling.
Table 6-9 AQRV PM Speciation for GTP Intermittent Diesel Engines
Note 1: Some of the equipment at the GTP would be less than 600 hp. Since no fi lterable/condensable PM information is provided in AP-42 Section 3.3, the data in AP-42 Section 3.4: Large Stationary Diesel Equipment (greater than 600 hp), was used to estimate the AQRV PM Speciation for these engines.
APPENDIX A EMISSIONS CALCULATION REPORT FOR THE GAS
TREATMENT PLANT
USAG-P1-SRZZZ-00-000001-000 7-OCT-16
REVISION: 1
PUBLIC PAGE 33 OF 81
7.0 DEVELOPMENT OF EMISSIONS AND STACK PARAMETERS: FUEL GAS HEATERS
7.1 OPERATIONS DESCRIPTION The fuel gas heaters listed below are expected to be installed at the GTP.
Building Heat Medium Heaters
The Building Heat Medium Heaters would provide heat to the process modules, utility modules, common areas, and other enclosed areas. The building heat medium system would be separate from the process heat medium systems; it therefore would require separate heat input since it would not be connected to any waste heat recovery system. The building heat medium system would be kept separate from the process heat medium system to employ a different type of heat medium that is more commonly used for buildings.
Three Building Heat Medium Heaters would be part of the design; however, one of these units would be assumed to be a full spare that would never run during normal operations. The heaters would be all sized for 50% of the required heat capacity needed at the facility, i.e., 3 x 50%. The load on the remaining two heaters would fluctuate based on seasonal heat needs.
Operations Camp Heaters
The Operations Camp Heaters would provide heat to the man camp enclosed areas. The operations camp system would be separate from all other facility heat systems because of the type of heat medium that could be used and because of the distance between the camp and process areas.
Three Operations Camp Heaters would be part of the design; however, one of these units would be assumed to be a full spare that would never run during normal operations. The heaters would be all sized for 50% of the required heat capacity needed at the camp, i.e., 3 x 50%. The load on the remaining two heaters would fluctuate based on seasonal heat needs.
Buyback Gas Bath Heaters
The Buyback Gas Bath Heaters would heat any treated gas that would be rerouted back from the sales pipeline downstream of the metering station. This gas may be required by the facility if treated gas is ever unavailable to feed the fuel gas system. Typically, the Buyback Gas Bath Heaters would operate in a standby low-load mode. Maintaining the heaters in standby mode would be required in case buyback gas is needed quickly. The heaters would be sized to be able to heat the entire low pressure and high pressure fuel gas demand of the facility. There would be two heaters sized as 2 x 50% of the total fuel capacity.
7.2 EMISSIONS DATA SOURCE Common industry standards as well as publicly available, currently operating, gas-fired heater information were used to determine the emission factors to be used for the GTP fired heaters. A compilation of public sources was used to determine the appropriate emission factors to be used with an ultra-low NOx burner or low NOx burner. It was assumed that the heater emission factors for NOx and VOC in the USEPA’s AP-42 Compilation of Air Pollutant Emission Factors (USEPA 2009) were overly conservative for the either of these proposed burner types. Also, greenhouse gas emission factors were taken from 40 Part 98 Mandatory Greenhouse Gas Reporting, Subpart C, General Stationary Fuel Combustion Sources (USEPA 2011). Table 7-1 lists the sources of the emission factors that were used to calculate gas heater emissions for all pollutants.
APPENDIX A EMISSIONS CALCULATION REPORT FOR THE GAS
TREATMENT PLANT
USAG-P1-SRZZZ-00-000001-000 7-OCT-16
REVISION: 1
PUBLIC PAGE 34 OF 81
Table 7-1 Data Sources for GTP Fired Heaters Emissions Estimation
Pollutant Data Source Description
NO x Average emission factor used by recent Alaska DEC for only heater point source emissions reporting (ADEC 2011)
CO AP-42 equipment emission factors, Section 1.4 (USEPA 2009)
VOC Average emission factor used by recent Alaska DEC for only heater point source emissions reporting (ADEC 2011)
PM 2.5 Assumed same value as PM 10 for most conservative estimate
SO 2 Mass balance assuming all sulfur in the fuel becomes SO 2 (H2SO 4 emissions included in SO 2)
Lead2 Negligible
Total GHG 40 CFR Part 98 Subpart C (USEPA 2011)
Total HAPs AP-42 equipment emission factors, Section 1.4 (USEPA 2009)
NO 2/NO x Ratio USEPA’s default accepted ratio of 0.5 (USEPA 2011)
Note 1: AP-42 emission factor was assumed to be sufficiently conservative for this equipment so that additional particulate matter resulting from the small percentage of sulfur compounds in the fuel were not added. Note 2: The primary source of lead emissions from combustion sources would be lead additives contained in some fuels that could subsequently be emitted during combustion. Since lead is not an additive to any GTP source fuels, it would only be present at negligible trace levels as a result of engine lubricant constituents or due to engine wear. Therefore, lead emissions are negligible, and the source emissions do not cause or contribute to an exceedance of the lead NAAQS.
7.3 EMISSION CALCULATION METHODOLOGY FOR DETERMINATION OF POTENTIAL TO EMIT AND MODELING Information on maximum foreseeable annual emissions was needed to determine the individual equipment and total facility PTE. Calculating the annual tons per year per pollutant was needed for PSD Applicability determination and for FERC Impact Assessment of facility impacts. Additionally, short-term and long-term emissions were calculated for predicting near-field and far-field air quality impacts by means of dispersion modeling. The following sections describe the calculation methods for determining annual tons per year and emissions for other appropriate averaging times as required for modeling.
7.3.1 Potential to Emit for PSD Applicability and FERC Impact Assessment Annual emission rates to support FERC Impact Assessment were estimated in the same manner used to quantify emissions for comparison with New Source Review PSD Applicability thresholds. Considerations that drove the emission calculations for the gas-fired heaters include operating hours and operating load.
Operating Load and Ambient Temperature Selection
Table 7-2 provides the assumed operational characteristics chosen for the calculation of annual emission rates for the gas-fired heaters to provide a conservative estimate of PTE per pollutant for PSD Applicability and FERC Impact Assessment. For the continuously operating Building Heat Medium Heaters and the Operations Camp Heaters, operational characteristics representing the maximum possible annual emissions were selected. However, only two of the three heaters would ever be operating at the same time and emissions were calculated accordingly. The annual emissions estimated in this manner for the Building Heat Medium and Operations Camp heaters are conservative, because the assumption of continuous operation at
APPENDIX A EMISSIONS CALCULATION REPORT FOR THE GAS
TREATMENT PLANT
USAG-P1-SRZZZ-00-000001-000 7-OCT-16
REVISION: 1
PUBLIC PAGE 35 OF 81
maximum load throughout the year does not reflect any load variations that would typically result in lower emissions.
The Buyback Gas Bath Heaters were represented by dual operating modes (standby and full load conditions) to provide conservative, but realistic, annual emission rate estimate. Fuel gas to the burners was supplied continuously, whether at the reduced standby rate or at maximum capacity. The full-capacity operating condition was conservatively assumed to occur 500 hours/year for each heater for purposes of the annual emissions estimates. The hourly emission rates for the 500 hours/year full-capacity case were annualized over the entire year (500 hours/8,760 hours) and then added to the emissions for the lower continuous, standby load operation that was assumed to occur for the remaining hours of the year.
The buyback gas heater emissions were conservative because of the following:
• Operation at standby load was assumed as constant operation for a full year.
The buyback gas heater maximum emissions were conservative because of the following:
• The assumption of 500 hours per year of operation at full-capacity is much higher than the projected actual annual hours (most likely only a few hours per year).
• Assumed operation at maximum load for all 500 hours does not account for any operational load variations that would typically result in lower emissions.
The emission factors that used for these gas-fired heaters are not dependent on ambient temperature.
7.3.2 Criteria Pollutant Modeling Conservative estimates of the short-term and long-term emissions from the gas-fired heaters were needed to support required dispersion modeling for evaluation of GTP impacts to air quality. Additionally, representative stack parameters (exhaust temperature and velocity) accompanying these emission rates were needed to represent the individual facility sources within the air dispersion model. The long-term annual emissions were calculated with the same methodology used to determine the PTE emissions, as previously described. Also, the short term emissions of NOx and SO2 from the maximum operation of the Buyback Gas Bath Heaters were annualized in accordance with USEPA guidance (USEPA 2011) on modeling emissions from intermittent sources. Operating Load Selection
Table 7-4 shows the gas-fired heaters operating load assumptions that were used in determining short-term emission rates for the criteria pollutant modeling analyses for all pollutants and averaging times. As discussed in Section 7.3.1 and allowed by USEPA guidance (USEPA 2011), the Buyback Gas Bath Heaters maximum “hourly” emission rates used in the modeling for 1-hour NO2 and 1-hour SO2 were determined by spreading the annual emissions over the 8,760 hours of the year (annualized). This practice removed the unreasonable conservatism associated with assuming continuous operation for equipment that would actually operate at full load for only a few hours per year. The annualized emission rates were based on the maximum hourly emission rate derated by a factor of 500 hours/8,760 hours. Additionally, as previously stated for the Building Heat Medium Heaters and the Operations Camp Heaters, only two of the three heaters were included as simultaneous operational emission sources in the dispersion modeling. Assuming all three heaters operating at 100% capacity would not be a reasonably foreseeable operation mode.
The modeled exhaust velocities and exhaust temperatures for the individual heaters were those corresponding to the assumed load operations for determining emissions. These values are not be dependent on ambient temperature.
APPENDIX A EMISSIONS CALCULATION REPORT FOR THE GAS
TREATMENT PLANT
USAG-P1-SRZZZ-00-000001-000 7-OCT-16
REVISION: 1
PUBLIC PAGE 37 OF 81
Table 7-5 shows the selection of modeling parameters for evaluating annual average impacts. All annual emission rates for the maximum Buyback Gas Bath Heater operation were based on the maximum emission rate derated by a factor of 500 hours/8,760 hours.
APPENDIX A EMISSIONS CALCULATION REPORT FOR THE GAS TREATMENT PLANT
USAG-P1-SRZZZ-00-000001-000 7-OCT-16
REVISION: 1
PUBLIC PAGE 38 OF 81
Table 7-4 Short-Term Modeling Parameters for GTP Fired Heaters
Pollutant Emission Type
Building Heat Medium Heaters and Operations Camp Heaters
Buyback Gas Bath Heater (Standby)
Buyback Gas Bath Heater (Full-Capacity)
Emissions Exhaust Velocity
Exhaust Temperature Emissions Exhaust
Velocity Exhaust
Temperature Emissions Exhaust Velocity
Exhaust Temperature
Selected Load
Selected Load
Selected Load
Selected Load
Selected Load
Selected Load
Selected Load
Selected Load
Selected Load
NO x 1-Hour
Maximum Operating
Load (100%)
Maximum Operating
Load (100%)
Maximum Operating Load
(100%)
Standby Operating
Load (1%)
Standby Operating
Load (1%)
Standby Operating Load
(1%)
100% (Annualized)
Full-Capacity Operating
Load (100%)
Full-Capacity Operating Load
(100%)
CO 1-Hour 100%
8-Hour 100%
PM 10 24-Hour 100%
PM 2.5 24-Hour 100%
SO 2
1-Hour 100% (Annualized)
3-Hour 100%
24-Hour 100%
Table 7-5 Long-Term Modeling Parameters for GTP Fired Heaters
Pollutant
Building Heat Medium Heaters and Operations Camp Heaters
Buyback Gas Bath Heater (Standby)
Buyback Gas Bath Heater (Full-Capacity)
Emissions Exhaust Velocity
Exhaust Temperature Emissions Exhaust
Velocity Exhaust
Temperature Emissions Exhaust Velocity
Exhaust Temperature
Selected Load
Selected Load
Selected Load
Selected Load
Selected Load
Selected Load
Selected Load
Selected Load
Selected Load
NO x
Maximum Operating Load
(100%)
Maximum Operating Load
(100%)
Maximum Operating Load
(100%)
Standby Operating
Load (10%)
Standby Operating
Load (1%)
Standby Operating Load
(1%)
Full-Capacity Operating
Load (100%)
Full-Capacity Operating
Load (100%)
Full-Capacity Operating Load
(100%)
CO
PM 10
PM 2.5
SO 2
APPENDIX A EMISSIONS CALCULATION REPORT FOR THE GAS TREATMENT PLANT
USAG-P1-SRZZZ-00-000001-000 7-OCT-16
REVISION: 1
PUBLIC PAGE 39 OF 81
Final Calculated Modeling Emissions The short-term and long-term emissions calculated for the heaters to be included in the facility’s modeling compliance demonstration are shown in Table 7-6 and Table 7-7.
Buyback Gas Bath Heater (Primary Heater) Buyback Gas Bath Heater (Secondary Heater) Reference
to Calculation
Standby Full-Capacity Standby Full-Capacity
Emission (g/s)
Exhaust Temp (°K)
Exhaust Velocity
(m/s)
Emission (g/s)
Exhaust Temp (°K)
Exhaust Velocity
(m/s)
Emission (g/s)
Exhaust Temp (°K)
Exhaust Velocity
(m/s)
Emission (g/s)
Exhaust Temp (°K)
Exhaust Velocity
(m/s)
NO x Short-Term 1.55E-03
589 0.10
0.01 (Annualized)
589 16.7
1.55E-03
748 0.12
0.01 (Annualized)
748 17.5 Section EC-2 and EC-6
Long-Term 1.55E-03 0.01 1.55E-03 0.01
CO Short-Term 1.60E-03 0.26 1.60E-03 0.22
PM 10 Short-Term 1.44E-04 0.02 1.44E-04 0.02
Long-Term 1.44E-04 1.36E-03 1.44E-04 1.12E-03
PM 2.5 Short-Term 1.44E-04 0.02 1.44E-04 0.02
Long-Term 1.44E-04 1.36E-03 1.44E-04 1.12E-03
SO 2
@ 16 ppmv
Short-Term (Hourly)
5.17E-05 4.57E-04 (Annualized)
5.17E-05 3.77E-04 (Annualized)
Short-Term (Daily)
5.17E-05 8.01E-03 5.17E-05 6.61E-03
Long-Term 5.17E-05 4.57E-04 5.17E-05 3.77E-04
SO 2
@ 96 ppmv
Short-Term (Hourly)
3.09E-04 2.74E-03 3.09E-04 2.26E-03
Short-Term (Daily)
3.09E-04 4.80E-02 3.09E-04 3.96E-02
Long-Term 3.09E-04 2.74E-03 3.09E-04 2.26E-03
APPENDIX A EMISSIONS CALCULATION REPORT FOR THE GAS
TREATMENT PLANT
USAG-P1-SRZZZ-00-000001-000 7-OCT-16
REVISION: 1
PUBLIC PAGE 41 OF 81
7.3.3 AQRV Modeling AQRV modeling is different from criteria pollutant modeling, in that it includes additional attention to acid deposition and visibility impacts. Emissions of gaseous pollutants in the AQRV impact assessment were the same as those used in the other short-term impact modeling described in Section 7.3.2. The short-term particulate matter emissions used for the AQRV analysis were speciated as described in the following subsection.
PM Speciation Breakdown Table 7-8 shows the assumed breakdown and basis for the short-term fired heater emissions of the PM10 and PM2.5 into filterable and condensable fractions, as required for AQRV modeling.
Table 7-8 AQRV PM Speciation for GTP Fired Heaters
APPENDIX A EMISSIONS CALCULATION REPORT FOR THE GAS
TREATMENT PLANT
USAG-P1-SRZZZ-00-000001-000 7-OCT-16
REVISION: 1
PUBLIC PAGE 42 OF 81
8.0 DEVELOPMENT OF EMISSIONS AND MODELED STACK PARAMTERS: FLARES
8.1 OPERATIONS DESCRIPTION The flare system at the GTP Facility would consist of four different types of flares, high and low pressure CO2 flares and high and low pressure hydrocarbon flares. The multiple flare services would be provided in an effort to minimize the required sizes of the flares and the flare headers. High pressure and low pressure flares would be separated based on the relief pressure of the largest single relief gas flow rate. The separation of high pressure from low pressure would reduce the amount of equipment required to have a high design pressure to account for high back pressures. Additionally, the hydrocarbon services would be separated from the CO2 services due to the complications of low-BTU flaring. The flaring events involving a gas with a heating value greater than 200 BTU/scf would be routed to the hydrocarbon flare, while all gas streams with lower heating values would be routed to the CO2 flares, where they could be mixed with assist gas to increase the streams’ heating value for flaring. The USEPA’s AP-42 Compilation of Air Pollutant Emission Factors, Chapter 13, Section 5 (USEPA 2009) on Industrial Flares requires the gas flared to have a fuel heating value of at least 200 BTU/ft3 to ensure complete combustion. The relief streams from the CO2 area within the GTP would not meet the required fuel heating value and would need to have fuel gas added to the stream in order to ensure combustion. The fuel gas addition would be designed to increase the relief flow fuel value up to 300 BTU/ft3 for conservatism.
Four common flare headers would be split into two flare systems, each sized to handle 100% of the anticipated GTP’s requirements. One flare system would be operational and the other system would be held in reserve. This would allow for the facility to keep operating during any individual flare maintenance or shutdown event. The reserve flare system would be fed with fuel gas to keep the flare headers purged of oxygen and to keep the flare pilots operational.
8.2 EMISSIONS DATA SOURCE Common industry references were used to provide emission factors, which were applied with flare operating data to calculate pollutant emission rates.
Table 8-1 shows the references for these emission factors for criteria pollutants, hazardous air pollutants and greenhouse gases.
APPENDIX A EMISSIONS CALCULATION REPORT FOR THE GAS
TREATMENT PLANT
USAG-P1-SRZZZ-00-000001-000 7-OCT-16
REVISION: 1
PUBLIC PAGE 43 OF 81
Table 8-1 Data Sources for GTP Flare Equipment Emissions Estimation
Pollutant Data Source Description NO x AP-42 equipment emission factors, Section 13.5 (USEPA 2009)
CO AP-42 equipment emission factors, Section 13.5 (USEPA 2009)
PM 2.5 Assumed same value as PM 10 for most conservative estimate
SO 2 Mass balance assuming all sulfur in the fuel becomes SO 2 (H2SO 4 emissions included in SO 2)
Lead2 Negligible
Total GHG 40 CFR 98 Subpart C (USEPA 2011)
Total HAPs Ventura County Air Pollution Control District, AB 2588 Combustion Emission Factors (VCAPD 2001)
NO 2/NO x Ratio USEPA’s default accepted ratio of 0.5 (USEPA 2011)
Note 1: PM emissions were included in the analysis for conservatism. It was understood that the smokeless flare design would have low particulate matter emissions. The PM mass emissions were calculated conservatively based on an assumed soot concentration of 40 µg/L for l ightly smoking flares as cited in USEPA’s AP 42 Compilation of Air Pollutant Emission Factors. Note 2: The primary source of lead emissions from combustion sources would be lead additives contained in some fuels that could subsequently be emitted during combustion. Since lead is not an additive to any GTP source fuels, it would only be present at negligible trace levels as a result of engine lubricant constituents or due to engine wear. Therefore, lead emissions are negligible, and the source emissions do not cause or contribute to an exceedance of the lead NAAQS.
8.3 EMISSION CALCULATION METHODOLOGY FOR DETERMINATION OF POTENTIAL TO EMIT AND MODELING Information on maximum foreseeable annual emissions was needed to determine the individual equipment and total facility PTE. Calculating the annual tons per year per pollutant was needed for PSD Applicability determination and for FERC Impact Assessment of facility impacts. Additionally, short-term and long-term emissions were calculated for predicting near-field and far-field air quality impacts by means of dispersion modeling. The following sections describe the calculation methods for determining annual tons per year and emissions for other appropriate averaging times as required for modeling.
8.3.1 Potential to Emit for PSD Applicability and FERC Impact Assessment Annual emission rates to support FERC Impact Assessment were estimated in the same manner used to quantify emissions for comparison with New Source Review PSD Applicability thresholds. Considerations that drove the emission calculations for the flares include annual operating hours and emergency relief rates.
Operating Hours and Operating Load
Emissions from the flare systems were calculated uniquely because this equipment would normally operate continuously at a low throughput, with only a few non-routine events per year during which the flares would operate at a much higher maximum throughput. Purge gas through the headers and pilot gas to keep the flare pilots lit would be combusted by the flares 8,760 hours/year (continuously), while the maximum flaring condition, for limited emergency or upset conditions, was conservatively assumed to occur 500 hours/year. The emissions from the 500 hours/year maximum case were annualized over the entire year using a derating factor of 500 hours/8,760 hours, which then were added to the emissions for the continuous purge/pilot fuel gas feed.
The flare PM emission factor in USEPA’s AP-42 Compilation of Air Pollutant Emission Factors (USEPA 2009) is based on the exhaust flow rate, not the fuel feed rate. An additional calculation
APPENDIX A EMISSIONS CALCULATION REPORT FOR THE GAS
TREATMENT PLANT
USAG-P1-SRZZZ-00-000001-000 7-OCT-16
REVISION: 1
PUBLIC PAGE 44 OF 81
was required to determine the full exhaust flow rate from the flare based on the fuel flow mixing with atmospheric air and combusting. The methodology described in 40 CFR 60 Method 19: Determination of Sulfur Dioxide Removal Efficiency and Particulate Matter, Sulfur Dioxide, and Nitrogen Oxide Emission Rates (USEPA 1991) was used to develop the exhaust flow rate based on an assumed dry oxygen concentration in the exhaust. Equation 19-1 of Method 19 was employed to determine the exhaust flow using an Fd factor, fuel flow heat duty, and the O2 concentration. An Fd factor of 8,710 dscf/MMBtu was used, since only gaseous fuels would be combusted in the flares. The Fd factor only accounts for gas with butane (C4 or lower) as the heaviest component. While other components may be sent to the flares, the majority of hydrocarbon streams at the facility would be natural gas (C1). The oxygen and water concentrations of the flare exhaust gas was assumed to be similar to standard values used for the other external combustion devices (boilers/heaters). Specifically, an oxygen concentration of 3% and a water concentration of 10% were used in the calculation.
Table 8-2 provides the assumed operational characteristics selected for the calculation of maximum annual pollutant emissions, based on continuous pilot/purge operation, and intermittent maximum/emergency relief operation for 500 hours per year.
The flare purge/pilot emissions were conservative because of the following:
• Operation at constant load was assumed for a full year without any variations which would typically result in lower emissions.
The flare maximum emissions were conservative because of the following:
• 500 hours of operation per year was assumed and is much higher than the projected actual operation per year (more likely less than 1 hour of such operation per year).
• Maximum load for full duration of operation without any variations which would typically result in lower emissions.
The emission factors used for the flares are not ambient temperature dependent.
Table 8-2 Assumed GTP Flare Annual Operations
Pollutant Annual Operating Hours
(Pilot/Purge) All Flares
Annual Operating Hours (Maximum) All Flares
Selected Load All Flares
NO x
Continuous Full-Time Operation (8,760)
Maximum Intermittent Operating Hours (500)
Pilot/Purge: Pilot/Purge Flare Tip Operation
Rate (100%)
Maximum: Maximum Flare Operation Rate
(100%)
CO
VOC
PM 10
PM 2.5
SO 2
Total GHG
Total HAPs
APPENDIX A EMISSIONS CALCULATION REPORT FOR THE GAS
TREATMENT PLANT
USAG-P1-SRZZZ-00-000001-000 7-OCT-16
REVISION: 1
PUBLIC PAGE 45 OF 81
Final Calculated Annual Emissions
The annual emissions calculated for the flares to be included in the facility’s PTE summary are shown in Table 8-3.
Table 8-3 GTP Flare PTE Summary
Pollutant
LP CO2 Flare (Per Flare)
HP CO2 Flare (Per Flare)
HP Hydrocarbon Flare
(Per Flare)
LP Hydrocarbon Flare
(Per Flare) Reference
to Calculation Purge/
Pilot Max Purge/Pilot Max Purge/
Pilot Max Purge/Pilot Max
NO x ton/year 2.03 164 0.88 53.6 2.34 1,246 0.43 76.4
8.3.2 Criteria Pollutant Modeling Conservative estimates of the short-term and long-term emissions from flaring were needed to support required dispersion modeling for evaluation of GTP impacts to air quality. Additionally, representative stack parameters (exhaust temperature and velocity) accompanying these emission rates were needed to represent the individual facility sources within the air dispersion model. The long-term annual emissions were calculated with the same methodology used to determine the PTE emissions, as previously described. Also, the short term maximum/emergency emissions for NOx and SO2 were annualized in accordance with USEPA guidance (USEPA 2011) for emissions calculations to support modeling of intermittent sources.
Operating Load Selection
The flares required two separate emissions calculations: one for the purge/pilot emissions that occur continuously for 8,760 hours/year, and another for the emergency maximum flaring case that was assumed to occur 500 hours per year. Emissions for the latter operating mode were annualized over the entire year (derated by a factor of 500 hours/8,760 hours). All emissions were modeled at the same location.
Table 8-3 details the flare operational characteristics assumed for the calculation of short-term modeled flare emission rates.
The exhaust velocity for flares was 20 m/s, a recommended modeling value as described in the Project Modeling Reports.
The exhaust temperature was 1,273°K, a recommended modeling value, as described in the Project Modeling Reports.
In accordance with USEPA Guidance (USEPA 1995), flares also required additional consideration for the calculation of their modeled heights and diameters. It is understood that flares are different from most other combustion emissions sources in that the gas combustion occurs at the exit point into the atmosphere, rather than upstream of the stack inlet. Because of the location of the emissions release above the flame, the height of plume release will actually be much higher than the physical stack height. For this reason, an effective height was calculated to simulate a taller stack height that better represents the true plume elevation. An effective
APPENDIX A EMISSIONS CALCULATION REPORT FOR THE GAS
TREATMENT PLANT
USAG-P1-SRZZZ-00-000001-000 7-OCT-16
REVISION: 1
PUBLIC PAGE 46 OF 81
diameter was also calculated for the flares to account for the correct initial size of the plume after the combustion has occurred beyond the flare exit. Both the effective height and effective diameter were based on the heat release rate of the gas flow to the flare prior to combustion. Detailed development of the effective stack heights and diameters are shown in Section EC-7.
Table 8-4 and Table 8-5 summarize the information that was used for development of short-term and long-term flaring emission estimates, respectively. All annual emission rates for the maximum operation scenarios were based on the maximum emission rate derated by a factor of 500 hours/8,760 hours.
Table 8-4 Short-Term Modeling Parameters for GTP Flares
Pollutant Emission Type
Purge/Pilot Emissions
Maximum Relief Emissions Exhaust
Velocity Exhaust
Temperature Selected Load Selected Load
NO x 1-Hour
Purge/Pilot Operating Load
(100%)
100% (Annualized)
USEPA and ADEC Standard
(20 m/s)
USEPA and ADEC Standard (1,273°K)
CO 1-Hour 100%
8-Hour 100%
PM 10 24-Hour 100%
PM 2.5 24-Hour 100%
SO 2
1-Hour 100%
(Annualized)
3-Hour 100%
24-Hour 100%
Table 8-5 Long-Term Modeling Parameters for GTP Flares
Pollutant Purge/Pilot Emissions Maximum Relief
Emissions Exhaust Velocity Exhaust Temperature
Selected Load Selected Load NO x
Purge/Pilot Operating Load (100%)
Maximum Operating Load (100%)
USEPA and ADEC Standard (20 m/s)
USEPA and ADEC Standard (1,273°K)
CO
PM 10
PM 2.5
SO 2
APPENDIX A EMISSIONS CALCULATION REPORT FOR THE GAS
TREATMENT PLANT
USAG-P1-SRZZZ-00-000001-000 7-OCT-16
REVISION: 1
PUBLIC PAGE 47 OF 81
Final Calculated Modeling Emissions
The short-term and long-term emissions calculated for the flares to be included in the facility’s modeling compliance demonstration are shown in Table 8-6 and Table 8-7.
Table 8-6 Modeling Emissions Summary for GTP CO2 Flares
Pollutant
LP CO2 Flare (Per Flare)
HP CO2 Flare (Per Flare) Reference
to Calculation
Purge/Pilot Emission
(g/s)
Maximum Emissions
(g/s)
Exhaust Temp (°K)
Exhaust Velocity
(m/s)
Purge/Pilot Emission
(g/s)
Maximum Emissions
(g/s)
Exhaust Temp (°K)
Exhaust Velocity
(m/s)
NO x Short-Term 0.06 4.71
(Annualized)
1,273 20
0.03 1.54 (Annualized)
1,273 20 Sections EC-2 and
EC-7
Long-Term 0.06 4.71 0.03 1.54
CO 1-hour 0.27 188 0.12 61.6
8-hour 0.27 23.5 0.12 7.70
PM 10 Short-Term 0.02 0.71 0.01 0.23
Long-Term 0.02 1.95 0.01 0.64
PM 2.5 Short-Term 0.02 0.71 0.01 0.23
Long-Term 0.02 1.95 0.01 0.64
SO 2
@ 16 ppmv
Short-Term (Hourly)
2.16E-03 0.57 (Annualized)
9.37E-04 0.19 (Annualized)
Short-Term (Daily)
2.16E-03 1.66 9.37E-04 0.54
Long-Term 2.16E-03 0.57 9.37E-04 0.19
SO 2
@ 96 ppmv
Short-Term (Hourly)
0.01 3.40 (Annualized)
0.01 1.11 (Annualized)
Short-Term (Daily)
0.01 9.92 0.01 3.25
Long-Term 0.01 3.40 0.01 1.11
APPENDIX A EMISSIONS CALCULATION REPORT FOR THE GAS
TREATMENT PLANT
USAG-P1-SRZZZ-00-000001-000 7-OCT-16
REVISION: 1
PUBLIC PAGE 48 OF 81
Table 8-7 Modeling Emissions Summary for GTP Hydrocarbon Flare
Pollutant
HP Hydrocarbon Flare (Per Flare)
LP Hydrocarbon Flare (Per Flare) Reference
to Calculation
Purge/Pilot Emission
(g/s)
Maximum Emissions
(g/s)
Exhaust Temp (°K)
Exhaust Velocity
(m/s)
Purge/Pilot Emission
(g/s)
Maximum Emissions
(g/s)
Exhaust Temp (°K)
Exhaust Velocity
(m/s)
NO x Short-Term 0.07 35.85
(Annualized)
1,273 20
0.01 2.20 (Annualized)
1,273 20 Sections EC-2 and
EC-7
Long-Term 0.07 35.85 0.01 2.20
CO 1-hour 0.31 1,432 0.06 87.8
8-hour 0.31 179 0.06 11.0
PM 10 Short-Term 0.03 5.43 0.01 0.33
Long-Term 0.03 14.9 0.01 0.91
PM 2.5 Short-Term 0.03 5.43 0.01 0.33
Long-Term 0.03 14.9 0.01 0.91
SO 2 @ 16 ppmv
Short-Term (Hourly)
2.48E-03 1.49 (Annualized)
4.54E-04 0.08 (Annualized)
Short-Term (Daily)
2.48E-03 4.34 4.54E-04 0.24
Long-Term 2.48E-03 1.49 4.54E-04 0.08
SO 2
@ 96 ppmv
Short-Term (Hourly)
0.02 8.90 (Annualized)
2.72E-03 0.49 (Annualized)
Short-Term (Daily)
0.02 26.0 2.72E-03 1.42
Long-Term 0.02 8.90 2.72E-03 0.49
8.3.3 AQRV Modeling AQRV modeling is different from criteria pollutant modeling in that it includes additional attention to acid deposition and visibility impacts. Emissions for gaseous pollutants in the AQRV impact assessments were the same as those used in the other short-term impact modeling described in Section 8.3.2. The short-term particulate matter emissions were speciated for the AQRV analysis as described in the following subsection. PM Speciation Breakdown
Table 8-8 shows the assumed breakdown and basis for the short-term GTP flare emissions of the PM10 and PM2.5 into filterable and condensable fractions, as required for AQRV modeling.
Table 8-8 AQRV PM Speciation for GTP Flares
Fuel Type
Fine Particulates from Non-
Combustion
Elemental Carbon (% Filterable)
Secondary Organic Aerosols
(% Condensable) Reference
PM 2.5 PM 10 PM 2.5 PM 10
Gas 0 25% 25% 75% 75%
AP-42 Table 1.4-2 (pilot/purge fuel gas, assumed as external
combustion source) (USEPA 2009)
APPENDIX A EMISSIONS CALCULATION REPORT FOR THE GAS
TREATMENT PLANT
USAG-P1-SRZZZ-00-000001-000 7-OCT-16
REVISION: 1
PUBLIC PAGE 49 OF 81
9.0 GTP MOBILE SOURCES Mobile sources typically are not included in a PSD Applicability assessment or in PSD modeling, However, mobile source emissions associated with the operational GTP were provided for full assessment of potential Project impacts to air quality in FERC Resource Report 9 submittal. The following sections describe the intended methodology for developing this information.
9.1.1 On Land Emissions of NOx, CO, VOC, SO2, PM10, PM2.5, CO2, CH4, N2O, and HAPs from on-road equipment associated with routine operations were estimated based on USEPA’s MOVES2014 motor vehicle emissions estimation program. The latest county-specific MOVES2014 input data available from ADEC was used and adjusted to approximate on-road emission factors for 2027. The assumed first full year of normal operation that does not include additional overlapping construction activities. As previously stated, construction-related emissions are not included in this Report.
The MOVES-generated emission factors (g/mi) for individual vehicle categories were multiplied by the average speeds of the equipment and the corresponding yearly operating hours to estimate annual emissions. The annual operating hours per unit for the vehicles were estimated based on assumed operations of 5 hours per day for garbage and food delivery trucks, 10 hours per month for various delivery and hazardous waste trucks, 20 hours per month for maintenance personnel and vacuum trucks, and 120 hours per month for the intercity bus operation. It was assumed that idling time has been included in the operating hours provided by the facility design team. All emissions were calculated in lb/hr and tons per year. All on-road vehicle types considered for mobile emissions are shown in Table 9-1.
The non-road emissions include mobile vehicles that would only be operated on-site, such as cranes and backhoes. Additionally, portable emissions sources were included in this category such as mobile generator sets or air compressors. These portable emission sources would not produce emissions while moving, but would not be bound to one location. The non-road emissions were calculated using Tier 4 standards from the NON-ROAD program for NOx, CO, PM, and Total Hydrocarbon (THC). The equipment type was assigned a Standard Classification Code (SCC) which connects the equipment type to the emissions. In addition to the emission factors for each pollutant, a load factor from the NMIM/NONROAD08 model factors (USEPA 2010) was applied to the diesel engine capacity to account for efficiency of the engine and to more accurately calculate emissions per normal operating horsepower output. All non-road vehicle types considered for mobile emissions are shown in Table 9-1.
APPENDIX A EMISSIONS CALCULATION REPORT FOR THE GAS
TREATMENT PLANT
USAG-P1-SRZZZ-00-000001-000 7-OCT-16
REVISION: 1
PUBLIC PAGE 50 OF 81
Table 9-1 GTP Emitting Mobile and Non-Road Equipment Types
Source Type Source Description
Mobile
Single Unit Short-Haul Truck
Light Commercial Truck
Intercity Bus
Passenger Truck
Non-Road
Light Commercial Air Compressor
Graders
Tractors/Loaders/Backhoes
Crane
Rubber Tire Dozer
Rubber Tire Loader
Light Commercial Generator Set
Forklifts
Aerial Lift
Skid Steer Loader
Light Commercial Welders
9.1.2 Marine During normal operation of the Gas Treatment Plant, there would be no marine transportation emission sources associated with the facility.
9.1.3 Final Mobile Emissions The emissions from the mobile and non-road/portable sources used for calculating the potential emissions from mobile equipment are shown in Sections EC-12 and EC-13.
APPENDIX A EMISSIONS CALCULATION REPORT FOR THE GAS
TREATMENT PLANT
USAG-P1-SRZZZ-00-000001-000 7-OCT-16
REVISION: 1
PUBLIC PAGE 51 OF 81
10.0 OFF-SITE EMISSIONS SOURCES The previous sections of this Report have described the development of air pollutant emissions information for the specific sources within the Project facilities themselves. This section provides comparable information on the methods that were used to characterize the emissions of off-site facilities that were included explicitly in predicting near-field and far-field cumulative impacts. For purposes of this discussion, “near-field” impacts were those predicted to occur at receptors within a 50-kilometer radius from the GTP, whereas “far-field” impacts were those at distances greater than 50 kilometers. The PSD modeling that was conducted to evaluate near-field cumulative impacts of the GTP for comparison with ambient air quality standards and increment limits explicitly included emissions from existing facilities at PBU. Data for the existing facilities were determined from facility permit documents and model input and output files from previous modeling analyses. Assessment of far-field impacts to air quality and AQRVs in Class I and sensitive Class II areas in Alaska required development of much larger modeling emissions inventories of existing sources that were compiled using national and state electronic databases. These emissions data on existing facilities were augmented with estimates for reasonably foreseeable future sources in the project areas that are currently undergoing permitting or construction. The following sections describe the methods and resources that were used to construct the emissions data needed to support both types of modeling analyses.
10.1 EMISSIONS DATA FOR NEAR-FIELD IMPACT ANALYSES
10.1.1 Cumulative Modeling It is anticipated that the two existing sources near the proposed GTP location in the PBU would be capable of causing significant pollutant concentration gradients at the GTP site, i.e., the Central Compression Plant (CCP) and Central Gas Facility (CGF) operated by BP Exploration (Alaska), Inc. (BPXA). Contributions from other North Slope emissions sources were assumed to be captured in locally monitored background pollutant concentrations that were a part of the cumulative impact analysis. USEPA has recently proposed modifications to the Guideline on Air Quality Models (USEPA 2011) that explicitly allow for representation of nearby sources in cumulative impact analyses at their actual operating conditions. Accordingly, emissions from CCP and CGF were included explicitly with GTP emissions in modeling to evaluate compliance with the NAAQS and Class II PSD Increments. For conservatism and because most of the larger units at these facility operate nearly continuously at 100% load (e.g., actual emissions close to maximum allowable), the maximum allowable (100% load) emissions for all CCP and CGF emission units were used in the NAAQS compliance analyses. The emissions data for CCP and CGF were determined from documents associated with the most recent Title V permit renewals for these facilities. The simulations that were conducted to test compliance with the Class II PSD increments used actual emission rates for the same units as reported to the 2011 NEI Database (NEI 2011), except that equipment that commenced operation prior to the North Slope PSD baseline dates were excluded.
Modeling of CCP and CGF NOx emissions required specification of appropriate in-stack NO2/NOx ratios (ISRs) for each emission unit. Review of source test data provided by ADEC and BPXA for the turbines at these and similar units at other North Slope facilities showed that ISRs decrease with increasing engine load and that ISRs are higher for the turbines equipped with air staging NOx controls than for uncontrolled turbines. Based on the substantial body of available relevant source tests, the in-stack ratios shown in Table 10-1 were found to be appropriate for uncontrolled and controlled turbines at operating loads between 80% and 100%.
APPENDIX A EMISSIONS CALCULATION REPORT FOR THE GAS
TREATMENT PLANT
USAG-P1-SRZZZ-00-000001-000 7-OCT-16
REVISION: 1
PUBLIC PAGE 52 OF 81
Table 10-1 In-Stack NO2/NOx Ratios for Use in Modeling CCP and CGF Turbines for Different
Operating Loads
NOx Control Applicable Technologies
Ratio at 80-89% Load
Ratio at 90- 99% Load
Ratio at 100% Load
Uncontrolled Forced Diffusion 0.2 0.1 0.1
Air Staging Control Lean Head End (LHE) Liner 0.5 0.4 0.35
Databases compiled by USEPA and ADEC based on stack testing results indicate that in-stack ratios for heaters/boilers, reciprocating engines and flares are generally less dependent upon operating load. Values selected for modeling involving these equipment types at CCP and CGF are summarized in Table 10-2.
Table 10-2 In-Stack NO2/NOx Ratios Assumed for Other CCP and CGF Combustion Equipment Equipment Ratio
Heaters/boilers 0.10
Internal Combustion Engines 0.10
Flares 0.50
Speciation of particulate matter emissions from CGF and CCP emission units was accomplished using PM10/PM2.5 splits for the appropriate facility equipment categories, as provided in the USEPA AP-42 compilation (USEPA 2009). The relevant splits and corresponding AP-42 citations are presented in Table 10-3.
Table 10-3 PM Speciation Assumed for CCP and CGF Equipment
Pump Diesel 0 86% 87% 14% 13% AP-42 Table 3.4-2 (Smaller than 600 hp, but no condensable info
in AP-42 3.3) (USEPA 2009)
Flares Gas 0 25% 25% 75% 75%
AP-42 Table 1.4-2 (pilot/purge fuel gas, assumed as external
combustion source) (USEPA 2009)
10.2 EMISSIONS DATA FOR FAR-FIELD IMPACT ANALYSES PSD Applicability determinations required dispersion modeling to evaluate GTP impacts at Class I areas located within 300 kilometers of these facilities, including air quality and AQRVs (visibility, acid deposition, impacts to soils and vegetation). It is also anticipated that Federal Land Managers (FLMs) will request additional modeling to evaluate the impacts of these facilities, as well as those of other existing sources and reasonably foreseeable future developments, at several Class II areas that are considered by these agencies to be potentially sensitive to air
APPENDIX A EMISSIONS CALCULATION REPORT FOR THE GAS
TREATMENT PLANT
USAG-P1-SRZZZ-00-000001-000 7-OCT-16
REVISION: 1
PUBLIC PAGE 53 OF 81
quality and related impacts from the Project facility. The areas in northern Alaska for which GTP impacts were assessed include:
• Arctic National Wildlife Refuge (Class II) • Gates of the Arctic National Park and Preserve (Class II)
10.2.1 Emissions Databases to Support Far-Field Modeling Far-field modeling to evaluate cumulative impacts at the Class I and Class II areas identified in the previous section involved searches of emissions databases compiled by National Emissions Inventory (NEI) and ADEC, as described in the following subsections. The NEI database (NEI 2011) was used to compile all active facilities near the proposed project location, while the ADEC Point Source (ADEC 2011) reports provided detailed actual emissions data specific to those facilities that have been identified as potential contributors to the cumulative impacts of the proposed facility.
10.2.1.1 NEI Database
The NEI is a comprehensive and detailed inventory of air emissions for criteria pollutants and precursors, as well as hazardous air pollutants, from stationary air emissions sources. Sources in the NEI include large industrial facilities and electric power plants, airports, and smaller industrial, non-industrial and commercial facilities. A small number of portable sources such as some asphalt and rock crushing operations are also included. The NEI database for a given year includes actual emissions for all criteria pollutants in tons per year, modeled stack parameters and coordinates for all point sources. The most recent available inventory for Alaska was compiled for calendar year 2011. This database was the primary resource available for identifying off-site emission sources to be included in the far-field modeling analyses for the GTP.
10.2.1.2 ADEC Point Source Database The ADEC is required by Federal Regulation 40 CFR 51.30 to submit an annual statewide point-source emission inventory report to USEPA. This report is required to include all sources with potential emissions at or above one of the following thresholds: 2,500 tons per year of SOx, NOx, or CO or 250 tons per year of VOC, PM10, or PM2.5. This database (ADEC 2011) was used in combination with the NEI database to ensure that all potentially significant sources are included.
10.2.2 Identifying Off-Site Sources A computer program was used to search the 2011 NEI database (NEI 2011) for Alaska. Any source located within 300 km of a Class I or Class II area receptor and inside the modeling domain was included. The boundary of the modeling domain was defined by pre-developed meteorological datasets that have been accepted for modeling for the area within Alaska that contain the proposed GTP site.
In order to screen this inventory to remove sources too small to impact the cumulative analysis, a Q/d analysis was conducted following the FLAG 2010 guidance on all of the sources previously identified. The total facility emissions (Q) in tons were obtained by adding together the annual emissions for the three main criteria pollutants specified by FLAG 2010 (NPS 2010): NOx, SO2, and PM10. The Q/d guideline specifies the use of maximum short-term PTE level emissions for this purpose. Since the NEI database only contains actual emissions, these facility totals were doubled to approximate PTE levels. Note that FLAG 2010 also specifies that H2SO4 emissions should be added to the total facility emissions for the Q/d calculation. The NEI Database PM emissions data are presented as primary PM10 (PM10-PRI), which was assumed to include both the filterable and condensable particulate matter fractions, which would include the conversion of the SO2 to H2SO4.
APPENDIX A EMISSIONS CALCULATION REPORT FOR THE GAS
TREATMENT PLANT
USAG-P1-SRZZZ-00-000001-000 7-OCT-16
REVISION: 1
PUBLIC PAGE 54 OF 81
The distances (d) between point sources and the Class I and II locations in kilometers were provided by a computer program and were supplemented by using the Google Earth measurement tool, as needed. The distances for each facility were determined by taking the closest distance from the individual facility’s point sources to the Class I/II location.
Finally, the total annual emissions for each source facility in tons were divided by the corresponding average distance in kilometers to obtain a Q/d value. Using thresholds identified in the FLAG 2010 guidance (NPS 2010), only facilities with a Q/d value or equal to or greater than 10 were included in the final offsite source inventory for far-field modeling.
10.2.3 Modeling Representation of Off-Site Sources Facilities close to the GTP were modeled as point sources for the near-field modeling (see Sections 10.1), and were also included as point sources in the far-field modeling. The additional sources that were added by means of the Q/d analysis described in the previous section were modeled as volume sources for simplicity and consistency. This representation, which used emission totals over all emission units within a given facility, was necessary to prevent an excessive number of individual stack sources in the far-field simulations.
10.2.3.1 Point Source Modeling Parameters As described previously, offsite sources within 50 km of the Project facilities were included in the near-field (AERMOD) impact assessment and were modeled as point sources at either their PTE emissions or actual emission rates. These sources also carried the same point source representations into the far-field (CALMET/CALPUFF) modeling analysis with the more distant sources from the Q/d screening.
All off-site sources in the far-field modeling were represented by actual emissions, rather than PTE, as is now allowed by USEPA according to recently proposed revisions to the Appendix W modeling guidelines (USEPA 2011).
Particulate matter speciation for these point sources in the AQRV modeling was based on individual equipment type/size and corresponding filterable/condensable PM10/2.5 splits consistent with those previously described for the near-field off-site inventory (Table 10-3).
10.2.3.2 Volume Source Modeling Parameters Far-field off-site sources were modeled as volume sources as previously described. The actual criteria pollutant emissions for a particular facility were represented as the summation over all contributing point sources, as obtained from the NEI Database (NEI 2011) (not doubled as in the Q/d analysis).
For conservatism with respect to the predicted visibility impacts, all filterable particulate matter, including that from non-combustion sources, was treated as elemental carbon, and all condensable particulate matter was treated as secondary organic aerosols. The NEI Database (NEI 2011) includes information on filterable PM10, filterable PM2.5 and condensable PM for all listed Alaska sources.
The conservative USEPA default NO2/NOx ratio of 0.5 (USEPA 2011) was used for all volume sources in the far-field NO2 modeling for the GTP.
For consistency, all volume sources were given the same source dimensions of 10 meters wide, by 10 meters long, and 10 meters in height, as shown in Table 10-4. The Sigma-Y and Sigma-Z dimensions are based on a modeling approach that assigns the initial lateral dimension (Sigma-Y) to the length of the side divided by 4.3 and the initial vertical dimension (Sigma-Z) as the height divided by 4.3 also, if the elevated source is not adjacent to a building.
APPENDIX A EMISSIONS CALCULATION REPORT FOR THE GAS
Sigma-y and sigma-z are measures of the volume source’s horizontal and vertical dimensions.
10.2.3.3 Model Parameters for Reasonably Foreseeable Development (RFD) In order to ensure that potential impacts in the Class I and Class II areas were fully addressed, ADEC was contacted regarding other new projects throughout the state that are currently engaged in the permitting process or in construction, and may become operational over the next several years. Lists of such projects were provided by ADEC for the modeling domain containing the Project’s GTP. Information on the corresponding emissions was obtained from permit documents available on the ADEC website (ADEC 2015). Specifically, maximum allowable (PTE) emissions totaled over all emitting equipment at a new facility were used. The same Q/d analysis described above for existing sources was also used for the RFD sources to screen out those for which projected emissions are below a level of concern. Projects exceeding the Q/d criteria were represented as volume sources with the dimensions described in the previous section. The conservative USEPA (USEPA 2011) default NO2/NOx ratio of 0.5 was used for all these future sources in the modeling to estimate NO2.
In Appendix L – Cumulative Impacts of Resource Report #1, Table 1 provides a list of RFDs to be considered in assessing cumulative environmental impacts of the AKLNG facilities. For each identified project, publicly available information was used to provide a brief description of the activity, as well as a “timeframe for construction and operation, location, footprint, and potential resource impacts that would need to be considered in conjunction with Project resource impacts.” Air quality is listed as a potentially affected resource for nearly all of the listed projects since at least some emissions of air pollutants would occur during construction, operations or both. However, not all of the projects listed in Table 1 of Appendix L were included in the long-range cumulative modeling. Reasons for excluding specific projects from the far-field modeling analysis are described below:
• Many of the projects are scheduled for completion by 2014 or 2015. By using the available historical air quality monitoring data to establish background concentrations for the area, the cumulative analysis included the contributions of these sources without explicitly modeling them.
• Some of the projects will be at a considerable distance from the proposed GTP location, or constitute a minor modification of an existing facility that would introduce minimal incremental emissions. These two factors would result in very small Q/d values that would screen out such projects from the modeling. (See Section 10.2.2)
• Many of the projects are currently only at the conceptual and/or study phase, such that the parameters needed for a meaningful estimation of emissions are insufficiently defined.
Additionally, the long-range modeling included a few RFDs that were not identified in the Appendix L list. As noted above, the final list of RFDs for the modeling analysis was developed in direct discussions with ADEC.
10.2.4 Final Offsite Sources with Emissions The emissions from the offsite sources used for the near field and far-field modeling are shown in Sections EC-14.
APPENDIX A EMISSIONS CALCULATION REPORT FOR THE GAS
TREATMENT PLANT
USAG-P1-SRZZZ-00-000001-000 7-OCT-16
REVISION: 1
PUBLIC PAGE 56 OF 81
11.0 ACRONYMS AND TERMS AAAQS Alaska Ambient Air Quality Standards ADEC Alaska Department of Environmental Conservation ARM2 Ambient Ratio Method 2 BTU British Thermal Unit CCP Central Compression Plant CH4 Methane CGF Central Gas Facility CO Carbon Monoxide CO2 Carbon Dioxide FERC Federal Energy Regulatory Commission FLAG Federal Land Managers’ Air Quality Related Values Work Group FLM Federal Land Manager GHG Greenhouse Gas GTP Gas Treatment Plant HAP Hazardous Air Pollutant HP High Pressure HRSG Heat Recovery Stream Generator IC Internal Combustion IMO International Maritime Organization LNG Liquefied Natural Gas lb/hr Pounds per hour LP Low pressure MM Million MMSCFD Million Standard Cubic Feet per Day NAAQS National Ambient Air Quality Standards N2O Nitrous Oxide NO2 Nitrogen Dioxide NOx Nitrogen Oxides Pb Lead PBU Prudhoe Bay Unit PM2.5 Particulate matter having an aerodynamic diameter of 2.5 microns or less PM10 Particulate matter having an aerodynamic diameter of 10 microns or less PMF Particulate Matter Fine – from non-combustion sources ppmv Parts per million by volume Project Alaska LNG Project PSD Prevention of Significant Deterioration PTU Point Thomson Unit RICE Reciprocating Internal Combustion Engine SF Supplemental Firing SO2 Sulfur Dioxide tpy Tons per Year USEPA U.S. Environmental Protection Agency VOC Volatile Organic Compounds WHRU Waste Heat Recovery Unit
APPENDIX A EMISSIONS CALCULATION REPORT FOR THE GAS
TREATMENT PLANT
USAG-P1-SRZZZ-00-000001-000 7-OCT-16
REVISION: 1
PUBLIC PAGE 57 OF 81
12.0 REFERENCES Alaska Department of Environmental Conservation (ADEC). 2015. 18 AAC 50, Air Quality Control, as
amended through April 17, 2015
______. 2011. ADEC Division of Air Quality. Point Source Inventory, available at http://dec.alaska.gov/Applications/Air/airtoolsweb/PointSourceEmissionInventory
______. 2013. ADEC Modeling Review Procedures Manual. June 30, 2013
National Emissions Inventory (NEI). 2011. National Emissions Inventory, available at https://www.epa.gov/air-emissions-inventories/2011-national-emissions-inventory-nei-data
National Park Service, U.S. Department of the Interior, Federal Land Managers’ Air Quality Related Values Work Group (FLAG). 2010. Phase I Report – Revised (2010). http://www.nature.nps.gov/air/Pubs/pdf/flag/FLAG_2010.pdf
United States Environmental Protection Agency (USEPA). 2009. AP-42 Compilation of Air Pollutant Emission Factors. https://www3.epa.gov/ttnchie1/AP-42/
______.1995. SCREEN3 Model User’s Guide. USEPA 454/B 94 004. Office of Air Quality Planning and Standards, Research Triangle Park, NC. September 1995
______. 2010. 40 CFR Part 1039 Subpart B, 1039.102: Control of Emissions from New and In-Use Nonroad Compression-Ignition Engines
______. 2013. 40 CFR Part 60 Subpart IIII, Appendix Table 4: Emission Standards for Stationary Fire Pump Engines
______. 2005. 40 CFR Part 89 Subpart B, 89.112: Control of Emissions from New and In-Use Nonroad Compression-Ignition Engines
______. 2011. 40 CFR Part 98 Subpart C: Mandatory Greenhouse Gas Reporting
______. 2011. Additional Clarification Regarding Application of Appendix W Modeling Guidance for the 1-hour NO2 National Ambient Air Quality Standard. Memorandum from Tyler Fox (USEPA) to Regional Air Division Directors. March 1, 2011
______.1991. 40 CFR 60 Method 19: Determination of Sulfur Dioxide Removal Efficiency and Particulate Matter, Sulfur Dioxide, and Nitrogen Oxide Emission Rates
______. 2015. “Revision to the Guideline on Air Quality Models: Enhancements to the AERMOD Dispersion Modeling System and Incorporation of Approaches to Address Ozone and Fine Particulate Matter”, issued and submitted for publication in the Federal Register on July 14, 2015
Ventura County Air Pollution Control District (VCAPD). 2001. AB2588 Combustion Emission Factors. http://www.aqmd.gov/docs/default-source/permitting/toxics-emission-factors-from-combustion-process-.pdf?sfvrsn=0
Western Regional Climate Center (WRCC). 2006. Historical Climate Data. http://www.wrcc.dri.edu/summary/Climsmak.html
APPENDIX A EMISSIONS CALCULATION REPORT FOR THE GAS TREATMENT PLANT
USAG-P1-SRZZZ-00-000001-000 7-OCT-16
REVISION: 1
PUBLIC PAGE 58 OF 81
EC-1 GAS TREATMENT PLANT POTENTIAL TO EMIT SUMMARY
NOTES500 hours Intermittent Diesel Equipment has been modeled with an annual value based on operating only 500 hours/year.500 hours Maximum Flaring Events have been modeled with an annual value based on operating only 500 hours/year.
8,760 hours Annual hours0.5 hours Per day maximum flare operation
1 Supplemental Firing emissions have been included in the total emissions from the turbine source. To be conservative, the additional supplemental firing flow rate and velocity have not been included in the stack parameter selection2 Intermittent equipment 1-hr NOx and SO2 emissions can be annualized
ConfigurationBase
Elevation (m)
Total Emissions (Without Maximum Flare)Total Emissions (With Maximum Flare)
Coordinates (UTM, NAD 83, Zone 6)Modeled
ID Emission UnitModeled Height SO2 @96 ppmvdVelocity Diameter NOxTemperature CO PM10 PM2.5 SO2 @16 ppmvd
APPENDIX A EMISSIONS CALCULATION REPORT FOR THE GAS TREATMENT PLANT
USAG-P1-SRZZZ-00-000001-000 7-OCT-16
REVISION: 1
PUBLIC PAGE 60 OF 81
PMF/SOIL EC - PM2.5 EC - PM10 SOA - PM2.5 SOA - PM10
g/s g/s g/s g/s g/sTurbines
1A Train 1a Treated Gas Compressor Turbine Primary Stack1 Turbine Gas 0.000E+00 1.573E-01 1.573E-01 3.891E-01 3.891E-011B Train 1b Treated Gas Compressor Turbine Primary Stack1 Turbine Gas 0.000E+00 1.573E-01 1.573E-01 3.891E-01 3.891E-012A Train 2a Treated Gas Compressor Turbine Primary Stack1 Turbine Gas 0.000E+00 1.573E-01 1.573E-01 3.891E-01 3.891E-012B Train 2b Treated Gas Compressor Turbine Primary Stack1 Turbine Gas 0.000E+00 1.573E-01 1.573E-01 3.891E-01 3.891E-013A Train 3a Treated Gas Compressor Turbine Primary Stack1 Turbine Gas 0.000E+00 1.573E-01 1.573E-01 3.891E-01 3.891E-013B Train 3b Treated Gas Compressor Turbine Primary Stack1 Turbine Gas 0.000E+00 1.573E-01 1.573E-01 3.891E-01 3.891E-014A Train 1a CO2 Compressor Turbine Primary Stack1 Turbine Gas 0.000E+00 1.133E-01 1.133E-01 2.802E-01 2.802E-014B Train 1b CO2 Compressor Turbine Primary Stack1 Turbine Gas 0.000E+00 1.133E-01 1.133E-01 2.802E-01 2.802E-015A Train 2a CO2 Compressor Turbine Primary Stack1 Turbine Gas 0.000E+00 1.133E-01 1.133E-01 2.802E-01 2.802E-015B Train 2b CO2 Compressor Turbine Primary Stack1 Turbine Gas 0.000E+00 1.133E-01 1.133E-01 2.802E-01 2.802E-016A Train 3a CO2 Compressor Turbine Primary Stack1 Turbine Gas 0.000E+00 1.133E-01 1.133E-01 2.802E-01 2.802E-016B Train 3b CO2 Compressor Turbine Primary Stack1 Turbine Gas 0.000E+00 1.133E-01 1.133E-01 2.802E-01 2.802E-01
7A_1A Power Generator Turbines Turbine Gas 0.000E+00 1.057E-01 1.057E-01 2.614E-01 2.614E-017A_1B Power Generator Turbines Turbine Gas 0.000E+00 1.057E-01 1.057E-01 2.614E-01 2.614E-017A_2A Power Generator Turbines Turbine Gas 0.000E+00 1.057E-01 1.057E-01 2.614E-01 2.614E-017A_2B Power Generator Turbines Turbine Gas 0.000E+00 1.057E-01 1.057E-01 2.614E-01 2.614E-017A_3A Power Generator Turbines Turbine Gas 0.000E+00 1.057E-01 1.057E-01 2.614E-01 2.614E-017A_3B Power Generator Turbines Turbine Gas 0.000E+00 1.057E-01 1.057E-01 2.614E-01 2.614E-01
Flares10E LP CO2 Flare East Pilot/Purge (3 Flare Tips) Flare Gas 0.000E+00 6.072E-03 6.072E-03 1.821E-02 1.821E-0210W LP CO2 Flare West Pilot/Purge (3 Flare Tips) Flare Gas 0.000E+00 6.072E-03 6.072E-03 1.821E-02 1.821E-0211E HP CO2 Flare East Pilot/Purge Flare Gas 0.000E+00 2.634E-03 2.634E-03 7.903E-03 7.903E-0311W HP CO2 Flare West Pilot/Purge Flare Gas 0.000E+00 2.634E-03 2.634E-03 7.903E-03 7.903E-0312E HP Hydrocarbon Flare East Pilot/Purge Flare Gas 0.000E+00 6.977E-03 6.977E-03 2.093E-02 2.093E-0212W HP Hydrocarbon Flare West Pilot/Purge Flare Gas 0.000E+00 6.977E-03 6.977E-03 2.093E-02 2.093E-0213E LP Hydrocarbon Flare East Pilot/Purge Flare Gas 0.000E+00 1.278E-03 1.278E-03 3.833E-03 3.833E-0313W LP Hydrocarbon Flare West Pilot/Purge Flare Gas 0.000E+00 1.278E-03 1.278E-03 3.833E-03 3.833E-03
10E_M LP CO2 Flare East MAX2 (3 Flare Tips) Flare Gas 0.000E+00 1.783E-01 1.783E-01 5.350E-01 5.350E-0111E_M HP CO2 Flare East MAX2 Flare Gas 0.000E+00 5.842E-02 5.842E-02 1.753E-01 1.753E-0112E_M HP Hydrocarbon Flare East MAX2 Flare Gas 0.000E+00 1.358E+00 1.358E+00 4.073E+00 4.073E+0013E_M LP Hydrocarbon Flare East MAX2 Flare Gas 0.000E+00 8.327E-02 8.327E-02 2.498E-01 2.498E-01
Heaters and Incinerators14_1 Building Heat Medium Heater Heater Gas 0.000E+00 6.448E-02 6.448E-02 1.934E-01 1.934E-0114_2 Building Heat Medium Heater Heater Gas 0.000E+00 6.448E-02 6.448E-02 1.934E-01 1.934E-0114_3 Building Heat Medium Heater (Spare)21A Buyback Gas Bath Heater Primary Heater Standby Heater Gas 0.000E+00 3.611E-05 3.611E-05 1.083E-04 1.083E-0421B Buyback Gas Bath Heater Secondary Heater Standby Heater Gas 0.000E+00 3.611E-05 3.611E-05 1.083E-04 1.083E-04
21A_M Buyback Gas Bath Heater Primary Heater MAX2 Heater Gas 0.000E+00 5.943E-03 5.943E-03 1.783E-02 1.783E-0221B_M Buyback Gas Bath Heater Secondary Heater MAX2 Heater Gas 0.000E+00 4.911E-03 4.911E-03 1.473E-02 1.473E-02
NOTES500 hours Intermittent Diesel Equipment has been modeled with an annual value based on operating only 500 hours/year.500 hours Maximum Flaring Events have been modeled with an annual value based on operating only 500 hours/year.
8,760 hours Annual hours0.5 hours Per day maximum flare operation
1
2 Intermittent equipment 1-hr NOx and SO2 emissions can be annualized
Supplemental Firing emissions have been included in the total emissions from the turbine source. To be conservative, the additional supplemental firing flow rate and velocity have not been included in the stack parameter selection
Total Emissions (Without Maximum Flare)Total Emissions (With Maximum Flare)
Modeled ID Emission Unit Fuel Type
Equip Type
APPENDIX A EMISSIONS CALCULATION REPORT FOR THE GAS TREATMENT PLANT
USAG-P1-SRZZZ-00-000001-000 7-OCT-16
REVISION: 1
PUBLIC PAGE 61 OF 81
EC-3 GAS TREATMENT PLANT FUEL SPECIFICATIONS
GTP Fuel Gas SpecificationComponent % By Volume MW Conversion of 1 grain/100 scf of H2S to Sulfur
From GTP Cookbook (FWP and Com Gen Assumed)From GTP Cookbook (FWP and Com Gen Assumed)From GTP Cookbook (FWP and Com Gen Assumed)From GTP Cookbook (FWP and Com Gen Assumed)
Based on Mass Balance of Sulfur
Emergency Non-Emergency
Intermittent Assumption
Standard Factors
EMISSION FACTORS
References/Comments
From GTP CookbookAmbient Temp does not affect emissions
From GTP CookbookAP42 Table 3.3-1For HAPs calculation and CO2eRatio Assumed for FWP and Com Tower GenRatio Assumed for FWP and Com Tower Gen
APPENDIX A EMISSIONS CALCULATION REPORT FOR THE GAS TREATMENT PLANT
PM2.5 (µg/L Exhaust) 40.000 40.000 40.000 40.000 40.000 40.000 40.000 40.000SO2 No Emission Factor No Emission Factor No Emission Factor No Emission Factor No Emission Factor No Emission Factor No Emission Factor No Emission Factor
Load Basis for CT EF >80% >80% >80% >80% >80% >80% >80% >80% >80% >80% >80% >80% >80% >80% >80% >80% >80% >80% >600hp <600hp <600hp <600hpFuel NG NG NG NG NG NG NG NG NG NG NG NG NG NG NG NG NG NG D D D D
Load Basis for CT EF <600hp <600hp 0 0.00 0.00 0.00 0.00 0.00 0.00 0.00 0.00 0.00 0.00 0.00 0.00 0 0 0 0 0 0 0 0 0Fuel D D NG NG NG NG NG NG NG NG NG NG NG NG NG NG NG NG NG NG NG NG NG NG
Train3b Treated Gas Compressor Turbine 386.0 8.60Supplemental Firing 189.0 4.21
Train 1a CO2 Compressor Turbine 291.0 6.48Supplemental Firing 141.8 3.16
Train 1b CO2 Compressor Turbine 291.0 6.48Supplemental Firing 141.8 3.16
Train 2a CO2 Compressor Turbine 291.0 6.48Supplemental Firing 141.8 3.16
Train 2b CO2 Compressor Turbine 291.0 6.48Supplemental Firing 141.8 3.16
Train 3a CO2 Compressor Turbine 291.0 6.48Supplemental Firing 141.8 3.16
Train 3b CO2 Compressor Turbine 291.0 6.48Supplemental Firing 141.8 3.16
Power Generation Turbines 386.0 8.60Power Generation Turbines 386.0 8.60Power Generation Turbines 386.0 8.60Power Generation Turbines 386.0 8.60Power Generation Turbines 386.0 8.60Power Generation Turbines 386.0 8.60LP CO2 Flare East Pilot/Purge (3 Flares) 6.8 0.15LP CO2 Flare West Pilot/Purge (3 Flares) 6.8 0.15HP CO2 Flare East Pilot/Purge 3.0 0.07HP CO2 Flare West Pilot/Purge 3.0 0.07HP Hydrocarbon Flare East Pilot/Purge 7.8 0.17HP Hydrocarbon Flare West Pilot/Purge 7.8 0.17LP Hydrocarbon Flare East Pilot/Purge 1.4 0.03LP Hydrocarbon Flare West Pilot/Purge 1.4 0.03LP CO2 Flare East Assist Gas (For Max Case) 9,558.4 213.00HP CO2 Flare East Assist Gas (For Max Case) 3,141.3 70.00Building Heat Medium Heater 274.7 6.12Building Heat Medium Heater 274.7 6.12Building Heat Medium Heater (spare) 0.0 0.00Buyback Gas Bath Heater Pre-Let Down Heater Standby 0.2 0.00Buyback Gas Bath Heater Post-Let Down Heater Standby 0.2 0.00Buyback Gas Bath Heater Pre-Let Down Heater MAX 25.3 0.56Buyback Gas Bath Heater Post-Let Down Heater MAX 20.9 0.47Operations Camp Heater 31.9 0.71Operations Camp Heater 31.9 0.71Operations Camp Heater (spare) 0.0 0.00
Total Fuel Gas Consumption 21,760 485Rated Duty (HHV) Daily Average Diesel Flow
PTE Emissions since actuals w eren't availableDecommissioned equipment = 0
horizontal release
Notes:
1 UTM Coordinates from current Air Quality Model
2 All emissions based on Worst-Case 24 hour emissions during normal facility operation. All emissions considered as operating 8,760 hours/year
Emergency equipment included in normal operation assumption at an annual operation of 8,760 hours/year. Normally not operational, and only operational at max condition w hile other equipment is not operating normally.
Emissions (g/sec)2Location
Model ID Point Sources Description
APPENDIX A EMISSIONS CALCULATION REPORT FOR THE GAS TREATMENT PLANT
USAG-P1-SRZZZ-00-000001-000 7-OCT-16
REVISION: 1
PUBLIC PAGE 77 OF 81
2/1988 6/1979 11/1978 11/2012
Stack Ht.
(m)
Exit Temp.
(K)
Exit Vel.
(m/s)
Stack Diam. (m)
NO2 Ratio
install/mod date
from permit
Consumes NO2
Increment
Consumes SO2
Increment
Consumes PM10
IncrementConsumes
PM2.5 Increment
801 MS5371PATP Gas Compressor 31.10 750.0 62.90 2.40 0.10 10/91 Yes Yes Yes No
802 MS5371PATP w/LHE Gas Compressor 31.10 754.0 63.30 2.40 0.35 2000 Yes Yes Yes No
803 MS5371PATP Gas Compressor 31.10 750.0 62.90 2.40 0.10 1/91 Yes Yes Yes No
804 MS5371PATP Gas Compressor 31.10 750.0 62.90 2.40 0.10 2/90 Yes Yes Yes No
805 MS5371PATP Gas Compressor 31.10 750.0 62.90 2.40 0.10 10/90 Yes Yes Yes No
806 MS5371PATP Gas Compressor 31.10 750.0 62.90 2.40 0.10 3/91 Yes Yes Yes No
807 MS5371PATP Gas Compressor 31.10 750.0 62.90 2.40 0.10 5/91 Yes Yes Yes No
808 MS5371PATP Gas Compressor 31.10 750.0 62.90 2.40 0.10 9/91 Yes Yes Yes No
809 MS5371PATP Gas Compressor 31.10 750.0 62.90 2.40 0.10 7/91 Yes Yes Yes No
810 MS5371PATP Gas Compressor 31.10 750.0 62.90 2.40 0.10 8/90 Yes Yes Yes No
811 MS5371PATP Gas Compressor 31.10 750.0 62.90 2.40 0.10 2/91 Yes Yes Yes No
812 MS5371PATP Gas Compressor 31.10 750.0 62.90 2.40 0.10 8/91 Yes Yes Yes No
813 MS5371PATP Gas Compressor 31.10 750.0 62.90 2.40 0.10 1991 Yes Yes Yes No
833 MS5382C Tandem Compressor 34.40 774.0 41.30 3.10 0.10 1990 Yes Yes Yes No
834 MS5382C Tandem Compressor 34.40 774.0 41.30 3.10 0.10 1990 Yes Yes Yes No
814 Broach Glycol Heater 20.10 422.0 6.50 1.10 0.10 4/74 No No No No
815 Broach Glycol Heater 20.10 422.0 6.50 1.10 0.10 4/74 No No No No
702 Eclipse Glycol Heater 21.10 611.0 3.70 0.90 0.10 Pre-1977 No No No No
701 Eclipse Glycol Heater 21.10 611.0 3.70 0.90 0.10 Pre-1977 No No No No
816 Solar T-4001 Emergency Generator 16.80 727.0 43.00 1.00 0.10 4/74 No No No No
817 GM Emergency Generator 12.80 616.0 42.00 0.60 0.10 11/84 No Yes Yes No
818 Cummins Emergency Fire Water Pump 12.20 602.0 58.00 0.10 0.10 Pre-1977 No No No No
819 John Zink HP/IP Flare Arm A (A-J, 10x) 3.10 1273.0 20.00 0.20 0.50 Pre-1977 No No No No
820 John Zink HP/IP Flare Arm B (A-J, 10x) 3.10 1273.0 20.00 0.20 0.50 Pre-1977 No No No No
821 John Zink HP/IP Flare Arm C (A-J, 10x) 3.10 1273.0 20.00 0.20 0.50 Pre-1977 No No No No
822 John Zink HP/IP Flare Arm D (A-I, 9x) 3.10 1273.0 20.00 0.20 0.50 Pre-1977 No No No No
823 John Zink STV Flare (A-E, 5x) 4.00 1273.0 20.00 0.40 0.50 Pre-1977 No No No No
824 Line Emergency Backup Flare 4.00 1273.0 20.00 0.40 0.50 Pre-1977 No No No No
825 Line Emergency Backup Flare 4.30 1273.0 20.00 0.40 0.50 Pre-1977 No No No No
PTE Emissions since actuals w eren't availableDecommissioned equipment = 0
horizontal release
Notes:
1 UTM Coordinates from current Air Quality Model
2 All emissions based on Worst-Case 24 hour emissions during normal facility operation. All emissions considered as operating 8,760 hours/yearEmergency equipment included in normal operation assumption at an annual operation of 8,760 hours/year. Normally not operational, and only operational at max condition w hile other equipment is not operating normally.
Stack Parameters
Baseline Dates
Model ID Point Sources Description
APPENDIX A EMISSIONS CALCULATION REPORT FOR THE GAS TREATMENT PLANT
USAG-P1-SRZZZ-00-000001-000 7-OCT-16
REVISION: 1
PUBLIC PAGE 78 OF 81
Central Gas Facility – Actual Emissions
UTM X1 UTM Y1
Base Elev. (m)
NOx (1-hr)
NOx (ann)
PM2.5/PM10
(24-hr) PM2.5/PM10
(annual) SO2
(1-hr)
SO2 (3-hr & 24-hr) SO2 annual CO Equip Type
Fuel Type PMF/SOIL EC - PM2.5 EC - PM10 SOA - PM2.5
SOA - PM10
1116 GE Frame 6 Tandem Compressor 442852.2 7802155.5 1.5 1.962E+01 1.96E+01 3.03E-01 3.03E-01 2.34E-01 2.34E-01 2.34E-01 1.03E+00 Turbine Gas 0.000E+00 8.72E-02 8.72E-02 2.16E-01 2.16E-01
1117 GE Frame 6 Tandem Compressor 442843.9 7802198 1.5 2.543E+01 2.54E+01 3.93E-01 3.93E-01 3.03E-01 3.03E-01 3.03E-01 1.33E+00 Turbine Gas 0.000E+00 1.13E-01 1.13E-01 2.80E-01 2.80E-01
1118 GE Frame 6 Tandem Compressor 442928.2 7802125.6 1.5 2.304E+01 2.30E+01 3.56E-01 3.56E-01 2.74E-01 2.74E-01 2.74E-01 1.21E+00 Turbine Gas 0.000E+00 1.02E-01 1.02E-01 2.53E-01 2.53E-01
1119 GE Frame 6 Tandem Compressor 442920.3 7802168.1 1.5 2.526E+01 2.53E+01 3.90E-01 3.90E-01 3.01E-01 3.01E-01 3.01E-01 1.32E+00 Turbine Gas 0.000E+00 1.12E-01 1.12E-01 2.78E-01 2.78E-01
2 All emissions based on Worst-Case 24 hour emissions during normal facility operation. All emissions considered as operating 8,760 hours/year
Emergency equipment included in normal operation assumption at an annual operation of 8,760 hours/year. Normally not operational, and only operational at max condition w hile other equipment is not operating normally.
Model ID Point Sources Description
Location Emissions (g/sec)2
APPENDIX A EMISSIONS CALCULATION REPORT FOR THE GAS TREATMENT PLANT
USAG-P1-SRZZZ-00-000001-000 7-OCT-16
REVISION: 1
PUBLIC PAGE 79 OF 81
2/1988 6/1979 11/1978 11/2012
Stack Ht.
(m)
Exit Temp.
(K)
Exit Vel.
(m/s)
Stack Diam. (m)
NO2 Ratio
install/mod date from
permit
Consumes NO2
Increment
Consumes SO2
Increment
Consumes PM10
IncrementConsumes PM2.5
Increment
1116 GE Frame 6 Tandem Compressor 36.80 741.0 43.83 3.20 0.10 4/1998 Yes Yes Yes No
1117 GE Frame 6 Tandem Compressor 36.80 741.0 43.83 3.20 0.10 4/1998 Yes Yes Yes No
1118 GE Frame 6 Tandem Compressor 36.80 741.0 43.83 3.20 0.10 4/1998 Yes Yes Yes No
1119 GE Frame 6 Tandem Compressor 36.80 741.0 43.83 3.20 0.10 4/1998 Yes Yes Yes No
1101 Cooper-Rolls/RB211-24C Booster Compressor 31.30 639.0 41.30 2.44 0.10 1986 No Yes Yes No
1102 Cooper-Rolls/RB211-24C Booster Compressor 31.30 639.0 41.30 2.44 0.10 1986 No Yes Yes No
1103 Cooper-Rolls/RB211-24C MI Compressor 34.30 639.0 41.30 2.44 0.10 1986 No Yes Yes No
1104 Cooper-Rolls/RB211-24C MI Compressor 34.30 639.0 41.30 2.44 0.10 1986 No Yes Yes No
1105 GE MS5382C w/LHE Refrigerant Compressor 28.20 521.0 31.63 2.60 0.35 7/1998 Yes Yes Yes No
1106 GE MS5382C w/LHE Refrigerant Compressor 28.20 760.0 36.81 3.05 0.35 8/1998 Yes Yes Yes No
1115 GE MS5382C w/LHE Booster Compressor 43.50 760.0 36.81 3.05 0.35 9/1999 Yes Yes Yes No
1107 Chiyoda-John Zink Hot Oil Heater 49.40 541.0 11.90 2.20 0.10 1986 No Yes Yes No
1108 Chiyoda-John Zink Hot Oil Heater 49.40 541.0 11.90 2.20 0.10 1986 No Yes Yes No
1109 Chiyoda-John Zink Hot Oil Heater 49.40 541.0 11.90 2.20 0.10 1986 No Yes Yes No
1110 GM Emergency Electrical Generator 9.90 608.0 41.10 0.56 0.10 1986 No Yes Yes No
1111 GM Emergency Electrical Generator 9.90 608.0 41.10 0.56 0.10 1986 No Yes Yes No
1122 Caterpillar Emergency Fire Water Pump 13.10 685.0 44.10 0.20 0.10 1986 No Yes Yes No
11131 John Zink Flare HP-Primary Pit 11.90 1273.0 20.00 1.40 0.50 1986 No Yes Yes No
11130 John Zink Flare LP-Primary Pit 11.50 1273.0 20.00 1.32 0.50 1986 No Yes Yes No
NGL John Zink Flare NGL-Primary Pit 8.32 1273.0 20.00 0.65 0.50 1986 No Yes Yes No
Notes:
1 UTM Coordinates from current Air Quality Model
2 All emissions based on Worst-Case 24 hour emissions during normal facility operation. All emissions considered as operating 8,760 hours/year
Emergency equipment included in normal operation assumption at an annual operation of 8,760 hours/year. Normally not operational, and only operational at max condition w hile other equipment is not operating normally.
Baseline Dates
Model ID Point Sources Description
Stack Parameters
APPENDIX A EMISSIONS CALCULATION REPORT FOR THE GAS TREATMENT PLANT
USAG-P1-SRZZZ-00-000001-000 7-OCT-16
REVISION: 1
PUBLIC PAGE 80 OF 81
Additional Facilities – Actual Emissions (RFD sources are in PTE)
Notes:a Locations based on 2011 NEI Database Average Point Source Longitude and Latitude
b Emissions based on Double the Actual Emissions from 2011 NEI Database.1-hr, 3-hr, 8-hr, and 24-hr have been set equal to the annual emission rate for each pollutant. It is assumed that the same level of emissions from the facility are emitted throughout the year (8,760 hours). Specif ic maximum operating cases are not know n.
c All volume source plume assumed to be 10 m x 10 m x 10 m in sizeSyinit assumed 4.3 from Table 3-1 in the AERMOD User's Guide for a single volume sourceSyinit assumed 4.3 from Table 3-1 in the AERMOD User's Guide for an elevated source not on or adjacent to a building
d PMF/Soil Set Equal to 0 tpy w ith the assumption that the majority of the emitters w ithin the Volume Sources are combustion-driven equipment.e The Elemental Carbon (EC) is set equal to the PM Filterable emissions provided by the 2011 NEI Databasef The Secondary Organic Aerosols (SOA) are set equal to the PM Condensable emissions provided by the 2011 NEI Databaseg The Kaktovik Pow er Plant and the Point Thomson Facility EC and SOA emissions calculated using AP42 filterable/condensable particulate matter speciation. The PM emissions w ere assumed to be based on gas-fired turbines as the main PM emission source
PM2.5 EC PM2.5 SOA PM10 EC PM10 SOATurbine w ith Gas Fuel 29% 71% 29% 71%
h Point Thomson is an existing facility, but actual emissions w ere not available through NEI 2011, so PTE rates w ere used
2011 Emissions (g/sec)b
SRCID Model ID Volume Sources Description
Locationa
APPENDIX A EMISSIONS CALCULATION REPORT FOR THE GAS TREATMENT PLANT
USAG-P1-SRZZZ-00-000001-000 7-OCT-16
REVISION: 1
PUBLIC PAGE 81 OF 81
1988 1978 2012 1979
Rel.Ht. (m) Syinit (m) Szinit (m) NO2 Ratio
Increment Consuming
NOx
Increment Consuming
PM10
Increment Consuming
PM2.5
Increment Consuming
SO2
Oldest Install Date
Newest Install Date
vol01 Alpine Central Processing Facility 10.0 2.33 2.33 0.5 Y Y Y Y 1984 2012vol02 CPF 1, Kuparuk Central Production Facility #1 10.0 2.33 2.33 0.5 Y Y N Y 1979 2001vol03 CPF 2, Kuparuk Central Production Facility #2 10.0 2.33 2.33 0.5 Y Y N Y 1981 1993vol04 CPF 3, Kuparuk Central Production Facility #3 10.0 2.33 2.33 0.5 Y Y N Y 1984 2003vol05 Endicott Production Facility (END) 10.0 2.33 2.33 0.5 Y Y N Y 1986 2010vol06 Flow Station #1 (FS 1) 10.0 2.33 2.33 0.5 Y Y N Y 1973 2006vol07 Flow Station #2 (FS 2) 10.0 2.33 2.33 0.5 Y Y N Y 1975 2002vol08 Flow Station #3 (FS 3) 10.0 2.33 2.33 0.5 Y Y N Y 1977 1990vol09 Gathering Center #1 (GC 1) 10.0 2.33 2.33 0.5 Y Y N Y 1977 1993vol10 Gathering Center #2 (GC 2) 10.0 2.33 2.33 0.5 Y Y N Y 1976 1999vol11 Gathering Center #3 (GC 3) 10.0 2.33 2.33 0.5 Y Y N Y 1977 1990vol12 Lisburne Production Center (LPC) 10.0 2.33 2.33 0.5 Y Y N Y 1984 2003vol13 Milne Point Production Facility (MPU) 10.0 2.33 2.33 0.5 Y Y N Y 1985 2004vol14 PBU Central Pow er Station (CPS) 10.0 2.33 2.33 0.5 Y Y N Y 1970 1999vol15 PS #03, TAPS Pump Station 10.0 2.33 2.33 0.5 Y Y N Y 1978 2006vol16 PS #04, TAPS Pump Station 10.0 2.33 2.33 0.5 Y Y N Y 1978 2010vol17 Seaw ater Injection Plant East (SIPE) 10.0 2.33 2.33 0.5 N Y N Y 1981 1983vol18 North Slope Borough - Kaktovik Pow er Plant 10.0 2.33 2.33 0.5 Y Y Y Yvol19 ExxonMobil - Point Thomson Facilityh 10.0 2.33 2.33 0.5 Y Y Y Y
RFD Sources - Emissions are PTE not Actuals
Notes:a Locations based on 2011 NEI Database Average Point Source Longitude and Latitude
b Emissions based on Double the Actual Emissions from 2011 NEI Database.1-hr, 3-hr, 8-hr, and 24-hr have been set equal to the annual emission rate for each pollutant. It is assumed that the same level of emissions from the facility are emitted throughout the year (8,760 hours). Specif ic maximum operating cases are not know n.
c All volume source plume assumed to be 10 m x 10 m x 10 m in sizeSyinit assumed 4.3 from Table 3-1 in the AERMOD User's Guide for a single volume sourceSyinit assumed 4.3 from Table 3-1 in the AERMOD User's Guide for an elevated source not on or adjacent to a building
d PMF/Soil Set Equal to 0 tpy w ith the assumption that the majority of the emitters w ithin the Volume Sources are combustion-driven equipment.e The Elemental Carbon (EC) is set equal to the PM Filterable emissions provided by the 2011 NEI Databasef The Secondary Organic Aerosols (SOA) are set equal to the PM Condensable emissions provided by the 2011 NEI Databaseg The Kaktovik Pow er Plant and the Point Thomson Facility EC and SOA emissions calculated using AP42 filterable/condensable particulate matter speciation. The PM emissions w ere assumed to be based on gas-fired turbines as the main PM emission source
PM2.5 EC PM2.5 SOA PM10 EC PM10 SOATurbine w ith Gas Fuel 29% 71% 29% 71%
h Point Thomson is an existing facility, but actual emissions w ere not available through NEI 2011, so PTE rates w ere used