34
APPENDIX F GEOTECHNICAL INVESTIGATION OF REVETMENT

APPENDIX F
GEOTECHNICAL INVESTIGATION OF REVETMENT

ENGINEERING GEOLOGY INVESTIGATION
ROCK REVETMENT AT BROAD BEACH, MALIBU, CALIFORNIA
PREPARED FOR AMEC ENVIRONMENT & INFRASTRUCTURE
JULY 31, 2012 PROJECT NO. 0018.0011.0008.01 (Cato PN 1047)
AMERICAN DISABLED VETERAN-OWNED CONSULTING COMPANY
and

Project No. 0018.0011.0008.01 Project No. 1047
Clevenger Geoconsulting, Inc. Cato Geoscience, Inc. 16870 West Bernardo Drive, Suite 400 P.O. Box 891930 San Diego, CA 92127 Temecula, CA 92589 (619) 818-0239 (951) 834-2619 [email protected] [email protected]
July 31, 2012
AMEC Environment & Infrastructure 104 West Anapamu St., Suite 204A Santa Barbara, CA 93101 Attention: Michael Henry Subject: Transmittal of Final Report
- Engineering Geologic Investigation of Rock Revetment at Broad Beach, Malibu, California
The final report titled, “Engineering Geology Investigation, Rock Revetment at Broad Beach, Malibu, California,” is enclosed. We have appreciated the opportunity to work on this project. If you have any questions about this report, please call or email. An invoice for this work is also attached.
Sincerely,
CLEVENGER GEOCONSULTING, INC. CATO GEOSCIENCE, INC.
William R. Clevenger President
Kerry Cato, President PhD CEG 2153
Enclosures: - Technical report - Invoice

Client: AMEC Environment & Infrastructure Engineering Geology Investigation Of Broad Beach Rock Revetment July 31, 2012
Cato Geoscience, Inc. Project No. 1047 Page 1 Clevenger Geoconsulting, Inc. Project No. 0018.0011.0008.01
!
Purpose and Scope
The Broad Beach Geologic Hazard Abatement District (GHAD) seeks permanent approval of the
emergency rock revetment constructed in 2010, as permitted by the City of Malibu and the California
Coastal Commission (CCC) among others. In order for this to occur, approval must be obtained through
the California Environmental Quality Act (CEQA) process; the State Lands Commission is the designated
lead agency for the CEQA process and all technical documents are being prepared for them. This is part
of the long-term strategy for protection of homes and septic systems from coastal erosion provided the
applicant conducts nourishment and backpassing for at least 20 years,. If approved, the revetment would
remain in place and would be buried beneath a new system of sand dunes located at the landward edge of
the widened, nourished beach. Additional nourishment is proposed to keep this shore protection structure
buried over approximately 20 years unless severe beach erosion or other conditions preclude maintaining
sufficient beach width for protection. The revetment would serve as a last line of defense against future
severe erosion during extreme storm events. The revetment is constructed primarily on private land, but
overlaps public land in some areas.
The purpose of this engineering geologic investigation is to evaluate the geologic conditions, data,
information, and reports attendant to the site including site seismicity, faulting, liquefaction, lateral
spreading, subsidence, flooding, and other geologic hazards or constraints. This report is being prepared
for the State Lands Commission CEQA report. This report is not intended to act as a design document and
does not collect subsurface or new quantitative data. It synthesizes existing work and attempts to evaluate
the present and future performance of the rock revetment in context of these discussed geologic processes.
Our scope of services included a geologic reconnaissance of the site and vicinity conducted by a geologist
with our firm in order to compare the current geologic conditions on the site with the researched
information. The Malibu General Plan (2007) and Los Angeles County General Plan (1990, 2008) were
reviewed for potential geologic hazards to the site. Our investigation, together with our conclusions and
recommendations, is discussed in detail in the following report.

Client: AMEC Environment & Infrastructure Engineering Geology Investigation Of Broad Beach Rock Revetment July 31, 2012
Cato Geoscience, Inc. Project No. 1047 Page 2 Clevenger Geoconsulting, Inc. Project No. 0018.0011.0008.01
!
Project Description
The project site consists of the existing revetment at Broad Beach in the western portion of Malibu,
California. The existing revetment is 4,100 feet long, extending from 30760 Broad Beach Road,
approximately 600 feet west of Trancas Creek, to 31346 Broad Beach Road, just west of the western
public access point for Broad Beach. A total of approximately 36,000 tons of bouldery rock was used to
create the revetment in 2010. According to project documents, the constructed revetment was 27 to 41
feet wide at its base and 13 to 17 feet in height, with the overall height averaging around 15 feet; our field
observations indicate that the wall is slightly lower than this height and that the wall is higher at the west
end than at the east end. Individual boulders for the majority of the revetment are between ½ and 2 tons
in weight. The portion of the revetment between 31302 and 31346 Broad Beach Road was designed to be
more robust and incorporated larger boulders, up to 4 tons per rock. The majority of the existing
revetment rests on private lands. However, portions of the seaward side of the revetment totaling
approximately 0.85 acre rest on Public Trust Lands [Broad Beach Restoration Project, Draft Analysis of
Impacts to Public Trust Resources and Values (BBRP Draft APTR, April, 2012)].
Geologic Setting
Broad Beach (previously known as Trancas Beach) is located in the western portion of the City of
Malibu, west of Zuma State Beach and Point Dume (Enclosure 1- Location Map). Point Lechuza marks
the western limit of Broad Beach. Broad Beach lies atop a buried wave-cut terrace etched upon rocks of
the Trancas Formation [FM] (Dibblee and Ehrenspeck, 1993). See Enclosure 2 – Geologic Map. Broad
Beach and the rest of Malibu is a part of the Santa Monica Mountains block. The Santa Monica
Mountains block is located in the western portion of the Transverse Ranges geomorphic province. The
Transverse Ranges province also includes the Santa Ynez Mountains, Santa Susana Mountains, San
Gabriel Mountains, San Bernardino Mountains, Little San Bernardino Mountains, San Fernando and San
Gabriel Valleys, Santa Barbara Channel, and the Channel Islands. The Transverse Ranges are considered
to have formerly been located adjacent to the current southern California coast between Los Angeles and
San Diego, but have subsequently rotated clockwise about 90 degrees during the Miocene epoch into their
current east-west position and transported northward (Crouch, 1979; Kamerling and Luyendyk, 1985;
Crouch and Suppe, 1993; Fritsche, 1998).

Client: AMEC Environment & Infrastructure Engineering Geology Investigation Of Broad Beach Rock Revetment July 31, 2012
Cato Geoscience, Inc. Project No. 1047 Page 3 Clevenger Geoconsulting, Inc. Project No. 0018.0011.0008.01
!
Broad Beach is comprised of medium-grained beach sand and finer-grained dune sand, both of Holocene-
age (Dibblee and Ehrenspeck, 1993). The modified surface of the beach and dune sands exists at
elevations ranging from mean sea level [MSL] to approximately 15 feet above [MSL]. The beach is
nestled against a wave-cut cliff that exposes fine- to coarse-grained alluvial deposits of Pleistocene age
(Dibblee and Ehrenspeck, 1993). The modified toe of this cliff is at an average elevation of 35 feet MSL.
The top of the cliff represents a man-made surface cut into the older alluvium for placement of Pacific
Coast Highway. Dibblee and Ehrenspeck (1993) mapped outcrops of the Sandstone Member of the
Trancas FM north of the highway. These outcrops may represent exposures of a marine terrace
representing oxygen-isotope Stage 5e (Milankovitch, 1941). The stage 5e terrace was etched into the
coastline of Malibu about 125,000 years ago. Remnants of this Pleistocene age terrace were identified in
the Pacific Palisades area (Shaller and Heron, 2004).
Both the Holocene-age and Pleistocene-age sediments are deposited upon the wave-cut terrace cut into
the Trancas FM (Yerkes and Campbell, 1979, 1980; Campbell et al., 1970; Dibblee and Ehrenspeck,
1993). The Trancas FM is comprised of metamorphic blueschist conglomerate-breccia (Dibblee and
Ehrenspeck, 1993). The Trancas FM is considered equivalent to the San Onofre Breccia (described by
Woodford, 1925; Truex and Hall, 1969; Stuart, 1979) and the Upper Topanga FM (described by Dibblee
and Ehrenspeck, 1990). The Trancas FM forms the top of the dense, highly cemented bedrock that
underlies Broad Beach and Pt. Lechuza. Bedding in the Trancas FM is mapped as overturned and dipping
steeply to the north at Pt. Lechuza and the west portion of Broad Beach (Dibblee and Ehrenspeck, 1993).
Outcrops of the Trancas FM are exposed at the west end of Broad Beach and locally in the surf zone off
the western portion of the beach. The thickness of the younger beach and dune sands at Broad Beach is
not known, but is expected to underlie the beach at relatively shallow depths.
The southeast end of Broad Beach is separated from Zuma Beach by fluvial deposits derived from
Trancas Creek. Holocene age alluvium is deposited at the mouth of Trancas Creek, forming a low mound
at the interface with the beach sand. This mound is formed by wave action pushing sand back up into the
mouth of Trancas Creek, combined with overlying dune sand. Low levels of surface flow from Trancas
Creek generally pond landward of this mound most of the year in Trancas Lagoon. Surface freshwater
flows change to subsurface groundwater flows beneath the alluvium/beach sand mound to discharge into
the sea. During the rainy season, higher surface flows in Trancas Creek tend to breach the mound and
discharge directly into the ocean.

Client: AMEC Environment & Infrastructure Engineering Geology Investigation Of Broad Beach Rock Revetment July 31, 2012
Cato Geoscience, Inc. Project No. 1047 Page 4 Clevenger Geoconsulting, Inc. Project No. 0018.0011.0008.01
!
Tectonic Setting The Broad Beach area, including the portion occupied by the existing revetment, are not shown as
affected by faulting (Jennings, 1975, 1977, 1992, 1994; Jennings and Bryant, 2010; Jennings et al., 2010;
Dibblee and Ehrenspeck, 1993; Jennings and Strand, 1969; Bryant, 2005; Frankel et al., 2002; U.S.
Geological Survey, 2002, 2006, 2007, 2008; Los Angeles County, 1990, 2008; Malibu, 1995). The area
does not lie within an Alquist-Priolo Earthquake Fault Zone as defined by the State of California (Bryant
and Hart, 2007). The area also does not lie within a County or City Fault Hazard Zone (Los Angeles,
1990, 2008; Malibu, 1995). The maximum magnitude earthquake (also referred to as MMAX) of faults in
the vicinity of the Broad Beach area are determined from measurements made by the U.S. Geological
Survey (2008), Southern California Earthquake Center (2010), and Cao et al. (2003).
The Malibu Coast reverse fault is located as close as 1,300 feet north of Broad Beach (Jennings and
Strand, 1969; Dibblee and Ehrenspeck, 1993). The east – west trending Malibu Coast fault generally
marks the break in slope along the toe of the Santa Monica Mountains, with the mountains experiencing
uplift along the fault. The Santa Monica reverse fault is shown as the eastern extension of the Malibu
Coast reverse fault by Jennings and Strand, (1969). The east - west trending Santa Monica reverse fault is
part of the Santa Monica-Hollywood fault zone. The Malibu Coast fault zone is expected to produce an
MMAX earthquake of MW 7.0 and is shown to accommodate 0.3 mm/yr of slip (U.S. Geological Survey,
2008). The Santa Monica fault has an MMAX earthquake of MW 6.8 and the Hollywood fault has an MMAX
earthquake of MW 6.7 (U.S. Geological Survey, 2008). Both the Santa Monica and Hollywood faults are
shown to have slip rates of about 1 mm/yr each.
The City of Malibu (1995) showed the Escondido thrust fault located approximately 2,000 feet northeast
of Broad Beach. Dibblee and Ehrenspeck (1993) mapped the portion of the east – west trending
Escondido fault closest to the site as part of the Malibu Coast fault. The eastern portion of the Escondido
fault, as shown by Malibu (1995), was mapped by Dibblee and Ehrenspeck as the Ramirez thrust fault.
Dibblee and Ehrenspeck showed the western end of the Ramirez fault located approximately one-half
mile southeast of Broad Beach. Dibblee and Ehrenspeck (1993) showed the east – west trending Ramirez
fault offsetting rocks of Miocene age, but as buried beneath sediments of Pleistocene age. The Ramirez
fault does not appear to represent an active fault as defined by the Alquist-Priolo Act. The City (1995)

Client: AMEC Environment & Infrastructure Engineering Geology Investigation Of Broad Beach Rock Revetment July 31, 2012
Cato Geoscience, Inc. Project No. 1047 Page 5 Clevenger Geoconsulting, Inc. Project No. 0018.0011.0008.01
!
showed the Escondido thrust fault as offsetting rocks of Miocene age. Malibu (1995) did not show the
Escondido fault on the general plan fault map. The state of activity of the fault is not known.
The Anacapa-Dume reverse fault lies off the coast approximately 6 miles south of Broad Beach (Veddar
et al., 1986, Bryant, 2005). Pinter (2010) considered the east – west trending Anacapa-Dume fault and
the Santa Cruz Island fault as primarily left-lateral faults with minor reverse components. The Anacapa-
Dume fault marks the break in slope between the submarine slope of the Santa Monica Mountains and the
floor of the San Pedro Basin. The Anacapa-Dume fault continues to the west as the Santa Cruz Island
fault (Veddar et al., 1986). The Anacapa-Dume fault zone displays a slip rate of about 3 mm/yr and is
considered to be capable of generating an MMAX earthquake of MW 7.2 (U.S. Geological Survey, 2008).
The Santa Cruz Island fault is listed as capable of an MMAX earthquake of MW 7.2, with a slip rate of
around 1 mm/yr (U.S. Geological Survey, 2008).
Dolan et al. (1995), Davis and Namson (1994), and Johnson et al. (1996) have postulated that the Santa
Monica Mountains are underlain by a blind reverse fault responsible for additional uplift of the
mountains. This fault is referred to as the Santa Monica Mountains blind thrust fault (Dolan et al., 1995)
and its subsurface trend would be an east – west orientation. Dolan et al. (1995) considered the Santa
Monica Mountains fault to be capable of an MMAX earthquake of MW 7.5, if the fault extends the full
length of the Santa Monica Mountains and were to move along its entire length simultaneously. The slip
rate of the Santa Monica Mountains blind reverse fault is not known.
Veddar et al. (1986) showed the northwest end of the Palos Verdes fault located about 10 miles southeast
of Broad Beach. The northwest – southeast trending Palos Verdes fault displays evidence for both right-
lateral strike slip and reverse slip movement (Fischer et al., 1987; Dibblee, 1999). The Palos Verdes Hills
are considered to have been uplifted by movement along the Palos Verdes fault. However, recognition of
the Palos Verdes Anticlinorium reverse fault along the submarine base of the Palos Verdes Hills by
Sorlien et al. (2003) appears to provide a better source fault for uplift of the entire Palos Verdes
Anticlinorium, as well as the Palos Verdes Hills. The northern end of the Palos Verdes Anticlinorium
fault is expected to mimic the length and trend of the higher angle Palos Verdes fault, and, therefore, lies
about 10 miles southeast of Broad Beach. The Palos Verdes Anticlinorium fault may also merge with the
eastern portion of the Anacapa-Dume fault. The MMAX earthquake of the Palos Verdes fault is provided
as MW 7.3, with an oblique slip rate of around 3 mm/yr (U.S. Geological Survey, 2008). The MMAX

Client: AMEC Environment & Infrastructure Engineering Geology Investigation Of Broad Beach Rock Revetment July 31, 2012
Cato Geoscience, Inc. Project No. 1047 Page 6 Clevenger Geoconsulting, Inc. Project No. 0018.0011.0008.01
!
earthquake for the Palos Verdes Anticlinorium fault may be MW 7.5, but the slip rate is not yet calculated
(Sorlien et al., 2003).
Review of digital aerial photography available from Google Earth Pro (Google, 2012), World Wind
(National Aeronautic and Space Administration (2011), and Bing 3D (Microsoft, 2011) suggests that
several high angle right-lateral strike-slip faults traverse the Broad Beach area. These suspected faults,
the strike slip faults generally trend in a northwest – southeast orientation and the reverse faults generally
trend in an east-west orientation, can be traced through alluvial materials of Pleistocene age and older
rocks on the photographs. Evidence for these features to represent faulting include offset ridge lines,
offset canyons and drainages, aligned canyons, offset landslides, structural control of parallel ridgelines,
vertically offset terraces and alluvial fan surfaces, aligned escarpments, and tonal lineaments associated
with aligned vegetation. A review of geologic and geotechnical investigations on file with the City and
County was beyond the scope of this study. The state of activity of these suspected faults is not known.
However, the observed offset of alluvial materials mapped as Pleistocene in age and offsets observed
across landslides considered to be Pleistocene in age would indicate that these features, if they do
represent faults, would be considered potentially active faults utilizing criteria developed by the State
(Bryant and Hart, 2007). The potential for surface fault rupture to affect the Broad Beach area is
considered to be a Potentially Significant Impact (Class 1).
A large earthquake along any of the faults listed above would result in very strong ground motion at
Broad Beach. In particular, earthquakes along the nearby Malibu Coast, Anacapa-Dume, or Santa
Monica Mountains reverse faults would be expected to generate high levels of both horizontal and
vertical shaking at Broad Beach. Based on peak ground accelerations measured from the 1971 San
Fernando and 1994 Northridge reverse-motion earthquakes, peak accelerations over 1 g (greater than the
acceleration due to gravity) should be expected to affect the Broad Beach area at some point in the future.
The potential for strong ground shaking to affect the Broad Beach area is considered to be a Potentially
Significant Impact (Class 1).
Numerous additional large faults are located within 50 miles of Broad Beach. These faults include:
Newport-Inglewood, San Pedro Basin, Santa Susana, Oakridge, Northridge Hills, Chatsworth-Simi, San
Cayetano, Holser, San Gabriel, Whittier, Compton-Wilmington, Puente Hills, Elysian Park, Raymond,
San Fernando, Sierra Madre, Santa Cruz-Santa Catalina, Santa Catalina Escarpment, San Clemente,

Client: AMEC Environment & Infrastructure Engineering Geology Investigation Of Broad Beach Rock Revetment July 31, 2012
Cato Geoscience, Inc. Project No. 1047 Page 7 Clevenger Geoconsulting, Inc. Project No. 0018.0011.0008.01
!
Channel Islands, Arroyo Parida, Mission Ridge, Santa Ynez, Pine Mountain, Red Mountain, Frazier
Mountain, Verdugo, Redondo Canyon, and San Andreas faults. Earthquakes along any of these faults
would be expected to generate moderate to strong ground shaking at Broad Beach.
Geology of Revetment Rocks Dr. Kerry Cato of Cato Geoscience, Inc. conducted a geologic reconnaissance of the revetment on June
13, 2012. The boulders comprising the revetment were observed to range between 1 and 7 feet, as
measured along the long axis. The boulders are generally larger in the western portion of the revetment.
The Broad Beach Restoration Project Draft Analysis of Impacts to Public Trust Resources and Values
(April, 2012) indicated that no boulders were placed over a 100-foot portion of Broad Beach at 30822
Broad Beach Road by design. In addition, gaps in the revetment were observed at 31022 Broad Beach
Road, and in the northern portion of the area north of 31460 Broad Beach Road. A non-contiguous group
of boulders was observed at 31346 Broad Beach Road. See Enclosures 3, 4 and 5 for photos. Residences
at the northwestern end of Broad Beach use various means of engineered protection from wave action and
do not rely on revetment protection. The constructed revetment ranged from 13 to 17 feet in height and
was 27 to 41 feet in width at the base (BBRP, Draft APTR, April, 2012). Our field observations indicate
that the wall is slightly lower than this height and that the wall is higher at the west end than at the east
end. The Draft APTR indicated that a portion (approximately 0.85 acre) of the seaward face of the
revetment rests upon Public Trust Lands. Removal and redistribution of the offending boulders is
anticipated as part of several project alternatives.
Larger boulders within the revetment are listed as 4 tons per rock. The bulk of the rock is reported to
range from ½ to 2 tons per rock (BBRP, Draft APTR, April, 2012). However, a considerable portion of
the revetment consists of rock as small as 1 foot in maximum dimension. These smaller rocks act as filler
between and among the larger boulders. The resistance of these smaller rocks to coastal erosion is
entirely dependent on the stability of the larger boulders resting along the seaward edge of the revetment.
The petrology of the revetment boulders consists primarily of a dark, fine-grained gabbro. Additional
petrologies observed included diorite, granodiorite, gneiss, and marble. All of the boulders exhibited
fresh, hard faces with little or no chemical weathering. Some of the smaller rocks may represent
fragments of larger boulders broken off by mechanical weathering from wave action, abrasion from
settlement and adjustment, or perhaps abrasion from the initial placement of the boulders. All of the

Client: AMEC Environment & Infrastructure Engineering Geology Investigation Of Broad Beach Rock Revetment July 31, 2012
Cato Geoscience, Inc. Project No. 1047 Page 8 Clevenger Geoconsulting, Inc. Project No. 0018.0011.0008.01
!
boulders exhibited angular shapes conducive to interlocking reinforcement. The Draft APTR (April,
2012) noted that the boulders were placed on top of a filter fabric to support the boulders and helps resist
vertical settlement of the rock into the beach sand. Stability of the existing revetment is, therefore,
dependent on the stability of the sand layer underlying the boulders of the revetment. The source quarry
(or quarries) for the boulders is/are not known. We understand that, due to the emergency nature of the
original placement permits, a geotechnical/geological investigation for the original placement was not
conducted. Further, it is understood that the filter fabric and overlying revetment stone were founded on
beach sand; the thickness of the beach sand that separates the revetment from the underlying Trancas FM
bedrock is unknown, but could be several feet to several tens of feet in thickness.
The armor stone stability calculations are provided in the Broad Beach Restoration Project, Coastal
Engineering Appendix (Moffat and Nichols, 2012). The hydraulic stability of the existing revetments
armor stone was evaluated using the Hudson formula outlined in the CEM. This formula is widely used
and has many years of successful application on the California coast. We briefly summarize pertinent
aspects of the design assumptions and criteria in the following paragraph. Most of the existing revetment
was constructed with two layers of armor stone between 0.5 and 3 tons. Based on specified gradation, the
median armor stone is between 1 and 2 tons of rough quarry stone with random placement. To meet the 0
to 5 percent damage criteria, the acceptable design wave for the existing revetment is 6 feet for 1-ton
stone to 8 feet for 2-ton stone. Depth limited wave heights greater than 6 to 8 feet breaking in front of the
existing revetment will likely result in a higher percentage of damage, or displacement, of armor stone.
The design wave heights calculated for the critical design condition of extreme tide, scour and SLR range
from 8.9 feet to 9.6 feet. For comparison, the armor stone required to meet the 0 to 5 percent damage
criteria for these wave heights is 3 to 4 tons in weight. These results indicate the western portion of the
existing revetment can withstand these design wave heights with minimal damage. Armor stone for the
remainder of the existing revetment is under-sized and greater than 5 percent damage can be expected
under critical design conditions.
During our field visit, we substantiated many of the above-mentioned design assumptions and in place
rock revetment conditions. As reported, we noted that the western end of the rock revetment consisted of
larger rock stone than that at the eastern end. The BBRP Draft APTR, April, 2012 states that the change
occurs near the property located at 31302 Broad Beach Rd. We noted that the change is gradational and
occurs “generally” in this area. Based on our field observations, we estimate that the larger stone exists

Client: AMEC Environment & Infrastructure Engineering Geology Investigation Of Broad Beach Rock Revetment July 31, 2012
Cato Geoscience, Inc. Project No. 1047 Page 9 Clevenger Geoconsulting, Inc. Project No. 0018.0011.0008.01
!
along the western 1,025 feet (25% of the length) and smaller stone exists along the eastern 3,075 feet
(75% of the length) of the revetment. The use of smaller stone, which was reportedly placed on the
interior, was unable to be observed as only the exterior of the wall could be observed.
Overall, the exterior stone appeared to be stable with little evidence of movement having occurred during
the two-year performance period (2010 – 2012). In the eastern end where the smaller rock exists, we
noted a few examples where individual rock pieces had been separated from the wall and now exist on the
beach in front (seaward side) of the wall. In these local cases the wall appeared stable with no obvious
perturbations in the overall linear shape of the wall. In these areas we did not note any deflections in the
top of the wall that could indicate settlement of the overall wall. At the western end of the wall where the
larger rock exists, we did not note any rock pieces that had been detached from the rock mass. It appears
that the rock sizing indicates relative stability of the rock mass, but the observed examples of detached
stones suggest that use of a larger size stone would be warranted.
The rock revetment was designed as a trapezoid that is 13-17 feet high and about 27-41 feet high at the
base. Without an “As Built” survey to confirm placed conditions, our reconnaissance relied on multiple
visual sitings along the top of the wall, which indicated that the wall is approximately level and without
significant variations in elevation.
In our traverse along the beach at the upstream toe of the rock revetment, the height of the wall was
observed to apparently increase from east to west; this would be the vertical distance between the top of
the wall and exposed toe of the rock. Overall the height is lowest at the eastern end, on the order of 6 –
10 feet high, and greatest at the western end where the height is on the order of 10 to 13 feet high. We
were working under the assumption that, as constructed, the top of the wall did not vary in elevation, but
that the bottom of the wall rises toward the eastern end, but this needs to be verified if possible from any
design drawings or construction reports. The other explanation is that beach sand deposition has been
greater at the eastern end and thus more of the wall has been buried since the revetment placement. This
observation is consistent with the known southerly longshore transport direction of sand that occurs along
this beach. It is important to note that wave heights of 6 to 8 feet could conceivably overtop the wall at
the eastern end and adversely impact structures in this area.
Another issue regarding wall stability is the foundation condition all along the rock wall. The rock
revetment was placed as an emergency measure on the existing beach surface. This sand material is
highly erodible and if the rock is left exposed the rock revetment could be undermined and destabilized.

Client: AMEC Environment & Infrastructure Engineering Geology Investigation Of Broad Beach Rock Revetment July 31, 2012
Cato Geoscience, Inc. Project No. 1047 Page 10 Clevenger Geoconsulting, Inc. Project No. 0018.0011.0008.01
!
The thickness of this sand foundation, or the depth to the underlying Trancas FM is unknown. If the
thickness of the sand foundation layer is small, say on the order of 5 feet, then the 15-foot high revetment
wall would still provide protection if undermining and settlement occurred. However, if the thickness of
the sand foundation is greater, say on the order of 10 – 15 feet thick then the rock revetment could settle a
greater amount with the amount of remaining protection left in doubt.
Damage to the revetment from an extreme event of this type does not suggest a complete failure of the
revetment. The flexible nature of a stone revetment is one reason it’s the most commonly used shore
protection device. This flexibility can accommodate minor settling and even displacement of some stones
without complete loss of protection. Damage from waves exceeding the design wave is usually
progressive and can be repaired provided there is sufficient time between consecutive storm events.
Although the existing revetment lacks the safety factor of a typical coastal revetment, the structure has
performed well under direct exposure over the past several years and will continue to provide a reliable
last line of defense over the design life of the project.
Liquefaction The Broad Beach area is included within a potential liquefaction area on the Los Angeles County General
Plan (1990) and the State’s Seismic Hazard Zones map (California Division of Mines and Geology,
2002). See Enclosure 6 – Liquefaction Zones. The Malibu General Plan (1995) did not show a map of
liquefiable areas. The geologic materials underlying the revetment are mapped as beach and dune sands
of Holocene age. These materials are loose and uncemented, as observed at the ground surface during the
geologic reconnaissance. Although the thickness of these deposits is not known, these sands are expected
to be relatively thin and unconformably resting upon dense rock of the Trancas FM. The depth to
groundwater at Broad Beach was not available at the time of this study. Subsurface flow derived from the
sea is expected to perennially infiltrate the beach sands underlying the revetment. Additional subsurface
flow is anticipated to originate from each of the septic systems located immediately landward of the
revetment. Sediments underlying the revetment are considered to be highly susceptible to liquefaction
and vertical differential settlement in the event that a large earthquake occurs in the vicinity of Broad
Beach. The potential for liquefaction and differential seismic settlement to affect the Broad Beach area is
considered to be a Potentially Significant Impact (Class 1).
Client: AMEC Environment & Infrastructure Engineering Geology Investigation Of Broad Beach Rock Revetment July 31, 2012
Cato Geoscience, Inc. Project No. 1047 Page 11 Clevenger Geoconsulting, Inc. Project No. 0018.0011.0008.01
!
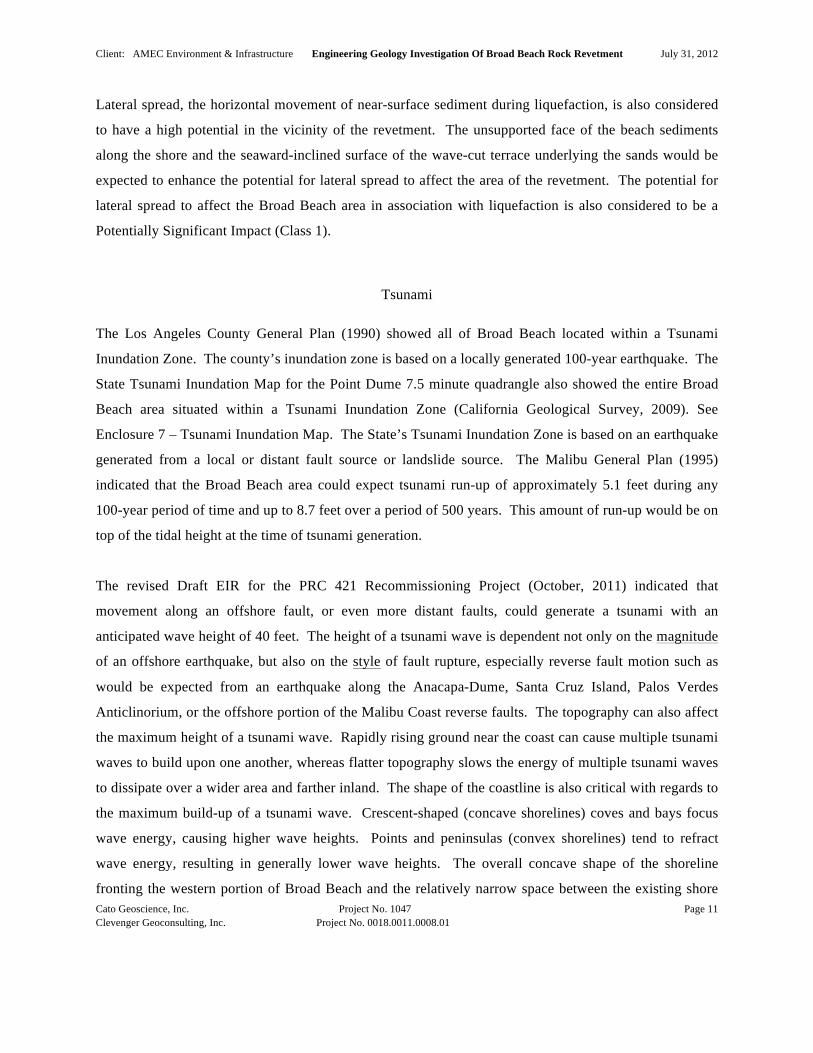
Lateral spread, the horizontal movement of near-surface sediment during liquefaction, is also considered
to have a high potential in the vicinity of the revetment. The unsupported face of the beach sediments
along the shore and the seaward-inclined surface of the wave-cut terrace underlying the sands would be
expected to enhance the potential for lateral spread to affect the area of the revetment. The potential for
lateral spread to affect the Broad Beach area in association with liquefaction is also considered to be a
Potentially Significant Impact (Class 1).
Tsunami The Los Angeles County General Plan (1990) showed all of Broad Beach located within a Tsunami
Inundation Zone. The county’s inundation zone is based on a locally generated 100-year earthquake. The
State Tsunami Inundation Map for the Point Dume 7.5 minute quadrangle also showed the entire Broad
Beach area situated within a Tsunami Inundation Zone (California Geological Survey, 2009). See
Enclosure 7 – Tsunami Inundation Map. The State’s Tsunami Inundation Zone is based on an earthquake
generated from a local or distant fault source or landslide source. The Malibu General Plan (1995)
indicated that the Broad Beach area could expect tsunami run-up of approximately 5.1 feet during any
100-year period of time and up to 8.7 feet over a period of 500 years. This amount of run-up would be on
top of the tidal height at the time of tsunami generation.
The revised Draft EIR for the PRC 421 Recommissioning Project (October, 2011) indicated that
movement along an offshore fault, or even more distant faults, could generate a tsunami with an
anticipated wave height of 40 feet. The height of a tsunami wave is dependent not only on the magnitude
of an offshore earthquake, but also on the style of fault rupture, especially reverse fault motion such as
would be expected from an earthquake along the Anacapa-Dume, Santa Cruz Island, Palos Verdes
Anticlinorium, or the offshore portion of the Malibu Coast reverse faults. The topography can also affect
the maximum height of a tsunami wave. Rapidly rising ground near the coast can cause multiple tsunami
waves to build upon one another, whereas flatter topography slows the energy of multiple tsunami waves
to dissipate over a wider area and farther inland. The shape of the coastline is also critical with regards to
the maximum build-up of a tsunami wave. Crescent-shaped (concave shorelines) coves and bays focus
wave energy, causing higher wave heights. Points and peninsulas (convex shorelines) tend to refract
wave energy, resulting in generally lower wave heights. The overall concave shape of the shoreline
fronting the western portion of Broad Beach and the relatively narrow space between the existing shore

Client: AMEC Environment & Infrastructure Engineering Geology Investigation Of Broad Beach Rock Revetment July 31, 2012
Cato Geoscience, Inc. Project No. 1047 Page 12 Clevenger Geoconsulting, Inc. Project No. 0018.0011.0008.01
!
and the cliff at the back of the beach would, therefore, tend to increase tsunami wave height as compared
with the eastern portion of the Broad Beach and the western portion of Zuma Beach, especially near the
mouth of Trancas Creek.
Tsunamis can also be generated from the movement of submarine landslides. The relatively steep slopes
descending from the coastline down to the floor of the San Pedro Basin are considered highly susceptible
to underwater landsliding. Although submarine slides can occur at any time, due to the perennially
saturated condition of the slope face, the potential for the slope face to fail in association with a large,
nearby earthquake is considered the more likely scenario. Locally situated underwater landslides can
result in locally compounded wave generation. The 2004 Banda Aceh Earthquake in Indonesia also
produced anomalously large wave heights in localized portions of the Sumatran coast due to triggered
rupture of additional reverse faults closer to shore. The potential for tsunami inundation to affect the
Broad Beach area is considered to be a Potentially Significant Impact (Class 1).
Slope Stability/Landslides The State Seismic Hazard Zones map (California Division of Mines and Geology, 2002) did not include
Broad Beach within a zone considered subject to earthquake-induced landsliding. These landslide zones
are shown on Enclosure – 6 Liquefaction Zones. The closest Earthquake-induced Landslide Zones are
shown coincident with the cliff face about 200 feet northwest of the revetment. The City of Malibu
(1995) and the County of Los Angeles (1990) did not include Broad Beach within an area affected by
mapped landslides. Based on the relatively flat topography in the immediate vicinity of the revetment,
landsliding and slope stability issues are considered to represent a Less-Than-Significant (Class III) level
of impact to the site of the existing revetment.
Climate Change/Sea Level Rise
Observational data suggest that the rate of sea-level rise was generally stable up until the late 19th century.
Empirical observations from around the world have shown that sea level rose approximately 6.7 inches

Client: AMEC Environment & Infrastructure Engineering Geology Investigation Of Broad Beach Rock Revetment July 31, 2012
Cato Geoscience, Inc. Project No. 1047 Page 13 Clevenger Geoconsulting, Inc. Project No. 0018.0011.0008.01
!
(17 centimeters) during the 20th century [Intergovernmental Panel on Climate Change (IPCC), 2007]. The
rise in the global mean sea level is due primarily to increases in mean global temperatures. The rise in
temperature causes glacial ice to melt and ocean water to expand. However, sea levels at any one
particular location may differ from the average worldwide sea level, based on tectonics, oceanic
circulation patterns, atmospheric circulation patterns, gravitational effects, and isostatic effects from
glacial melt.
The IPCC (2007) documented an increase in mean sea level of between 4 and 10 inches over the
preceding 100 years. Between 1961 and 2003, sea level rose at an average annual rate of 0.07 inch (1.7
mm/yr.), although the average annual rate of sea level rise over the period between 1993 and 2003
accelerated to 0.12 inch per year (3.1 mm/yr.) (IPCC, 2007). The reason for this most recently measured
increase in the rate of sea level rise was not known at that time. The IPCC (2007) predicted that sea level
could rise between 7 and 23 inches over the next 100 years. The State of California has accepted these
rates of sea level rise for purposes of calculating the potential impact of sea level rise on proposed coastal
development.
A recently released study by the National Research Council’s Committee on Sea Level Rise in California,
Oregon, and Washington (2012) provided updated rates of sea-level rise for the California coast south of
Cape Mendocino. The committee projected a sea level rise of 16.5 to 65.7 inches (42 to 167 centimeters)
for the 100-year period between 2000 and 2100 for the central and southern California coastline. By
comparison, the Committee on Sea Level Rise (2012) projections are substantially higher than the IPCC
(2007) projections. This is the result of differences in the calculations for thermal expansion of seawater
and the contribution of glacial melt water used by the two studies.
The Committee on Sea Level Rise (2012) concluded that sea-level in the area of Broad Beach will rise
between 1.5 and 11.8 inches (4 to 30 centimeters) by the year 2030, as compared with the year 2000 (a
30-year time period). These values, therefore, cover 18 years of the anticipated 20-year life of the Broad
Beach project. Accounting for the 12 years of that expected sea-level rise has already occurred yields a
sea level rise of 0.9 to 7.1 inches over the next 18 years. Over the 20 year life of the project, it is
anticipated that sea level at Broad Beach would rise between approximately 1 and 8 inches.

Client: AMEC Environment & Infrastructure Engineering Geology Investigation Of Broad Beach Rock Revetment July 31, 2012
Cato Geoscience, Inc. Project No. 1047 Page 14 Clevenger Geoconsulting, Inc. Project No. 0018.0011.0008.01
!
The average inclination of the proposed beach in the eastern portion of Broad Beach would be 10
horizontal to 1 vertical (10:1 H to V), while the average inclination of the western portion of the beach
would be 3 horizontal to 1 vertical. A minimum increase in sea level of 1 inch vertically over the next 20
years would result in the average encroachment of the sea landward by 3 inches in the western portion of
the nourished beach and by 10 inches in the eastern portion of a nourished beach. A maximum increase
in sea level of 8 inches vertically over the next 20 years would result in the average encroachment of the
sea landward by 24 inches (2 feet) in the western portion of the nourished beach and by 80 inches (6.7
feet) in the eastern portion of a nourished beach.
California Executive Order S-13-08 directed affected state agencies to anticipate that sea level will rise
and to plan for the potential impacts to coastal communities and infrastructure. Since the State of
California has accepted that these amounts of sea level rise are expected to occur along the California
coast, the effects of sea level rise on other potential geologic hazards should be considered cumulative.
Therefore, the overall effects of the other potential geologic hazards along Broad Beach will be
compounded by the anticipated rise in sea level. The potential for the anticipated rise in sea level, in
conjunction with the potential for liquefaction, seismic settlement, lateral spread, storm surge, and/or
tsunami waves, to affect the Broad Beach area, is considered to represent a Potentially Significant Impact
(Class 1) to the project.
Aerial Photography Review
Digital aerial photography available from Google Earth Pro (2012) was reviewed in association with this
study. The date of the oldest imagery that included the site was dated September 6, 1990. The sequence
of additional imagery dates reviewed included May 31, 1994, June 11, 2002, December 31, 2002,
December 4, 2004, December 31, 2004, January 11, 2005, January 26, 2006, March 15, 2006, October 22,
2007, January 8, 2008, and May 24, 2009 (Google, 2012). The Broad Beach area demonstrated varying
amounts of sand accumulation along the shoreline on these images. The beach was narrowest at the time
of the 2009 imagery. The placement of the emergency revetment occurred in 2010 (BBRP Draft APTR,
April, 2012; CSLC NOP, April 15, 2011; CSLC SOI, April 15, 2011). Access to aerial photography
flown subsequent to placement of the revetment was not available at the time of this study.

Client: AMEC Environment & Infrastructure Engineering Geology Investigation Of Broad Beach Rock Revetment July 31, 2012
Cato Geoscience, Inc. Project No. 1047 Page 15 Clevenger Geoconsulting, Inc. Project No. 0018.0011.0008.01
!
Conclusions
Many of the design assumptions and in place rock revetment conditions were verified based on site
observations. The western end of the rock revetment consisted of larger rock stone than that at the eastern
end. The use of smaller stone, which was reportedly placed on the interior, was unable to be observed as
only the exterior of the wall could be observed.
We address wall adequacy in two ways. First, the rock revetment wall was under-designed and poorly
constructed. The wall was not designed to U.S. Army Corps of Engineers standards. For example, it is
founded on erodible sand and the depth to hard bedrock of sufficient strength to adequately support the
revetment is unknown. The facing rock is undersized for an estimated 75% length of the wall. Field
observations suggest that the rock was placed at a height equal to the existing geomorphic surface, which
is also the elevation of the residence�s foundations. The wall is at a higher elevation on the west end than
the east end providing greater protection on the west. Protection for the residences and septic systems on
the east end is less adequate. In addition, we point out four Potentially Significant Impacts to the wall as
it exists (lateral spreading, liquefaction, tsunami, and sea level rise). If this wall were to be left as the
ONLY protection, we believe it would ultimately fail. This would not occur rapidly, but over a period of
time and with successive storms. This conclusion should not be overtly surprising because the wall was
placed as an emergency measure.
Now, however, the wall is being considered as part of a long-term (20-year) mitigation for shore erosion.
Our second point is that the wall is not being analyzed singularly. Instead, it will operate in conjunction
with a more robust system of beach nourishment that provides significant distance from the wave attack
to the buried rock revetment. The wall acts as the last defense against wave attack. It would provide
protection and it buys time.
The shore protection with the wall is better, in our opinion, than without it. Most certainly the rock
revetment provides significant protection to the residences and septic systems from wave attack. If the
rock wall did not exist and beach nourishment were the only mitigation, the risk of damage to residences
and septic systems would be much greater.
The existing rock revetment is not adequate, in our opinion, as a permanent solution to shoreline

Client: AMEC Environment & Infrastructure Engineering Geology Investigation Of Broad Beach Rock Revetment July 31, 2012
Cato Geoscience, Inc. Project No. 1047 Page 16 Clevenger Geoconsulting, Inc. Project No. 0018.0011.0008.01
!
protection. It does not meet current Corps of Engineers standards as a permanent structure. However, as
a supplemental means to reduce the rate of distress to the shoreline, it may achieve the results desired by
the State Lands Commission (SLAC). This is a policy position for them to decide. The existing rock
wall has been stable and on its own, without beach nourishment protection, and has provided adequate
protection for two years. It is conceivable that, with the addition of beach nourishment and our
recommendations, the wall could perform adequately for the 20-year life of the project.
Recommendations
Our recommendations are based on leaving the rock revetment wall in place. The following
improvements, listed in the subsequent paragraphs, should be made in the wall prior to the addition of the
beach nourishment. These recommendation�s do not address the issue of foundation stability; that is a
weakness that the SLAC and residences must accept if the wall is to remain. The following
recommendations are presented to make the wall more robust and to mitigate the effect of the
weaknesses.
The wall should provide an equal measure of protection from the west to the east end. Namely the entire
top of the wall should be constructed to the same elevation. This may obstruct the views of some east end
residents. The height of the wall should be surveyed and the amount of sand separating the foundation
from the underlying Trancas FM should be known. The depth to hard bedrock, in conjunction with the
surveyed height of the wall, would provide information critical to estimating future settlement.
All gaps in the wall should be filled. These are the gaps that occur at 30822 Broad Beach, which is by
design, at 31022 Broad Beach Rd, and at the western end for about 200-feet west of 31460 Broad Beach
Rd. Refraction would bend in-coming waves around the ends of the existing revetment and focus wave
attacks onto the unprotected properties.
Many technical studies and published reports were referenced during the preparation of this report,.
These were not provided for review, but should ultimately be reviewed before moving forward with
design and construction of additions or replacements. A list of these documents is contained in Appendix
1.

Client: AMEC Environment & Infrastructure Engineering Geology Investigation Of Broad Beach Rock Revetment July 31, 2012
Cato Geoscience, Inc. Project No. 1047 Page 17 Clevenger Geoconsulting, Inc. Project No. 0018.0011.0008.01
!
Limitations and Uniformity of Conditions
The analysis and recommendations submitted in this report are based in part upon the data obtained from
published and project reports and site observations. The nature and extent of variations between and
beyond this information may not become evident until construction. If variations then appear evident, it
will be necessary to reevaluate the conclusions and recommendations of this report.
Findings of this report are valid as of this date; however, changes in conditions of a property can occur
with passage of time whether they are due to natural processes or works of man on this or adjacent
properties. In addition, changes in applicable or appropriate standards may occur whether they result
from legislation or broadening of knowledge. Accordingly, findings in this report may be invalidated
wholly or partially by changes outside our control. Therefore, this report should be considered valid for a
period of 1 year from the date of issue, but should be updated if implementation is delayed beyond this
period of time.
In the event that any changes in the nature, design, or location of the structure and other improvements are
planned, the conclusions and recommendations contained in this report shall not be considered valid
unless the changes are reviewed and this report modified or verified in writing.
This report is issued with the understanding that it is the responsibility of the user of this report to
transmit the information and recommendations of this report to regulators, owners, developers,
contractors, buyers, architects, engineers and designers for the project so that the necessary steps can be
taken by the contractors and subcontractors to carry out such recommendations in the field and
incorporate these into the design.
The conclusions and recommendations contained in this report are solely professional opinions. The
professional staff of Cato Geoscience, Incorporated and Clevenger Geoconsulting, Inc. strives to perform
its services in a proper and professional manner with reasonable care and competence. There are risks of
earth movement and property damages inherent in land development. We are unable to eliminate all risks
or provide insurance; therefore, no warranty or guarantee is expressed or implied.
This report was prepared for the exclusive use of AMEC Environment and Infrastructure, Inc. and their

Client: AMEC Environment & Infrastructure Engineering Geology Investigation Of Broad Beach Rock Revetment July 31, 2012
Cato Geoscience, Inc. Project No. 1047 Page 18 Clevenger Geoconsulting, Inc. Project No. 0018.0011.0008.01
!
authorized agents. This document must not be subject to unauthorized reuse, that is, reuse without written
authorization of Cato Geoscience and Clevenger Geoconsulting. Such authorization is essential because
it requires Cato Geoscience and Clevenger Geoconsulting to evaluate the document's applicability given
new circumstances, not the least of which is passage of time. Actual field or other conditions will
necessitate clarifications, adjustments, modifications or other changes to Cato Geoscience's and
Clevenger Geoconsulting’s services.
It is recommended that Cato Geoscience and Clevenger Geoconsulting be provided the opportunity for a
general review of final design and specifications in order that earthwork and foundation recommendations
may be properly interpreted in implementing the design and specifications. Along with this, the time to
review the missing or yet-to-be-supplied documents listed in Appendix 1, should be provided. If Cato
Geoscience and Clevenger Geoconsulting are not accorded the privilege of making this recommended
review, we can assume no responsibility for misinterpretation of our conclusions and recommendations.
References Draft EIR for the PRC 421 Recommissioning Project (October, 2011) The Broad Beach Restoration Project Draft Analysis of Impacts to Public Trust Resources and Values (April, 2012) (BBRP, Draft APTR, April, 2012). Bindoff, N.L., Willebrand, J., Artale, V., Cazenave, A., Gregory, J., Hanawa, K., Le Quéré, C., Levitus, S., Nojiri, Y., Shum, C.K., Talley, L.D., and Unnikrishnan, A. (2007). “Observations: Oceanic climate change and sea level.” in: Solomon, S., Qin, D., Manning, M., Chen, Z., Marquis, M., Averyt, K.B., Tignor, M., and Miller, H.L., eds., “Climate Change 2007: The Physical Science Basis. Contribution of Working Group I to the Fourth Assessment Report of the Intergovernmental Panel on Climate Change.” Cambridge University Press, New York, Chapter 5, p. 385-432.
Bryant, W.A. (compiler) (2005). “Digital database of Quaternary and Younger Faults form the Fault Activity Map of California, version 2.0.” California Resources Agency, Department of Conservation,Geological Survey,website: http://www.consrv.ca.gov/CGS/information/publications/Pages/QuaternaryFaults_ver2.aspx, accessed June, 2012.
Bryant, W.A. and Hart, E.W. (2007). “Fault-rupture hazard zones in California, Alquist-Priolo Earthquake Fault Zoning Act with index to Earthquake Fault Zones maps, interim revision.” California Resources Agency, Department of Conservation, Geological Survey Special Publication, SP 42, 42 p.
Client: AMEC Environment & Infrastructure Engineering Geology Investigation Of Broad Beach Rock Revetment July 31, 2012
Cato Geoscience, Inc. Project No. 1047 Page 19 Clevenger Geoconsulting, Inc. Project No. 0018.0011.0008.01
!
Campbell, R.H., Blackerby, B.A., Yerkes, R.F., Schoellhamer, J.E., Birkeland, P.W., Wentworth, C.M. (1970). “Preliminary geologic map of the Point Dume quadrangle, Los Angeles County, California”: U.S. Geological Survey open-file maps; Scale 1:12,000 and 1:24,000. California Division of Mines and Geology. (1995). “Earthquake Fault Zones, Point Dume Quadrangle.” Scale 1: 24,000. California Division of Mines and Geology. (2001). “Seismic Hazard Zones Report, Point Dume 7.5 Minute Quadrangle.” SHZR 056. California Division of Mines and Geology. (2002). “Seismic Hazard Zones Map, Point Dume Quadrangle.” Scale 1:24,000. California State Lands Commission (CSLC). (2011). “Notice of Project (NOP).” April 15, 2011. California State Lands Commission (CSLC). (2011). “Solicitation for Statements of Interest.” April 15, 2011. California Geological Survey. (2009). “Tsunami Inundation Map For Emergency Planning, Point Dume Quadrangle.” Scale 1:24,000. Cao, T., Bryant, W.A., Rowshandel, B., Branum, D., and Wills, C.J. (2003). “The revised 2002 California probabilistic seismic hazards maps, June, 2003.” California Resources Agency, Department of Conservation, Geological Survey Webpage: http://www.conservation.ca.gov/cgs/rghm/psha/fault_parameters/pdf/Documents/2002_CA_Haz ard_Maps.pdf
Crouch, J. K. (1979). “Neogene tectonic evolution of the California continental borderland and western Transverse Ranges.” Geological Society of America Bulletin 90: 338-345. Crouch, J.K. and Suppe, J. (1993). “Late Cenozoic tectonic evolution of the Los Angeles basin and California Borderland: A model for core complex-like crustal extension.” Geological Society of America Bulletin 105: 1415-1434.
Davis, T.L. and Namson, J.S. (1994). “Structural analysis and seismic potential evaluation of the Santa Monica Mountains anticlinorium and Elysian Park thrust system of the Los Angeles basin and Santa Monica Bay.” U.S. Department of the Interior, Geological Survey, National Earthquake Hazard Reduction Program Award No. 1434-93-G-2292.
Dibblee, T.W., Jr. (1999). “Geologic map of the Palos Verdes Peninsula and Vicinity, Redondo Beach, Torrance, and San Pedro Quadrangles, Los Angeles County, California.” Dibblee Geological Foundation, Martin L. Stout and Thomas L. Wright Honorary Map No. DF-70, Scale 1” = 2,000’.
Dibblee, T.W., Jr. and Ehrenspeck, H.E. (1990). “Geologic map of the Camarillo and Newbury Park Quadrangles, Ventura County, California.” Dibblee Geological Foundation. Map No. DF-28, Scale 1” = 2,000’.

Client: AMEC Environment & Infrastructure Engineering Geology Investigation Of Broad Beach Rock Revetment July 31, 2012
Cato Geoscience, Inc. Project No. 1047 Page 20 Clevenger Geoconsulting, Inc. Project No. 0018.0011.0008.01
!
Dibblee, T.W., Jr. and Ehrenspeck, H.E. (1993). “Geologic map of the Point Dume Quadrangle, Los Angeles and Ventura Counties, California.” Dibblee Geological Foundation, Cordell Durrell Honorary Map No. DF-48, Scale 1” = 2,000’.
Dolan, J.F., Sieh, K., Rockwell, T.K, Yeats, R.S., Shaw, J., Suppe, J., Huftile, G.J., and Gath, E.M. (1995). “Prospects for larger or more frequent earthquakes in the Los Angeles Metropolitan Region.” Science 267: 199-205.
Dolan, J.F., Gath, E.M., Grant, L.B., Legg, M., Lindvall, S., Mueller, K., Oskin, M., Ponti, D.F., Rubin, C.M., Rockwell, T.K., Shaw, J.H., Treiman, J.A., Walls, C., and Yeats, R.S. (2001). “Active faults in the Los Angeles metropolitan region.” Southern California Earthquake Center, SCEC Special Publication Series, No. 001, 47 pages.
Fischer, P.J., Patterson, R.H., Darrow, A.C., Rudat, J.H., Simila, G. (1987). “The Palos Verdes Fault Zone: Onshore and Offshore.” Society of Environmental and American Association of Petroleum Geologists Geology of the Palos Verdes Peninsula and San Pedro Bay Field Trip Guidebook.
Frankel, A., Petersen, M, Mueller, C., Haller, K., Wheeler, R., Leyendecker, E., Wesson, R., Harmsen, S., Cramer, C., Perkins, D., and Rukstales, K. (2002). “Documentation for the 2002 Update of the National Seismic Hazard Maps.” U.S. Department of the Interior, Geological Survey Open-File Report OFR-2002-0420. Fritsche, A.E. (1998). “Transverse/Peninsular Ranges connections – Nine lines of evidence for the incredible Miocene rotation.” California State University, Northridge website: http://www.csun.edu/~hcgeo007/ninelines.html. Fritsche, A.E., Weigand, P.W., Colburn, I.P., and Harma, R.L. (2001). “Transverse/Peninsular Ranges connections – evidence for the incredible Miocene rotation.” in: Dunne, g. and Cooper, J., compilers, “Geologic excursions in southwestern California.” Society for Sedimentary Geology, Pacific Section, Book 89: 101-146. Google Earth. (2012). “Google Earth Pro.” Google. Image dates: September 6, 1990, May 31, 1994, June 11, 2002, December 31, 2002, December 4, 2004, December 31, 2004, January 11, 2005, January 26, 2006, March 15, 2006, October 22, 2007, January 8, 2008, and May 24, 2009. Accessed online June 2012. Intergovernmental Panel on Climate Change (2007). “Synthesis Report.” IPCC Fourth Assessment Report, AR 4, 52 p. Jennings, C.W. (1975). “Fault map of California with locations of volcanoes, thermal springs, and thermal wells.” California Resources Agency, Department of Conservation, Division of Mines and Geology Geologic Data Map Series, CDM No. 1, Scale: 1” = 12 miles.
Jennings, C.W. (1977). “Geologic Map of California.” California Resources Agency, Department of Conservation, Division of Mines and Geology Geologic Data Map Series, CDM No. 2, Scale: 1” = 12 miles.
Client: AMEC Environment & Infrastructure Engineering Geology Investigation Of Broad Beach Rock Revetment July 31, 2012
Cato Geoscience, Inc. Project No. 1047 Page 21 Clevenger Geoconsulting, Inc. Project No. 0018.0011.0008.01
!
Jennings, C.W. (1992). “Preliminary fault activity map of California.” California Resources Agency, Department of Conservation, Division of Mines and Geology Open-File Report, OFR 92-03, Scale: 1” = 12 miles.
Jennings, C.W. (1994). “Fault activity map of California and adjacent areas with locations and ages of recent volcanic eruptions.” California Resources Agency, Department of Conservation, Division of Mines and Geology California Geologic Data Map Series, CDM No. 6, Scale: 1” = 12 miles.
Jennings, C.W. and Bryant, W.A. (2010). “Fault activity map of California:” State of California, Geological Survey, Geologic Data Map No. 6, Scale 1 ” ≈ 12 miles, Webpage: http://www.quake.ca.gov/gmaps/FAM/faultactivitymap.html
Jennings, C.W., and Strand, R.G. (1969). “Geologic Map of California. Olaf P. Jenkins Edition, Los Angeles Sheet.” California Resources Agency, Department of Conservation, Division of Mines and Geology, Scale: 1” ≈ 4 miles.
Johnson, M., Dolan, J.F., and Meigs, A. (1996). “Geomorphologic and structural analysis of the stage 5e marine terrace, Malibu coast, California suggests that the Santa Monica Mountains blind thrust fault is no longer a major seismic hazard.” EOS, Transactions American Geophysical Union 77: F461. Kamerling, M.J. and Luyendyk, B.P. (1979). “Tectonic rotations of the Santa Monica Mountains region, western Transverse Ranges, California, suggested by paleomagnetic vectors.” Geological Society of America Bulletin 90: 331-337.
Los Angeles County. (1990). “Seismic Safety Element to the General Plan.” Los Angeles County, California.
Los Angeles County. (2008). “Los Angeles County General Plan Draft.” Los Angeles County, California.
City of Malibu. (1995). “City of Malibu General Plan.” Milankovitch, M., 1941, “Kanon der Erdbestrahlungen und seine Anwendung auf das Eiszeitenproblem Belgrade”. (New English Translation, 1998, “Canon of Insolation and the Ice Age Problem”: Alven Global. ISBN 86-17-06619-9, 636 p. Microsoft (2011). “Bing Maps 3D.” Microsoft Corporation Website: http://maps.live.com/default.aspx?v=2&cp=44.023938~-99.71&style=h&lvl=4&tilt=- 89.875918865193&dir=0&alt=7689462.6842358. Imagery accessed online June 2012.
National Academy of Science. (2012). “Sea-Level Rise for the Coasts of California, Oregon, and Washington: Past, Present, and Future.” Report authored by the Committee on Sea Level Rise in California, Oregon, and Washington, and commissioned by the Board on Earth Sciences and Resources and Ocean Studies Board Division on Earth and Life Studies, National Research Council.
National Aeronautics and Space Administration [NASA]. (2012). “WorldWind.” National Aeronautics and Space Administration Website: worldwind.arc.nasa.gov. Imagery accessed online June 2012. Petersen, M.D., Cramer, C.H., Faneros, G.A., Real, C.R., and Reichle, M.S. (2001). “Potential Ground Shaking in the Point Dume 7.5-Minute Quadrangle, Los Angeles and Ventura Counties, California.” in

Client: AMEC Environment & Infrastructure Engineering Geology Investigation Of Broad Beach Rock Revetment July 31, 2012
Cato Geoscience, Inc. Project No. 1047 Page 22 Clevenger Geoconsulting, Inc. Project No. 0018.0011.0008.01
!
California Division of Mines and Geology, “Seismic Hazard Zone Report for the Point Dume 7.5 minute quadrangle, Section 3, Ground Shaking Evaluation Report.” California Resources Agency, Department of Conservation, Division of Mines and Geology Seismic Hazard Zones Report SHZR-056, p. 45-55. Pinter, N. (2010). “Active tectonics and geomorphology of the California Channel Islands.” Southern Illinois University, Department of Geology website: http://www.geology.siu.edu/people/pinter/nci.html.
Shaller, P.J. and Heron, C.W. (2004). “Proposed revision of marine terrace extent, geometry, and rates of uplift, Pacific Palisades, California.” Geological Society of America and the Association of Environmental and Engineering Geologists, Environmental & Engineering Geoscience, Vol. X (3): 253-275.
Silva, M.A. and Irvine, P.J. (2001). “Earthquake-Induced Landslide Zones in the Point Dume 7.5 Minute Quadrangle, Los Angeles and Ventura Counties, California.” in California Division of Mines and Geology, “Seismic Hazard Zone Report for the Point Dume 7.5 minute quadrangle, Section 2, Earthquake-Induced Landslide Evaluation Report.” California Resources Agency, Department of Conservation, Division of Mines and Geology Seismic Hazard Zones Report SHZR-056, p. 19-43. Solomon, S., Qin, D., Manning, M., Chen, Z., Marquis, M., Averyt, K.B., Tignor, M., and Miller, H.L., eds. (2007). “Contribution of Working Group I to the Fourth Assessment Report of the Intergovernmental Panel on Climate Change.” Cambridge University Press, New York, 996 p.
Sorlien, C.C., Seeber, L., Broderick, K., Sliter, R., Normark, B., Fisher, M., Kamerling, M., and Luyendyk, B. (2003). “Digital 3D mapping of active faults beneath Santa Monica Bay, basin modeling, and strain partitioning: Collaborative research UCSB and LDEO.” United States Department of the Interior, Geological Survey, National Earthquake Hazards Reduction Program, contracts USDI/USGS 03HQGR0048 (UCSB) and USDI/USGS 03HQGR0005 (Colombia), 21 p.
Southern California Earthquake Data Center (2010). “Southern California Catalogs, 1932 – Present* Earthquake Catalog.” Southern California Earthquake Center, website: http://www.data.scec.org/catalog_search/date_mag_loc.php
Stuart, C.J. (1979). “Lithofacies and origin of the San Onofre Breccia, coastal southern California.” in Stuart, C.J., ed., “Miocene lithofacies and depositional environments, coastal southern California and northwestern Baja California.” Pacific Section, Society of Economic Paleontologists and Mineralogists, p. 25-42. Truex, J.N., and Hall, E.A. (1969) “Geologic map, Santa Monica Mountains.” In Geology and oil field of coastal areas, Ventura and Los Angeles basins, California; Pacific Section of American Association of Petroleum Geologists, Society of Economic Geophysicists, and Society of Economic Paleontologists and Mineralogists, 44th Annual Meeting, Los Angeles,; Guidebook and field trip, 1969. Map scale 1:62,500. United States Geological Survey and California Geological Survey (2002). Quaternary fault and fold database for the United States, accessed June 2012, from USGS web site: http//earthquake.usgs.gov/regional/qfaults/. [Google Earth KMZ file] United States Geological Survey and California Geological Survey (2006). Quaternary fault and fold database for the United States, accessed June 2012, from USGS web site: http//earthquake.usgs.gov/regional/qfaults/. [Google Earth KMZ file]

Client: AMEC Environment & Infrastructure Engineering Geology Investigation Of Broad Beach Rock Revetment July 31, 2012
Cato Geoscience, Inc. Project No. 1047 Page 23 Clevenger Geoconsulting, Inc. Project No. 0018.0011.0008.01
!
United States Geological Survey. (2007). “2002 National Seismic Hazard Maps – California Fault Parameters.” U.S. Department of the Interior, Geological Survey Webpage: http://gldims.cr.usgs.gov/webapps/cfusion/Sites/qfault/qf_web_search_res.cfm
United States Geological Survey. (2008). “Documentation for the 2008 Update of the United States National Seismic Hazard Maps: Appendix I. Parameters for Faults in California.” U.S. Department of the Interior, Geological Survey. Webpage: http://pubs.usgs.gov/of/2008/1128/
Veddar, J.G., Greene, H.G., Clarke, S.H., and Kennedy, M.P. (1986). “Geologic Map of the Mid-Southern California Continental Margin.” in: Greene, H.G. and Kennedy, M.P., eds., “Geology of the Mid-Southern California Continental Margin.” California Resources Agency, Department of Conservation, Division of Mines and Geology and the U.S. Geological Survey, California Continental Margin Geologic Map Series, Area 2 of 7, Map No. 2a, Scale: 1” = 2,000’. Woodford, A.O. (1925). “The San Onofre Breccia; Its nature and origin.” California University Publications in the Geological Sciences 15: 159-280. Woods, M. (2001). “Liquefaction Zones in the Point Dume 7.5-Minute Quadrangle, Los Angeles and Ventura Counties, California.” in California Division of Mines and Geology, “Seismic Hazard Zone Report for the Point Dume 7.5 minute quadrangle, Section 1, Liquefaction Evaluation Report.” California Resources Agency, Department of Conservation, Division of Mines and Geology Seismic Hazard Zones Report SHZR-056, p. 3-18. Yerkes, R.F., and Campbell, R.H. (1979) “Stratigraphic nomenclature of the central Santa Monica Mountains, Los Angeles County, California.” U.S. Geological Survey Bulletin 1457-E, p. E1-E31. Yerkes, R.F., and Campbell, R.H. (1980). “Geologic map of east central Santa Monica Mountains, Los Angeles County, California.” U.S. Geological Survey Miscellaneous Investigations Series, Map I-1146. Scale 1: 24,000.
Appendix 1
During the preparation of this report, many technical studies and published reports were referenced.
These were not provided for review, but should ultimately be reviewed. Therefore we request they be
provided, reviewed, and that information should be included in future versions of this report. These
documents include:
Chambers study Recent air photos (dated after 2010) Preliminary (Phase 1) Engineering Investigation (dated April, 2010) Sand Source Investigation Report (dated June, 2010) Offshore Sand Investigation Study, Phase 1 (dated June, 2011) Offshore Sand Investigation Study, Phase 2 (dated August, 2011) Sampling and Analysis Plan Results and Report (dated July, 2011) Sampling and Analysis Plan Results and Report, Appendix B (dated July, 2011)

Client: AMEC Environment & Infrastructure Engineering Geology Investigation Of Broad Beach Rock Revetment July 31, 2012
Cato Geoscience, Inc. Project No. 1047 Page 24 Clevenger Geoconsulting, Inc. Project No. 0018.0011.0008.01
!
Sampling and Analysis Plan Results and Report Addendum (dated July, 2011) Shoreline Morphology Study (dated July, 2011) Beach Profile Report (dated January, 2011) Previous Geotechnical Investigations for existing coastal protection structures, including seawalls
and piers Previous Geotechnical Investigations for existing and proposed residences/additions along Broad
Beach As-built revetment grading plan Locations of all septic systems Drainage/storm drain plans Beach grading plans County Assessor’s Parcel maps showing locations of public/private property boundaries Map with locations of revetment encroachment upon Public Trust Lands Map of propose dune restoration Map of proposed public and private access management plans, including proposed routes across
restored dunes Dune habitat restoration plans Construction Management Plan Environmental reports and documents Regional Water Quality Control Board studies or actions City of Malibu reports, studies, environmental documents County of Los Angeles reports, studies, environmental documents County of Los Angeles Department of Public Works stereoscopic aerial photographs California Coastal Record project oblique aerial photographs Geo-Tech International imagery Pre-revetment coastal protection structures, including temporary sand bag revetments MHTL Surveys

Enclosure*1*
Project*1047*****Broad*Beach*Rock*Revetment*
Malibu,*California*
Rock*Revetment*area*
along*Broad*Beach*
(formerly*known*as*Trancas*Beach)*
Approximate*Scale*
*******0*****************************Kilometers******************************1*
***************0***************************Mile*****************************1**
Source:**Lower*images*–*Google*Earth*Pro*
Upper*imageOUS*Geological*Survey,*7*½*minute*Point*Dume*Quadrangle,*1995*
Malibu*
LocaUon*Map*

Enclosure*2*
Project*1047*****Broad*Beach*Rock*Revetment*
Malibu,*California*
Source:**1993,*Dibblee*and*Ehrenspeck,***
Geologic*Map*of*the*Point*Dume*Quadrangle*
Geologic*Map*
Rock*Revetment**
area*along*Broad*Beach*(formerly*known*as*Trancas*Beach)*
Approximate*Scale*
*******0*****************************Kilometers******************************1*
***************0***************************Mile*****************************1**
Map*ExplanaUon*
Trancas*FormaUon*
*
*
Extrusive*Conejo*Volcanics*
*
*
Lower*Topanga*FormaUon*
Surficial*sediments*
QsObeach*sand*
QaOalluvial*gravel,*sand*and**
*********clay*of*floodplains*
QlsOlandslide*debris,*some*of**
*****Pleistocene*age*
*
Older*surficial*sediments*
QoaOolder*dissected*alluvial*gravel,*sand*and**
*****clay;*deposited*in*part*on*a*waveOcut**
*****pla^orm;**forms*several*terraces*

Enclosure*3*
Project*1047*****Broad*Beach*Rock*Revetment*
Malibu,*California*
Photos*of*Rock*Revetment*
Photo%3A.* *Size*of*exterior*rock*revetment*at*west*end*of*wall,*near*31346*Broad*Beach*Rd,*
ranges*from*4Ob*to*6Ob*diameter.**Measuring*tape*extends*about*5Ob*leb*of*the*
person’s*hand.**Rock*is*plutonic*igneous*and*gneiss*rock*type.*
Photo%3B.* *An*approximate*200Ob*long*gap*in*the*revetment*wall*was*created*at*the*
west*end,**west*of*31346*Broad*Beach*Rd;*photo*taken*from*western*beach*
access.**Wall*height*in*this*area*is*approximately*10Ob*to*12Ob.*Note*that*
erosion*has*exposed*the*substructure*support*of*these*residences.*

Enclosure*4*
Project*1047*****Broad*Beach*Rock*Revetment*
Malibu,*California*
Photos*of*Rock*Revetment*
Photo%4A.* *In*the*middle*secUon,*the*height*of*the*wall*ranges*from*6Ob*to*8Ob*high.*
For*the*most*part*the*rock*sizes*appear*to*be*adequately*stable*for*the*
wave*aiacks*during*the*last*2*years*as*few*rock*pieces*were*displaced.**
Photo%4B.* *In*the*middle*wall*secUon,*this*view*near*31038*Broad*Beach,*shows*the*
rock*diameter*to*range*from*1Ob*to*3.5Ob*in*diameter.**Wall*height*is*
approximately*6Ob*high.*
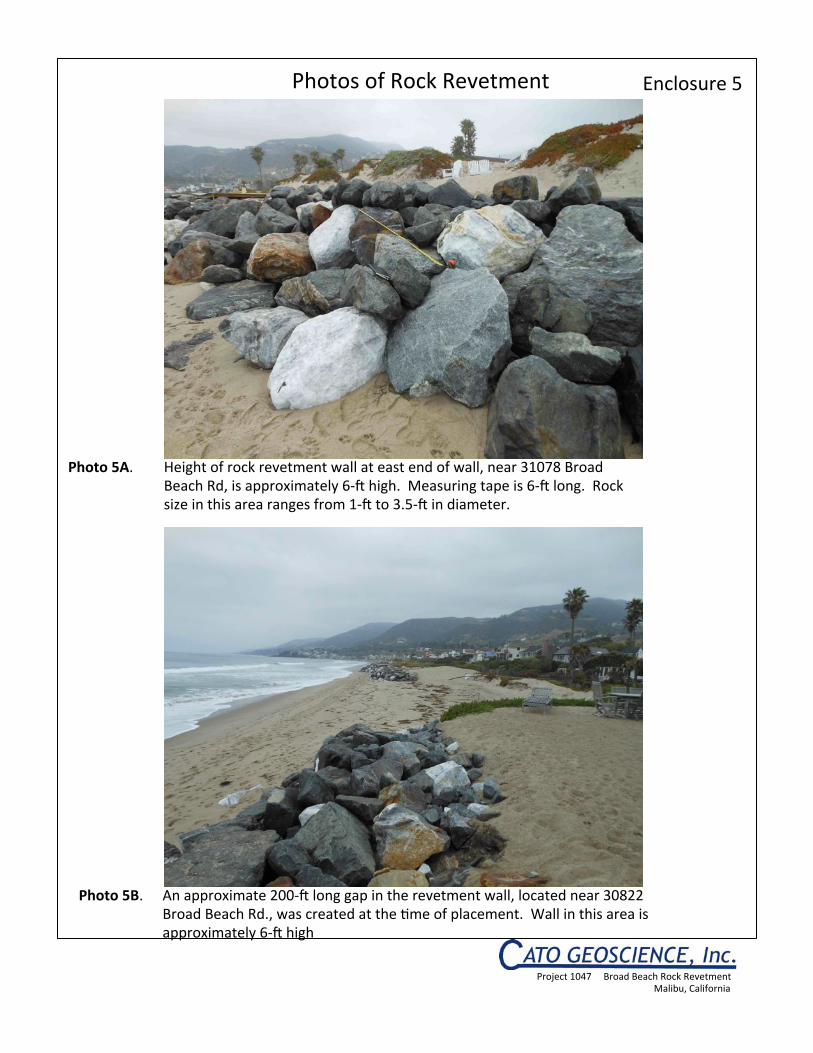
Enclosure*5*
Project*1047*****Broad*Beach*Rock*Revetment*
Malibu,*California*
Photos*of*Rock*Revetment*
Photo%5A.* *Height*of*rock*revetment*wall*at*east*end*of*wall,*near*31078*Broad*
Beach*Rd,*is*approximately*6Ob*high.**Measuring*tape*is*6Ob*long.**Rock*
size*in*this*area*ranges*from*1Ob*to*3.5Ob*in*diameter.***
Photo%5B.* *An*approximate*200Ob*long*gap*in*the*revetment*wall,*located*near*30822*
Broad*Beach*Rd.,*was*created*at*the*Ume*of*placement.**Wall*in*this*area*is*
approximately*6Ob*high*

Enclosure*6*
Project*1047*****Broad*Beach*Rock*Revetment*
Malibu,*California*
Source:**2002,*Point*Dume*Quadrangle,**
State*of*California*Seismic*Hazard*Zones*
LiquefacUon*Zones*
Rock*Revetment*area*
along*Broad*Beach*
(formerly*known*as*Trancas*Beach)*
Approximate*Scale*
*******0*************************************Kilometers**********************************1*
***************0**********************************Mile********************************1**
Map*ExplanaUon*

Enclosure*7*
Project*1047*****Broad*Beach*Rock*Revetment*
Malibu,*California*
118°45'0"W
118°45'0"W
118°52'30"W
118°52'30"W
34°0'0"N34°0'0"N
118°45'0"W
118°45'0"W
118°52'30"W
118°52'30"W
34°0'0"N34°0'0"N
TSUNAMI INUNDATION MAPFOR EMERGENCY PLANNING
0.5 0 0.5 10.25
Miles
SCALE 1:24,000
1,000 0 1,000 2,000 3,000 4,000 5,000500
Feet
0.5 0 0.5 10.25
Kilometers
State of CaliforniaCounty of Los Angeles
Initial tsunami modeling was performed by the University of Southern California (USC) Tsunami Research Center funded through the California Emergency Management Agency (CalEMA) by the National Tsunami Hazard Mitigation Program. The tsunami modeling process utilized the MOST (Method of Splitting Tsunamis) computational program (Version 0), which allows for wave evolution over a variable bathymetry and topography used for the inundation mapping (Titov and Gonzalez, 1997; Titov and Synolakis, 1998). The bathymetric/topographic data that were used in the tsunami models consist of a series of nested grids. Near-shore grids with a 3 arc-second (75- to 90-meters) resolution or higher, were adjusted to “Mean High Water” sea-level conditions, representing a conservative sea level for the intended use of the tsunami modeling and mapping.
A suite of tsunami source events was selected for modeling, representing realistic local and distant earthquakes and hypothetical extreme undersea, near-shore landslides (Table 1). Local tsunami sources that were considered include offshore reverse-thrust faults, restraining bends on strike-slip fault zones and large submarine landslides capable of significant seafloor displacement and tsunami generation. Distant tsunami sources that were considered include great subduction zone events that are known to have occurred historically (1960 Chile and 1964 Alaska earthquakes) and others which can occur around the Pacific Ocean “Ring of Fire.”
In order to enhance the result from the 75- to 90-meter inundation grid data, a method was developed utilizing higher-resolution digital topographic data (3- to 10-meters resolution) that better defines the location of the maximum inundation line (U.S. Geological Survey, 1993; Intermap, 2003; NOAA, 2004). The location of the enhanced inundation line was determined by using digital imagery and terrain data on a GIS platform with consideration given to historic inundation information (Lander, et al., 1993). This information was verified, where possible, by field work coordinated with local county personnel.
The accuracy of the inundation line shown on these maps is subject to limitations in the accuracy and completeness of available terrain and tsunami source information, and the current understanding of tsunami generation and propagation phenomena as expressed in the models. Thus, although an attempt has been made to identify a credible upper bound to inundation at any location along the coastline, it remains possible that actual inundation could be greater in a major tsunami event.
This map does not represent inundation from a single scenario event. It was created by combining inundation results for an ensemble of source events affecting a given region (Table 1). For this reason, all of the inundation region in a particular area will not likely be inundated during a single tsunami event.
Tsunami Inundation Line
Tsunami Inundation Area
MAP EXPLANATIONMETHOD OF PREPARATION
PIRU
AZUSA
ACTON
TUSTIN
VENICE
ORANGE
ONTARIO
ANAHEIM
LONG B
EACH
SUNLAND
TOPA
NGA
WHITTIER
ELMONTE
BURBANK
NEWHALL
LA H
ABRA
MT BALDY
FILLM
ORE
VAN N
UYS
PASADENA
VALY
ERMO
SAN DIM
AS
VAL V
ERDE
TORRANCE
GLENDORA
MT WILS
ON
MOORPARK
CAMARILLO
SAN PEDRO
CALABASAS
PRADO DAM
INGLE
WOOD
SEAL BEACH
POINT D
UME
CHILAO FLA
T
SOUTH GATE
HOLLYWOOD
AGUA DULC
E
YORBA LINDA
SANTA PAULA
LOS ANGELE
S
MINT C
ANYON
CANOGA PARK
POINT M
UGU
LOS ALA
MITOS
TRIU
NFO PASS
CRYSTAL L
AKE
JUNIP
ER HILL
S
CONDOR PEAK
MALIBU BEACH
BALDW
IN PA
RK
OAT M
OUNTAIN
BEVERLY H
ILLS
REDONDO BEACH
MESCAL CREEK
NEWPORT B
EACH
SAN FERNANDO
NEWBURY PARK
WATERMAN M
TN
THOUSAND O
AKS
PALM
DALE
SIMI V
ALLEY EAST
SIMI V
ALLEY W
EST
SANTA PAULA P
EAK
EL MIR
AGE
PACIFIC
O MOUNTA
IN
BLACK S
TAR C
ANYON
LITTL
EROCK
MOUNT SAN ANTONIO
RITTER R
IDGE
GREEN VALL
EY
WHITAKER P
EAK
SLEEPY VALL
EY
COBBLESTO
NE MTN
DEVILS H
EART PEAK
LOVEJO
Y BUTTES
TOPA
TOPA M
OUNTAIN
S
WARM SPRIN
GS MOUNTA
IN
LAGUNA BEACH
SAN JUAN CAPISTRANO
References:
Intermap Technologies, Inc., 2003, Intermap product handbook and quick start guide: Intermap NEXTmap document on 5-meter resolution data, 112 p.
Lander, J.F., Lockridge, P.A., and Kozuch, M.J., 1993, Tsunamis Affecting the West Coast of the United States 1806-1992: National Geophysical Data Center Key to Geophysical Record Documentation No. 29, NOAA, NESDIS, NGDC, 242 p.
National Atmospheric and Oceanic Administration (NOAA), 2004, Interferometric Synthetic Aperture Radar (IfSAR) Digital Elevation Models from GeoSAR platform (EarthData): 3-meter resolution data.
Titov, V.V., and Gonzalez, F.I., 1997, Implementation and Testing of the Method of Tsunami Splitting (MOST): NOAA Technical Memorandum ERL PMEL – 112, 11 p.
Titov, V.V., and Synolakis, C.E., 1998, Numerical modeling of tidal wave runup: Journal of Waterways, Port, Coastal and Ocean Engineering, ASCE, 124 (4), pp 157-171.
U.S. Geological Survey, 1993, Digital Elevation Models: National Mapping Program, Technical Instructions, Data Users Guide 5, 48 p.
California Emergency Management AgencyCalifornia Geological SurveyUniversity of Southern California
Tsunami Inundation Map for Emergency PlanningPoint Dume Quadrangle
State of California ~ County of Los AngelesPOINT DUME QUADRANGLE
March 1, 2009 This tsunami inundation map was prepared to assist cities and counties in identifying their tsunami hazard. It is intended for local jurisdictional, coastal evacuation planning uses only. This map, and the information presented herein, is not a legal document and does not meet disclosure requirements for real estate transactions nor for any other regulatory purpose.
The inundation map has been compiled with best currently available scientific information. The inundation line represents the maximum considered tsunami runup from a number of extreme, yet realistic, tsunami sources. Tsunamis are rare events; due to a lack of known occurrences in the historical record, this map includes no information about the probability of any tsunami affecting any area within a specific period of time.
Please refer to the following websites for additional information on the construction and/or intended use of the tsunami inundation map:
State of California Emergency Management Agency, Earthquake and Tsunami Program:http://www.oes.ca.gov/WebPage/oeswebsite.nsf/Content/B1EC51BA215931768825741F005E8D80?OpenDocument
University of Southern California – Tsunami Research Center:http://www.usc.edu/dept/tsunamis/2005/index.php
State of California Geological Survey Tsunami Information: http://www.conservation.ca.gov/cgs/geologic_hazards/Tsunami/index.htm
National Oceanic and Atmospheric Agency Center for Tsunami Research (MOST model):http://nctr.pmel.noaa.gov/time/background/models.html
The California Emergency Management Agency (CalEMA), the University of Southern California (USC), and the California Geological Survey (CGS) make no representation or warranties regarding the accuracy of this inundation map nor the data from which the map was derived. Neither the State of California nor USC shall be liable under any circumstances for any direct, indirect, special, incidental or consequential damages with respect to any claim by any user or any third party on account of or arising from the use of this map.
Topographic base maps prepared by U.S. Geological Survey as part of the 7.5-minute Quadrangle Map Series (originally 1:24,000 scale). Tsunami inundation line boundaries may reflect updated digital orthophotographic and topographic data that can differ significantly from contours shown on the base map.
PURPOSE OF THIS MAP
MAP BASE
DISCLAIMER
Table 1: Tsunami sources modeled for the Los Angeles County coastline.
Areas of Inundation Map Coverage and Sources Used Sources (M = moment magnitude used in modeled
event) Malibu Santa Monica
Los Angeles Harbor
Anacapa-Dume Fault X X Catalina Fault X X X Channel Island Thrust Fault X Newport-Inglewood Fault X Santa Monica Fault X X Palos Verdes Landslide #1 X X
Local Sources
Palos Verdes Landslide #2 X Cascadia Subduction Zone #2 (M9.2) X X Central Aleutians Subduction Zone#1 (M8.9) X X Central Aleutians Subduction Zone#2 (M8.9) X X Central Aleutians Subduction Zone#3 (M9.2) X X X Chile North Subduction Zone (M9.4) X X X 1960 Chile Earthquake (M9.3) X X 1964 Alaska Earthquake (M9.2) X X X Japan Subduction Zone #2 (M8.8) X X Kuril Islands Subduction Zone #2 (M8.8) X X Kuril Islands Subduction Zone #3 (M8.8) X X
Distant Sources
Kuril Islands Subduction Zone #4 (M8.8) X X
Source:**Tsunami*InundaUon*Map*For*Emergency*Planning,*Point*Dume*Quadrangle,*State*of*California,County*of*Los*Angeles,**March*1,*2009*
118°45'0"W
118°45'0"W
118°52'30"W
118°52'30"W
34°0'0"N34°0'0"N
118°45'0"W
118°45'0"W
118°52'30"W
118°52'30"W
34°0'0"N34°0'0"N
TSUNAMI INUNDATION MAPFOR EMERGENCY PLANNING
0.5 0 0.5 10.25
Miles
SCALE 1:24,000
1,000 0 1,000 2,000 3,000 4,000 5,000500
Feet
0.5 0 0.5 10.25
Kilometers
State of CaliforniaCounty of Los Angeles
Initial tsunami modeling was performed by the University of Southern California (USC) Tsunami Research Center funded through the California Emergency Management Agency (CalEMA) by the National Tsunami Hazard Mitigation Program. The tsunami modeling process utilized the MOST (Method of Splitting Tsunamis) computational program (Version 0), which allows for wave evolution over a variable bathymetry and topography used for the inundation mapping (Titov and Gonzalez, 1997; Titov and Synolakis, 1998). The bathymetric/topographic data that were used in the tsunami models consist of a series of nested grids. Near-shore grids with a 3 arc-second (75- to 90-meters) resolution or higher, were adjusted to “Mean High Water” sea-level conditions, representing a conservative sea level for the intended use of the tsunami modeling and mapping.
A suite of tsunami source events was selected for modeling, representing realistic local and distant earthquakes and hypothetical extreme undersea, near-shore landslides (Table 1). Local tsunami sources that were considered include offshore reverse-thrust faults, restraining bends on strike-slip fault zones and large submarine landslides capable of significant seafloor displacement and tsunami generation. Distant tsunami sources that were considered include great subduction zone events that are known to have occurred historically (1960 Chile and 1964 Alaska earthquakes) and others which can occur around the Pacific Ocean “Ring of Fire.”
In order to enhance the result from the 75- to 90-meter inundation grid data, a method was developed utilizing higher-resolution digital topographic data (3- to 10-meters resolution) that better defines the location of the maximum inundation line (U.S. Geological Survey, 1993; Intermap, 2003; NOAA, 2004). The location of the enhanced inundation line was determined by using digital imagery and terrain data on a GIS platform with consideration given to historic inundation information (Lander, et al., 1993). This information was verified, where possible, by field work coordinated with local county personnel.
The accuracy of the inundation line shown on these maps is subject to limitations in the accuracy and completeness of available terrain and tsunami source information, and the current understanding of tsunami generation and propagation phenomena as expressed in the models. Thus, although an attempt has been made to identify a credible upper bound to inundation at any location along the coastline, it remains possible that actual inundation could be greater in a major tsunami event.
This map does not represent inundation from a single scenario event. It was created by combining inundation results for an ensemble of source events affecting a given region (Table 1). For this reason, all of the inundation region in a particular area will not likely be inundated during a single tsunami event.
Tsunami Inundation Line
Tsunami Inundation Area
MAP EXPLANATIONMETHOD OF PREPARATION
PIRU
AZUSA
ACTON
TUSTIN
VENICE
ORANGE
ONTARIO
ANAHEIM
LONG B
EACH
SUNLAND
TOPA
NGA
WHITTIER
ELMONTE
BURBANK
NEWHALL
LA H
ABRA
MT BALDY
FILLM
ORE
VAN N
UYS
PASADENA
VALY
ERMO
SAN DIM
AS
VAL V
ERDE
TORRANCE
GLENDORA
MT WILS
ON
MOORPARK
CAMARILLO
SAN PEDRO
CALABASAS
PRADO DAM
INGLE
WOOD
SEAL BEACH
POINT D
UME
CHILAO FLA
T
SOUTH GATE
HOLLYWOOD
AGUA DULC
E
YORBA LINDA
SANTA PAULA
LOS ANGELE
S
MINT C
ANYON
CANOGA PARK
POINT M
UGU
LOS ALA
MITOS
TRIU
NFO PASS
CRYSTAL L
AKE
JUNIP
ER HILL
S
CONDOR PEAK
MALIBU BEACH
BALDW
IN PA
RK
OAT M
OUNTAIN
BEVERLY H
ILLS
REDONDO BEACH
MESCAL CREEK
NEWPORT B
EACH
SAN FERNANDO
NEWBURY PARK
WATERMAN M
TN
THOUSAND O
AKS
PALM
DALE
SIMI V
ALLEY EAST
SIMI V
ALLEY W
EST
SANTA PAULA P
EAK
EL MIR
AGE
PACIFIC
O MOUNTA
IN
BLACK S
TAR C
ANYON
LITTL
EROCK
MOUNT SAN ANTONIO
RITTER R
IDGE
GREEN VALL
EY
WHITAKER P
EAK
SLEEPY VALL
EY
COBBLESTO
NE MTN
DEVILS H
EART PEAK
LOVEJO
Y BUTTES
TOPA
TOPA M
OUNTAIN
S
WARM SPRIN
GS MOUNTA
IN
LAGUNA BEACH
SAN JUAN CAPISTRANO
References:
Intermap Technologies, Inc., 2003, Intermap product handbook and quick start guide: Intermap NEXTmap document on 5-meter resolution data, 112 p.
Lander, J.F., Lockridge, P.A., and Kozuch, M.J., 1993, Tsunamis Affecting the West Coast of the United States 1806-1992: National Geophysical Data Center Key to Geophysical Record Documentation No. 29, NOAA, NESDIS, NGDC, 242 p.
National Atmospheric and Oceanic Administration (NOAA), 2004, Interferometric Synthetic Aperture Radar (IfSAR) Digital Elevation Models from GeoSAR platform (EarthData): 3-meter resolution data.
Titov, V.V., and Gonzalez, F.I., 1997, Implementation and Testing of the Method of Tsunami Splitting (MOST): NOAA Technical Memorandum ERL PMEL – 112, 11 p.
Titov, V.V., and Synolakis, C.E., 1998, Numerical modeling of tidal wave runup: Journal of Waterways, Port, Coastal and Ocean Engineering, ASCE, 124 (4), pp 157-171.
U.S. Geological Survey, 1993, Digital Elevation Models: National Mapping Program, Technical Instructions, Data Users Guide 5, 48 p.
California Emergency Management AgencyCalifornia Geological SurveyUniversity of Southern California
Tsunami Inundation Map for Emergency PlanningPoint Dume Quadrangle
State of California ~ County of Los AngelesPOINT DUME QUADRANGLE
March 1, 2009 This tsunami inundation map was prepared to assist cities and counties in identifying their tsunami hazard. It is intended for local jurisdictional, coastal evacuation planning uses only. This map, and the information presented herein, is not a legal document and does not meet disclosure requirements for real estate transactions nor for any other regulatory purpose.
The inundation map has been compiled with best currently available scientific information. The inundation line represents the maximum considered tsunami runup from a number of extreme, yet realistic, tsunami sources. Tsunamis are rare events; due to a lack of known occurrences in the historical record, this map includes no information about the probability of any tsunami affecting any area within a specific period of time.
Please refer to the following websites for additional information on the construction and/or intended use of the tsunami inundation map:
State of California Emergency Management Agency, Earthquake and Tsunami Program:http://www.oes.ca.gov/WebPage/oeswebsite.nsf/Content/B1EC51BA215931768825741F005E8D80?OpenDocument
University of Southern California – Tsunami Research Center:http://www.usc.edu/dept/tsunamis/2005/index.php
State of California Geological Survey Tsunami Information: http://www.conservation.ca.gov/cgs/geologic_hazards/Tsunami/index.htm
National Oceanic and Atmospheric Agency Center for Tsunami Research (MOST model):http://nctr.pmel.noaa.gov/time/background/models.html
The California Emergency Management Agency (CalEMA), the University of Southern California (USC), and the California Geological Survey (CGS) make no representation or warranties regarding the accuracy of this inundation map nor the data from which the map was derived. Neither the State of California nor USC shall be liable under any circumstances for any direct, indirect, special, incidental or consequential damages with respect to any claim by any user or any third party on account of or arising from the use of this map.
Topographic base maps prepared by U.S. Geological Survey as part of the 7.5-minute Quadrangle Map Series (originally 1:24,000 scale). Tsunami inundation line boundaries may reflect updated digital orthophotographic and topographic data that can differ significantly from contours shown on the base map.
PURPOSE OF THIS MAP
MAP BASE
DISCLAIMER
Table 1: Tsunami sources modeled for the Los Angeles County coastline.
Areas of Inundation Map Coverage and Sources Used Sources (M = moment magnitude used in modeled
event) Malibu Santa Monica
Los Angeles Harbor
Anacapa-Dume Fault X X Catalina Fault X X X Channel Island Thrust Fault X Newport-Inglewood Fault X Santa Monica Fault X X Palos Verdes Landslide #1 X X
Local Sources
Palos Verdes Landslide #2 X Cascadia Subduction Zone #2 (M9.2) X X Central Aleutians Subduction Zone#1 (M8.9) X X Central Aleutians Subduction Zone#2 (M8.9) X X Central Aleutians Subduction Zone#3 (M9.2) X X X Chile North Subduction Zone (M9.4) X X X 1960 Chile Earthquake (M9.3) X X 1964 Alaska Earthquake (M9.2) X X X Japan Subduction Zone #2 (M8.8) X X Kuril Islands Subduction Zone #2 (M8.8) X X Kuril Islands Subduction Zone #3 (M8.8) X X
Distant Sources
Kuril Islands Subduction Zone #4 (M8.8) X X
Tsunami*InundaUon*Map*
Approximate*Scale*
*******0*****************************Kilometers******************************1*
***************0***************************Mile*****************************1**
118°45'0"W
118°45'0"W
118°52'30"W
118°52'30"W
34°0'0"N34°0'0"N
118°45'0"W
118°45'0"W
118°52'30"W
118°52'30"W
34°0'0"N34°0'0"N
TSUNAMI INUNDATION MAPFOR EMERGENCY PLANNING
0.5 0 0.5 10.25
Miles
SCALE 1:24,000
1,000 0 1,000 2,000 3,000 4,000 5,000500
Feet
0.5 0 0.5 10.25
Kilometers
State of CaliforniaCounty of Los Angeles
Initial tsunami modeling was performed by the University of Southern California (USC) Tsunami Research Center funded through the California Emergency Management Agency (CalEMA) by the National Tsunami Hazard Mitigation Program. The tsunami modeling process utilized the MOST (Method of Splitting Tsunamis) computational program (Version 0), which allows for wave evolution over a variable bathymetry and topography used for the inundation mapping (Titov and Gonzalez, 1997; Titov and Synolakis, 1998). The bathymetric/topographic data that were used in the tsunami models consist of a series of nested grids. Near-shore grids with a 3 arc-second (75- to 90-meters) resolution or higher, were adjusted to “Mean High Water” sea-level conditions, representing a conservative sea level for the intended use of the tsunami modeling and mapping.
A suite of tsunami source events was selected for modeling, representing realistic local and distant earthquakes and hypothetical extreme undersea, near-shore landslides (Table 1). Local tsunami sources that were considered include offshore reverse-thrust faults, restraining bends on strike-slip fault zones and large submarine landslides capable of significant seafloor displacement and tsunami generation. Distant tsunami sources that were considered include great subduction zone events that are known to have occurred historically (1960 Chile and 1964 Alaska earthquakes) and others which can occur around the Pacific Ocean “Ring of Fire.”
In order to enhance the result from the 75- to 90-meter inundation grid data, a method was developed utilizing higher-resolution digital topographic data (3- to 10-meters resolution) that better defines the location of the maximum inundation line (U.S. Geological Survey, 1993; Intermap, 2003; NOAA, 2004). The location of the enhanced inundation line was determined by using digital imagery and terrain data on a GIS platform with consideration given to historic inundation information (Lander, et al., 1993). This information was verified, where possible, by field work coordinated with local county personnel.
The accuracy of the inundation line shown on these maps is subject to limitations in the accuracy and completeness of available terrain and tsunami source information, and the current understanding of tsunami generation and propagation phenomena as expressed in the models. Thus, although an attempt has been made to identify a credible upper bound to inundation at any location along the coastline, it remains possible that actual inundation could be greater in a major tsunami event.
This map does not represent inundation from a single scenario event. It was created by combining inundation results for an ensemble of source events affecting a given region (Table 1). For this reason, all of the inundation region in a particular area will not likely be inundated during a single tsunami event.
Tsunami Inundation Line
Tsunami Inundation Area
MAP EXPLANATIONMETHOD OF PREPARATION
PIRU
AZUSA
ACTON
TUSTIN
VENICE
ORANGE
ONTARIO
ANAHEIM
LONG B
EACH
SUNLAND
TOPA
NGA
WHITTIER
ELMONTE
BURBANK
NEWHALL
LA H
ABRA
MT BALDY
FILLM
ORE
VAN N
UYS
PASADENA
VALY
ERMO
SAN DIM
AS
VAL V
ERDE
TORRANCE
GLENDORA
MT WILS
ON
MOORPARK
CAMARILLO
SAN PEDRO
CALABASAS
PRADO DAM
INGLE
WOOD
SEAL BEACH
POINT D
UME
CHILAO FLA
T
SOUTH GATE
HOLLYWOOD
AGUA DULC
E
YORBA LINDA
SANTA PAULA
LOS ANGELE
S
MINT C
ANYON
CANOGA PARK
POINT M
UGU
LOS ALA
MITOS
TRIU
NFO PASS
CRYSTAL L
AKE
JUNIP
ER HILL
S
CONDOR PEAK
MALIBU BEACH
BALDW
IN PA
RK
OAT M
OUNTAIN
BEVERLY H
ILLS
REDONDO BEACH
MESCAL CREEK
NEWPORT B
EACH
SAN FERNANDO
NEWBURY PARK
WATERMAN M
TN
THOUSAND O
AKS
PALM
DALE
SIMI V
ALLEY EAST
SIMI V
ALLEY W
EST
SANTA PAULA P
EAK
EL MIR
AGE
PACIFIC
O MOUNTA
IN
BLACK S
TAR C
ANYON
LITTL
EROCK
MOUNT SAN ANTONIO
RITTER R
IDGE
GREEN VALL
EY
WHITAKER P
EAK
SLEEPY VALL
EY
COBBLESTO
NE MTN
DEVILS H
EART PEAK
LOVEJO
Y BUTTES
TOPA
TOPA M
OUNTAIN
S
WARM SPRIN
GS MOUNTA
IN
LAGUNA BEACH
SAN JUAN CAPISTRANO
References:
Intermap Technologies, Inc., 2003, Intermap product handbook and quick start guide: Intermap NEXTmap document on 5-meter resolution data, 112 p.
Lander, J.F., Lockridge, P.A., and Kozuch, M.J., 1993, Tsunamis Affecting the West Coast of the United States 1806-1992: National Geophysical Data Center Key to Geophysical Record Documentation No. 29, NOAA, NESDIS, NGDC, 242 p.
National Atmospheric and Oceanic Administration (NOAA), 2004, Interferometric Synthetic Aperture Radar (IfSAR) Digital Elevation Models from GeoSAR platform (EarthData): 3-meter resolution data.
Titov, V.V., and Gonzalez, F.I., 1997, Implementation and Testing of the Method of Tsunami Splitting (MOST): NOAA Technical Memorandum ERL PMEL – 112, 11 p.
Titov, V.V., and Synolakis, C.E., 1998, Numerical modeling of tidal wave runup: Journal of Waterways, Port, Coastal and Ocean Engineering, ASCE, 124 (4), pp 157-171.
U.S. Geological Survey, 1993, Digital Elevation Models: National Mapping Program, Technical Instructions, Data Users Guide 5, 48 p.
California Emergency Management AgencyCalifornia Geological SurveyUniversity of Southern California
Tsunami Inundation Map for Emergency PlanningPoint Dume Quadrangle
State of California ~ County of Los AngelesPOINT DUME QUADRANGLE
March 1, 2009 This tsunami inundation map was prepared to assist cities and counties in identifying their tsunami hazard. It is intended for local jurisdictional, coastal evacuation planning uses only. This map, and the information presented herein, is not a legal document and does not meet disclosure requirements for real estate transactions nor for any other regulatory purpose.
The inundation map has been compiled with best currently available scientific information. The inundation line represents the maximum considered tsunami runup from a number of extreme, yet realistic, tsunami sources. Tsunamis are rare events; due to a lack of known occurrences in the historical record, this map includes no information about the probability of any tsunami affecting any area within a specific period of time.
Please refer to the following websites for additional information on the construction and/or intended use of the tsunami inundation map:
State of California Emergency Management Agency, Earthquake and Tsunami Program:http://www.oes.ca.gov/WebPage/oeswebsite.nsf/Content/B1EC51BA215931768825741F005E8D80?OpenDocument
University of Southern California – Tsunami Research Center:http://www.usc.edu/dept/tsunamis/2005/index.php
State of California Geological Survey Tsunami Information: http://www.conservation.ca.gov/cgs/geologic_hazards/Tsunami/index.htm
National Oceanic and Atmospheric Agency Center for Tsunami Research (MOST model):http://nctr.pmel.noaa.gov/time/background/models.html
The California Emergency Management Agency (CalEMA), the University of Southern California (USC), and the California Geological Survey (CGS) make no representation or warranties regarding the accuracy of this inundation map nor the data from which the map was derived. Neither the State of California nor USC shall be liable under any circumstances for any direct, indirect, special, incidental or consequential damages with respect to any claim by any user or any third party on account of or arising from the use of this map.
Topographic base maps prepared by U.S. Geological Survey as part of the 7.5-minute Quadrangle Map Series (originally 1:24,000 scale). Tsunami inundation line boundaries may reflect updated digital orthophotographic and topographic data that can differ significantly from contours shown on the base map.
PURPOSE OF THIS MAP
MAP BASE
DISCLAIMER
Table 1: Tsunami sources modeled for the Los Angeles County coastline.
Areas of Inundation Map Coverage and Sources Used Sources (M = moment magnitude used in modeled
event) Malibu Santa Monica
Los Angeles Harbor
Anacapa-Dume Fault X X Catalina Fault X X X Channel Island Thrust Fault X Newport-Inglewood Fault X Santa Monica Fault X X Palos Verdes Landslide #1 X X
Local Sources
Palos Verdes Landslide #2 X Cascadia Subduction Zone #2 (M9.2) X X Central Aleutians Subduction Zone#1 (M8.9) X X Central Aleutians Subduction Zone#2 (M8.9) X X Central Aleutians Subduction Zone#3 (M9.2) X X X Chile North Subduction Zone (M9.4) X X X 1960 Chile Earthquake (M9.3) X X 1964 Alaska Earthquake (M9.2) X X X Japan Subduction Zone #2 (M8.8) X X Kuril Islands Subduction Zone #2 (M8.8) X X Kuril Islands Subduction Zone #3 (M8.8) X X
Distant Sources
Kuril Islands Subduction Zone #4 (M8.8) X X
Rock*Revetment*area*
along*Broad*Beach*
(formerly*known*as*Trancas*Beach)*


