56
TM 970, CSO Control Alternatives Development (October 2011) Appendix F Planning-Level Sizing Assumptions
TM 970, CSO Control Alternatives Development (October 2011)
Appendix F
Planning-Level Sizing Assumptions

This page left blank intentionally.

TM 970, CSO Control Alternatives Development (October 2011)
Appendix F.1
Storage Tank Design Criteria

This page left blank intentionally.

King County 2012 CSO Control Program Review STORAGE TANK DESIGN CRITERIA
Storage Tank Design Criteria 1 of 3 3/17/2011
Facility Component Design Criteria Footprint Criteria
Storage Tank a) Discharge into storage tank via gravity and pump to drain.
b) Maximum Water Surface Level = Existing Overflow Elevation (When Feasible); Freeboard Depth = 2 feet.
a. Existing overflow elevation is the water level at which combined sewage is diverted to the existing CSO outfall, either via an overflow weir or outfall gate.
b. Two feet of freeboard is assumed to allow the system to balance and discharge to the CSO outfall when the storage tank is full.
c. If site-specific conditions require the storage tank to be constructed deeper, then it may be possible that the maximum water surface level is lower than the existing overflow elevation. In these instances, the maximum water surface level would be assumed to be 1 foot below the invert of the inlet conveyance piping into the storage tank, and isolation valves could be used to prevent surcharging of the storage tank.
c) Flushing Lane: 2% slope. d) Tank Cover Depth: minimum 2 feet. e) Water Depth in Tank: 10 to 20 feet. f) Tipping buckets will be used for flushing.
a) Tank Length to Width Ratio: 3:1 or 5:1. b) Outer Wall Thickness: 3 feet. c) Dividing Wall Thickness: 1 foot. d) Additional Length and Width for Shoring: 5 feet
each side.
King County 2012 CSO Control Program Review STORAGE TANK DESIGN CRITERIA
Storage Tank Design Criteria 2 of 3 3/17/2011
Facility Component Design Criteria Footprint Criteria
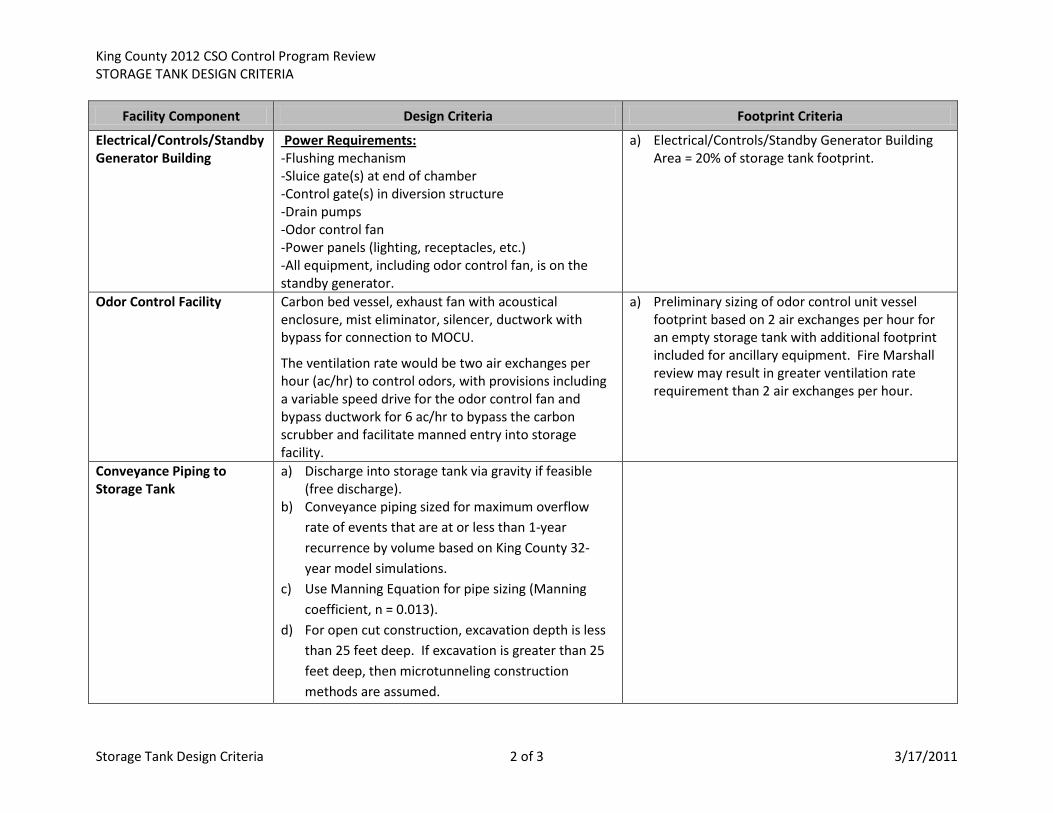
Electrical/Controls/Standby Generator Building
Power Requirements: -Flushing mechanism -Sluice gate(s) at end of chamber -Control gate(s) in diversion structure -Drain pumps -Odor control fan -Power panels (lighting, receptacles, etc.) -All equipment, including odor control fan, is on the standby generator.
a) Electrical/Controls/Standby Generator Building Area = 20% of storage tank footprint.
Odor Control Facility Carbon bed vessel, exhaust fan with acoustical enclosure, mist eliminator, silencer, ductwork with bypass for connection to MOCU.
The ventilation rate would be two air exchanges per hour (ac/hr) to control odors, with provisions including a variable speed drive for the odor control fan and bypass ductwork for 6 ac/hr to bypass the carbon scrubber and facilitate manned entry into storage facility.
a) Preliminary sizing of odor control unit vessel footprint based on 2 air exchanges per hour for an empty storage tank with additional footprint included for ancillary equipment. Fire Marshall review may result in greater ventilation rate requirement than 2 air exchanges per hour.
Conveyance Piping to Storage Tank
a) Discharge into storage tank via gravity if feasible (free discharge).
b) Conveyance piping sized for maximum overflow rate of events that are at or less than 1-year recurrence by volume based on King County 32-year model simulations.
c) Use Manning Equation for pipe sizing (Manning coefficient, n = 0.013).
d) For open cut construction, excavation depth is less than 25 feet deep. If excavation is greater than 25 feet deep, then microtunneling construction methods are assumed.

King County 2012 CSO Control Program Review STORAGE TANK DESIGN CRITERIA
Storage Tank Design Criteria 3 of 3 3/17/2011
Facility Component Design Criteria Footprint Criteria
Force Main (Draining Storage Tank) and Drain Pumping System
a) Single force main. b) Design to accommodate storage facility drawdown
in 12 hours. c) Maintain a velocity between 4 and 10 feet per
second.
a) Submersible pumps are located within storage tank footprint area.
Diversion Structure a) Locate diversion structure as required to convey combined sewage to storage tank. General assumption is that diversion would occur at existing regulator stations.
b) Diversion structure consists of overflow weirs and gates. Details of operation will be determined during Predesign.
c) Elevation of new overflow weir that diverts combined sewage to storage tank is below the existing overflow elevation (water level at which combined sewage is diverted to the existing CSO outfall, either via an overflow weir or outfall gate).
Assume standard 15’ x 15’ footprint.
C2 Water Service C2 Water System for Tipping Buckets: Break tank Fill pumps Backflow preventer
Assume standard 10’ x 10’ footprint.

This page is left blank intentionally.

Diversion Location(Regulator Station)
CSO Storage Tank
InfluentGravitySewer
Overflow
DrainageForceMain
Influent Gravity Sewer UpstreamCrown < ElevO
King CountyInterceptorOverflow
Weiror Gate
To CSOOutfall
GroundSurface
Overflow Elev.(ElevO)
Overflow Elev. to CSOStorage Tank (ElevS)ElevS < ElevO
Max. WaterSurface Level= ElevO
Influent Sewer Invert<25’ Below Ground Surfacefor Installations UsingOpen-Cut Construction
CSO Storage TankFreeboard = 2’
CSO StorageTank Top SlabThickness = 2’
Depth ofCover = 2’ min.
HigherGround
CSO Storage Tank Slope = 2%
CSO Storage Tank Length (LT)
CSO StorageWater Depth
= 10’ - 20’
Max
imum
Exc
avat
ion
Dep
th ≤
50’
Weir
Diversion Location(Regulator Station)
CSO Storage Tank
InfluentGravitySewer
Overflow
DrainageForceMain
Influent Gravity Sewer Upstream Crown < ElevO
King CountyInterceptorOverflow
Weiror Gate
To CSOOutfall
GroundSurface
Overflow Elev.(ElevO)
Overflow Elev. to CSOStorage Tank (ElevS)ElevS < ElevO
Max. Water Surface Level < ElevO(1’ Below Influent Sewer Invert)
Influent Sewer Invert<25’ Below Ground Surfacefor Installations UsingOpen-Cut Construction
CSO StorageTank Top SlabThickness = 2’
IsolationValve
CSO Storage Tank Bottom Slab Thickness = 4’
Depth ofCover = 2’ min.
CSO Storage Tank Slope = 2%
CSO Storage Tank Length (LT)
CSO Storage Water Depth = 10’ - 20’
Max
imum
Exc
avat
ion
Dep
th ≤
50’
Weir
CSO Storage Tank Bottom Slab Thickness = 4’
CSO Storage Tank Design Criteria(Maximum Water Surface Level = Overflow Elevation)
CSO Storage Tank Design Criteria(Maximum Water Surface Level < Overflow Elevation)

This page left blank intentionally.
Diversion Location(Regulator Station)
DiversionLocation
Storage Location
Influent Gravity SewerOverflow
Influent Gravity Sewer Upstream Invert (IEU)
Influent Gravity Sewer Upstream Crown
King CountyInterceptor
OverflowWeiror Gate
To CSO Outfall
Influent Gravity Sewer Downstream Invert (IED)
Influent Gravity Sewer Slope (SS)
Ground SurfaceElev. (ElevG)
Maximum Conveyance Length (LS)
Overflow Elev.(ElevO)
Overflow Elev. to CSOStorage Tank (ElevS)ElevS < ElevO
Max. WaterSurfaceLevel (WLmax)
CSO Storage TankFreeboard (F)
CSO StorageTank Top SlabThickness (TT)
Depth ofCover (DC)
PipeDiameter
Storage Location HigherGround
InfluentGravitySewer
CSO Storage Tank Slope (ST)
MaximumGround Surface Elev.(ElevGmax)
Radius of Circular Path = 0.8LS
0.8LS
CSO Storage Tank Length (LT)
Max. Water SurfaceLevel (WLmax)
DiversionLocation
DiversionLocation
CSO Storage Tank BottomSlab Thickness (TB)
CSO Storage WaterDepth (DW)
MaximumExcavationDepth (DEmax)
Max. G
round Surface Elev. (ElevG
max )
Max. G
round Surface Elev. (ElevG
max )
Max. G
round Surface Elev. (ElevG
max )
Weir
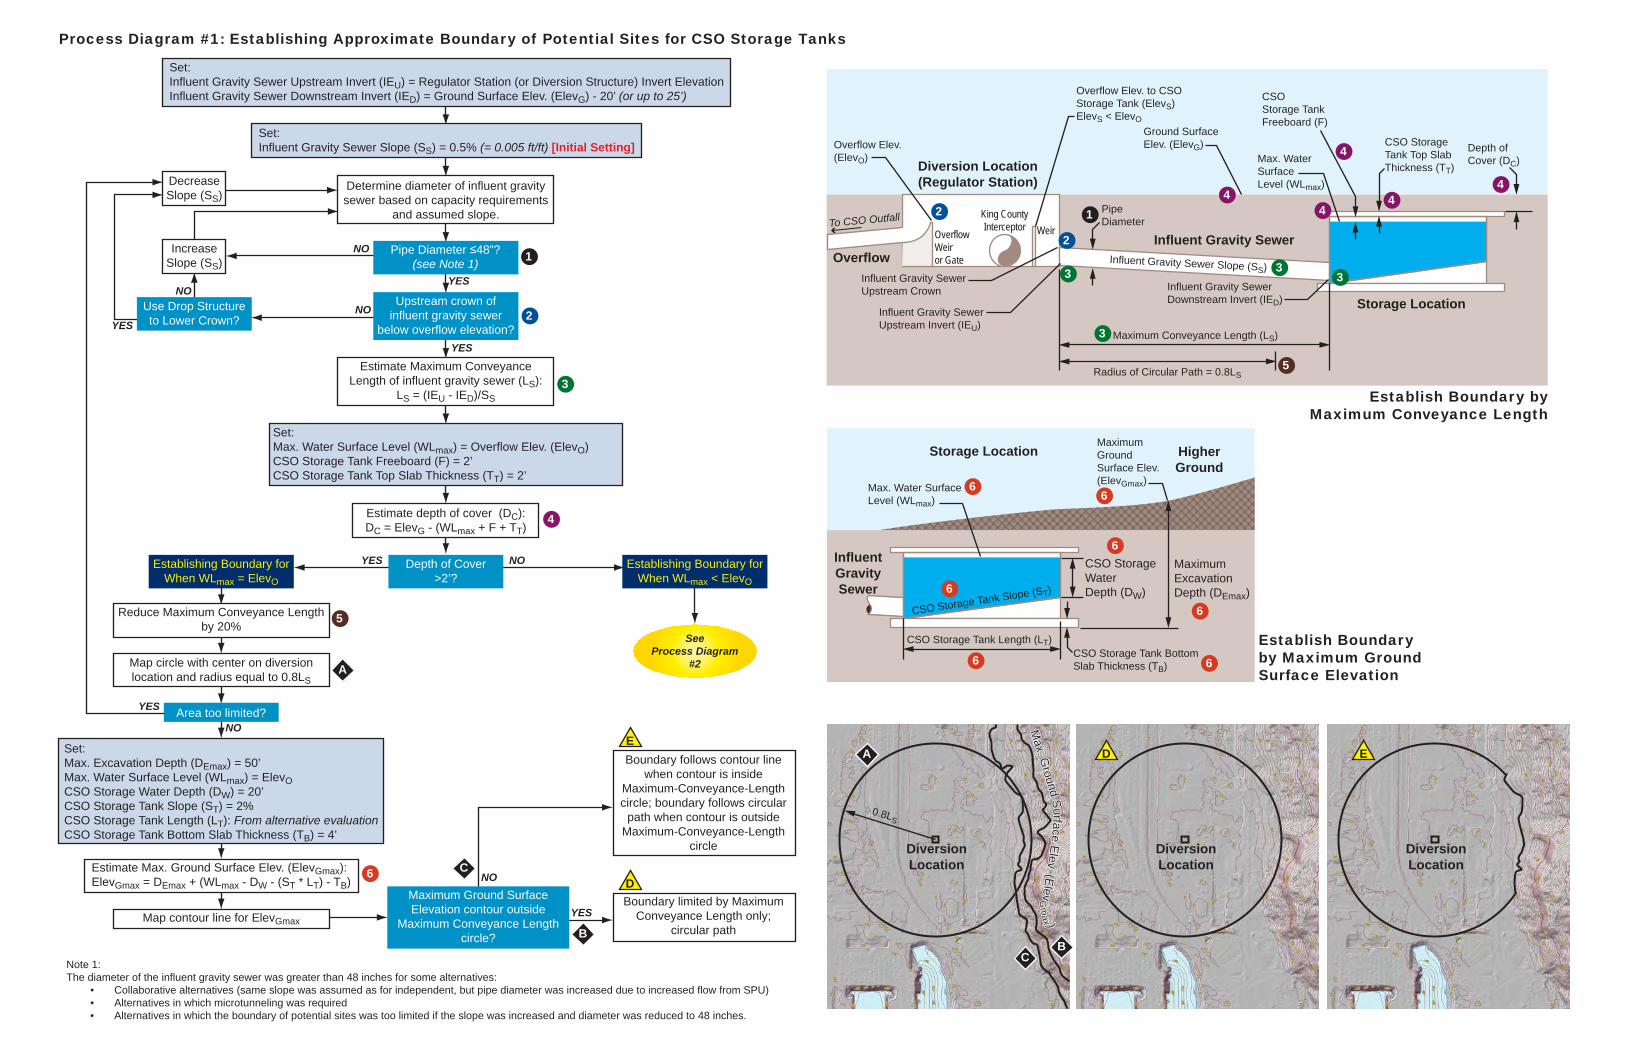
Determine diameter of influent gravity sewer based on capacity requirements
and assumed slope.
Estimate Maximum Conveyance Length of influent gravity sewer (LS):
LS = (IEU - IED)/SS
Set:Max. Water Surface Level (WLmax) = Overflow Elev. (ElevO)CSO Storage Tank Freeboard (F) = 2’CSO Storage Tank Top Slab Thickness (TT) = 2’
Reduce Maximum Conveyance Length by 20%
Boundary limited by Maximum Conveyance Length only;
circular path
Boundary follows contour line when contour is inside
Maximum-Conveyance-Length circle; boundary follows circular
path when contour is outside Maximum-Conveyance-Length
circle
Map contour line for ElevGmax
Map circle with center on diversion location and radius equal to 0.8LS
Estimate depth of cover (DC): DC = ElevG - (WLmax + F + TT)
Increase Slope (SS)
Decrease Slope (SS)
Pipe Diameter ≤48”?(see Note 1)
Depth of Cover >2’?
Upstream crown of influent gravity sewer
below overflow elevation?
Establishing Boundary for When WLmax = ElevO
Establishing Boundary for When WLmax < ElevO
Use Drop Structureto Lower Crown?
NO
YES
YES
SeeProcess Diagram
#2
Process Diagram #1: Establishing Approximate Boundary of Potential Sites for CSO Storage Tanks
Establish Boundary byMaximum Conveyance Length
Establish Boundaryby Maximum Ground Surface Elevation
NO
NO
YES
NO
YES
YES
Area too limited?
Maximum Ground Surface Elevation contour outside
Maximum Conveyance Length circle?
YES
NO
NO
Set:Max. Excavation Depth (DEmax) = 50’Max. Water Surface Level (WLmax) = ElevOCSO Storage Water Depth (DW) = 20’CSO Storage Tank Slope (ST) = 2%CSO Storage Tank Length (LT): From alternative evaluationCSO Storage Tank Bottom Slab Thickness (TB) = 4’
Set:Influent Gravity Sewer Slope (SS) = 0.5% (= 0.005 ft/ft) [Initial Setting]
Set:Influent Gravity Sewer Upstream Invert (IEU) = Regulator Station (or Diversion Structure) Invert ElevationInfluent Gravity Sewer Downstream Invert (IED) = Ground Surface Elev. (ElevG) - 20’ (or up to 25’)
Estimate Max. Ground Surface Elev. (ElevGmax):ElevGmax = DEmax + (WLmax - DW - (ST * LT) - TB)
2
1
1
3
4
5
6
6
6
6
6
6
6
6
5
44
44
4
3
3 33
2
2
A
C
C
B
D
DE
E
B
A
Note 1: The diameter of the influent gravity sewer was greater than 48 inches for some alternatives:
• Collaborative alternatives (same slope was assumed as for independent, but pipe diameter was increased due to increased flow from SPU)• Alternatives in which microtunneling was required• Alternatives in which the boundary of potential sites was too limited if the slope was increased and diameter was reduced to 48 inches.
Diversion Location(Regulator Station)
Storage LocationInfluent Gravity Sewer
Overflow
Influent Gravity Sewer Upstream Invert (IEU)
To CSO Outfall
Influent Gravity Sewer Downstream Invert (IED)
InfluentGravity Sewer DownstreamInvert (IEDn)
Influent Gravity Sewer Slope (SS)
Maximum Conveyance Length (LS)
Overflow Elev.(ElevO)
Storage LocationInfluentGravitySewer
CSO Storage Tank Slope (ST)
Ground Surface Elev.(ElevGn)
Radius of Circular Path = 0.8LS
CSO Storage Tank Length (LT)
Max. WaterSurface Level(WLmaxn)
CSO Storage Tank BottomSlab Thickness (TB)
CSO Storage WaterDepth (DW)
MaximumExcavationDepth (DEmax)
DiversionLocationLocationDiversionLocation
0.8LS10.8LS1
0.8L S
3
0.8L S
3
0.8LS 2
0.8LS 2
ElevG1ElevG1
ElevG2ElevG2
ElevG3ElevG3
Boundary of PotentialCSO Storage Tank SitesCSO Storage Tank SitesBoundary of Potential
CSO Storage Tank Sites
King CountyInterceptorOverflow
Weiror Gate
Weir
Overflow Elev. to CSOStorage Tank (ElevS)ElevS < ElevO
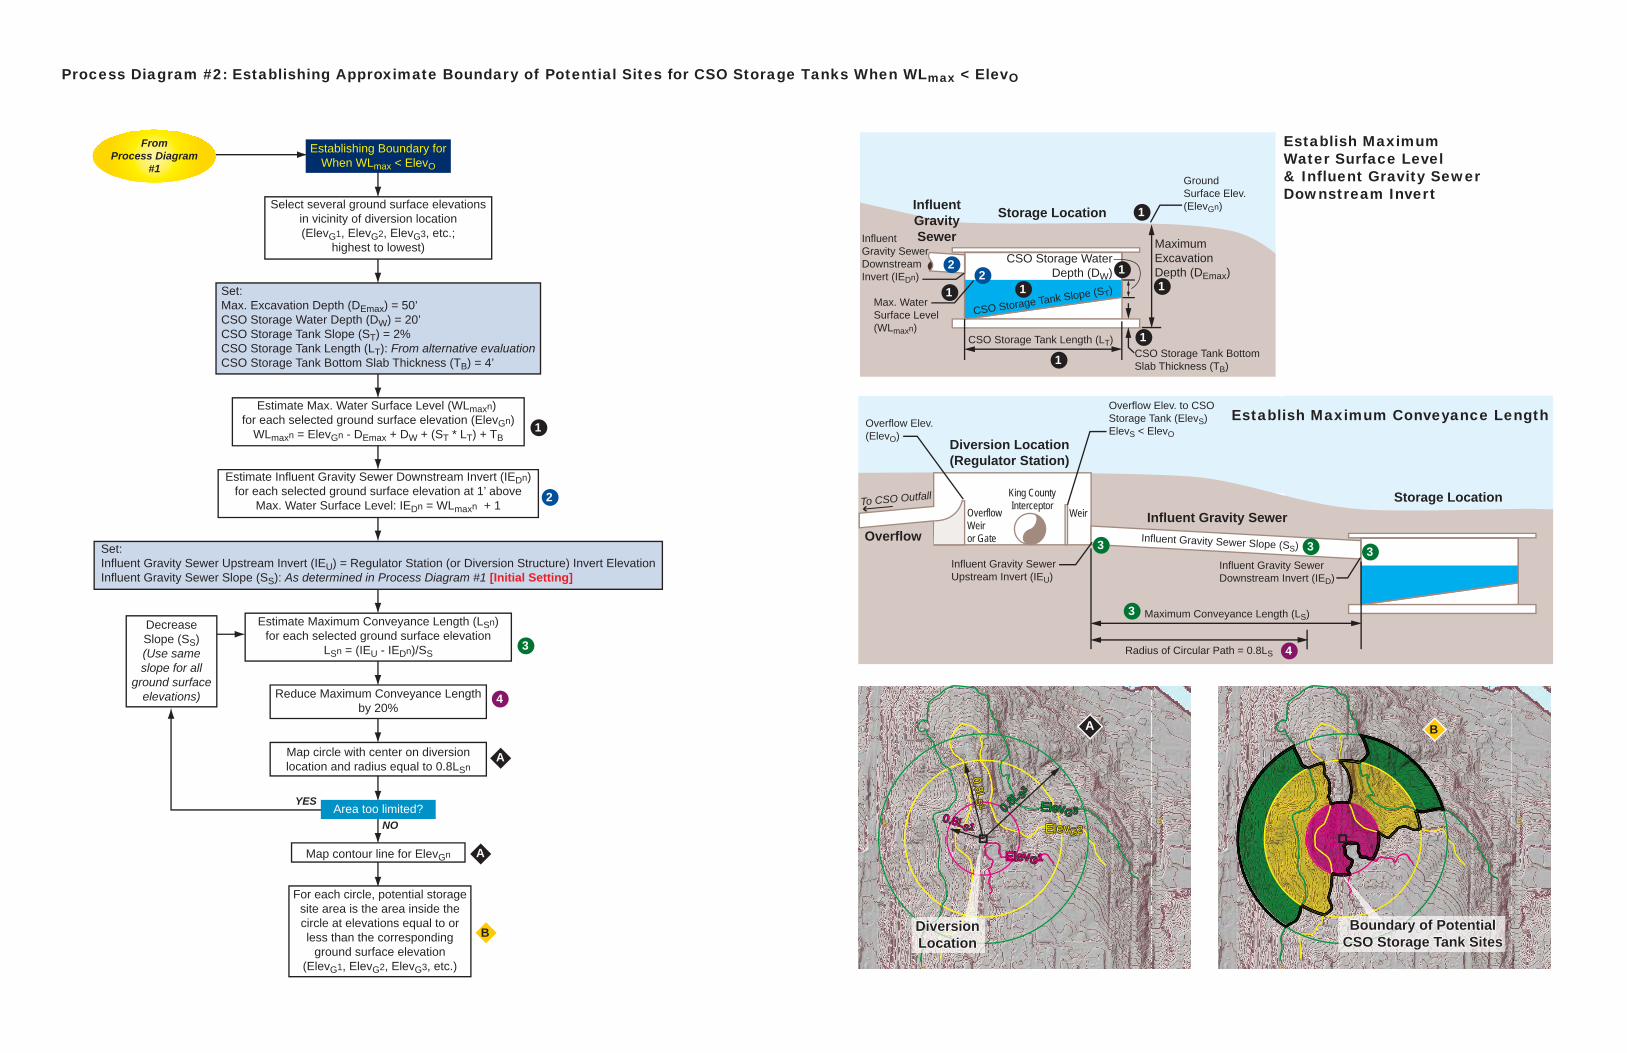
Process Diagram #2: Establishing Approximate Boundary of Potential Sites for CSO Storage Tanks When WLmax < ElevO
Establish Maximum Conveyance Length
Establish Maximum Water Surface Level& Influent Gravity Sewer Downstream Invert
Select several ground surface elevations in vicinity of diversion location(ElevG1, ElevG2, ElevG3, etc.;
highest to lowest)
Decrease Slope (SS)(Use same slope for all
ground surface elevations)
Establishing Boundary for When WLmax < ElevO
FromProcess Diagram
#1
For each circle, potential storage site area is the area inside the circle at elevations equal to or less than the corresponding
ground surface elevation (ElevG1, ElevG2, ElevG3, etc.)
Map contour line for ElevGn
Reduce Maximum Conveyance Length by 20%
Map circle with center on diversion location and radius equal to 0.8LSn
Area too limited?YES
NO
Set:Max. Excavation Depth (DEmax) = 50’CSO Storage Water Depth (DW) = 20’CSO Storage Tank Slope (ST) = 2%CSO Storage Tank Length (LT): From alternative evaluationCSO Storage Tank Bottom Slab Thickness (TB) = 4’
Set:Influent Gravity Sewer Upstream Invert (IEU) = Regulator Station (or Diversion Structure) Invert ElevationInfluent Gravity Sewer Slope (SS): As determined in Process Diagram #1 [Initial Setting]
Estimate Max. Water Surface Level (WLmaxn) for each selected ground surface elevation (ElevGn)
WLmaxn = ElevGn - DEmax + DW + (ST * LT) + TB
Estimate Influent Gravity Sewer Downstream Invert (IEDn)for each selected ground surface elevation at 1’ above
Max. Water Surface Level: IEDn = WLmaxn + 1
Estimate Maximum Conveyance Length (LSn)for each selected ground surface elevation
LSn = (IEU - IEDn)/SS
1
1
1
11
1
1
1
4
43
3
3
33
22
2
A
A
A
B
B
TM 970, CSO Control Alternatives Development (October 2011)
Appendix F.2
Storage Pipe Design Criteria

This page left blank intentionally.
King County 2012 CSO Control Program Review STORAGE PIPE DESIGN CRITERIA
Storage Pipe Design Criteria 1 of 3 3/31/2011
Facility Component Design Criteria Footprint Criteria
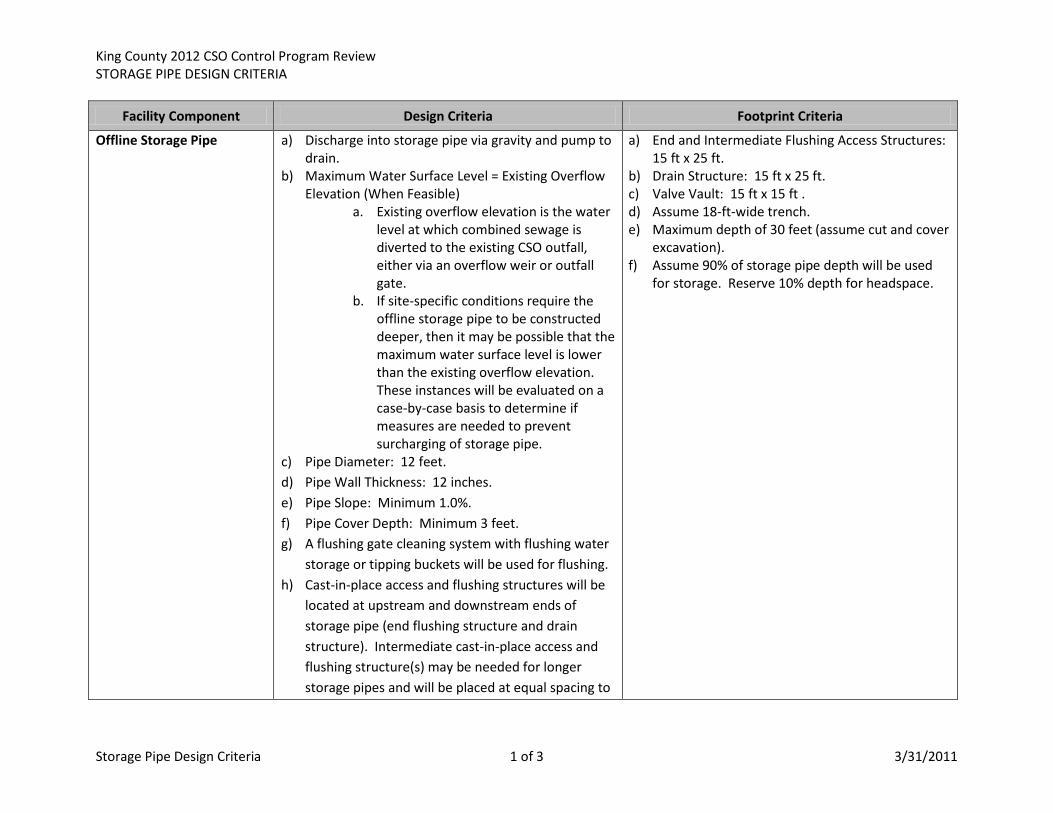
Offline Storage Pipe a) Discharge into storage pipe via gravity and pump to drain.
b) Maximum Water Surface Level = Existing Overflow Elevation (When Feasible)
a. Existing overflow elevation is the water level at which combined sewage is diverted to the existing CSO outfall, either via an overflow weir or outfall gate.
b. If site-specific conditions require the offline storage pipe to be constructed deeper, then it may be possible that the maximum water surface level is lower than the existing overflow elevation. These instances will be evaluated on a case-by-case basis to determine if measures are needed to prevent surcharging of storage pipe.
c) Pipe Diameter: 12 feet. d) Pipe Wall Thickness: 12 inches. e) Pipe Slope: Minimum 1.0%. f) Pipe Cover Depth: Minimum 3 feet. g) A flushing gate cleaning system with flushing water
storage or tipping buckets will be used for flushing. h) Cast-in-place access and flushing structures will be
located at upstream and downstream ends of storage pipe (end flushing structure and drain structure). Intermediate cast-in-place access and flushing structure(s) may be needed for longer storage pipes and will be placed at equal spacing to
a) End and Intermediate Flushing Access Structures: 15 ft x 25 ft.
b) Drain Structure: 15 ft x 25 ft. c) Valve Vault: 15 ft x 15 ft . d) Assume 18-ft-wide trench. e) Maximum depth of 30 feet (assume cut and cover
excavation). f) Assume 90% of storage pipe depth will be used
for storage. Reserve 10% depth for headspace.
King County 2012 CSO Control Program Review STORAGE PIPE DESIGN CRITERIA
Storage Pipe Design Criteria 2 of 3 3/31/2011
Facility Component Design Criteria Footprint Criteria
allow the same storage volume to be held at each flushing structure.
i) Valve vault will house control valves and a common header for drain pumping system.
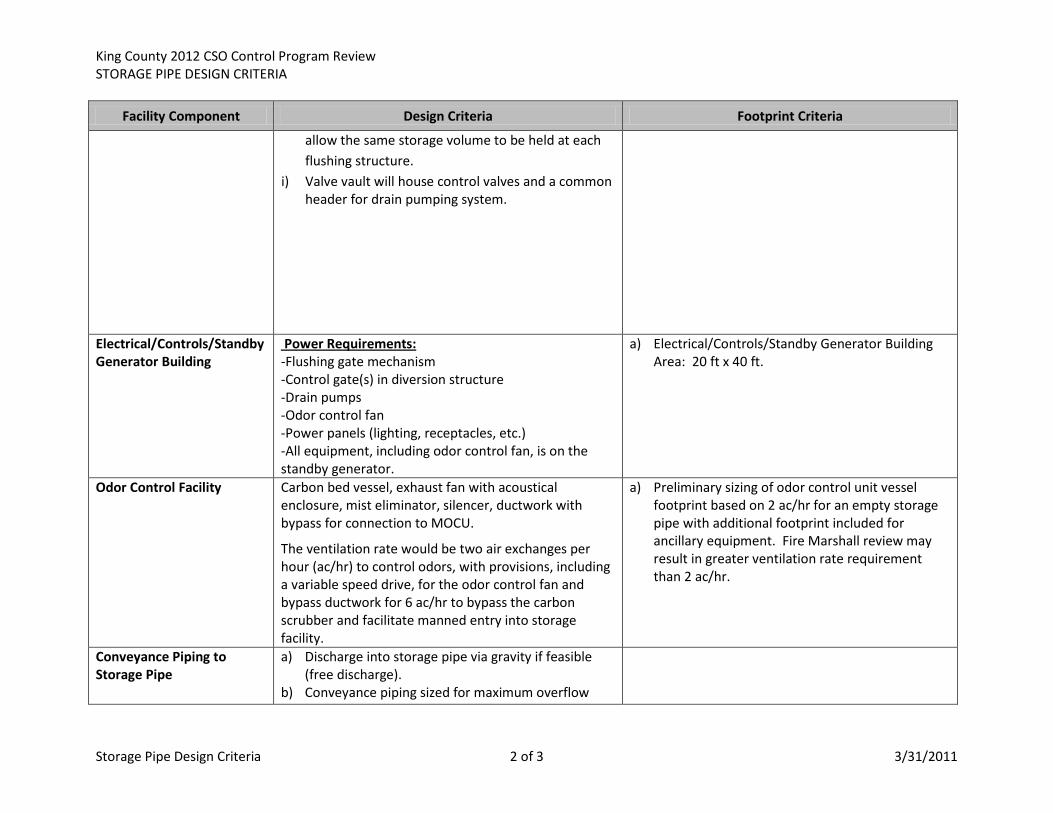
Electrical/Controls/Standby Generator Building
Power Requirements: -Flushing gate mechanism -Control gate(s) in diversion structure -Drain pumps -Odor control fan -Power panels (lighting, receptacles, etc.) -All equipment, including odor control fan, is on the standby generator.
a) Electrical/Controls/Standby Generator Building Area: 20 ft x 40 ft.
Odor Control Facility Carbon bed vessel, exhaust fan with acoustical enclosure, mist eliminator, silencer, ductwork with bypass for connection to MOCU.
The ventilation rate would be two air exchanges per hour (ac/hr) to control odors, with provisions, including a variable speed drive, for the odor control fan and bypass ductwork for 6 ac/hr to bypass the carbon scrubber and facilitate manned entry into storage facility.
a) Preliminary sizing of odor control unit vessel footprint based on 2 ac/hr for an empty storage pipe with additional footprint included for ancillary equipment. Fire Marshall review may result in greater ventilation rate requirement than 2 ac/hr.
Conveyance Piping to Storage Pipe
a) Discharge into storage pipe via gravity if feasible (free discharge).
b) Conveyance piping sized for maximum overflow

King County 2012 CSO Control Program Review STORAGE PIPE DESIGN CRITERIA
Storage Pipe Design Criteria 3 of 3 3/31/2011
Facility Component Design Criteria Footprint Criteria
rate of events that are at or less than 1-year recurrence by volume based on King County 32-year model simulations.
c) Assume velocity is 3 feet per second for sizing conveyance piping
Force Main (Draining Storage Pipe) and Drain Pumping System
a) Single force main. b) Design to accommodate storage facility drawdown
in 12 hours. c) Maintain a velocity between 4 and 10 feet per
second.
a) Submersible pumps are located within the drain structure, which is included in the offline storage pipe footprint.
Diversion Structure a) Locate diversion structure as required to convey combined sewage to storage pipe.
b) Diversion structure consists of overflow weirs and gates. Details of operation will be determined during predesign.
c) Elevation of new overflow weir that diverts combined sewage to storage pipe is below the existing overflow elevation (water level at which combined sewage is diverted to the existing CSO outfall, either via an overflow weir or outfall gate).
Assume standard 15’ x 15’ footprint.
C2 Water Service C2 Water System for Flushing: Air break tank Booster pumps Backflow preventer
Assume included in equipment building.

Diversion Location(Regulator Station)
CSO Storage Pipe
Overflow
Drainage Force MainKing CountyInterceptor
OverflowWeir
To CSOOutfall
GroundSurface
Overflow Elev.(ElevO)
Max. WaterSurface Level= ElevO
Invert Elevation= ElevO - 9/10 * D
Storage PipeDiameter (D)= 12’
Maximum Depth= 9/10 * D
Influent Pipe(Size for 3 ft/sec;
minimize head loss)
SubmersiblePumps in Sump
AccessStructure
Weir
CSO Storage Pipe Slope = 1%
Depth ofCover = 3’ min.
Max
imum
Exc
avat
ion
Dep
th ≤
30’
CSO Storage Pipe Design Criteria

TM 970, CSO Control Alternatives Development (October 2011)
Appendix F.3
Wet-Weather Treatment Facility Design Criteria

This page left blank intentionally.
King County 2012 CSO Control Program Review WET-WEATHER TREATMENT FACILITY DESIGN CRITERIA
WWTF Design Criteria 1 of 8 4/05/2011
PURPOSE
Develop peak flow rate (MGD) versus footprint (acres) sizing curves for alternative evaluations of wet-weather treatment facilities (WWTFs) using ballasted sedimentation and chemically enhanced primary treatment (CEPT) with lamella plate as part of the King County 2012 CSO Control Program Review (Program Review). Data points are based on existing WWTFs or facilities that are currently in design.
STEP 1) Define Representative Wet-Weather Treatment Facilities.
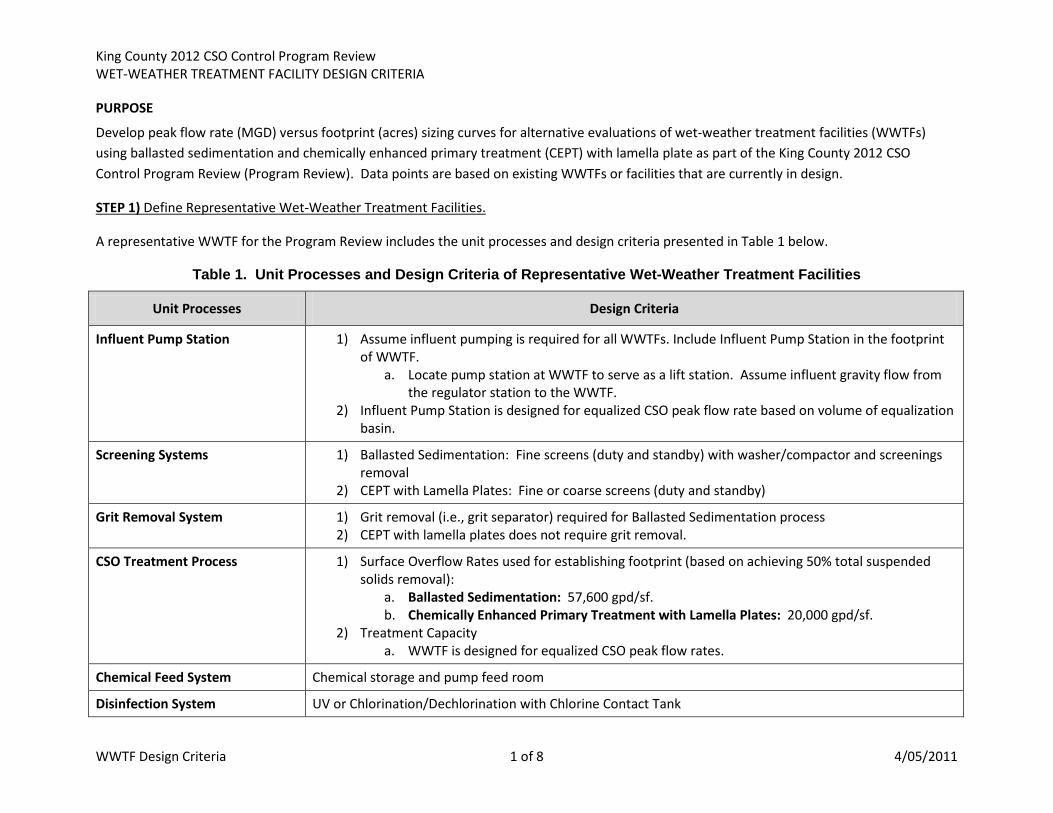
A representative WWTF for the Program Review includes the unit processes and design criteria presented in Table 1 below.
Table 1. Unit Processes and Design Criteria of Representative Wet-Weather Treatment Facilities
Unit Processes Design Criteria
Influent Pump Station 1) Assume influent pumping is required for all WWTFs. Include Influent Pump Station in the footprint of WWTF.
a. Locate pump station at WWTF to serve as a lift station. Assume influent gravity flow from the regulator station to the WWTF.
2) Influent Pump Station is designed for equalized CSO peak flow rate based on volume of equalization basin.
Screening Systems 1) Ballasted Sedimentation: Fine screens (duty and standby) with washer/compactor and screenings removal
2) CEPT with Lamella Plates: Fine or coarse screens (duty and standby)
Grit Removal System 1) Grit removal (i.e., grit separator) required for Ballasted Sedimentation process 2) CEPT with lamella plates does not require grit removal.
CSO Treatment Process 1) Surface Overflow Rates used for establishing footprint (based on achieving 50% total suspended solids removal):
a. Ballasted Sedimentation: 57,600 gpd/sf. b. Chemically Enhanced Primary Treatment with Lamella Plates: 20,000 gpd/sf.
2) Treatment Capacity a. WWTF is designed for equalized CSO peak flow rates.
Chemical Feed System Chemical storage and pump feed room
Disinfection System UV or Chlorination/Dechlorination with Chlorine Contact Tank

King County 2012 CSO Control Program Review WET-WEATHER TREATMENT FACILITY DESIGN CRITERIA
WWTF Design Criteria 2 of 8 4/05/2011
Unit Processes Design Criteria
Electrical/Controls Building
Generator
Odor Control Facility 1) Assume vapor phase (carbon scrubber) odor control.
Solids Handling Facility 1) Solids handling facility includes separate sludge storage for ballasted sedimentation consisting of a separate solids thickening clarifier.
a. For cost estimating purposes, solids thickening clarifier will be sized with the following assumptions: 1) Design flow = 5% of equalized CSO peak flow rate, 2) surface overflow rate of 800 gpd/sf , and 3) side-water depth of 15 feet.
2) For CEPT processes, a separate solids handling facility is not required because solids storage is available in the larger surface area settling basin of a CEPT facility. Therefore, the solids handling facility footprint was removed or not included for developing the representative footprint curve of wet-weather treatment facilities using CEPT with lamella plates. However, the need for a separate solids handling facility will be evaluated and discussed based on the specific wet-weather treatment facility alternatives.
Other Facilities 1) Account for parking, restrooms, lab, sampling and metering facilities, property setbacks, etc.
CSO Outfall Pipe
1) Existing CSO outfall pipe has adequate capacity to handle the equalized CSO peak flow rates within each uncontrolled CSO basin (independent alternatives).
a. Existing CSO outfall, including conveyance piping to outfall, will be used for combined discharge of untreated and treated CSOs.
b. Existing CSO outfall will be extended to middle of waterway assuming the same pipe diameter as the existing CSO outfall. Assume open-ended pipe discharge.
2) New CSO outfall will be required for consolidated alternatives in which one CSO basin and outfall handles CSOs from multiple CSO basins. Sizing of new CSO outfall:
a. New CSO outfall is sized for equalized CSO peak flow rate. b. New CSO outfall pipe discharges to middle of receiving water body. c. Outfall pipe operates as a pressure pipe during an overflow event.
The preliminary outfall assumptions listed above were used during the alternatives development and evaluation process. Refined outfall design concepts and cost estimates were prepared separately from this technical memorandum and are included in Technical Memorandum 954.03, Preliminary CSO Outfall Concepts Analysis.
King County 2012 CSO Control Program Review WET-WEATHER TREATMENT FACILITY DESIGN CRITERIA
WWTF Design Criteria 3 of 8 4/05/2011
Note: WWTF footprint assumes treated CSOs are diverted to the CSO outfall via gravity, and effluent pumping is not required.
STEP 2) Estimate Footprints of Existing Wet-Weather Treatment Facilities Using Ballasted Sedimentation.
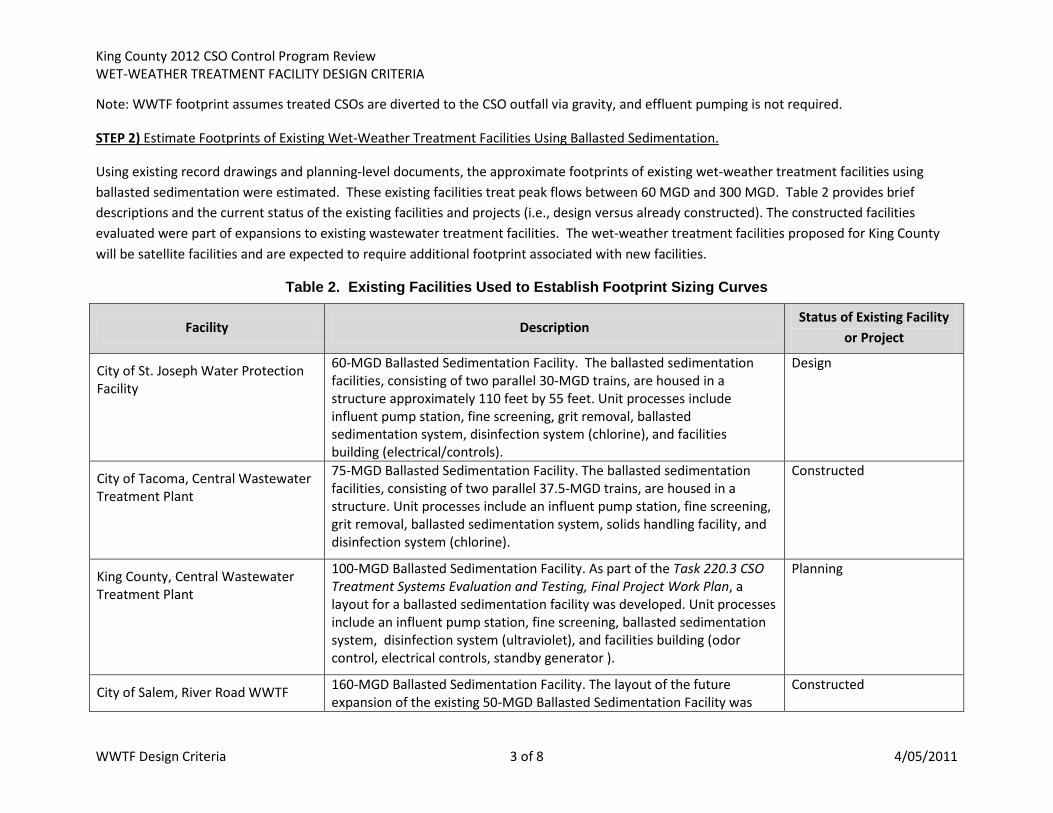
Using existing record drawings and planning-level documents, the approximate footprints of existing wet-weather treatment facilities using ballasted sedimentation were estimated. These existing facilities treat peak flows between 60 MGD and 300 MGD. Table 2 provides brief descriptions and the current status of the existing facilities and projects (i.e., design versus already constructed). The constructed facilities evaluated were part of expansions to existing wastewater treatment facilities. The wet-weather treatment facilities proposed for King County will be satellite facilities and are expected to require additional footprint associated with new facilities.
Table 2. Existing Facilities Used to Establish Footprint Sizing Curves
Facility Description Status of Existing Facility
or Project
City of St. Joseph Water Protection Facility
60-MGD Ballasted Sedimentation Facility. The ballasted sedimentation facilities, consisting of two parallel 30-MGD trains, are housed in a structure approximately 110 feet by 55 feet. Unit processes include influent pump station, fine screening, grit removal, ballasted sedimentation system, disinfection system (chlorine), and facilities building (electrical/controls).
Design
City of Tacoma, Central Wastewater Treatment Plant
75-MGD Ballasted Sedimentation Facility. The ballasted sedimentation facilities, consisting of two parallel 37.5-MGD trains, are housed in a structure. Unit processes include an influent pump station, fine screening, grit removal, ballasted sedimentation system, solids handling facility, and disinfection system (chlorine).
Constructed
King County, Central Wastewater Treatment Plant
100-MGD Ballasted Sedimentation Facility. As part of the Task 220.3 CSO Treatment Systems Evaluation and Testing, Final Project Work Plan, a layout for a ballasted sedimentation facility was developed. Unit processes include an influent pump station, fine screening, ballasted sedimentation system, disinfection system (ultraviolet), and facilities building (odor control, electrical controls, standby generator ).
Planning
City of Salem, River Road WWTF 160-MGD Ballasted Sedimentation Facility. The layout of the future expansion of the existing 50-MGD Ballasted Sedimentation Facility was
Constructed

King County 2012 CSO Control Program Review WET-WEATHER TREATMENT FACILITY DESIGN CRITERIA
WWTF Design Criteria 4 of 8 4/05/2011
Facility Description Status of Existing Facility
or Project
included. Unit processes include an influent pump station, fine screening, ballasted sedimentation system, disinfection system (ultraviolet), and facilities building (odor control and electrical controls).
City of Toledo, Bayview WWTF 232-MGD Ballasted Sedimentation Facility. The ballasted sedimentation facilities are part of a 400-MGD wet-weather treatment facility expansion, consisting of 60-MGD trains. Unit processes include fine screening, grit removal, ballasted sedimentation system, solids handling facility, disinfection system, and facilities building (electrical controls).
Constructed
Alcosan Facility 300-MGD Ballasted Sedimentation Facility. The ballasted sedimentation facility is a new wet-weather treatment facility. Unit processes include an influent pump station, fine screening, grit removal, ballasted sedimentation system, solids handling facility, disinfection system (chlorine), and facilities building (electrical controls).
Design
STEP 3) Adjust Footprints of Existing Facilities to Develop Representative Wet-Weather Treatment Facility Footprints
Common elements of the existing facilities (Table 1) include fine screening, ballasted sedimentation system, and a disinfection system. However, there were unit processes identified in the representative wet-weather treatment facility footprint (Table 2) that were not included in the existing facilities evaluated. Therefore, the footprints of the existing facilities were adjusted to include the unit processes identified as part of a representative CSO treatment process. Table 3 summarizes the percent adjustments assigned to each unit process that were used to normalize the footprints of the existing facilities.
King County 2012 CSO Control Program Review WET-WEATHER TREATMENT FACILITY DESIGN CRITERIA
WWTF Design Criteria 5 of 8 4/05/2011
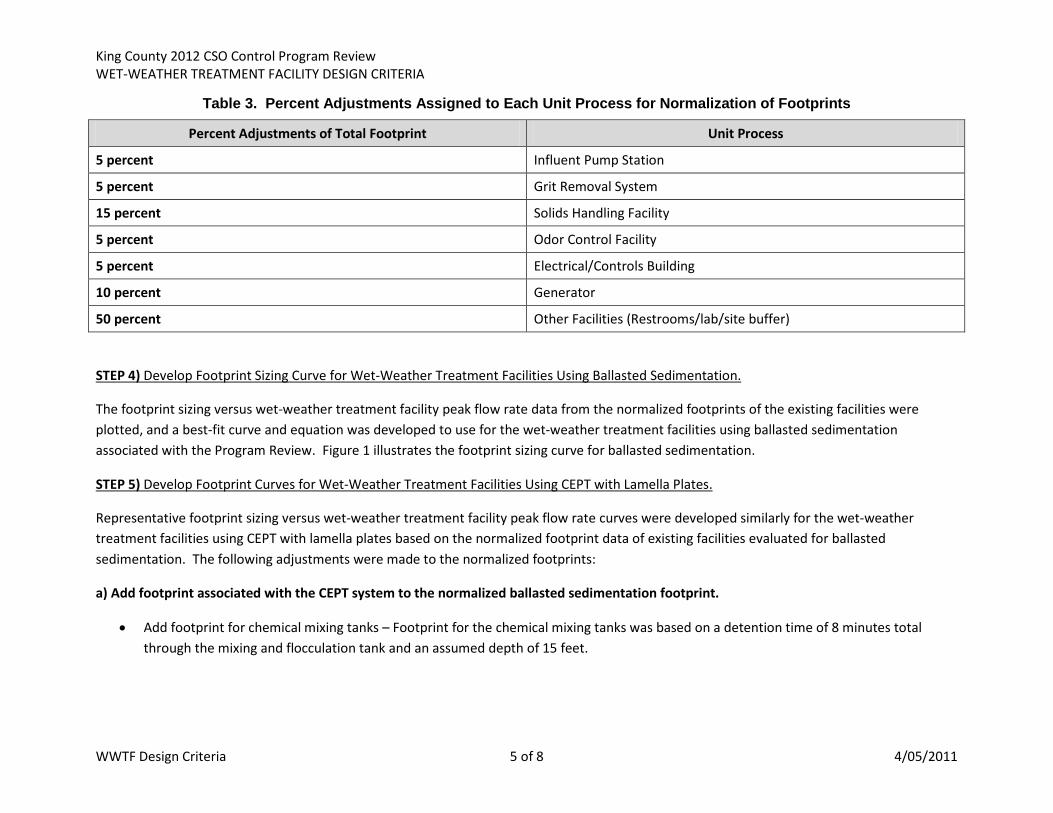
Table 3. Percent Adjustments Assigned to Each Unit Process for Normalization of Footprints
Percent Adjustments of Total Footprint Unit Process
5 percent Influent Pump Station
5 percent Grit Removal System
15 percent Solids Handling Facility
5 percent Odor Control Facility
5 percent Electrical/Controls Building
10 percent Generator
50 percent Other Facilities (Restrooms/lab/site buffer)
STEP 4) Develop Footprint Sizing Curve for Wet-Weather Treatment Facilities Using Ballasted Sedimentation.
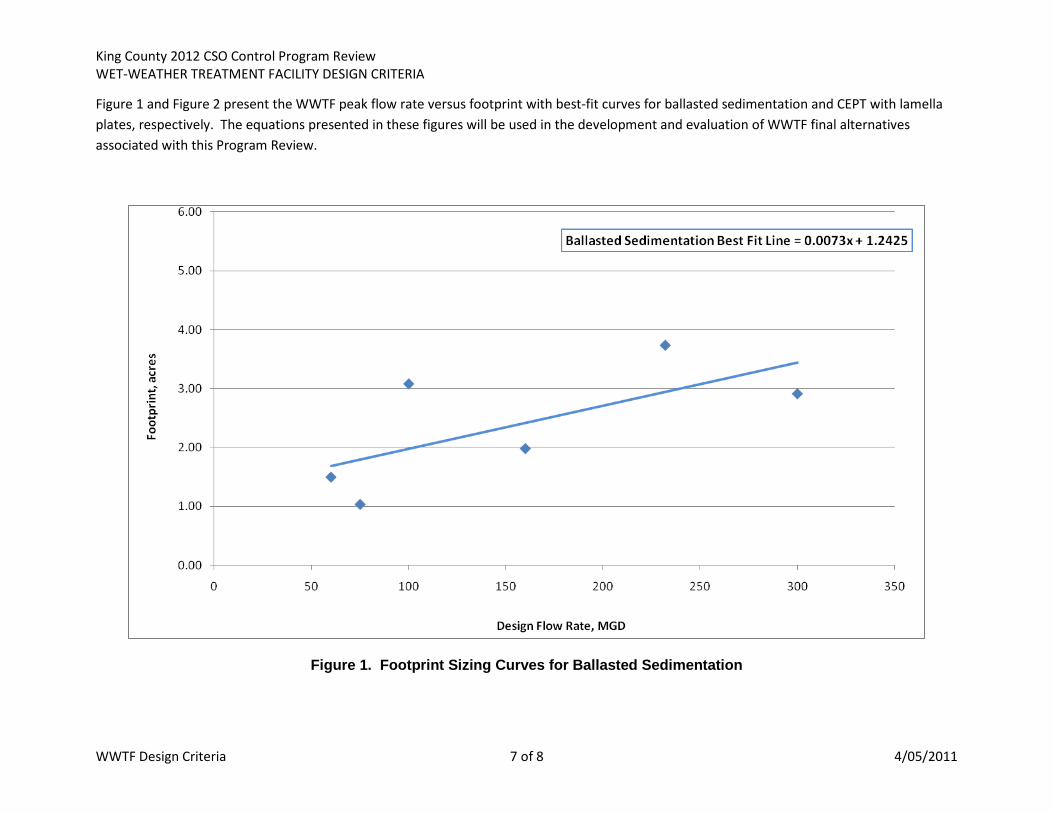
The footprint sizing versus wet-weather treatment facility peak flow rate data from the normalized footprints of the existing facilities were plotted, and a best-fit curve and equation was developed to use for the wet-weather treatment facilities using ballasted sedimentation associated with the Program Review. Figure 1 illustrates the footprint sizing curve for ballasted sedimentation.
STEP 5) Develop Footprint Curves for Wet-Weather Treatment Facilities Using CEPT with Lamella Plates.
Representative footprint sizing versus wet-weather treatment facility peak flow rate curves were developed similarly for the wet-weather treatment facilities using CEPT with lamella plates based on the normalized footprint data of existing facilities evaluated for ballasted sedimentation. The following adjustments were made to the normalized footprints:
a) Add footprint associated with the CEPT system to the normalized ballasted sedimentation footprint.
• Add footprint for chemical mixing tanks – Footprint for the chemical mixing tanks was based on a detention time of 8 minutes total through the mixing and flocculation tank and an assumed depth of 15 feet.

King County 2012 CSO Control Program Review WET-WEATHER TREATMENT FACILITY DESIGN CRITERIA
WWTF Design Criteria 6 of 8 4/05/2011
For example, the footprint of the chemical mixing tank for River Road WWTF (160 MGD) was based on approximately an 888,900-gallon tank required for a detention time of 8 minutes, which equates to approximately 7,920 sf based on a 15-foot-deep tank. The chemical mixing tank footprint was multiplied by 1.5 for contingency.
• Add footprint for increased settling basin – Calculate additional footprint due to CEPT with lamella plates at a lower surface overflow rate (SOR) of 20,000 gpd/sf compared to the SOR of 57,600 gpd/sf for ballasted sedimentation.
For example, the footprint associated with the ballasted sedimentation settling basin for River Road WWTF (160 MGD) was calculated based on a SOR of 57,600 gpd/sf, which equates to approximately 2,778 sf. The footprint associated with the CEPT with lamella plates settling basin for River Road WWTF (160 MGD) was then calculated based on a SOR of 20,000 gpd/sf, which equates to approximately 8,000 sf. This footprint is then multiplied by 1.5 for contingency, resulting in a footprint of approximately 12,000 sf for the CEPT with lamella plates settling basin.
b) Remove footprints of unit processes associated with the wet-weather treatment facility using ballasted sedimentation that would not be part of the CEPT unit processes.
• Remove grit removal facility footprint – Grit removal is not required in a CEPT facility. Footprint for grit removal was removed based on the existing grit removal footprint of the existing facility or based on the adjustment percentage of 5 percent of the total facility footprint.
• Remove solids handling facility footprint - Typically a separate solids handling facility is not required because solids storage is available in the larger surface area settling basin of a CEPT facility. Therefore, the solids handling facility footprint was removed for developing the representative footprint sizing curve of wet-weather treatment facilities using CEPT with lamella plates. However, the need for solid handling will be evaluated and discussed based on the specific wet-weather treatment facility alternatives.
• Apply a contingency of 1.5 to the estimated footprint.
The footprint sizing versus wet-weather treatment facility peak flow rate data from the adjusted footprints for wet-weather treatment facilities using CEPT with lamella plates were plotted, and a best-fit curve and equation was developed to use for the wet-weather treatment facilities using CEPT with lamella plates associated with the Program Review. Figure 2 illustrates the footprint sizing curve for CEPT with lamella plates.
King County 2012 CSO Control Program Review WET-WEATHER TREATMENT FACILITY DESIGN CRITERIA
WWTF Design Criteria 7 of 8 4/05/2011
Figure 1 and Figure 2 present the WWTF peak flow rate versus footprint with best-fit curves for ballasted sedimentation and CEPT with lamella plates, respectively. The equations presented in these figures will be used in the development and evaluation of WWTF final alternatives associated with this Program Review.
Figure 1. Footprint Sizing Curves for Ballasted Sedimentation

King County 2012 CSO Control Program Review WET-WEATHER TREATMENT FACILITY DESIGN CRITERIA
WWTF Design Criteria 8 of 8 4/05/2011
Figure 2. Footprint Sizing Curves for Chemically Enhanced Primary Treatment with Lamella Plates
Diversion Location(Regulator Station)
Wet-Weather Treatment Facility
Wet-Weather Treatment Facility
Effluent Gravity SewerDownstream Invert (IEEffD)(see Note 2)
Effluent Gravity Sewer Downstream Crown (CEEffD)(see Note 2)
Effluent Gravity Sewer Upstream Invert (IEEffU)
Effluent Gravity Sewer Upstream Crown (CEEffU)
King CountyInterceptor
InfluentPump
Stattion
EqualizationBasin
Influent Gravity Sewer
Effluent Gravity Sewer
OverflowWeiror Gate
OverflowTo CSO Outfall
Effluent Gravity Sewer Slope (SE)
Ground SurfaceElev. (ElevG)
Maximum Conveyance Length (LE)
Overflow Elev.(ElevO)
Overflow Elev. to CSOTreatment (ElevT)ElevT < ElevO
Ground SurfaceElev. (ElevG)
Overflow Elev. to CSOTreatment (ElevT)ElevT < ElevO
Effluent Gravity SewerDiameter (DE)
DiversionLocation
LE or L
I
Weir
Diversion Location(Regulator Station)
Influent Gravity Sewer Upstream Invert (IEInU)
Influent Gravity Sewer Upstream Crown (CEInU)
Influent Gravity Sewer Downstream Invert (IEInD)
King CountyInterceptor
InfluentPump
Stattion
EqualizationBasin
OverflowWeiror Gate
OverflowTo CSO Outfall
Influent Gravity Sewer Slope (SI)
Maximum Conveyance Length (LE or LI)
Overflow Elev.(ElevO)
Influent GravitySewer Diameter(DI)
Depth Below Ground, 25’ max. Weir
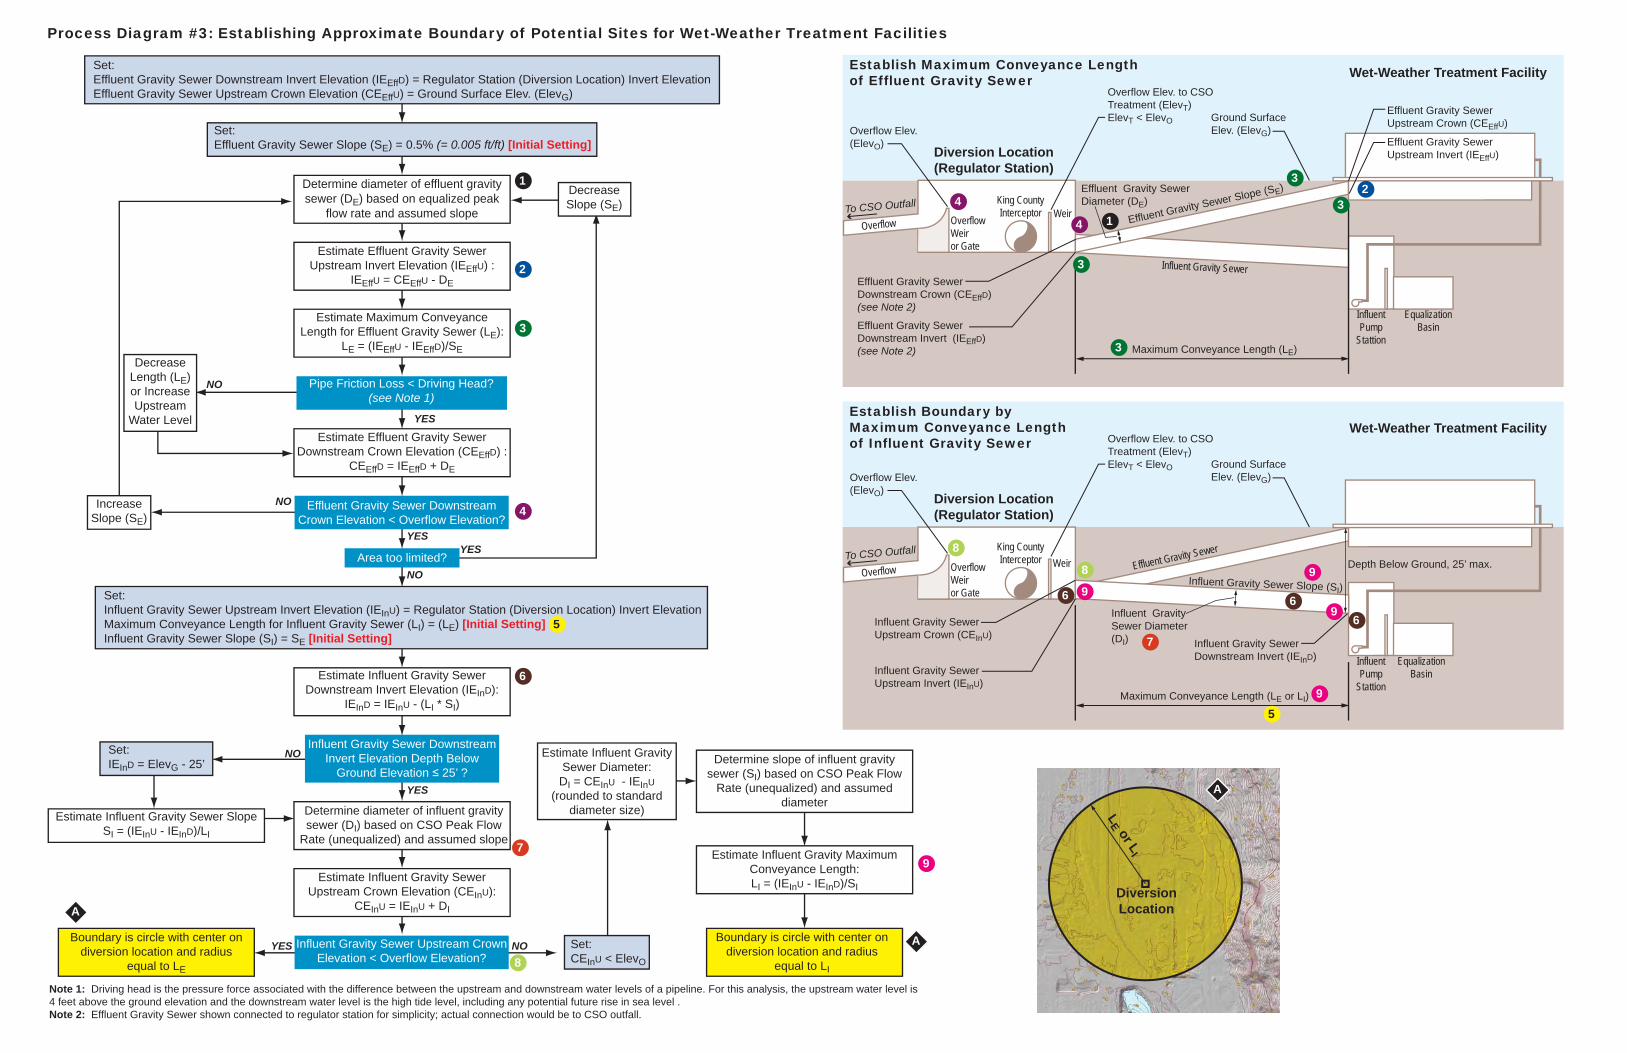
Determine diameter of effluent gravity sewer (DE) based on equalized peak
flow rate and assumed slope
Determine diameter of influent gravity sewer (DI) based on CSO Peak Flow
Rate (unequalized) and assumed slope
Determine slope of influent gravity sewer (SI) based on CSO Peak Flow
Rate (unequalized) and assumed diameter
Estimate Maximum Conveyance Length for Effluent Gravity Sewer (LE):
LE = (IEEffU - IEEffD)/SE
Estimate Effluent Gravity Sewer Upstream Invert Elevation (IEEffU) :
IEEffU = CEEffU - DE
Estimate Effluent Gravity Sewer Downstream Crown Elevation (CEEffD) :
CEEffD = IEEffD + DE
Estimate Influent Gravity Sewer Downstream Invert Elevation (IEInD):
IEInD = IEInU - (LI * SI)
Estimate Influent Gravity Sewer Slope SI = (IEInU - IEInD)/LI
Estimate Influent Gravity Maximum Conveyance Length:LI = (IEInU - IEInD)/SI
Boundary is circle with center on diversion location and radius
equal to LE
Boundary is circle with center on diversion location and radius
equal to LI
DecreaseSlope (SE)
Increase Slope (SE)
Decrease Length (LE) or Increase Upstream
Water Level
Effluent Gravity Sewer Downstream Crown Elevation < Overflow Elevation?
Influent Gravity Sewer Upstream Crown Elevation < Overflow Elevation?
Influent Gravity Sewer Downstream Invert Elevation Depth Below
Ground Elevation ≤ 25’ ?
NO
NO
Estimate Influent Gravity Sewer Upstream Crown Elevation (CEInU):
CEInU = IEInU + DI
Estimate Influent Gravity Sewer Diameter:DI = CEInU - IEInU
(rounded to standard diameter size)
NO
NO
Area too limited?YES
YES
YES
YES
NO
Pipe Friction Loss < Driving Head?(see Note 1)
YES
Set:Effluent Gravity Sewer Slope (SE) = 0.5% (= 0.005 ft/ft) [Initial Setting]
Set:Effluent Gravity Sewer Downstream Invert Elevation (IEEffD) = Regulator Station (Diversion Location) Invert ElevationEffluent Gravity Sewer Upstream Crown Elevation (CEEffU) = Ground Surface Elev. (ElevG)
Set:Influent Gravity Sewer Upstream Invert Elevation (IEInU) = Regulator Station (Diversion Location) Invert ElevationMaximum Conveyance Length for Influent Gravity Sewer (LI) = (LE) [Initial Setting]Influent Gravity Sewer Slope (SI) = SE [Initial Setting]
Set:IEInD = ElevG - 25’
Set:CEInU < ElevO
Note 1: Driving head is the pressure force associated with the difference between the upstream and downstream water levels of a pipeline. For this analysis, the upstream water level is 4 feet above the ground elevation and the downstream water level is the high tide level, including any potential future rise in sea level .Note 2: Effluent Gravity Sewer shown connected to regulator station for simplicity; actual connection would be to CSO outfall.
Process Diagram #3: Establishing Approximate Boundary of Potential Sites for Wet-Weather Treatment Facilities
Establish Maximum Conveyance Lengthof Effluent Gravity Sewer
Establish Boundary byMaximum Conveyance Lengthof Influent Gravity Sewer
1
1
2
2
3
3
3
3
3
4
4
4
6
5
5
6
66
7
8
9
9
99
9
8
8
7
A
A
A

This page left blank intentionally.

TM 970, CSO Control Alternatives Development (October 2011)
Appendix F.4
Optimum Capacity Assessment

This page left blank intentionally.
TM 970, CSO Control Alternatives Development (October 2011) F.4-1
Appendix F.4 Optimum Capacity Assessment
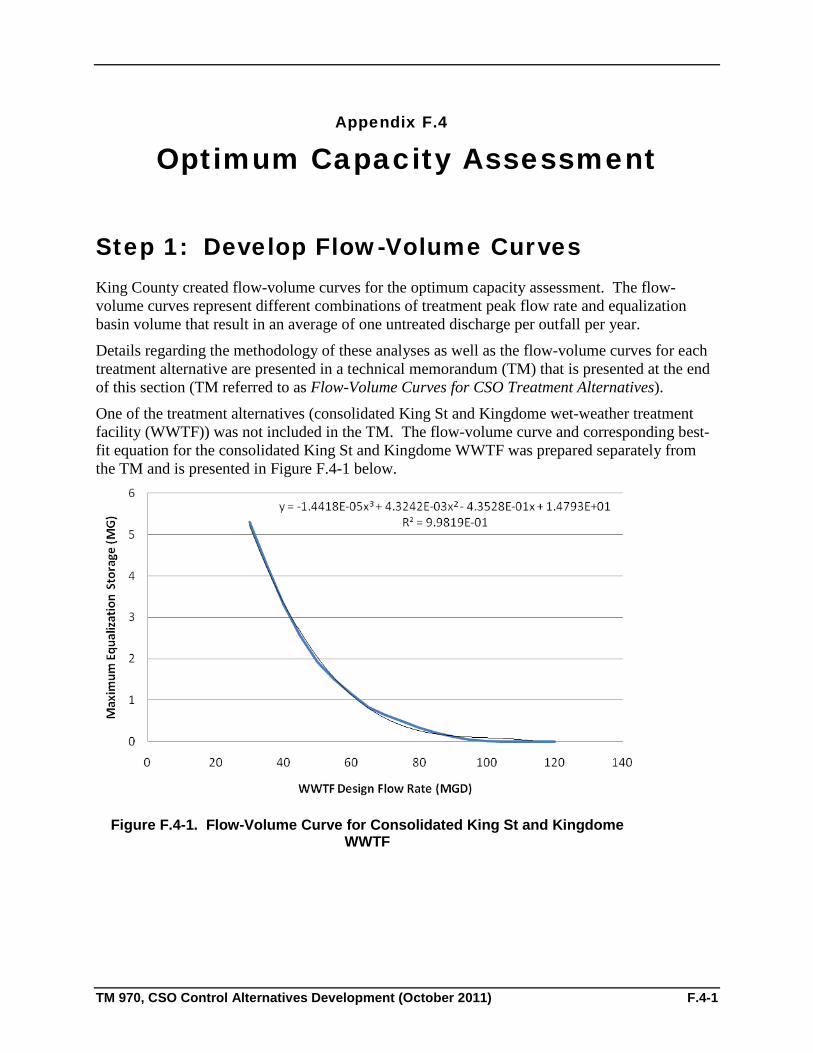
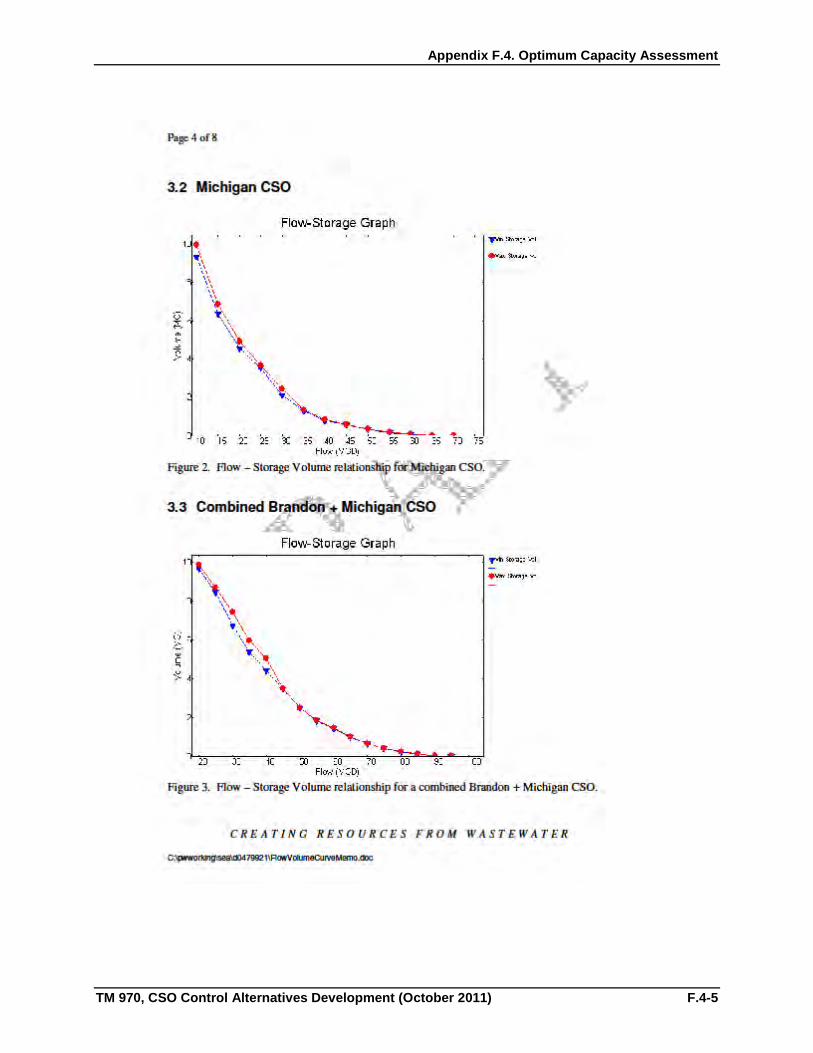
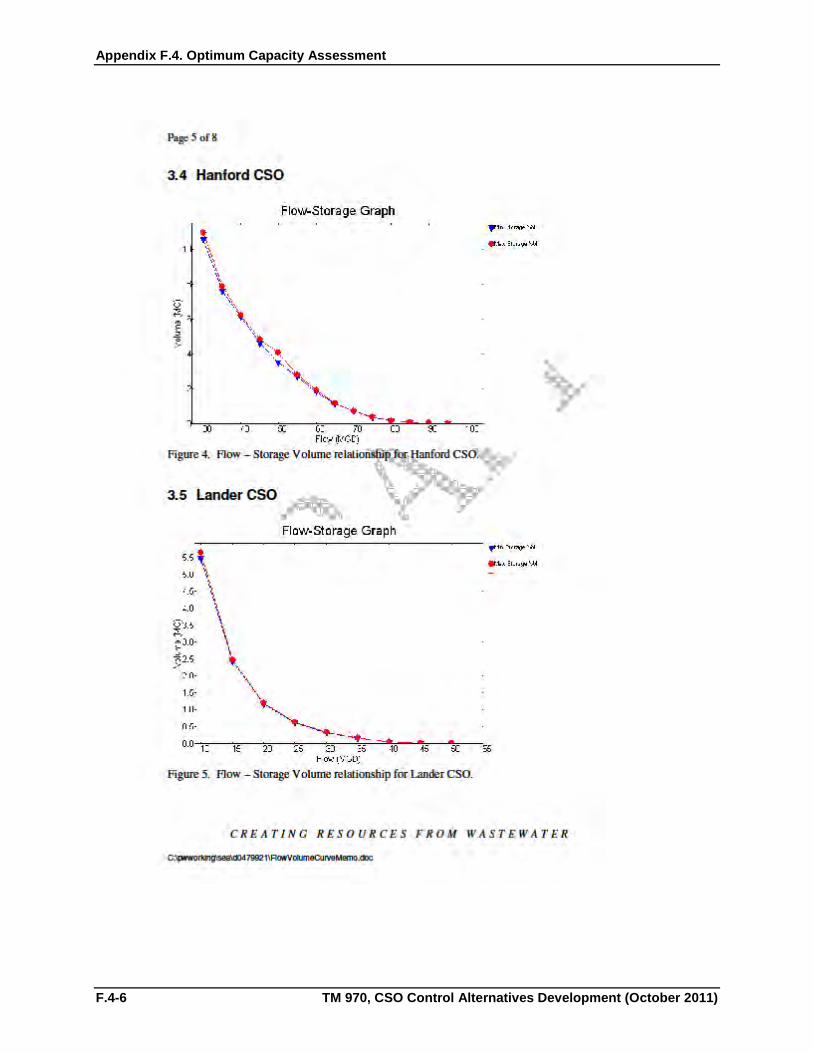
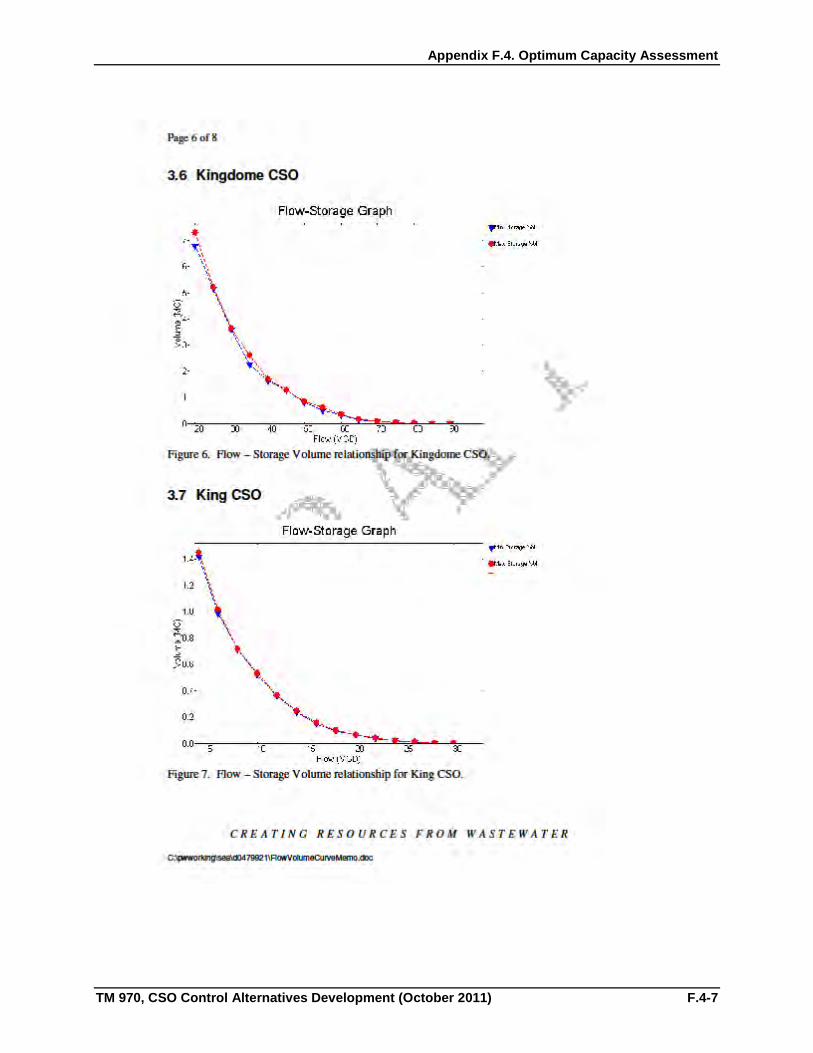
Step 1: Develop Flow-Volume Curves King County created flow-volume curves for the optimum capacity assessment. The flow-volume curves represent different combinations of treatment peak flow rate and equalization basin volume that result in an average of one untreated discharge per outfall per year.
Details regarding the methodology of these analyses as well as the flow-volume curves for each treatment alternative are presented in a technical memorandum (TM) that is presented at the end of this section (TM referred to as Flow-Volume Curves for CSO Treatment Alternatives).
One of the treatment alternatives (consolidated King St and Kingdome wet-weather treatment facility (WWTF)) was not included in the TM. The flow-volume curve and corresponding best-fit equation for the consolidated King St and Kingdome WWTF was prepared separately from the TM and is presented in Figure F.4-1 below.
Figure F.4-1. Flow-Volume Curve for Consolidated King St and Kingdome WWTF
Appendix F.4. Optimum Capacity Assessment
F.4-2 TM 970, CSO Control Alternatives Development (October 2011)
Appendix F.4. Optimum Capacity Assessment
TM 970, CSO Control Alternatives Development (October 2011) F.4-3
Appendix F.4. Optimum Capacity Assessment
F.4-4 TM 970, CSO Control Alternatives Development (October 2011)
Appendix F.4. Optimum Capacity Assessment
TM 970, CSO Control Alternatives Development (October 2011) F.4-5
Appendix F.4. Optimum Capacity Assessment
F.4-6 TM 970, CSO Control Alternatives Development (October 2011)
Appendix F.4. Optimum Capacity Assessment
TM 970, CSO Control Alternatives Development (October 2011) F.4-7

Appendix F.4. Optimum Capacity Assessment
F.4-8 TM 970, CSO Control Alternatives Development (October 2011)

Appendix F.4. Optimum Capacity Assessment
TM 970, CSO Control Alternatives Development (October 2011) F.4-9
Appendix F.4. Optimum Capacity Assessment
F.4-10 TM 970, CSO Control Alternatives Development (October 2011)
Step 2: Develop Footprint Sizing Curves and Estimate Property Costs
Footprint Sizing of Wet-Weather Treatment Facilities
Representative footprint sizing versus treatment peak flow rates curves were developed to establish planning-level footprints for the various alternatives. The methodology used to develop the footprint sizing curves for wet-weather treatment facilities using ballasted sedimentation and CEPT with lamella plates is described in Appendix F.3. The footprint sizing curve and corresponding equations for wet-weather treatment facilities (for both CSO treatment processes) is also presented in Appendix F.3.
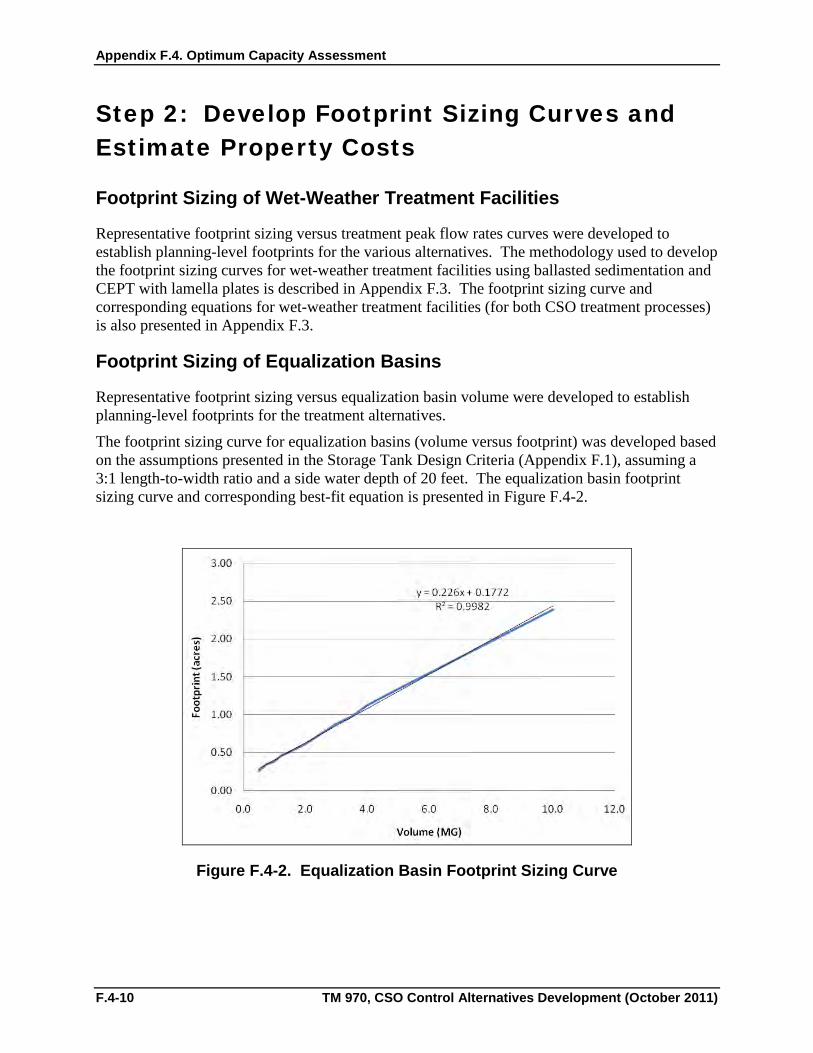
Footprint Sizing of Equalization Basins
Representative footprint sizing versus equalization basin volume were developed to establish planning-level footprints for the treatment alternatives.
The footprint sizing curve for equalization basins (volume versus footprint) was developed based on the assumptions presented in the Storage Tank Design Criteria (Appendix F.1), assuming a 3:1 length-to-width ratio and a side water depth of 20 feet. The equalization basin footprint sizing curve and corresponding best-fit equation is presented in Figure F.4-2.
Figure F.4-2. Equalization Basin Footprint Sizing Curve

Appendix F.4. Optimum Capacity Assessment
TM 970, CSO Control Alternatives Development (October 2011) F.4-11
Estimating Property Costs
Property costs were estimated by multiplying the corresponding footprint sizes of treatment facilities and equalization basins by the property and building unit cost ($/SF) of the CSO basin where the treatment facility is located. Property and building unit costs of the uncontrolled CSO basins are presented in Appendix C of the Technical Memorandum 620, Cost Estimating Methodology for CSO Control Facilities.
Step 3: Develop Construction Cost Curves Construction cost curves were developed for equalization basins and wet-weather treatment facilities using ballasted sedimentation or chemically enhanced primary treatment with lamella plates to estimate construction costs of the different facilities. These cost curves were used to determine the most cost-effective relative sizing of treatment and equalization.
Equalization Basin Cost Curve
Using the same methodology as what is presented in Section 2.4.1 of the Technical Memorandum 620, Cost Estimating Methodology for CSO Control Facilities for storage tanks, a construction cost curve (equalization basin volume versus construction cost) was developed to estimate construction costs for equalization basins. The construction cost curve and corresponding best-fit equation for equalization basins is presented in Figure F.4-3 below. To develop construction cost estimates of equalization basins at varying volumes, use the curve or equation for total construction costs in Figure F.4-3.
Figure F.4-3. Construction Costs for Equalization Basins

Appendix F.4. Optimum Capacity Assessment
F.4-12 TM 970, CSO Control Alternatives Development (October 2011)
Ballasted Sedimentation Cost Curve
A construction cost curve for wet-weather treatment facilities using ballasted sedimentation was developed as part of the Technical Memorandum 620, Cost Estimating Methodology for CSO Control Facilities. Figure F.4-4 shows the cost curves developed for ballasted sedimentation. The figure shows curves for individual components of the treatment facility, as well as total estimated construction cost. Table F.4-1 provides best-fit equations for each curve. To develop construction cost estimates of wet-weather treatment facilities using ballasted sedimentation at varying peak flow rates, use the curve or equation for total construction costs in Figure F.4-4 or Table F.4-1.
Figure F.4-4. Construction Costs for WWTFs Using Ballasted Sedimentation
Table F.4-1. Cost Equations for WWTFs Using Ballasted Sedimentation
Component Construction Cost Equationa (2010 Dollars)
Ballasted Sedimentation Construction Cost = -308.06x2 + 248,995.12x + 5,012,751.25 Influent Pump Station Construction Cost = -133.54x2 + 212,088.62x + 979,951.34 Solids Handling Facility Construction Cost = 34,273.93x + 389,237.31 Grit Removal Facility Construction Cost = 7,760.90x Regulator Station Construction Cost = 485,000 Total of All Components Construction Cost = -441.60x2 + 503,118.57x + 6,866,939.90
a. x = Peak flow rate in million gallons per day

Appendix F.4. Optimum Capacity Assessment
TM 970, CSO Control Alternatives Development (October 2011) F.4-13
Cost Curve for CEPT with Lamella Plates
A construction cost curve for wet-weather treatment facilities using chemically enhanced primary treatment with lamella plates was developed as part of the Technical Memorandum 620, Cost Estimating Methodology for CSO Control Facilities. Separate solids handling facility construction costs and associated property costs were not incorporated into the cost curve or optimum capacity assessment when determining the most cost-effective combination of equalization and treatment. Solids handling was evaluated separately as discussed in the Technical Memorandum 620, Cost Estimating Methodology for CSO Control Facilities. Figure F.4-5 shows the cost curves developed for a wet-weather treatment facility using CEPT with lamella plates. The figure shows curves for all individual components of the treatment facility except the separate solids handling facility, as well as total estimated construction cost for the components shown. Table F.4-2 provides best-fit equations for each curve. For the optimum capacity assessment, to develop construction cost estimates of wet-weather treatment facilities using CEPT with lamella plates at varying peak flow rates, use the curve or equation for total construction costs in Figure F.4-5 or Table F.4-2.
Figure F.4-5. Construction Costs for WWTF Using CEPT with Lamella Plates,
Excluding Solids Handling Facilities
Table F.4-2. Cost Equations for WWTF Using CEPT with Lamella Plates, Excluding Solids Handling Facility
Component Construction Cost Equationa (2010 Dollars)
CEPT Construction Cost = -320.37x2 + 228,220.40x + 3,886,640.69
Appendix F.4. Optimum Capacity Assessment
F.4-14 TM 970, CSO Control Alternatives Development (October 2011)
Component Construction Cost Equationa (2010 Dollars)
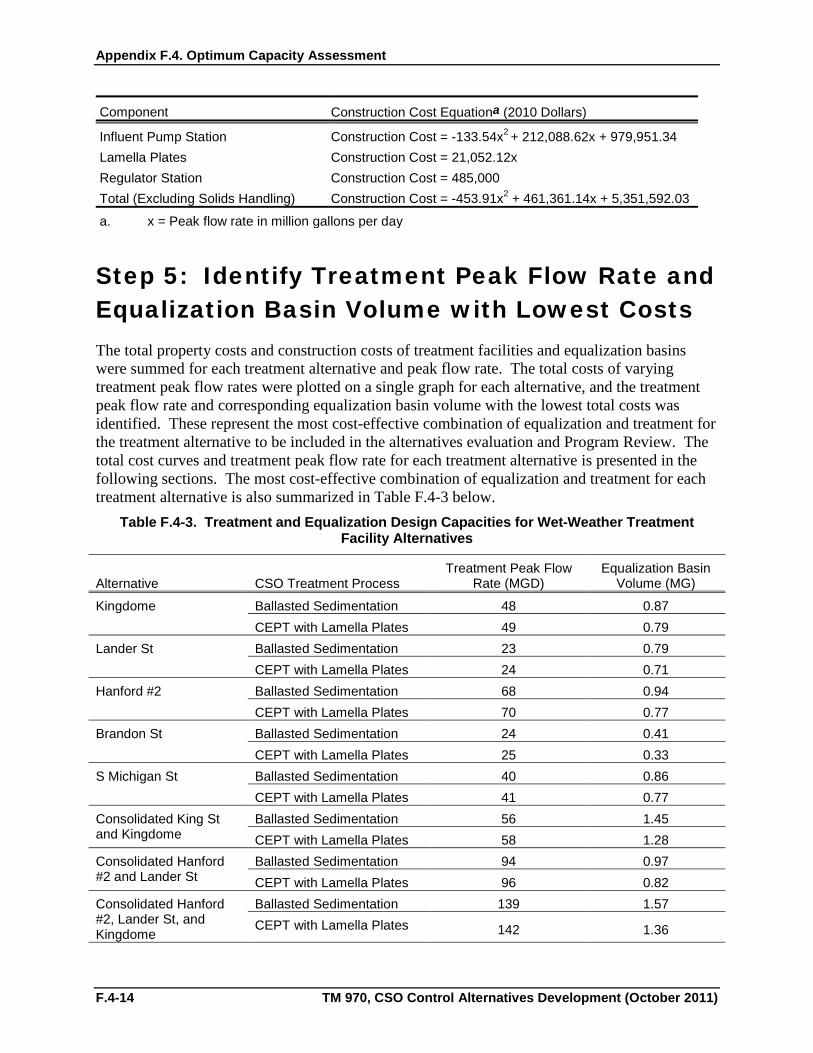
Influent Pump Station Construction Cost = -133.54x2 + 212,088.62x + 979,951.34 Lamella Plates Construction Cost = 21,052.12x Regulator Station Construction Cost = 485,000 Total (Excluding Solids Handling) Construction Cost = -453.91x2 + 461,361.14x + 5,351,592.03
a. x = Peak flow rate in million gallons per day
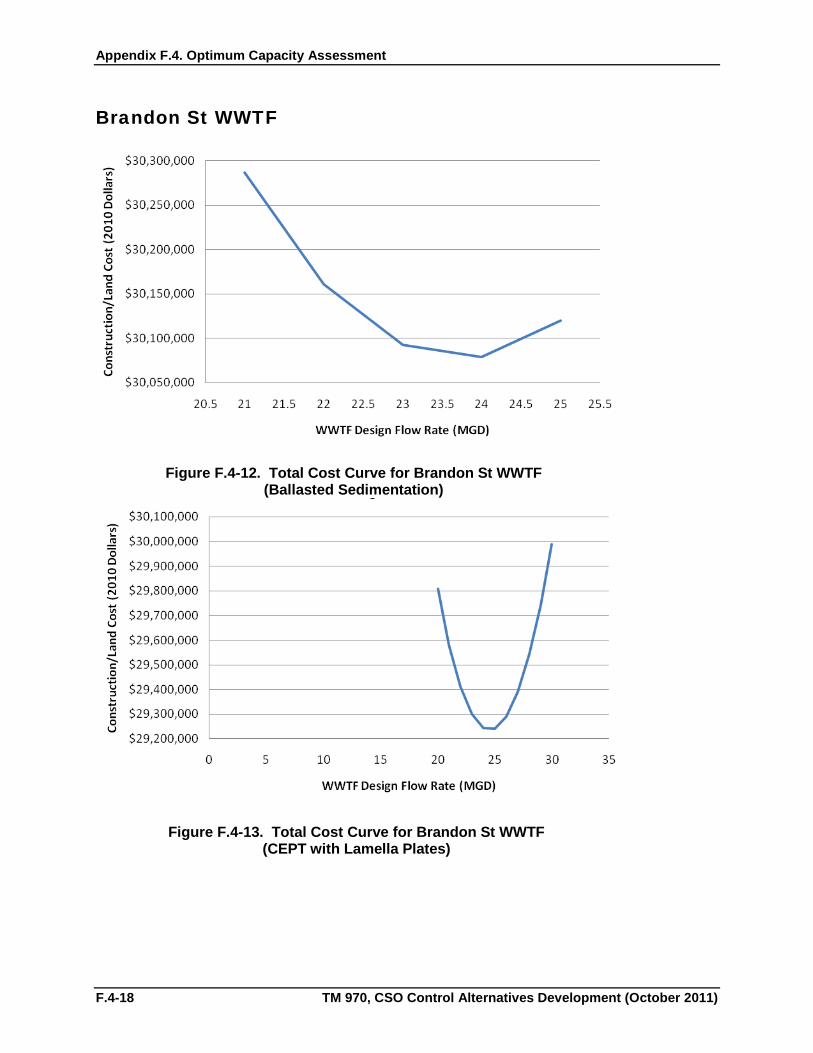
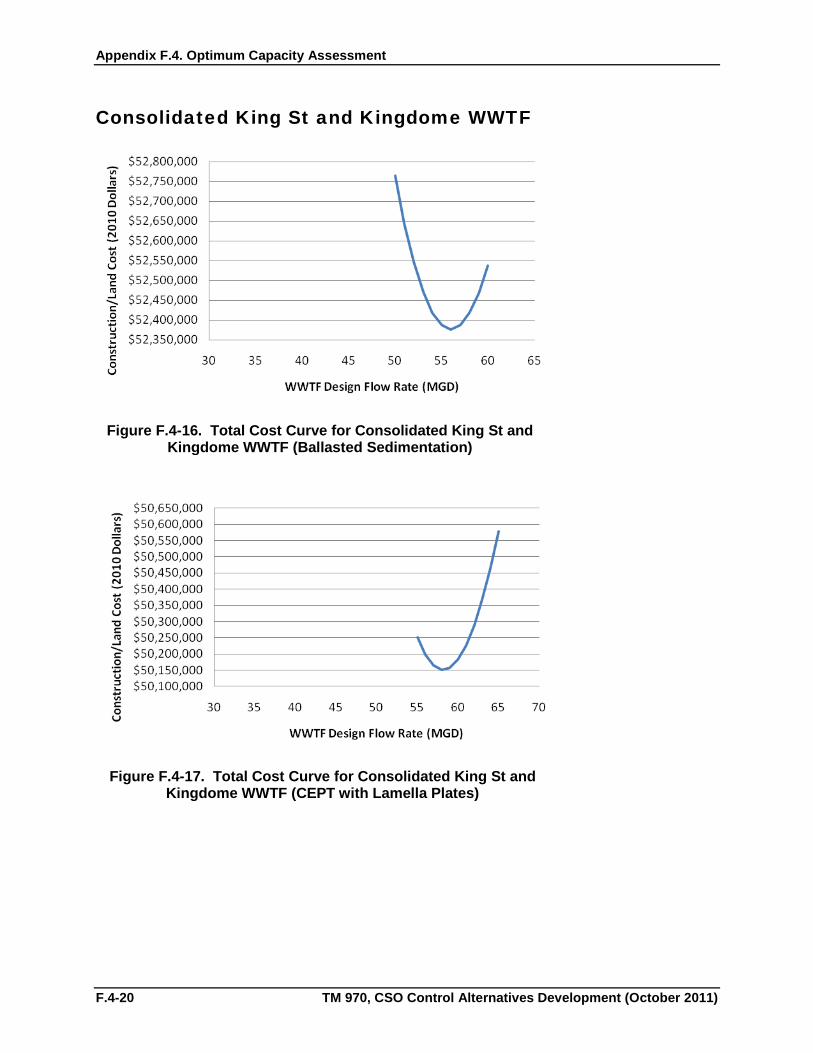
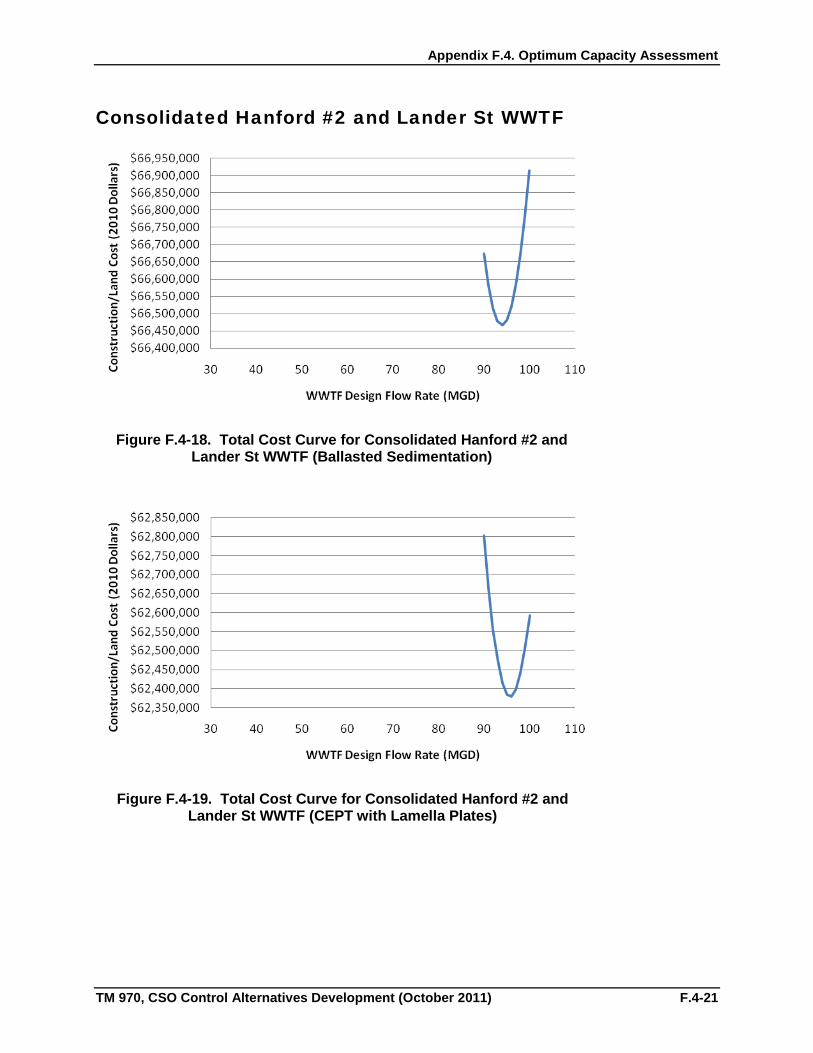
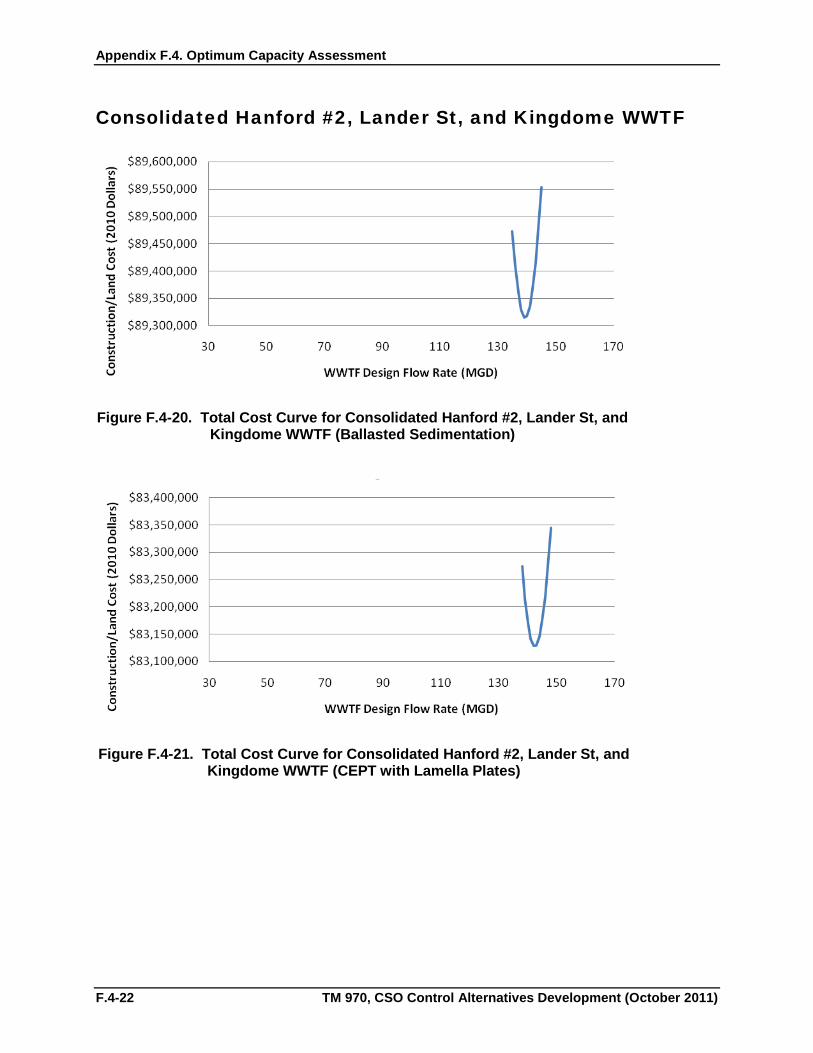
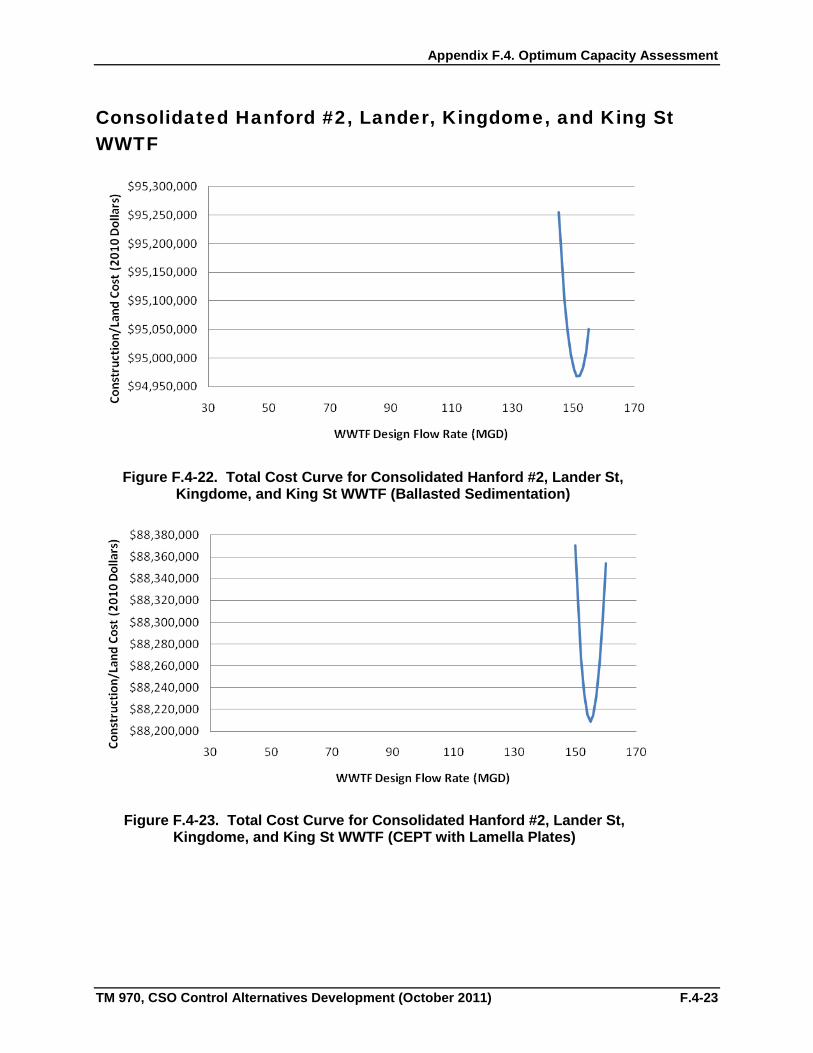
Step 5: Identify Treatment Peak Flow Rate and Equalization Basin Volume with Lowest Costs The total property costs and construction costs of treatment facilities and equalization basins were summed for each treatment alternative and peak flow rate. The total costs of varying treatment peak flow rates were plotted on a single graph for each alternative, and the treatment peak flow rate and corresponding equalization basin volume with the lowest total costs was identified. These represent the most cost-effective combination of equalization and treatment for the treatment alternative to be included in the alternatives evaluation and Program Review. The total cost curves and treatment peak flow rate for each treatment alternative is presented in the following sections. The most cost-effective combination of equalization and treatment for each treatment alternative is also summarized in Table F.4-3 below.
Table F.4-3. Treatment and Equalization Design Capacities for Wet-Weather Treatment Facility Alternatives
Alternative CSO Treatment Process Treatment Peak Flow
Rate (MGD) Equalization Basin
Volume (MG)
Kingdome Ballasted Sedimentation 48 0.87 CEPT with Lamella Plates 49 0.79
Lander St Ballasted Sedimentation 23 0.79 CEPT with Lamella Plates 24 0.71
Hanford #2 Ballasted Sedimentation 68 0.94 CEPT with Lamella Plates 70 0.77
Brandon St Ballasted Sedimentation 24 0.41 CEPT with Lamella Plates 25 0.33
S Michigan St Ballasted Sedimentation 40 0.86 CEPT with Lamella Plates 41 0.77
Consolidated King St and Kingdome
Ballasted Sedimentation 56 1.45 CEPT with Lamella Plates 58 1.28
Consolidated Hanford #2 and Lander St
Ballasted Sedimentation 94 0.97 CEPT with Lamella Plates 96 0.82
Consolidated Hanford #2, Lander St, and Kingdome
Ballasted Sedimentation 139 1.57 CEPT with Lamella Plates 142 1.36
Appendix F.4. Optimum Capacity Assessment
TM 970, CSO Control Alternatives Development (October 2011) F.4-15
Alternative CSO Treatment Process Treatment Peak Flow
Rate (MGD) Equalization Basin
Volume (MG)
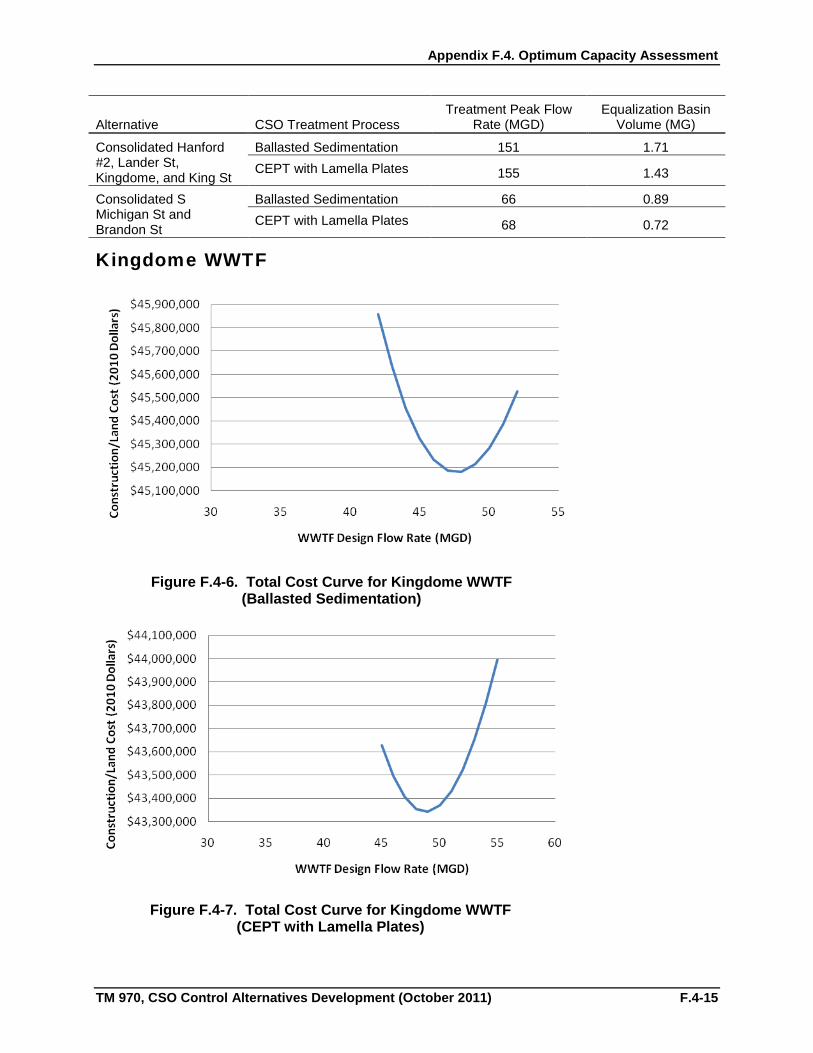
Consolidated Hanford #2, Lander St, Kingdome, and King St
Ballasted Sedimentation 151 1.71 CEPT with Lamella Plates 155 1.43
Consolidated S Michigan St and Brandon St
Ballasted Sedimentation 66 0.89 CEPT with Lamella Plates 68 0.72
Kingdome WWTF
Figure F.4-6. Total Cost Curve for Kingdome WWTF (Ballasted Sedimentation)
Figure F.4-7. Total Cost Curve for Kingdome WWTF (CEPT with Lamella Plates)
Appendix F.4. Optimum Capacity Assessment
F.4-16 TM 970, CSO Control Alternatives Development (October 2011)
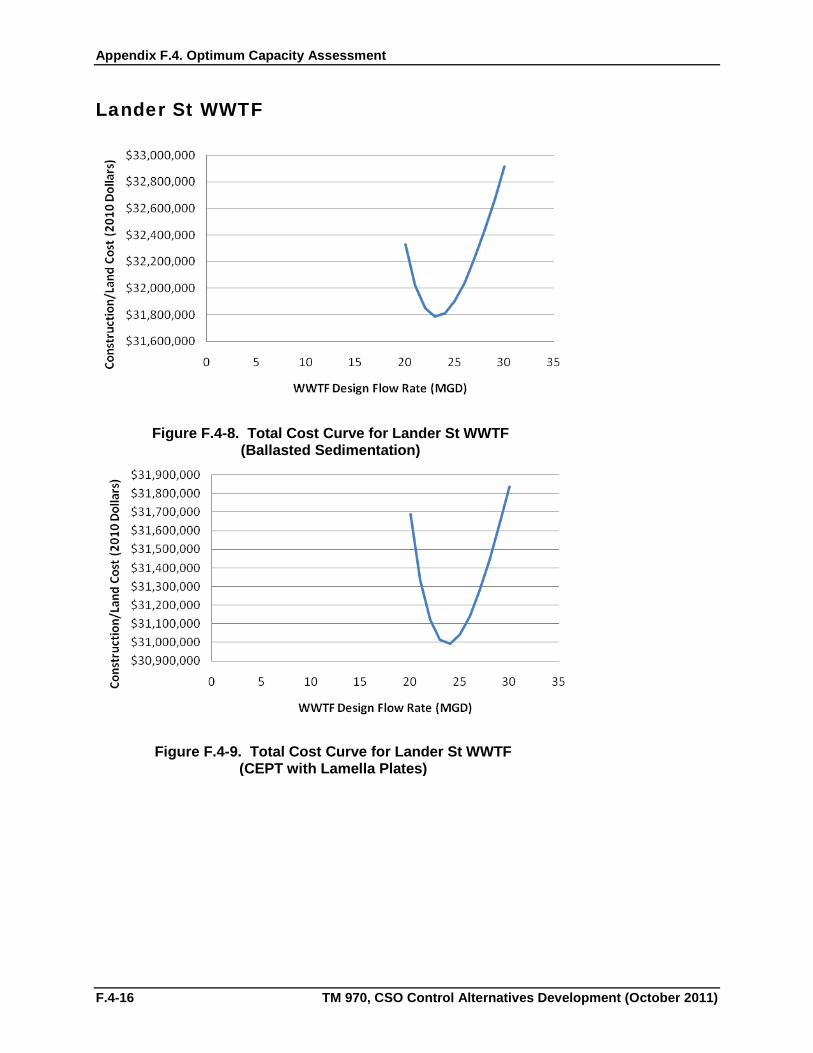
Lander St WWTF
Figure F.4-8. Total Cost Curve for Lander St WWTF (Ballasted Sedimentation)
Figure F.4-9. Total Cost Curve for Lander St WWTF (CEPT with Lamella Plates)
Appendix F.4. Optimum Capacity Assessment
TM 970, CSO Control Alternatives Development (October 2011) F.4-17
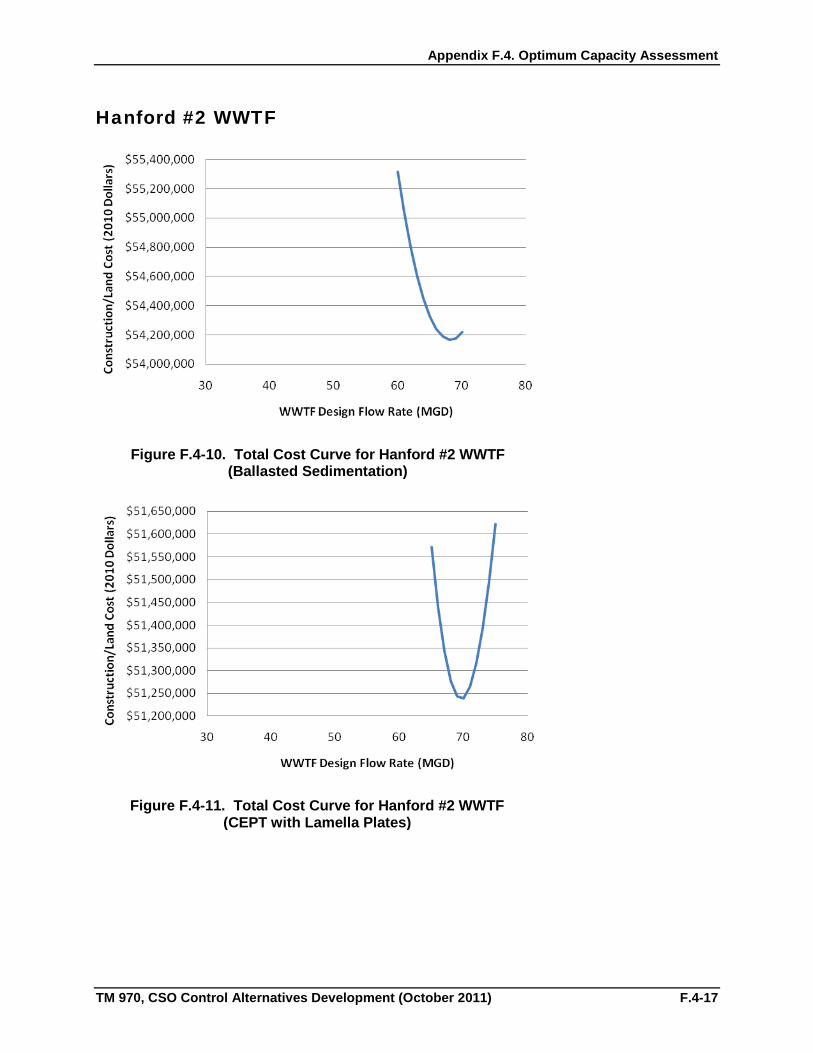
Hanford #2 WWTF
Figure F.4-10. Total Cost Curve for Hanford #2 WWTF (Ballasted Sedimentation)
Figure F.4-11. Total Cost Curve for Hanford #2 WWTF (CEPT with Lamella Plates)
Appendix F.4. Optimum Capacity Assessment
F.4-18 TM 970, CSO Control Alternatives Development (October 2011)
Brandon St WWTF
Figure F.4-12. Total Cost Curve for Brandon St WWTF (Ballasted Sedimentation)
Figure F.4-13. Total Cost Curve for Brandon St WWTF (CEPT with Lamella Plates)

Appendix F.4. Optimum Capacity Assessment
TM 970, CSO Control Alternatives Development (October 2011) F.4-19
S Michigan St WWTF
Figure F.4-14. Total Cost Curve for S Michigan St WWTF (Ballasted Sedimentation)
Figure F.4-15. Total Cost Curve for S Michigan St WWTF (CEPT with Lamella Plates)
Appendix F.4. Optimum Capacity Assessment
F.4-20 TM 970, CSO Control Alternatives Development (October 2011)
Consolidated King St and Kingdome WWTF
Figure F.4-16. Total Cost Curve for Consolidated King St and Kingdome WWTF (Ballasted Sedimentation)
Figure F.4-17. Total Cost Curve for Consolidated King St and Kingdome WWTF (CEPT with Lamella Plates)
Appendix F.4. Optimum Capacity Assessment
TM 970, CSO Control Alternatives Development (October 2011) F.4-21
Consolidated Hanford #2 and Lander St WWTF
Figure F.4-18. Total Cost Curve for Consolidated Hanford #2 and Lander St WWTF (Ballasted Sedimentation)
Figure F.4-19. Total Cost Curve for Consolidated Hanford #2 and Lander St WWTF (CEPT with Lamella Plates)
Appendix F.4. Optimum Capacity Assessment
F.4-22 TM 970, CSO Control Alternatives Development (October 2011)
Consolidated Hanford #2, Lander St, and Kingdome WWTF
Figure F.4-20. Total Cost Curve for Consolidated Hanford #2, Lander St, and Kingdome WWTF (Ballasted Sedimentation)
Figure F.4-21. Total Cost Curve for Consolidated Hanford #2, Lander St, and Kingdome WWTF (CEPT with Lamella Plates)
Appendix F.4. Optimum Capacity Assessment
TM 970, CSO Control Alternatives Development (October 2011) F.4-23
Consolidated Hanford #2, Lander, Kingdome, and King St WWTF
Figure F.4-22. Total Cost Curve for Consolidated Hanford #2, Lander St, Kingdome, and King St WWTF (Ballasted Sedimentation)
Figure F.4-23. Total Cost Curve for Consolidated Hanford #2, Lander St, Kingdome, and King St WWTF (CEPT with Lamella Plates)

Appendix F.4. Optimum Capacity Assessment
F.4-24 TM 970, CSO Control Alternatives Development (October 2011)
Consolidated S Michigan St and Brandon St WWTF
Figure F.4-24. Total Cost Curve for Consolidated S Michigan St and Brandon St WWTF (Ballasted Sedimentation)
Figure F.4-25. Total Cost Curve for Consolidated S Michigan St and Brandon St WWTF (CEPT with Lamella Plates)


