F-0 APPENDIX F NCHRP Project 12-76 (01) TRUCK SORTING STRATEGIES & INFLUENCE ON “r” VALUES INTRODUCTION NCHRP 12-76 protocols recommended a simplified calibration approach (Method I) for Strength I that focuses on the maximum live load variable, L max for updating the load factor for current traffic conditions, in a manner consistent with the LRFD calibration. L max is the expected maximum lifetime load effect, projected over the 75 year life of the bridge. The ratio, r (L max WIM data, divided by L max LRFD calibration data) for one-lane and for two-lanes is used to adjust the live load factor assuming that the overall LRFD calibration, multiple presence factors, and target reliability indices are adequate. Based on the above simple method, an increase in the maximum expected 75-year live load as estimated from current WIM data can be accounted for in the design equation by raising the live load factor in proportion to the ratio of the estimated live load projection from WIM data to the value used during the calibration of the AASHTO LRFD Specifications. The high r-values for Strength I in the NCHRP 12-76 study for one-lane loaded conditions may have been influenced by the truck sorting methodology used in the study and increasing presence of heavy exclusion vehicles and/or routine permits in the traffic stream. This study will further investigate the truck sorting methodology and the sensitivity of r values to how the trucks are sorted into Strength I and Strength II. The separation of large scale traffic data into Strength I and Strength II groups is a difficult but important issue that needs to be resolved. In LRFD, Strength I uses the HL-93 design load whereas Strength II is reserved for an owners specified permit design load. At the present time many DOTs have not defined a design permit vehicle for LRFD and are designing their bridges just for Strength I, as far as live loads are concerned. The NCHRP 12-76 study addressed the issue of separating traffic data into Strength I and Strength II limit states by recommending that all uncontrolled traffic that constitutes normal traffic or service loads at a site be grouped into Strength I and all controlled or analyzed overload permits be grouped into Strength II. Strength I vehicles were taken to include state legal trucks, illegal trucks, and routine permits or divisible load permits. All legal trucks, illegal overloads and un-analyzed permits (all routine permits) were grouped into Strength I as they were considered to represent normal service traffic at bridge sites. Operationally there is no difference between a legal load (including Exclusion trucks) and a routine permits as they all belong to uncontrolled traffic. Routine permits are allowed unlimited trips statewide by the permit office without bridge review for a nominal annual fee. In many states routine permits are similar to exclusion trucks, except for the fee, and they are indistinguishable from other non-permit traffic. Most states do not rate or post their bridges for routine permits, which makes it important that all bridges be designed for these vehicles as normal service loads. Special permits are treated separately under Strength II traffic as these are usually analyzed by the bridge office for bridge safety and allowed to operate under permit controls. It is important that these very heavy loads be separated out so that they do not control the upper tail of the traffic distribution for Strength I calibration. Implementing the NCHRP 12-76 recommendation for grouping trucks into Strength I and Strength II proved to be challenging for the research team. Deciding what is permit traffic and what is non-permit traffic when using large scale WIM data is a topic of critical interest. Getting reliable and complete permit information suitable for use with large scale WIM data has been difficult as much of this data is not available, especially due to the high number of annual or blanket permits in operation. Due to the difficulty in separating permit vs non-permit traffic in the 12-76 study using permit records, it was decided to group all trucks
Transcript
F-0
APPENDIX F
NCHRP Project 12-76 (01)
TRUCK SORTING STRATEGIES & INFLUENCE ON “r” VALUES INTRODUCTION NCHRP 12-76 protocols recommended a simplified calibration approach (Method I) for Strength I that focuses on the maximum live load variable, Lmax for updating the load factor for current traffic conditions, in a manner consistent with the LRFD calibration. Lmax is the expected maximum lifetime load effect, projected over the 75 year life of the bridge. The ratio, r (Lmax WIM data, divided by Lmax LRFD calibration data) for one-lane and for two-lanes is used to adjust the live load factor assuming that the overall LRFD calibration, multiple presence factors, and target reliability indices are adequate. Based on the above simple method, an increase in the maximum expected 75-year live load as estimated from current WIM data can be accounted for in the design equation by raising the live load factor in proportion to the ratio of the estimated live load projection from WIM data to the value used during the calibration of the AASHTO LRFD Specifications. The high r-values for Strength I in the NCHRP 12-76 study for one-lane loaded conditions may have been influenced by the truck sorting methodology used in the study and increasing presence of heavy exclusion vehicles and/or routine permits in the traffic stream. This study will further investigate the truck sorting methodology and the sensitivity of r values to how the trucks are sorted into Strength I and Strength II. The separation of large scale traffic data into Strength I and Strength II groups is a difficult but important issue that needs to be resolved. In LRFD, Strength I uses the HL-93 design load whereas Strength II is reserved for an owners specified permit design load. At the present time many DOTs have not defined a design permit vehicle for LRFD and are designing their bridges just for Strength I, as far as live loads are concerned. The NCHRP 12-76 study addressed the issue of separating traffic data into Strength I and Strength II limit states by recommending that all uncontrolled traffic that constitutes normal traffic or service loads at a site be grouped into Strength I and all controlled or analyzed overload permits be grouped into Strength II. Strength I vehicles were taken to include state legal trucks, illegal trucks, and routine permits or divisible load permits. All legal trucks, illegal overloads and un-analyzed permits (all routine permits) were grouped into Strength I as they were considered to represent normal service traffic at bridge sites. Operationally there is no difference between a legal load (including Exclusion trucks) and a routine permits as they all belong to uncontrolled traffic. Routine permits are allowed unlimited trips statewide by the permit office without bridge review for a nominal annual fee. In many states routine permits are similar to exclusion trucks, except for the fee, and they are indistinguishable from other non-permit traffic. Most states do not rate or post their bridges for routine permits, which makes it important that all bridges be designed for these vehicles as normal service loads. Special permits are treated separately under Strength II traffic as these are usually analyzed by the bridge office for bridge safety and allowed to operate under permit controls. It is important that these very heavy loads be separated out so that they do not control the upper tail of the traffic distribution for Strength I calibration. Implementing the NCHRP 12-76 recommendation for grouping trucks into Strength I and Strength II proved to be challenging for the research team. Deciding what is permit traffic and what is non-permit traffic when using large scale WIM data is a topic of critical interest. Getting reliable and complete permit information suitable for use with large scale WIM data has been difficult as much of this data is not available, especially due to the high number of annual or blanket permits in operation. Due to the difficulty in separating permit vs non-permit traffic in the 12-76 study using permit records, it was decided to group all trucks
F-1
with six or fewer axles in the STRENGTH I calibration. This was considered the most reasonable approach to separate out all legal, illegal and routine permits into Strength I for national implementation. It is reasonable to assume that trucks with seven or more axles are heavy permit loads geared to carrying loads above the 120 Kip to 150 Kip limit commonly set for routine permits. This approach also corresponds very well with the distribution of trucks in the traffic stream in most states. There is a usually significant drop off in the number of trucks with seven or more axles, as would be expected for the controlled heavy permits. NCHRP 12-76 protocols for classifying trucks into Strength I and Strength II limit states may be summarized as follows:
1. All legal trucks, illegal overloads and un-analyzed permits (all routine permits) were grouped into Strength I as they were considered to represent normal service traffic at bridge sites.
2. All controlled or analyzed overload permits be grouped into Strength II. 3. Due to the difficulty in separating permit vs non-permit traffic using permit records, it was
decided to group all trucks with six or fewer axles in the STRENGTH I calibration. TRUCK SORTING STRATEGIES AND INFLUENCE ON “r” NCHRP 12-76 found very large variations in maximum projected load effects from WIM site to WIM site for the Strength I limit states. At a number of sites the results indicated maximum “r” values that were very high for single lane loaded conditions. This indicated that for the single lane loaded condition the AASHTO LRFD may be underestimating the live load force effects using HL-93 and the 1.75 live load factor. Since most members are governed by the multiple lane loaded condition instead of the single lane loaded condition this result does not necessarily imply that the AASHTO live load should be increased in some way, however it did indicate that further study was warranted. The aforementioned methodology used to separate the STRENGTH I trucks from the STRENGTH II trucks could be a possible source of data classification errors in the calculation of “r”, which should be investigated. These additional studies were initiated by the 12-76 Project Panel as it was considered that it would be very helpful to investigate how sensitive the “r” values are to how the trucks are sorted. In other words, we need to perform a study of the sensitivity of “r” based on various truck sorting strategies. Sorting strategies based on changing the number of axles, truck gross weight limits or state truck weight and permit regulations are viable approaches for classifying trucks as non-permit traffic or permit traffic. Once this determination is made of the overall traffic stream at a site, we then need to decide how these permit and non-permit traffic needs to be grouped into the strength limit states for live load calibration purposes. This will confirm if the high “r” values for one lane loaded case observed in the initial 12-76 study is an anomaly based on how trucks were sorted or a true representation of extreme load effects in Strength I representing a combination of non-permit and routine permit traffic. WIM data must be separated into two populations for assessing live load effects. The first population is the vehicles that correspond to the AASHTO LRFD Strength I limit state. Ideally this population would include all significant vehicles operating at a WIM site that have not been issued an overweight permit. The second population corresponds to the AASHTO LRFD Strength II limit state. Ideally this population consists of all vehicles operating at a WIM site that have been issued an overweight permit based on a bridge review. Since issuing an overweight permit implies that a site/bridge specific evaluation has been performed for that load the effect of these permit vehicles should not be included in the Strength I calibration. The WIM site data utilized in this study did not have a dedicated data record to indicate if a particular truck passage is a permit vehicle or not. For this reason the WIM data must first be separated into permit (P) and non-permit (N) records. The logic used to determine if a vehicle is a permit or not may then have an influence on the live load effect for Strength I that is being compared (by normalizing) against the HL-93 live load effect.
F-2
Issues to be investigated in the current phase of this research:
1. Strategies for sorting trucks into non permit (state legal loads and illegal loads), routine or annual permits and special permits (Superloads).
2. Strategies for grouping the various trucks defined in Step 1into Strength I and Strength II for design load calibration
3. The influence of the various truck sorting strategies on “r” values Note that in this study Lmax has been normalized using HL-93 for Strength I and Strength II limit states to allow comparison of values between the two for different sorting strategies where trucks are moved from one to the other. This study is aimed at investigating the high Lmax and r values for the Strength I only using the simplified method as the LRFD calibration provides data on Lmax values for only Strength I. Load factor for Strength II are to be calibrated using the reliability based method in the 12-76 Protocols (Method II) for owner specified design permit vehicles. RESEARCH TASKS
Task 1. Review of NCHRP 12-76 Studies and Available WIM Data. Task 2. Sensitivity Analysis of the Influence of Truck Sorting Strategies Task 3. Submit Tasks 1 and 2 Work Products Task 4. Revise Tasks 1 and 2 Work Products Task 5. Prepare a Final Report that Documents the Entire Research Effort.
F-3
TRUCK SORTING STRATEGIES Overall Strategy for Sorting Trucks into Strength I and Strength II The original NCHRP 12-76 study results indicated maximum “r” values that were very high for single lane loaded conditions. The high r-values for Strength I in the NCHRP 12-76 study for one-lane loaded conditions may have been influenced by the truck sorting methodology used in the study. Only the one-lane loaded condition for Strength I and Strength II truck classifications was considered in this study as it is the most pertinent to achieving the objective of this project. As seen in the 12-76 results the two-lane loaded condition is governed primarily by multiple presence of two or more trucks on a bridge and not by a single truck, and are not particularly sensitive to truck sorting methods. Truck Definitions State highway agencies have established processes for permitting overweight non-divisible loads on state highways. Some states also have “Grandfather rights” to authorize permits for divisible loads that exceed 80,000 lbs. A "divisible load" is any vehicle or combination of vehicles transporting cargo of legal dimensions which can be separated into units of legal weight without affecting the physical integrity of the load. Examples of divisible loads include: aggregate (sand, top soil, gravel, stone), logs, scrap metal, fuel, milk, trash/refuse/garbage, etc.
State Legal Trucks: Trucks that meet state vehicle weight regulations for legal loads. Typical specify axle weight limits or single and axle groups, gross weight limit, and requirements for axle configuration and spacing based on Federal Bridge Formula B.
Annual (or Blanket) Overweight Permits: Annual or Blanket permits are usually valid for unlimited trips within a
state over a period of time, not to exceed one year, for vehicles of a given configuration within specified gross and axle weight limits.
Trip (or Superload) Overweight Permits: Trip permits are usually valid for a single trip only, for a limited number
of trips, for a vehicle of specified configuration, axle weights, and gross weight. Special permit vehicles are usually heavier than those vehicles issued annual permits
Illegal Trucks: Trucks that do not meet state vehicle weight regulations for legal loads
or for permit loads
F-4
SORTING VARIATIONS Table 1: Sorting Variations Used for Including Trucks into Strength I / Strength II Sorting Variation
Strength I Strength II Comment
Baseline Trucks with 6 or fewer axles Trucks with 7 or more Axles Same as NCHRP 12-76 Protocols. Provides a basis for comparison
12 All trucks Provides a basis for comparison and for sensitivity studies
Generalized Sorting Methods Applicable to all States
1 Trucks with 7 or fewer axles Trucks with 8 or more Axles
2 Trucks with 8 or fewer axles Trucks with 9 or more Axles
3 Trucks with 5 or fewer axles Trucks with 6 or more Axles
4 GVW > 84 Kips Includes a 5% scale allowance over 80 Kips
5 GVW > 100 Kips
6 GVW > 120 kips
7 GVW > 150 Kips
State-Specific Sorting Methods Based on State Weight Regulations and Permit Rules
11 State Legal Trucks Illegal Trucks Annual (Routine) Permits
Trip Permits Trucks sorting goal intended in 12-76 Protocols. Useful to compare with Baseline case.
F-5
The sorting variations given in Table 1 can be placed into four groups to facilitate discussions: Group I: Sorting Based on # of Axles Baseline: Strength I = 6 axles or less Variation P1: Strength I = 7 axles or less Variation P2: Strength I = 8 axles or less Variation P3: Strength I = 5 axles or less Group II: Sorting Based on GVW Variation P4: Strength I = GVW ≤ 84 Variation P5: Strength I = GVW ≤ 100 Variation P6: Strength I = GVW ≤ 120 Variation P7: Strength I = GVW ≤ 150 Group III: Sorting Based on State Permit Regulations Variation P8: Strength I = State Legal Trucks only Variation P9: Strength I = State Legal Trucks, Annual (Routine) Permits Variation P10: Strength I = State Legal Trucks, Illegal Trucks Variation P11: Strength I = State Legal Trucks, Illegal Trucks, Annual Permits (only Trip Permits in Strength
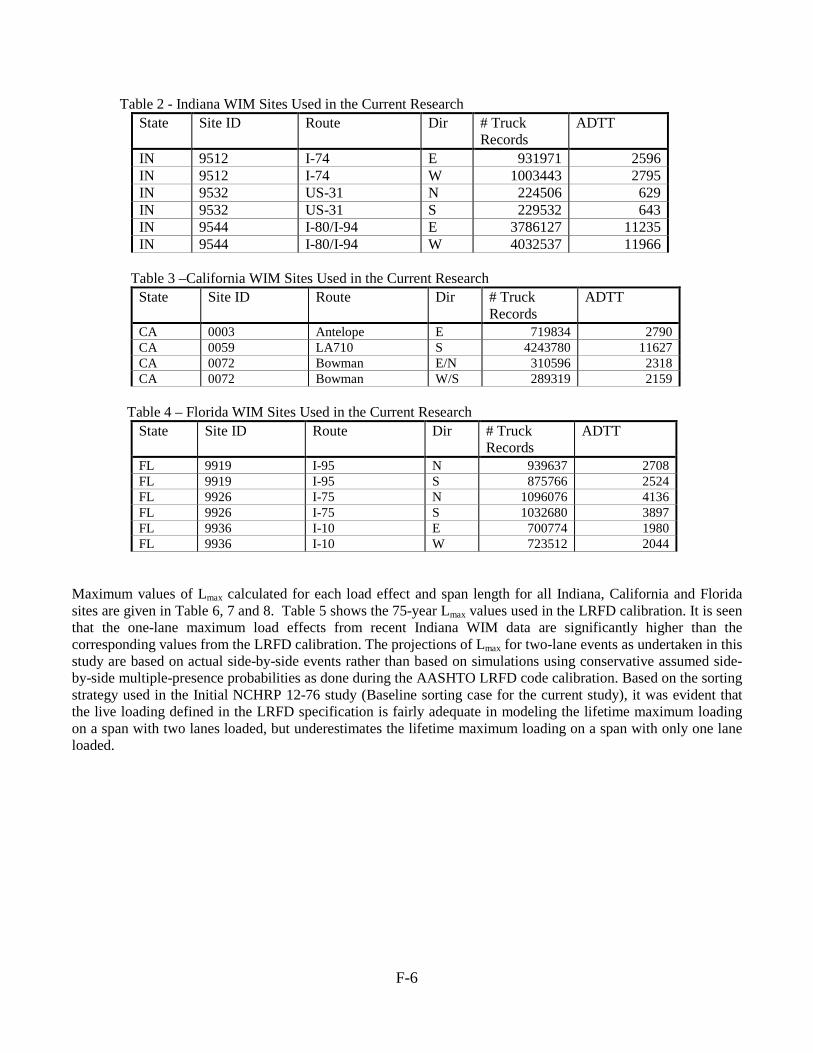
II) Group IV: Non Sorted Variation P12: All vehicles in Strength I NCHRP 12-76 protocols for classifying trucks into Strength I and Strength II limit states (defined as the Baseline case in this study) included all legal trucks, illegal overloads and un-analyzed permits (all routine permits) into Strength I as they were considered to represent normal service traffic at bridge sites. All controlled or analyzed overload permits (trip permits) were grouped into Strength II. Due to the difficulty in separating permit vs non-permit traffic using permit records, it was decided to include all trucks with six or fewer axles in the STRENGTH I calibration. Sorting Variation 11 is aimed at achieving the same classification of trucks into Strength I and Strength II, but using the State’s permit regulations as the criteria and not number of axles. Both the Baseline case and Variation 11 have the same objective but take different approaches to sorting trucks into Strength I and Strength II. WIM SITES USED IN THE ANALYSIS This phase of the NCHRP 12-76 study has considered three WIM sites each from IN, CA and FL taken from the original NCHRP 12-76 research (Table 2, 3, 4) for studying how changing the definition of classification of loads into Strengths I and II changes the results of the study especially in terms of the “r” value which is a measure of how each site compares to the HL-93 design basis. The states and sites were chosen to capture a variety of geographic locations and functional classes. Values of “r” of 1.0 indicate that the HL-93 loading and the live load factor of 1.75 in the AASHTO LRFD specifications are providing the desired design basis for a set of WIM traffic data. “r” values less than 1.0 indicate that the AASHTO LRFD specifications are providing a conservative evaluation of the live load effect and “r” values greater than 1.0 indicate that the load effects are higher than expected based on the AASHTO LRFD calibration. This supplement to NCHRP 12-76 has performed variations on the truck separation methodology to study the effect. WIM data for Indiana were considered as the first test state for this study.
F-6
Table 2 - Indiana WIM Sites Used in the Current Research State Site ID Route Dir # Truck
Records ADTT
IN 9512 I-74 E 931971 2596 IN 9512 I-74 W 1003443 2795 IN 9532 US-31 N 224506 629 IN 9532 US-31 S 229532 643 IN 9544 I-80/I-94 E 3786127 11235 IN 9544 I-80/I-94 W 4032537 11966
Table 3 –California WIM Sites Used in the Current Research
State Site ID Route Dir # Truck Records
ADTT
CA 0003 Antelope E 719834 2790 CA 0059 LA710 S 4243780 11627 CA 0072 Bowman E/N 310596 2318 CA 0072 Bowman W/S 289319 2159
Table 4 – Florida WIM Sites Used in the Current Research
State Site ID Route Dir # Truck Records
ADTT
FL 9919 I-95 N 939637 2708 FL 9919 I-95 S 875766 2524 FL 9926 I-75 N 1096076 4136 FL 9926 I-75 S 1032680 3897 FL 9936 I-10 E 700774 1980 FL 9936 I-10 W 723512 2044
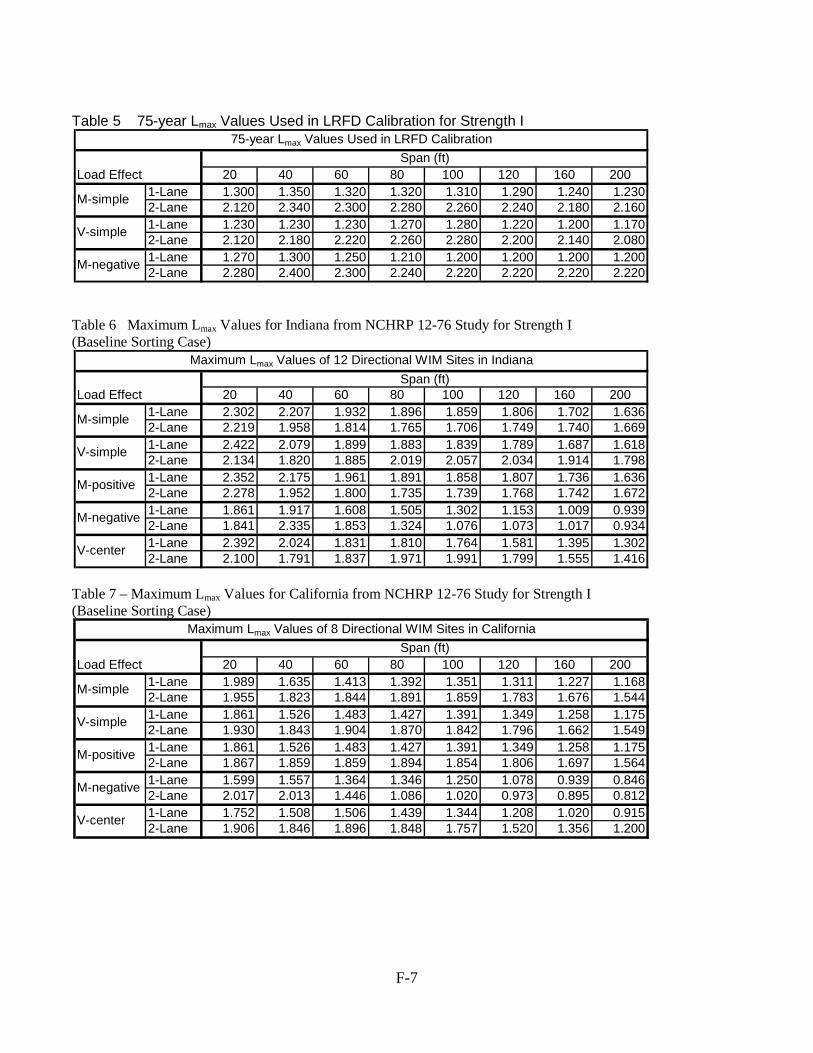
Maximum values of Lmax calculated for each load effect and span length for all Indiana, California and Florida sites are given in Table 6, 7 and 8. Table 5 shows the 75-year Lmax values used in the LRFD calibration. It is seen that the one-lane maximum load effects from recent Indiana WIM data are significantly higher than the corresponding values from the LRFD calibration. The projections of Lmax for two-lane events as undertaken in this study are based on actual side-by-side events rather than based on simulations using conservative assumed side-by-side multiple-presence probabilities as done during the AASHTO LRFD code calibration. Based on the sorting strategy used in the Initial NCHRP 12-76 study (Baseline sorting case for the current study), it was evident that the live loading defined in the LRFD specification is fairly adequate in modeling the lifetime maximum loading on a span with two lanes loaded, but underestimates the lifetime maximum loading on a span with only one lane loaded.
F-7
Table 5 75-year Lmax Values Used in LRFD Calibration for Strength I
Table 6 Maximum Lmax Values for Indiana from NCHRP 12-76 Study for Strength I (Baseline Sorting Case)
Table 7 – Maximum Lmax Values for California from NCHRP 12-76 Study for Strength I (Baseline Sorting Case)
Maximum Lmax Values of 8 Directional WIM Sites in CaliforniaSpan (ft)
M-simple
V-simple
M-positive
M-negative
V-center
F-8
Table 8 - Maximum Lmax Values for Florida from NCHRP 12-76 Study for Strength I (Baseline Sorting Case)
STATE-SPECIFIC IMPLEMENTATION OF TRUCK SORTING STRATEGIES The above noted sorting strategies were implemented using permit rules and recent WIM data from three states, namely: Indiana, California, and Florida. For each State, the permit variations were customized to incorporate State specific vehicle weight laws and permit regulations as described below: a) INDIANA
Indiana Permit Regulations Indiana generally uses the federal definition of overweight vehicles. The following is quoted from the Indiana Oversize/Overweight Vehicle Permitting Handbook:
“Once your load is non-divisible, you must determine if your truck and load are over the legal dimensions and/or legal weight for Indiana. To travel legally on any Indiana roads, you cannot exceed the following weight:
80,000 pounds gross vehicle weight; or 12,000 pounds on the steering axle; or 20,000 pounds on a single axle; or
800 pounds per inch of rim width and subject to the above axle weights. 34,000 pounds on a tandem axle; or
An overweight vehicle is generally any vehicle whose overall weight exceeds 80,000 pounds. However, road and bridge stress levels are determined by the distribution of the weight, so it is important that the weight per axle, or sets of tandem axles, are observed. Weight per tire is also considered. The total gross weight may be calculated by the following federal bridge formula and then compared with the established weight limits listed above.
W = 500 {[(LN) ÷ (N-1)] + 12N + 36} where W = The overall gross weight on any group of two or more consecutive axles, to the nearest
500 pounds, L = The distance between the extreme of any group of two or more consecutive axles, and
Maximum Lmax Values of 9 Directional WIM Sites in FloridaSpan (ft)
M-simple
V-simple
M-positive
M-negative
V-center
N = The number of axles in the group under consideration, except that two consecutive sets of tandem axles may carry a gross load of 34,000 pounds each, providing the first and last axles of the consecutive sets of tandem axles are at least 36 feet or more apart.”
F-9
Like most states Indiana has some exceptions to their standard rules, however the gross vehicle weight, axle weight, tandem axle weight, and compliance with formula B form the basis for the Indiana regulations. Indiana considers permits exceeding the legal limits as “Overweight” for loads up to a GVW of 120 kip. Permits exceeding 120 kip are given an extra designation as “Superload” permits. One notable permit type is the “Michigan Train Permit” which Indiana designates as the “Special Weight” permit. This permit is allowed on designated routes in northern Indiana. Of the three WIM data sets considered in this study one is in northern Indiana (9544) and would include these vehicles in its records. This permit has a GVW of up to 134 kip and its axle arrangement can violate the federal bridge formula B in both high GVW configurations and in lower GVW configurations. The implications of this special permit will be discussed more in conjunction with the 9544 site results. Since the Indiana Design Manual does not include a STRENGTH II design load the load effects of their very common permit types should be enveloped within the STRENGTH I load combination. This would appear to be the case for the “Special Weight” permits. If so then these vehicles should be included in the group assigned to STRENGTH I for WIM data. If the bridges on the northern routes where these permits are issued were designed using one or more STRENGTH II cases to represent these loads then the WIM data separation should reflect that but this does not appear to be the case. Strategies for sorting trucks that belong in Strength II were developed based on the following:
1. Number of axles 2. Gross weight (GVW) 3. State permit regulation
In each strategy below, various strategies are used to qualify a truck to be grouped into Strength II. Indiana Truck Sorting Strategies Investigated
Group I: Sorting Based on # of Axles
Baseline: Strength I =6 axles or less
Same as the sorting method used in the original NCHRP 12-76 research. The Strength II definition is based on the number of axles being the single strongest indicator determining if a load is a permit or not. As the magnitude of a permit load increases the number of axles to carry that load must increase in order for the permit vehicle to avoid pavement damage. Illegal non-permit overloads are more likely to simply exceed the allowable axle loads. The cutoff used for the baseline definition is that a vehicle having seven or more axles is a permit vehicle.
Variation 1: Strength I = 7 axles or less Increase the number of axles required to qualify for Strength II to 8 or more axles.
Variation 2: Strength I = 8 axles or less
Increase the number of axles required to qualify for Strength II to 9 or more axles.
F-10
Variation 3: Strength I = 5 axles or less
Decrease the number of axles required to qualify for Strength II to 6 or more axles.
Group II: Sorting Based on GVW
Variation 4: Strength I = GVW ≤ 84
This variation switches the basis for the definition from number of axles to Gross Vehicle Weight (GVW). All trucks above 84 Kips are grouped into Strength II. This approach may not be as useful as the axle based definition as it will remove any illegal overloads from the Strength I calibration. The analysis of the GVW variations is useful for comparison purposes to the other definitions. The GVW limit of 80 kips has been increased by 5% here so that vehicles that are reasonably close to the legal limit are still considered as STRENGTH I loads.
Variation 5: Strength I = GVW ≤ 100
Same as Variation 4, but increase the GVW to qualify for inclusion in Strength II to 100 Kips.
Variation 6: Strength I = GVW ≤ 120
Same as Variation 4, but increase the GVW to qualify for inclusion in Strength II to 120 Kips.
Variation 7: Strength I = GVW ≤ 150
Same as Variation 4, but increase the GVW to qualify for inclusion in Strength II to 150 Kips.
Group III: Sorting Based on State Permit Regulations Variation 8: Strength I = State Legal Trucks Only
In this variation trucks that comply with Indiana weight regulations (legal trucks) are grouped into Strength I and all other trucks are grouped in Strength II. Variations 8 and 9 classify any load that violated Federal Formula B (FBF) or axle weights and any load greater than the GVW limit as an illegal load (grouped into Strength II).
Variation 9: Strength I = State Legal Trucks, Annual Permits
In this variation trucks that comply with Indiana weight regulations (legal trucks) and Annual or Routine permits (GVW < 120 Kips) are grouped into Strength I and all other trucks are grouped in Strength II.
Variation 10: Strength I = State Legal Trucks, Illegal Trucks
Permit Variation 10 denotes classifying trucks into Strength I and Strength II based on Indiana permit regulations. All valid Annual and Trip permits are included in Strength II. Indiana requires all permit loads to comply with Federal formula B and the axle weight limits. Variations 10 and 11 classify any load that violates Indiana permit regulations as a non-permit and is grouped into Strength I. This is logical as permit vehicles are able to carry greater total loads by spreading that load over more axles,
F-11
not by overloading individual axles. This definition sets a cutoff GVW for considering if a load is a permit. All loads below that GVW are included in Strength I. For loads above the cutoff of 84 K, if the load satisfies the maximum axle weight limit, the tandem axle weight limit, and Formula B applied to each combination of axles from the front of the vehicle to back then the load is considered a legal permit (included in Strength II). If the load violates any of these criteria it is considered illegal and is included in Strength I. The GVW limit of 80 kips has been increased by 5% here (allowance for WIM measurements) so that vehicles that are reasonably close to the legal limit are still considered as STRENGTH I loads. The single axle weight limit of 20 kip has been increased by 10% since there is greater variation in axle weights than in GVW and to keep permit that a reasonably close within STRENGTH II and not assume they are illegal and therefore belong in STRENGTH I. The same 10% increase in the limit has been applied to the tandem axle limit. The Formula B requirement is checked for each grouping of axles from the front of the vehicle back. No allowance on that requirement has been included. Stated from the perspective of permits, a truck is considered to be a legal permit only if its gross vehicle weight exceeds the minimum value but its configuration is legal (as defined here). Then it is considered in the Strength II data set. Otherwise it is considered part of the Strength I data set.
Variation 11: Strength I = State Legal Trucks, Illegal Trucks, Annual Permits
Variation 11 includes only trip permits (> 120 kips) in Strength II. For Indiana this would include the routine “Overweight” permits with the STRENGTH I data set and only include the “Superload” permits in the STRENGTH II data set. This sorting combination represents the NCHRP 12-76 recommendation for Strength I traffic, which is: all legal loads, illegal loads and all routine permits. Special permits or superloads are grouped into Strength II. Here we see a demonstration of implementing the 12-76 recommendations for grouping trucks using a State’s permit regulations as opposed to an approach that uses the number as axles (Baseline case). They are two different ways of implementing the recommended protocols for grouping traffic data into strength II permits and all others into Strength I.
Group IV: Non Sorted
Variation 12: All vehicles in Strength I The purpose of this variation is to provide a basis for comparison.
b) CALIFORNIA California Permit Regulations California follows the federal weight laws for legal limits. Federal formula B is enforced for axle weight and spacing combinations. The single axle weight limit is 20,000 lbs. Tandem axles group weights are limited to 34,000 lbs. Gross vehicle weights are limited to 80,000 lb. One exception route (Port of Long Beach Route 41) is present but it will not be considered in this study. California issues annual permits for vehicle weights exceeding 80,000 lb and less than 300,000 lb. Permits for more than 300,000 lb are only issued as single trip permits. California requires annual permits satisfy the Purple Weight Table which lists the maximum allowable permit weight on groups of axles as a function of axle spacing, without the gross vehicle weight limit. The maximum allowable weight on groups of axles is given as: 1.50 x 700 (L+40) lbs, where L is the distance first to last axle in feet. The Purple Weight Table also limits the maximum
F-12
tandem axle combination to 60,000 lb. (Special, heavier, tandem axles with 8 tires per axle and 8 or 10 ft wide are allowed a bonus weight – this allowance is not considered in this study). California also limits the number of axles in tractor trailer configurations with annual permits to 6. Crane trucks are also issued annual permits and are allowed up to 8 axles. However the maximum number of axles that can exceed permit weight is 5.
F-13
F-14
California Truck Sorting Strategies Investigated
Group I: Sorting Based on # of Axles
Baseline: Strength I = 6 axles or less
Same as the sorting method used in the original NCHRP 12-76 research. The baseline definition is based on the number of axles being the single strongest indicator determining if a load is a permit or not. As the magnitude of a permit load increases the number of axles to carry that load must increase in order for the permit vehicle to avoid pavement damage. Illegal non-permit overloads are more likely to simply exceed the allowable axle loads. The cutoff used for the baseline definition is that a vehicle having seven or more axles is a Strength II vehicle.
Variation 1: Strength I = 7 axles or less
Increase the number of axles required to qualify for Strength II to 8 or more axles.
Variation 2: Strength I = 8 axles or less
Increase the number of axles required to qualify for Strength II to 8 or more axles.
Variation 3: Strength I = 5 axles or less
Decrease the number of axles required to qualify for Strength II to 6 or more axles.
Group II: Sorting Based on # GVW
Variation 4: Strength I = GVW ≤ 84
This variation switches the basis for the definition from number of axles to Gross Vehicle Weight (GVW). All trucks above 84 Kips are grouped into Strength II as permits. This approach may not be as useful as the axle based definition as it will remove any illegal overloads from the Strength I calibration. The analysis of the GVW variations is useful for comparison purposes to the other definitions. The GVW limit of 80 kips has been increased by 5% here so that vehicles that are reasonably close to the legal limit are still considered as STRENGTH I loads.
Variation 5: Strength I = GVW ≤ 100
Same as Variation 4, but increase the GVW to qualify for inclusion in Strength II to 100 Kips.
Variation 6: Strength I = GVW ≤ 120
Same as Variation 4, but increase the GVW to qualify for inclusion in Strength II to 120 Kips.
F-15
Variation 7: Strength I = GVW ≤ 150
Same as Variation 4, but increase the GVW to qualify for inclusion in Strength II to 150 Kips.
Group III: Sorting Based on State Permit Regulations Variation 8: Strength I = State Legal Trucks
In this variation trucks that comply with CA weight regulations (legal trucks) are grouped into Strength I and all other trucks are grouped in Strength II.
Legal truck: complies with federal axle weight limits, Formula B and GVW < 84 kip Variation 9: Strength I = State Legal Trucks, Annual Permits
In this variation trucks that comply with CA weight regulations (legal trucks) and Annual or Routine permits are grouped into Strength I and all other trucks are grouped in Strength II.
Legal truck: complies with federal axle weight limits, Formula B and GVW < 84 kip Annual Permits: Axle loads comply with 1.50 x 700 (L+40) lbs, GVW < 300 Kips. Provide a +10% allowance for axle loads and a +5% allowance for GVW.
Variation 10: Strength I = State Legal Trucks, Illegal Trucks
Permit Variation 10 denotes classifying trucks into Strength I and Strength II based on CA permit regulations. All valid Annual and Trip permits are included in Strength II. Legal trucks and illegal trucks are grouped in Strength I.
Legal truck: complies with federal axle weight limits, Formula B and GVW < 84 kip Illegal trucks: Trucks that do not meet above noted requirements for legal loads or permits Annual Permits: Axle loads comply with 1.50 x 700 (L+40) lbs, GVW < 300 Kips. Provide a +10% allowance for axle loads and a +5% allowance for GVW. Trip Permits: Axle loads comply with 1.50 x 700 (L+40) lbs, GVW > 300 Kips. Provide a +10% allowance for axle loads and a +5% allowance for GVW.
Variation 11: Strength I = State Legal Trucks, Illegal Trucks, Annual Permits
Variation 11 includes only trip permits in Strength II. This sorting combination represents the NCHRP 12-76 recommendation for Strength I traffic, which is: all legal loads, illegal loads and all routine permits. Special permits or superloads are grouped into Strength II. Trip Permits: Axle loads comply with 1.50 x 700 (L+40) lbs, GVW > 300 Kips. Provide a +10% allowance for axle loads and a +5% allowance for GVW.
F-16
Group IV: Non Sorted
Variation 12: All vehicles in Strength I
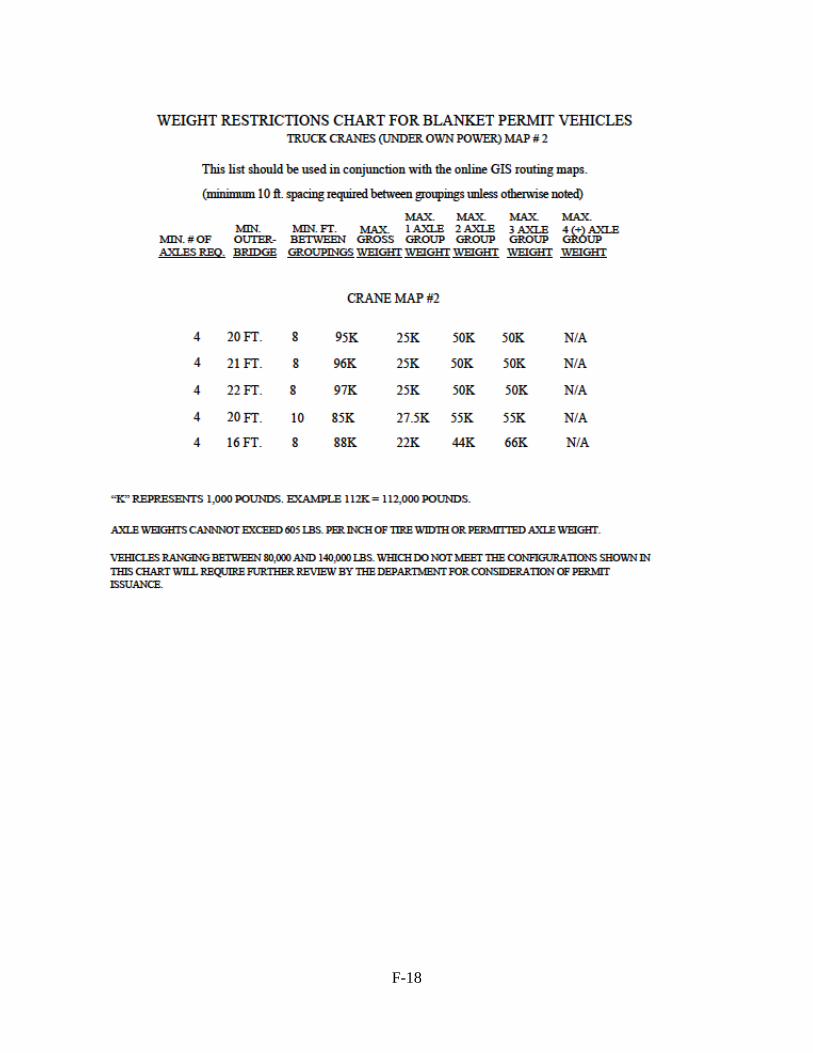
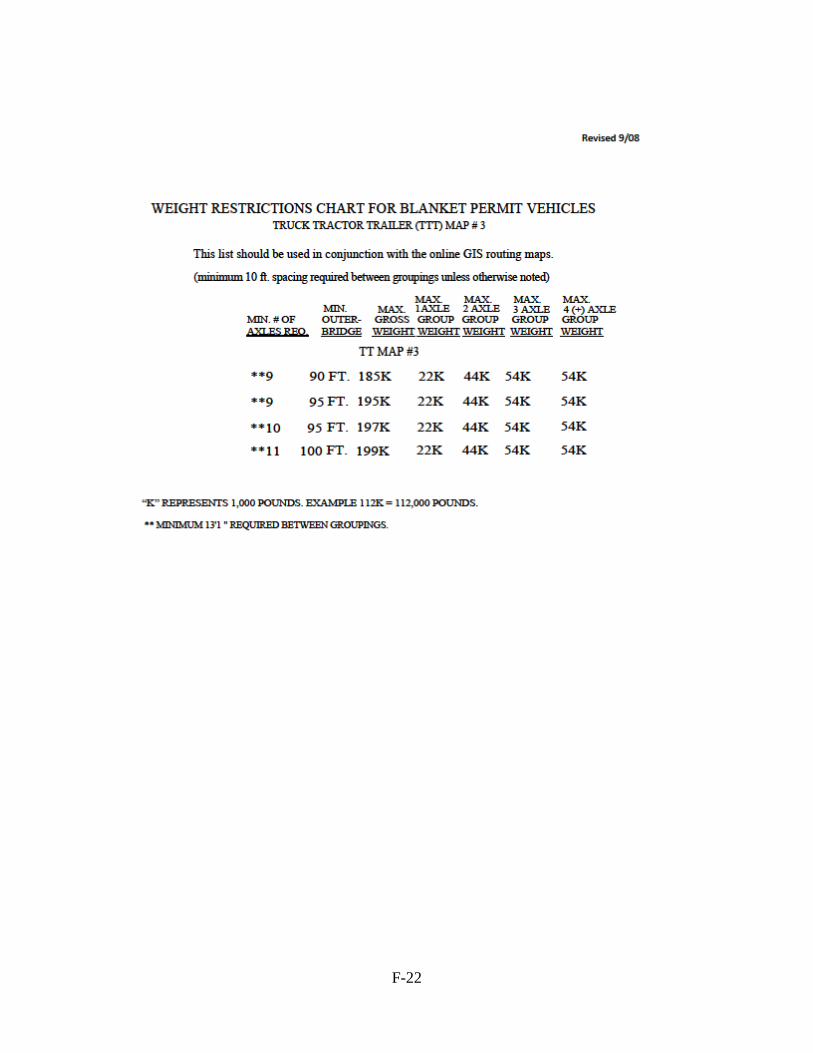
The purpose of this variation is to provide a basis for comparison. c) FLORIDA Florida Permit Regulations The Florida “Commercial Motor Vehicle Manual” 6th Edition defines legal and permit loads for the state of Florida. Florida regulations mostly follow the federal legal load definitions. The legal single axle weight is set at 22,000 lbs and the legal tandem axle weight is 44,000 lbs. One difference between the typical federal legal load definitions and the Florida regulations is a grandfather exemption for short single-unit trucks. Florida allows short single-unit trucks as legal loads up to 70,000 lbs with the 22,000 lb axle weight requirement, these vehicles do not meet the federal formula B requirement. The Florida manual specifies legal loads using both the outer-bridge distance and inner-bridge distances. The inner-bridge distances allow the same checking as is done using federal formula B for tractor trailers. Tractor trailers meet the federal formula B requirements and have a maximum legal gross vehicle weight of 80,000 lbs. Florida requires an overload permit for any vehicle that exceeds 80,000 lbs. Florida issues blanket permits (annual) based upon predefined routes shown on maps. These blanket permits are issued based on weight restriction charts matched to the maps for truck cranes and tractor trailers. The weight restriction charts are shown as Figures X to X. The weight restriction charts use number of axles, minimum outer-bridge distance, and maximum axle group weights. Minimum distances between axle groups are also dictated. The outer-bridge distance is the length of the vehicle from front to rear axle. Florida also places a limitation on special permit vehicles given in the Axle Weight Limitations table of 40,000 lbs for an axle with 8 tires. For the typical blanket permits of greatest interest the highest single axle limit is 27.500 lbs and the highest gross vehicle weight limit is 199,000 lbs.
F-17
F-18
F-19
F-20
F-21
F-22
F-23
Florida Truck Sorting Strategies Investigated
Group I: Sorting Based on # of Axles
Baseline: Strength I = 6 axles or less
Same as used in the original NCHRP 12-76 Approach. The permit baseline definition is based on the number of axles being the single strongest indicator determining if a load is a permit or not. As the magnitude of a permit load increases the number of axles to carry that load must increase in order for the permit vehicle to avoid pavement damage. Illegal non-permit overloads are more likely to simply exceed the allowable axle loads. The cutoff used for the baseline definition is that a vehicle having seven or more axles is a Strength II vehicle.
Variation 1: Strength I = 7 axles or less
Increase the number of axles required to qualify for Strength II to 8 or more axles.
Variation 2: Strength I = 8 axles or less
Increase the number of axles required to qualify for Strength II to 9 or more axles.
Variation 3: Strength I = 5 axles or less
Decrease the number of axles required to qualify for Strength II to 6 or more axles.
Group II: Sorting Based on GVW
Variation 4: Strength I = GVW ≤ 84
This variation switches the basis for the definition from number of axles to Gross Vehicle Weight (GVW). All trucks above 84 Kips are grouped into Strength II as permits. This approach may not be as useful as the axle based definition as it will remove any illegal overloads from the Strength I calibration. The analysis of the GVW variations is useful for comparison purposes to the other definitions. The GVW limit of 80 kips has been increased by 5% here so that vehicles that are reasonably close to the legal limit are still considered as STRENGTH I loads.
Variation 5: Strength I = GVW ≤ 100
Same as Variation 4, but increase the GVW to qualify for inclusion in Strength II to 100 Kips.
Variation 6: Strength I = GVW ≤ 120
Same as Variation 4, but increase the GVW to qualify for inclusion in Strength II to 120 Kips.
Variation 7: Strength I = GVW ≤ 150
Same as Variation 4, but increase the GVW to qualify for inclusion in Strength II to 150 Kips.
F-24
Group III: Sorting Based on State Permit Regulations
Variation 8: Strength I = State Legal Trucks
In this variation trucks that comply with Florida weight regulations (Legal Trucks) are grouped into Strength I and all other trucks are grouped in Strength II. Legal truck: The legal single axle weight is set at 22,000 lbs and the legal tandem axle weight is 44,000 lbs. Grandfather exemption for short single-unit trucks in Florida allows short single-unit trucks as legal loads up to 70,000 lbs with the 22,000 lb axle weight requirement, these vehicles do not meet the federal formula B requirement. Tractor trailers meet the federal formula B requirements and have a maximum legal gross vehicle weight of 80,000 lbs.
Variation 9: Strength I = State Legal Trucks, Annual Permits
In this variation trucks that comply with Florida weight regulations (legal trucks) and Annual or Routine permits are grouped into Strength I and all other trucks are grouped in Strength II.
Legal truck: See variation 8 Annual Permits: Florida requires an overload permit for any vehicle that exceeds 80,000 lbs. Florida issues blanket permits (annual) are issued based on weight restriction charts shown as Figures X to X. For the typical blanket permits the highest single axle limit is 27.500 lbs and the highest gross vehicle weight limit is 199,000 lbs. Provide a +10% allowance for axle loads and a +5% allowance for GVW.
Variation 10: Strength I = State Legal Trucks, Illegal trucks
Permit Variation 10 denotes classifying trucks into Strength I and Strength II based on Florida permit regulations. All valid Annual and Trip permits are included in Strength II. Legal trucks and illegal trucks are grouped in Strength I.
Legal truck: See Variation 8
Illegal trucks: Trucks that do not meet above noted requirements for legal loads or permits
Variation 11: Strength I = State Legal Trucks, Illegal trucks, Annual Permits
Variation 11 includes only trip permits in Strength II. This sorting combination represents the NCHRP 12-76 recommendation for Strength I traffic, which is: all legal loads, illegal loads and all routine permits. Special permits or superloads are grouped into Strength II. Trip Permits: Trucks exceeding 199, 000 lbs
F-25
Group IV: Non Sorted
Variation 12: All vehicles in Strength I
The purpose of this variation is to provide a basis for comparison.
F-26
REVIEW OF RESULTS Introduction The sorting variations are grouped into four groups to facilitate discussions: Group I: Sorting Based on # of Axles
Baseline: Strength I = 6 axles or less Variation P1: Strength I = 7 axles or less Variation P2: Strength I = 8 axles or less Variation P3: Strength I = 5 axles or less
Group II: Sorting Based on GVW
Variation P4: Strength I = GVW ≤ 84 Variation P5: Strength I = GVW ≤ 100 Variation P6: Strength I = GVW ≤ 120 Variation P7: Strength I = GVW ≤ 150
Group III: Sorting Based on State Permit Regulations
Variation P8: Strength I = State Legal Trucks only Variation P9: Strength I = State Legal Trucks, Annual (Routine) Permits Variation P10: Strength I = State Legal Trucks, Illegal Trucks Variation P11: Strength I = State Legal Trucks, Illegal Trucks, Annual Permits (only Trip Permits in
Strength II) Group IV: Non Sorted
Variation P12: All vehicles in Strength I Additional insight into the influence of truck sorting strategies on “r” values is gained by investigating the variations in “r” values based on:
1. Force effects such as simple span moment, simple span shear, and negative bending 2. Span length (20 ft, 60 ft, 120 ft)
GENERAL TRENDS IN STRENGTH I MAXIMUM “r” VALUES The maximum moment or shear values of “r” for all span lengths considered (from 20 foot up to 200 foot) have been tabulated in Table 9 for sorting variations P1 through P12 and the baseline sorting strategy. Table 10 gives the number of trucks included in Strength II based on the sorting criteria. The total number of truck records for each site is given in Tables 2, 3 and 4.
1. As can be seen in the variations of “r” for STRENTH I in the following tables the variations in number of axles do not have a large impact upon the “r” values.
2. Increasing GVW for trucks in Strength I leads to a small increase in “r” values. 3. Configurations of the trucks as governed by state permit regulations (and weight regulations) have the
greatest influence on “r” values than either GVW or the number of axles. 4. Compared with P12 where all trucks are in Strength I, P8 and P9 see a big drop in Strength I “r” values.
In P8 and P9 all illegal trucks and trip permits are moved to Strength II.
F-27
5. Comparing P8, P9 and P10 is instructive. The inclusion of Annual permits in along with legal trucks P9 only resulted in a small increase in “r” values. However, when illegal trucks are added to legal trucks in P10, we see a significant increase in “r” values.
6. Comparing P11 to P12, the only difference is that Trip permits are added to Strength I in P12. It is evident that adding Trip permits causes no noticeable change in max “r” values.
7. This shows that heavy permits when they are legal and comply with permit regulations do not induce significant load effects. In P10 and P11 overloaded trucks not complying with permit or weight regulations were grouped into Strength I, which led to high “r” values.
8. Florida Site 9919 did not show a jump in “r” values between P9 and P10 as for the other sites. This may be explained by the low number of illegal trucks (only 24) at this site given in P9 in Table 10. With the exception of these 24 trucks, this site has only legal loads and Annual permits that comply with all permit regulations. With this high level of compliance the “r” values are predictably low. As the number of illegal loads increase for the other two Florida sites, the “r’ values are also show a big increase.
9. From Table 10, it is evident that very few trip permits were recorded, but there was quite a large volume of Annual permits (P10 –P11).
10. Most Strength II trucks in Indiana were classified as illegal (P9-P11). Most Strength II trucks in Florida were classified as Annual permits (P10-P11).In California the Strength II trucks were equally divided between illegal trucks and Annual permits (P9 and P10).
11. There is a big drop in number of Strength II trucks with axles > 7 (Baseline) and GVW > 100. 12. Baseline and P11 results provide a useful comparison. Both sorting cases seek to include all legal trucks,
illegal overloads and un-analyzed permits (all Annual/Routine permits) into Strength I, but execute this by different approaches as previously discussed. For Florida the results are comparable. For Indiana P11 is slightly higher. For California is about 30% higher. This means that CA has more Annual permits or illegal loads with number of axles greater than 7, which were being grouped into Strength II in the Baseline case. Using a state’s permit & weight regulations as in P11 to group trucks into Strength I and Strength II is considered more rational, whereas the axles based approach used in the 12-76 protocols is considered simpler, yet less precise, when using national WIM data.
-
F-28
Table 9: Summary of maximum Strength I “r” values for all WIM sites.
Maximum " r " Values Strength I
Sorting Variation IN WIM Sites CA WIM Sites FL WIM Sites 9544 9532 9512 Site 0003 Site 0059 Site 0072 9919 9926 9936
Non Sorted All Trucks in Str I P12 2.11 1.45 1.38 1.46 1.36 1.54 0.95 2.21 2.15
F-29
Table 10: Number of Trucks in Strength II for all WIM sites.
Number of Trucks in Strength II for all WIM sites.
Sorting Variation IN WIM Sites CA WIM Sites FL WIM Sites
9544 9532 9512 Site 0003 Site 0059 Site 0072 9919 9926 9936
# Axles
Str.II: # Axles > 6 P3 199,100
7,423 35,375 16,106 66,875 16,987 33,846
48,682
27,676
Str. II: # Axles > 7 (Baseline) 41,272
839 2,855 777 9,730 509 2,361
3,308
2,282
Str.II: # Axles > 8 P1 13,720
320 1,085 577 667 297 665 523 791
Str. II: # Axles > 9 P2 5,181
52 493 473 509 169 111 143 210
GVW
Str.II: GVW > 84 P4 67,747
2,534 96,768 1,308 10,224 1,310
2,598
80,849
202,613
Str.II: GVW > 100 P5 14,251
616 3,288 636 942 330
638
4,410
26,600
Str.II: GVW > 120 P6 2,055
169 1,183 333 503 132
108
1,171
1,700
Str. II: GVW > 150 P7 186
32 288 175 194 61 1 140 399
State Permit Regulations
Str II: Illegal, Annual & Trip Permits P8 117,494
17,811 157,731 2,694 49,012 2,611
4,413
222,641
237,943
Str II: Illegal & Trip Permits P9 110,809
17,378 140,132 1,576 26,487 1,200
24
3,263
3,009
Str II: Annual & Trip Permits P10 6,720
433 17,633 1,118 22,525 1411
4,389
219,382
234,954
Str II: Only Trip Permits P11 35 0 34 0 0 0
0 4 20
Non Sorted No Trucks in Str II P12 0 0 0 0 0 0 0 0 0
F-30
DETAILED REVIEW OF STRENGTH I MAXIMUM “r” VALUES
One WIM site from each state has been selected for a more in-depth review and discussion and will serve as representative examples of the other sites for each state. The sites to be discussed are:
Table 11: WIM Sites for Detailed Review State Site ID Route Dir # Truck
Records ADTT
IN 9544 I-80/I-94 E 3786127 11235 IN 9544 I-80/I-94 W 4032537 11966 CA 0059 LA710 S 4243780 11627 FL 9936 I-10 E 700774 1980 FL 9936 I-10 W 723512 2044
Additional insight into the influence of truck sorting strategies on “r” values is gained by investigating the variations in “r” values based on:
1. Force effects such as simple span moment, simple span shear, and negative bending 2. Span length (20 ft to 200 ft)
The sorting variations are grouped into four groups to facilitate discussions:
Group I: Sorting Based on # of Axles:
Group II: Sorting Based on GVW:
Group III: Sorting Based on State Permit Regulations:
Group IV: Non Sorted. Used as a reference for sensitivity analysis
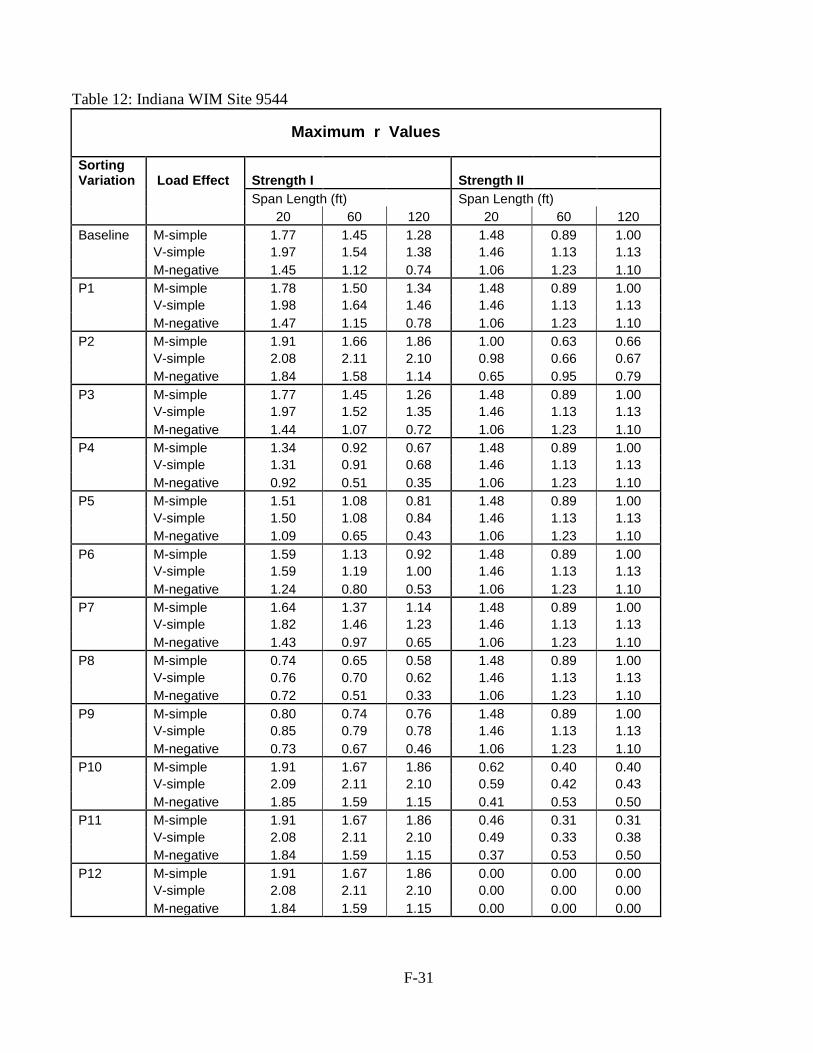
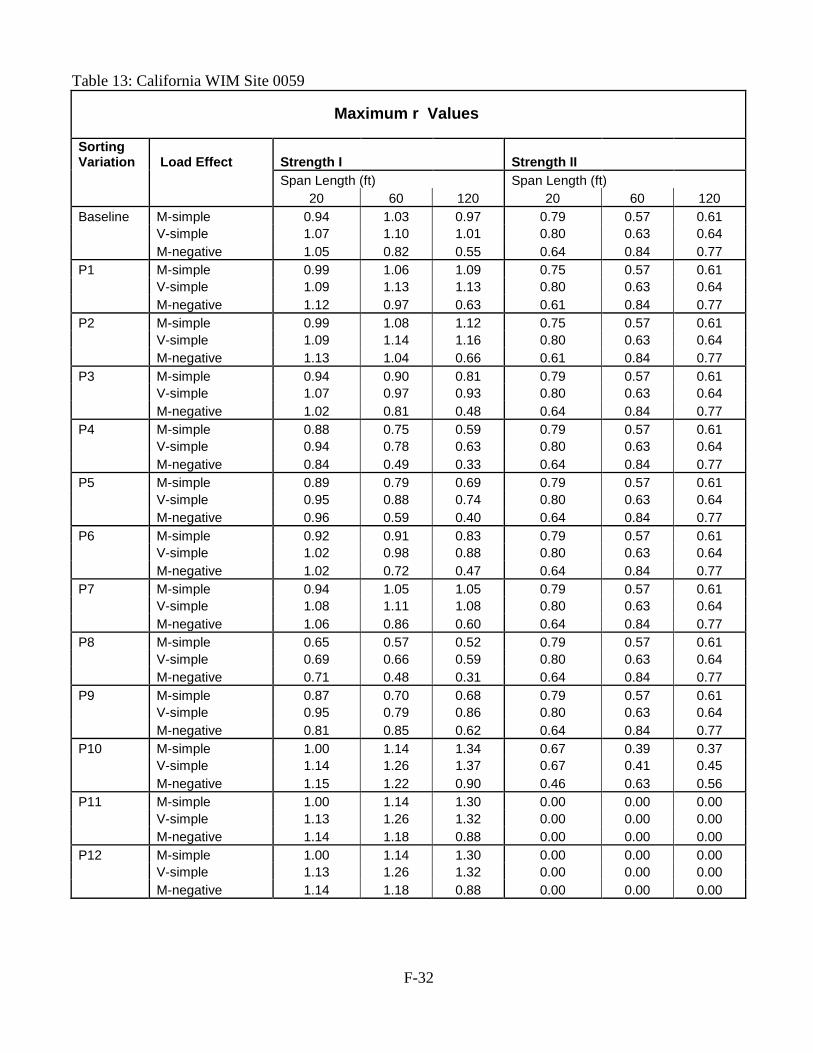
Maximum “r” values for each of these three sites in given in Tables 12, 13 and 14 by load effect and by span length. The same is given for all other WIM sites in Appendix A.
Group I: Sorting Variation Based on Number of Axles
The following sorting variations will be discussed under Group I:
Baseline: Strength I = 6 axles or less P1: Strength I = 7 axles or less P2: Strength I = 8 axles or less P3: Strength I = 5 axles or less
Indiana Site 9544
Fig. 1 Strength I Moment r Values vs Span Lengths, IN Site 9544
0.00
0.50
1.00
1.50
2.00
2.50
20 40 60 80 100 120 160 200
Strength I M-simple
Baseline
P1
P2
P3
F-35
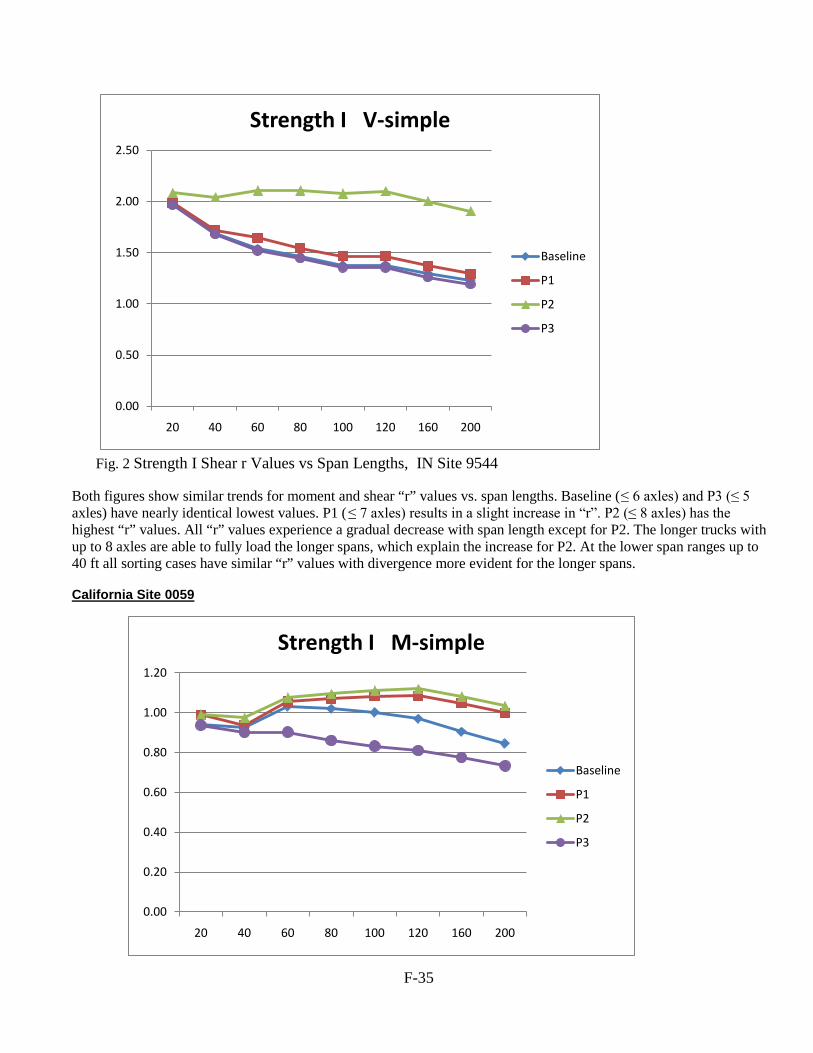
Fig. 2 Strength I Shear r Values vs Span Lengths, IN Site 9544 Both figures show similar trends for moment and shear “r” values vs. span lengths. Baseline (≤ 6 axles) and P3 (≤ 5 axles) have nearly identical lowest values. P1 (≤ 7 axles) results in a slight increase in “r”. P2 (≤ 8 axles) has the highest “r” values. All “r” values experience a gradual decrease with span length except for P2. The longer trucks with up to 8 axles are able to fully load the longer spans, which explain the increase for P2. At the lower span ranges up to 40 ft all sorting cases have similar “r” values with divergence more evident for the longer spans. California Site 0059
0.00
0.50
1.00
1.50
2.00
2.50
20 40 60 80 100 120 160 200
Strength I V-simple
Baseline
P1
P2
P3
0.00
0.20
0.40
0.60
0.80
1.00
1.20
20 40 60 80 100 120 160 200
Strength I M-simple
Baseline
P1
P2
P3
F-36
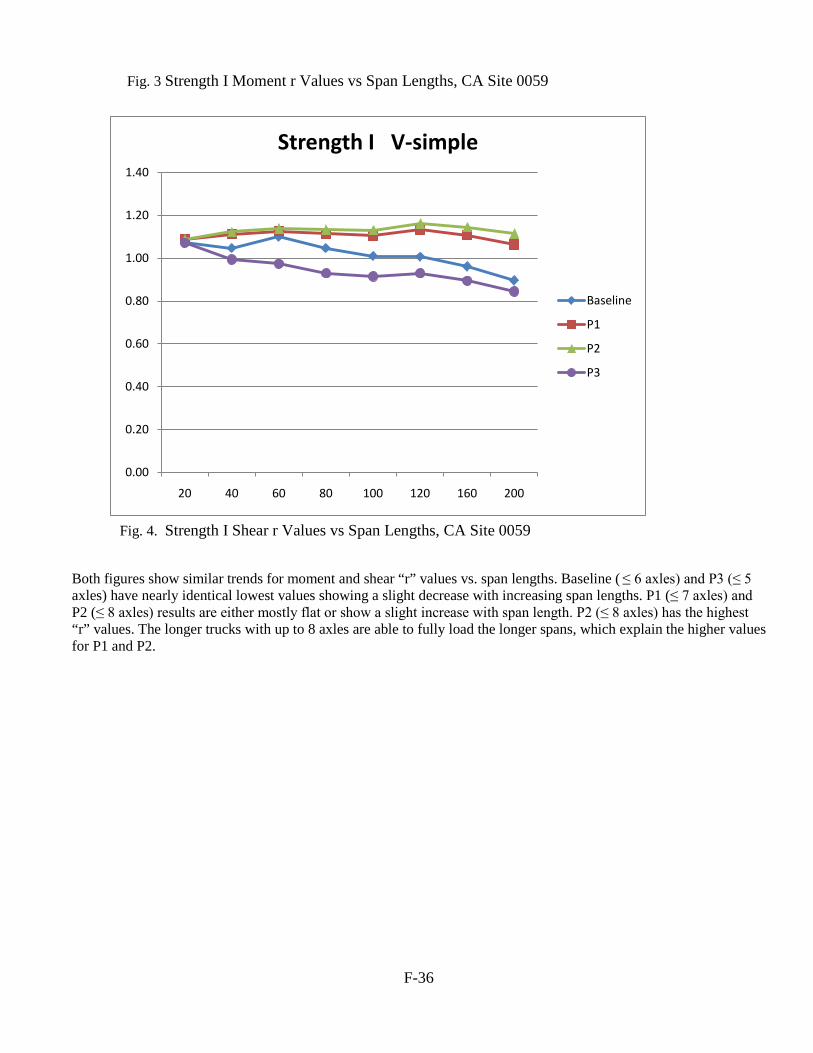
Fig. 3 Strength I Moment r Values vs Span Lengths, CA Site 0059
Fig. 4. Strength I Shear r Values vs Span Lengths, CA Site 0059 Both figures show similar trends for moment and shear “r” values vs. span lengths. Baseline ( ≤ 6 axles) and P3 (≤ 5 axles) have nearly identical lowest values showing a slight decrease with increasing span lengths. P1 (≤ 7 axles) and P2 (≤ 8 axles) results are either mostly flat or show a slight increase with span length. P2 (≤ 8 axles) has the highest “r” values. The longer trucks with up to 8 axles are able to fully load the longer spans, which explain the higher values for P1 and P2.
0.00
0.20
0.40
0.60
0.80
1.00
1.20
1.40
20 40 60 80 100 120 160 200
Strength I V-simple
Baseline
P1
P2
P3
F-37
Florida Site 9936
Fig. 5 Strength I Moment r Values vs Span Lengths, FL Site 9936
0.00
0.50
1.00
1.50
2.00
2.50
20 40 60 80 100 120 160 200
Strength I M-simple
Baseline
P1
P2
P3
0.00
0.50
1.00
1.50
2.00
2.50
20 40 60 80 100 120 160 200
Strength I V-simple
Baseline
P1
P2
P3
F-38
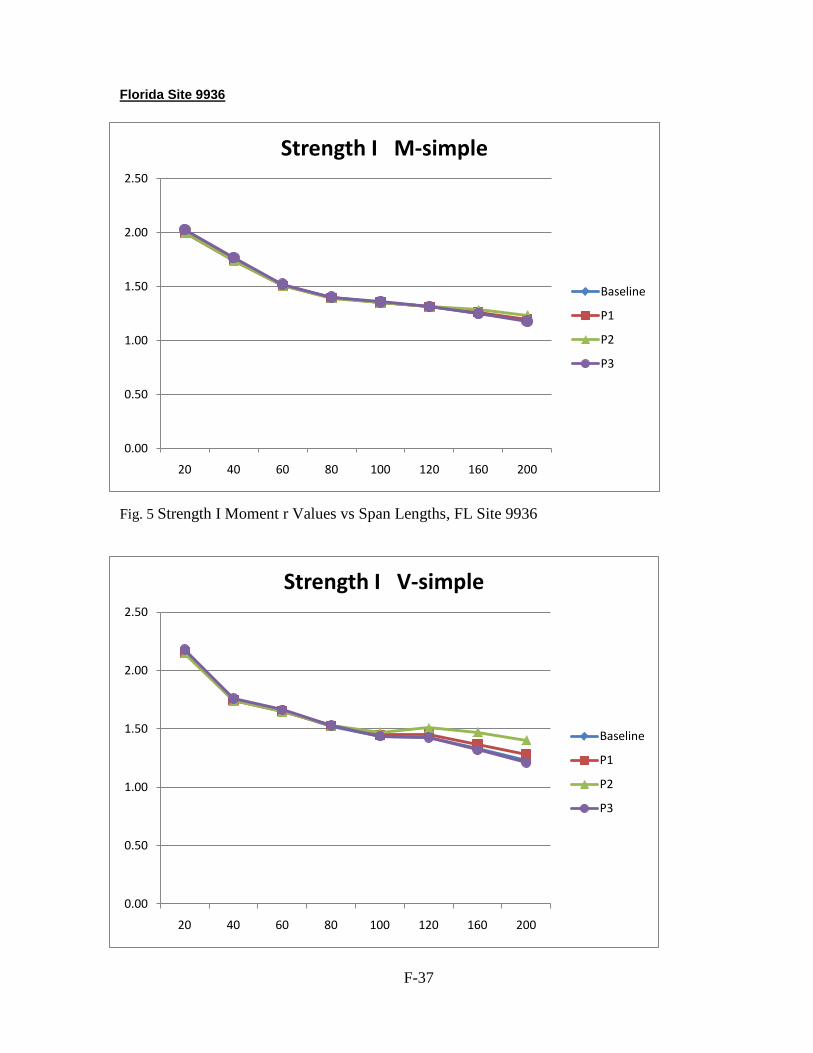
Fig. 6 Strength I Shear r Values vs Span Lengths, FL Site 9936 Unlike the IN and CA sites the FL site shows very little divergence for the sorting strategies based on number of axles. The “r” values are essentially identical except for spans above 120 ft. This indicates that for Florida sorting trucks into Strength I and Strength II by using number of axles as a criterion may not be very effective, though the maximum “r” values remain mostly unchanged.
Group II: Sorting Variation Based on GVW
The following sorting variations will be discussed under Group II:
P4: Strength I = GVW ≤ 84
P5: Strength I = GVW ≤ 100
P6: Strength I = GVW ≤ 120
P7: Strength I = GVW ≤ 150 Indiana Site 9544
Fig. 7 Strength I Moment r Values vs Span Lengths, IN Site 9544
0.00
0.20
0.40
0.60
0.80
1.00
1.20
1.40
1.60
1.80
2.00
20 40 60 80 100 120 160 200
Strength I M-simple
Baseline
P4
P5
P6
P7
F-39
Fig. 8 Strength I Shear r Values vs Span Lengths, IN Site 9544 The Group II graphs for IN site 9544 exhibit a consistent pattern for maximum load effects. The “r” values for shear and moment for P4 thru P7 show a gradual decrease with increasing span lengths (Fig 7 and Fig 8). The “r” values are higher as the GVW cut off is increased. Thus P7 (GVW ≤ 150 K) has the highest values and P4 (GVW ≤ 84 K) has the lowest values for a given span length. It should be noted that for short spans less than 40 ft the “r” values are greater than 1.0 for all Group II sorting variations.
0.00
0.50
1.00
1.50
2.00
2.50
20 40 60 80 100 120 160 200
Strength I V-simple
Baseline
P4
P5
P6
P7
F-40
California Site 0059
Fig. 9 Strength I Moment r Values vs Span Lengths, CA Site 0059
Fig. 10 Strength I Shear r Values vs Span Lengths, CA Site 0059
0.00
0.20
0.40
0.60
0.80
1.00
1.20
20 40 60 80 100 120 160 200
Strength I M-simple
Baseline
P4
P5
P6
P7
0.00
0.20
0.40
0.60
0.80
1.00
1.20
20 40 60 80 100 120 160 200
Strength I V-simple
Baseline
P4
P5
P6
P7
F-41
The Group II graphs for CA site 0059 also exhibits a pattern similar to the IN site. The “r” values for shear and moment for P4 thru P6 show a gradual decrease with increasing span lengths (Fig 9 and Fig 10). The “r” values are higher as the GVW cut off is increased. One difference from the IN site is that P7 (GVW ≤ 150 K) “r” values do not show much change with span lengths. Also the “r” values for all Group II sorting variations, except P7, are less than 1.0. Even the P7 “r” values only reach a maximum of 1.11.The “r” values for the IN site were as high as 1.82 for Group II sorting variations. Florida Site 9936
Fig. 11 Strength I Moment r Values vs Span Lengths, FL Site 9936
0.00
0.50
1.00
1.50
2.00
2.50
20 40 60 80 100 120 160 200
Strength I M-simple
Baseline
P4
P5
P6
P7
F-42
Fig. 12 Strength I Shear r Values vs Span Lengths, FL Site 9936 The Group II graphs for FL site 9936 exhibit a consistent pattern for maximum load effects similar to the IN site. The “r” values for shear and moment for P4 thru P7 show a gradual decrease with increasing span lengths (Fig 11 and Fig 12). The “r” values are higher as the GVW cut off is increased. Thus P7 (GVW ≤ 150 K) has the highest values and P4 (GVW ≤ 84 K) has the lowest values for a given span length. It should be noted that for short spans less than 40 ft the “r” values are greater than 1.0 for all Group II sorting variations.
0.00
0.50
1.00
1.50
2.00
2.50
20 40 60 80 100 120 160 200
Strength I V-simple
Baseline
P4
P5
P6
P7
F-43
Group III: Sorting Variation Based on State Permit Regulations
The following sorting variations will be discussed under Group III:
P8: Strength I = State legal trucks P9: Strength I = State legal trucks + Annual Permits P10: Strength I = State legal trucks + Illegal trucks
P11: Strength I = State legal trucks + Illegal trucks + Annual permits P12: Strength I = All trucks Indiana Site 9544
Fig. 13 Strength I Moment r Values vs Span Lengths, IN Site 9544
0.00
0.50
1.00
1.50
2.00
2.50
20 40 60 80 100 120 160 200
Strength I M-simple
Baseline
P8
P9
P10
P11
P12
F-44
Fig. 14 Strength I Shear r Values vs Span Lengths, IN Site 9544
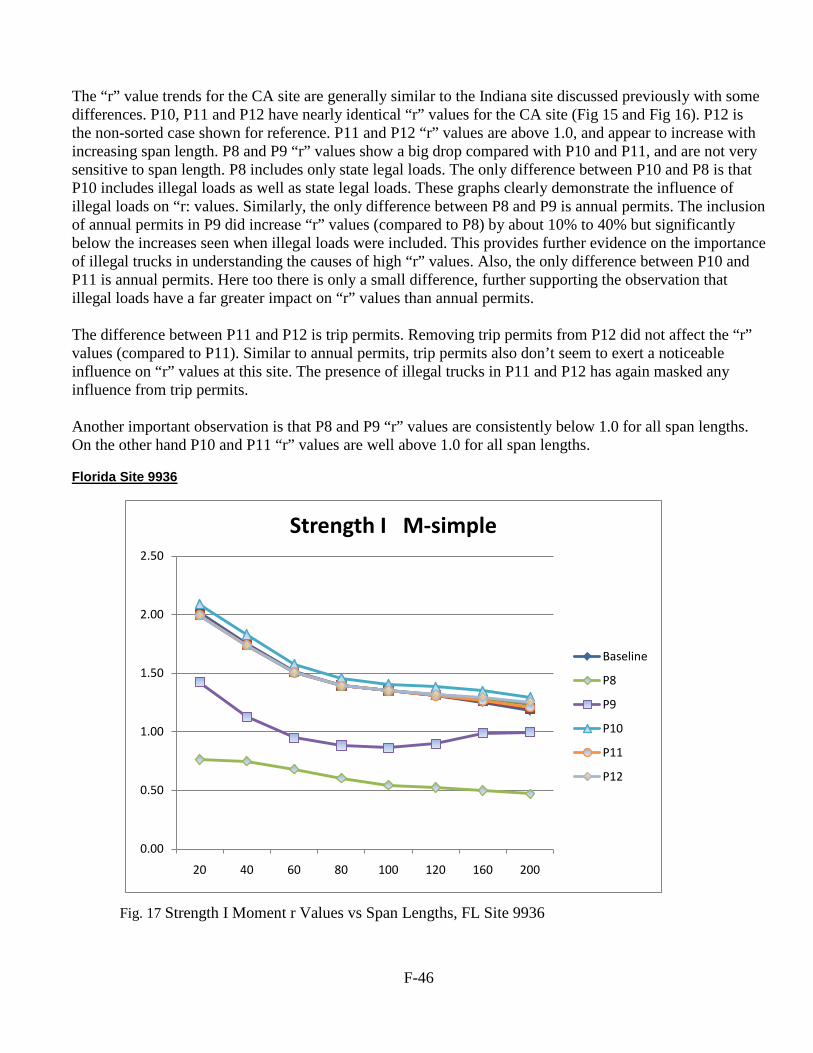
P10, P11 and P12 have nearly identical “r” values For the Indiana site (Fig 13 and Fig 14). P12 is the non-sorted case shown for reference. P11 and P12 “r” values are well above 1.0, and even exceed 2.0 for shear, and are not particularly sensitive to span length. P8 and P9 “r” values show a big drop compared with P10 and P11, and are also not particularly sensitive to span length. P8 includes only state legal loads. The only difference between P10 and P8 is that P10 includes illegal loads as well as state legal loads. These graphs clearly demonstrate the influence of illegal loads on “r: values. Similarly, the only difference between P8 and P9 is annual permits. The fact that the inclusion of annual permits in P9 had only a small effect on “r” values (compared to P8) provides further evidence on the importance of illegal trucks in understanding the causes of high “r” values. Also, the only difference between P10 and P11 is annual permits. Here too there is no discernible impact on ‘r” values (masked by the illegal loads) further supporting the observation that illegal loads have a far greater impact on “r” values than annual permits. The difference between P11 and P12 is trip permits. Removing trip permits from P12 did not affect the “r” values (compared to P11). Similar to annual permits, trip permits also don’t seem to exert a noticeable influence on “r” values at this site. The presence of illegal trucks in P11 and P12 has again masked any influence from trip permits. Another important observation is that P8 and P9 “r” values are consistently below 1.0 for all span lengths. On the other hand P10 and P11 “r” values are well above 1.0 for all span lengths.
0.00
0.50
1.00
1.50
2.00
2.50
20 40 60 80 100 120 160 200
Strength I V-simple
Baseline
P8
P9
P10
P11
P12
F-45
California Site 0059
Fig. 15 Strength I Moment r Values vs Span Lengths, CA Site 0059
Fig. 16 Strength I Shear r Values vs Span Lengths, CA Site 0059
0.00
0.20
0.40
0.60
0.80
1.00
1.20
1.40
1.60
20 40 60 80 100 120 160 200
Strength I M-simple
Baseline
P8
P9
P10
P11
P12
0.00
0.20
0.40
0.60
0.80
1.00
1.20
1.40
1.60
20 40 60 80 100 120 160 200
Strength I V-simple
Baseline
P8
P9
P10
P11
P12
F-46
The “r” value trends for the CA site are generally similar to the Indiana site discussed previously with some differences. P10, P11 and P12 have nearly identical “r” values for the CA site (Fig 15 and Fig 16). P12 is the non-sorted case shown for reference. P11 and P12 “r” values are above 1.0, and appear to increase with increasing span length. P8 and P9 “r” values show a big drop compared with P10 and P11, and are not very sensitive to span length. P8 includes only state legal loads. The only difference between P10 and P8 is that P10 includes illegal loads as well as state legal loads. These graphs clearly demonstrate the influence of illegal loads on “r: values. Similarly, the only difference between P8 and P9 is annual permits. The inclusion of annual permits in P9 did increase “r” values (compared to P8) by about 10% to 40% but significantly below the increases seen when illegal loads were included. This provides further evidence on the importance of illegal trucks in understanding the causes of high “r” values. Also, the only difference between P10 and P11 is annual permits. Here too there is only a small difference, further supporting the observation that illegal loads have a far greater impact on “r” values than annual permits. The difference between P11 and P12 is trip permits. Removing trip permits from P12 did not affect the “r” values (compared to P11). Similar to annual permits, trip permits also don’t seem to exert a noticeable influence on “r” values at this site. The presence of illegal trucks in P11 and P12 has again masked any influence from trip permits. Another important observation is that P8 and P9 “r” values are consistently below 1.0 for all span lengths. On the other hand P10 and P11 “r” values are well above 1.0 for all span lengths. Florida Site 9936
Fig. 17 Strength I Moment r Values vs Span Lengths, FL Site 9936
0.00
0.50
1.00
1.50
2.00
2.50
20 40 60 80 100 120 160 200
Strength I M-simple
Baseline
P8
P9
P10
P11
P12
F-47
Fig. 18 Strength I Shear r Values vs Span Lengths, FL Site 9936 The “r” value trends for the FL site are generally similar to the Indiana and California site discussed previously with some differences. P10, P11 and P12 have nearly identical “r” values that remain well above 1.0 for all span lengths, but exhibit a gradual decrease with increasing span lengths (Fig 17 and Fig 18). P12 is the non-sorted case shown for reference. P8 includes only state legal loads and is consistently below 1.0 for all span lengths. P8 and P9 “r” values show a big drop compared with P10 and P11, and are not very sensitive to span length. The only difference between P10 and P8 is that P10 includes illegal loads as well as state legal loads. These graphs clearly demonstrate the influence of illegal loads on “r: values. Similarly, the only difference between P8 and P9 is annual permits. The inclusion of annual permits in P9 did increase “r” values (compared to P8) by about 20% to 70% but less than the increases seen when illegal loads were included. This provides further evidence on the importance of illegal trucks in understanding the causes of high “r” values. Also, the only difference between P10 and P11 is annual permits. Here too there is only a small difference, further supporting the observation that illegal loads have a far greater impact on “r” values than annual permits. The difference between P11 and P12 is trip permits. Removing trip permits from P12 did not noticeably affect the “r” values (compared to P11). Similar to annual permits, trip permits also don’t seem to exert a noticeable influence on “r” values at this site. The presence of illegal trucks in P11 and P12 has again masked any influence from trip permits.
0.00
0.50
1.00
1.50
2.00
2.50
20 40 60 80 100 120 160 200
Strength I V-simple
Baseline
P8
P9
P10
P11
P12
F-48
SENSITIVITY ANALYSIS OF STRENGTH I MAXIMUM “r” VALUES
The previous sections compared the maximum “r” values for the Baseline and sorting variations P1 thru P12 by grouping them into the following:
Group I: Baseline, P1, P2, and P3 Sorting Based on # of Axles:
Group II: P4, P5, P6 and P7 Sorting Based on GVW:
Group III: P8, P9, P10 and P11 Sorting Based on State Permit Regulations:
Group IV: Non Sorted. P12 Used as a reference for sensitivity analysis A more detailed discussion of influence of truck sorting strategies on “r” values was provided by investigating the variations in “r” values based on:
1. Force effects such as simple span moment, simple span shear, and negative bending 2. Span lengths (20 ft to 200 ft)
Sensitivity Analysis Using r Differentials for Strength I This section is comprised of the findings of a sensitivity analysis performed on “r” values by defining a new metric for Strength I termed the “r Differential”. This metric is defined as:
r Differential = [(r12 - rx) / r12 ] x 100% (1)
Where: r12 = “r” value for reference case P12 which includes all trucks in Strength I rx = “r” value for sorting variation Px (could be anyone of P1 thru P11 or Baseline) It provides a quantification of how the “r” value changes in percentage terms as various trucks are removed from P12 the Reference Case that was not sorted and includes all trucks in Strength I. This is described using Table 15 below that gives the types of trucks included in Strength I for each sorting case.
F-49
Table 15: Sorting Variations Showing Trucks in Strength I Sorting Variation Trucks in Strength I
P12 All trucks
GROUP I (Based on # of Axles) P3 Trucks with 5 or fewer axles
P1 Trucks with 7 or fewer axles
Baseline Trucks with 6 or fewer axles
P2 Trucks with 8 or fewer axles
GROUP II (Based on GVW) P4 Trucks with GVW ≤ 84 Kips P5 Trucks with GVW ≤ 100 Kips P6 Trucks with GVW ≤ 120 Kips
P7 Trucks with GVW ≤ 150 Kips
GROUP III (Based on State Permit Regulations)
P8 State Legal Trucks only
P9 State Legal Trucks, Annual (Routine) Permits
P10 State Legal Trucks, Illegal Trucks
P11 State Legal Trucks, Illegal Trucks, Annual (Routine) Permits (All trucks but Trip Permits in Strength I)
For instance, to understand how sensitive the “r” values are when trucks that weigh more than 120 Kips are excluded from Strength I, the following “r Differential” is executed:
r Differential for P6 = [(r12 – r6) / r12 ] x 100% To understand how sensitive the “r” values are when Trip Permits are excluded from Strength I, the following “r Differential” is executed:
r Differential for P11 = [(r12 – r11) / r12 ] x 100% Similarly, to understand how sensitive the “r” values are when all trucks but State legal loads are excluded from Strength I, the following “r Differential” is executed:
r Differential for P8 = [(r12 – r8) / r12 ] x 100%
F-50
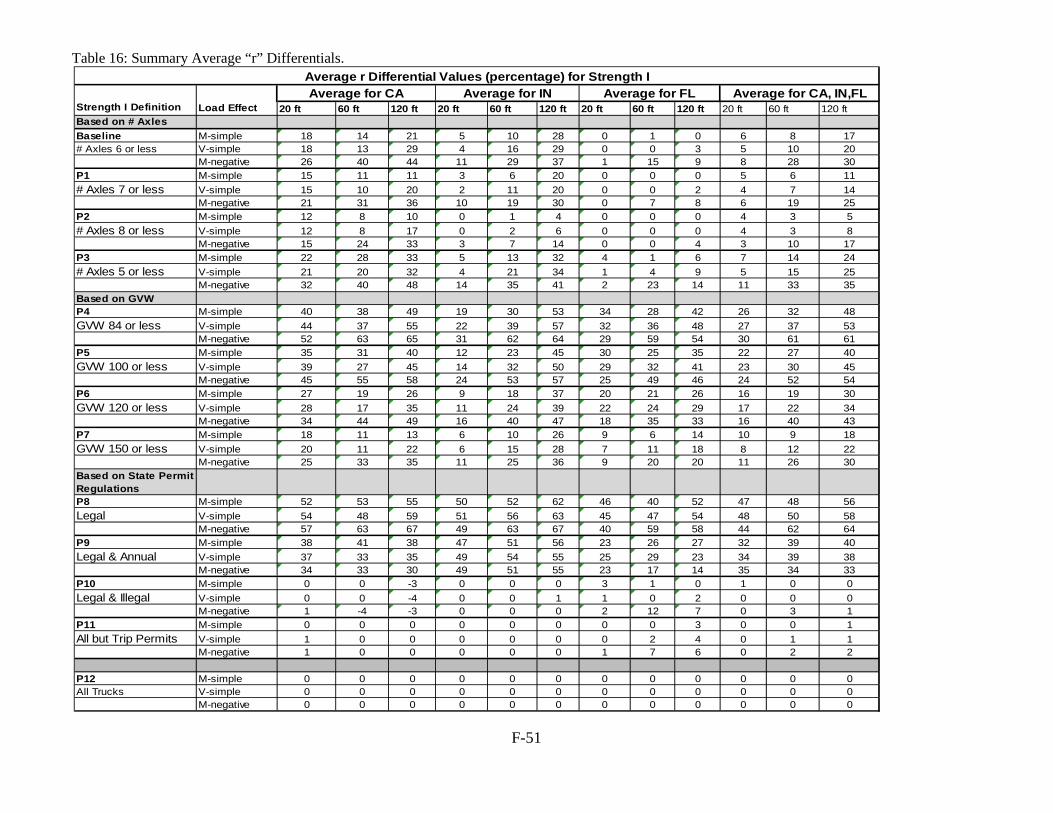
GENERAL TRENDS IN STRENGTH I r DIFFERENTIAL” RESULTS The results of “r Differentials” are summarized in Table 16. The average “r Differentials” for the three WIM sites in each state are shown for the following force effects and span lengths.
1. Force effects such as simple span moment, simple span shear, and negative bending 2. Span lengths (20ft, 60ft, 120 ft)
The last three columns of Table 16 show the averages for all WIM sites by span length and load effect for easier comparisons. Complete results of “r Differentials” for each WIM site is included in Appendix A. The findings from Table 16 may be stated as follows:
1. Group III results (based on state permit regulations) particularly P8 and P9 are the most sensitive, followed by Group II (based on GVW), and then Group III (based on # of axles).
2. “r Differential” results for P8 were the highest. This signifies the biggest difference in “r” values occur when only state legal loads are included in Strength I or the exclusion of illegal loads, trip permits and annual permits. The average drop was between 44% and 64%.
3. “r Differential” results for P10 and P11 were negligible. This indicates the minimal influence of removing Annual permits or Trip permits from Strength I.
4. “r Differential” results for P9 were the second highest in Group III. The average drop was between 32% and 40%. This signifies the sensitivity of the results to removing illegal loads and trip permits. From P10 and P11 we saw that trip permits exert minimal influence on r values, which means that illegal trucks were essentially responsible for the drop in r values.
5. The Group III “r Differential” results were not significantly sensitive to span length or load effect and remained relatively consistent for each state. Similar findings were identified in the previous discussions on “r” values for Group III.
6. P4 “r Differential” results were the highest within Group II (based on GVW) and decrease gradually to the lowest values obtained for P7. This shows that as heavier trucks were included in Strength I the “r Differential” is minimized as expected. This is in line with the previous discussions on group II r values.
7. “r Differential” results for Group II vary from under 10% for P7 to over 60% for P4. The “r Differential” show an increase with increasing span lengths, and generally the highest values were for the negative moments. This is likely due to the fact the longer and heavier trucks could be dominating both the longer spans and the negative bending. The trends were similar for all three states, with the exception that Florida had very low “r Differential” for P7.
8. Group I “r Differential” results were the lowest., particularly for Florida where the results were mostly less than 10%. This shows that sorting trucks based on number of axles for Florida WIM sites is not particularly effective, at least when compared with Group II and Group III sorting strategies.
9. For CA and IN the Group I “r Differential” results increase with increasing span lengths. The “r Differential” also increases as trucks with higher number of axles are removed from Strength I. The highest values were obtained for P3 and the lowest for P2.The general trends were similar for all load effects.
F-51
Table 16: Summary Average “r” Differentials.
20 ft 60 ft 120 ft 20 ft 60 ft 120 ft 20 ft 60 ft 120 ft 20 ft 60 ft 120 ftBased on # AxlesBaseline M-simple 18 14 21 5 10 28 0 1 0 6 8 17# Axles 6 or less V-simple 18 13 29 4 16 29 0 0 3 5 10 20
Average for CA Average for IN Average for FLStrength I Definition Load Effect
Average r Differential Values (percentage) for Strength IAverage for CA, IN,FL
F-52
DETAILED REVIEW OF STRENGTH I “r DIFFERENTIAL” RESULTS
One WIM site from each state has been selected for a more in-depth review and discussion and will serve as representative examples of the other sites for each state. The sites to be discussed are: IN Site 9544, CA Site 0059 and FL site 9936. A discussion of r Differentials results is provided following the sorting groups previously defined.
1. Group I: Sorting Variation Based on Number of Axles
The following sorting variations will be discussed under Group I:
Baseline: Strength I = 6 axles or less P1: Strength I = 7 axles or less P2: Strength I = 8 axles or less P3: Strength I = 5 axles or less
Table 17 Indiana Site 9544 “r “ Differentials Group I
Fig. 19 Strength I Moment r Differentials Group I vs Span Lengths, IN Site 9544
From Table 17 and Fig 19, sorting case P2 where trucks with 9 axles or more are excluded from Strength I shows no noticeable r Differential values. However Baseline, P1 and P2 increasing r differential values with increasing span length. The trucks excluded in Baseline, P1 and P3 are: Baseline: 7 axles or more P1: 8 axles or more P3: 6 axles or more
P3 where trucks with 6 or more axles are excluded has the highest r Differential.
-5
0
5
10
15
20
25
30
35
20 60 120
r Diff
eren
tial
Per
cent
age
Strength I M-simple# Axle Variations
Baseline
P1
P2
P3
F-54
Table 18 California Site 0059 “r “ Differentials Group I
Fig. 20 Strength I Moment r Differentials Group I vs Span Lengths, CA Site 0059
0
5
10
15
20
25
30
35
40
20 60 120
r Diff
eren
tial
Per
cent
age
Strength I M-simple# Axle Variations
Baseline
P1
P2
P3
F-55
From Table 18 and Fig 20, all sorting cases show increasing r differential values with increasing span length. The trucks excluded in Baseline, P1, P2 and P3 are: Baseline: 7 axles or more P1: 8 axles or more
P2: 9 axles or more P3: 6 axles or more
P3 where trucks with 6 or more axles are excluded has the highest r Differential. Unlike the IN site, P2 values do vary with span length indicating that the CA site has a population of trucks with 9 or more axles. Table 19 Florida Site 9936 “r “ Differentials Group I
Fig. 22 Strength I Moment r Differentials Group II vs Span Lengths, IN Site 9544
From Table 20 and Fig 22, all sorting cases show increasing r differential values with increasing span length for the Indiana site. This shows that as increasingly heavier trucks are included in Strength I, going from P4 to P7, the “r Differential” is minimized as expected.
0
10
20
30
40
50
60
70
20 60 120
r Diff
eren
tial
Per
cent
age
Strength I M-simple GVW Variations
Baseline
P4
P5
P6
P7
F-58
Table 21 California Site 0059 “r “ Differentials Group II
Fig. 23 Strength I Moment r Differentials Group II vs Span Lengths, CA Site 0059 From Table 21 and Fig 23, all sorting cases show increasing r differential values with increasing span length for the California site. This shows that as increasingly heavier trucks are included in Strength I, going from P4 to P7, the “r Differential” is minimized as expected.
0
10
20
30
40
50
60
20 60 120
r Diff
eren
tial
Per
cent
age
Strength I M-simple GVW Variations
Baseline
P4
P5
P6
P7
F-59
Table 22 Florida Site 9936 “r “ Differentials Group II
Fig. 24 Strength I Moment r Differentials Group II vs Span Lengths, FL Site 9936 From Table 22 and Fig 24, all sorting cases generally show increasing r differential values with increasing span length for the Florida site. This shows that as increasingly heavier trucks are included in Strength I, going from P4 to P7, the “r Differential” is minimized as expected.
-10
0
10
20
30
40
50
60
20 60 120
r Diff
eren
tial
Per
cent
age
Strength I M-simple GVW Variations
Baseline
P4
P5
P6
P7
F-60
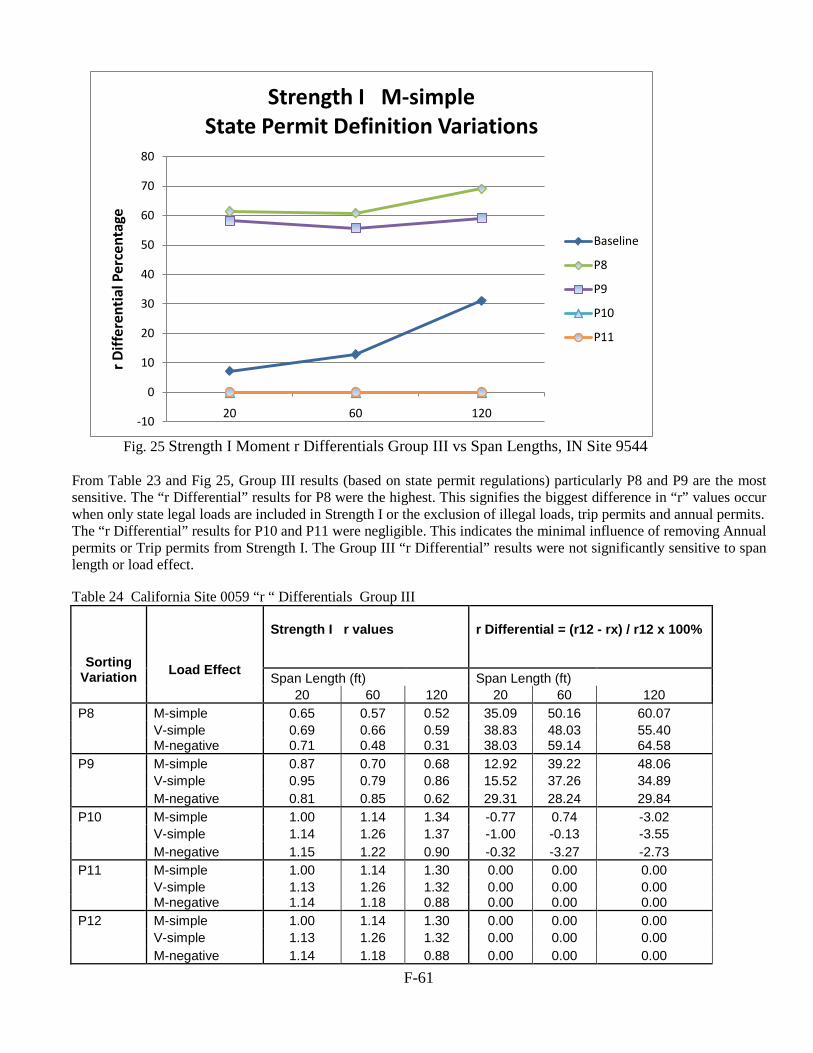
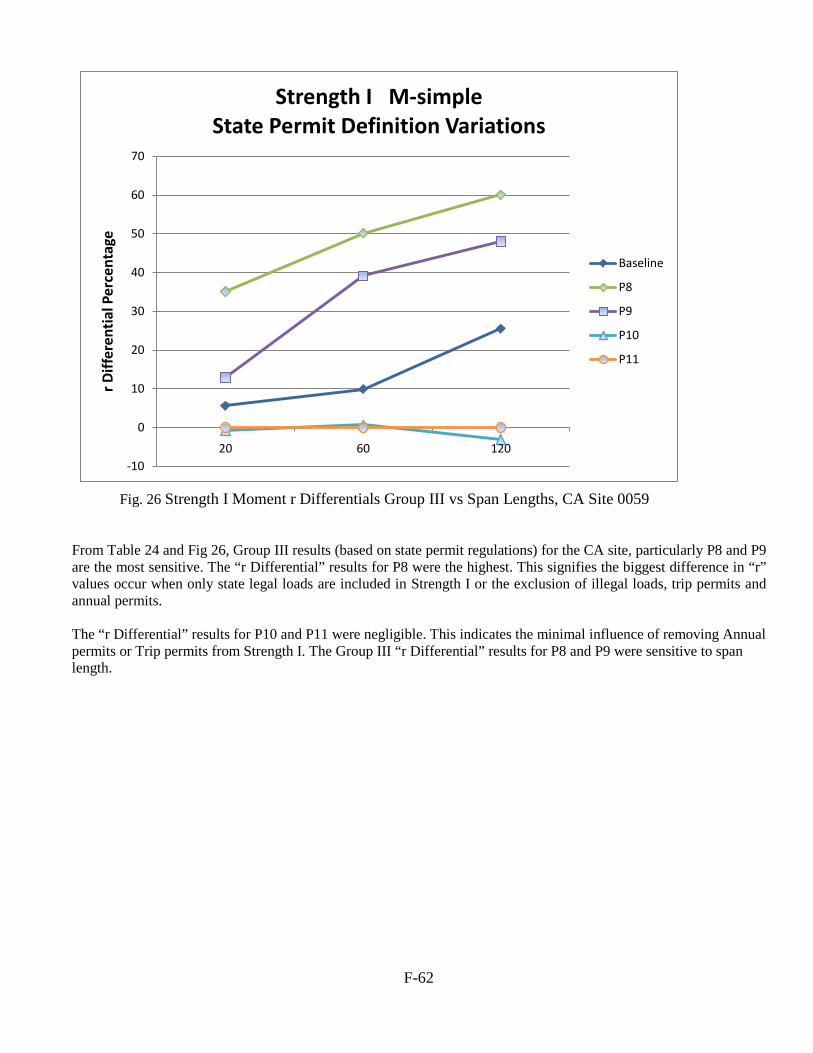
Group III: Sorting Variation Based on State Permit Regulations
The following sorting variations will be discussed under Group III:
P8: Strength I = State legal trucks P9: Strength I = State legal trucks + Annual Permits P10: Strength I = State legal trucks + Illegal trucks
P11: Strength I = State legal trucks + Illegal trucks + Annual permits
Table 23 Indiana Site 9544 “r “ Differentials Group III
Fig. 25 Strength I Moment r Differentials Group III vs Span Lengths, IN Site 9544 From Table 23 and Fig 25, Group III results (based on state permit regulations) particularly P8 and P9 are the most sensitive. The “r Differential” results for P8 were the highest. This signifies the biggest difference in “r” values occur when only state legal loads are included in Strength I or the exclusion of illegal loads, trip permits and annual permits. The “r Differential” results for P10 and P11 were negligible. This indicates the minimal influence of removing Annual permits or Trip permits from Strength I. The Group III “r Differential” results were not significantly sensitive to span length or load effect. Table 24 California Site 0059 “r “ Differentials Group III
Strength I M-simpleState Permit Definition Variations
Baseline
P8
P9
P10
P11
F-62
Fig. 26 Strength I Moment r Differentials Group III vs Span Lengths, CA Site 0059
From Table 24 and Fig 26, Group III results (based on state permit regulations) for the CA site, particularly P8 and P9 are the most sensitive. The “r Differential” results for P8 were the highest. This signifies the biggest difference in “r” values occur when only state legal loads are included in Strength I or the exclusion of illegal loads, trip permits and annual permits. The “r Differential” results for P10 and P11 were negligible. This indicates the minimal influence of removing Annual permits or Trip permits from Strength I. The Group III “r Differential” results for P8 and P9 were sensitive to span length.
-10
0
10
20
30
40
50
60
70
20 60 120
r Diff
eren
tial
Per
cent
age
Strength I M-simpleState Permit Definition Variations
Baseline
P8
P9
P10
P11
F-63
Table 25 Florida Site 9936 “r “ Differentials Group III
Fig. 27 Strength I Moment r Differentials Group III vs Span Lengths, FL Site 9936
-10
0
10
20
30
40
50
60
70
20 60 120
r Diff
eren
tial
Per
cent
age
Strength I M-simpleState Permit Definition Variations
Baseline
P8
P9
P10
P11
F-64
From Table 25 and Fig 27, Group III results (based on state permit regulations) for the FL site, particularly P8 and P9 are the most sensitive. The “r Differential” results for P8 were the highest. This signifies the biggest difference in “r” values occur when only state legal loads are included in Strength I or the exclusion of illegal loads, trip permits and annual permits. The “r Differential” results for P10 and P11 were negligible. This indicates the minimal influence of removing Annual permits or Trip permits from Strength I. The Group III “r Differential” results are not particularly sensitive to span length.
Recommendations for Grouping Traffic into Strength I and Strength II The NCHRP 12-76 study addressed the issue of separating traffic data into Strength I and Strength II limit states by recommending that all uncontrolled traffic that constitutes normal traffic or service loads at a site be grouped into Strength I and all controlled or analyzed overload permits be grouped into Strength II. Strength I vehicles were taken to include state legal trucks, illegal trucks, and routine permits or divisible load permits. All legal trucks, illegal overloads and un-analyzed permits (all routine permits) were grouped into Strength I as they were considered to represent normal service traffic at bridge sites. Only the controlled trip permits or superloads were included in Strength II. Some questions on how to best implement this sorting criteria when using large WIM databases did arise in the 12-76 study. In the 12-76 study it was decided to group all trucks with six or fewer axles in the STRENGTH I calibration as a reasonable though approximate way to capture all legal trucks, illegal trucks and annual permits. Thus trucks with 7 or more axles were considered as controlled or trip permits. A sensitivity analysis was performed on “r” values by defining a new metric for Strength I termed the “r Differential”. It provides a quantification of how the “r” value changes in percentage terms as various trucks are removed from P12 the Reference Case that was not sorted and includes all trucks in Strength I. The r-differentials for a 60 ft span moment are given in Table 26: Sensitivity analysis of r-values shows that Group III results (based on state permit regulations) particularly P8 and P9 are the most sensitive, followed by Group II (based on GVW), and then Group III (based on # of axles). In P10 when illegal trucks are added to State legal loads the “r differential” disappears, which indicates that illegal trucks and not the permits that follow state permit regulations are likely the biggest drivers of high r-values. Baseline and P11 results provide a useful comparison. Both sorting cases seek to include all legal trucks, illegal overloads and un-analyzed permits (all Annual/Routine permits) into Strength I, but execute this by different approaches. For Florida the results are comparable. But for Indiana and California P11 will give higher “r” values than the Baseline case of using trucks with 6 or fewer axles to define all trucks other than heavy trip permits. Using a state’s permit & weight regulations as in P11 to group trucks into Strength I and Strength II is considered more rational, and more precise, when using national WIM data.
Trucks in Strength I r- Differential for 60 ft span M (CA, IN, FL)
P12 All trucks (0,0,0)
GROUP I (Based on # of Axles) P3 Trucks with 5 or fewer axles (28, 13, 1)
Baseline Trucks with 6 or fewer axles (14, 10, 1)
P1 Trucks with 7 or fewer axles (11, 6, 0)
P2 Trucks with 8 or fewer axles (8, 1, 0)
GROUP II (Based on GVW) P4 Trucks with GVW ≤ 84 Kips (38, 30, 28) P5 Trucks with GVW ≤ 100 Kips (31, 23, 25) P6 Trucks with GVW ≤ 120 Kips (19, 18, 21)
P7 Trucks with GVW ≤ 150 Kips (11, 10, 6)
GROUP III (Based on State Permit Regulations)
P8 State Legal Trucks only
(53, 52, 40)
P9 State Legal Trucks, Annual (Routine) Permits
(41, 51, 26)
P10 State Legal Trucks, Illegal Trucks (0, 0, 1)
P11 State Legal Trucks, Illegal Trucks, Annual (Routine) Permits
(0, 0, 0)
Recommendations for grouping trucks into Strength I and II based on the additional research conducted in this phase on truck sorting strategies are as follows:
1. Using a state’s permit & weight regulations, as in variation P11, to group trucks into Strength I and Strength II is considered the most precise and rational approach, when using national WIM data.
2. Using number of axles as a means to separate the trip permits from the rest of the traffic is an acceptable approximate sorting approach that may be easier to implement. Trucks with 7 or more axles (or 8 or more axles) could be grouped into Strength II as trip permits.
3. Using GVW as a means to separate the trip permits from the rest of the traffic is also acceptable approximate sorting approach that can be easily implemented. Trucks with GVW=150 K or more could be grouped into Strength II as trip permits. For certain states this may need to be increased to 200 Kip or higher depending on state permit regulations and the maximum GVW allowed for annual permits.