45
2003 RMNS Intercomparison 7 4 Appendix I List of participating laboratories

2003 RMNS Intercomparison
74
Appendix I
List of participating laboratories

2003 RMNS Intercomparison
48

2003 RMNS Intercomparison
49
Table A1 – List of participating laboratories
Laboratory Name Affiliation Address
1 Minhan DAI Marine Environmental
Laboratory, Xiamen University, China
361005 Xiamen, China
2 Nurit KRESS Israel Oceanographic and
Limnological Research Institute, Israel
P.O. Box 8030, Tel-Shikmona, 31080 Haifa, Israel
3 Doug MASTEN / Susan BECKER
Scripps Institution of Oceanography, STS/ODF, USA
8855 Biological Grade, 215 Isaacs Hall, La Jolla, CA 92037
4 Louis I. GORDON College of Oceanic and
Atmospheric Sciences, Oregon State University, USA
College of Oceanic and Atmospheric Sciences, Oregon State University,
104 Ocean Administration Building, Corvallis, OR 97331-5033
5 Kazuhiro SAITO Hakodate Marine Observatory, Japan
3-4-4 Mihara, Hakodate-shi, Hokkaido 041-0806, Japan
6 Roger KEROUEL IFREMER (Centre de Brest) BP 70, 29280 Plouzane, France
7 Hiroshi OGAWA Ocean Research Institute, The University of Tokyo, Japan
1-15-1 Minamidai, Nakano-ku, Tokyo 164-8639, Japan
8 Hiroaki SAITO Tohoku National Fisheries Research Institute, Japan
3-27-5 Shinhama-cho, Shiogama-city, Miyagi 985-0001, Japan
9 Naoki NAGAI Marine Division, Climate and
Marine Department, Japan Meteorological Agency, Japan
1-3-4 Otemachi, Chiyoda-ku, Tokyo 100-8122, Japan
10 Hiroyuki TAKANO Oceanographical Division,
Maizuru Marine Observatory, Japan
901 Shimofukui, Maizuru-city, Kyoto 624-0946, Japan

2003 RMNS Intercomparison
50
11 Agnes. YOUENOU IFREMER DEL/EC/PP BP 70, 29280 Plouzane, France
13 Akihiko MURATA Japan Marine Science and Technology Center, Japan
2-15 Natsushima-cho, Yokosuka-city,
Kanagawa 237-0061, Japan
14 Hideshi DAIMON Kobe Marine Observatory, Japan
1-4-3 Wakinohamakaigan-dori, Chuo-ku, Kobe-city, Hyogo 650-0073, Japan
15 Takao SHIMIZU Nagasaki Marine Observatory, Japan
11-51 Minami-yamate, Nagasaki-city, Nagasaki 850-0931, Japan
16 Hidekazu OTA KANSO, Japan 3-1-1 Higashikurazi, Katano-city, Osaka 576-0061, Japan
17 Atsushi TSUDA / Hiromi KASAI
Hokkaido National Fisheries Research Institute
116 Katsurakoi, Kushiro, Hokkaido 085-0802, Japan
18 Katsumi YOKOUCHI
Seikai National Fisheries Research Institute
3-30 Kokubu-machi, Nagasaki 850-0951, Japan

2003 RMNS Intercomparison
15
Appendix II
Results submitted by participating laboratories

2003 RMNS Intercomparison
52

2003 RMNS Intercomparison
53
Laboratory 1 Report on Nutrient Intercomparison Results
April 29, 2003
LABORATORY: Ocean Carbon Group, Marine Environmental Laboratory, Xiamen University, Xiamen, China Contact: Minhan Dai, [email protected] DATE OF RECEIPT OF SAMPLE: Jan. 18, 2003
Unit: mol kg–1 * Under detection limit BRIEF DESCRIPTIONS OF ANALYSIS: Nitrite (NO2), phosphate (PO4), and silicic acid (H2SiO3) were determined colorimetrically using a flow injection analyzer (Tri-223 autoanalyzer). Nitrate (NO3) plus NO2 was measured by reducing nitrate to nitrite using the same Tri-223 autoanalyzer with an on-line Cd coil. COMMENTS; 1. Analysis date: April 28, 2003 2. We experienced a shortage of samples during the runs for samples 1 and 4. 3. Concentration units have been converted from µmol L–1 to µmol kg–1 according to
Millero (1996) (Chemical Oceanography, 2nd edition). 4. We’d like to know more about the preparation procedure of the samples that were
provided for this intercomparison exercise. We are concerned about the way the samples were stored.
Nitrite Nitrate Nitrite + nitrate
Phosphate Silicic acid Remarks
Sample 1 0.012 2.057 2.069 0.093 2.486 Shortage of volume
Sample 2 0.448 16.379 16.827 1.072 68.793 Sample 3 ND* 36.936 36.936 2.144 139.093 Sample 4 ND* 1.855 1.855 0.093 2.572 Shortage of
volume Sample 5 0.896 13.491 14.387 1.047 75.186 Sample 6 0.362 39.872 40.233 2.743 137.229

2003 RMNS Intercomparison
54
Laboratory 2 Dr. Michio Aoyama Geochemical Res. Dept. Meteorological Res. Inst. 1-1 Nagamina, Tsukuba 305-0052, Japan 30 April 2003 Re: 2003 Intercomparison Exercise for Reference Material for Nutrients in Seawater in a Seawater Matrix Dear Michio, Below are the results of the analysis we performed on the six samples sent to us by the Marine Chemistry Department of the Israel Oceanographic and Limnological Research Institute, P.O. Box 8030, Tel-Shikmona, 31080 Haifa, Israel The samples arrived in good shape on January 2003 and were analyzed on April 28, 2003. They were kept refrigerated during the whole time. Comments:
1. Because we usually run samples with very low concentrations, samples 2, 3, 5, and 6 were diluted before analysis with low-nutrient seawater from the eastern Mediterranean
2. Samples 1 and 4 were run without dilution. 3. Triplicate samples were run and the average computed 4. Bdl – The detection limit for nitrate + nitrite and nitrite is 0.08 micromolar. 5. The concentrations in micromoles per liter were transformed to micromoles per
kilogram using the density calculated from the given salinity and the temperature of the sample during analysis
Looking forward to the results of the intercomparison. Sincerely, Dr. Nurit Kress

2003 RMNS Intercomparison
55
Table of results in micromoles per liter
Table of results in micromoles per kilogram
A brief description of the methods used: The nutrients were analyzed on a SANplus System autoanalyzer (Skalar, Breda, The Netherlands) equipped with an automatic SA 1000 sampler, three colorimeters, and a
Sample NO3 + NO2 NO2 PO4 Si(OH)4 Salinity Temp. Density Micromoles per liter
S1 average Bdl Bdl 0.071 2.08 34.75 20 1.02457 std. dev. 0.005 0.04 CV (%) 7 2
S2 average 17.4 0.20 1.28 110.9 34.65 20 1.0245 std. dev. 0.2 0.00 0.02 0.7 CV (%) 1 0 1 1
S3 average 35.1 Bdl 2.38 155.5 34.65 20 1.0245 std. dev. 0.8 0.02 0.4 CV (%) 2 1 0
S4 average Bdl Bdl 0.094 2.16 34.8 20 1.02461 std. dev. 0.005 0.03 CV (%) 5 1
S5 average 12.8 0.87 1.17 80.3 34.6 20 1.02446 std. dev. 0.2 0.03 0.02 0.9 CV (%) 2 4 2 1
S6 average 35.3 0.25 3.09 152.9 34.5 20 1.02438 std. dev. 0.3 0.01 0.02 0.2 CV (%) 1 2 1 0
Sample NO3 + NO2 NO2 PO4 Si(OH)4 Micromoles per kilogram
S1 Average Bdl Bdl 0.069 2.03 S2 Average 17.0 0.20 1.25 108.3 S3 Average 34.3 Bdl 2.32 151.8 S4 Average Bdl Bdl 0.091 2.11 S5 Average 12.5 0.85 1.14 78.4 S6 Average 34.5 0.24 3.02 149.2

2003 RMNS Intercomparison
56
data acquisition module with FlowAccess® software (Windows software for Skalar SANplus systems). The peristaltic pump and the cartridges were from Bran+Luebbe. The chemistries are as follows: NO3 + NO2 — Nitrate is reduced to nitrite under alkaline conditions in a copperized cadmium reductor coil. The nitrite reduced from nitrate, plus any free nitrite already present, reacts under acidic conditions with sulphanilamide to form a diazo compound, which then couples with N-1-naphthyl-ethylenediamine dihydrochloride to form a reddish-purple azo dye, which is measured at 520 nm. Si(OH)4 — Silicic acid reacts with ammonium molybdate in an acidic medium to form silicomolybdic acid which is reduced to molybdenum blue with stannous chloride. The absorption of the colored complex is measured at 630 nm. PO4 — Phosphate reacts with ammonium molybdate in an acidic medium to form a phosphomolybdic acid, which is in turn reduced to phosphomolybdous acid by hydrazine sulfate. The intensity of the blue color of the latter compound is measured at 880 nm. If you need any more information about the methods please let me know.

2003 RMNS Intercomparison
57
Laboratory 3 2003 Intercomparison Exercise for Reference Material for Nutrients in Seawater in a Seawater Matrix RESULTS REPORT FORM LABORATORY: Scripps Institution of Oceanography STS/ODF DATE OF RECEIPT OF SAMPLES: 13 Jan 2003 DATA OF ANALYSIS: All samples analyzed on 15 Jan 2003 Results in micromoles per kilogram = micromoles per liter/density Nitrite Nitrate Nitrite + nitrate Phosphate Silicic acid Sample 1 0.03 0.06 0.09 0.10 2.2 Sample 2 0.14 17.60 17.74 1.26 66.8 Sample 3 0.01 35.36 35.37 2.14 133.2
Sample 4 0.03 0.07 0.10 0.13 2.3
Sample 5 0.90 13.08 13.98 1.09 73.4 Sample 6 0.27 38.11 38.38 2.7 130.9 Estimation of analytical error: NO2 ±0.005 NO3 + NO2 ±0.05 PO4 ±0.04 SiO3 ±0.40 Brief description of analyses: Samples were analyzed with a modified Technicon AAII. 1. A modification of the Armstrong et al. (1967) procedure was used for the analysis of
nitrate + nitrite and nitrite. Nitrate is quantitatively reduced to nitrite by passing the

2003 RMNS Intercomparison
58
sample through a Cd/Cu reduction column. The sample is then passed through a 15-mm flowcell and absorbance measured at 540 nm.
2. Orthophosphate was analyzed using a modification of the Bernhardt and Wilhelms
(1967) method using dihydrazine sulfate as a reductant of the sample in an acidified ammonium molybdate solution. The sample was passed through a 50-mm flowcell and absorbance measured at 820 nm.
3. Silicic acid was analyzed using a modification of the Armstrong et al. (1967)
method. Stannous chloride was used as a reductant of the sample in an acidified ammonium molybdate solution. Tartaric acid was added to eliminate PO4 interference. The sample was passed through a 15-mm flowcell and absorbance measured at 660 nm.
References: Armstrong, F.A.J., C.R. Stearns and J.D.H. Strickland. 1967. The measurement of upwelling and subsequent biological processes by means of the Technicon Autoanalyzer and associated equipment. Deep-Sea Research 14(3):381–389. Bernhardt, H. and A. Wilhelms. 1967. The continuous determination of low level iron, soluble phosphate and total phosphate with the AutoAnalyzer. Technicon Symposium, 1967, Vol. I, p. 386.

2003 RMNS Intercomparison
59
Laboratory 4
Results for 2003 Intercomparison Exercise for Reference Material for Nutrients in Seawater in a Seawater Matrix
RESULTS REPORT FORM LABORATORY: College of Oceanic and Atmospheric Sciences, Oregon State University DATE OF RECEIPT OF SAMPLES: 13-Jan-03 DATE OF ANALYSIS: 13-Jan-03 All samples Results in micromoles per kilogram
Nitrite
Nitrate Nitrate + nitrite
Phosphate
Silicic acid
Mean ± Mean ± Mean ± Mean ± Mean ± N Sample 1 0.023 0.007 0.06 0.07 0.08 0.08 0.120 0.013 2.18 0.15 4 Sample 2 0.044 0.007 18.35 0.09 18.40 0.10 1.296 0.023 65.64 0.17 4 Sample 3 0.014 0.005 34.87 0.07 34.88 0.06 2.099 0.019 134.00 0.29 5 Sample 4 0.010 0.009 0.01 0.04 0.02 0.03 0.073 0.006 2.16 0.10 4 Sample 5 0.893 0.011 12.94 0.04 13.84 0.04 1.105 0.007 72.63 0.15 4 Sample 6 0.204 0.012 36.44 0.03 36.64 0.02 2.550 0.015 131.82 0.24 4 ± = 95% confidence level

2003 RMNS Intercomparison
60
Brief descriptions of analysis: All four nutrients were analyzed simultaneously on a hybrid autoanalyzer consisting of a Technicon AAII for the determination of phosphate and an ALPKEM RFA 300 for the determination of silicic acid, nitrite, and nitrate + nitrite. A description of the chemistries can be found in: A suggested protocol for continuous flow automated analysis of seawater nutrients (phosphate, nitrate, nitrite and silicic acid) in the WOCE Hydrographic Program and the Joint Global Ocean Fluxes Study. WOCE Hydrographic Program Office, WHP Office Report WHPO 91-1, Part 3.1.3: WHP Operations and Methods, WOCE Report No. 68/91, November 1994. Comments: Samples were in good shape prior to analysis and no problems occurred during the single run. Prior to the analysis on March 19th, the samples were stored in the dark at room temperature.

2003 RMNS Intercomparison
61
Laboratory 5 2003 Intercomparison Exercise for Reference Material for Nutrients in Seawater in a Seawater Matrix
RESULTS REPORT FORM LABORATORY: KOHUMARU (HAKODATE) DATE OF RECEIPT OF SAMPLES: 2003/1/16 (Japan Standard Time) DATE OF ANALYSIS: Sample 1 2003/2/20 17:22 (JST) Sample 2 2003/2/20 17:22 (JST) Sample 3 2003/2/20 17:22 (JST) Sample 4 2003/2/20 17:22 (JST) Sample 5 2003/2/20 17:22 (JST) Sample 6 2003/2/20 17:22 (JST) Results in micromoles per kilogram Nitrite Nitrate Nitrite + nitrate Phosphate Silicic acid Sample 1 0.02 ± 0.00 0.05 0.07 ± 0.01 0.08 ± 0.00 ― Sample 2 0.13 ± 0.01 17.62 17.75 ± 0.03 1.27 ± 0.01 ― Sample 3 0.01 ± 0.00 35.07 35.08 ± 0.01 2.23 ± 0.00 ― Sample 4 0.01 ± 0.00 0.03 0.04 ± 0.01 0.05 ± 0.01 ― Sample 5 0.92 ± 0.00 12.81 13.73 ± 0.03 1.16 ± 0.01 ― Sample 6 0.10 ± 0.01 38.44 38.54 ± 0.07 2.80 ± 0.01 ― Brief descriptions of the methods of analysis:
Measurements were performed with an AutoAnalyzerTM-II (TechniconTM). Distilled water was tightly sealed in clean bottles and opened just before use for zero-base. PO4 measurements were based upon the method of Murphy and Riley (1961). NO2 and NO3 were measured in accordance with the technique of Armstorng et al. (1967), and NO3 concentrations were calculated by subtracting NO2 from NO3 + NO2. Since calibration curves of PO4 and NO3 were not linear at low concentrations, we applied quadratic calibration curves.

2003 RMNS Intercomparison
62
Order of standard and RMNS was as follows:
0, 1/4, 2/4, 3/4, 4/4, 3/4, 2/4, 1/4, 0, standard for linearity check RMNS-1, RMNS-1, RMNS-1, RMNS-1, RMNS-2, RMNS-2, RMNS-2, RMNS-2, ………… RMNS-6, RMNS-6, RMNS-6, RMNS-6
Comments
No baseline drift occurred through the measurement. Peak shapes were neat enough.
We could not measure salinity values of RMNS because their remainders were too small. Conversion of concentrations (from µmol L–1 to µmol kg–1) was carried out using the given salinity values.

2003 RMNS Intercomparison
63
Laboratory 6 2003 Intercomparison Exercise for Reference Material for Nutrients in Seawater in a Seawater Matrix RESULTS REPORT FORM LABORATORY:
R. KEROUEL IFREMER, Centre de Brest Département DEL/EC/EB BP 70, 29280 Plouzane France
DATE OF RECEIPT OF SAMPLES: 14 JAN 2003 DATA OF ANALYSIS: Sample 1 N & P: 23/01/03; Si: 27/01/03
Sample 2 N & P: 23/01/03; Si: 27/01/03 Sample 3 N & P: 23/01/03; Si: 27/01/03 Sample 4 N & P: 23/01/03; Si: 27/01/03 Sample 5 N & P: 23/01/03; Si: 27/01/03 Sample 6 N & P: 23/01/03; Si: 27/01/03
Note: after N & P analysis, the samples were immediately recapped and placed in a refrigerator until Si analysis. Results in micromoles per kilogram
Nitrite Nitrate Nitrite + nitrate Phosphate Silicic acid
Sample 1 0.023 ± 0.003 0.02 ± 0.03 0.04 ± 0.03 0.079 ± 0.004 2.03 ± 0.05
Sample 2 0.150 ± 0.003 17.6 ± 0.1 17.7 ± 0.1 1.23 ± 0.01 66.6 ± 0.3
Sample 3 0.012 ± 0.003 35.5 ± 0.2 35.5 ± 0.2 2.12 ± 0.01 136 ± 1
Sample 4 0.033 ± 0.003 0.02 ± 0.03 0.05 ± 0.03 0.113 ± 0.004 2.09 ± 0.05
Sample 5 0.918 ± 0.005 13.0 ± 0.1 13.9 ± 0.1 1.07 ± 0.01 73.7 ± 0.3
Sample 6 0.270 ± 0.003 38.1 ± 0.2 38.4 ± 0.2 2.65 ± 0.01 134 ± 1 Brief descriptions of analysis: automated analysis. Bran+Luebbe Autoanalyzer AA3 for nitrate and nitrite. Technicon Autoanalyzer AA2 for phosphate and silicic acid. Methods proposed by Tréguer and Le Corre (1975) with only minor modifications. Tréguer, P. and Le Corre, P., 1975. Manuel d’analyse des sels nutritifs dans l’eau de mer. LOC-UBO, Brest, 110 pp. Your comments: none

2003 RMNS Intercomparison
64
Laboratory 7 Results for RMNS Unit: µmol kg–1
Nitrite Nitrate Nitrite + nitrate Phosphate Silicic
acid
Sample Ave ±SD Ave ±SD Ave ±SD Ave ±SD Ave ±SD 1 0.00 0.00 0.01 0.01 0.01 0.01 0.01 0.00 1.92 0.02 2 0.04 0.00 18.58 0.08 18.62 0.08 1.31 0.00 64.55 0.14 3 0.01 0.00 35.50 0.06 35.51 0.06 2.14 0.00 132.27 0.05 4 0.01 0.00 0.02 0.00 0.03 0.00 0.06 0.00 2.00 0.05 5 0.90 0.00 12.99 0.02 13.88 0.02 1.09 0.00 71.42 0.14 6 0.24 0.00 38.56 0.03 38.80 0.03 2.72 0.01 130.23 0.08
Analysis date: Apr 11, 2003 Analysts: Hiroshi Ogawa and Yoko Fujimoto, Ocean Research Institute, The University of Tokyo
Instrument: AACS III, BRAN+LUEBBE Co.
* Triplicate analyses for each sample

2003 RMNS Intercomparison
65
Laboratory 8 2003 Intercomparison Exercise for Reference Material for Nutrients in Seawater in a Seawater Matrix RESULTS REPORT FORM LABORATORY: Tohoku National Fisheries Research Institute, Fisheries Research Agency DATE OF RECEIPT OF SAMPLES:
Jan 2003 DATA OF ANALYSIS: Sample 1 March 5, 2003 Sample 2 March 5, 2003 Sample 3 March 5, 2003 Sample 4 March 5, 2003 Sample 5 March 5, 2003 Sample 6 March 5, 2003 Results in micromoles per kilogram Nitrite Nitrate Nitrite + nitrate Phosphate Silicic acid Sample 1 0.04 0.1 0.09 1.9 ------------ ------------- -------------- ------------ ----------- Sample 2 0.06 17.3 1.28 68.3 ------------ ------------- -------------- ------------ ----------- Sample 3 0.02 35.6 2.16 139.5 ------------ ------------- -------------- ------------ ----------- Sample 4 0.04 0.0 0.11 1.9 ------------ ------------- -------------- ------------ ----------- Sample 5 0.91 13.6 1.10 75.8 ------------ ------------- -------------- ------------ ----------- Sample 6 0.29 39.0 2.80 137.2 ------------ ------------- -------------- ------------ ----------- Brief descriptions of analysis: Nutrients were analyzed using a Bran+Luebbe TRAACS 800 autoanalyzer following the protocol for the JGOFS core measurements with low-nutrient seawater (LNSW) base.

2003 RMNS Intercomparison
66
Laboratory 9 LABORATORY: R/V Ryofu-Maru DATE OF RECEIPT OF SAMPLES: DATA OF ANALYSIS: Results in micromoles per kilogram Nitrite Nitrate Nitrite + nitrate Phosphate Silicic acid Sample 1 0.01 ± 0.00 0.04 ± 0.04 0.08 ± 0.00 1.80 ± 0.06 ------------ ------------- -------------- ------------ ----------- Sample 2 0.16 ± 0.00 16.39 ± 0.04 0.99 ± 0.00 62.99 ± 0.06 ------------ ------------- -------------- ------------ ----------- Sample 3 0.00 ± 0.00 35.17 ± 0.04 2.03 ± 0.00 129.10 ± 0.06 ------------ ------------- -------------- ------------ ----------- Sample 4 0.01 ± 0.00 0.03 ± 0.04 0.10 ± 0.00 1.89 ± 0.06 ------------ ------------- -------------- ------------ ----------- Sample 5 0.90 ± 0.00 13.84 ± 0.04 1.02 ± 0.00 69.64 ± 0.06 ------------ ------------- -------------- ------------ ----------- Sample 6 0.13 ± 0.00 38.57 ± 0.04 2.56 ± 0.00 127.06 ± 0.06 ------------ ------------- -------------- ------------ -----------

2003 RMNS Intercomparison
67
Laboratory 10 2003 Intercomparison Exercise for Reference Material for Nutrients in Seawater in a Seawater Matrix RESULTS REPORT FORM LABORATORY: Oceanographical Division, Maizuru Marine Observatory DATE OF RECEIPT OF SAMPLES: 15 January 2003 DATA OF ANALYSIS: Results in micromoles per kilogram
Nitrite Nitrate Nitrite + nitrate Phosphate Silicic acid
Sample 1 0.00 ± 0.01 0.00 ± 0.14 0.00 ± 0.14 0.10 ± 0.05 -
------------ ------------- -------------- ------------ ----------- Sample 2 0.06 ± 0.01 18.28 ± 0.14 18.34 ± 0.14 1.25 ± 0.05 -
------------ ------------- -------------- ------------ ----------- Sample 3 0.00 ± 0.01 35.15 ± 0.14 35.15 ± 0.14 2.00 ± 0.05 -
------------ ------------- -------------- ------------ ----------- Sample 4 0.00 ± 0.01 0.00 ± 0.14 0.00 ± 0.14 0.12 ± 0.05 -
------------ ------------- -------------- ------------ ----------- Sample 5 0.88 ± 0.01 13.39 ± 0.14 14.27 ± 0.14 1.09 ± 0.05 -
------------ ------------- -------------- ------------ ----------- Sample 6 0.42 ± 0.01 37.15 ± 0.14 37.57 ± 0.14 2.71 ± 0.05 -
------------ ------------- -------------- ------------ ----------- Brief descriptions of analysis: We measured these samples with an AA-II system. measurement dates: 17–18 March 2003 measurement place: R/V Seifu Maru (at Maizuru)

2003 RMNS Intercomparison
68
Laboratory 11 2003 Intercomparison Exercise for Reference Material for Nutrients in Seawater in a Seawater Matrix RESULTS REPORT FORM LABORATORY: IFREMER Centre de BREST Département DEL/EC/PP BP 70 29280 Plouzane, France DATE OF RECEIPT OF SAMPLES: 15/01/2003 DATA OF ANALYSIS: Sample 1: Nitrate, Nitrite, Phosphate, 12/03/03; Silicic acid, 13/03/03 Sample 2: Nitrate, Nitrite, Phosphate, 12/03/03; Silicic acid, 13/03/03 Sample 3: Nitrate, Nitrite, Phosphate, 12/03/03; Silicic acid, 13/03/03 Sample 4: Nitrate, Nitrite, Phosphate, 12/03/03; Silicic acid, 13/03/03 Sample 5: Nitrate, Nitrite, Phosphate, 12/03/03; Silicic acid, 13/03/03 Sample 6: Nitrate, Nitrite, Phosphate, 12/03/03; Silicic acid, 13/03/03 Results in micromoles per kilogram
NO2 NO3 NO3 + NO2 PO4 Si Sample 1 0.02 ± 0.01 0.08 ± 0.1 0.10 ± 0.1 0.13 ± 0.02 2.1 ± 0.1 Sample 2 0.22 ± 0.01 16.8 ± 0.1 17.0 ± 0.1 1.28 ± 0.02 70.1 ± 0.1 Sample 3 0.01 ± 0.01 34.8 ± 0.1 34.9 ± 0.1 2.19 ± 0.02 136 ± 1 Sample 4 0.02 ± 0.01 0 ± 0.1 0 ± 0.1 0.08 ± 0.02 2.08 ± 0.1 Sample 5 0.96 ± 0.01 11.7 ± 0.1 12.7 ± 0.1 1.12 ± 0.02 77.5 ± 0.1 Sample 6 0.39 ± 0.01 36.7 ± 0.1 37.0 ± 0.1 2.77 ± 0.02 134 ± 1
Brief descriptions of analysis: Nitrate and phosphate were automatically analyzed with an Technicon AACE Autoanalyser, and nitrite and silicic acid with an Technicon AAII Autoanalyser. The technical reference manual for analysis is “Manuel d’analyse des sels nutritifs dans l’eau de mer” (Utilisation de l’Autoanalyser II Technicon) – P. Treguer, P. Le Corre, 1975. Your comments: none

2003 RMNS Intercomparison
69
Laboratory 13 2003 Intercomparison Exercise for Reference Material for Nutrients in Seawater in a Seawater Matrix RESULTS REPORT FORM LABORATORY: The R/V Mirai DATE OF RECEIPT OF SAMPLES: Jan. 19, 2003 DATE OF ANALYSIS: Sample 1 Mar. 13, 2003 Sample 2 Mar. 13, 2003 Sample 3 Mar. 13, 2003 Sample 4 Mar. 13, 2003 Sample 5 Mar. 13, 2003 Sample 6 Mar. 13, 2003 Results in micromoles per kilogram Nitrite Nitrate Nitrite + nitrate Phosphate Silicic acid Sample 1 0.02 0.07 0.09 0.09 1.38 ------------ ------------- -------------- ------------ ----------- Sample 2 0.19 17.32 17.51 1.19 65.62 ------------ ------------- -------------- ------------ ----------- Sample 3 0.01 35.23 35.24 2.10 133.97 ------------ ------------- -------------- ------------ ----------- Sample 4 0.01 0.05 0.05 0.08 1.48 ------------ ------------- -------------- ------------ ----------- Sample 5 0.90 12.86 13.76 1.05 72.30 ------------ ------------- -------------- ------------ ----------- Sample 6 0.14 38.83 38.97 2.74 131.50 ------------ ------------- -------------- ------------ ----------- Brief descriptions of analysis:
System used: BRAN+LUEBBE TRAACS 800 Your comments:
We feel uncertain as to the values of nitrite + nitrate and silicic acid for sample 4. To evaluate the overall performance of our measuring system, we measured concentrations of nutrients in the intermediate layer of the western North Pacific, and calculated the repeatability (n = 5). The results are as follows:

2003 RMNS Intercomparison
70
0.01 ± 0.003 (average ± 1 SD) for nitrite; 36.52 ± 0.047 for nitrate; 36.53 ± 0.044 for nitrite + nitrate; 2.52 ± 0.005 for phosphate; and 146.09 ± 0.267 for silicic acid. This evaluation is close to that of the measuring system during the cruise of the Mirai (MR03-K01).
2003 RMNS Intercomparison
71
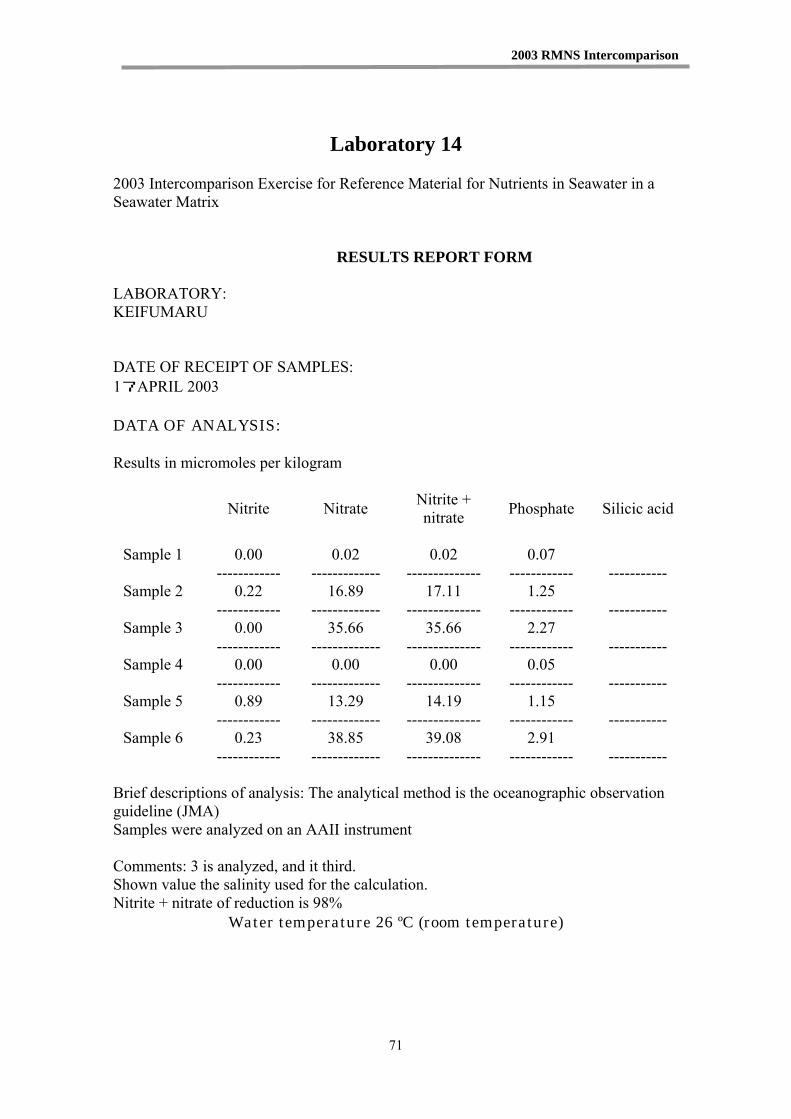
Laboratory 14 2003 Intercomparison Exercise for Reference Material for Nutrients in Seawater in a Seawater Matrix RESULTS REPORT FORM LABORATORY: KEIFUMARU DATE OF RECEIPT OF SAMPLES: 17APRIL 2003 DATA OF ANALYSIS: Results in micromoles per kilogram
Nitrite Nitrate Nitrite + nitrate Phosphate Silicic acid
Sample 1 0.00 0.02 0.02 0.07
------------ ------------- -------------- ------------ ----------- Sample 2 0.22 16.89 17.11 1.25
------------ ------------- -------------- ------------ ----------- Sample 3 0.00 35.66 35.66 2.27
------------ ------------- -------------- ------------ ----------- Sample 4 0.00 0.00 0.00 0.05
------------ ------------- -------------- ------------ ----------- Sample 5 0.89 13.29 14.19 1.15
------------ ------------- -------------- ------------ ----------- Sample 6 0.23 38.85 39.08 2.91
------------ ------------- -------------- ------------ ----------- Brief descriptions of analysis: The analytical method is the oceanographic observation guideline (JMA) Samples were analyzed on an AAII instrument Comments: 3 is analyzed, and it third. Shown value the salinity used for the calculation. Nitrite + nitrate of reduction is 98%
Water temperature 26 ºC (room temperature)

2003 RMNS Intercomparison
72
Laboratory 15 RESULTS REPORT FORM LABORATORY:
Nagasaki Marine Observatory DATE OF RECEIPT OF SAMPLES: DATA OF ANALYSIS: Results in micromoles per kilogram Nitrite Nitrate Nitrite + nitrate Phosphate Silicic acid Sample 1 0.00 ± 0.00 0.02 ± 0.18 0.02 ± 0.18 0.06 ± 0.01 ------------ ------------- -------------- ------------ ----------- Sample 2 0.16 ± 0.00 17.71 ± 0.18 17.87 ± 0.18 1.24 ± 0.01 ------------ ------------- -------------- ------------ ----------- Sample 3 0.01 ± 0.00 35.78 ± 0.18 35.79 ± 0.18 2.21 ± 0.01 ------------ ------------- -------------- ------------ ----------- Sample 4 0.02 ± 0.00 0.06 ± 0.18 0.08 ± 0.18 0.09 ± 0.01 ------------ ------------- -------------- ------------ ----------- Sample 5 0.94 ± 0.00 13.24 ± 0.18 14.18 ± 0.18 1.12 ± 0.01 ------------ ------------- -------------- ------------ ----------- Sample 6 0.15 ± 0.00 39.99 ± 0.18 40.14 ± 0.18 2.88 ± 0.01 ------------ ------------- -------------- ------------ ----------- Brief descriptions of analysis: The sample subdivided to the sample cup of three, and analyzed six samples at the same time. The analytical error is a standard deviation of the standard.

2003 RMNS Intercomparison
73
Laboratory 16 RESULTS REPORT FORM LABORATORY: KANSO DATE OF RECEIPT OF SAMPLES: 2003/1/17 DATA OF ANALYSIS: Sample 1 2003/4/16 Sample 2 2003/4/16 Sample 3 2003/4/16 Sample 4 2003/4/16 Sample 5 2003/4/16 Sample 6 2003/4/16 Results in micromoles per kilogram Nitrite Nitrate Nitrite + nitrate Phosphate Silicic acid Sample 1 0.03 ± 0.00 0.12 ± 0.03 0.18 ± 0.01 1.71 ± 0.03 ------------ ------------- -------------- ------------ ----------- Sample 2 0.13 ± 0.00 17.47 ± 0.04 1.17 ± 0.01 64.71 ± 0.34 ------------ ------------- -------------- ------------ ----------- Sample 3 0.02 ± 0.00 35.80 ± 0.10 2.19 ± 0.02 136.30 ± 0.62 ------------ ------------- -------------- ------------ ----------- Sample 4 0.04 ± 0.00 0.08 ± 0.00 0.20 ± 0.01 1.85 ± 0.07 ------------ ------------- -------------- ------------ ----------- Sample 5 0.94 ± 0.00 13.07 ± 0.06 1.18 ± 0.01 73.03 ± 0.50 ------------ ------------- -------------- ------------ ----------- Sample 6 0.18 ± 0.00 36.85 ± 0.14 2.82 ± 0.02 136.27 ± 0.19 ------------ ------------- -------------- ------------ ----------- Brief descriptions of analysis: Nutrient analysis was performed on two Bran+Luebbe TRAACS 2000 systems with 4-channel analyzing systems for nitrate, nitrite, silicic acid, and phosphate. Nitrite: Nitrite was determined by diazotizing with sulfanilamide and coupling with N-1-naphthyl-ethylenediamine to form a colored azo dye whose absorbance was measured at 550 nm using a 5-cm-long cell. Nitrate: Nitrate in seawater was reduced to nitrite in a reduction tube (Cd–Cu tube), and the nitrite determined by the method described above, but the flow cell used in nitrate analysis was 3-cm-long cell. Phosphate: The method of Murphy and Riley (1962) was used with separate additions

2003 RMNS Intercomparison
74
of ascorbic acid and mixed molybdate–sulfuric acid–tartrate. The absorbance of the phosphomolybdate produced was measured at 880 nm using a 5-cm-long cell. Silicic acid: The standard AAII molybdate–ascorbic acid method was used. The temperature of the sample was maintained at 45–50 ºC using a water bath to reduce the reproducibility problems encountered when the samples were analyzed at different temperatures. The absorbance of the silicomolybdate produced was measured at 660 nm using a 3-cm-long cell.

2003 RMNS Intercomparison
75
Laboratory 17 RESULTS REPORT FORM LABORATORY: Hokkaido National Fisheries Research Institute, Fisheries Research Agency (116 Katsurakoi, Kushiro, 085-0802 Hokkaido, Japan) DATE OF RECEIPT OF SAMPLES: March 2003 DATA OF ANALYSIS: Results in micromoles per kilogram Nitrite Nitrate Nitrite + nitrate Phosphate Silicic acid Sample 1 0.045 0.05 0.078 2.29 ------------ ------------- -------------- ------------ ----------- Sample 2 0.118 18.10 1.320 66.63 ------------ ------------- -------------- ------------ ----------- Sample 3 0.048 37.10 2.143 135.19 ------------ ------------- -------------- ------------ ----------- Sample 4 0.050 0.23 0.074 2.61 ------------ ------------- -------------- ------------ ----------- Sample 5 0.968 13.71 1.118 73.74 ------------ ------------- -------------- ------------ ----------- Sample 6 0.241 37.74 2.690 133.46 ------------ ------------- -------------- ------------ ----------- Brief descriptions of analysis: Samples were measured on April 22 and 23, 2003. Each reported value is the mean of 4 measurements.

2003 RMNS Intercomparison
76
Laboratory 18
RESULTS REPORT FORM LABORATORY: Seikai National Fisheries Research Institute DATE OF RECEIPT OF SAMPLES: Maybe mid January 2003 DATA OF ANALYSIS: Results in micromoles per kilogram (mean ± standard deviation) Nitrite Nitrate Nitrite + nitrate Phosphate Silicic acid Sample 1 ------------ ------------- 0.07 ± 0.03 0.10 ± 0.02 0.12 ± 0.23 Sample 2 ------------ -------------17.78 ± 0.09 1.19 ± 0.01 66.08 ± 0.19 Sample 3 ------------ -------------35.41 ± 0.08 2.06 ± 0.01 136.83 ± 0.58 Sample 4 ------------ ------------ 0.05 ± 0.03 0.13 ± 0.02 0.32 ± 0.23 Sample 5 ------------ -------------14.09 ± 0.04 1.06 ± 0.02 73.21 ± 0.27 Sample 6 ------------ -------------38.47 ± 0.23 2.71 ± 0.01 134.95 ± 0.54
2003 RMNS Intercomparison
77
Appendix III
Documents

2003 RMNS Intercomparison
78

2003 RMNS Intercomparison
97
Appendix III – Documents III – 1 Call for participating
Dear Colleague,
This letter is to invite you to “Intercomparison Exercise for Reference Material of for Nutrients in Seawater in a seawater matrix 2003”.
Progress in Reference Material for Nutrients in Seawater (RMNS) has done by our group during these five years. The seawater in a stainless steel container of 40 liters was autoclaved at 120 deg. C, 2 hours, 2 times. The autoclaved seawater of 90 ml was filled in polypropylene bottles. The homogeneity of the RMNS was confirmed as same magnitude as a repeatability of the measurements of the same sample. The long-term storage experiment of our RMNS for up to 4 years showed that homogeneity and concentrations of nutrient are maintained for about 4 years. Our results, then, had demonstrated that the RMNS for nitrate, nitrite, phosphate and silicic acid can be obtained using autoclaving and can be stored for about up to 4 years.
The objectives of this effort are to establish traceability on nutrient analyses in seawater and to become the onboard nutrients analyses more easy where more accurate nutrients data could become available. We also focused to provide the certified reference material in this field. Although the Group of Expert on standards and Reference Material had clearly pointed out (UNESCO, 1991,1992) the necessity of giving high priority to developing production of RMNS, the Certified Reference Materials which are in a seawater matrix are not available in this field at this moment. The only way now is to conduct inter-laboratory comparison experiments by laboratories, which would provide consensus values and their uncertainty of nutrients concentrations for nitrate, nitrite, phosphate and silicic acid.
The reply sheet in a document attached should be used to confirm your participation and following points should be clearly understood.
1. If you do not return the sheet by the end of November 2002, you will not receive any RMNS samples.
2. I will acknowledge receipt of your reply and list of the participants on 3 Dec. 2002. If you do not receive an acknowledgement by 7 Dec. 2002, please contact us in case your reply has gone elsewhere.
3. A reply sheet will confirm that your wish to participate this comparison exercise and to analyzing the samples and submitting results before the reporting deadline, tentatively end of April 2003, or returning the samples intact before the reporting deadline, if for any reason you are unable to analyze them. I expect to receive nutrients concentrations for nitrate, nitrite, phosphate and silicic acid.
4. All results reported will be published with the name of data originator after the data

2003 RMNS Intercomparison
80
in the publication is confirmed by each data originator.
Some documents are available at an anonymous ftp site of our Institute. You will find three files, two of them are posters presented at Ocean Sciences Meeting at Hawaii in Feb. 2002 and one of them are draft of manuscript entitled “Reference material for nutrients in seawater in a seawater matrix”. The site is mri-2.mri-jma.go.jp, you can login as anonymous user using your e-mail address. The files are at /pub/geochem/outging/OSM.
Best regards, Michio AOYAMA Intercomparison Exercise for Reference Material of for Nutrients in Seawater in a seawater matrix 2003 IMPORTANT DATES DEADLINE OF REPLY: 30 NOVEMBER 2002. LIST OF PARTICIPANT: 3 DECEMBER 2002. SAMPLES SHIPPED BY : 10 JANUARY 2003 REPORTING DEADLINE: 30 APRIL 2003 EXPECTED DRAFT OF INTERCOMPARIOSN SUMARY: 30 JUNE 2003 “Intercomparison Exercise for Reference Material of for Nutrients in Seawater in a seawater matrix 2003”.

2003 RMNS Intercomparison
81
III – 2 Instructions for RMNS bottles 1. Package contents 1) Your package contains 6 bottles 2) You will see the sample IDs, from 1 to 6, and your name. 2. Preparations of samples 1) No preservatives have been added. 2) The details of preparation are given in the documents at our anonymous ftp site. You will find three files, two of them are posters presented at Ocean Sciences Meeting at Hawaii in Feb. 2002 and one of them are draft of manuscript entitled “Reference material for nutrients in seawater in a seawater matrix”. The site is mri-2.mri-jma.go.jp, you can login as anonymous user using your e-mail address. The files are at /pub/geochem/outging/OSM. 3. Analysis 1) RMNSs are ready for analysis, then please use them without filtration just after you open the bottles. Again, no preservatives have been added, when opened their sterility will be lost. 2) Salinities are in the range 34.5-34.8. Sample 1 34.75+-0.10 Sample 2 34.65+-0.10 Sample 3 (assumed to be 34.65) Sample 4 34.80+-0.10 Sample 5 34.60+-0.10 Sample 6 34.50+-0.10 I will determine the salinity of sample3 and deliver them to the participants later. Then please use 34.65 as the tentative salinity of sample3 to get the density of sample3. 3) Concentrations can be assumed to be in the following ranges in micromoles per kilogram. Atlantic people may be surprised by high concentrations of sample 3 and 6, however, these RMNS are Pacific origin. Nitrite Nitrate Nitrite + Nitrate Phosphate Silicic acid
Sample 1 <0.5 ------------
<5 ------------
<0.5 ------------
<5 ------------
Sample 2 <0.5 ------------
<20 ------------
<1.5 ------------
<80 ------------
Sample 3 <0.5 ------------
<45 ------------
<3.0 ------------
<150 ------------
Sample 4 <0.5 ------------
<5 ------------
<0.5 ------------
<5 ------------
Sample 5 <1.2 ------------
<20 ------------
<1.5 ------------
<80 ------------
Sample 6 <1.0 ------------
<45 ------------
<3.0 ------------
<150 ------------
4. Reporting of results
2003 RMNS Intercomparison
82
1) Report concentrations in micromoles per kilogram using the reporting format attached. 2) Please report one value for each parameter for each sample. 3) Participants are welcome to add your estimation on analytical error for each parameter for each sample (ex. 1.23±0.04; 23.45±0.67). 4) REPORTING DEADLINE: 30 APRIL 2003 Intercomparison Exercise for Reference Material of for Nutrients in Seawater in a seawater matrix 2003

2003 RMNS Intercomparison
38
Appendix III- 3 Results report form
LABORATORY:
DATE OF RECEIPT OF SAMPLES:
DATA OF ANALYSIS: SAMPLE 1 SAMPLE 2 SAMPLE 3 SAMPLE 4 SAMPLE 5 SAMPLE 6
Results in micromoles per kilogram Nitrite Nitrate Nitrite + Nitrate Phosphate Silicic acid
SAMPLE 1 ------------ ------------
------------ ------------
SAMPLE 2 ------------ ------------
------------ ------------
SAMPLE 3 ------------ ------------
------------ ------------
SAMPLE 4 ------------ ------------
------------ ------------
SAMPLE 5 ------------ ------------
------------ ------------
SAMPLE 6 ------------ ------------
------------ ------------
Options;Brief descriptions of analysis;
Your comments;
THESE RESULTS SHOULD BE SENT TO: Michio AOYAMA [email protected]
or mail to Michio AOYAMA Geochemical Res. Dep. Meteorological Res. Inst.
1-1 Nagamine,305-0052 JAPAN

2003 RMNS Intercomparison
84

2003 RMNS Intercomparison
58
Appendix IV
History of nutrients intercomprisons

2003 RMNS Intercomparison
86
2003 RMNS Intercomparison
87
Appendix IV History of nutrient intercomparisons
This history of nutrient intercomparisons is based on several reports of previous intercomparison exercises. The histories of the first to fourth ICES exercises are derived from Aminot and Kirkwood’s (1995) detailed report of the fifth ICES intercomparison, which includes histories of the first to fourth ICES exercises. Histories of the fifth ICES exercise and the first and second NOAA/NRC intercomparisons are also summarized in this appendix.
1. First ICES Exercise
The first intercalibration to include nutrients was an entirely Baltic affair in June 1965, when three research vessels met by private agreement in Copenhagen:
Aranda Institute of Marine Research (IMR), Helsinki Hermann Wattenberg Institut für Meereskunde, Kiel Skagerak Royal Fishery Board, Gothenburg
Each ship contributed freshly collected bulk samples to the experiment, which were subsampled and analyzed on board each of the three participating ships on the same day. Oxygen, salinity, chlorinity, alkalinity, and phosphate were determined.
2. Second ICES Exercise
The second ICES exercise, carried out in 1966 under the auspices of the newly formed ICES Working Group on the Intercalibration of Chemical Methods, was still predominantly a Baltic initiative and consisted of two parts: Part I, Leningrad, during the 5th Conference of Baltic Oceanographers; and Part II, Copenhagen, at the 54th ICES Statutory Meeting.
Part I, Leningrad (May 1966)
The participating research vessels were
Alkor Institut für Meereskunde, Kiel Okeanograf Institute of Marine Research, Leningrad Prof Otto Krammel Institut für Meereskunde, Warnemünde Skagerak Fisheries Board of Sweden, Gothenburg
Research vessels delivered bulk samples, which were subsampled and analyzed almost immediately for oxygen, salinity, chlorinity, pH, and phosphate.
Part II, Copenhagen (September 1966)
The list of interested parties continued to grow and, in addition to Baltic countries, Norway and the UK were represented. Research vessels delivered bulk samples and the

2003 RMNS Intercomparison
88
various participants analyzed samples simultaneously in Copenhagen. The determinands of primary interest included not only oxygen, salinity, chlorinity, and phosphate, as in Part I (Leningrad) and the previous year's exercise (Copenhagen, 1965), but also nitrate, nitrite, and silicate.
The final report, edited by Grasshoff (UNESCO, 1966), makes no mention of nitrate or nitrite but some of those who were present confessed that these results were "too terrible to be included"! To be fair to those involved, 1966 was an early time in the development of heterogeneous cadmium-based nitrate/nitrite reduction techniques and some of the associated problems were presumably not fully appreciated at the time.
Evidently nitrate analysis had some way to go to achieve the reliability and ease of operation of the Murphy and Riley (1962) phosphate technique, but it is worth noting that intercomparison work on phosphate so far had consisted of simultaneous analysis of freshly obtained subsamples by a small number of highly competent workers, in close contact with each other, exchanging calibration solutions, ideas, technical details, etc. Subsequent to the Copenhagen trial, Jones and Folkard (ICES, 1966) undertook a detailed laboratory examination of the individual methods used by the participants and, in their contribution to Grasshoff’s report, they announced, "There seems to be no need for any further intercalibration in the determination of inorganic phosphate by this method."
Clearly this happy state of affairs could and did not last. Along came the autoanalyzer!
3. Third ICES Exercise
The third ICES exercise was organized by the ICES Working Group on Chemical Analysis of Sea Water under the joint auspices of ICES and SCOR and its official title, "The International Intercalibration Exercise for Nutrient Methods2”, shows that it set out to be an ambitious project.
Samples were distributed in 1969–1970 and 45 laboratories from 20 countries submitted results, but the final report on the results of the exercise was not published for several years (ICES, 1977).
The time had come to study "nutrients" separately from oxygen, salinity, chlorinity, and pH, but with the awareness of problems arising from the instability of natural seawater samples, the organizers chose to use standard solutions that were prepared and distributed by the Sagami Chemical Research Center, Japan. [Note added by Aoyama: The standard solutions used in this exercise were Cooperative Survey of Kuroshio(CSK) standards, which are solutions in artificial seawater for nitrate, phosphate, and silicate and in pure water for nitrite.]
In this exercise, participants performed the analyses in their own laboratories but, despite being supplied (knowingly) with appropriate blank solutions for each determination, the overall accuracy, particularly for phosphate and nitrate, was disappointing.

2003 RMNS Intercomparison
89
The report concludes, "As methods did not diverge much, it is clear that variations must be sought primarily in the standardization procedures. The results will also aid participants in re-evaluating their analytical procedures by comparison of their methods with those that appear most satisfactory from this exercise".
The names of the participating laboratories were listed, as were the tables of results, but it was not possible to link them together. Hindsight suggests that this may have been counterproductive; we now suspect that there is no greater incentive for a laboratory to improve its performance than the knowledge that peer laboratories throughout the world are aware that it is producing poor quality data.
4. Fourth ICES Exercise
Various "workshop" and multiship events following the ICES/SCOR exercise included nutrient studies, but it was many years later (1988) before the ICES Marine Chemistry Working Group produced volunteers (Don Kirkwood, Alain Aminot, and Matti Perttilä) to organize the next large-scale intercalibration exercise, designated "NUTS I/C 4". This exercise did not set out to be worldwide, beginning only with laboratories in ICES Member Countries, but other laboratories who were interested in participating were not turned away.
The fourth exercise differed from the third exercise in three important respects.
1) The test samples were natural or near-natural seawater rather than standard solutions.(Strictly speaking, this made the exercise an intercomparison rather than an intercalibration.)
2) Participants were unaware that "blank" samples were included.3) Anonymity was abolished. Participants were made aware from the outset that the
final report would list identities of laboratories, results, and a means for any reader to contact them.
Sixty-nine laboratories from 22 countries submitted results and, thanks in some measure to the telefax machine, the final 83-page report (Kirkwood et al., 1991) was in the hands of participants within two years of the distribution of samples. Statistical treatment identified 58 laboratories consistent in phosphate analyses, 51 consistent in nitrate analyses, and 48 consistent in both phosphate and nitrate analyses, including a group of 12 whose results were especially close to the consensus concentrations.
5. Fifth ICES Exercise
Due to the generally perceived need for more and better quality control in analytical measurement, a fifth ICES intercomparison exercise was carried out in 1993. A total of 142 sets of samples were distributed in 31 countries. Results were returned by 132 laboratories, 61 of which had participated in the fourth intercomparison and 56 of which were participating in QUASIMEME (Quality Assurance of Information for Marine
2003 RMNS Intercomparison
90
Environmental Monitoring in Europe). The distribution of laboratories was as follows: UK (22), Germany (18), Sweden (13), France (11), Spain (8), USA (7), Norway(5), Ireland(5), Australia(4) Canada(4), Netherlands(4), Denmark(3), Greece(3), Portugal(3), Belgium(2), Estonia(2), Finland(2), Italy(2), Poland(2), Argentina(1), Bermuda(1), China(1), Faroe Islands(1), Iceland(1), Japan(1), Latvia(1), Lithuania(1), New Zealand(1), Qatar(1), South Africa(1), Turkey(1), The method of sample preparation, autoclaving, for the fifth intercomparison imposed constraints that resulted in there being only two relevant determinands per sample (nitrate and nitrite in one series, and phosphate and ammonia in the other series). A large volume of low-nutrient natural seawater was spiked with known concentrations of nutrient salt. Although the concentrations in the distributed samples covered a greater concentration range than that in the fourth intercomparison, the concentration levels were representative of the Atlantic Ocean, 1–26 µmol L–1 for nitrate and 0.08–1.85 µmol L–1 for phosphate.
6. 2000 NOAA/NRC Intercomparison
The test material distributed in this intercomparison was MOOS-1, a proposed certified reference material for nutrients in seawater (Clancy and Willie, 2004). The sample material was intended to be a certified reference material for silicate, phosphate, nitrite, and nitrate + nitrite. Participating laboratories were each sent two bottles of MOOS-1 and requested to perform duplicate analyses on each of the bottles. The prepared samples were sent to 36 participating laboratories. Thirty sets of results were returned.
The results of this intercomparison may, in several respects, have been compromised by sample homogeneity problems. The target standard deviation for measuring p-scores is too broad and does not reflect the measurement precision that can be attained.
7. 2002 NOAA/NRC Intercomparison
An intercomparison exercise was undertaken to assess the current capabilities of a group of laboratories to quantitate orthophosphate, silicate, nitrite, and nitrite + nitrate in a seawater sample. This was the second such exercise sponsored by the NOAA Center for Coastal Monitoring and Assessment (CCMA) and coordinated by the Institute for National Measurement Standards of the National Research Council of Canada. Two seawater samples — one from Pensacola Sound, FL, and a proposed certified reference material for nutrients in seawater (MOOS-1) — were distributed to 31 laboratories. Twenty-four laboratories submitted data. Methodologies were not prescribed to the participants; however, all reported results were obtained using traditional colorimetric procedures. Generally, satisfactory agreement among participants was achieved, with results within 10% of the assigned mean values.
The results from this exercise suggest that the homogeneity problem identified in the first NOAA/NRC intercomparison exercise was overcome, although the orthophosphate data indicate a larger interlaboratory spread of results than expected. Results for silicate, nitrite, and nitrite + nitrate in the distributed seawater samples were acceptable for the majority of the participants and generally deviated <±10% from the

2003 RMNS Intercomparison
91
assigned mean. All laboratories used methodology based on colorimetric principles.
8. 2003 MRI Intercomparison
Autoclaved natural seawater was prepared for intercomparison samples. Sample homogeneity was confirmed by repeatability of measurement. Sets of 6 samples covering a concentration range greater than that in previous intercomparisons were distributed. The concentrations were 0–38 µmol kg–1 for nitrate, 0–0.9 µmol kg–1 for nitrite, 0–2.7 µmol kg–1 for phosphate, and 0–136 µmol kg–1 for silicic acid. A total of 18 sets of samples were distributed to 18 laboratories in 5 countries. Results were returned by 17 laboratories in 5 countries. Although consensus concentrations were obtained for the 6 samples, the standard deviations were 4.5 times and more than 10 times greater than those of the homogeneities for phosphate and silicic acid, respectively. For nitrate, the standard deviations were only about double the homogeneities. These results indicate that variability in in-house standards of the participating laboratories — rather than analytical precision — is the primary source of interlaboratory discrepancy. Therefore use of a certified RMNS is essential for establishing nutrient data sets that can be compared across laboratories, especially for silicic acid and phosphate.


