97
Appendix M – Red Penn Landfill Record of Decesion (ROD)

Appendix M – Red Penn Landfill Record of Decesion (ROD)

EPA/ROD/R04-00/0812000
EPA Superfund
Record of Decision:
RED PENN SANITATION CO. LANDFILLEPA ID: KYD981469794OU 01PEEWEE VALLEY, KY09/19/2000

RED PENN LANDFILLSUPERFUND SITE
RECORD OF DECISIONSEPTEMBER 19, 2000
RECORD OF DECISIONRED PENN LANDFILL SITE
TABLE OF CONTENTS
SECTION PAGE
DECLARATION FOR THE RECORD OF DECISION . . . . . . . . . . . . . . . . . . . . . . . . . . . . . i
1.0 SITE BACKGROUND . . . . . . . . . . . . . . . . . . . . . . . . . . . . . . . . . . . . . . . . . . . . . . . . . . . . . . . . 1
1.1 SITE LOCATION . . . . . . . . . . . . . . . . . . . . . . . . . . . . . . . . . . . . . . . . . . . . . . . . . . . . . . . . . . . 1
1.2 SITE DESCRIPTION . . . . . . . . . . . . . . . . . . . . . . . . . . . . . . . . . . . . . . . . . . . . . . . . . . . . . . . . . 1
2.0 SITE HISTORY AND ENFORCEMENT ACTIVITIES . . . . . . . . . . . . . . . . . . . . . . . . . . . . . . 1
2.1 SITE HISTORY . . . . . . . . . . . . . . . . . . . . . . . . . . . . . . . . . . . . . . . . . . . . . . . . . . . . . . . . . . . . . 1
2.2 ENFORCEMENT ACTIVITIES . . . . . . . . . . . . . . . . . . . . . . . . . . . . . . . . . . . . . . . . . . . . . . . . . 5
3.0 COMMUNITY PARTICIPATION HIGHLIGHTS . . . . . . . . . . . . . . . . . . . . . . . . . . . . . . . . . . 7
4.0 CURRENT AND POTENTIAL SITE RESOURCE USE . . . . . . . . . . . . . . . . . . . . . . . . . . . . . . 8
4.1 DEMOGRAPHY . . . . . . . . . . . . . . . . . . . . . . . . . . . . . . . . . . . . . . . . . . . . . . . . . . . . . . . . . . . . 8
4.2 LAND USE . . . . . . . . . . . . . . . . . . . . . . . . . . . . . . . . . . . . . . . . . . . . . . . . . . . . . . . . . . . . . . . . . 9
5.0 SUMMARY OF SITE CHARACTERISTICS . . . . . . . . . . . . . . . . . . . . . . . . . . . . . . . . . . . . . . 9
5.1 PHYSIOGRAPHY . . . . . . . . . . . . . . . . . . . . . . . . . . . . . . . . . . . . . . . . . . . . . . . . . . . . . . . . . . . 9
5.2 TOPOGRAPHY . . . . . . . . . . . . . . . . . . . . . . . . . . . . . . . . . . . . . . . . . . . . . . . . . . . . . . . . . . . . . 11
5.3 SURFACE HYDROLOGY . . . . . . . . . . . . . . . . . . . . . . . . . . . . . . . . . . . . . . . . . . . . . . . . . . . . . 11
5.4 SOILS . . . . . . . . . . . . . . . . . . . . . . . . . . . . . . . . . . . . . . . . . . . . . . . . . . . . . . . . . . . . . . . . . . . . . 14
5.5 GEOLOGY . . . . . . . . . . . . . . . . . . . . . . . . . . . . . . . . . . . . . . . . . . . . . . . . . . . . . . . . . . . . . . . . . 14
5.6 HYDROGEOLOGY . . . . . . . . . . . . . . . . . . . . . . . . . . . . . . . . . . . . . . . . . . . . . . . . . . . . . . . . . . 16
RECORD OF DECISIONRED PENN LANDFILL SITE
TABLE OF CONTENTS CONTD.
SECTION PAGE
6.0 SUMMARY OF SITE RISKS . . . . . . . . . . . . . . . . . . . . . . . . . . . . . . . . . . . . . . . . . . . . . . . . . . 22
6.1 REMEDIAL INVESTIGATION SUMMARY . . . . . . . . . . . . . . . . . . . . . . . . . . . . . . . . . . . . . . 22
6.1.1 SOIL GAS SAMPLING . . . . . . . . . . . . . . . . . . . . . . . . . . . . . . . . . . . . . . . . . . . . . . . . . . . . . . . 22
6.1.2 SURFACE SOIL SAMPLING . . . . . . . . . . . . . . . . . . . . . . . . . . . . . . . . . . . . . . . . . . . . . . . . . . 23
6.1.3 SURFACE WATER AND SEDIMENT SAMPLING . . . . . . . . . . . . . . . . . . . . . . . . . . . . . . . . . 23
6.1.4 GROUNDWATER EVALUATION . . . . . . . . . . . . . . . . . . . . . . . . . . . . . . . . . . . . . . . . . . . . . . 23
6.1.5 LEACHATE SAMPLING . . . . . . . . . . . . . . . . . . . . . . . . . . . . . . . . . . . . . . . . . . . . . . . . . . . . . . 24
6.2 SUMMARY OF HUMAN HEALTH RISK ASSESSMENT . . . . . . . . . . . . . . . . . . . . . . . . . . . 24
6.2.1 CHEMICALS OF POTENTIAL CONCERN . . . . . . . . . . . . . . . . . . . . . . . . . . . . . . . . . . . . . . 24
6.2.2 EXPOSURE ASSESSMENT . . . . . . . . . . . . . . . . . . . . . . . . . . . . . . . . . . . . . . . . . . . . . . . . . . . 25
6.2.3 TOXICITY ANALYSIS . . . . . . . . . . . . . . . . . . . . . . . . . . . . . . . . . . . . . . . . . . . . . . . . . . . . . . . 25
6.2.4 RISK CHARACTERIZATION . . . . . . . . . . . . . . . . . . . . . . . . . . . . . . . . . . . . . . . . . . . . . . . . . . 25
6.3 SUMMARY OF ECOLOGICAL RISK ASSESSMENT . . . . . . . . . . . . . . . . . . . . . . . . . . . . . . 39
7.0 SCOPE AND ROLE OF RESPONSE ACTION . . . . . . . . . . . . . . . . . . . . . . . . . . . . . . . . . . . . 47
8.0 RESPONSIVENESS SUMMARY . . . . . . . . . . . . . . . . . . . . . . . . . . . . . . . . . . . . . . . . . . . . . . . 48
PROPOSED PLAN PUBLIC MEETING TRANSCRIPT . . . . . . . . . . . . . . . . . . . . . . . . . APPENDIX A
CORRESPONDENCE ON LANDFILL CAPPING . . . . . . . . . . . . . . . . . . . . . . . . . . . . . APPENDIX B
RECORD OF DECISIONRED PENN LANDFILL SITE
TABLE OF CONTENTS CONTD.FIGURE PAGE
1 SITE LOCATION MAP . . . . . . . . . . . . . . . . . . . . . . . . . . . . . . . . . . . . . . . . . . 2
2 SITE FEATURES . . . . . . . . . . . . . . . . . . . . . . . . . . . . . . . . . . . . . . . . . . . . . . . 3
3 PHYSIOGRAPHY MAP . . . . . . . . . . . . . . . . . . . . . . . . . . . . . . . . . . . . . . . . . 10
4 SURFACE RUNOFF PATHWAYS . . . . . . . . . . . . . . . . . . . . . . . . . . . . . . . . . 12
5 100-YEAR FLOOD PLAIN MAP . . . . . . . . . . . . . . . . . . . . . . . . . . . . . . . . . . 13
6 SOIL TYPE DISTRIBUTION . . . . . . . . . . . . . . . . . . . . . . . . . . . . . . . . . . . . . 15
7 GEOLOGIC CROSS SECTION . . . . . . . . . . . . . . . . . . . . . . . . . . . . . . . . . . . 17
8 GEOLOGIC CROSS SECTION . . . . . . . . . . . . . . . . . . . . . . . . . . . . . . . . . . . 18
9 GEOLOGIC CROSS SECTION . . . . . . . . . . . . . . . . . . . . . . . . . . . . . . . . . . . 19
10 CONCEPTUAL SITE MODEL . . . . . . . . . . . . . . . . . . . . . . . . . . . . . . . . . . . . 36
11 ECOLOGICAL SAMPLING LOCATION . . . . . . . . . . . . . . . . . . . . . . . . . . . 43
TABLE
1 SITE CONTAMINANTS . . . . . . . . . . . . . . . . . . . . . . . . . . . . . . . . . . . . . . . . . 26
2 CANCER CLASSIFICATIONS, SLOPE FACTORS, TUMOR SITES . . . . . 37
3 REFERENCE DOSE DATA . . . . . . . . . . . . . . . . . . . . . . . . . . . . . . . . . . . . . . . 38
4 SUMMARY OF SITE RISK . . . . . . . . . . . . . . . . . . . . . . . . . . . . . . . . . . . . . . 40
5 HAZARD INDEX BY TARGET ORGAN . . . . . . . . . . . . . . . . . . . . . . . . . . . . 41
6 FRESH WATER MUSSELS TISSUE ANALYSIS . . . . . . . . . . . . . . . . . . . . . 44
7 TOXICITY TEST RESULTS . . . . . . . . . . . . . . . . . . . . . . . . . . . . . . . . . . . . . . 45
i
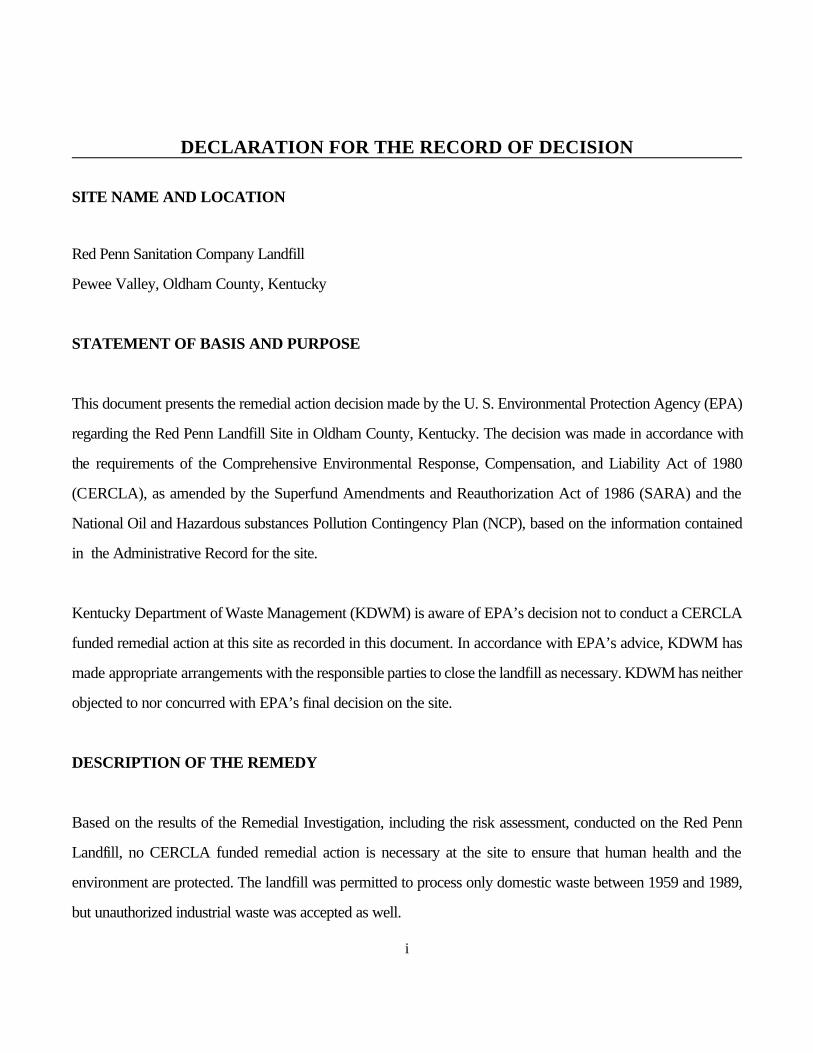
DECLARATION FOR THE RECORD OF DECISION
SITE NAME AND LOCATION
Red Penn Sanitation Company Landfill
Pewee Valley, Oldham County, Kentucky
STATEMENT OF BASIS AND PURPOSE
This document presents the remedial action decision made by the U. S. Environmental Protection Agency (EPA)
regarding the Red Penn Landfill Site in Oldham County, Kentucky. The decision was made in accordance with
the requirements of the Comprehensive Environmental Response, Compensation, and Liability Act of 1980
(CERCLA), as amended by the Superfund Amendments and Reauthorization Act of 1986 (SARA) and the
National Oil and Hazardous substances Pollution Contingency Plan (NCP), based on the information contained
in the Administrative Record for the site.
Kentucky Department of Waste Management (KDWM) is aware of EPA’s decision not to conduct a CERCLA
funded remedial action at this site as recorded in this document. In accordance with EPA’s advice, KDWM has
made appropriate arrangements with the responsible parties to close the landfill as necessary. KDWM has neither
objected to nor concurred with EPA’s final decision on the site.
DESCRIPTION OF THE REMEDY
Based on the results of the Remedial Investigation, including the risk assessment, conducted on the Red Penn
Landfill, no CERCLA funded remedial action is necessary at the site to ensure that human health and the
environment are protected. The landfill was permitted to process only domestic waste between 1959 and 1989,
but unauthorized industrial waste was accepted as well.

ii
Remedial Investigation indicated that the site contained hazardous materials but the levels of contamination and risk
are below EPA’s action levels. Because the landfill was abandoned without proper closure, EPA advised KDWM
to prevent site conditions from deterioration by requiring the responsible parties to close the landfill properly.
KDWM negotiated the landfill closure plan with the parties and approved their capping design in October 1999.
The responsible parties began constructing the remedy under Kentucky’s oversight in June 2000. The project is
scheduled to be completed by the end of September 2000. This Record of Decision document completes EPA’s
action on the site and includes a recommendation to the Commonwealth to restrict the use of the site to activities
that would not compromise the integrity of the landfill cap.
DECLARATION STATEMENT
EPA has determined that no Superfund action is necessary at this site to ensure the protection of human health and
the environment. The current decision will not result in hazardous substances remaining on-site above health-based
levels. Therefore, no five-year review will be conducted for the site.

1
1.0 SITE BACKGROUND
1.1 SITE LOCATION
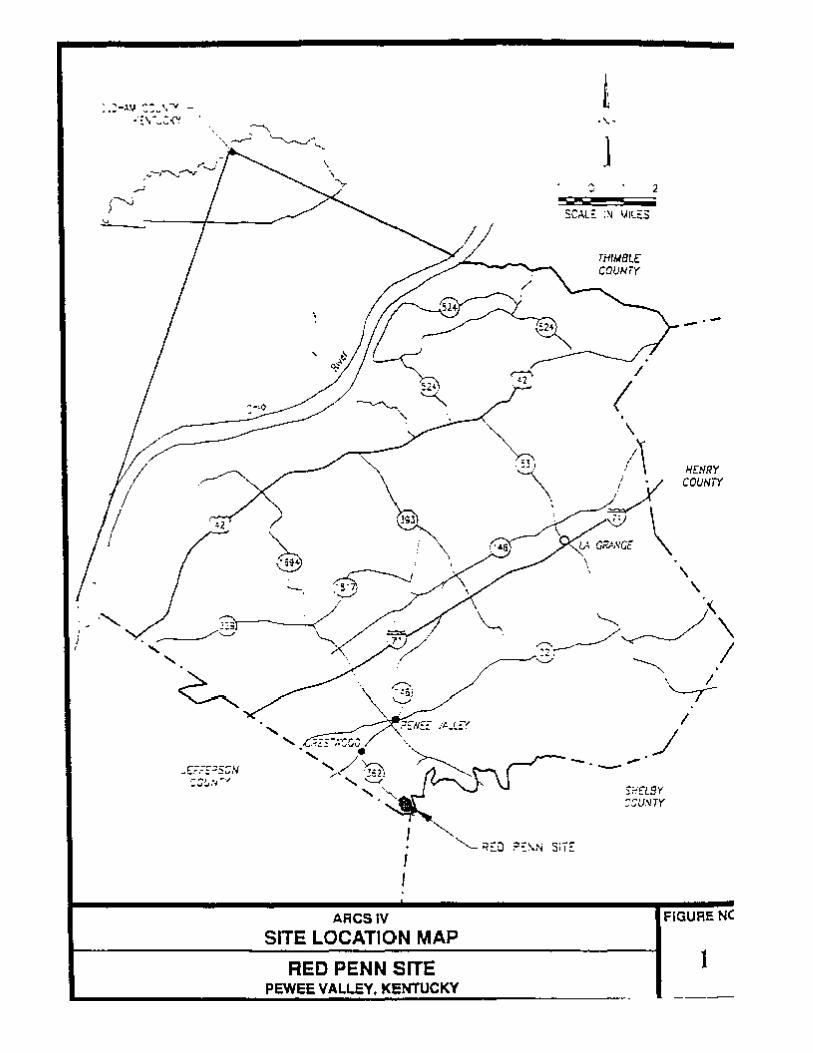
The Red Penn Landfill Superfund Site is located approximately 1.5 miles southeast of Pewee Valley in Oldham
County, Kentucky. As shown in Figure 1, Shelby County lies to the east and southeast of the site, and Jefferson
County lies to the south and southwest. The property is bounded on the east and southeast by Floyds Fork Creek,
and on the southwest by an un-named creek tributary which runs along Kentucky State Route 362. Hawley Gibson
Road forms the northwest property line.
1.2 SITE DESCRIPTION
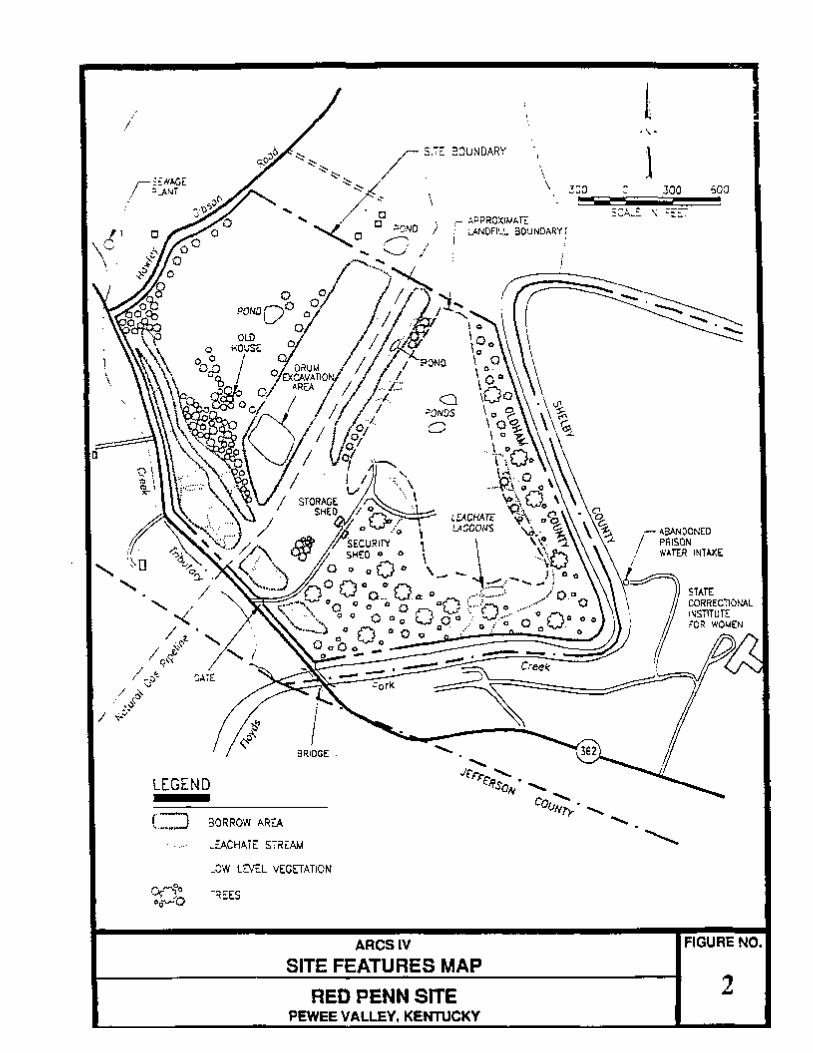
The landfill is contained in a rural parcel of land which is approximately 151 acres in size. The portion of the
property permitted and actively used for waste disposal was 85 acres. The remaining 66 acres were used primarily
as the borrow area from which cover soil was obtained during the landfill operations. The site is currently inactive
and much of the property is overgrown with vines, shrubs and trees. The property is unfenced, but access roads
have barricades which act as barriers to vehicular traffic. The physical structures remaining onsite include remnants
of the old guard shack, and the maintenance building. A buried natural gas pipeline passes through the middle of
the site, west of the landfill area, trending from northeast to southwest. Texas Gas Company owns the pipeline and
maintains its corridor. See Figure 2 for site features.
2.0 SITE HISTORY AND ENFORCEMENT ACTIVITIES
2.1 SITE HISTORY
The first documented waste disposal activity on this site occurred in 1954, when a 10-acre portion of the property
was leased to Bert Logsdon and Chris P. Pennington for five years as a dump ground. In the lease, the parties
agreed that the property would be used for the dumping of residential garbage only. The lease specifically excluded
slop or carcasses of dead animals. The initial permit
4
to operate a landfill at the site was issued by the Oldham County Health Department in 1959, to the Red Penn
Sanitation Company. In 1968, the company obtained a solid waste disposal permit from the Kentucky Department
of Health to use 85 acres of the property as a sanitary landfill. Although the permit excluded industrial wastes, Red
Penn Sanitation Company contracted to accept industrial rubbish and sludge from the Louisville Scrap Material
Company for disposal at the site in 1972.
Subsequently, the Red Penn site was inspected regularly by the Kentucky Division of Solid Waste which later
became known as the Division of Hazardous Material and Waste Management, and is now called the Kentucky
Division of Waste Management (KDWM). KDWM’s files for this site indicate that violations of state and local
regulations by the operator were frequent. Between 1972 and 1982, Red Penn Sanitation was cited repeatedly for
improper operational problems, including creek pollution from overflowing leachate collection ponds, cover soil
deficiencies, and consistently unsatisfactory site conditions.
In November 1982, KDWM discovered through discussions with Robert Layer, an independent Red Penn
contractor that he had hauled several thousand drums of waste from the Anaconda Wire and Cable Company in
LaGrange and dumped them in the landfill between 1967 and 1974. These drums allegedly contained waste
enamels, drawing solution from the curing of copper wire, and possibly scrap varnish. Based on the information
provided by Mr. Layer, KDWM estimated the number of drums dumped in the landfill to be at least 5400.
Apparently, the drums were unloaded from his truck near the operating cell of the landfill and spread out over the
landfill by the bulldozer operator at the site. Mr. Layer claimed that the drums were never empty. Fifteen drums
were also taken to his own property where the contents were burned and the drums used as garbage cans. In
addition, approximately 100 drums were taken to a Jim Sanders’ property on Dawkins Road in Oldham County.
In April 1987, KDWM discovered through an interview with Mr. Donald Puckett, a former bulldozer operator at
the landfill, that several drums containing paint waste and sludge generated by the Ford Motor Company plant in
Jefferson County were dumped in the landfill between 1968 and 1974.
5
Based on the information provided by Mr. Puckett, KDWM estimated the number of drums dumped in the landfill
to be at least 7800. Approximately 100 drums were also taken to Mr. Puckett’s own property.
2.2 ENFORCEMENT ACTIVITIES
In March 1986, John Guelda, a part owner of the Red Penn Sanitation Company who bought half interest in 1979,
notified KDWM that suspected hazardous waste had been found at the site. Upon inspection, KDWM found
several drums and a pile of contaminated soil which had been excavated from the borrow area and dumped at the
entrance of the landfill. Several drums were also found protruding from the excavation area. Two soil samples were
collected from the drum and the pile at the entrance to the site during the inspection. Limited chemical analysis of
the samples revealed the presence of toluene and xylene at concentrations of 153 and 62.5 milligrams per kilogram
(mg/kg), respectively.
In 1986, KDWM conducted a preliminary assessment of the site and concluded that a site investigation was
appropriate. The site investigation was conducted later in the same year. Samples of soil and wastes from the site,
surface water and sediment from the Floyds Fork Creek, and groundwater from the site and private wells were
analyzed for the entire list of priority pollutants. In addition, air sampling and magnetometer surveys were
conducted. Several pollutants from industrial activities were detected in the various samples at significant levels of
concentration particularly, metals, pesticides and volatile organic compounds. No readings above the background
were observed from the magnetometer survey. Therefore, the extent of suspected drum burial could not be
ascertained.
Based on the results of the site investigation, KDWM filed a Request for Appropriate Action and a Notice of
Violation against the Red Penn Sanitation Company in 1986. The company agreed to clean up the drum excavation
area and the pile of waste at the landfill entrance. In September and October 1986, approximately 207 cubic yards
of contaminated soil and 85 drums (a total of about 154 tons
6
of material) were removed from the two locations by the Red Penn Sanitation Company under the direction of
EPA’s Emergency Response contractor. Upon completion of the removal action, KDWM collected and analyzed
random soil samples from the excavation area and determined that further soil removal was necessary at the site.
Red Penn Sanitation was ordered to conduct the additional removal work but defied the order. The permit to
operate the landfill expired in December 1986. Although the company ceased operating the facility, the landfill was
not properly closed. In April 1987, the Kentucky Natural Resources and Environmental Protection Cabinet
(KNREPC) issued letters to several parties, notifying them that they were responsible for disposal of hazardous
substances at the site. The letters requested voluntary participation by these parties in investigating the site,
proposing a remedial plan, and implementing an acceptable remedial action.
The site was scored by the State in late 1987, and listed as a National Priorities Site by EPA in 1989,
based on a score of 38.1 using the Hazard Ranking System. The high score was driven primarily by the
groundwater and surface water pathways. A major source of drinking water in the area is the Laurel aquifer which
is shallow (21 feet), is highly permeable due to karst features and is exposed at the landfill. Floyds Fork Creek is
a major stream which served as the source of potable water for approximately 250 inmates and staff at the nearby
women’s reformatory. The creek also supports recreational fishing in the area.
EPA conducted a search of the entities associated with the dumping of unauthorized waste at the landfill and
identified several potentially responsible parties (PRPs) in 1988. Notice letters were sent to the parties in February
1989, to inform them of their potential liability, request additional information from them, and to advise them that
EPA was considering spending public funds to conduct Remedial Investigation/Feasibility Studies (RI/FS) at the
site. On June 19, 1989, two of the PRPs (Ford Motor Company and Waste Management, Inc.) met with EPA
staff to discuss the possibility of a PRP lead RI/FS. EPA’s conclusion from the discussions was that no PRP was
interested in funding the studies. Therefore, a fund-lead RI/FS was initiated in late 1989.
In July 1993, EPA concluded from its RI studies that a Superfund remedial action at the site could not be justified.
However, because the landfill was not properly closed, EPA advised KDWM to

7
solicit the PRPs to conduct a corrective action at the site under its authority. KDWM acted accordingly. In August
1994, the PRPs submitted a draft scope of work to the Commonwealth for capping the landfill. After revising the
proposal several times, it was finalized in May 1998. Following an extensive negotiation, the Commonwealth and
several PRPs entered into an Agreed Order in August 1999, requiring the PRPs to implement the remedial plan
for the landfill. Pursuant to the provisions of the Agreed Order, the design for site remediation was prepared by
the responsible parties and approved by KDWM in October 1999. The PRPs began construction of the remedy
in April 2000, under the Commonwealth’s authority and oversight.
3.0 COMMUNITY PARTICIPATION HIGHLIGHTS
The community relations program for the site began in June 1991, prior to starting the Remedial Investigation (RI)
field work. EPA personnel interviewed the city and county officials, civic leaders, and area residents to determine
their concerns and understanding of site issues. In addition, the interviews provided a basis for developing a
comprehensive community relations plan for the site. Those interviewed were informed of the Superfund process
and how it would be applied at the Red Penn site beginning with the pending Remedial Investigation and Feasibility
Studies (RI/FS). The door to door interviews were held on June 3 and 4, 1991. The local library, South Oldham
Library in Crestwood, was visited during the interview, and established as one of two information repositories for
the site. The other repository was the EPA record center in Atlanta, Georgia. Establishment of the repositories was
announced to the public early in the process, and information at both places was updated as necessary.
Several Fact Sheets were published to inform the public about EPA activities on this site. The first one, published
in August 1991, reviewed site history and the work being planned for the site by EPA, particularly the RI/FS. The
second Fact Sheet was written in May 1993, to review EPA’s work progress. An analysis of site evaluation, and
the results of risk assessment were reported in a July 1993 Proposed Plan Fact Sheet which also announced that
EPA could not justify a Superfund Remedial Action at the site. A second Proposed Plan Fact Sheet was published
in April 2000, to re-state why Superfund cleanup could not be conducted at the site and to inform the public that
the
8
responsible parties were in the process of conducting the necessary landfill closure under Kentucky’s authority and
supervision.
KDWM also issued three fact sheets on the site between August 1994 and April 2000. The first fact sheet
informed the public that the Commonwealth of Kentucky would exercise its independent authority to effect a
corrective action at the site by working directly with the potentially responsible parties. The second issue was
published in November 1999, to discuss the progress of negotiation between the Commonwealth and the
responsible parties. In April 2000, Kentucky’s third fact sheet was published to discuss the remedial action
construction which the responsible parties were about to begin at the site.
In addition to the fact sheets, EPA and KDWM conducted several meetings between September 1991 and April
2000, to discuss the site with the public. The meetings were attended by federal, state, county, and city officials,
environmental activists, responsible parties, area residents and members of the local news media. Appendix A
includes the transcript of the Proposed Plan Public Meeting held on April 20, 2000.
In summary, public participation in the Red Penn Landfill site events was promoted actively by both EPA and
KDWM. In turn, the public indicated a high level of interest in site activities. To encourage the public to review
and understand the technical issues and documents related to the site, availability of the Technical Assistance Grant
was announced at the beginning of the project. However, no applications were received for the grant.
4.0 CURRENT AND POTENTIAL SITE RESOURCE USE
4.1 DEMOGRAPHICS
There are three towns within a 4 mile radius of the Red Penn landfill. These are Pewee Valley, Crestwood, and
Anchorage with a combined population of approximately 4,800 people according to the 1990 census. Pewee
Valley is located at approximately 1.5 miles, northwest of the site and
9
has a population of approximately 1,283 people. Crestwood is 2.5 miles north of the site and has an estimated
population of 1,435 people. Anchorage has a population of 2,082 people and is located at 3.5 miles southwest of
the site. Several residences that are not considered parts of these towns, constituting some 2,200 people, are
estimated to be within four miles of the site.
4.2 LAND USE
Land around the site is used primarily for agricultural and residential purposes. Agricultural activities include raising
of crops and livestock. No parks or recreational areas are within a close proximity of the site. The property
containing the landfill is designated for mix-use by the Oldham County Comprehensive Development Plan published
in 1982. Development of the Red Penn property through year 2000 is planned to include commercial and office
buildings, and medium to high density residences. The surrounding area is planned for low density residences. The
Floyds Fork Creek which supports an active recreational fishing is designated as a resource protection item in the
plan.
5.0 SUMMARY OF SITE CHARACTERISTICS
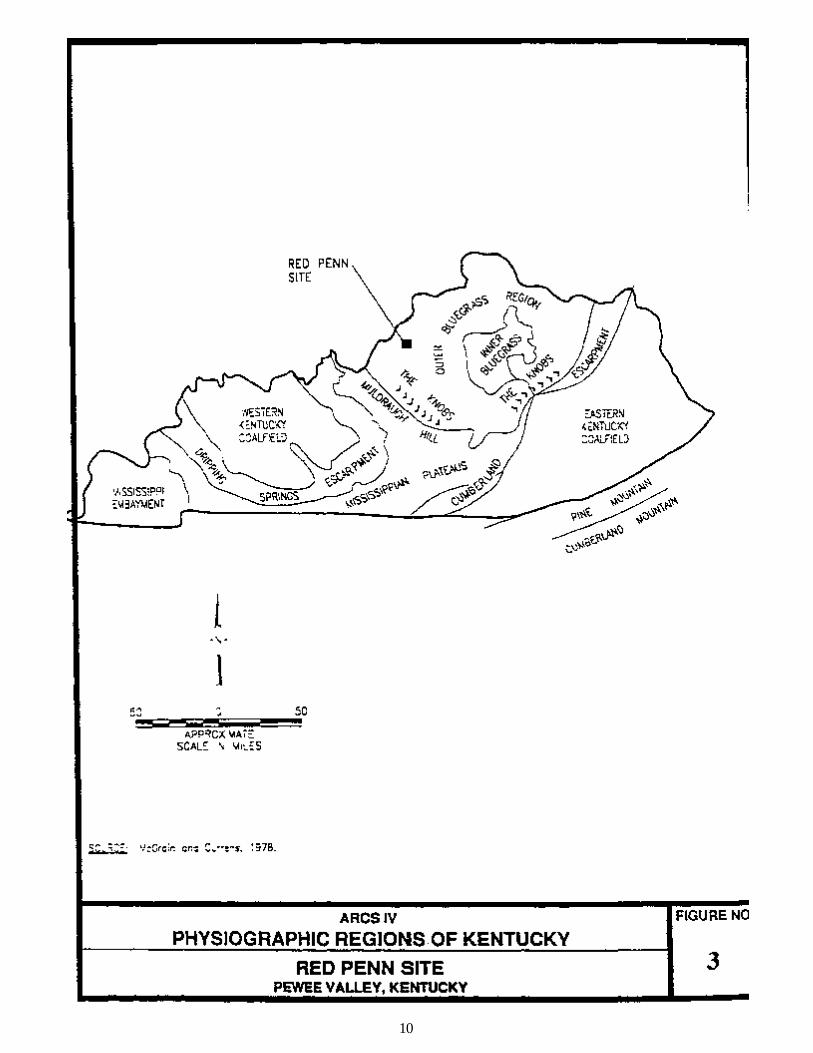
5.1 PHYSIOGRAPHY
As shown in Figure 3, Oldham County is located in the Outer Bluegrass Physiographic Province of Kentucky. The
county consists of gently rolling to hilly terrain with upland elevations ranging from 650 feet above mean sea level
(msl) in the western part, to 900 feet above msl in the eastern part. The Ohio River marks the northwest border
of the county. In the western part of the county, wide expanses of gently rolling to nearly flat land are present. In
the eastern part the terrain is dissected by several streams and is noticeably hilly. A few ridges are flat-topped, with
the width of the ridges increasing westward in the county. Local relief is slight in the county except near Floyds
Fork Creek, which has carved a valley 150 to 200 feet below the surrounding upland in some areas.
10
11
5.2 TOPOGRAPHY
The topography at the site has been altered significantly due to years of filling and borrowing activities. A review
of the original (pre-development) topographic contours of the area during the RI indicated that a north-south
trending drainage swale dissected the center of the property formerly and provided drainage into the Floyds Fork
Creek. Presently, however, there is at least 50 feet of fill over this drainage swale. As part of the RI, a ground
survey of the site was conducted and aerial photographs were obtained. The ground survey was conducted to
locate a 100 foot sample grid over the entire 85 acres of the landfill and a 200 foot sample grid over the remainder
of the property. The aerial photographs were utilized in conjunction with the ground survey to define current
topography and to produce study base maps.
The crest of the landfill is approximately 700 feet above msl and approximately 100 feet above Floyds Fork Creek.
Because the landfill is mound shaped, surface runoff occurs at the site radially and then proceeds south, east, or
west towards the creeks along the site boundary. See Figure 4. To control the direct discharge of runoff from the
site into the creek, a system of berm and catchment basin was constructed by the landfill operators. As shown in
Figure 5, the site is not within the 100-year flood plain.
5.3 SURFACE HYDROLOGY
The surface waters potentially affected by the site are Floyds Fork Creek and the creek tributary. The creek
tributary is approximately 10 feet wide where it borders the site and appears to be normally less than 1 foot deep
based on observations made during the RI. The tributary flows southwest into the Floyds Fork Creek. Floyds Fork
Creek is a perennial. It is a southwest flowing fork of the Salt River and is approximately 20 feet wide where it
borders the site. Its depth is normally about 1 to 2 feet deep. However, high water marks of 6 or more feet above
the stream banks were observed during site visits for this study. The Salt River is located approximately 12 miles
south of the site. It flows

12


14
westward into the Ohio River. The U.S. Geological Survey (USGS) has a permanent stream gage on Floyds Fork
Creek located approximately four miles upstream from the site and monitors the creek’s rate of flow. A review of
the USGS record indicated that during the dry season, Floyds Fork Creek may dry up or its flow rate may be too
small to measure.
5.4 SOILS
Soil depth at the site varies from 0 to 12 feet. The soil type distribution at the site, according to the Soil Survey of
Oldham County which was conducted in 1975, is shown in Figure 6. It is noteworthy that the soil type distribution
depicted by the figure is representative of conditions as they existed prior to 1975. Due to land filling and
borrowing activities since then, these conditions may have been altered. Nevertheless, the map provides a general
indication of the types of soils present at the site.
5.5 GEOLOGY
Oldham County lies within the Ohio Geological Region which is made up of a series of bedrock units. The bedrock
series vary greatly in thickness and hydrogeologic characteristics, and range in age from Precambrian to Tertiary.
Two basins, the Appalachian and the Illinois, are the most conspicuous structural features in the area. These basins
are separated from each other by the Cincinnati, the Findlay, and the Kankakee arches, and the Nashville dome.
The surface of the basement complex slopes from the arch areas toward the Appalachian and Illinois basins. This
slope is the key geologic feature controlling the strike and dip of the younger bedrock series overlying the basement
complex. These younger units form the bedrock aquifer system. Oldham County lies on the western flank of the
Cincinnati arch. The dip of the younger bedrock west of the Cincinnati arch and south of the Kankakee arch is
generally toward the low point of the Illinois basement depression. Local geologic structures in the counties
surrounding the site can be described as a series of synclines and anticlines, generally plunging to the
west-southwest. The axis of the Lyndon Syncline, a local structural feature, traverses the central section of the site.
Strike and dip measurements on the rock units outcropping at the surface indicate that the site is situated on a very
gentle swale of the syncline. The dip of the

15
16
bedrock units is generally less than 3 degrees, and influences the surface-water flow direction. The formation
underlying the site is made up of fine grained carbonates and shales. Alluvial deposits are also found along Floyds
Fork Creek and its tributaries. These sediments are of Quaternary age flood plain deposits composed principally
of sands, silts, clays, and gravels. The unconsolidated sediments are commonly 8 to 10 feet in thickness along
Floyds Fork Creek. Figure 7 is a map of the site showing the locations where two schematic geologic
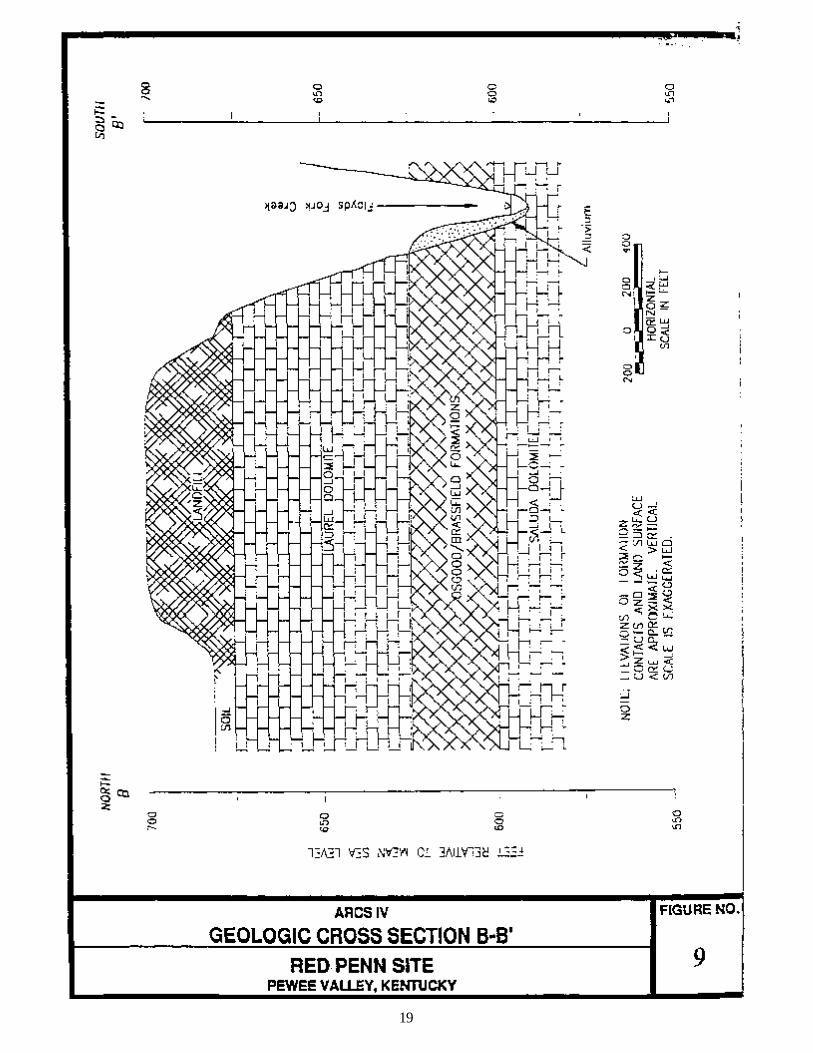
cross-sections (A-A’ and B-B’) have been constructed. Section A-A’ is an east-west cross-section which is
shown in Figure 8. Section B-B’ is a north-south cross-section depicted in Figure 9.
5.6 HYDROGEOLOGY
The occurrence and movement of ground water in this region appear to be controlled by three major factors. These
are : (1) the fractures and solution-enlarged openings in the rocks, (2) the western-southwestern dip of the
bedrock units, and (3) the creeks incising the bedrock aquifers. Generally, the limestone and dolomite beds
transmit large quantities of water through openings along joints and bedding planes enlarged by solutioning. The
shale beds, however, generally impede the upward and downward movement of water from the adjacent limestone
and dolomite beds due to fewer and smaller fractures. The water bearing potentials of the stratigraphic units in the
area are described below:
The Louisville limestone typically yields more than 500 gallons of water per day (gpd) towells drilled in valley bottoms or along streams and broad uplands. At many locations, thelimestone is highly porous and permeable along joints and bedding planes. Wellsintersecting these openings usually yield a sustainable domestic supply of water. Springsare commonly found in the Louisville limestone just above the contact with the underlyingWaldrom shale.
The Waldron shale yields little water. It tends to act as an aquitard which impedes rechargeto the underlying Laurel dolomite.
The Laurel dolomite is fine-grained. It crops out in valleys of south-flowing streams suchas the Floyds Fork Creek. Karst features, including sinkholes and solution channels arecommon in this unit. The Laurel dolomite typically yields 100 to 500
17
18
19

20
gpd of water to wells located along streams. The unit, however, does not have sustainable yields of fresh waterwhere it is extensively overlain by the Waldron shale.
The Osgood Formation underlying the Laurel dolomite consists of dolomitic shale,mudstone, and dolomite. The units yield little water to wells and impede recharge to theunderlying limestones and dolomites. However, it yields water to small springs and seepsat locations where the contact between the dolomite and shale is exposed.
The Brassfield limestone underlying the Osgood Formation also yields water to springs.Karst features are common in this unit, however the formation is generally thin and has lowcapacity. Therefore, it is not a principal drinking water source in the area.
The Saluda dolomite is a member of the Drakes Formation which typically yields between100 and 500 gpd of water to wells in valley bottoms such as near the Floyds Fork Creek.Karst features are common in the upper part of this formation but less common in thelower part.
In view of the above hydrogeologic characteristics, three major aquifers are potentially affected by the Red Penn
Landfill. These are: the Louisville Limestone Aquifer, the Laurel Dolomite/Upper Osgood Formation Aquifer, and
the Brassfield Limestone/Saluda Dolomite Aquifer. The first and second aquifers are separated by the Waldron
shale, and the second and third aquifers are separated by the lower Osgood Formation aquitard. Around the site,
a significant amount of the Louisville limestone and the Waldron shale has been eroded away, leaving the Laurel
dolomite as the first formation encountered. The base of the Red Penn landfill lies on top of the Laurel dolomite,
and leachate springs at the landfill have been observed to accumulate on top of the Osgood Formation beneath the
Laurel dolomite. Therefore, the aquifers of primary concern at this site are the Laurel and the Saluda.
Generally, carbonate formations are potentially host to solution enhanced permeabilities and karst development
which may present unpredictable and complicated groundwater flow patterns with variable transmissivities. These
characteristics were observed at the site. Accordingly, the special technique of dye tracing was applied to study
the groundwater flow pattern in the area. The following were the findings of the study.

21
• A vertical sequence of aquifers and confining layers exists at the site. The Louisville limestone represents
a water-table aquifer extending down to the top of the Waldron shale, which is an effective confining layer.
These units occur only at the most northern portion of the site and are not impacted by the landfill except
by borrow activities.
• The aquifers of concern at the site are the Laurel and Saluda dolomites. While neither is a well-developed
karst aquifer due to interbedding of shale and dolomite strata, they are anisotropic carbonate aquifers. The
Laurel is a fractured dolomitic aquifer exposed at the land surface over most of the site. It exhibits a high
degree of secondary permeability due to solution-enlarged joints and bedding-plane partings. While
groundwater storage in the Laurel aquifer may be low, recharge occurring during wet periods travels at
high velocity (on the order of 500 feet per hour) through discrete conduits in relatively narrow groundwater
basins. The Osgood shales effectively limit downward percolation of groundwater from the Laurel aquifer
into the Saluda aquifer, limiting dissolutional enlargement of fractures in the Saluda. Therefore, the Saluda
is significantly less permeable than the Laurel. Both aquifers are gently folded by the
west-southwest-plunging Lyndon Syncline, the axis of which bisects the site.
• Surface geophysical surveys conducted at the site detected no extensive areas of groundwater flow.
However, the data indicated that flow of groundwater away from the landfill is limited to localized and
discrete zones.
• Numerous small intermittent springs and several leachate streams flow from the landfill area into the Floyds
Fork. However, due to structural control of groundwater flow by the west-southwest-plunging Lyndon
Syncline, the greatest discharge occurs through the quarry springs which flow into the creek tributary.
These springs occur primarily in the Laurel dolomite and are perched on the shaly Osgood Formation.
• Most groundwater flow from the site discharges through springs into Floyds Fork and the creek tributary.
These streams are deeply incised and appear to form a local base level for

22
groundwater flow at the site. The dye-tracing investigation provided no evidence of groundwater migrating
off site except via discharge into these streams.
6.0 SUMMARY OF SITE RISKS
EPA initiated sampling activities at the site in September 1989, primarily to assess current impact on the creeks
especially because the nearby correctional institute obtained its drinking water from the Floyds Fork Creek.
Surface water and sediment samples were collected and analyzed to determine the need for any emergency action.
Although, toluene and heavy metals were detected in the samples, no emergency response was deemed necessary.
Shortly after this event, RI began at the site.
6.1 REMEDIAL INVESTIGATION SUMMARY
During the RI, various studies were conducted to determine the nature and extent of site contamination. The studies
included site sampling and laboratory analyses, evaluation of the risks potentially posed by site contamination to
human health and the environment, and determination of site clean-up options. Details of the studies are in the
Administrative Record and their results are summarized in the following sections.
6.1.1 Soil Gas Sampling
A passive soil gas survey was conducted to identify volatile organic compounds in the landfill and to determine
potential source areas and migration pathways. Soil gas samples were collected from 222 grid points on and
around the landfill. Results of the survey indicated presence of chemical compounds commonly found in solvents
and fuel products primarily within the boundaries of the site. The results also indicated possible off-site migration
of the compounds towards the creeks.

23
6.1.2 Surface Soil Sampling
Fifty-one soil samples were collected from and around the landfill to determine the chemical compounds of
potential threat to human health due to direct contact. All samples were obtained from within one foot of the landfill
surface and analyzed for complete target compound list/target analyte list (TCL/TAL). In addition, presence of
cyanide was investigated. Several metals and cyanide were detected in the soil samples at low levels of
concentration. The most predominant metals were chromium, iron, lead, vanadium, zinc, sodium, potassium,
calcium and magnesium. Isolated occurrences of pesticides, polycyclic aromatic hydrocarbons and toluene were
also reported.
6.1.3 Surface Water and Sediment Sampling
Surface water and sediment samples were collected from five locations along the Floyds Fork Creek, four
locations along the creek tributary, and three on-site catchment basins. The samples were analyzed for TCL/TAL
parameters and cyanide. Chloroform and bromodichloromethane were found in one surface water sample from
the creek tributary and lindane was detected in a surface water sample from the Floyds Fork Creek. Sediments
from the three on-site catchment basins showed the presence of PAHs. Concentrations of the contaminants found
in the surface water and sediment samples were insignificant.
6.1.4 Groundwater Evaluation
Groundwater samples were collected from one up-gradient and two down-gradient domestic wells, two on-site
monitoring wells, and one domestic source spring near the site. The samples were analyzed for chemical
compounds of potential human health concern. No contaminants were found at significant concentrations in the
wells with the exception of the up-gradient sample which showed the presence of lead and cadmium at elevated
levels.
In addition to these samples which were collected by EPA contractors, Kentucky conducted a

24
confirmatory monitoring program to characterize seasonal fluctuations in contaminant levels. Groundwater was
sampled quarterly over a period of one year between 1996 and 1997, under a cooperative agreement with EPA.
Eleven on-site locations including two new wells, and one private well were sampled. Contaminants similar to those
obtained during previous sampling efforts were obtained at levels within the ranges from previous laboratory results.
Groundwater flow and contaminant transport characteristics were evaluated using dye trace analysis. The analysis
concluded that the primary aquifers underlying the landfill flow towards and discharge into the adjacent creeks.
Consequently, landfill contaminants transported by the groundwater would be discharged into the creeks.
However, sampling of the creeks indicated low contaminant concentrations. Furthermore, the dye trace study
indicated that a confining layer exists above the deeper aquifer (Saluda) which would limit its contamination by the
landfill.
6.1.5 Leachate Sampling
Several leachate springs, seeps, and ponds were found on and adjacent to the site during the RI. Six locations were
chosen and sampled. The samples indicated the presence of several organic and inorganic compounds at varying
concentrations which were determined to constitute a minimal threat to human health.
6.2 Summary of Human Health Risk Assessment
Human health risks posed by the Red Penn site were evaluated as part of the RI. The process of evaluation
included: (1) identification of chemicals of potential concern at the site, (2) exposure assessment, (3) toxicity
analysis, and (4) risk characterization.
6.2.1 Chemicals of Potential Concern
The RI field and laboratory activities were designed and conducted with proper quality control
25
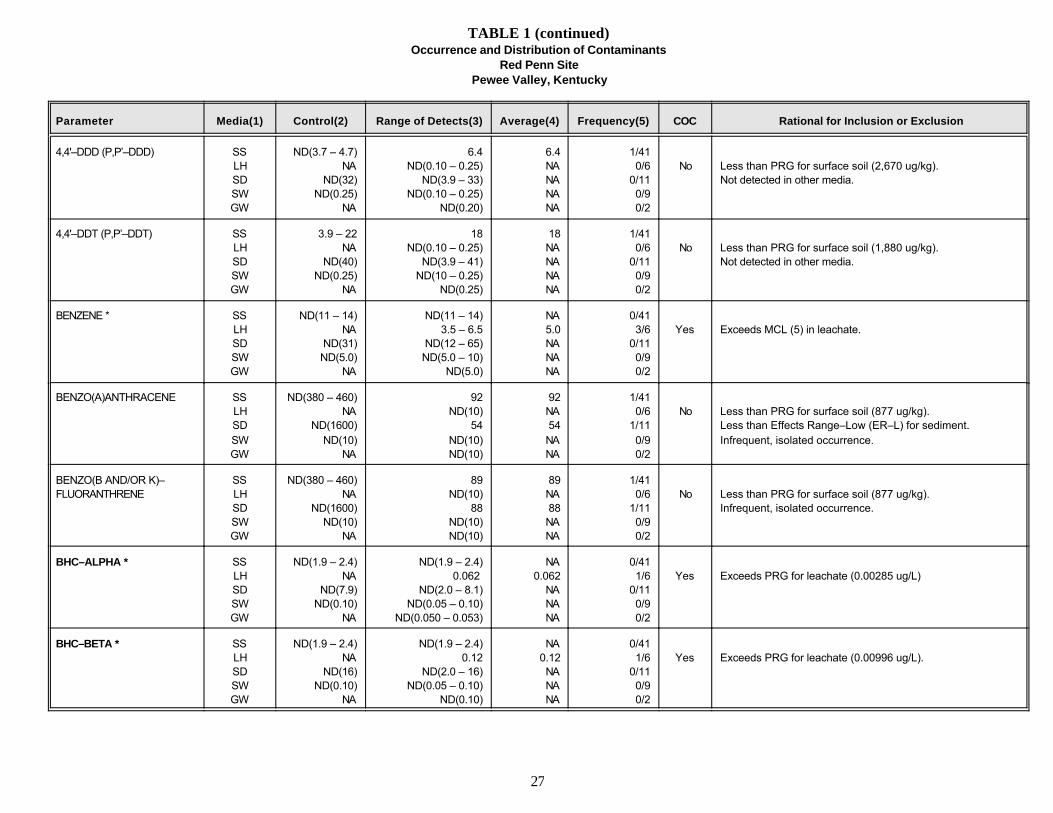
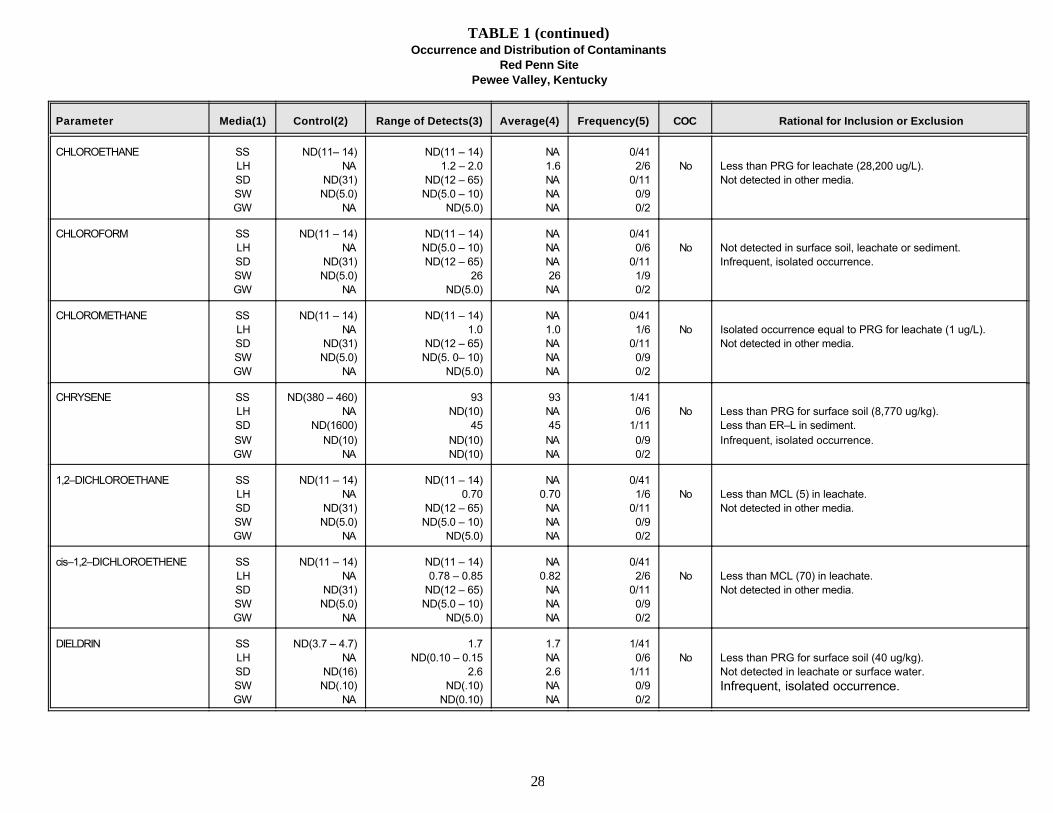
measures to identify the chemical compounds associated with the site. Upon completing the activities,approximately sixty-six different chemicals were found at the site. A listing of the chemicals is presentedin Table 1. A subset of the listed chemicals was selected as the contaminants of potential concern (COCS),by evaluating each chemical’s toxicity, concentration; and frequency of occurrence. The COCS arecadmium, chromium, lead, cyanide, benzene, three isomers of benzene hexachloride (alpha, beta, gamma),bis(2-ethylhexyl)phthalate, and carbon disulfide. Rationales for selecting these chemicals are stated in Table1.
6.2.2 Exposure Assessment
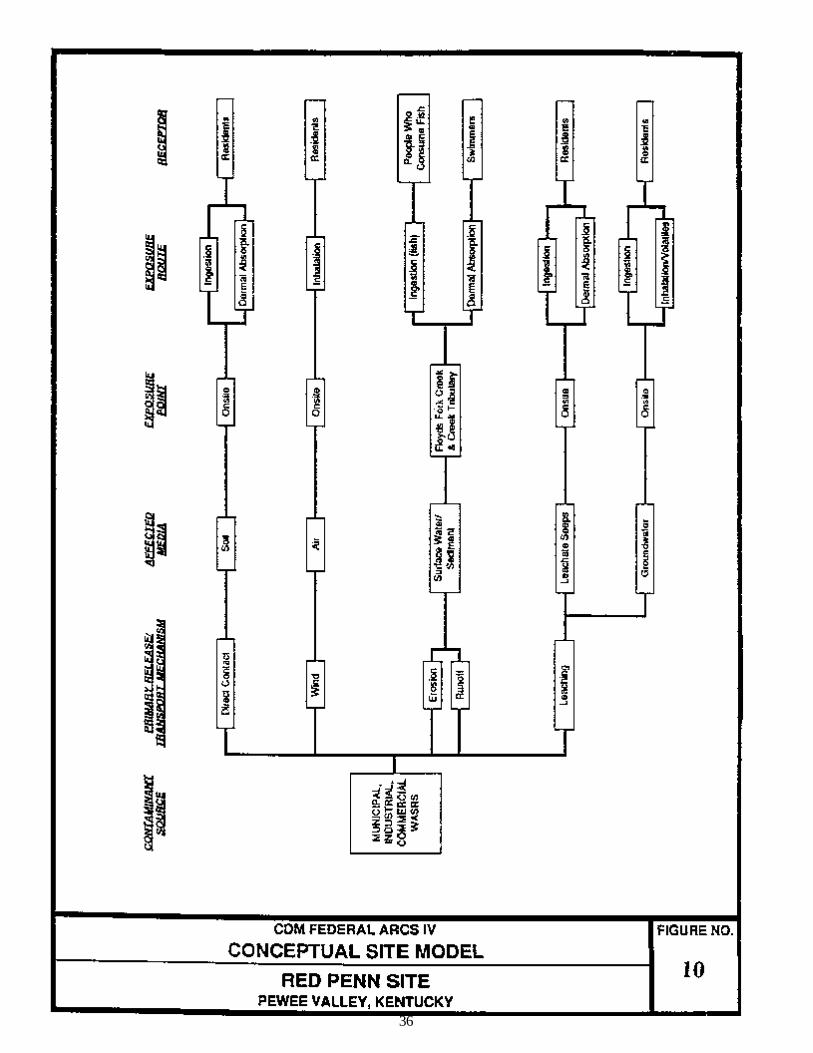
An analysis of potential human contact with the chemicals of concern at Red Penn was conducted. Sitephysical setting, fate and transport of the COCS, the potentially exposed populations, and all relevantexposure pathways were considered as detailed in the RI report. The various qualitative factors consideredin the exposure assessment are outlined in the Conceptual Site Model of Figure 10. Exposure to COCSwas expressed numerically and designated as Chronic Daily Intake (CDI). Quantitative factors used tocalculate chronic daily intake for each COC, including reasonable maximum exposure, contaminantconcentration, frequency, and duration of exposure, were based on worst case scenarios so as to deriveconservative exposure information.
6.2.3 Toxicity Analysis
Toxicity analysis was conducted to evaluate the potential for cases of cancer and/other adverse humanhealth problems as a result of exposure to each COC. The analysis was based on EPA’s slope factors forcarcinogenic effects and reference doses (RfDs) for non-carcinogenic effects. Results of the analysis areshown in Tables 2 and 3.
6.2.4 Risk Characterization
By integrating the results of exposure assessment and toxicity analysis, various cancer and non-cancer

26
TABLE 1Occurrence and Distribution of Contaminants
Red Penn SitePewee Valley, Kentucky
Parameter Media(1) Control(2) Range of Detects(3) Average(4) Frequency(5) COC Rational for Inclusion or Exclusion
ALUMINUM SSLHSDSWGW
5200 – 14000NA
110003900
NA
1900 – 45000430 – 4500
1600 – 170001200 – 4200280 – 2400
10,6001100800015001340
41/415/6
11/115/92/2
No Mean concentration less than 2 x background In all media.No EPA toxicity values available.
ANTIMONY SSLHSDSWGW
ND(8.5 – 20)NA
ND(30)ND(30)
NA
2.5 – 3.3ND(30)
ND(20 – 30)ND(30 – 60)
ND(30)
2.8NANANANA
3/410/6
0/110/90/2
No Less than preliminary remediation goal (PRG) for surface soil,(110 mg/kg).Not detected in other media.
ARSENIC SSLHSDSWGW
3 – 12NA80
ND(30)ND(30)
2.5 – 2313 – 343 – 78
ND(3 – 30)NA
12.82140NANA
19/414/6
10/110/90/2
No Less than 2 x background for surface soil and sediment.Less than MCL (50) in leachate.Less than PRG for surface soil (274 mg/kg)
BARIUM SSLHSDSWGW
36 – 120NA42063NA
15 – 170150 – 44021 – 44063 – 30027 – 98
7229221012063
41/416/6
11/116/92/2
No Less than MCL (2,000) in leachate.Less than PRGs for surface soil (13,700 mg/kg) and leachate(1,830 ug/L)
BERYLLIUM SSLHSDSWGW
0.50 – 1.0NA5.3
ND(5.0)NA
0.34 – 1.7ND(1 – 5.0)
0.41 – 5.8ND(1 – 5.0)
ND(5.0)
0.72NA2.7NANA
41/410/6
9/110/90/2
No Less than 2 x background in surface soil and sediment.Not detected in leachate or surface water.
CADMIUM * SSLHSDSWGW
ND(0.48 – 1.5)NA
ND(5.0)ND(5.0)
NA
ND(0.41 – 1.5)9 – 13
0.85 – 2.73 – 6
ND(5.0)
NA101.8
4NA
0/413/6
2/115/90/2
Yes Exceeds MCL (5) in leachate.
CALCIUM SSLHSDSWGW
800 – 150000NA
7400041000
NA
1000 – 15000076000 – 1450008100 – 14000041000 – 72000
48000 – 100000
58,300110000750005600074000
41/416/6
10/109/92/2
No Less than 2 x background in all media.No EPA toxicity values available.
27
TABLE 1 (continued)Occurrence and Distribution of Contaminants
Red Penn SitePewee Valley, Kentucky
Parameter Media(1) Control(2) Range of Detects(3) Average(4) Frequency(5) COC Rational for Inclusion or Exclusion
4,4'–DDD (P,P’–DDD) SSLHSDSWGW
ND(3.7 – 4.7)NA
ND(32)ND(0.25)
NA
6.4ND(0.10 – 0.25)
ND(3.9 – 33)ND(0.10 – 0.25)
ND(0.20)
6.4NANANANA
1/410/6
0/110/90/2
No Less than PRG for surface soil (2,670 ug/kg).Not detected in other media.
4,4'–DDT (P,P’–DDT) SSLHSDSWGW
3.9 – 22NA
ND(40)ND(0.25)
NA
18ND(0.10 – 0.25)
ND(3.9 – 41)ND(10 – 0.25)
ND(0.25)
18NANANANA
1/410/6
0/110/90/2
No Less than PRG for surface soil (1,880 ug/kg).Not detected in other media.
BENZENE * SSLHSDSWGW
ND(11 – 14)NA
ND(31)ND(5.0)
NA
ND(11 – 14)3.5 – 6.5
ND(12 – 65)ND(5.0 – 10)
ND(5.0)
NA5.0NANANA
0/413/6
0/110/90/2
Yes Exceeds MCL (5) in leachate.
BENZO(A)ANTHRACENE SSLHSDSWGW
ND(380 – 460)NA
ND(1600)ND(10)
NA
92ND(10)
54ND(10)ND(10)
92NA54NANA
1/410/6
1/110/90/2
No Less than PRG for surface soil (877 ug/kg).Less than Effects Range–Low (ER–L) for sediment.Infrequent, isolated occurrence.
BENZO(B AND/OR K)–FLUORANTHRENE
SSLHSDSWGW
ND(380 – 460)NA
ND(1600)ND(10)
NA
89ND(10)
88ND(10)ND(10)
89NA88NANA
1/410/6
1/110/90/2
No Less than PRG for surface soil (877 ug/kg).Infrequent, isolated occurrence.
BHC–ALPHA * SSLHSDSWGW
ND(1.9 – 2.4)NA
ND(7.9)ND(0.10)
NA
ND(1.9 – 2.4)0.062
ND(2.0 – 8.1)ND(0.05 – 0.10)
ND(0.050 – 0.053)
NA0.062
NANANA
0/411/6
0/110/90/2
Yes Exceeds PRG for leachate (0.00285 ug/L)
BHC–BETA * SSLHSDSWGW
ND(1.9 – 2.4)NA
ND(16)ND(0.10)
NA
ND(1.9 – 2.4)0.12
ND(2.0 – 16)ND(0.05 – 0.10)
ND(0.10)
NA0.12NANANA
0/411/6
0/110/90/2
Yes Exceeds PRG for leachate (0.00996 ug/L).
28
TABLE 1 (continued)Occurrence and Distribution of Contaminants
Red Penn SitePewee Valley, Kentucky
Parameter Media(1) Control(2) Range of Detects(3) Average(4) Frequency(5) COC Rational for Inclusion or Exclusion
CHLOROETHANE SSLHSDSWGW
ND(11– 14)NA
ND(31)ND(5.0)
NA
ND(11 – 14)1.2 – 2.0
ND(12 – 65)ND(5.0 – 10)
ND(5.0)
NA1.6NANANA
0/412/6
0/110/90/2
No Less than PRG for leachate (28,200 ug/L).Not detected in other media.
CHLOROFORM SSLHSDSWGW
ND(11 – 14)NA
ND(31)ND(5.0)
NA
ND(11 – 14)ND(5.0 – 10)ND(12 – 65)
26ND(5.0)
NANANA26NA
0/410/6
0/111/90/2
No Not detected in surface soil, leachate or sediment.Infrequent, isolated occurrence.
CHLOROMETHANE SSLHSDSWGW
ND(11 – 14)NA
ND(31)ND(5.0)
NA
ND(11 – 14)1.0
ND(12 – 65)ND(5. 0– 10)
ND(5.0)
NA1.0NANANA
0/411/6
0/110/90/2
No Isolated occurrence equal to PRG for leachate (1 ug/L).Not detected in other media.
CHRYSENE SSLHSDSWGW
ND(380 – 460)NA
ND(1600)ND(10)
NA
93ND(10)
45ND(10)ND(10)
93NA45NANA
1/410/6
1/110/90/2
No Less than PRG for surface soil (8,770 ug/kg).Less than ER–L in sediment.Infrequent, isolated occurrence.
1,2–DICHLOROETHANE SSLHSDSWGW
ND(11 – 14)NA
ND(31)ND(5.0)
NA
ND(11 – 14)0.70
ND(12 – 65)ND(5.0 – 10)
ND(5.0)
NA0.70NANANA
0/411/6
0/110/90/2
No Less than MCL (5) in leachate.Not detected in other media.
cis–1,2–DICHLOROETHENE SSLHSDSWGW
ND(11 – 14)NA
ND(31)ND(5.0)
NA
ND(11 – 14)0.78 – 0.85
ND(12 – 65)ND(5.0 – 10)
ND(5.0)
NA0.82NANANA
0/412/6
0/110/90/2
No Less than MCL (70) in leachate.Not detected in other media.
DIELDRIN SSLHSDSWGW
ND(3.7 – 4.7)NA
ND(16)ND(.10)
NA
1.7ND(0.10 – 0.15
2.6ND(.10)
ND(0.10)
1.7NA2.6NANA
1/410/6
1/110/90/2
No Less than PRG for surface soil (40 ug/kg).Not detected in leachate or surface water.Infrequent, isolated occurrence.

29
TABLE 1 (continued)Occurrence and Distribution of Contaminants
Red Penn SitePewee Valley, Kentucky
Parameter Media(1) Control(2) Range of Detects(3) Average(4) Frequency(5) COC Rational for Inclusion or Exclusion
CHROMIUM * SSLHSDSWGW
7 – 21 NA91
ND(10)NA
4.4 – 5635 – 65
5.5 – 11011 – 31
18
1653431618
41/413/6
11/115/91/2
Yes Exceeds state drinking water quality standard (50) in leachate.
COLBALT SSLHSDSWGW
4.8 – 16NA91
ND(10)NA
2.2 – 1955
3.1 – 91ND(4 – 30)
ND(10)
8.95557NANA
41/411/6
7/110/90/2
No Less than 2 x background in all media.No EPA toxicity values available.
COPPER SSLHSDSWGW
4.3 – 16NA3313NA
2 – 31ND(10 – 30)
2.8 – 3311
ND(10)
8.9NA
16.711NA
31/410/6
6/111/90/2
No Less than 2 x background in all media.Less than PRGs for surface soil (10,200 mg/kg) and leachate.(1,350 ug/L)
IRON SSLHSDSWGW
10000 – 25000NA
2000003800
NA
8600 – 540001400 – 9000
6000 – 2100001050 – 6900440 – 5200
22,30013200
10900027002820
41/416/6
11/116/92/2
No Mean concentration less than 2 x background in all media.No EPA toxicity values available..
LEAD * SSLHSDSWGW
18 – 25NA78
ND(40)NA
1.1–1005 – 9
4.6 – 985
ND(40)
19.67
395
NA
41/412/6
11/111/90/2
Yes Exceeds 2 x background in surface soil.
MAGNESIUM SSLHSDSWGW
1000 – 58000NA
360015000
NA
1300 – 6100056000 – 190000
3100 – 6300015000 – 7400043000 – 48000
32,500109000200002900045500
41/416/6
11/119/92/2
No Mean concentration less than 2 x background in all media.No EPA toxicity values available.
MANGANESE SSLHSDSWGW
560 – 2100NA
10000120NA
260 – 2900340 – 825
380 – 710021 – 32021 – 160
1,100550
320011291
41/416/6
11/119/92/2
No Mean concentration less than 2 x background in all media.Less than PRGs in surface soil (27,400 mg/kg) and leachate.(3,650 ug/L)

30
TABLE 1 (continued)Occurrence and Distribution of Contaminants
Red Penn SitePewee Valley, Kentucky
Parameter Media(1) Control(2) Range of Detects(3) Average(4) Frequency(5) COC Rational for Inclusion or Exclusion
MERCURY SSLHSDSWGW
ND(0.11 – 0.15)NA
0.06ND(0.2)
NA
0.12 – 0.23ND(0.2 – 0.3)
0.05ND(0.2)ND(0.2)
0.17NA
0.05NANA
3/410/6
4/110/90/2
No Not detected above background in sediment.Less than PRG in surface soil (82.3 mg/kg)Not detected in other media.
MOLYBDENUM SSLHSDSWGW
NANA
ND(10)ND(10)
NA
NAND(10)ND(10)11 – 20ND(10)
NANANA16NA
NA0/30/44/40/2
No Not analyzed for in surface soil or leachate.No evidence to link to the site.
NICKEL SSLHSDSWGW
5.2 – 16NA73
ND(20)NA
3.4 – 3634 – 813.1 – 7517 – 46ND(20)
12543732NA
41/413/6
11/112/90/2
No Less than MCL (100) in leachate.Less than PRGs in surface soil (5,490 mg/kg) and leachate,(730 ug/L)
POTASSIUM SSLHSDSWGW
480 – 1800NA
ND(2000)5800
NA
780 – 380017000 – 580000
450 – 22005800 – 230000
3800–6100
2100260000
1200340004950
41/416/6
7/119/92/2
No Mean concentration less than 2 x background in all media.No EPA toxicity values available.
SILVER SSLHSDSWGW
ND(0.72 – 1.9)NA
ND(10)ND(10)
NA
18ND(2 – 10)
9.6ND(3 – 10)
ND(10)
18NA9.6NANA
1/410/6
1/110/90/2
No Less than PRG in surface soil (823 mg/kg).Not detected in leachate or surface water.Infrequent, isolated occurrence.
SODIUM SSLHSDSWGW
ND(50 – 210)NA
ND(1000)28000
NA
93 – 70068000 – 1000000
220 – 86028000 – 40000012000 – 25000
177440000
3509300018500
24/416/6
7/119/92/2
No No EPA toxicity values available.
STRONTIUM SSLHSDSWGW
NANA9072NA
NA160 – 56076 – 12075 – 83
460 – 1000
NA2909080
730
NA3/34/44/42/2
No Less than 2 x background in surface water and sediment.No EPA toxicity values available.

31
TABLE 1 (continued)Occurrence and Distribution of Contaminants
Red Penn SitePewee Valley, Kentucky
Parameter Media(1) Control(2) Range of Detects(3) Average(4) Frequency(5) COC Rational for Inclusion or Exclusion
TIN SSLHSDSWGW
NANA160
ND(25)NA
NANA(25)ND(25)ND(25)ND(25)
NANANANANA
NA0/60/40/40/2
No Not detected in site leachate, sediment or surface water.Not analyzed for in surface soil.
TITANIUM SSLHSDSWGW
NANA8545NA
NA13 – 14
95 – 13019 – 4410 – 39
NA14
1103125
NA2/34/44/42/2
No Less than 2 x background in surface water and sediment.No EPA toxicity values available.
VANADIUM SSLHSDSWGW
13 – 37NA120
ND(10)NA
9.1 – 82ND(10 – 100)
12 – 140ND(6 – 20)
ND(10)
27NA75NANA
41/410/6
9/110/90/2
No Less than 2 x background in sediment.Less than PRG for surface soil (1,920 mg/kg).Not detected in leachate or surface water.
YTTRIUM SSLHSDSWGW
NANA45
ND(10)NA
NAND(10)46 – 62ND(10)ND(10)
NANA52NANA
NA0/34/40/40/2
No Less than 2 x background in sediment.Not detected in othermedia.
ZINC SSLHSDSWGW
24 – 54NA7314NA
11 – 17014 – 12024 – 10016 – 8828 – 36
2969645232
30/414/6
9/112/92/2
No Less than 2 x background in sediment.Less than PRG for surface soil (54,900 mg/kg).Less than SMCL (5,000) in leachate.
CYANIDE * SSLHSDSWGW
ND(0.59 – 0.80)NA
ND(0.24)ND(4)
NA
0.54 – 2.851 – 69
ND(0.24 – 1.0)350
ND(4)
1.560NA350NA
15/412/6
0/111/90/2
Yes Exceeds 2 x background in surface soil and surface water.
4,4'DDE (P,P’–DDE) SSLHSDSWGW
3.9 – 36NA
ND(16)ND(0.10)
NA
2.3 – 14ND(0.10 – 0.25)
ND(3.9 – 16)ND(0.10)ND(0.10)
8.2NANANANA
2/410/6
0/110/90/2
No Less than PRG for surface soil (1,880 ug/kg).Not detected in other media.
32
TABLE 1 (continued)Occurrence and Distribution of Contaminants
Red Penn SitePewee Valley, Kentucky
Parameter Media(1) Control(2) Range of Detects(3) Average(4) Frequency(5) COC Rational for Inclusion or Exclusion
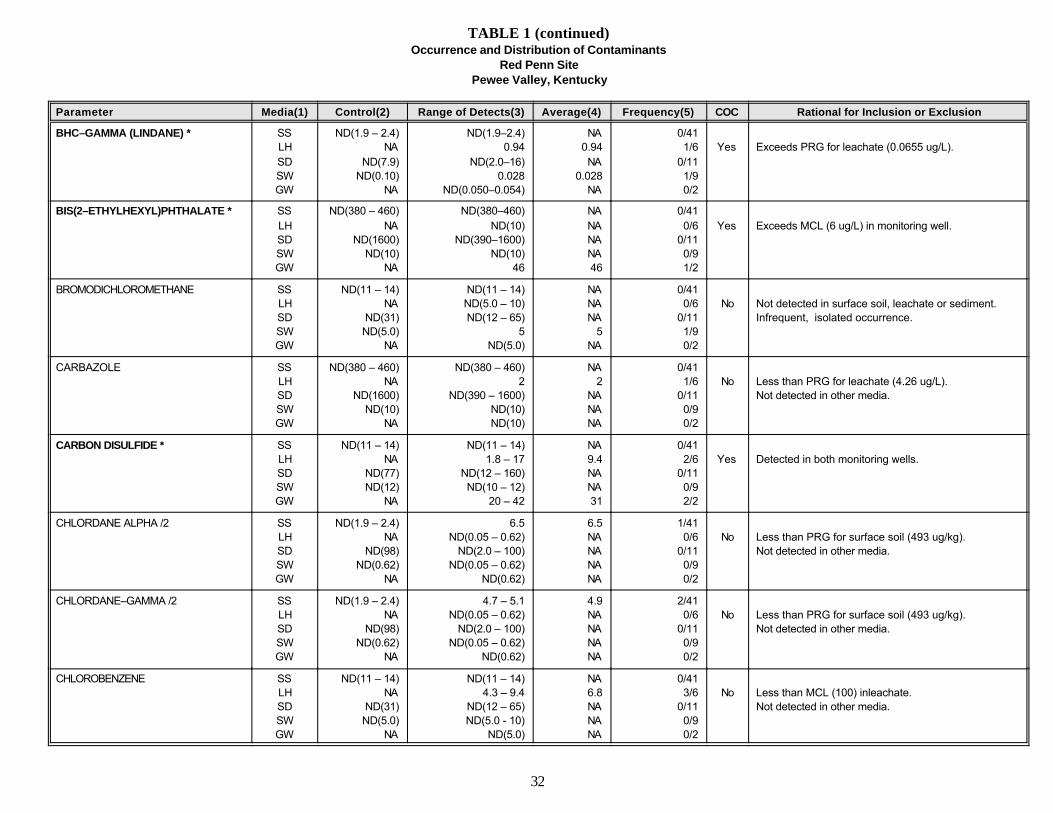
BHC–GAMMA (LINDANE) * SSLHSDSWGW
ND(1.9 – 2.4)NA
ND(7.9)ND(0.10)
NA
ND(1.9–2.4)0.94
ND(2.0–16)0.028
ND(0.050–0.054)
NA0.94NA
0.028NA
0/411/6
0/111/90/2
Yes Exceeds PRG for leachate (0.0655 ug/L).
BIS(2–ETHYLHEXYL)PHTHALATE * SSLHSDSWGW
ND(380 – 460)NA
ND(1600)ND(10)
NA
ND(380–460)ND(10)
ND(390–1600)ND(10)
46
NANANANA46
0/410/6
0/110/91/2
Yes Exceeds MCL (6 ug/L) in monitoring well.
BROMODICHLOROMETHANE SSLHSDSWGW
ND(11 – 14)NA
ND(31)ND(5.0)
NA
ND(11 – 14)ND(5.0 – 10)ND(12 – 65)
5ND(5.0)
NANANA
5NA
0/410/6
0/111/90/2
No Not detected in surface soil, leachate or sediment.Infrequent, isolated occurrence.
CARBAZOLE SSLHSDSWGW
ND(380 – 460)NA
ND(1600)ND(10)
NA
ND(380 – 460)2
ND(390 – 1600)ND(10)ND(10)
NA2
NANANA
0/411/6
0/110/90/2
No Less than PRG for leachate (4.26 ug/L). Not detected in other media.
CARBON DISULFIDE * SSLHSDSWGW
ND(11 – 14)NA
ND(77)ND(12)
NA
ND(11 – 14)1.8 – 17
ND(12 – 160)ND(10 – 12)
20 – 42
NA9.4NANA31
0/412/6
0/110/92/2
Yes Detected in both monitoring wells.
CHLORDANE ALPHA /2 SSLHSDSWGW
ND(1.9 – 2.4)NA
ND(98)ND(0.62)
NA
6.5ND(0.05 – 0.62)
ND(2.0 – 100)ND(0.05 – 0.62)
ND(0.62)
6.5NANANANA
1/410/6
0/110/90/2
No Less than PRG for surface soil (493 ug/kg).Not detected in other media.
CHLORDANE–GAMMA /2 SSLHSDSWGW
ND(1.9 – 2.4)NA
ND(98)ND(0.62)
NA
4.7 – 5.1ND(0.05 – 0.62)
ND(2.0 – 100)ND(0.05 – 0.62)
ND(0.62)
4.9NANANANA
2/410/6
0/110/90/2
No Less than PRG for surface soil (493 ug/kg).Not detected in other media.
CHLOROBENZENE SSLHSDSWGW
ND(11 – 14)NA
ND(31)ND(5.0)
NA
ND(11 – 14)4.3 – 9.4
ND(12 – 65)ND(5.0 - 10)
ND(5.0)
NA6.8NANANA
0/413/6
0/110/90/2
No Less than MCL (100) inleachate.Not detected in other media.

33
TABLE 1 (continued)
Occurrence and Distribution of ContaminantsRed Penn Site
Pewee Valley, Kentucky
Parameter Media(1) Control(2) Range of Detects(3) Average(4) Frequency(5) COC Rationale for Inclusion or Exclusion
DIETHYL PHTHALATE SS ND(380–460) 41–46 44 3/41LH NA ND(10) NA 0/6 No Less than PRG for surface soil (220,000 ug/kg).SD ND(1600) ND(390–1600) NA 0/11 Not detected in other media.
SW ND(10) ND(10) NA 0/9GW NA ND(10) NA 0/2
DI-N-BUTYLPHTHALATE SS ND(380–460) ND(380–460) NA 0/41LH NA ND(10) NA 0/6 No Not detected in surface soil, leachate or surface water.SD ND(1600) 120 120 1/11 Infrequent, isolated occurrence.SW ND(10) ND(10) NA 0/9GW NA ND(10) NA 0/2
ENDRIN SS ND(3.7–4.7) 0.72–2.2 1.5 2/41LH NA ND(0.10–0.25) NA 0/6 No Less than PRG for surface soil (10,900 ug/kg).SD ND(32) ND(4.0–34) NA 0/11 Not detected in other media.SW ND(.25) ND(.10–0.25) NA 0/9GW NA ND(0.20–0.21) NA 0/2
FLUORANTHENE SS ND(380–460) 67 67 1/41LH NA ND(10) NA 0/6 No Less than PRG for surface soil (1460 ug/kg).SD ND(1600) 92 92 1/11 Less than ER–L for sediment.SW ND(10) ND(10) NA 0/9 Infrequent, isolated occurrence.GW NA ND(10) NA 0/2
METHYL BUTYL KETONE SS ND(11–14) ND(11–14) NA 0/41LH NA 2.2 2.2 1/6 No Less than PRG for leachate (176 ug/L).SD ND(77) ND(12–160) NA 0/11 Not detected in other media.SW ND(12) ND(10–12) NA 0/9GW NA ND(12) NA 0/2
METHYL ETHYL KETONE SS ND(11–14) ND(11–14) NA 0/41LH NA ND(10–50) NA 0/6 No Not detected in surface soil, leachate or surface water.SD ND(310) 59 59 1/11 Infrequent, isolated occurrence.SW ND(50) ND(10–50) NA 0/9GW NA ND(50) NA 0/2
NAPHTHALENE SS ND(380–460) ND(380–460) NA 0/41LH NA 1.5 1.5 1/6 No Less than PRG for leachate (1460 ug/L).SD ND(1600) ND(390–1600) NA 0/11 Not detected in other media.SW ND(10) ND(10) NA 0/9GW NA ND(10) NA 0/2

34
TABLE 1 (continued)
Occurrence and Distribution of ContaminantsRed Penn Site
Pewee Valley, Kentucky
Parameter Media(1) Control(2) Range of Detects(3) Average(4) Frequency(5) COC Rationale for Inclusion or Exclusion
PCB–1254 (AROCLOR 1254) SS ND(37–47) 48–190 110 2/41LH NA ND(1.0–2.5) NA 0/6 No Less than EPA remediation goal (1 ppm) for surface soil.SD ND(190) ND(40–200) NA 0/11 Not detect in other media.
SW ND(1.2) ND(1.0–1.2) NA 0/9GW NA ND(1.2) NA 0/2
PHENANTHRENE SS ND(380–460) 46–48 47 3/41LH NA ND(10) NA 0/6 No Less than PRG for surface soil (8,230,000 ug/kg).SD ND(1600) 65 65 1/11 Not detect in leachate or surface water.SW ND(10) ND(10) NA 0/9 Less than ER–L in sediment.GW NA ND(10) NA 0/2
PYRENE SS ND(380–460) 59 59 1/41LH NA ND(10) NA 0/6 No Less than PRG for surface soil (8,230,000 ug/kg).SD ND(1600) 86 86 1/11 Not detected in leachate or surface water.SW ND(10) ND(10) NA 0/9 Less than ER–L in sediment.GW NA ND(10) NA 0/2
TOLUENE SS ND(11–14) 2–4 3 3/41LH NA 0.58 0.58 1/6 No Less than PRGs for surface soil (54,900 ug/kg) and leachate, (3,150 ug/L).SD ND(31) ND(12–65) NA 0/11SW ND(5.0) ND(5.0–10) NA 0/9 Not detected in sediment or surface water.GW NA ND(5.0) NA 0/2
XYLENE-O SS ND(11–14) ND(11-14) NA 0/41LH NA 0.57 0.57 1/6 No Less than PRG for leachate (828 ug/L).SD ND(31) ND(12–65) NA 0/11 Less than MCL (10,000) in leachate.SW ND(5.0) ND(5.0–10) NA 0/9 Not detected in other media.GW NA ND(5.0) NA 0/2
XYLENE (M–AND/OR P–) SS ND(11–14) ND(11–14) NA 0/41LH NA 0.52–1.5 1.1 3/6 No Less than PRG for leachate (828 ug/L).SD ND(31) ND(12–65) NA 0/11 less than MCL (10,000) in leachate.SW ND(5.0) ND(5.0–10) NA 0/9 Infrequent, isolated occurrence.GW NA ND(5.0) NA 0/2
XYLENES (TOTAL) SS ND(11–14) ND(11–14) NA 0/41LH NA 1–2 1.5 1/6 No Less than PRG for leachate (828 ug/L).SD ND(310) 47 47 2/11 Less than MCL (10,000) in leachate.SW ND(5.0) ND(5.0–10) NA 0/9 Infrequent, isolated occurrence.GW NA ND(5.0) NA 0/2
35
TABLE 1 (continued)
Occurrence and Distribution of ContaminantsRed Penn Site
Pewee Valley, Kentucky
Notes:
1. SS is surface soil. LH is leachate. SD is sediment. SW is surface water. GW is groundwater.
2. Control samples are: surface soil– samples: SS–01, SS–04, SS–05, SS–06, SS–07, SS–08, SS-29, SS–30.Leachate– not applicable. Sediment–SD–06. Surface water– SW–06. Groundwater – none.
3. Surface soil samples were collected in October 1991. Leachate samples were collected in August and October 1991.Sediment samples were collected in September, October, and November 1991. Surface water samples were collected in September and October 1991.Units are: ug/kg for organic soil samples, ug/l for organic water samples (including leachate), mg/kg for inorganic soil samples, and ug/l for inorganic water samples (including leachate).
4. Arithmetic mean of samples with detected contamination “hits”. Surface soil samples SS–02 and SS–03 not included.
5. Detected contamination “hits” per sample location. Duplicate samples were combined, using the higher detected value.
COC Contaminant of Concern
ND( ) Not detected. The number (or range) is the sample quantitation limit (or range of SQLs).
NA Not applicable.
• Contaminant of Concern
36

37
TABLE 2
Cancer Slope Factors, Tumor Sites and EPA Cancer Classifications for Contaminants of ConcernRed Penn Site
Pewee Valley, Kentucky
COC CSF(mg/kg/day)–1 Tumor Sites EPA
Classification
Oral Inhalation Dermal (1) Oral/Dermal Inhalation
CADMIUM NA 6.3E+00 (2) NA NA respiratory tract B1
CHROMIUM VI NA 4.2E+00 (2) NA NA lung A
LEAD NA NA NA NA NA B2
CYANIDE NA NA NA NA NA D
BENZENE 2.9E–02 (2) 2.9E–02 (2) 3.6E–02 hematological changes hematological changes A
ALPHA–BHC 6.3E+00 (2) 6.3E+00 (2) 1.3E+01 liver liver B2
BETA–BHC 1.8E+00 (2) 1.8E+00 (2) 3.6E+00 liver NA C
GAMMA–BHC (LINDANE) 1.3E+00 (3) NA 2.6E+00 liver NA B2
BIS(2–ETHYLHEXYL)PHTHALATE 1.4E–02 (2) NA 2.8E–02 liver NA B2
CARBON DISULFIDE NA NA NA NA NA D
(1) Derived from administered dose (oral) using a conversion factor of 80% for benzene, 50% for BHC isomers (Region IV guidance, march 23, 1993) (2) IRIS, 1992 (3) HEAST, 1992
COC Contaminant of ConcernCSF Cancer Slope FactorNA Not ApplicableEPA Classifications: A Human Carcinogen B1 Probable Human Carcinogen B2 Probably Human Carcinogen C Possible Human Carcinogen D Not Classifiable as to Human Carcinogenicity

38
TABLE 3
Reference Doses, Target Sites, and Confidence Levels for Contaminants of ConcernRed Penn Site
Pewee Valley, Kentucky
COC RfD(mg/kg/day)–1 Target Sites Uncertainty Factor
Oral Inhalation Dermal (1) Oral/Dermal Inhalation Oral Inhalation
Dermal
CADMIUM 5.0E–04 (2) NA 1.0E–04 kidney NA 10 Na High
CHROMIUM VI 5.0E–03 (2) NA 1.0E–03 not defined nasal mucosa atrophy 500 NA High
LEAD NA NA NA CNS, hematologicalchanges
NA NA NA NA
CYANIDE 2.0E–02 (2) NA 4.0E–03 weight loss, thyroid effects. NA 100 NA NA
BENZENE NA NA NA NA NA NA NA NA
ALPHA–BHC NA NA NA NA NA NA NA NA
BETA–BHC NA NA NA NA NA NA NA NA
GAMMA–BHC (LINDANE) 3.0E–04 (2) NA 1.5E–04 liver, kidney NA 1000 NA High
BIX(2–ETHYLHEXYL)PHTHALATE 2.0E–02 (2) NA 1.0E–02 liver NA 1000 NA High
CARBON DISULFIDE 1.0E–01 (2) 2.9E–03 8.0E–02 fetal toxicity fetal toxicity 100 1000 High
(1) Derived from administered dose (oral) using a conversion factor of 20% for inorganics and 50% for semivolatiles, and 80% for volatiles (EPA guidance, march 23, 1993) (2) IRIS, 1992
COC Contaminant of ConcernRfD Reference Dose NA Not Applicable

39
risks were calculated. The process considered pertinent exposure pathways and routes in addition to other
factors such as body weight and age of the person at risk, exposure to a single COC, simultaneous
exposures to several COCS, and duration of exposure. Results of the calculations are summarized in Table
4. A review of the table indicates that estimates of cancer risk are as follows:
Child Resident Adult Resident
Exposure to Leachate 1.3E-6 2.2E-6
Exposure to Soil 1.6E-9 1.7E-9
Exposure to Groundwater 3.5E-6 6.0E-6
By summing the risks for a child and an adult across all pathways, the total cancer risk of 1.3E-5 is
obtained for the site. This level of cancer risk is within EPA’s acceptable range of 1.0E-4 to 1.0E-6.
Therefore, no contaminants of concern were identified for the site.
As Table 4 indicates, a total Hazard Index of 0.98 was obtained for the site by summing the indices for a
child and an adult over all exposure routes. The total HI is close to the EPA’s threshold of 1.0 for
unacceptable non-cancer risks. Never-the-less, adverse health effects are not expected for either a child
or an adult resident since the residential scenario and/or consumption of leachate assumed in the
calculations exaggerated actual exposure conditions. In addition, summing of the hazard indices assumed
that toxic effects from the various exposure pathways would impact the same target organ. Most likely,
however, the organ potentially affected by the COCS would vary with respect to exposure pathways. As
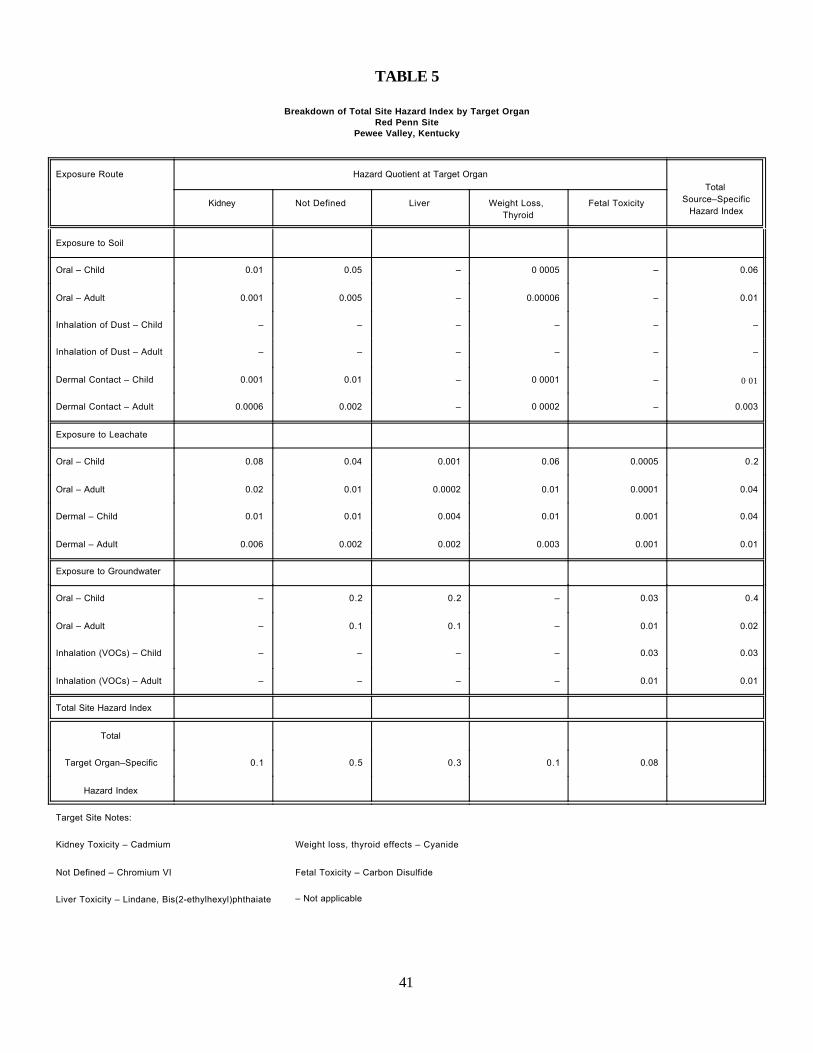
presented in Table 5, HI ranges from approximately 0.1 to 0.5 for the different target organs and does not
signify an unacceptable non-cancer risk.
6.3 Summary of Ecological Risk Assessment
A site reconnaissance was conducted to assess ecological risks associated with the landfill in 1991. The
aim was to identify dominant species of fauna, flora, ecological receptors, and stressed environments in
the area. In addition, the survey researched the endangered species and their habitats
40
TABLE 4
Summary of Site RiskRed Penn Site
Pewee Valley, KentuckyChild Resident Adult Resident Child and Adult Resident
Exposure to Soil Cancer HI Cancer HI Cancer HI
Oral NA 0.06 NA 0.01 NA 0.07
Inhalation (dust) 1.6E–09 NA 1.7E–09 NA 3.3E–09 NA
Dermal Contact NA 0.01 NA 0.003 NA 0.01
Total Source–Specific Risk 1.6E–09 0.07 1.7E–09 0.01 3.3E–09 0.08
Exposure to Leachate Cancer HI Cancer HI Cancer HIOral 2.4E–07 0.18 2.1E–07 0.04 4.5E–07 0.2
Dermal Contact 1.1E–06 0.03 2.0E–06 0.012 3.1E–06 0.04
Total Source–Specific Risk 1.3E–06 0.21 2.2E–06 0.05 3.5E–06 0.26
Exposure to Groundwater Cancer HI Cancer HI Cancer HIOral 3.5E–06 0.4 6.0E–06 0.2 9.5E–06 0.60
Inhalation (VOCs) NA 0.03 NA 0.01 NA 0.04
Total Source–Specific Risk 3.5E–06 0.43 6.0E–06 0.21 9.5E–06 0.64
Total Site Risk 4.8E–06 0.7 8.2E–06 0.3 1.3E–05 0.98 *
HI Hazard Index (noncancer risk)NA Not Applicable
* See Table 6–39–A
41
TABLE 5
Breakdown of Total Site Hazard Index by Target OrganRed Penn Site
Pewee Valley, Kentucky
Exposure Route Hazard Quotient at Target OrganTotal
Source–SpecificHazard Index
Kidney Not Defined Liver Weight Loss, Thyroid
Fetal Toxicity
Exposure to Soil
Oral – Child 0.01 0.05 – 0 0005 – 0.06
Oral – Adult 0.001 0.005 – 0.00006 – 0.01
Inhalation of Dust – Child – – – – – –
Inhalation of Dust – Adult – – – – – –
Dermal Contact – Child 0.001 0.01 – 0 0001 – 0 01
Dermal Contact – Adult 0.0006 0.002 – 0 0002 – 0.003
Exposure to Leachate
Oral – Child 0.08 0.04 0.001 0.06 0.0005 0.2
Oral – Adult 0.02 0.01 0.0002 0.01 0.0001 0.04
Dermal – Child 0.01 0.01 0.004 0.01 0.001 0.04
Dermal – Adult 0.006 0.002 0.002 0.003 0.001 0.01
Exposure to Groundwater
Oral – Child – 0.2 0.2 – 0.03 0.4
Oral – Adult – 0.1 0.1 – 0.01 0.02
Inhalation (VOCs) – Child – – – – 0.03 0.03
Inhalation (VOCs) – Adult – – – – 0.01 0.01
Total Site Hazard Index
Total
Target Organ–Specific 0.1 0.5 0.3 0.1 0.08
Hazard Index
Target Site Notes:
Kidney Toxicity – Cadmium Weight loss, thyroid effects – Cyanide
Not Defined – Chromium VI Fetal Toxicity – Carbon Disulfide
Liver Toxicity – Lindane, Bis(2-ethylhexyl)phthaiate – Not applicable
42
on and near the site. Stressed vegetation was observed in the vicinity of leachate seeps and their flow paths.
No endangered or threatened flora or fauna was observed and no threat to their habitats was evident.
Ecological studies were conducted at the site to determine landfill impact on the structure and function of
biological communities in the creek. The studies included collection and identification of benthic macro
invertebrate, mussels sampling and metal analysis, and leachate toxicity testing on bioassay. Four locations
on Floyds Fork Creek and two locations on the tributary were sampled for benthic macro invertebrates.
The sampling locations are shown on Figure 11 where the background test location is labeled “1”. Samples
were processed in the laboratory where the organisms were identified to the lowest taxonomic level
possible. Results of the species identification did not indicate a significant difference in diversity between
the locations sampled. The diversity index calculated ranged from 2.42 to 2.98 which was considered
normal for the area. However, at test locations #3 and #4, the study observed relatively high numbers of
pollution tolerant species.
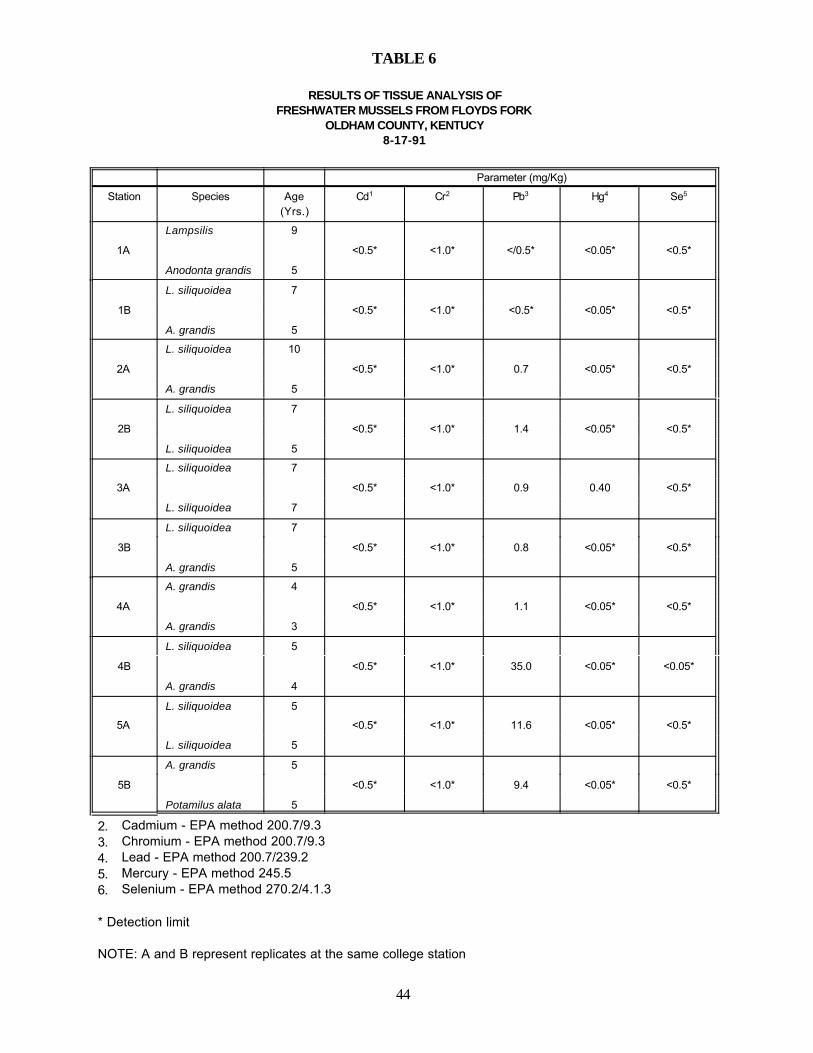
Fresh water mussels were collected by hand from stations 1 through 5 (Figure 11), on the Floyds Fork
Creek. for tissue metal analysis. Table 6 presents the results and demonstrates that lead contamination was
observed in the creek except in the up-gradient sample.
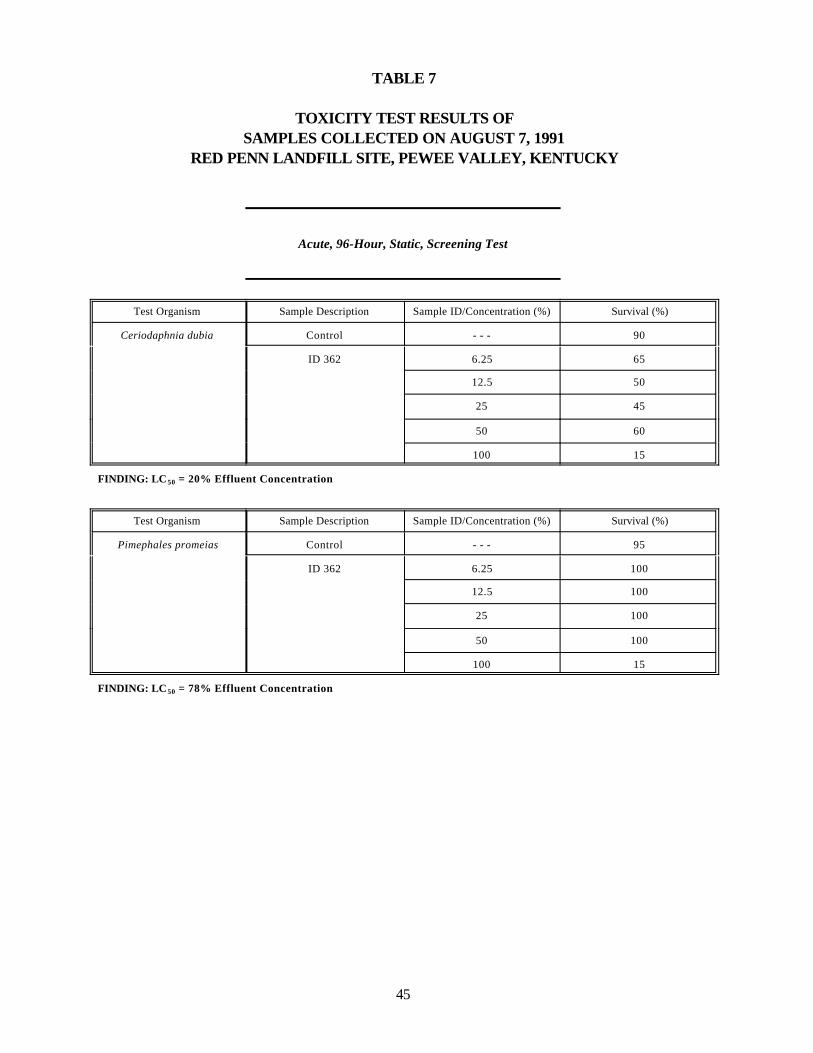
Toxicity analysis was conducted by obtaining leachate from two locations on the site. Two different aquatic
communities (ceriodaphnia dubia and pimephales pomelos) were immersed in the leachate samples at
various concentrations for ninety-six hours. Test results are presented in Table 7. The study showed that
the populations of both test organisms were reduced considerably even at low leachate concentrations.
A fish study of the area conducted by the Commonwealth of Kentucky was reviewed during the RI. The
study reported that Floyds Fork Creek supported a good amount of sport fishing. The report identified as
many as eighteen species of fish at various stages of life and classified the population as 50% fingerlings,
46% of intermediate size, and the remaining 4% as harvestable size population.

43
44
TABLE 6
RESULTS OF TISSUE ANALYSIS OFFRESHWATER MUSSELS FROM FLOYDS FORK
OLDHAM COUNTY, KENTUCY8-17-91
Parameter (mg/Kg)
Station Species Age(Yrs.)
Cd1 Cr2 Pb3 Hg4 Se5
1A
Lampsilis 9
<0.5* <1.0* </0.5* <0.05* <0.5*
Anodonta grandis 5
1B
L. siliquoidea 7
<0.5* <1.0* <0.5* <0.05* <0.5*
A. grandis 5
2A
L. siliquoidea 10
<0.5* <1.0* 0.7 <0.05* <0.5*
A. grandis 5
2B
L. siliquoidea 7
<0.5* <1.0* 1.4 <0.05* <0.5*
L. siliquoidea 5
3A
L. siliquoidea 7
<0.5* <1.0* 0.9 0.40 <0.5*
L. siliquoidea 7
3B
L. siliquoidea 7
<0.5* <1.0* 0.8 <0.05* <0.5*
A. grandis 5
4A
A. grandis 4
<0.5* <1.0* 1.1 <0.05* <0.5*
A. grandis 3
4B
L. siliquoidea 5
<0.5* <1.0* 35.0 <0.05* <0.05*
A. grandis 4
5A
L. siliquoidea 5
<0.5* <1.0* 11.6 <0.05* <0.5*
L. siliquoidea 5
5B
A. grandis 5
<0.5* <1.0* 9.4 <0.05* <0.5*
Potamilus alata 5
2. Cadmium - EPA method 200.7/9.33. Chromium - EPA method 200.7/9.34. Lead - EPA method 200.7/239.25. Mercury - EPA method 245.56. Selenium - EPA method 270.2/4.1.3
* Detection limit
NOTE: A and B represent replicates at the same college station
45
TABLE 7
TOXICITY TEST RESULTS OFSAMPLES COLLECTED ON AUGUST 7, 1991
RED PENN LANDFILL SITE, PEWEE VALLEY, KENTUCKY
Acute, 96-Hour, Static, Screening Test
Test Organism Sample Description Sample ID/Concentration (%) Survival (%)
Ceriodaphnia dubia Control - - - 90
ID 362 6.25 65
12.5 50
25 45
50 60
100 15
FINDING: LC50 = 20% Effluent Concentration
Test Organism Sample Description Sample ID/Concentration (%) Survival (%)
Pimephales promeias Control - - - 95
ID 362 6.25 100
12.5 100
25 100
50 100
100 15
FINDING: LC50 = 78% Effluent Concentration
46
TABLE 7 (continued)
TOXICITY TEST RESULTS OFSAMPLES COLLECTED ON AUGUST 7, 1991
RED PENN LANDFILL SITE, PEWEE VALLEY, KENTUCKY
Acute, 96-Hour, Static, Screening Test
Test Organism Sample Description Sample ID/Concentration (%) Survival (%)
Ceriodaphnia dubia Control - - - 90
Creek Site 6.25 100
12.5 0
25 0
50 0
100 0
FINDING: LC50 = 9 % Effluent Concentration
Test Organism Sample Description Sample ID/Concentration (%) Survival (%)
Pimephaies promeias Control - - - 95
Creek Site 6.25 90
12.5 0
25 0
50 0
100 0
FINDING: LC50 = 8% Effluent Concentration
47
Independent fish tissue studies conducted by KDWM and the Agency for Toxic Substances and Disease
Registry relative to the site were also reviewed. KDWM concluded that there were no clear indications
of adverse site impact on their environmental specimens. Similarly, ATSDR concluded that consumption
of fish from the creeks near the site should not result in adverse health conditions.
The most significant adverse ecological impact observed at this site is related to the leachate which
apparently limited plant growth, and killed test aquatic micro-organisms upon direct contact. However,
leachate outbreaks are localized and the flow can be restricted to the site. As stated before, a study of flora
and fauna during the RI concluded that there were no endangered species or habitats in the area.
Therefore, no major ecological risks appear to be associated with the landfill.
7.0 SCOPE AND ROLE OF RESPONSE ACTION
Over sixty different contaminants were identified during the laboratory analyses of field data from this site.
Only ten of them were considered as COPCs. Human health and environmental risks associated with the
COPCs were evaluated and found to be within acceptable levels based on EPA criteria. The current and
future populations in the area are not expected to be affected adversely as a result of exposure to site
contaminants. Therefore, no Superfund remedial action is warranted at the site. These conclusions were
arrived at in 1993, when the RI was completed. At that time, EPA proposed an additional year of
groundwater monitoring to validate RI results relative to seasonal variations. The confirmatory sampling
was accomplished by KDWM in 1997. The results were similar to those obtained during the RI. In
addition, EPA advised KDWM that proper closure of the landfill was necessary to minimize leachate
problems. To address landfill closure, KDWM began negotiations with the responsible parties in 1994.
The negotiations were concluded in 1999, when the responsible parties agreed to close the landfill properly
by installing an approved cap. EPA reviewed the closure plan and concluded that it would adequately
address site issues if implemented as designed. Essentially, the work would include landfill regrading,
geosynthetic clay liner installation, re-vegetation, and site monitoring. Currently, construction of the landfill
cap is in progress. To protect the cap, EPA recommends to the Commonwealth of Kentucky that future
use of the property which

48
contains the landfill be restricted. Activities which may compromise the integrity of the liner should be
prohibited by formal institutional controls.
EPA will continue to review site information from the Commonwealth or any other entity to ensure that
acceptable human health and environmental standards are maintained. EPA may initiate further Superfund
work at this site if additional information and/or new data reveal an unacceptable level of risk without
re-ranking.
8.0 RESPONSIVENESS SUMMARY
When the RI was completed in 1993, EPA published a Proposed Plan. The document summarized the
findings of site studies and risk assessment, indicated that no Superfund remedial action was warranted
at the site, and scheduled a public meeting for August 5, 1993. A group of local environmentalists, local
officials, and KDWM disagreed with EPA’s “no action” proposal. EPA canceled the public meeting and
engaged in a series of dialogue with the stakeholders. During the meetings, EPA explained the rationales
for the Proposed Plan and that the unlined landfill needed to be properly closed under Kentucky’s
authority. KDWM expressed concerns about EPA’s risk assessment methodology in general. Local
officials and the environmentalists wanted all landfill content removed and disposed of elsewhere. Color
and odor of leachate from the site were of concern in addition to landfill aesthetics. On August 5, 1993,
top level officials and staff from the Commonwealth of Kentucky and EPA Region 4 met at the site with
personnel from the local news media. At the meeting, EPA re-iterated the RI findings and the Superfund
process, recommended to the Commonwealth to work directly with the PRPs for resolution of site issues,
and reiterated the need to close the landfill properly. The Commonwealth requested EPA to postpone this
ROD pending the results of the confirmatory site sampling, and the negotiations with the PRPs to close the
landfill properly. KDWM began the negotiations with the PRPs in March 1994, and an Agreed Order to
conduct the landfill closure was signed in late 1999, by the parties.
49
In April 2000, EPA re-published its Proposed Plan for a no-action ROD and held a joint public meeting
with KDWM on April 20, 2000. During the meeting, EPA indicated that the landfill. closure would be
conducted by the PRPs under KDWM supervision. KDWM personnel then explained the details of the
planned landfill cap to the meeting attendees. No objections were raised to EPA’s Proposed Plan.
However, several questions were posed to KDWM and were addressed appropriately as reported in the
meeting transcript, Appendix A.
There were no written or verbal comments to EPA from the public during the comment period of April 13
to May 12, 2000. In June, 2000, five letters were received from four local residents and one congressman
(Honorable Ken Lucas). The letters essentially expressed concerns that capping would not adequately
address site issues. The letters and EPA responses are included in Appendix B. In addition, two local
newspaper editors contacted EPA by telephone for an explanation of capping as an appropriate solution
to the issues at the site.
APPENDIX A
PROPOSED PLAN PUBLIC MEETING TRANSCRIPT
RED PENN LANDFILL SITE
PROPOSED PLAN PUBLIC MEETING
HELD ON APRIL 20, 2000
BARBARA J. CRAWFORDCourt Reporter
8503 Wyndstar PlaceLouisville, Kentucky 40242-4520
(502) 339-8212
-2-
1
2
3
4
5
6
7
8
9
10
11
12
13
14
15
16
17
18
19
20
21
22
23
24
25
The Proposed Plan Public meeting for the Red Penn
Landfill Site, on Thursday, April 20, 2000 7:00 p.m., at
the Oldham County Community & Convention Center, 1551
North Highway 393, Buckner, Oldham County, Kentucky.
MS. BARRETT: We want to welcome you to the meeting
tonight. My name is Diane Barrett. I do community
relations for the EPA out of our Atlanta office. So, I'm
here tonight to make sure that everybody has got
information and can ask questions regarding community
involvement.
The purpose tonight of course is to discuss the
Red Penn Landfill and what actions are going to be taken
at this site.
To start, I want to give you just a little bit
of an overview of the Superfund process. I hope you all
picked this up. I don't know how familiar you are with
the Superfund process, but this is it in a nutshell, front
and back.
As you see, there's the site discovery phase.
And then, in 1989, the site, Red Penn Landfill, was
placed on the National Priorities list, the Superfund
National Priorities List, which made it eligible for EPA
funding, in the event there was a responsible party that
-3-
1
2
3
4
5
6
7
8
9
10
11
12
13
14
15
16
17
18
19
20
21
22
23
24
25
was not able to pay for cleanup or bankrupt or deceased,
or whatever. So, that fund is there for those kind of
sites.
Then, in 1991 through 1993, EPA began their
remedial investigation, and feasibility studies started
after that.
And we are at this point now where we're at,
our proposed plan public meeting. And tonight, Femi
Akindele, who is the project manager, Mr. Akindele here,
will provide you information about the site, a little bit
of history in what the EPA is proposing. Then, Mr. Rick
Hogan, for the State, will go over what the State's plans
are.
This meeting is by law having to be recorded by
a court reporter. So, when the court reporter is taking
your words or our words as we talk, please make sure that
you enunciate plainly.
And if at any time she doesn't understand you,
I've asked her to just stop and ask you to repeat it. So,
if you'll just give your name and your question so she can
hear that, we would appreciate it.
And then, this transcript will be made
available and placed in the information repository for
this site so that you all can review that.
The record of decision, after the comment

-4-
1
2
3
4
5
6
7
8
9
10
11
12
13
14
15
16
17
18
19
20
21
22
23
24
25
period, which is a 30-day comment period -- the comment
period runs from April the 13th to May the 12th. And if
you desire additional time, we can grant that for you.
But once the comment period is closed, then the
record of decision will be prepared. And this is our
document that states what the EPA's action is, what their
decision is.
Then, normally after that is done, there's a
remedial design prepared. In this case, the design has
already been prepared as a capping. And then, remedial
action takes place.
So, that, in kind of a nutshell, when you read
through this, that will give you what we're in the process
of doing.
At this time, I will turn it over to Mr. Femi
Akindele, and he will go on with the EPA. Thank you very
much for your attention.
MR. AKINDEL: Well, good evening, ladies and
gentlemen. I'm going to sit down, and, if it gets to a
point where you can't understand me or you don't hear me,
I'll get up and walk around or do whatever needs to be
done.
Has everybody got a chance to read the fact
sheet prepared by the EPA? There were two that came out
recently, one from the State of Kentucky or Commonwealth

-5-
1
2
3
4
5
6
7
8
9
10
11
12
13
14
15
16
17
18
19
20
21
22
23
24
25
of Kentucky, and another one from the U.S. EPA out of
Atlanta.
Is there anybody here that is not familiar with
the site? Then, I am not going to waste your time going
over the history and how we came to where we are.
There are only three points I'd like to make
tonight and I'm going to turn it over to Rick after those
three points are made. One is that EPA is responsible to
find sites and clean them, if they require cleaning.
Particularly the Superfund group is responsible
for finding and cleaning sites that are abandoned, like
the Red Penn Landfill. We try to do those things, finding
them and cleaning them, if cleaning is needed, by
following some guidelines, and those guidelines are
recorded in the fact sheet that Diane was talking about
early on, the Superfund process.
In addition to following the guidelines, we do
the best we can with science and engineering to study the
sites and clean them, as best as we can, whenever cleaning
is required. At times, cleaning will not be required,
especially by the Superfund group, if the criteria that
the law stipulates are not met.
With respect to the Red Penn Landfill, the U.S.
EPA got involved about twelve years ago and came out here
and evaluated the site, collected as much information as

-6-
1
2
3
4
5
6
7
8
9
10
11
12
13
14
15
16
17
18
19
20
21
22
23
24
25
we could, and evaluated the results of lab analysis.
We concluded after doing risk assessment that
the site did not meet the criteria established for
Superfund cleanup. But that does not mean that the site
does not require some action.
Consequently we pointed it out to the State
that the landfill needed to be capped. The landfill was
never properly closed after the operation ceased.
With the fact that some PRP's were found viable
and the fact that the State was also interested in making
sure that the site protects human health and the
environment, EPA stood along the side of the State while
negotiations were being made with the PRP's to do the
appropriate things with respect to capping the site.
I think it's been about three months or so,
maybe a little more than that now, that the State was able
to reach agreement with the PRP's, and plans are in place
to completely take care of the problems at the Red Penn
site.
Consequently, the EPA's plan, which was
actually made after we did the studies about five years
ago, to do nothing with Superfund money, is now going to
be published. And that's why we published the proposed
plan.
Because we did one back in 1993, I believe, and

-7-
1
2
3
4
5
6
7
8
9
10
11
12
13
14
15
16
17
18
19
20
21
22
23
24
25
it states exactly what I'm saying now, that we studied the
site, we found some problems, some chemicals that are not
acceptable or conducive to human health and the
environment.
However, when we evaluated the risks associated
with those chemicals, the criteria for cleanup with
Superfund money were not met. Again, we felt like the
site needed some action. Therefore, we asked the State to
directly contact the PRP's and get them to do what is
right.
At this point, like I said earlier on, the
State has successfully negotiated a cleanup action for the
site. Therefore, EPA is going to publish the record of
decision to state the activities that we performed at the
site and conclusions that we reached.
At this point, Rick will discuss what the plan
of action is, and I'll take questions after his
discussion.
MR. HOGAN: I'm Rick Hogan, with the State Division of
Waste Management. And we met with many, if not all, of
you in December to discuss the plan for this site.
And I realize that it's a little confusing that
EPA is saying that they're not going to take any action,
yet we are going to take action, but they have their
procedures that they have to follow.

-8-
1
2
3
4
5
6
7
8
9
10
11
12
13
14
15
16
17
18
19
20
21
22
23
24
25
There are criteria which have to be met before
they can take an action. Those criteria were not met;
they could not take an action.
The State negotiated directly, beginning in
about 1994, with the responsible parties. It has taken
way too long for us reach agreement, but we have. We
negotiated a design for the site. We approved the design
for the site.
Construction activities will begin very
shortly. We have a construction contractor, which has
been selected. They're Kester Contracting out of
Evansville, Indiana.
The oversight engineering contractor will be
RMT, Incorporated, out of Madison, Wisconsin. They also
have representatives here. And then also, of course, the
State of Kentucky will be overseeing the activities.
They're set to begin shortly; they're going to
be mobilizing in a couple of weeks, bringing in their
equipment. There won't be a lot of traffic that you'll
see; you may not see any traffic in the area, unless
you're there at the right time, minimum of truck activity.
They'll be working there all Summer. They'll
be grading the site, clearing a lot of trees over the next
month or two, shaping the site. There won't be a lot of
earth moved, just generally regrading a few areas to

-9-
1
2
3
4
5
6
7
8
9
10
11
12
13
14
15
16
17
18
19
20
21
22
23
24
25
prepare a proper bed for the geosynthetic material, which
is going to cap the site. And that material will prevent
rain water from coming in and infiltrating into the waste
and leaching out into the environment, as it has been
doing for the last 20 or 30 years.
This is something we should have done many
years ago. I apologize that we have not taken action
earlier; we haven't, but we're going to this Summer and
hopefully eliminate this contamination which is emanating
from the site.
That's really all about I have to say. I'll
welcome any questions that you have about the specifics.
MR. AKINDELE: I just want to make one more comment
before the questions come out. Because the site has been
on the NPL, or the National Priorities List, meaning that
it qualified for Superfund activities, means that EPA will
continue to review information passed on to EPA, and EPA
will come in any time that human health and the
environment or human health or the environment is in
jeopardy. So, let's keep that in mind.
The fact that EPA says the results of our
evaluation show that there will he no action at this point
does not mean that we abandoned the site forever. We'll
come back and do what has to be done to make the site safe
for human health and the environment, if additional
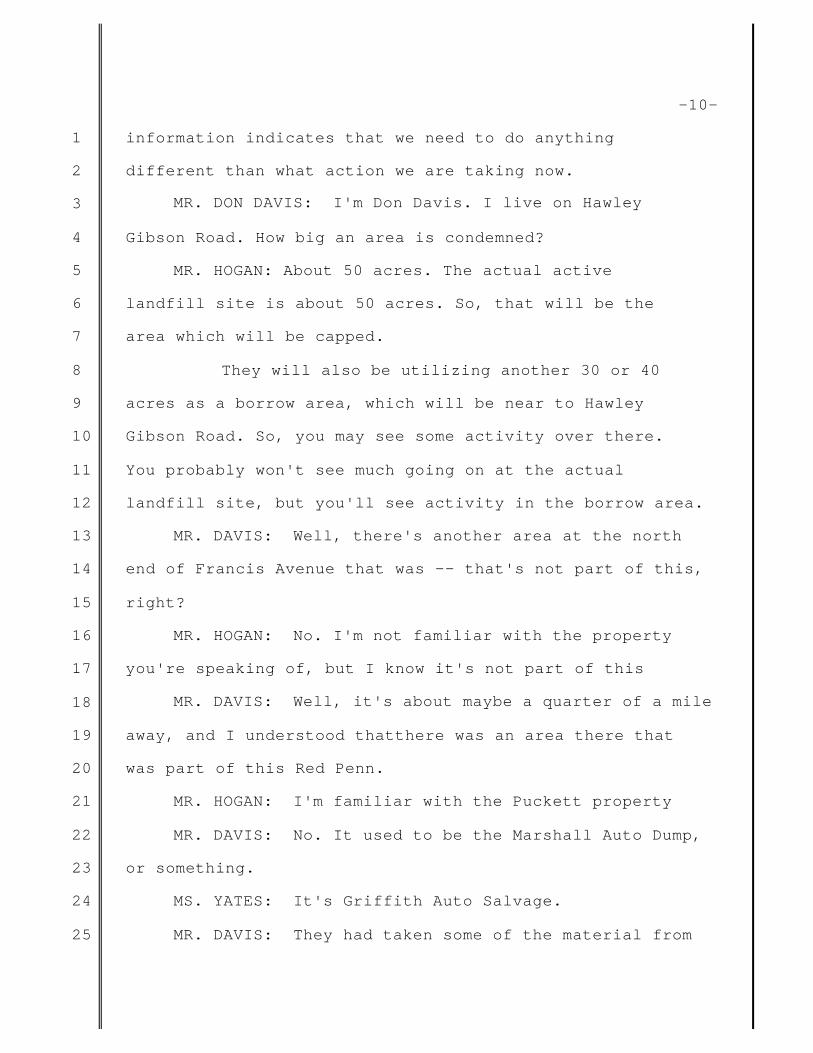
-10-
1
2
3
4
5
6
7
8
9
10
11
12
13
14
15
16
17
18
19
20
21
22
23
24
25
information indicates that we need to do anything
different than what action we are taking now.
MR. DON DAVIS: I'm Don Davis. I live on Hawley
Gibson Road. How big an area is condemned?
MR. HOGAN: About 50 acres. The actual active
landfill site is about 50 acres. So, that will be the
area which will be capped.
They will also be utilizing another 30 or 40
acres as a borrow area, which will be near to Hawley
Gibson Road. So, you may see some activity over there.
You probably won't see much going on at the actual
landfill site, but you'll see activity in the borrow area.
MR. DAVIS: Well, there's another area at the north
end of Francis Avenue that was -- that's not part of this,
right?
MR. HOGAN: No. I'm not familiar with the property
you're speaking of, but I know it's not part of this
MR. DAVIS: Well, it's about maybe a quarter of a mile
away, and I understood thatthere was an area there that
was part of this Red Penn.
MR. HOGAN: I'm familiar with the Puckett property
MR. DAVIS: No. It used to be the Marshall Auto Dump,
or something.
MS. YATES: It's Griffith Auto Salvage.
MR. DAVIS: They had taken some of the material from

-11-
1
2
3
4
5
6
7
8
9
10
11
12
13
14
15
16
17
18
19
20
21
22
23
24
25
Red Penn to that area.
MR. HOGAN: Yeah, I'm sorry, I'm not at all familiar
with that site.
MR. DAVIS: Will you look into that?
MR. HOGAN: Yes, sure. What's the name of it again?
MS. YATES: Griffith. It's at the very beginning of
Richard Griffith's property.
MR. HOGAN: Griffin property?
MS. YATES: Griffith, I think. I-t-h, I believe.
MR. HOGAN: And where? On Francis?
MS. YATES: It's at the end of Francis Avenue.
MR. HOGAN: Francis Avenue.
MS. PAYNE: Doesn't Francis run into Hawley Gibson?
MS. YATES: Yes, it does.
MR. HOGAN: If you'll give me your name and phone
number afterwards, I'll check on that and give you a call.
Yes, sir?
MR. BILL WETTER: I'm Bill Wetter. I'm the
Environmental Health Director for Jefferson County. Rick,
I'm interested in continuing ground water monitoring at
event sites after camping takes place. Any plans to
continue that, and for how long?
MR. HOGAN: Yes, our agreement with the responsible
parties requires that they conduct ground water monitoring
for a minimum of five years. At the end of five years, we

-12-
1
2
3
4
5
6
7
8
9
10
11
12
13
14
15
16
17
18
19
20
21
22
23
24
25
will evaluate the results to determine whether additional
monitoring beyond that time is necessary.
In addition, we are contracting with USGS to do
a general ground water user study in the area, and that
will be conducted possibly this Summer. And if we find
wells or springs which we feel like may be connected to
the site, we'll sample those areas also. These will be
off-site areas, down-gradient of the landfill. Yes?
MR. MARK JACKIE: My name is Mark Jackie. I live on
Ash Avenue. Is there a way for us to see what area within
that 150 acres is going to be capped?
I live directly across the street, on a far
hillside, and, you know, I look out and I see rocks. And
I was under the impression that was something else when I
moved in; I wasn't from around this area.
But my concerns are (1) in that area on Ash
Avenue when we have heavy rains, the road is completely
flooded. To give you an idea, my mailbox at one point was
two feet under water.
Now, that water runs across Ash Avenue, up my
property some 20, 30 yards, all the way across to the
bottom of that rock wall. I've walked that area, not very
much, but I've seen something coming out of the ground in
that area.
You know, my concerns are, when we have heavy
-13-
1
2
3
4
5
6
7
8
9
10
11
12
13
14
15
16
17
18
19
20
21
22
23
24
25
rains, there's a creek that runs parallel with Ash, I
think it's called Flat Rock Creek, I'm not sure --
MR. HOGAN: We've called it Ash Creek, I think.
MR. JACKIE: Well, it runs into Floyds Fork --
MR. HOGAN: Yes.
MR. JACKIE: -- three or 400 yards down the road. I
mean it's just a mess. It's flooded for 300 yards --
MR. HOGAN: I noticed the culverts to perhaps your
next-door neighbor were blocked with debris today. There
was evidence of some heavy flow.
MR. JACKIE: Oh, it's ridiculous, you know. A
hundred-year flood plain, and I believe it.
MR. HOGAN: Well, I do have, in answer to your first
question, some maps over here which will show you the
areas which will be actively remediated. There will be an
erosion control plan to prevent sediment runoff from the
entire area.
As far as controlling the runoff of water, I'm
afraid we're not going to be improving that, at least
during the construction.
After construction is completed, runoff should
be directed more toward Floyds Fork rather than across Ash
Avenue. It perhaps would help some. But I'm not sure
we're going to be able to help your flooding problem.
MR. JACKIE: Well, that's not what I'm asking. I mean
-14-
1
2
3
4
5
6
7
8
9
10
11
12
13
14
15
16
17
18
19
20
21
22
23
24
25
it's been doing that forever.
MR. HOGAN: Yeah.
MR. JACKIE: But it is a concern of mine that whatever
is coming out is coming over.
MR. HOGAN: And there are springs which exit -- that
you're probably referring to, that exit that rock cliff --
MR. JACKIE: Right.
MR. HOGAN: -- there are springs. And those are some
of the springs we'll be monitoring, because there has been
some contamination coming out that way. So, we may in
fact dry those springs up; we hope to.
MR. DAVIS: Has any ground been moved in that area?
MR. HOGAN: No. No, there's been no activity there.
MR. DAVIS: It looked like there had been some work
done years ago.
MR. HOGAN: Oh, yes. Oh, certainly, yes. When
there's an active landfill --
MR. DAVIS: I mean since it closed.
MR. HOGAN: There was one small drum removal about
'86, but not since that time.
MR. JACKIE: Nothing grows on that area that I'm
speaking of.
MR. HOGAN: Right, nearest to Ash Avenue.
MR. JACKIE: Right. And that does concern me.
There's nothing --
-15-
1
2
3
4
5
6
7
8
9
10
11
12
13
14
15
16
17
18
19
20
21
22
23
24
25
MR. HOGAN: Yeah, it's bedrock. And there's no plan
to do anything with that area.
MR. JACKIE: Once the landfill is capped, how much, if
any, maintenance will be required and who will be
responsible for that maintenance.
MR. HOGAN: Well, that site will need to be
maintained.
MR. JACKIE: In what way?
MR. HOGAN: Into the near future. We cannot allow
trees to grow on that site. Trees will penetrate that cap
and create conduits for the flow of water. So, we have to
keep that site mowed.
And by we, I mean the responsible parties, Ford
Motor Company waste management will have a contractor out
there to mow the site and to repair any erosion, to repair
anything that goes wrong for the foreseeable future.
MR. JACKIE: Will the residential waste and litter and
trash be taken care of at the same time? The area I'm
talking about is a slope that runs down basically towards
Floyds Fork. It's a treed area. I understand at one
point it was used for residential waste.
There are areas there that you can't stay on
your feet, there's so much garbage in there. Will that be
--
MR. HOGAN: I believe so, yes. I'll show you on the

-16-
1
2
3
4
5
6
7
8
9
10
11
12
13
14
15
16
17
18
19
20
21
22
23
24
25
map, and I think I know where you're talking about. Those
areas will all be cleaned up.
A lot of trees will be removed. Some of those
areas are so old, there are trees this big. And
unfortunately we're going to have to remove a whole lot of
trees, which I hate to do, but that's the only way to get
a cap on those areas. Tim?
MR. TIM FEELEY: I'm Tim Feeley, from Crestwood. Two
questions. First, since our last meeting, which I think
was in December, has there been any further inquiry into
where the barrels are? I remember we talked last time,
and we know there are some out there but didn't know
exactly where they were.
MR. HOGAN: No, no further work.
MR. FEELEY: I apologize, I came a little late, but
did you give a timetable for when work will begin?
MR. HOGAN: Work will begin in the very near future.
In the next couple of weeks, the contractor will be
mobilizing, bringing their equipment onto the site.
Shortly thereafter, they will begin the earth work, which
will be the majority of the work.
The intent is to have the project finished by
the end of the construction season, November, December.
But, as I said before, I suspect they'll be back out there
next Spring to tidy things up, correct some erosion
-17-
1
2
3
4
5
6
7
8
9
10
11
12
13
14
15
16
17
18
19
20
21
22
23
24
25
problems. So, I think you will see some people out there
next Spring.
MR. JOHN KIELKOFF: Do you have a plan for what you're
going to plant, what kind of grass, and so forth?
MR. HOGAN: The specification is what is called the
DOT mixture. It's what the Department of Transportation
approves for planting on the properties that they have.
And so, as the construction contractor or
someone pointed out earlier today, if you'll drive down
the road and look at the vegetation on the side of the
road, that's basically what will be on the site.
Now, if you have suggestions, I'm certainly
open to suggestions for plantings which could enhance the
appearance or value of that property, I would certainly
take that into consideration, and I would hope that the
contractors, the responsible parties, would, too. Yes,
sir?
MR. TERRY GAGEL: On the tree removal on the stream
side, how far down would you be removing trees? Would you
get down to the flood plain?
MR. HOGAN: No, I don't think so. We're going to get
very close. They've submitted an application to construct
within the flood plain, but they will just barely get into
what is defined as the flood plain. The toe of the
landfill will essentially be that break where the flood

-18-
1
2
3
4
5
6
7
8
9
10
11
12
13
14
15
16
17
18
19
20
21
22
23
24
25
plain sort of begins.
MR. GAGEL: And that will be the extent of the cap?
It will come to that point?
MR. HOGAN: Yes. Yes. And you'll see rock riprap all
around the base of that landfill. And that riprap itself
will, I believe, sit slightly in the flood plain. It
won't be right next to the stream, but it will be in that
flat area which is defined as the flood plain.
MR. JOHN BLACK: I'm the County Judge/Executive here
in Oldham County. What kind of bricks does the landfill
-- what is opposing -- just as it sits there today and
just in capping, the extent that you're going to do the
cleanup, is that just because of the appropriation of
what's allowable to go into that site, or if more could
have been spent or appropriated, would it have been done
in a different manner, you know, and to what degree
further?
MR. HOGAN: Well, I believe, given the situation,
we're doing what -- the best that technology has to offer,
within reason. You could go in, remove all of the
materials, at a tremendous expense, and I'm not sure, in
the long run, you will have created a better environment
overall.
You can imagine quite an effort would have to
be made. You'd have tens and hundreds and thousands of

-19-
1
2
3
4
5
6
7
8
9
10
11
12
13
14
15
16
17
18
19
20
21
22
23
24
25
trucks hauling materials away along your roads. You would
be digging into the materials, exposing waste materials,
which would be difficult to contain.
It's just not something that's done. To my
knowledge, it's never been done in the United States,
where you dig up a landfill of this magnitude.
Given the situation, the best that you can do
is simply put an impermeable cover on it. It's not a
perfect solution. The site is going to be there a hundred
years from now with contamination.
I don't really like the thought of passing
something like this down to our children and
grandchildren. But given the realities, that's about the
best that we can do at this time.
Perhaps in the future, technologies will be
discovered where we can inject microbes or chemicals or
something into the landfill which will act to remediate it
on its own. But presently, that technology is in its
infancy.
MR. GAGEL: There are monitoring wells on the landfill
now, is that correct?
MR. HOGAN: There's one monitoring well on the
perimeter. There are three lysimeters, which simply
monitor water level within the landfill itself, but only
one monitoring well.

-20-
1
2
3
4
5
6
7
8
9
10
11
12
13
14
15
16
17
18
19
20
21
22
23
24
25
MR. GAGEL: The monitoring well, will you test that on
an annual basis?
MR. HOGAN: That will be tested on a quarterly basis
for two or three years and then a semi-annual basis for
the next two or three years, at which time we will
evaluate the data to determine future monitoring
requirements.
MR. GAGEL: What has been the results of the data up
to now?
MR. HOGAN: We found relatively low levels of various
chemical compounds and heavy metals to date. Really the
springs are a better indicator of what's coming off the
site.
We monitor four -- or we will be monitoring
four or five different springs, and they are really the
best indicator of what's coming off the site.
But two of the main contaminants that I recall
are PCB's and heavy metal lead were the ones that kind of
stuck out in my mind.
MR. WAMPLER: Are there any plans for retention basins
or retaining walls to help keep what water flow there
might be out of Floyds Fork?
MR. HOGAN: Well, no, no retention basins. An erosion
control plan has been submitted, and I understand perhaps
it's been -- it is going to be approved for silt fences.

-21-
1
2
3
4
5
6
7
8
9
10
11
12
13
14
15
16
17
18
19
20
21
22
23
24
25
Silt fences will be the primary method of
containing erosion. And it will be around, oh, about 75
percent of the site or more, a continuous fence to catch
sediment particles.
But no sediment basins are proposed. That
could change. If they're needed, I think they'll be
constructed.
REPORTER: May I have your name, sir?
MR. WAMPLER: Roger Wampler. I'm solid waste
coordinator for Oldham County.
MR. HOGAN: We have individuals here, as I mentioned,
from the engineering oversight management team, RMT and
from Kester Contracting. So, afterward, if you'd like to
speak individually to them, I think they'd be glad to talk
to you about specifics.
MR. BLACK: How much is this project going to cost to
clean up?
MR. HOGAN: Somewhere on the order of Three or Four
Million Dollars, I think. Any other questions?
MR. SHAWN TAPP: My name is Shawn Tapp. Is the State
of Kentucky going to take over the control of the property
or are they going to be kept owned by the Red Penn people,
or whoever owns it?
MR. HOGAN: No, the State doesn't want the property,
federal government doesn't want the property. It will

-22-
1
2
3
4
5
6
7
8
9
10
11
12
13
14
15
16
17
18
19
20
21
22
23
24
25
remain in the hands of the current owners, which I believe
is Red Penn Sanitation Corporation.
MR. TAPP: Is the State planning on putting any kind
of restrictions --
MR. HOGAN: There will be deed restrictions on the use
of the property so that the cap is not in any way
punctured or it remains intact. Yes, there will be deed
restrictions.
MR. JACKIE: I think there's a Texas gas line that
runs somewhere through that property, I think two pretty
large transmission lines. Is that in any way affected?
Was the contaminated area near those gas lines? And if
so, what happens if they've got to go work on these
transmission lines?
MR. HOGAN: Well, that issue was studied several years
back, and it was concluded that those transmission lines
in no way provide a conduit for the flow of contamination,
nor would activities along that line affect the landfill
itself.
MR. JACKIE: How far is that contaminated area from
those gas lines, approximately?
MR. HOGAN: The map will give you the specifics, but
it's 50 yards, a hundred yards, I think. There's also, as
many of you may know, a road which is being planned to go
through that area.

-23-
1
2
3
4
5
6
7
8
9
10
11
12
13
14
15
16
17
18
19
20
21
22
23
24
25
And I just happened to pick up a map showing
that there are basically three alternatives for that road
through the area. And many of you may already know all of
this, but I got the map recently, and it's not an official
map, but it will show the alignment of those three
options.
None of those options will go through the
landfill. One or two of the options will impinge upon the
northern end of the property, along Hawley Gibson Road.
Yes, ma'am?
MS. BARBARA YATES: I'm Barbara Yates. I'm the one
that sent you the Commonwealth technology statement.
MR. HOGAN: Oh, okay.
MS. YATES: My question is in regards to the silt
fencing and the road. Does the road alignment in any way
look like it's going to impinge upon the silt fencing or
borrow area --
MR. HOGAN: Well, the silt fence will be a temporary
measure.
MS. YATES: It's temporary only?
MR. HOGAN: So, I think, by the time the road is
constructed, it will be gone.
MS. YATES: Okay.
MR. ERNIE HARRIS: Is there going to need to be a gas
collection system on this?

-24-
1
2
3
4
5
6
7
8
9
10
11
12
13
14
15
16
17
18
19
20
21
22
23
24
25
MR. HOGAN: No. We discussed that and evaluated it
and decided we would not need that for a landfill of this
age.
MS. BARRETT: Are there any other questions before we
adjourn?
MR. BLACK: How many types of personnel or numbers
will be working in there through the Summer?
MR. HOGAN: Somebody from Kester can answer that
better than I.
MR. NIEHAUS: My name is Rick Niehaus. I'll be the
project manager there. We anticipate an initial work
force around 15 workers, doing the initial clearing and
earth moving.
Once the liner installer comes on board, he
will have a work force probably of another 12 to 15
workers. So, at a maximum, it will be a peak of 30. And
then, once the liner is done, the final finishing, we'll
be back down to 12 to 15 toward Fall.
MR. BLACK: Will you have to bring any dirt to the
site or pretty much use what's there.
MR. NIEHAUS: The current plan is to use what's there
from the borrow site adjacent to the landfill, depending
on the geological conditions and the depth of the rock,
the extent of that borrow area. Steps are being
finalized.

-25-
1
2
3
4
5
6
7
8
9
10
11
12
13
14
15
16
17
18
19
20
21
22
23
24
25
MR. HOGAN: You'll see very little traffic. You may
not even know these guys are there.
MR. JACKIE: I will.
MR. HOGAN: You will. I noticed a very fine home
being constructed across Floyds Fork from the site. Mr.
Jackie, are you familiar with that construction? Does
that fellow know what's going to be going on?
MR. JACKIE: I don't know. He hasn't come and asked
me.
MR. HOGAN: Roger?
MR. WAMPLER: With the test wells you're going to
have, the analyses that you're going to be doing on the
water in those wells and in those springs, are those going
to be available for us to see?
MR. HOGAN: Yes, and that's a good point. And someone
suggested at the last public meeting that we set up a
website so that we can provide that information. And we
do intend to post that information on our website as it
becomes available.
That testing will not begin until after the
construction is finished. So, that will be next year
about this time that we'll begin sampling.
But I will develop information on our website.
I think I gave that address; I hope that was the correct
address. And the information -- there's no information

-26-
1
2
3
4
5
6
7
8
9
10
11
12
13
14
15
16
17
18
19
20
21
22
23
24
25
there now regarding Red Penn, but there will be.
MR. WAMPLER: While the process is going on, could
Richard Benton and myself -- would we be allowed to
observe from time to time?
MR. HOGAN: Absolutely, yes.
MR. WAMPLER: Okay, very good.
MR. HOGAN: Yeah, you could call me or I can give you
a contact at the site if you want to call them.
MR. WAMPLER: Thank you, Rick.
MR. JACKIE: I'd like to have that.
MR. HOGAN: Sure. Sure. I'll give you my card. I
have a card over there on the table. We intend to be over
there, myself and Eric Liebenhauer, my associate. We
intend to be over there every week or two or more, as
conditions warrant.
In addition, RMT will have a person on site all
of the time. So, we'll have plenty of oversight, I think.
MR. BLACK: Is the reason you actually cap a site like
this so the rainwater won't go down through the surface
and push the things outward, so they're pretty much
contained and let them sit there as they are? Is that the
purpose of that?
MR. HOGAN: Yes, that's it in a nutshell.
MR. JACKIE: This may be way out there, but it will be
the last thing I ask you. Have there been any studies
-27-
1
2
3
4
5
6
7
8
9
10
11
12
13
14
15
16
17
18
19
20
21
22
23
24
25
done on any wildlife as far as toxin buildup in deer,
small game, for that matter, cattle that water in that
area? Have there been any tests done on that?
MR. HOGAN: We have not done any. I don't think,
Femi, that EPA did any during its investigation either.
MR. AKINDELE: If I remember well, there was fish
studyied.
MR. HOGAN: Okay, yeah.
MR. JACKIE: And they showed no sign of --
MR. HOGAN: They did show some signs. In fact, again,
I'm glad you brought that up, someone at the last meeting
asked if we were going to continue to evaluate the stream,
the microorganisms and the fish in the stream. And, yes,
we will do that.
I talked to our experts in the Division of
Water. They suggested that a study of that type would
best be done perhaps a couple of years after the site is
remediated because you wouldn't see the effects
immediately in the organisms in the stream. But after a
couple of years, we should begin to see the effect of
eliminating the source of contamination.
MR. AKINDELE: There is a short paragraph here in
paper that shows the effects.
MR. BLACK: I want to thank you all for giving us the
opportunity. It's only because we contacted you all to
-28-
1
2
3
4
5
6
7
8
9
10
11
12
13
14
15
16
17
18
19
20
21
22
23
24
25
have another session to see if there were any final
questions, or anything, so I appreciate the State
and the federal folks for coming in tonight to see if
there were any further questions to be answered or asked.
MR. HOGAN: If you like, we can conduct another
meeting, perhaps in the Fall, when construction is about
over. We don't have one planned right now, but if there
is interest, give me a call and we'll have another meeting
at that time.
MR. DAVIS: Can we have one just for quality control,
update on what you did do, maybe after it's finished?
MR. HOGAN: Sure.
MS. BARRETT: Any other questions? Thank you very
much for coming. Your questions were great, and we
appreciate it. We look forward to seeing you again.
Thank you.
-29-
STATE OF KENTUCKY)
( SS:
COUNTY OF OLDHAM )
I, BARBARA J. CRAWFORD, a Notary Public within and for
the State of Kentucky at Large, do hereby certify the
foregoing transcript of the Proposed Plan Public Meeting on
the Red Penn Landfill Site was transcribed by me in the
presence of all who attended the meeting; that the
foregoing is a full, true and correct transcript of the
said Meeting.
WITNESS MY SIGNATURE THIS 1st day of May, 2000.
My commission expires the 5th day of April, 2002.

APPENDIX B
CORRESPONDENCE ON LANDFILL CAPPING
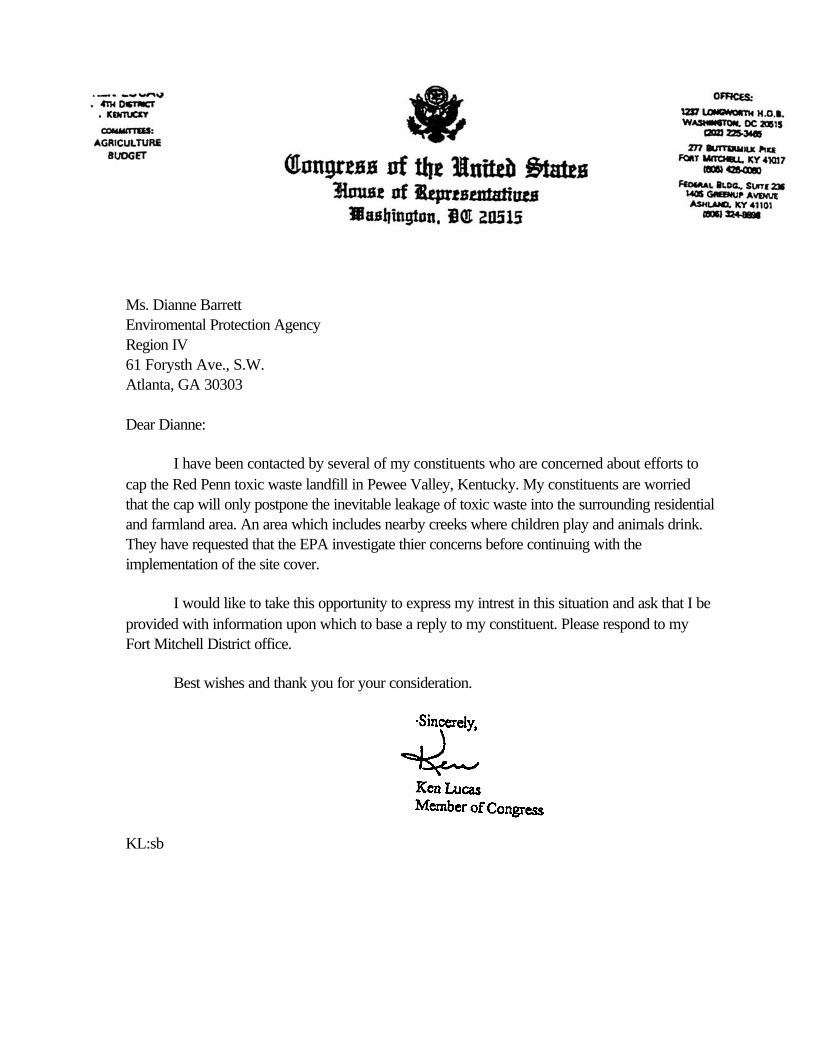
Ms. Dianne BarrettEnviromental Protection AgencyRegion IV61 Forysth Ave., S.W.Atlanta, GA 30303
Dear Dianne:
I have been contacted by several of my constituents who are concerned about efforts tocap the Red Penn toxic waste landfill in Pewee Valley, Kentucky. My constituents are worriedthat the cap will only postpone the inevitable leakage of toxic waste into the surrounding residentialand farmland area. An area which includes nearby creeks where children play and animals drink.They have requested that the EPA investigate thier concerns before continuing with theimplementation of the site cover.
I would like to take this opportunity to express my intrest in this situation and ask that I beprovided with information upon which to base a reply to my constituent. Please respond to myFort Mitchell District office.
Best wishes and thank you for your consideration.
KL:sb
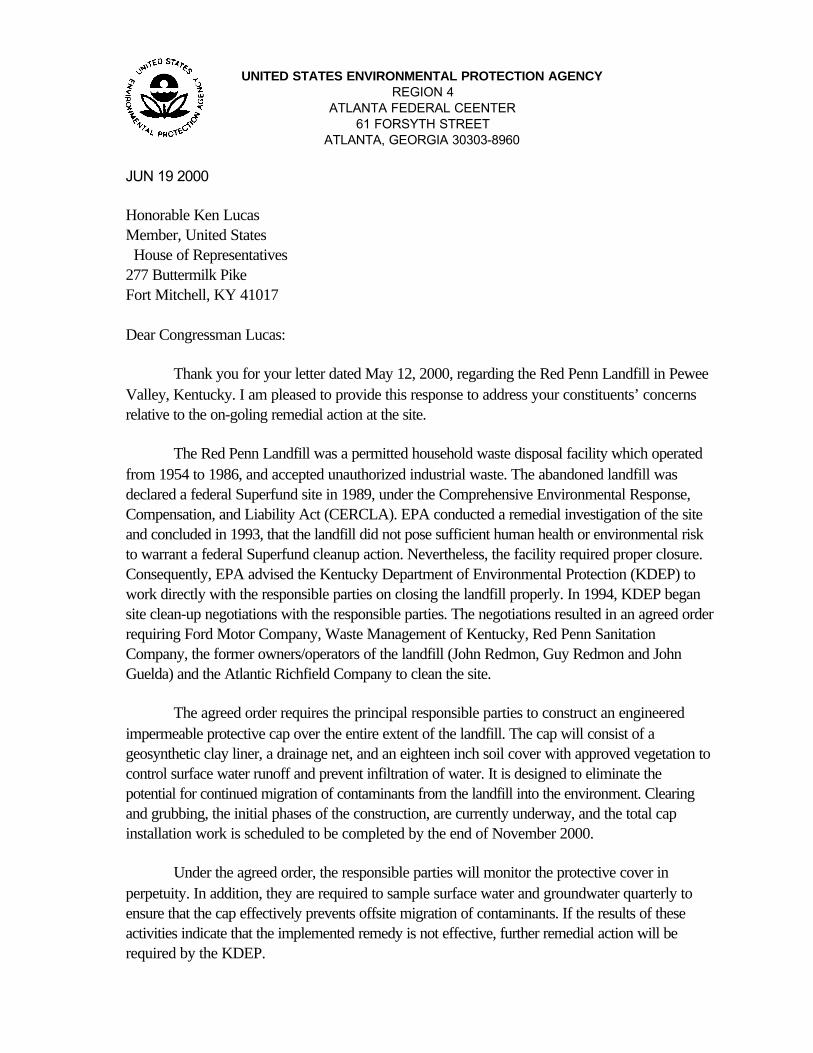
UNITED STATES ENVIRONMENTAL PROTECTION AGENCYREGION 4
ATLANTA FEDERAL CEENTER61 FORSYTH STREET
ATLANTA, GEORGIA 30303-8960
JUN 19 2000
Honorable Ken LucasMember, United States House of Representatives277 Buttermilk PikeFort Mitchell, KY 41017
Dear Congressman Lucas:
Thank you for your letter dated May 12, 2000, regarding the Red Penn Landfill in PeweeValley, Kentucky. I am pleased to provide this response to address your constituents’ concernsrelative to the on-goling remedial action at the site.
The Red Penn Landfill was a permitted household waste disposal facility which operatedfrom 1954 to 1986, and accepted unauthorized industrial waste. The abandoned landfill wasdeclared a federal Superfund site in 1989, under the Comprehensive Environmental Response,Compensation, and Liability Act (CERCLA). EPA conducted a remedial investigation of the siteand concluded in 1993, that the landfill did not pose sufficient human health or environmental riskto warrant a federal Superfund cleanup action. Nevertheless, the facility required proper closure.Consequently, EPA advised the Kentucky Department of Environmental Protection (KDEP) towork directly with the responsible parties on closing the landfill properly. In 1994, KDEP begansite clean-up negotiations with the responsible parties. The negotiations resulted in an agreed orderrequiring Ford Motor Company, Waste Management of Kentucky, Red Penn SanitationCompany, the former owners/operators of the landfill (John Redmon, Guy Redmon and JohnGuelda) and the Atlantic Richfield Company to clean the site.
The agreed order requires the principal responsible parties to construct an engineeredimpermeable protective cap over the entire extent of the landfill. The cap will consist of ageosynthetic clay liner, a drainage net, and an eighteen inch soil cover with approved vegetation tocontrol surface water runoff and prevent infiltration of water. It is designed to eliminate thepotential for continued migration of contaminants from the landfill into the environment. Clearingand grubbing, the initial phases of the construction, are currently underway, and the total capinstallation work is scheduled to be completed by the end of November 2000.
Under the agreed order, the responsible parties will monitor the protective cover inperpetuity. In addition, they are required to sample surface water and groundwater quarterly toensure that the cap effectively prevents offsite migration of contaminants. If the results of theseactivities indicate that the implemented remedy is not effective, further remedial action will berequired by the KDEP.

2
EPA evaluated the proposed remedy and concluded that the project as designed includessufficient measures to result in an.effective resolution of the environmental issues at the site. Iassure you that EPA is interested in mitigating unacceptable human health and environmental risksat the Red Penn Landfill. We will continue to review information on the site to ensure that theremedy under construction is effective. As provided for by the CERCLA, EPA will take anappropriate action or require furthertleanup activities at the site if future conditions so indicate.
If I may be of further assistance, please feel free to contact me or the Office of ExternalAffairs at (404) 562-8327.
cc: Jeff Pratt w/ incoming letterKDEP

Jun 13 00 04:38p P.2
June 12, 2000
Environmental Protection AgencyRegion IVAtlanta, Georgia
Re: Redd-Penn Landfill
The Redd-Penn Landfill located in Oldham County near Pewee Valley is a topic that is mostfrightening to those of us who live anywhere nearby.
The cancer victims in the area are becoming so numerous and we feel we have a right to beconcerned.
Please, do whatever you can to help REMOVE these toxic wastes, instead of CAPPING; notonly for us, but for future generations.
Jun 13 00 04:38p P.2
April 23,2000Pewee Valley, KY
The Environental Protection AgencyRegion IVAtlanta, GA
Dear Editor:
The plan to cap the Red Peon toxic waste, landfill is woefully inadequate. To even suggest that it will solve theproblem is ludicrous. The cap will only postpone the inevitable leakage of toxic waste into the surroundingarea. There is no question that it will eventually happen. The very idea that we would knowingly leave thispoison catastrophe for our children and possibly their children is unconscionable. I really don't know whomade this deal for the community, but whoever it was should go back to the drawing board and vehementlyinsist that the toxic waste be removed from the area and disposed of properly.
Jun 13 00 04:38p P.3
June 12,2000
Environmental Protection AgencyRegion IVAtlanta, Georgia
Re: Redd-Penn Landfill
As you know there are plans to “CAP” the Redd-Penn Landfill in Oldham County. In view of theextremely hazardous waste involved, I feel this would be a very big and costly mistake.
I would a ppreciate your investigating this plan THOROUGHLY before giving your approval sincethe health of so many people, especially little children, is involved.
A thorough CLEAN-UP would be very expensive, but in the longrun would save money as wellas lives.

UNITED STATES ENVIRONMENTAL PROTECTION AGENCYREGION 4
ATLANTA FEDERAL CENTER61 FORSYTH STREET
ATLANTA, GEORGIA 30303-8960
June 20, 2000
Subject: Red Penn Landfill SitePewee Valley, Kentucky
From: Femi Akindele
To: Ms. Louise H. MarkerP. 0. Box 54Pewee Valley, KY 40056
As the EPA Remedial Project Manager for Red Penn Landfill Site, a copy of the memo yourecently wrote regarding the landfill cap under construction at the site was forwarded to me. Theattached letter from our Regional Administrator to Congressman Ken Lucas may be of interest toyou as it addresses concerns similar to yours.
As the letter states, EPA believes that capping the site will address site issues adequately, basedon current information. If new information indicates otherwise, EPA will take appropriate actions.
Thank you very much.
UNITED STATES ENVIRONMENTAL PROTECTION AGENCYREGION 4
ATLANTA FEDERAL CENTER61 FORSYTH STREET
ATLANTA, GEORGIA 30303-8960
June 20, 2000
Subject: Red Penn Landfill SitePewee Valley, Kentucky
From: Fermi Akindele
To: Ms Virginia H. ChaudoinP. O. Box 444Pewee Valley, KY 40056
As the EPA Remedial Project Manager for Red Penn Landfill Site, a copy of the memo yourecently wrote regarding the landfill cap under construction at the site was forwarded to me. Theattached letter from our Regional Administrator to Congressman Ken Lucas may be of interest toyou as it addresses concerns similar to yours.
As the letter states, EPA believes that capping the site will address site issues adequately, basedon current information. If new information indicates otherwise, EPA will take appropriate actions.
Thank you very much.
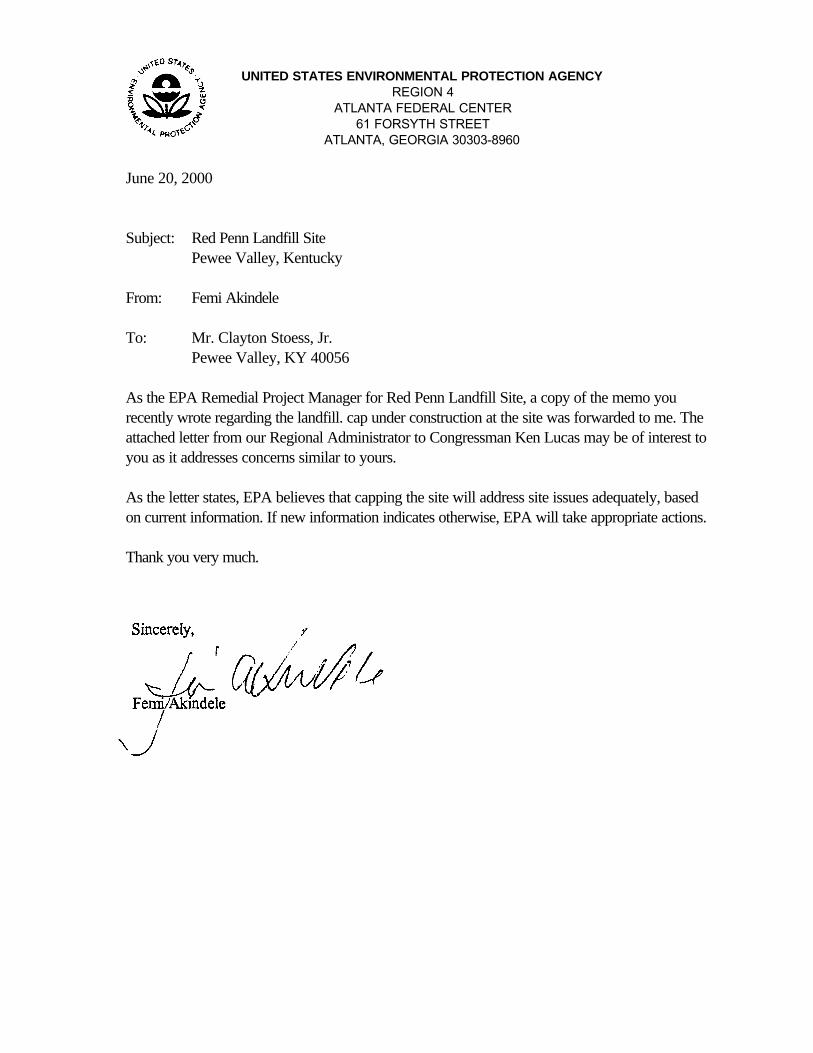
UNITED STATES ENVIRONMENTAL PROTECTION AGENCYREGION 4
ATLANTA FEDERAL CENTER61 FORSYTH STREET
ATLANTA, GEORGIA 30303-8960
June 20, 2000
Subject: Red Penn Landfill SitePewee Valley, Kentucky
From: Femi Akindele
To: Mr. Clayton Stoess, Jr.Pewee Valley, KY 40056
As the EPA Remedial Project Manager for Red Penn Landfill Site, a copy of the memo yourecently wrote regarding the landfill. cap under construction at the site was forwarded to me. Theattached letter from our Regional Administrator to Congressman Ken Lucas may be of interest toyou as it addresses concerns similar to yours.
As the letter states, EPA believes that capping the site will address site issues adequately, basedon current information. If new information indicates otherwise, EPA will take appropriate actions.
Thank you very much.


