Page 1
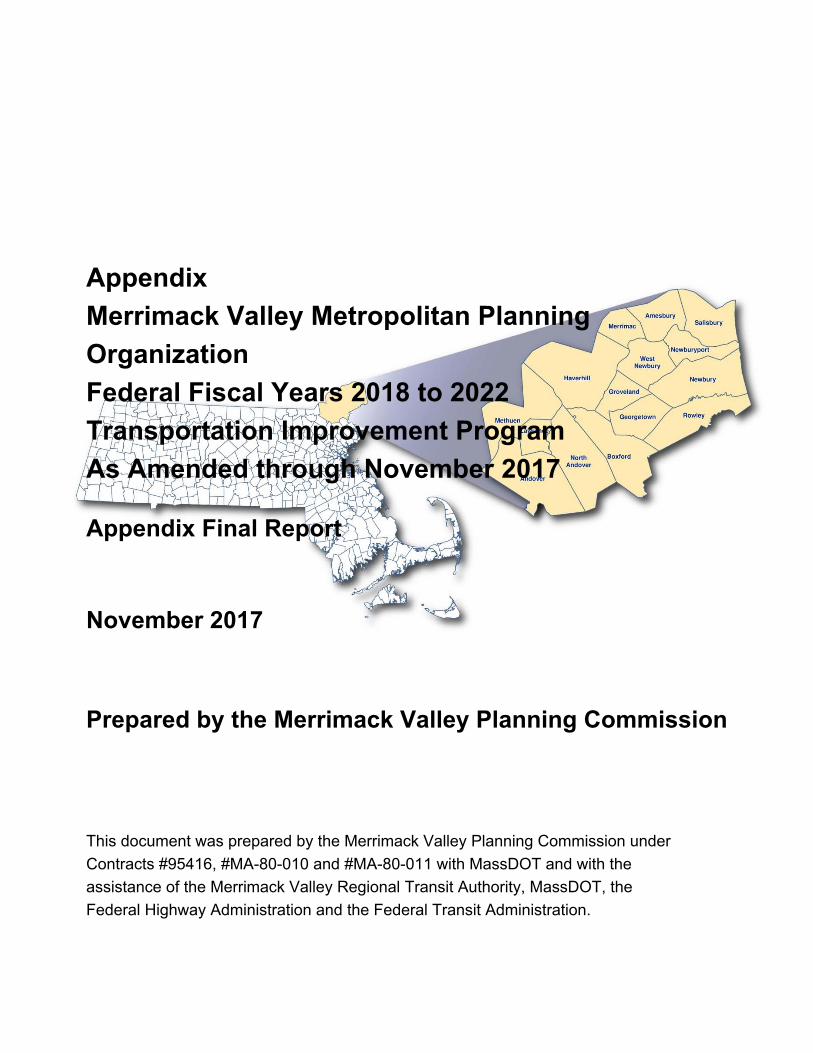
Appendix
Merrimack Valley Metropolitan Planning
Organization
Federal Fiscal Years 2018 to 2022
Transportation Improvement Program
As Amended through November 2017
Appendix Final Report
November 2017
Prepared by the Merrimack Valley Planning Commission
This document was prepared by the Merrimack Valley Planning Commission under
Contracts #95416, #MA-80-010 and #MA-80-011 with MassDOT and with the
assistance of the Merrimack Valley Regional Transit Authority, MassDOT, the
Federal Highway Administration and the Federal Transit Administration.
Page 2
Page intentionally left blank.
Page 3
Final FFYs 2018-2022 MVMPO TIP Appendix as Amended through November 2017
Table of Contents
Appendices ....................................................................................................................... 1
Appendix A Other Regional Priority Bridge Projects ...................................................... 2
Appendix B Other Regional Priority Roadway Projects .................................................. 4
Appendix C Transportation Evaluation Criteria Summary .............................................. 7
Appendix D Sample Project Evaluation Worksheet ....................................................... 15
Appendix E Greenhouse Gas (GHG) Monitoring and Evaluation ................................... 21
FFYs 2018 to 2022 Projects GHG Tracking Summary ......................... 27
Appendix F Completed Highway and Transit Projects GHG Summary .......................... 79
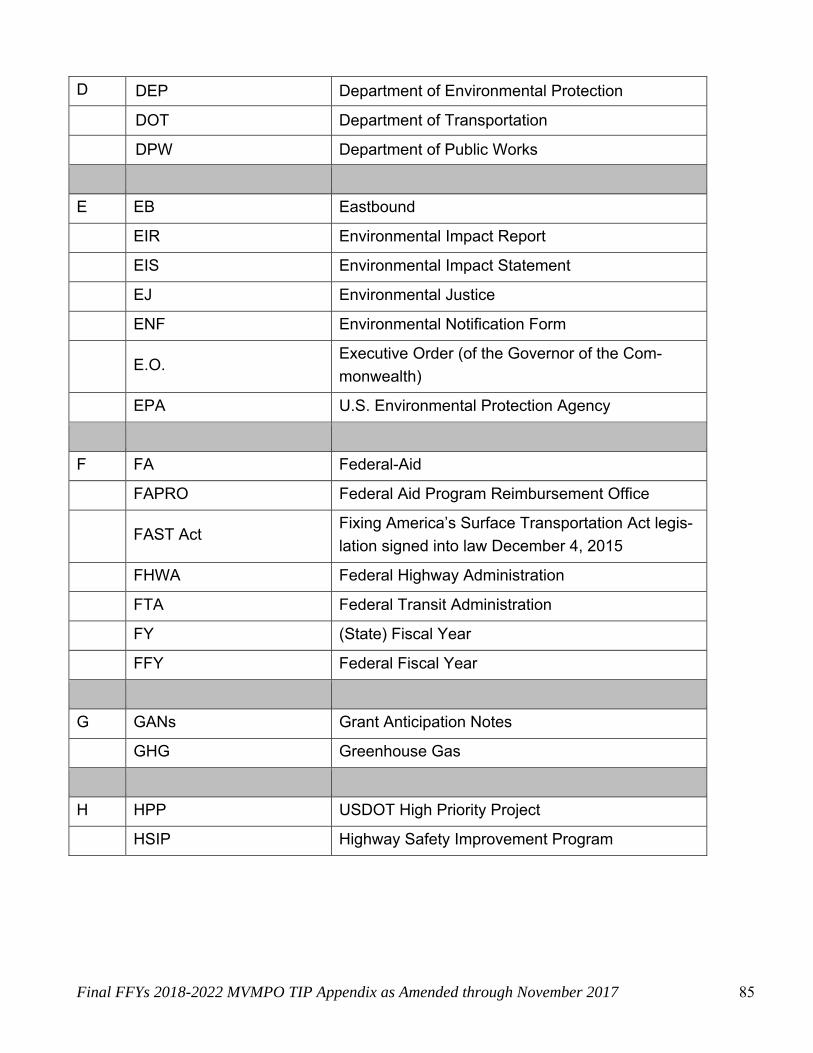
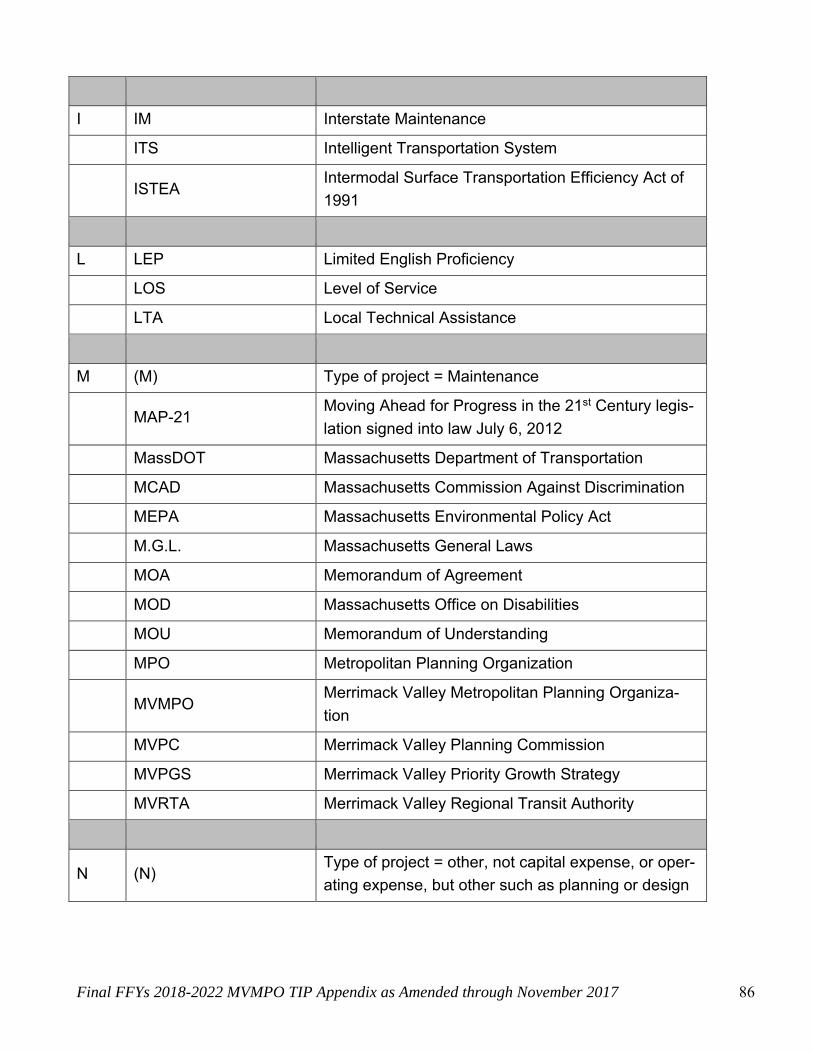
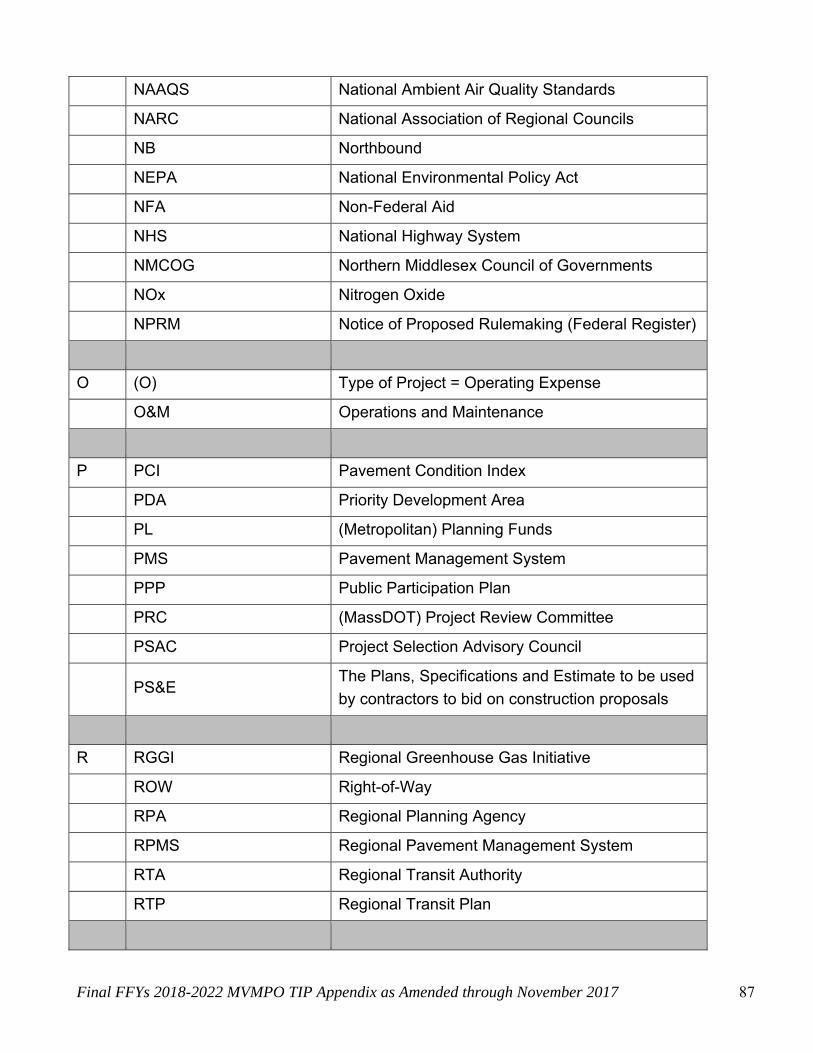
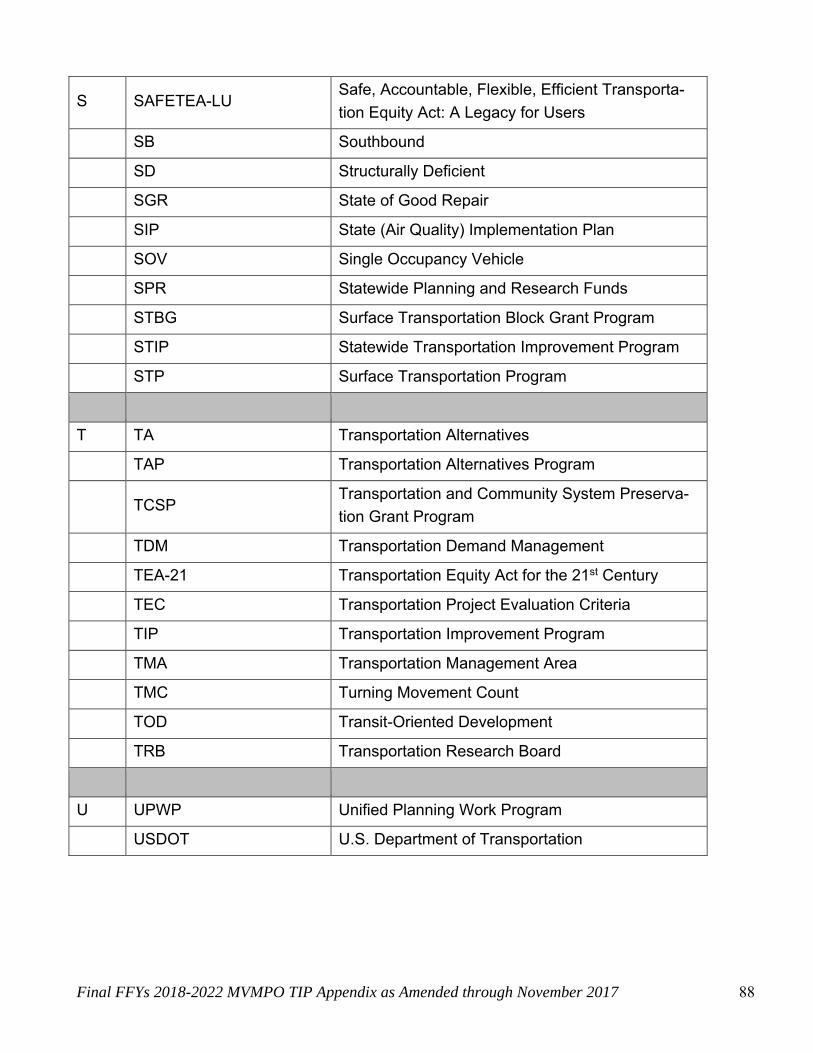
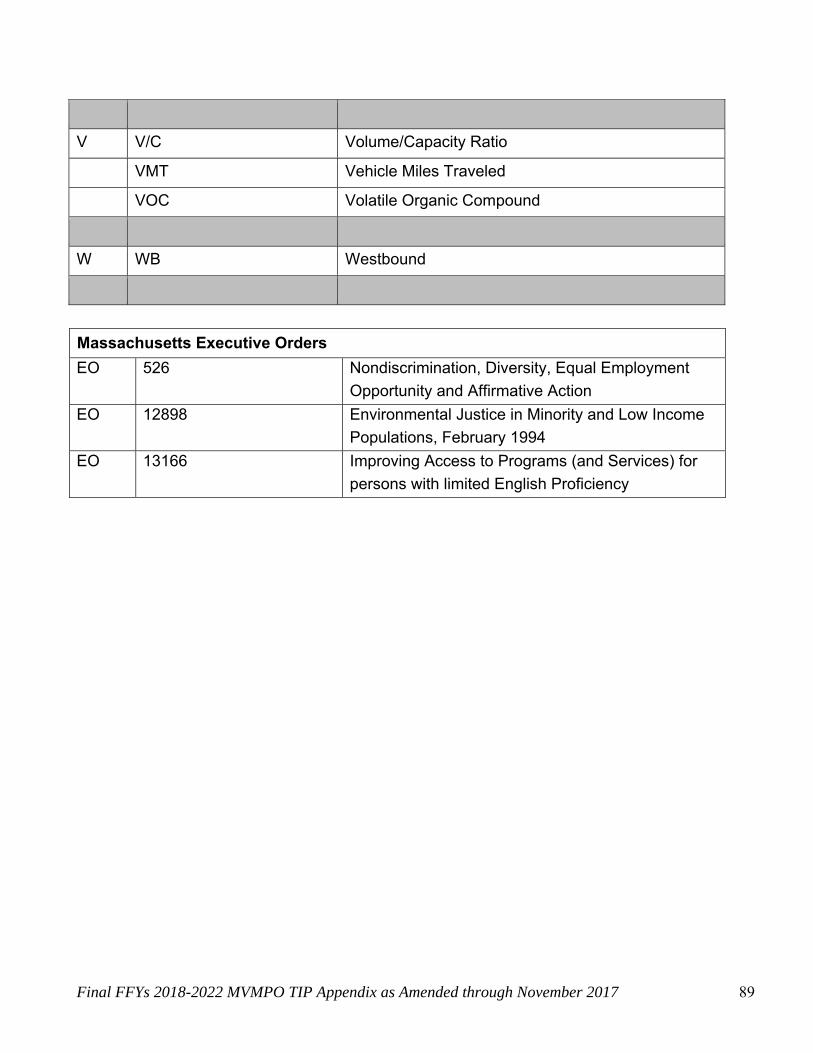
Appendix G List of Acronyms ......................................................................................... 83
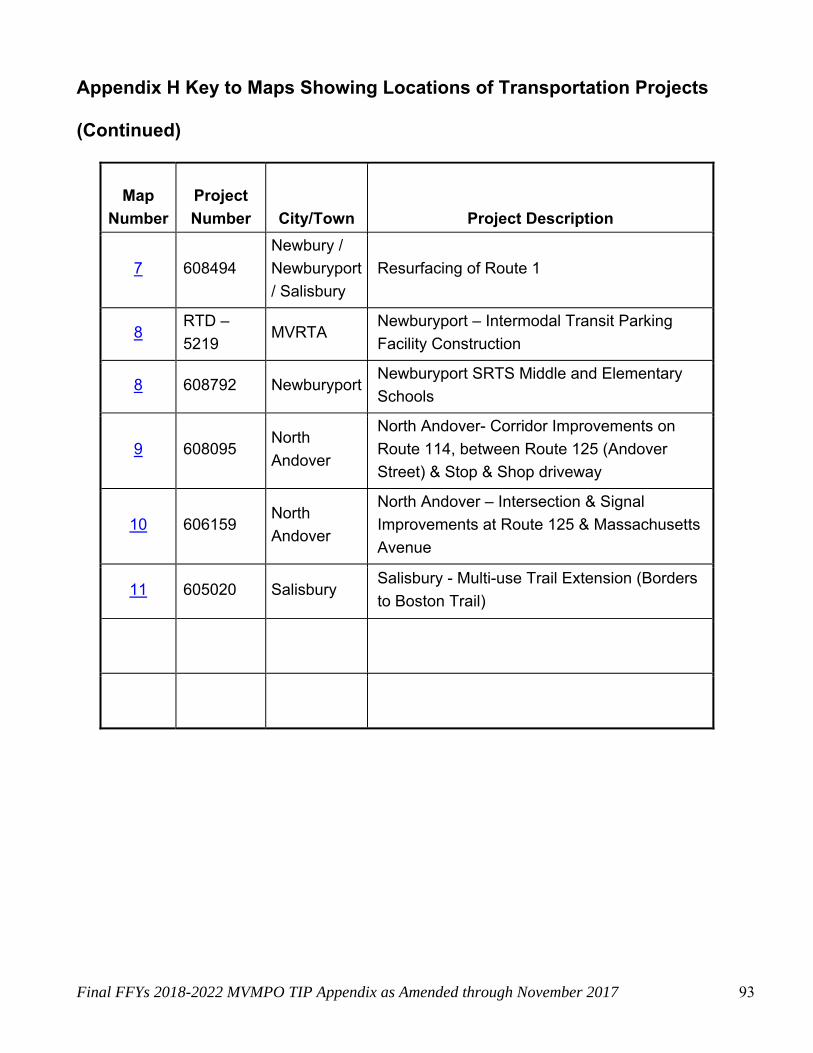
Appendix H Key to Maps Showing Locations of Transportation Projects ....................... 91
Appendix I Comments Received on Draft 2018 to 2022 TIP ........................................ 95
Appendix J October 2017 Amendments and Comments .............................................. 109
Page 4
Final FFYs 2018-2022 MVMPO TIP Appendix as Amended through November 2017
Page intentionally left blank.
Page 5
Final FFYs 2018-2022 MVMPO TIP Appendix as Amended through November 2017 1
Appendices
Appendix A and B: Other Regional Priorities
Page 6
Final FFYs 2018-2022 MVMPO TIP Appendix as Amended through November 2017 2
Appendix A Other Regional Priority Bridge Projects
Merrimack Valley Metropolitan Planning Organization
FFY 2018-2022 Transportation Improvement Program
Implementing Agency: MassDOT
Bridges That Do Not Fit into Fiscally Constrained Targets
and therefore have No Funding Available in Any Year:
ID Location Project Description Highway
District
Estimated
Total Project
Cost
602322 Ames.
Amesbury - Bridge Replacement,
A-07-008, Oak Street Over the B&M
Railroad (Abandoned Line)
4 $1,000,000
And.
Andover - Rehab. Bridge (A-09-001)
Route 28 (North Main Street) Over
the Shawsheen River
4
605418 And. Andover - Bridge Preservation,
A-09-028, Chandler Road over I-93 4 $3,450,000
606522 And.
Andover - Bridge Rehabilitation,
A-09-036, I-495 over ST 28 (SB),
A-09-037, I-495 over B&M and
MBTA, A-09-041, I-495 over ST 28
(NB)
4 $22,706,948
605304 Hav.
Haverhill- Bridge Replacement,
H-12-007 & H-12-025, Bridge Street
(SR 125) over the Merrimack River
and the Abandoned B&M RR (Pro-
posed Bikeway)
4 $63,437,220
604839 Law.
Lawrence – Bridge Replacement,
L-04-027, Lowell Street over B&M
Railroad
4 $4,473,000
Law.
Lawrence - Bridge Rehabilitation,
L-04-042, South Union Connector
over South Street
4
Page 7
Final FFYs 2018-2022 MVMPO TIP Appendix as Amended through November 2017 3
Appendix A Other Regional Priority Bridge Projects (Continued)
Merrimack Valley Metropolitan Planning Organization
FFY 2018-2022 Transportation Improvement Program
Implementing Agency: MassDOT
Bridges That Do Not Fit into Fiscally Constrained Targets
and therefore have No Funding Available in Any Year:
ID Location Project Description Highway
District
Estimated
Total Project
Cost
Nbypt.
Newburyport - Bridge (N-11-002)
State Route 113 (High Street) Over
Railroad
4
Nbypt.
Newburyport - Bridge (N-11-014)
State Route 1A (High Street) over
US 1
4
607115 Nbypt. Newburyport - Bridge Repairs,
N-11-015, Washington St. over US 14 $1,400,000
Page 8
Final FFYs 2018-2022 MVMPO TIP Appendix as Amended through November 2017 4
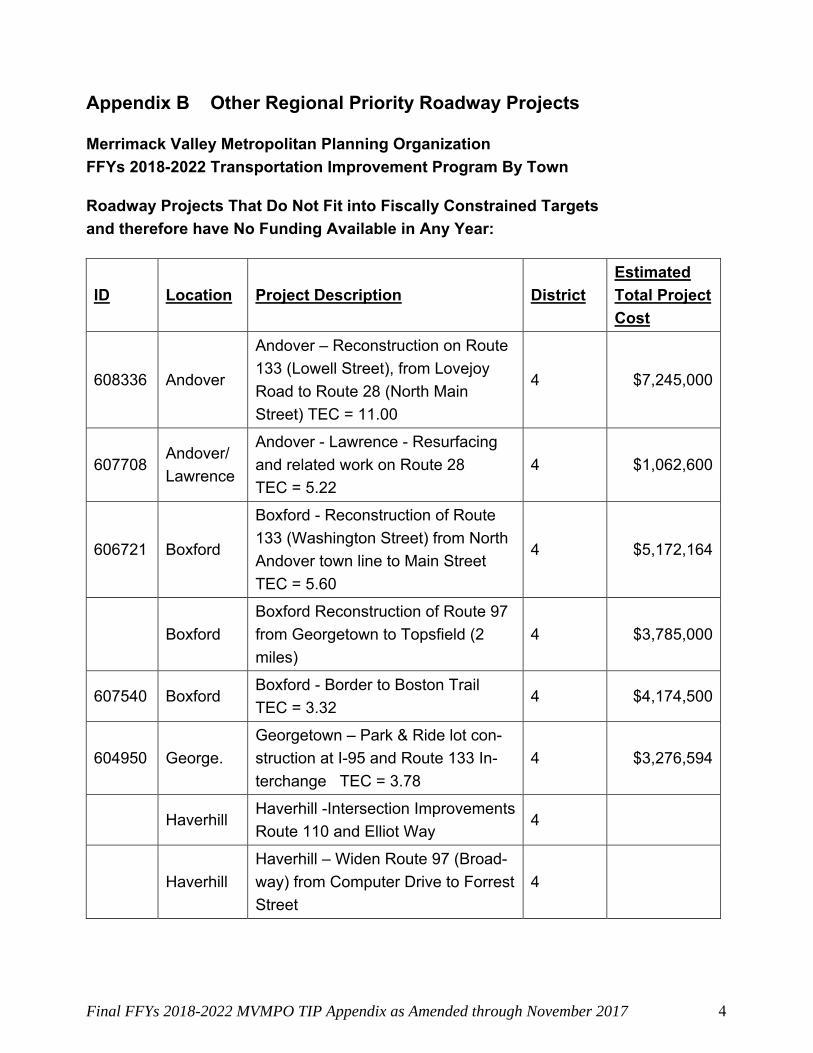
Appendix B Other Regional Priority Roadway Projects
Merrimack Valley Metropolitan Planning Organization
FFYs 2018-2022 Transportation Improvement Program By Town
Roadway Projects That Do Not Fit into Fiscally Constrained Targets
and therefore have No Funding Available in Any Year:
ID Location Project Description District
Estimated
Total Project
Cost
608336 Andover
Andover – Reconstruction on Route
133 (Lowell Street), from Lovejoy
Road to Route 28 (North Main
Street) TEC = 11.00
4 $7,245,000
607708 Andover/
Lawrence
Andover - Lawrence - Resurfacing
and related work on Route 28
TEC = 5.22
4 $1,062,600
606721 Boxford
Boxford - Reconstruction of Route
133 (Washington Street) from North
Andover town line to Main Street
TEC = 5.60
4 $5,172,164
Boxford
Boxford Reconstruction of Route 97
from Georgetown to Topsfield (2
miles)
4 $3,785,000
607540 Boxford Boxford - Border to Boston Trail
TEC = 3.32 4 $4,174,500
604950 George.
Georgetown – Park & Ride lot con-
struction at I-95 and Route 133 In-
terchange TEC = 3.78
4 $3,276,594
Haverhill Haverhill -Intersection Improvements
Route 110 and Elliot Way 4
Haverhill
Haverhill – Widen Route 97 (Broad-
way) from Computer Drive to Forrest
Street
4
Page 9
Final FFYs 2018-2022 MVMPO TIP Appendix as Amended through November 2017 5
Appendix B Other Regional Priority Roadway Projects (Continued)
Roadway Projects That Do Not Fit into Fiscally Constrained Targets
and therefore have No Funding Available in Any Year:
ID Location Project Description District
Estimated
Total Project
Cost
607711 Haverhill
Haverhill - Resurfacing and related
work on Route 125 (from N. And. TL
to Boston Rd) TEC = 5.80
4 $1,062,600
608761 Haverhill
Haverhill – Intersection Reconstruc-
tion on Route 108 (Newton Road) at
Route 110 (Kenoza Avenue and
Amesbury Road) TEC = 8.03
4 $1,944,000
608788 Haverhill Haverhill – Reconstruction of North
Avenue TEC = 8.00 4 $12,200,000
608721 Haverhill
Haverhill – Corridor Improvements
on Water Street (Route 97/113),
from Ginty Boulevard/Mill Street to
Lincoln Boulevard/Riverside Avenue
TEC = 7.98
4 $8,050,000
Haverhill Haverhill – Buttonwoods Trail 4 $2,000,000
602339 Haverhill Haverhill-Historic Waterfront Walk-
way Phase II (Construction) 4 $3,110,184
Lawrence/
North
Andover
Lawrence - North Andover - Recon-
struction of Route 114 from South
Union St. in Lawrence to Rt. 125
(Andover St.) in North Andover
TEC = 12.8
4 $16,300,000
Page 10
Final FFYs 2018-2022 MVMPO TIP Appendix as Amended through November 2017 6
Appendix B Other Regional Priority Roadway Projects (Continued)
Roadway Projects That Do Not Fit into Fiscally Constrained Targets
and therefore have No Funding Available in Any Year:
ID Location Project Description District
Estimated
Total Pro-
ject Cost
Law-
rence
Lawrence - Construct Multi-use Trail
along old M&L Branch ROW from Me-
thuen line to Merrimack Street
4
Law-
rence
Lawrence - Reconstruct Merrimack
Street from Parker Street to South Un-
ion Street TEC = 9.68
4
Methuen
Methuen – Reconstruction of Route 110
from Burnham Road to Woodland
Street
4
Newbury-
port
Newburyport -Route 1 Rotary Reconfig-
uration 4
608029 Newbury-
port
Newburyport - Intersection Improve-
ments Route 1 at Merrimac Street TEC
= 7.22
4 $2,400,000
North
Andover
North Andover - Machine Shop Village
improvements 4
North
Andover
North Andover – Reconstruction of
Mass. Ave. and Sidewalks (from Os-
good St. to I-495)
4
605694 North
Andover
North Andover - Resurfacing and relat-
ed work Route 125 TEC = 7.45 4 $7,910,592
North
Andover
North Andover - Signals and turn lanes
at Mass Ave. and I-495 NB and SB
Ramps
4
602202 Salisbury
Salisbury - Reconstruction of Route 1
(Lafayette Road) TEC = 8.10
4 $6,330,819
Page 11
Final FFYs 2018-2022 MVMPO TIP Appendix as Amended through November 2017 7
Appendix C Transportation Evaluation Criteria Summary
Page 12
Final FFYs 2018-2022 MVMPO TIP Appendix as Amended through November 2017 8
Appendix C Transportation Evaluation Criteria Summary
ID# Project Description
Project
Cost in
1000s AADT Lin
ear
Lan
e M
iles
Co
nd
itio
n
Mo
bili
ty
Saf
ety
& S
ecu
rity
Co
mm
un
ity
Eff
ects
&
Su
pp
ort
Lan
d U
se &
Eco
no
mic
Dev
elo
pm
ent
En
viro
nm
enta
l Eff
ects
To
tal T
EC
Sco
re (
2018
-
2022
)
OPP Lawrence –North Andover -
Reconstruction of Rt. 114
from I-495 to Rt. 125 (Ando-
ver St.)
30,000 5.2 3.00 3.00 3.00 1.80 1.50 0.50 12.80
TIP 608095 North Andover – Recon-
struction of Rt. 114 from Rt.
125 (Andover St.) to Stop &
Shop
$14,950 30,000 4.8 2.50 2.75 2.67 1.00 1.50 0.75 11.17
OPP 608336 Andover – Rt. 133 reconst.
Lovejoy Road to Shawsheen
Square (inc. Shawsheen
Square)
$7,245 12,773 4.4 2.00 2.75 2.00 1.00 1.75 1.50 11.00
Page 13
Final FFYs 2018-2022 MVMPO TIP Appendix as Amended through November 2017 9
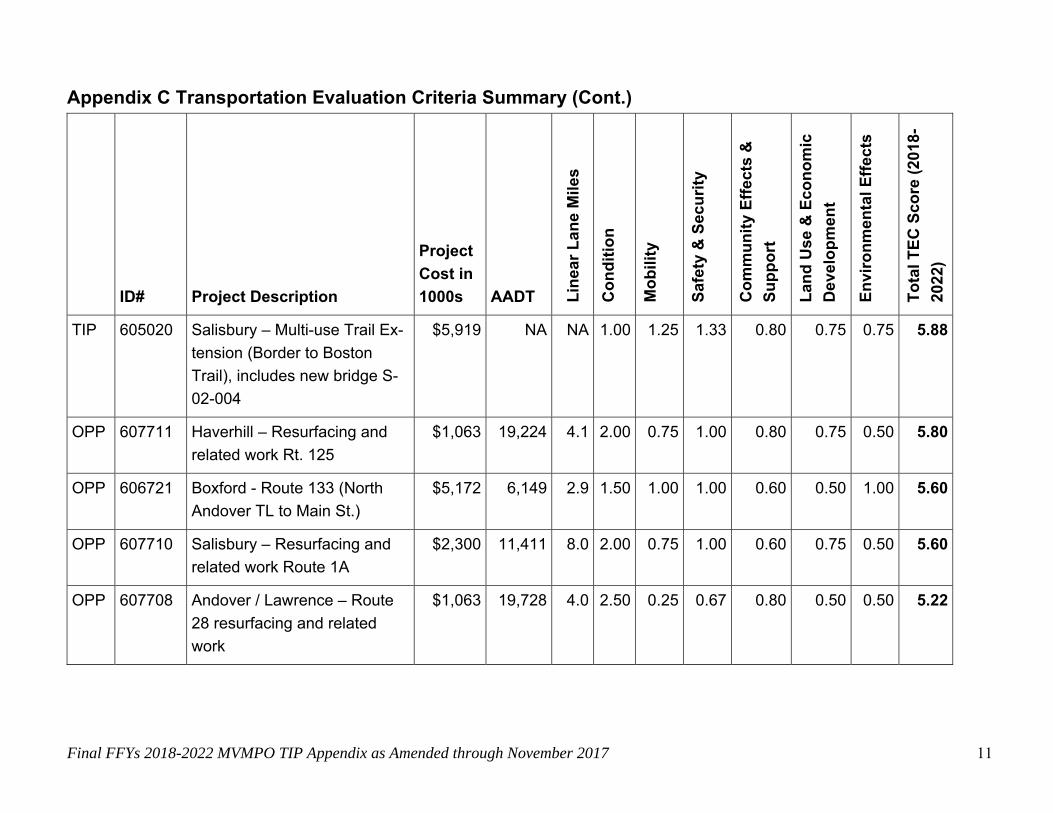
Appendix C Transportation Evaluation Criteria Summary (Cont.)
ID# Project Description
Project
Cost in
1000s AADT Lin
ear
Lan
e M
iles
Co
nd
itio
n
Mo
bili
ty
Saf
ety
& S
ecu
rity
Co
mm
un
ity
Eff
ects
&
Su
pp
ort
Lan
d U
se &
Eco
no
mic
Dev
elo
pm
ent
En
viro
nm
enta
l Eff
ects
To
tal T
EC
Sco
re (
2018
-
2022
)
OPP Lawrence – Merrimack St.
(Parker St. to South Union
St.)
9,654 0.6 2.50 1.25 1.33 1.6 2.25 0.75 9.68
OPP 602202 Salisbury – Reconstruction
of Route 1 (Lafayette Road)
$6,331 12,147 4.8 1.50 2.00 2.00 0.60 1.5 0.5 8.10
OPP 608761 Haverhill - Intersection Im-
provements at Rt. 110 / Rt.
108
$1,944 NA NA 1.00 1.75 1.33 1.20 1.75 1.00 8.03
OPP 608788 Haverhill - Reconstruction
of North Ave. from Main St.
to NH stateline
$12,200 13,172 4 2.50 1.75 1.00 2.00 0.00 0.75 8.00
OPP 608721 Haverhill - Corridor Im-
provements on Water St.
from Ginty Blvd / Mill St. to
Lincoln Ave./ Riverside Ave.
$8,050 20,200 2 1.05 1.75 1.33 1.40 1.25 0.75 7.98
Page 14
Final FFYs 2018-2022 MVMPO TIP Appendix as Amended through November 2017 10
Appendix C Transportation Evaluation Criteria Summary (Cont.)
ID# Project Description
Project
Cost in
1000s AADT Lin
ear
Lan
e M
iles
Co
nd
itio
n
Mo
bili
ty
Saf
ety
& S
ecu
rity
Co
mm
un
ity
Eff
ects
&
Su
pp
ort
Lan
d U
se &
Eco
no
mic
Dev
elo
pm
ent
En
viro
nm
enta
l Eff
ects
To
tal T
EC
Sco
re (
2018
-
2022
)
TIP 606159 North Andover – Intersec-
tion Improvements Route
125 at Mass. Ave.
$3,640 30,284 NA 1.50 1.75 2.00 1.20 0.75 0.75 7.95
OPP 605694 North Andover – Route 125
Resurfacing and related
work
$8,255 20,400 9.4 2.50 1.00 1.00 1.20 1.25 0.50 7.45
OPP 608029 Newburyport – Intersection
Improvements Rt. 1 at Mer-
rimac St.
$2,400 24,850 NA 2.00 0.50 2.67 0.80 1.00 0.25 7.22
TIP 608027 Haverhill – Bradford Rail
Trail extension
$1,088 NA NA 0.50 1.50 1.00 2.40 1.25 0.50 7.15
TIP 602418 Amesbury – Reconstruction
of Elm Street
$11,600 12,436 3.4 1.50 0.50 1.33 0.40 1.50 0.75 5.98
Page 15
Final FFYs 2018-2022 MVMPO TIP Appendix as Amended through November 2017 11
Appendix C Transportation Evaluation Criteria Summary (Cont.)
ID# Project Description
Project
Cost in
1000s AADT Lin
ear
Lan
e M
iles
Co
nd
itio
n
Mo
bili
ty
Saf
ety
& S
ecu
rity
Co
mm
un
ity
Eff
ects
&
Su
pp
ort
Lan
d U
se &
Eco
no
mic
Dev
elo
pm
ent
En
viro
nm
enta
l Eff
ects
To
tal T
EC
Sco
re (
2018
-
2022
)
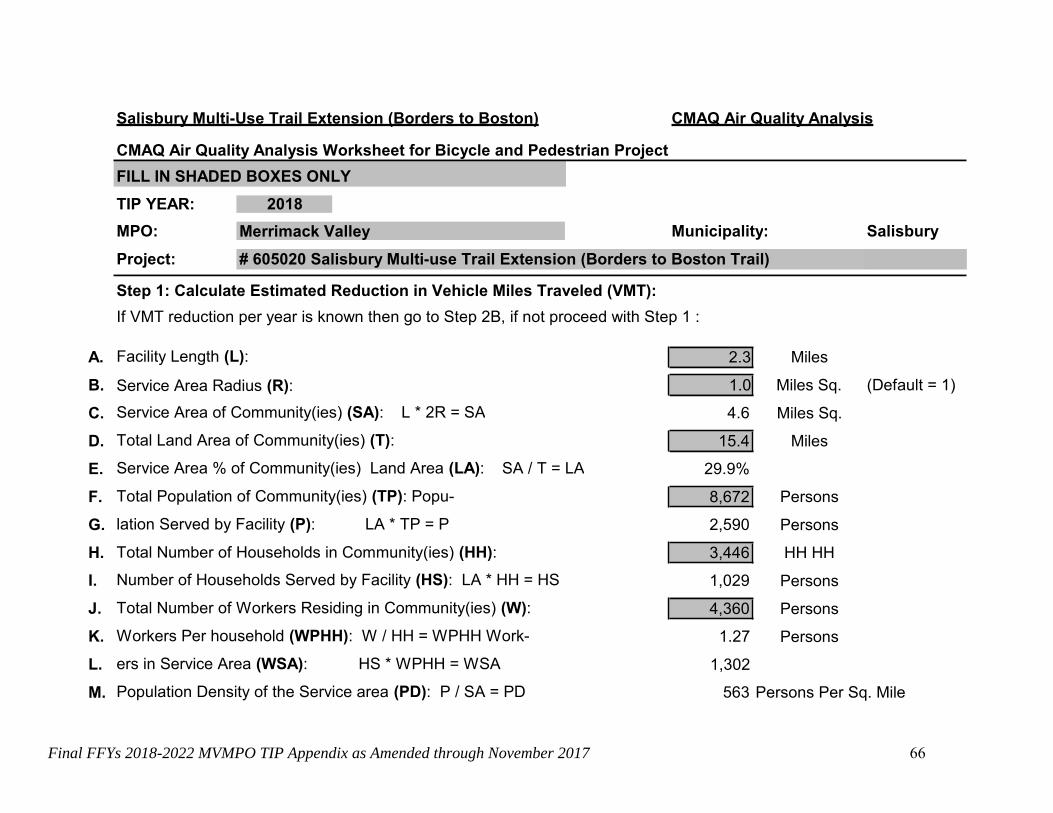
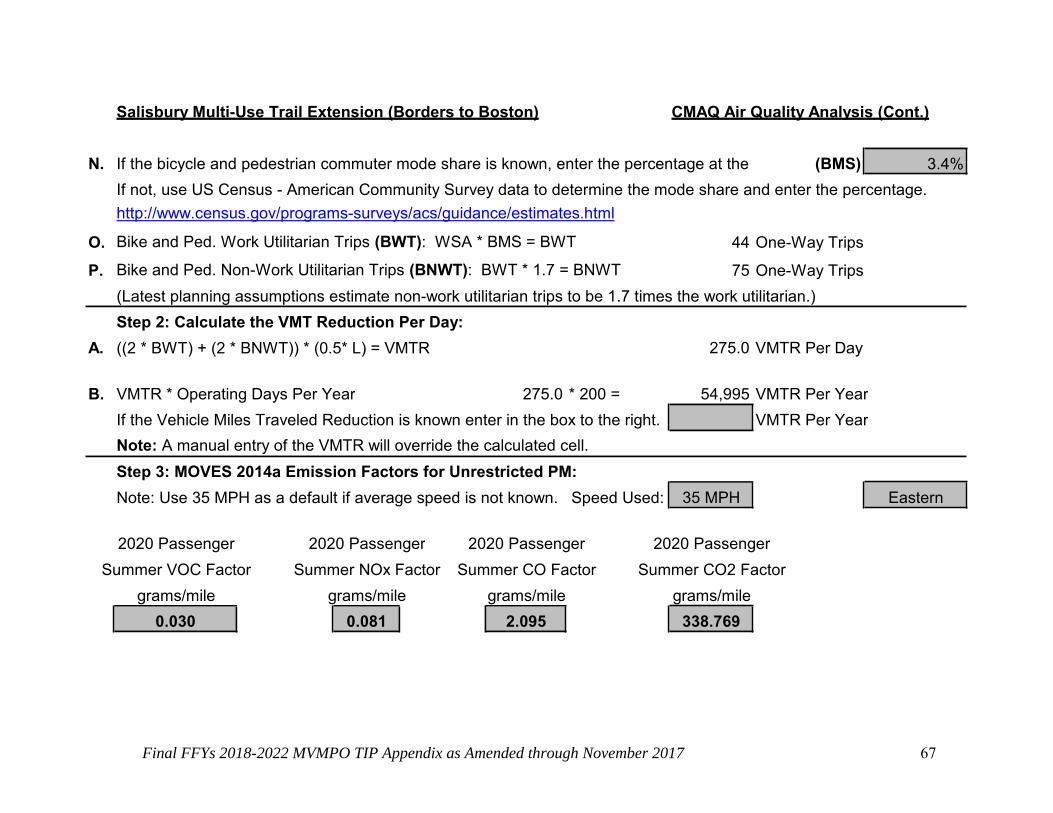
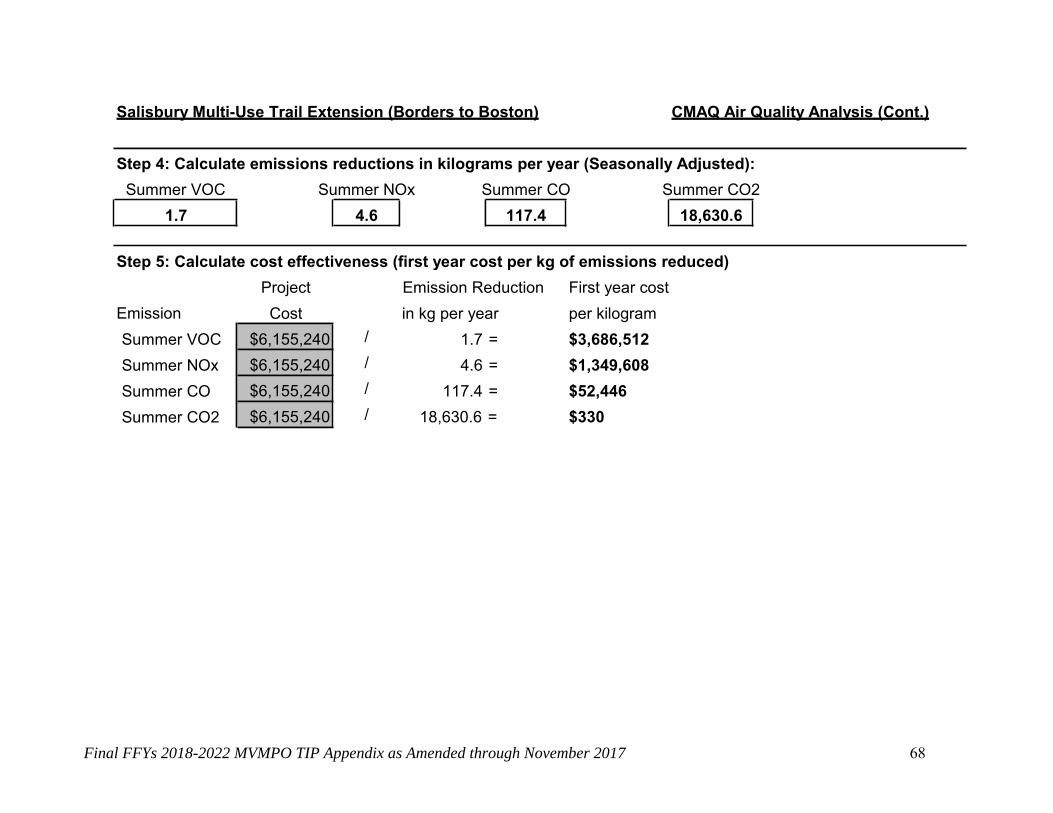
TIP 605020 Salisbury – Multi-use Trail Ex-
tension (Border to Boston
Trail), includes new bridge S-
02-004
$5,919 NA NA 1.00 1.25 1.33 0.80 0.75 0.75 5.88
OPP 607711 Haverhill – Resurfacing and
related work Rt. 125
$1,063 19,224 4.1 2.00 0.75 1.00 0.80 0.75 0.50 5.80
OPP 606721 Boxford - Route 133 (North
Andover TL to Main St.)
$5,172 6,149 2.9 1.50 1.00 1.00 0.60 0.50 1.00 5.60
OPP 607710 Salisbury – Resurfacing and
related work Route 1A
$2,300 11,411 8.0 2.00 0.75 1.00 0.60 0.75 0.50 5.60
OPP 607708 Andover / Lawrence – Route
28 resurfacing and related
work
$1,063 19,728 4.0 2.50 0.25 0.67 0.80 0.50 0.50 5.22
Page 16
Final FFYs 2018-2022 MVMPO TIP Appendix as Amended through November 2017 12
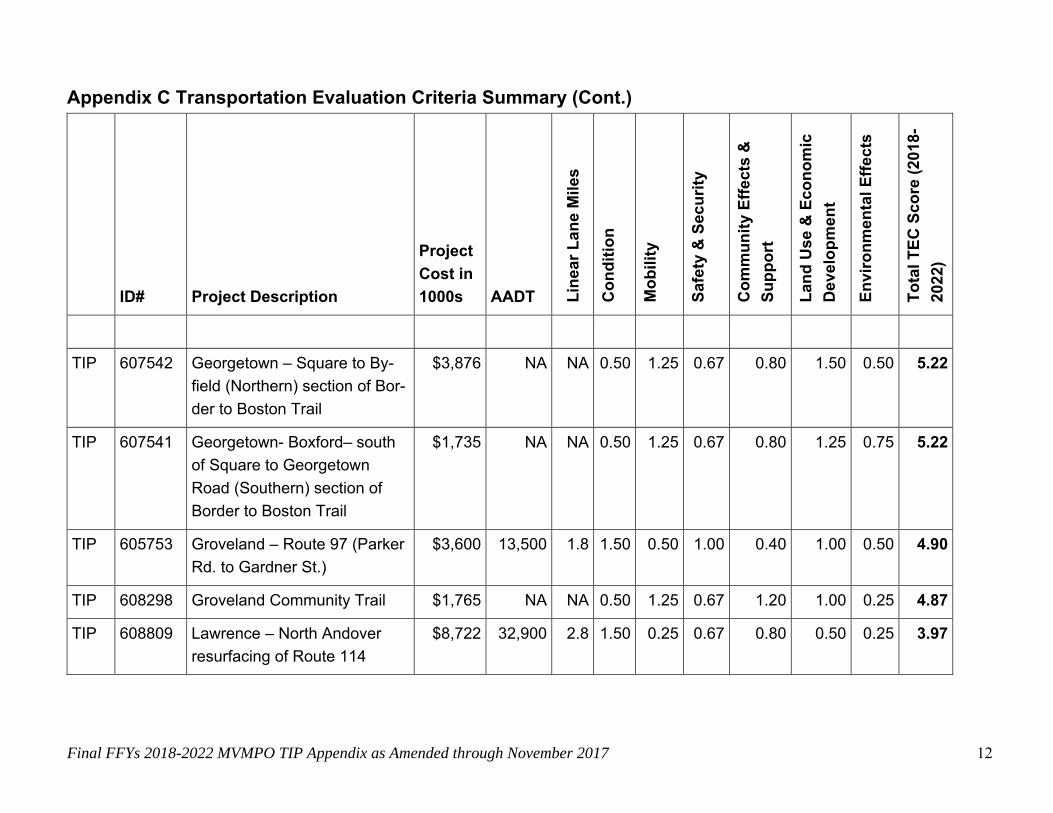
Appendix C Transportation Evaluation Criteria Summary (Cont.)
ID# Project Description
Project
Cost in
1000s AADT Lin
ear
Lan
e M
iles
Co
nd
itio
n
Mo
bili
ty
Saf
ety
& S
ecu
rity
Co
mm
un
ity
Eff
ects
&
Su
pp
ort
Lan
d U
se &
Eco
no
mic
Dev
elo
pm
ent
En
viro
nm
enta
l Eff
ects
To
tal T
EC
Sco
re (
2018
-
2022
)
TIP 607542 Georgetown – Square to By-
field (Northern) section of Bor-
der to Boston Trail
$3,876 NA NA 0.50 1.25 0.67 0.80 1.50 0.50 5.22
TIP 607541 Georgetown- Boxford– south
of Square to Georgetown
Road (Southern) section of
Border to Boston Trail
$1,735 NA NA 0.50 1.25 0.67 0.80 1.25 0.75 5.22
TIP 605753 Groveland – Route 97 (Parker
Rd. to Gardner St.)
$3,600 13,500 1.8 1.50 0.50 1.00 0.40 1.00 0.50 4.90
TIP 608298 Groveland Community Trail $1,765 NA NA 0.50 1.25 0.67 1.20 1.00 0.25 4.87
TIP 608809 Lawrence – North Andover
resurfacing of Route 114
$8,722 32,900 2.8 1.50 0.25 0.67 0.80 0.50 0.25 3.97
Page 17
Final FFYs 2018-2022 MVMPO TIP Appendix as Amended through November 2017 13
Appendix C Transportation Evaluation Criteria Summary (Cont.)
ID# Project Description
Project
Cost in
1000s AADT Lin
ear
Lan
e M
iles
Co
nd
itio
n
Mo
bili
ty
Saf
ety
& S
ecu
rity
Co
mm
un
ity
Eff
ects
&
Su
pp
ort
Lan
d U
se &
Eco
no
mic
Dev
elo
pm
ent
En
viro
nm
enta
l Eff
ects
To
tal T
EC
Sco
re (
2018
-
2022
)
OPP 604950 Georgetown – Park & Ride
Construction at I-95 and Route
133 Interchange
$3,277 NA NA 0.00 1.75 0.33 0.20 0.75 0.75 3.78
OPP 607540 Boxford – section of Border to
Boston Trail
$4,175 NA NA 0.50 1.00 0.67 0.40 0.50 0.25 3.32
Page 18
Final FFYs 2018-2022 MVMPO TIP Appendix as Amended through November 2017 14
Page intentionally left blank.
Page 19
Final FFYs 2018-2022 MVMPO TIP Appendix as Amended through November 2017 15
Appendix D Sample Project Evaluation Worksheet
Page 20
Final FFYs 2018-2022 MVMPO TIP Appendix as Amended through November 2017 16
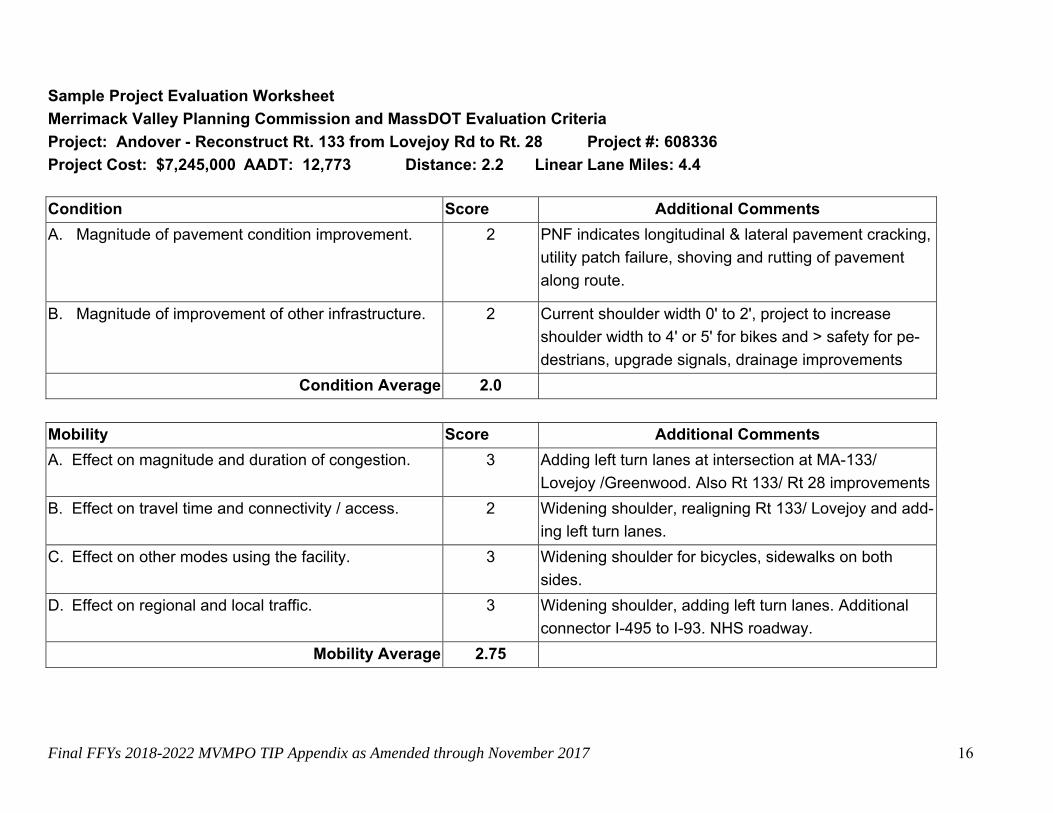
Sample Project Evaluation Worksheet
Merrimack Valley Planning Commission and MassDOT Evaluation Criteria
Project: Andover - Reconstruct Rt. 133 from Lovejoy Rd to Rt. 28 Project #: 608336
Project Cost: $7,245,000 AADT: 12,773 Distance: 2.2 Linear Lane Miles: 4.4
Condition Score Additional Comments
A. Magnitude of pavement condition improvement. 2 PNF indicates longitudinal & lateral pavement cracking,
utility patch failure, shoving and rutting of pavement
along route.
B. Magnitude of improvement of other infrastructure. 2 Current shoulder width 0' to 2', project to increase
shoulder width to 4' or 5' for bikes and > safety for pe-
destrians, upgrade signals, drainage improvements
Condition Average 2.0
Mobility Score Additional Comments
A. Effect on magnitude and duration of congestion. 3 Adding left turn lanes at intersection at MA-133/
Lovejoy /Greenwood. Also Rt 133/ Rt 28 improvements
B. Effect on travel time and connectivity / access. 2 Widening shoulder, realigning Rt 133/ Lovejoy and add-
ing left turn lanes.
C. Effect on other modes using the facility. 3 Widening shoulder for bicycles, sidewalks on both
sides.
D. Effect on regional and local traffic. 3 Widening shoulder, adding left turn lanes. Additional
connector I-495 to I-93. NHS roadway.
Mobility Average 2.75
Page 21
Final FFYs 2018-2022 MVMPO TIP Appendix as Amended through November 2017 17
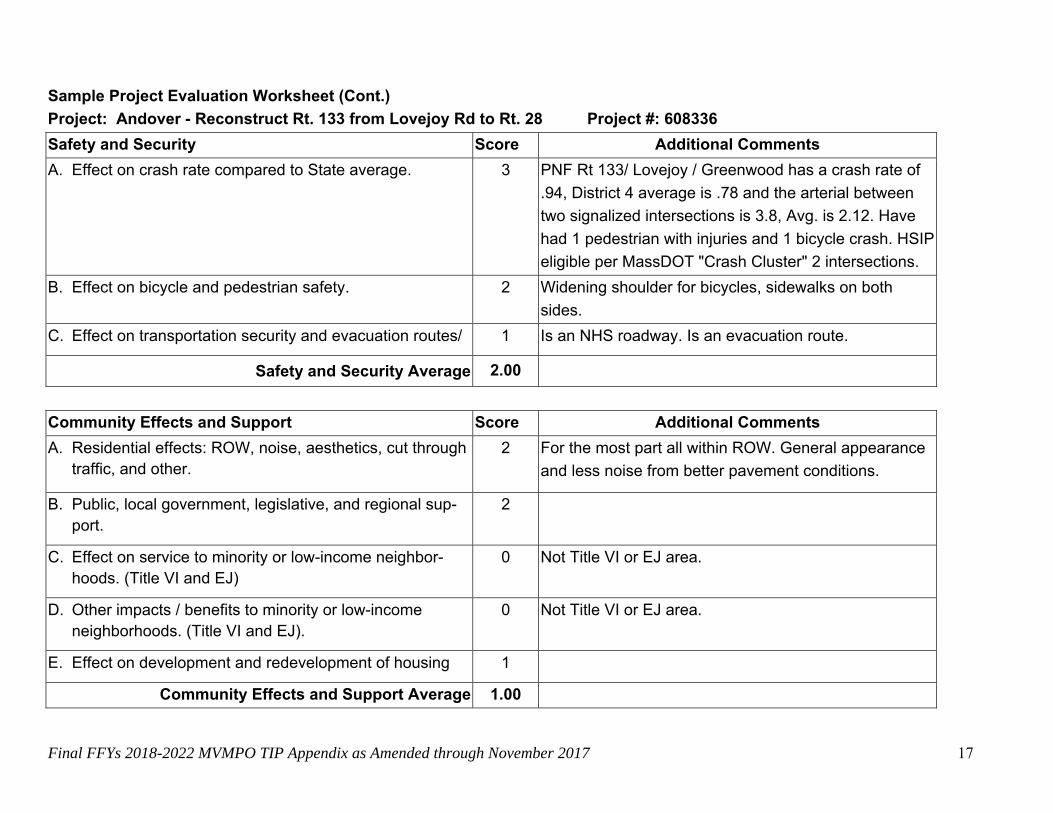
Sample Project Evaluation Worksheet (Cont.)
Project: Andover - Reconstruct Rt. 133 from Lovejoy Rd to Rt. 28 Project #: 608336
Safety and Security Score Additional Comments
A. Effect on crash rate compared to State average. 3 PNF Rt 133/ Lovejoy / Greenwood has a crash rate of
.94, District 4 average is .78 and the arterial between
two signalized intersections is 3.8, Avg. is 2.12. Have
had 1 pedestrian with injuries and 1 bicycle crash. HSIP
eligible per MassDOT "Crash Cluster" 2 intersections.
B. Effect on bicycle and pedestrian safety. 2 Widening shoulder for bicycles, sidewalks on both
sides.
C. Effect on transportation security and evacuation routes/ 1 Is an NHS roadway. Is an evacuation route.
Safety and Security Average 2.00
Community Effects and Support Score Additional Comments
A. Residential effects: ROW, noise, aesthetics, cut through traffic, and other.
2 For the most part all within ROW. General appearance
and less noise from better pavement conditions.
B. Public, local government, legislative, and regional sup-port.
2
C. Effect on service to minority or low-income neighbor-hoods. (Title VI and EJ)
0 Not Title VI or EJ area.
D. Other impacts / benefits to minority or low-income neighborhoods. (Title VI and EJ).
0 Not Title VI or EJ area.
E. Effect on development and redevelopment of housing 1
Community Effects and Support Average 1.00
Page 22
Final FFYs 2018-2022 MVMPO TIP Appendix as Amended through November 2017 18
Sample Project Evaluation Worksheet (Cont.)
Project: Andover - Reconstruct Rt. 133 from Lovejoy Rd to Rt. 28 Project #: 608336
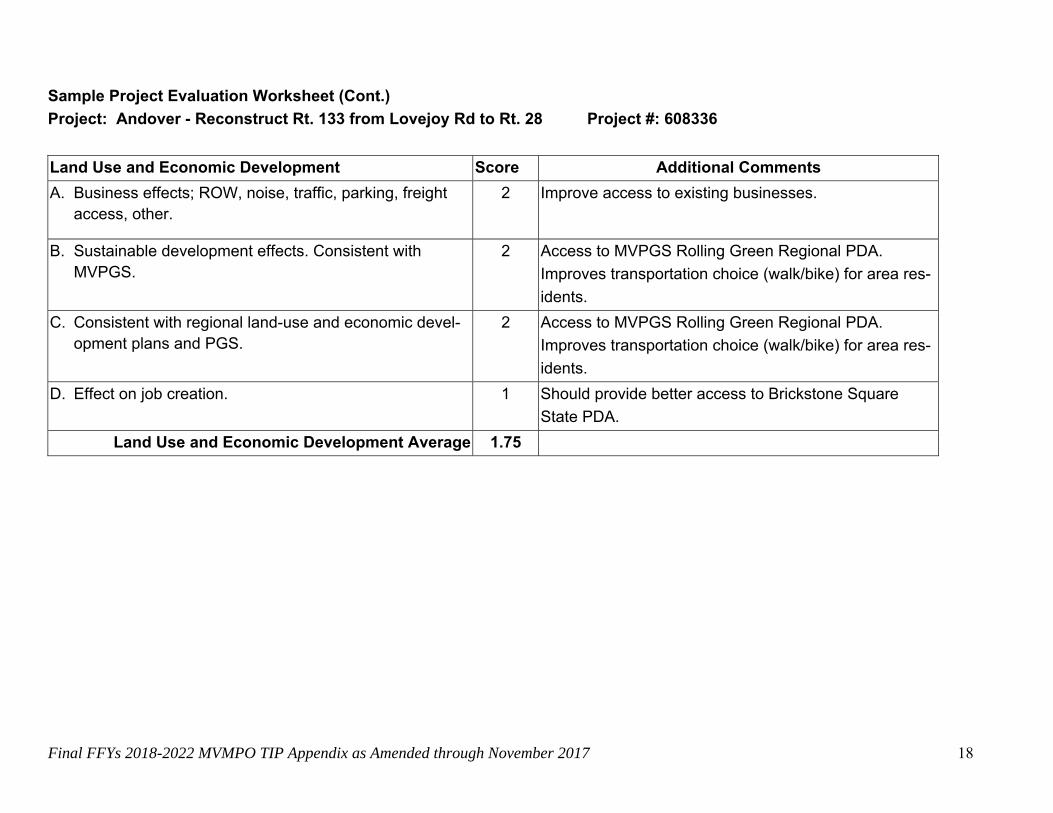
Land Use and Economic Development Score Additional Comments
A. Business effects; ROW, noise, traffic, parking, freight access, other.
2 Improve access to existing businesses.
B. Sustainable development effects. Consistent with MVPGS.
2 Access to MVPGS Rolling Green Regional PDA.
Improves transportation choice (walk/bike) for area res-
idents.
C. Consistent with regional land-use and economic devel-opment plans and PGS.
2 Access to MVPGS Rolling Green Regional PDA.
Improves transportation choice (walk/bike) for area res-
idents.
D. Effect on job creation. 1 Should provide better access to Brickstone Square
State PDA.
Land Use and Economic Development Average 1.75
Page 23
Final FFYs 2018-2022 MVMPO TIP Appendix as Amended through November 2017 19
Sample Project Evaluation Worksheet (Cont.)
Project: Andover - Reconstruct Rt. 133 from Lovejoy Rd to Rt. 28 Project #: 608336
Environmental Effects Score Additional Comments
A. Air quality / Climate effects. GHG Impact Description – Assumed Nominal Decrease in Emissions from Other Improvements
2 Adding bike lanes and sidewalks. Reducing
delays at intersections.
B. Water quality/supply effects; wetlands effects. 1 There will be deep sump catch basins
C. Historic and cultural resources effects. 3 Shawsheen Village Historic District
D. Effect on wildlife habitat and endangered species. 0 Not endangered species habitat area.
Environmental Effects Average 1.5
Overall Project TEC score 11.00
Page 24
Final FFYs 2018-2022 MVMPO TIP Appendix as Amended through November 2017 20
Page intentionally left blank.
Page 25
Final FFYs 2018-2022 MVMPO TIP Appendix as Amended through November 2017 21
Appendix E Greenhouse Gas (GHG) Monitoring and Evaluation
Page 26
Final FFYs 2018-2022 MVMPO TIP Appendix as Amended through November 2017 22
2018-2022
Transportation Improvement Program
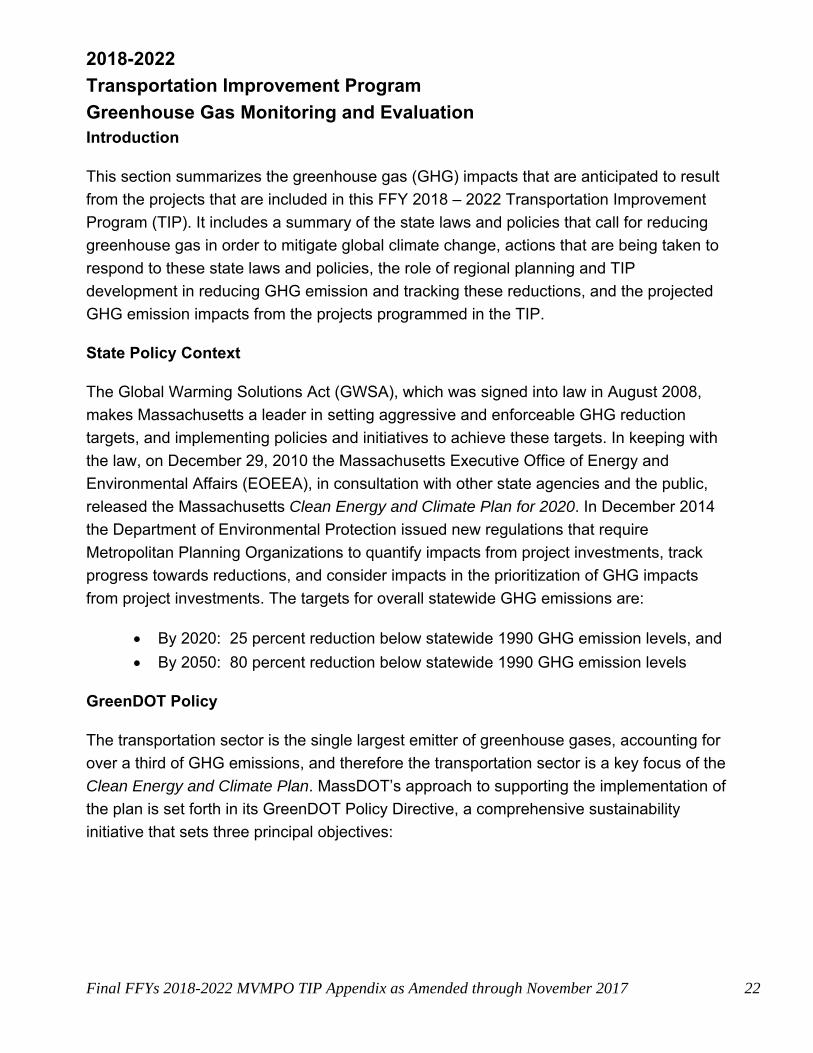
Greenhouse Gas Monitoring and Evaluation Introduction
This section summarizes the greenhouse gas (GHG) impacts that are anticipated to result
from the projects that are included in this FFY 2018 – 2022 Transportation Improvement
Program (TIP). It includes a summary of the state laws and policies that call for reducing
greenhouse gas in order to mitigate global climate change, actions that are being taken to
respond to these state laws and policies, the role of regional planning and TIP
development in reducing GHG emission and tracking these reductions, and the projected
GHG emission impacts from the projects programmed in the TIP.
State Policy Context
The Global Warming Solutions Act (GWSA), which was signed into law in August 2008,
makes Massachusetts a leader in setting aggressive and enforceable GHG reduction
targets, and implementing policies and initiatives to achieve these targets. In keeping with
the law, on December 29, 2010 the Massachusetts Executive Office of Energy and
Environmental Affairs (EOEEA), in consultation with other state agencies and the public,
released the Massachusetts Clean Energy and Climate Plan for 2020. In December 2014
the Department of Environmental Protection issued new regulations that require
Metropolitan Planning Organizations to quantify impacts from project investments, track
progress towards reductions, and consider impacts in the prioritization of GHG impacts
from project investments. The targets for overall statewide GHG emissions are:
By 2020: 25 percent reduction below statewide 1990 GHG emission levels, and
By 2050: 80 percent reduction below statewide 1990 GHG emission levels
GreenDOT Policy
The transportation sector is the single largest emitter of greenhouse gases, accounting for
over a third of GHG emissions, and therefore the transportation sector is a key focus of the
Clean Energy and Climate Plan. MassDOT’s approach to supporting the implementation of
the plan is set forth in its GreenDOT Policy Directive, a comprehensive sustainability
initiative that sets three principal objectives:
Page 27
Final FFYs 2018-2022 MVMPO TIP Appendix as Amended through November 2017 23
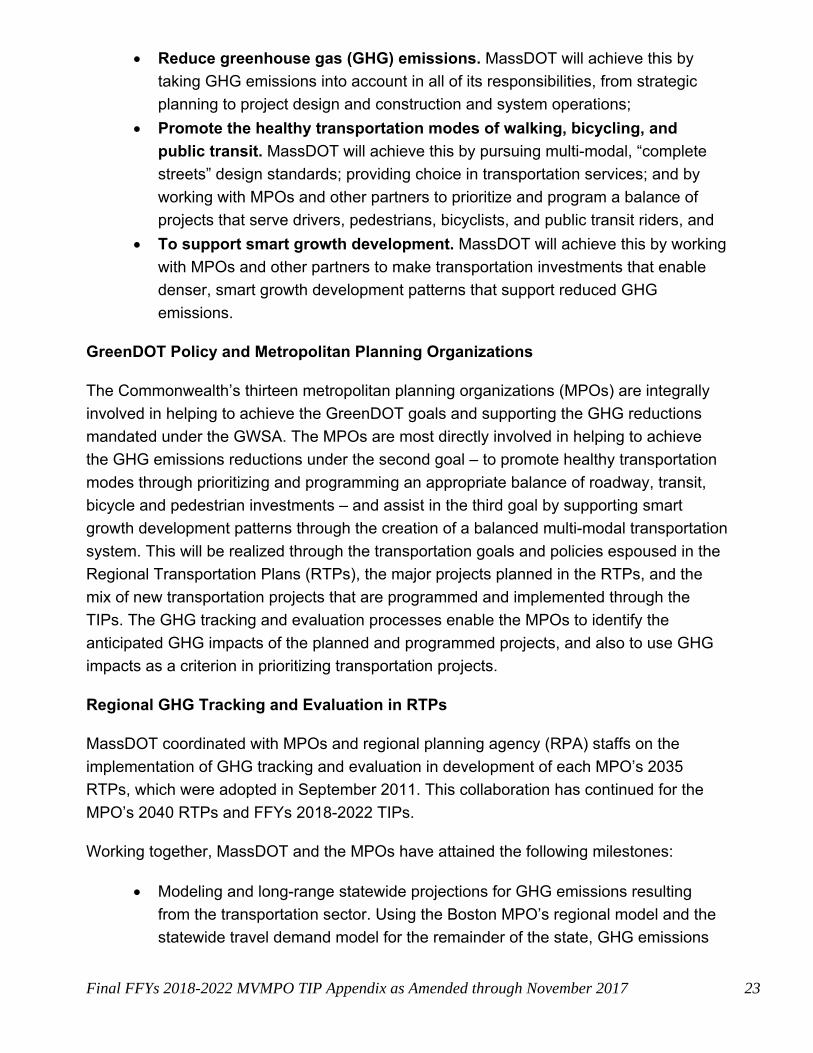
Reduce greenhouse gas (GHG) emissions. MassDOT will achieve this by
taking GHG emissions into account in all of its responsibilities, from strategic
planning to project design and construction and system operations;
Promote the healthy transportation modes of walking, bicycling, and
public transit. MassDOT will achieve this by pursuing multi-modal, “complete
streets” design standards; providing choice in transportation services; and by
working with MPOs and other partners to prioritize and program a balance of
projects that serve drivers, pedestrians, bicyclists, and public transit riders, and
To support smart growth development. MassDOT will achieve this by working
with MPOs and other partners to make transportation investments that enable
denser, smart growth development patterns that support reduced GHG
emissions.
GreenDOT Policy and Metropolitan Planning Organizations
The Commonwealth’s thirteen metropolitan planning organizations (MPOs) are integrally
involved in helping to achieve the GreenDOT goals and supporting the GHG reductions
mandated under the GWSA. The MPOs are most directly involved in helping to achieve
the GHG emissions reductions under the second goal – to promote healthy transportation
modes through prioritizing and programming an appropriate balance of roadway, transit,
bicycle and pedestrian investments – and assist in the third goal by supporting smart
growth development patterns through the creation of a balanced multi-modal transportation
system. This will be realized through the transportation goals and policies espoused in the
Regional Transportation Plans (RTPs), the major projects planned in the RTPs, and the
mix of new transportation projects that are programmed and implemented through the
TIPs. The GHG tracking and evaluation processes enable the MPOs to identify the
anticipated GHG impacts of the planned and programmed projects, and also to use GHG
impacts as a criterion in prioritizing transportation projects.
Regional GHG Tracking and Evaluation in RTPs
MassDOT coordinated with MPOs and regional planning agency (RPA) staffs on the
implementation of GHG tracking and evaluation in development of each MPO’s 2035
RTPs, which were adopted in September 2011. This collaboration has continued for the
MPO’s 2040 RTPs and FFYs 2018-2022 TIPs.
Working together, MassDOT and the MPOs have attained the following milestones:
Modeling and long-range statewide projections for GHG emissions resulting
from the transportation sector. Using the Boston MPO’s regional model and the
statewide travel demand model for the remainder of the state, GHG emissions
Page 28
Final FFYs 2018-2022 MVMPO TIP Appendix as Amended through November 2017 24
were projected for 2021 no-build and build conditions, and for 2035 no-build and
build conditions.
All of the MPOs included these GHG emission projections in their RTPs, along
with a discussion of climate change and a statement of MPO support for
reducing GHG emissions as a regional goal.
Project-Level GHG Tracking and Evaluation in the Transportation Improvement
Program
It is also important to monitor and evaluate the GHG impacts of the transportation projects
that are programmed in the MPO Transportation Improvement Programs (TIP). The TIP
includes both the larger, regionally-significant projects from the RTPs, which have already
had their aggregate GHG impacts calculated and reported in the RTP, as well as smaller
projects that are not included in the RTP but that may nevertheless have impacts on GHG
emissions. The principal objective of this tracking is to enable the MPOs to evaluate
expected GHG impacts of different projects and to use this information as a criterion for
prioritizing and programming projects in future TIPs.
In order to monitor and evaluate the GHG impacts of TIP projects, MassDOT and the
MPOs have developed the following approach for identifying anticipated GHG impacts and
quantifying GHG impacts of projects, when appropriate, through the TIP. Different types of
projects will have different anticipated GHG emissions impacts. The different project
categories are outlined on the next two pages with this region’s project tracking sheets on
the third page.
Calculation of GHG Impacts for TIP Projects
The Office of Transportation Planning at MassDOT provided the spreadsheets that are
used for determining Congestion Management and Air Quality (CMAQ) eligibility. These
spreadsheets require the same inputs as the CMAQ calculations, and have been adapted
to provide CO2 impacts. The data and analysis required for these calculations is available
from functional design reports that should be submitted for projects that would produce a
measurable GHG impact.
Projects with Quantified Impacts
o RTP Projects - Major capacity expansion projects would be expected to
have a significant impact on GHG emissions. However, these projects are
included in the RTPs and analyzed using the statewide model or Boston
regional model, which would reflect their GHG impacts. Therefore, no
independent TIP calculations are required.
Page 29
Final FFYs 2018-2022 MVMPO TIP Appendix as Amended through November 2017 25
o Quantified Decrease in Emissions - Projects that would be expected to
produce a measurable decrease in emissions. The approach for
calculating these impacts is described below. These projects should be
categorized in the following manner:
Quantified Decrease in Emissions from Traffic Operational
Improvement - An intersection reconstruction or signalization
project that is projected to reduce delay and congestion.
Quantified Decrease in Emissions from Pedestrian and
Bicycle Infrastructure - A shared-use path that would enable
increased walking and biking and decreased vehicle-miles traveled
(VMT).
Quantified Decrease in Emissions from New/Additional
Transit Service - A bus or shuttle service that would enable
increased transit ridership and decreased VMT.
Quantified Decrease in Emissions from a Park and Ride Lot -
A park-and-ride lot that would enable increased transit ridership/
increased ridesharing and decreased VMT.
Quantified Decrease in Emissions from Bus Replacement
A bus replacement that would directly reduce GHG emissions
generated by that bus service.
Quantified Decrease in Emissions from Complete Streets
Improvements
Improvements to roadway networks that include the addition of
bicycle and pedestrian accommodations where none were present
before.
Quantified Decrease in Emissions from Other Improvement
o Quantified Increase in Emissions – Projects that would be expected to
produce a measurable increase in emissions.
Projects with Assumed Impacts
o No Assumed Impact/Negligible Impact on Emission - Projects that do
not change the capacity or use of a facility (e.g. a resurfacing project that
restores a roadway to its previous condition, or a bridge
rehabilitation/replacement that restores the bridge to its previous
condition) would be assumed to have no GHG impact.
Page 30
Final FFYs 2018-2022 MVMPO TIP Appendix as Amended through November 2017 26
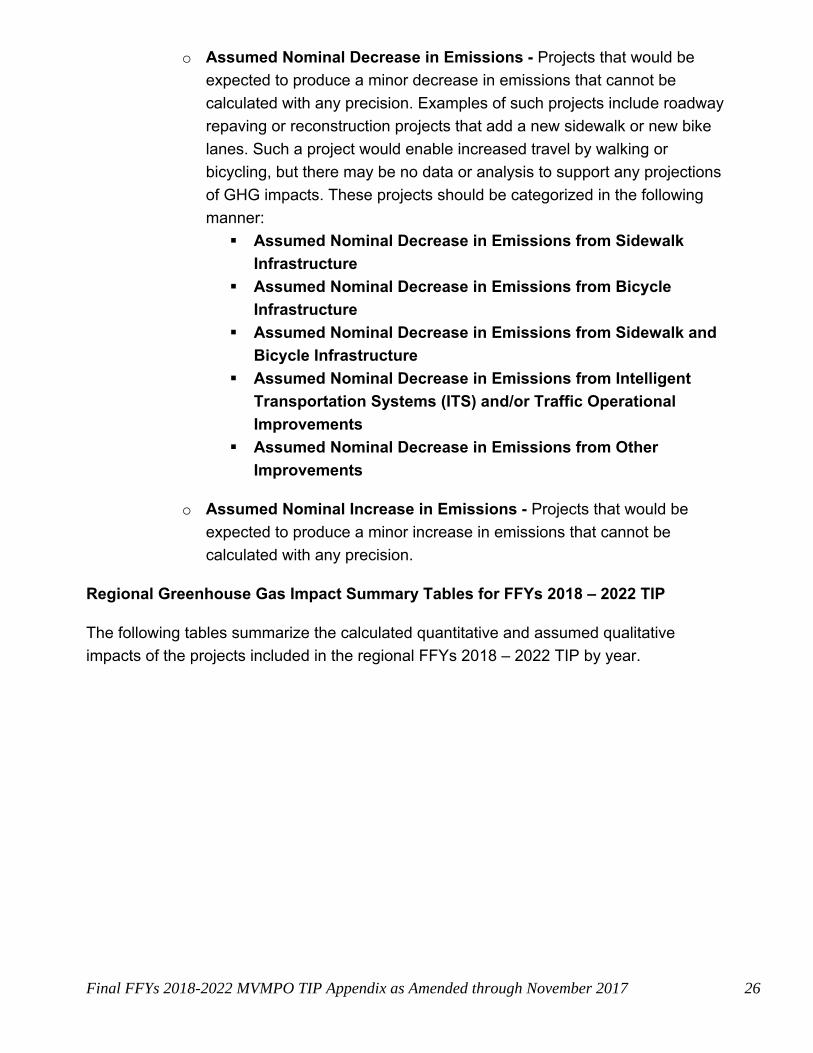
o Assumed Nominal Decrease in Emissions - Projects that would be
expected to produce a minor decrease in emissions that cannot be
calculated with any precision. Examples of such projects include roadway
repaving or reconstruction projects that add a new sidewalk or new bike
lanes. Such a project would enable increased travel by walking or
bicycling, but there may be no data or analysis to support any projections
of GHG impacts. These projects should be categorized in the following
manner:
Assumed Nominal Decrease in Emissions from Sidewalk
Infrastructure
Assumed Nominal Decrease in Emissions from Bicycle
Infrastructure
Assumed Nominal Decrease in Emissions from Sidewalk and
Bicycle Infrastructure
Assumed Nominal Decrease in Emissions from Intelligent
Transportation Systems (ITS) and/or Traffic Operational
Improvements
Assumed Nominal Decrease in Emissions from Other
Improvements
o Assumed Nominal Increase in Emissions - Projects that would be
expected to produce a minor increase in emissions that cannot be
calculated with any precision.
Regional Greenhouse Gas Impact Summary Tables for FFYs 2018 – 2022 TIP
The following tables summarize the calculated quantitative and assumed qualitative
impacts of the projects included in the regional FFYs 2018 – 2022 TIP by year.
Page 31
Final FFYs 2018-2022 MVMPO TIP Appendix as Amended through November 2017 27
FFYs 2018 to 2022 Projects GHG Tracking Summary
Page 32
Final FFYs 2018-2022 MVMPO TIP Appendix as Amended through November 2017 28
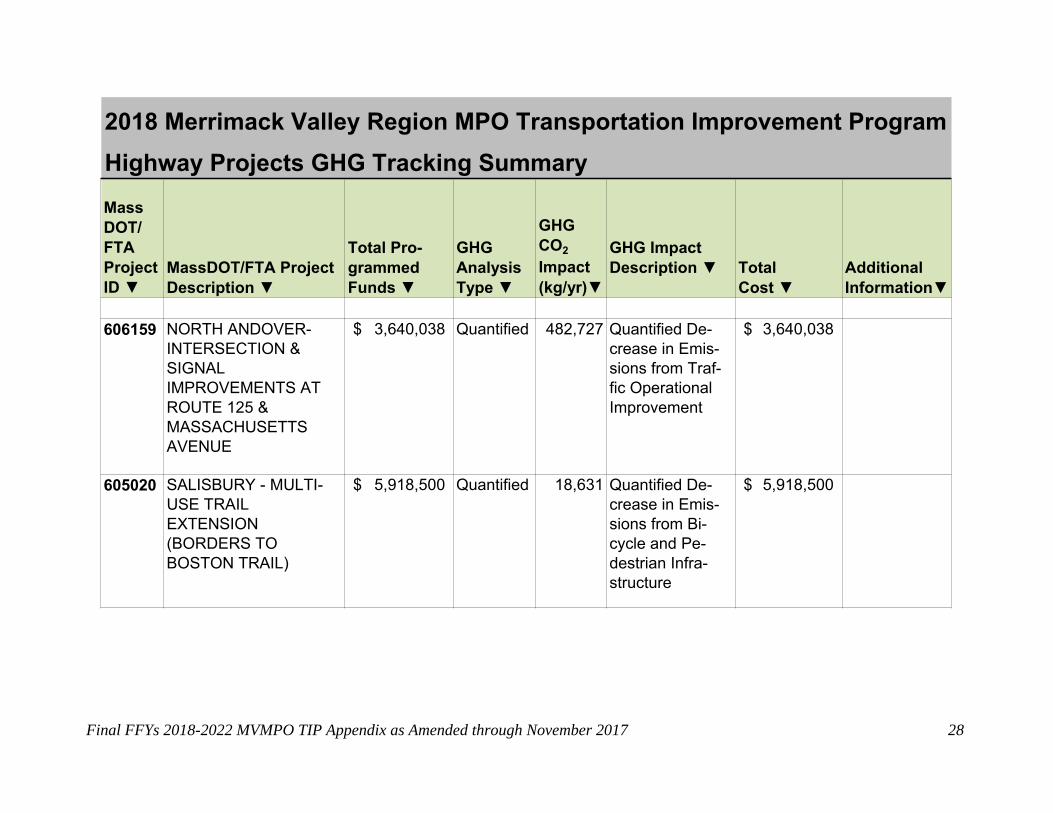
2018 Merrimack Valley Region MPO Transportation Improvement Program
Highway Projects GHG Tracking Summary Mass DOT/ FTA Project ID ▼
MassDOT/FTA Project Description ▼
Total Pro-grammed Funds ▼
GHG Analysis Type ▼
GHG CO2
Impact (kg/yr)▼
GHG Impact Description ▼
Total Cost ▼
Additional Information▼
606159
NORTH ANDOVER- INTERSECTION & SIGNAL IMPROVEMENTS AT ROUTE 125 & MASSACHUSETTS AVENUE
$ 3,640,038
Quantified
482,727
Quantified De-crease in Emis-sions from Traf-fic Operational Improvement
$ 3,640,038
605020
SALISBURY - MULTI- USE TRAIL EXTENSION (BORDERS TO BOSTON TRAIL)
$ 5,918,500
Quantified
18,631
Quantified De-crease in Emis-sions from Bi-cycle and Pe-destrian Infra-structure
$ 5,918,500
Page 33
Final FFYs 2018-2022 MVMPO TIP Appendix as Amended through November 2017 29
2018 Merrimack Valley Region MPO Transportation Improvement Program
Highway Projects GHG Tracking Summary (Cont.) Mass DOT/ FTA Project ID ▼
MassDOT/FTA Project Description ▼
Total Pro-grammed Funds ▼
GHG Analysis Type ▼
GHG CO2
Impact (kg/yr)▼
GHG Impact Description ▼
Total Cost ▼
Additional Information▼
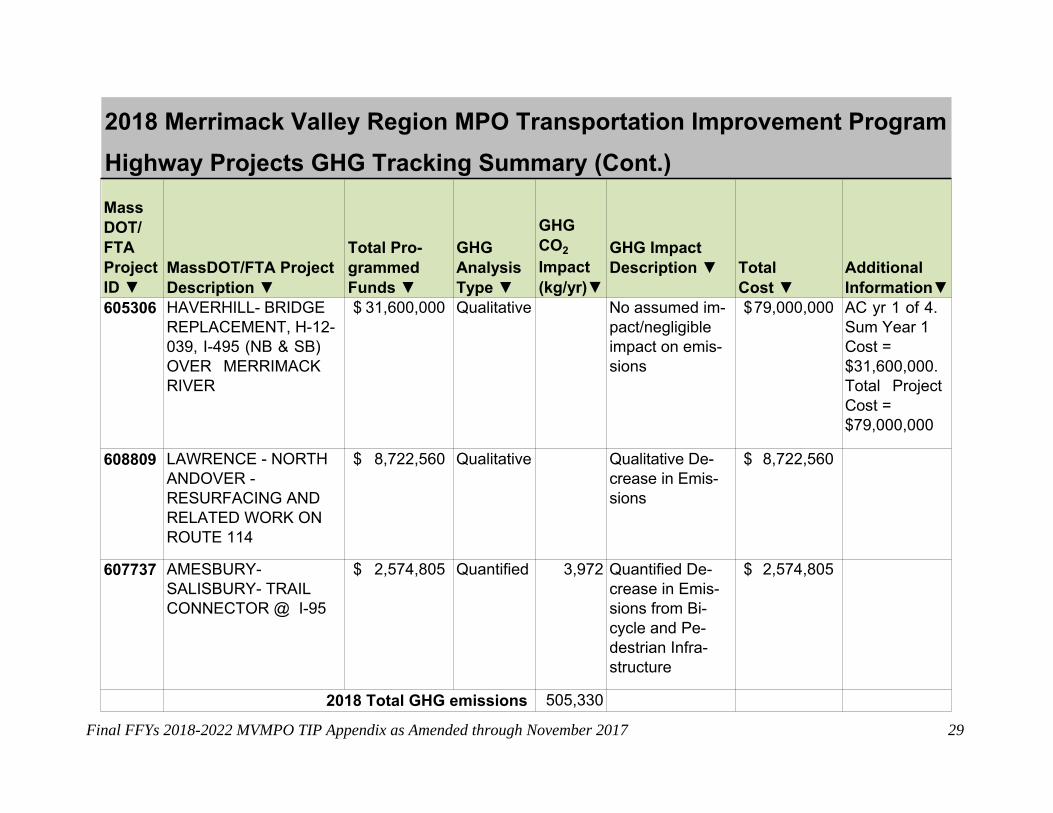
605306
HAVERHILL- BRIDGE REPLACEMENT, H-12- 039, I-495 (NB & SB) OVER MERRIMACK RIVER
$ 31,600,000
Qualitative
No assumed im-pact/negligible impact on emis-sions
$ 79,000,000
AC yr 1 of 4. Sum Year 1 Cost = $31,600,000. Total Project Cost = $79,000,000
608809
LAWRENCE - NORTH ANDOVER - RESURFACING AND RELATED WORK ON ROUTE 114
$ 8,722,560
Qualitative
Qualitative De-crease in Emis-sions
$ 8,722,560
607737
AMESBURY- SALISBURY- TRAIL CONNECTOR @ I-95
$ 2,574,805
Quantified
3,972
Quantified De-crease in Emis-sions from Bi-cycle and Pe-destrian Infra-structure
$ 2,574,805
2018 Total GHG emissions 505,330
Page 34
Final FFYs 2018-2022 MVMPO TIP Appendix as Amended through November 2017 30
2019 Merrimack Valley Region MPO Transportation Improvement Program
Highway Projects GHG Tracking Summary Mass DOT/ FTA Project ID ▼
MassDOT/FTA Project De-scription ▼
Total Pro-grammed Funds ▼
GHG Analysis Type ▼
GHG CO2
Impact(kg/yr) ▼
GHG Impact Description ▼
Total Cost ▼
Additional Information▼
602418
AMESBURY- RECONSTRUCTION OF ELM STREET
$ 7,207,810
Quantified
Quantified De-crease in Emis-sions from Com-plete Streets Pro-ject
$12,064,000
AC yr 1 of 2. Quantified de-crease in emis-sions shown in FFY 2020.
608298
GROVELAND- GROVELAND COMMUNITY TRAIL, FROM MAIN STREET TO KING STREET
$ 1,835,573
Quantified
2,710
Quantified De-crease in Emis-sions from Bi-cycle and Pe-destrian Infra-structure
$ 2,672,677
MV0001
FLEX TO FTA FOR MVRTA NEW BUS UPGRADE TO CLEANER FUEL BUSES
$ 698,541
Qualitative
Qualitative Decrease in Emissions
$ 698,541
Page 35
Final FFYs 2018-2022 MVMPO TIP Appendix as Amended through November 2017 31
-
2019 Merrimack Valley Region MPO Transportation Improvement Program
Highway Projects GHG Tracking Summary (Cont.) Mass DOT/ FTA Project ID ▼
MassDOT/FTA Project De-scription ▼
Total Pro-grammed Funds ▼
GHG Analysis Type ▼
GHG CO2
Impact(kg/yr) ▼
GHG Impact Description ▼
Total Cost ▼
Additional Information▼
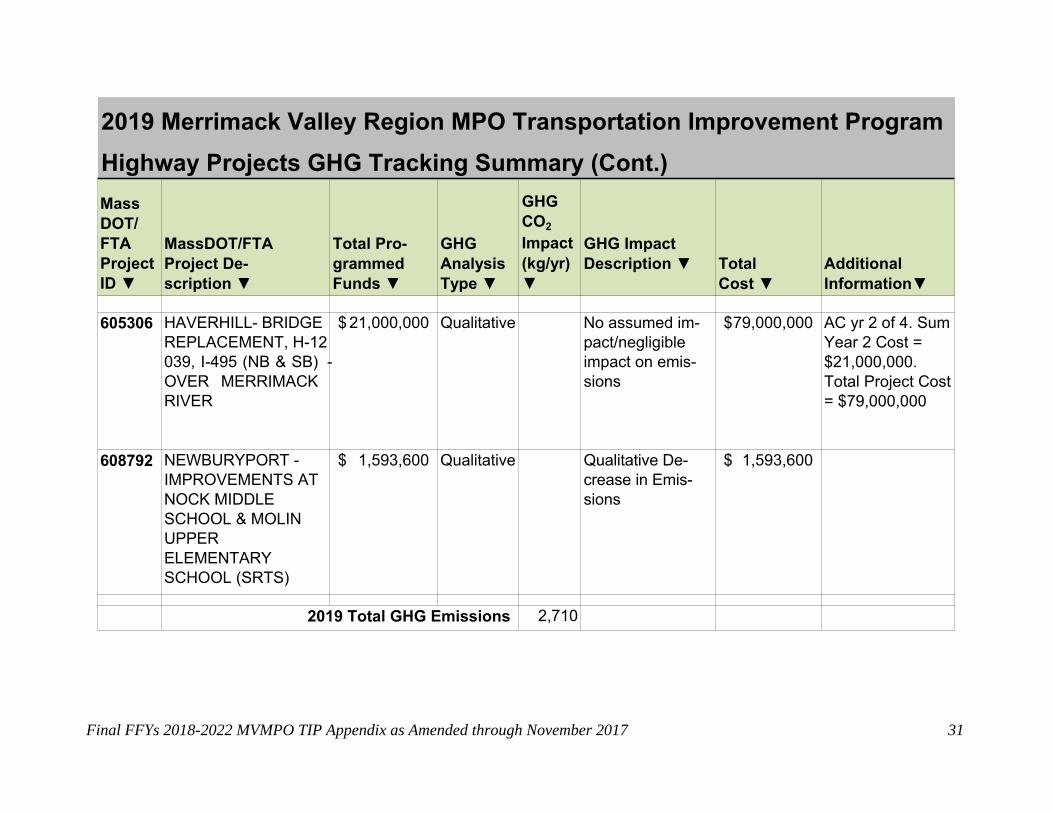
605306
HAVERHILL- BRIDGE REPLACEMENT, H-12039, I-495 (NB & SB) OVER MERRIMACK RIVER
$ 21,000,000
Qualitative
No assumed im-pact/negligible impact on emis-sions
$79,000,000
AC yr 2 of 4. SumYear 2 Cost = $21,000,000. Total Project Cost= $79,000,000
608792
NEWBURYPORT - IMPROVEMENTS AT NOCK MIDDLE SCHOOL & MOLIN UPPER ELEMENTARY SCHOOL (SRTS)
$ 1,593,600
Qualitative
Qualitative De-crease in Emis-sions
$ 1,593,600
2019 Total GHG Emissions 2,710
Page 36
Final FFYs 2018-2022 MVMPO TIP Appendix as Amended through November 2017 32
2020 Merrimack Valley Region MPO Transportation Improvement Program
Highway Projects GHG Tracking Summary Mass DOT/ FTA Project ID ▼
MassDOT/FTA Project De-scription ▼
Total Pro-grammed Funds ▼
GHG Analysis Type ▼
GHG CO2
Impact(kg/yr) ▼
GHG Impact Description ▼
Total Cost ▼
Additional Information▼
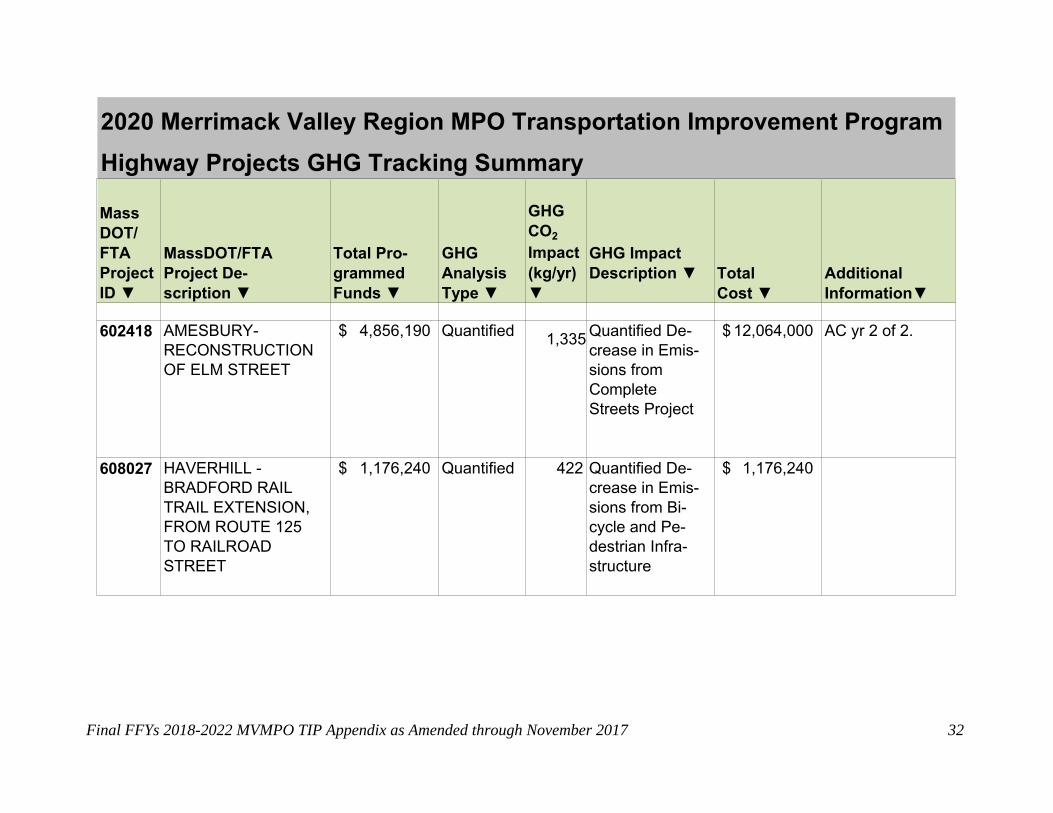
602418
AMESBURY- RECONSTRUCTION OF ELM STREET
$ 4,856,190
Quantified 1,335
Quantified De-crease in Emis-sions from Complete Streets Project
$ 12,064,000
AC yr 2 of 2.
608027
HAVERHILL - BRADFORD RAIL TRAIL EXTENSION, FROM ROUTE 125 TO RAILROAD STREET
$ 1,176,240
Quantified
422
Quantified De-crease in Emis-sions from Bi-cycle and Pe-destrian Infra-structure
$ 1,176,240
Page 37
Final FFYs 2018-2022 MVMPO TIP Appendix as Amended through November 2017 33
2020 Merrimack Valley Region MPO Transportation Improvement Program
Highway Projects GHG Tracking Summary (Cont.) Mass DOT/ FTA Project ID ▼
MassDOT/FTA Project De-scription ▼
Total Pro-grammed Funds ▼
GHG Analysis Type ▼
GHG CO2
Impact(kg/yr) ▼
GHG Impact Description ▼
Total Cost ▼
Additional Information▼
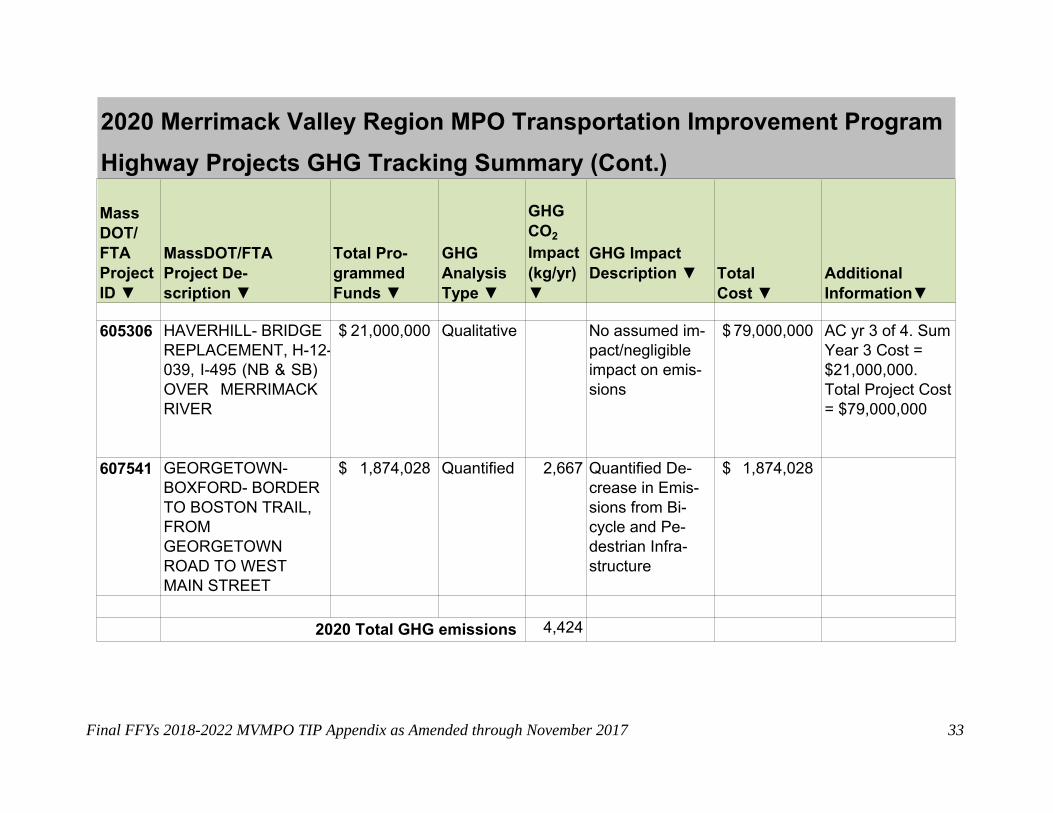
605306
HAVERHILL- BRIDGE REPLACEMENT, H-12-039, I-495 (NB & SB) OVER MERRIMACK RIVER
$ 21,000,000
Qualitative
No assumed im-pact/negligible impact on emis-sions
$ 79,000,000
AC yr 3 of 4. SumYear 3 Cost = $21,000,000. Total Project Cost= $79,000,000
607541
GEORGETOWN- BOXFORD- BORDER TO BOSTON TRAIL, FROM GEORGETOWN ROAD TO WEST MAIN STREET
$ 1,874,028
Quantified
2,667
Quantified De-crease in Emis-sions from Bi-cycle and Pe-destrian Infra-structure
$ 1,874,028
2020 Total GHG emissions 4,424
Page 38
Final FFYs 2018-2022 MVMPO TIP Appendix as Amended through November 2017 34
2021 Merrimack Valley Region MPO Transportation Improvement Program
Highway Projects GHG Tracking Summary
Mass DOT/ FTA Project ID ▼
MassDOT/FTA Project De-scription ▼
Total Pro-grammed Funds ▼
GHG Analysis Type ▼
GHG CO2
Impact (kg/yr) ▼
GHG Impact Description ▼
Total Cost ▼
Additional Information▼
605753
GROVELAND- RECONSTRUCTION OF ROUTE 97 (SCHOOL STREET) FROM PARKER STREET TO GARDNER STREET
$ 4,049,510
Qualitative
No assumed impact/negligibl e impact on emissions
$ 4,049,510
608095
NORTH ANDOVER- CORRIDOR IMPROVEMENTS ON ROUTE 114, BETWEEN ROUTE 125 (ANDOVER STREET) & STOP & SHOP DRIVEWAY
$ 6,290,405
Qualitative
Qualitative Decrease in Emissions
$ 16,816,717
Not yet enough information to generate an es-timate. AC Year 1 of 3.
Page 39
Final FFYs 2018-2022 MVMPO TIP Appendix as Amended through November 2017 35
2021 Merrimack Valley Region MPO Transportation Improvement Program
Highway Projects GHG Tracking Summary (Cont.)
Mass DOT/ FTA Project ID ▼
MassDOT/FTA Project De-scription ▼
Total Pro-grammed Funds ▼
GHG Analysis Type ▼
GHG CO2
Impact (kg/yr) ▼
GHG Impact Description ▼
Total Cost ▼
Additional Information▼
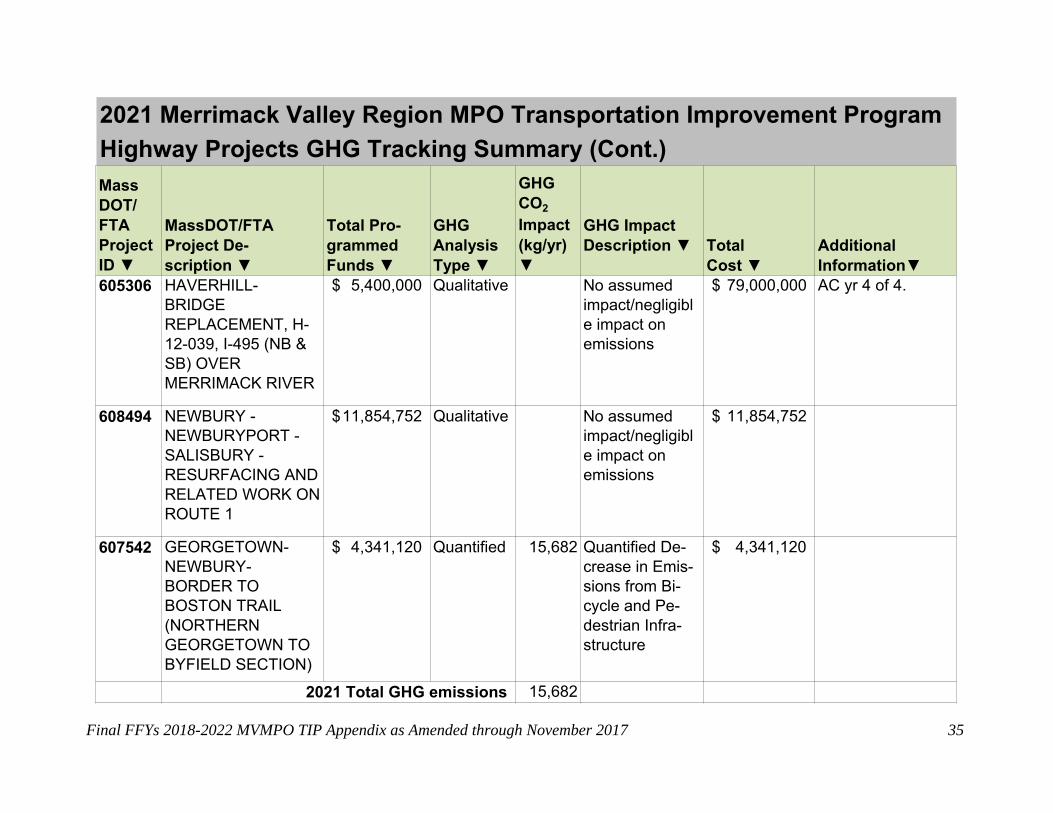
605306
HAVERHILL- BRIDGE REPLACEMENT, H- 12-039, I-495 (NB & SB) OVER MERRIMACK RIVER
$ 5,400,000
Qualitative
No assumed impact/negligibl e impact on emissions
$ 79,000,000
AC yr 4 of 4.
608494
NEWBURY - NEWBURYPORT - SALISBURY - RESURFACING AND RELATED WORK ON ROUTE 1
$ 11,854,752
Qualitative
No assumed impact/negligibl e impact on emissions
$ 11,854,752
607542
GEORGETOWN- NEWBURY- BORDER TO BOSTON TRAIL (NORTHERN GEORGETOWN TO BYFIELD SECTION)
$ 4,341,120
Quantified
15,682
Quantified De-crease in Emis-sions from Bi-cycle and Pe-destrian Infra-structure
$ 4,341,120
2021 Total GHG emissions 15,682
Page 40
Final FFYs 2018-2022 MVMPO TIP Appendix as Amended through November 2017 36
2022 Merrimack Valley Region MPO Transportation Improvement Program
Highway Projects GHG Tracking Summary Mass DOT/ FTA Project ID ▼
MassDOT/FTA Project De-scription ▼
Total Pro-grammed Funds ▼
GHG Analysis Type ▼
GHG CO2
Impact (kg/yr) ▼
GHG Im-pact De-scription ▼
Total Cost ▼
Additional Information▼
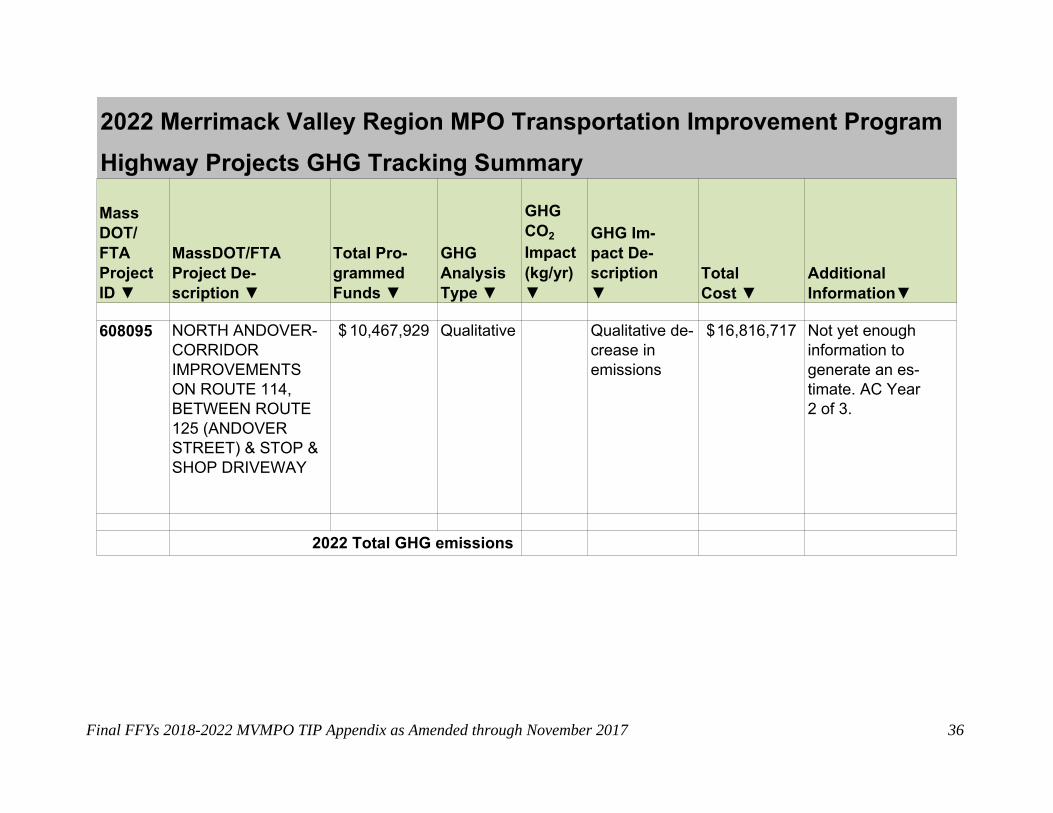
608095
NORTH ANDOVER- CORRIDOR IMPROVEMENTS ON ROUTE 114, BETWEEN ROUTE 125 (ANDOVER STREET) & STOP & SHOP DRIVEWAY
$ 10,467,929
Qualitative
Qualitative de-crease in emissions
$ 16,816,717
Not yet enough information to generate an es-timate. AC Year 2 of 3.
2022 Total GHG emissions
Page 41
Final FFYs 2018-2022 MVMPO TIP Appendix as Amended through November 2017 37
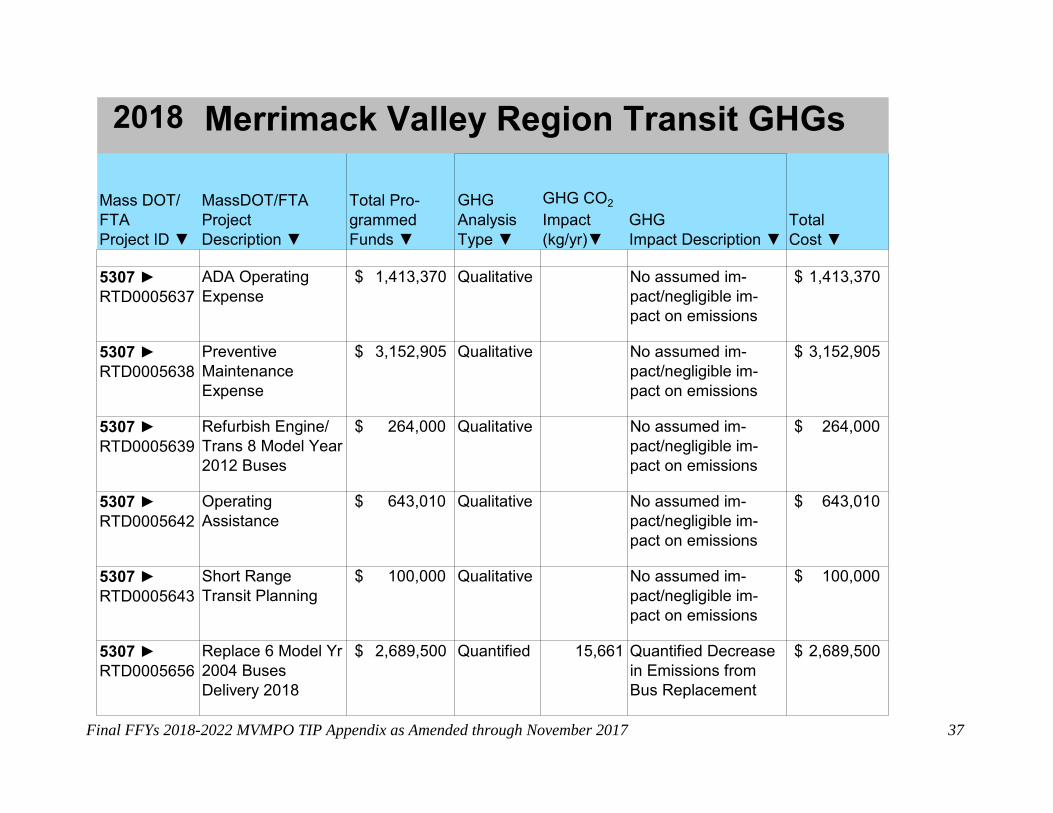
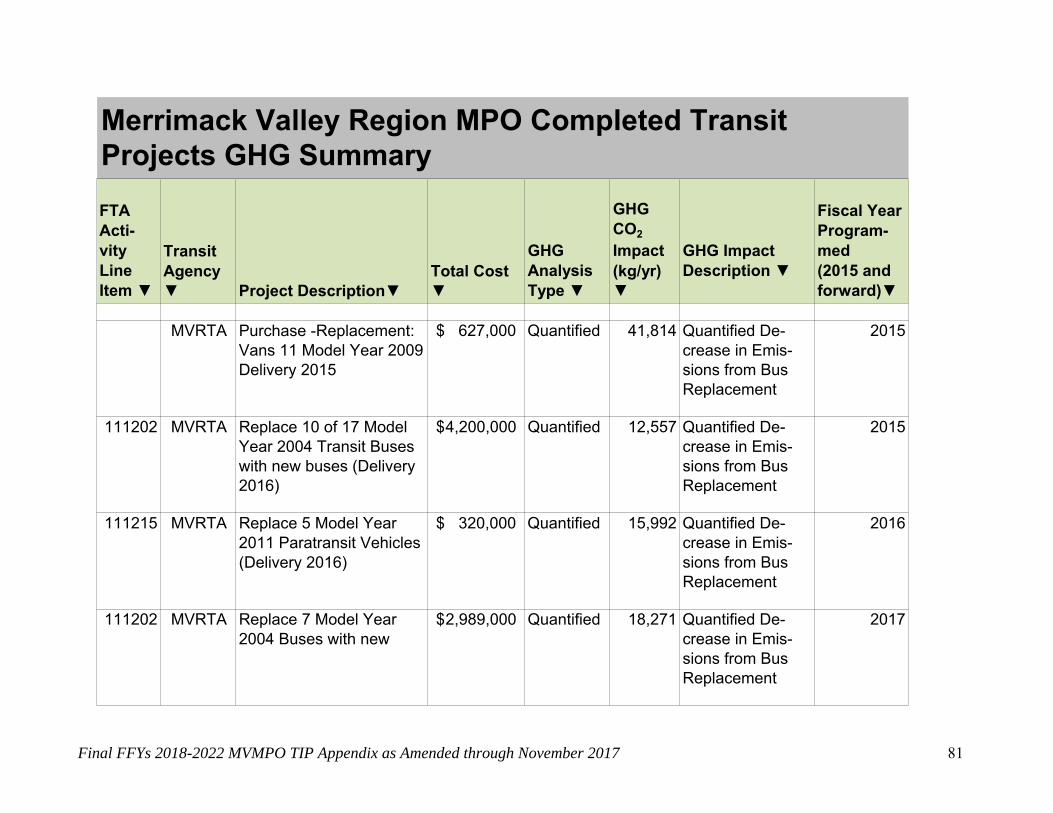
2018 Merrimack Valley Region Transit GHGs Mass DOT/ MassDOT/FTA FTA Project Project ID ▼ Description ▼
Total Pro-grammed Funds ▼
GHG GHG CO2
Analysis Impact GHG Type ▼ (kg/yr)▼ Impact Description ▼
Total Cost ▼
5307 ► RTD0005637
ADA Operating Expense
$ 1,413,370
Qualitative
No assumed im-pact/negligible im-pact on emissions
$ 1,413,370
5307 ► RTD0005638
Preventive Maintenance Expense
$ 3,152,905
Qualitative
No assumed im-pact/negligible im-pact on emissions
$ 3,152,905
5307 ► RTD0005639
Refurbish Engine/ Trans 8 Model Year2012 Buses
$ 264,000
Qualitative
No assumed im-pact/negligible im-pact on emissions
$ 264,000
5307 ► RTD0005642
Operating Assistance
$ 643,010
Qualitative
No assumed im-pact/negligible im-pact on emissions
$ 643,010
5307 ► RTD0005643
Short Range Transit Planning
$ 100,000
Qualitative
No assumed im-pact/negligible im-pact on emissions
$ 100,000
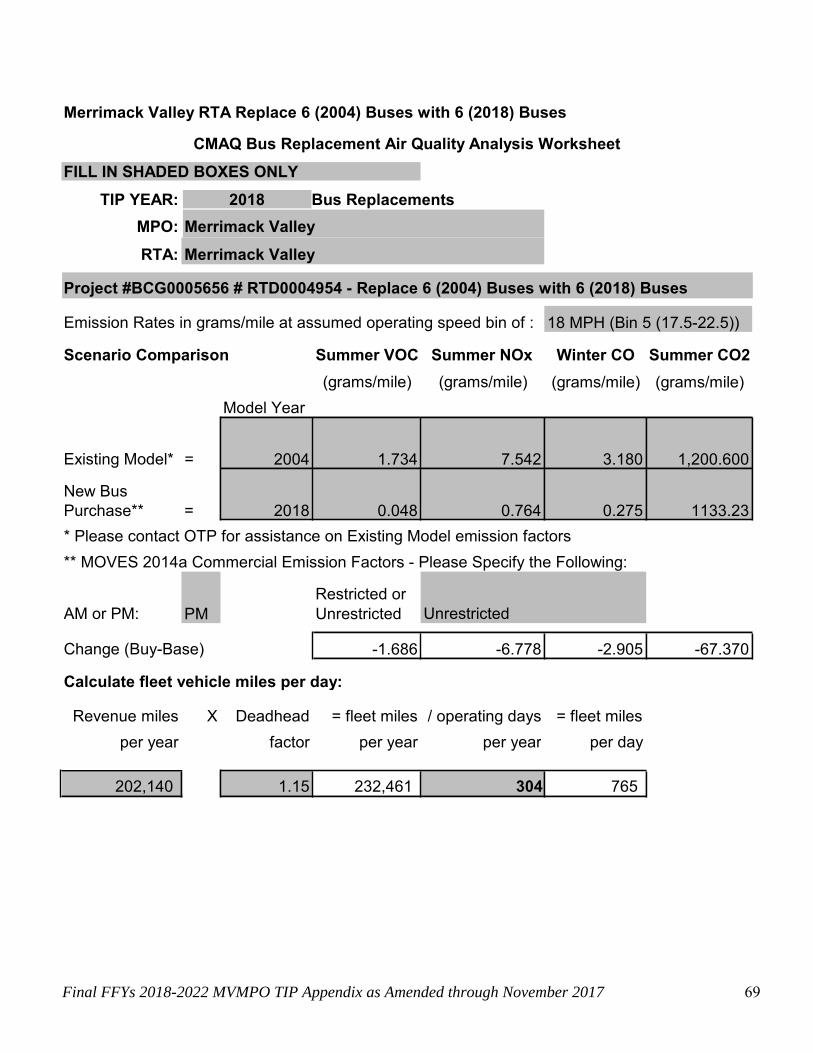
5307 ► RTD0005656
Replace 6 Model Yr2004 Buses Delivery 2018
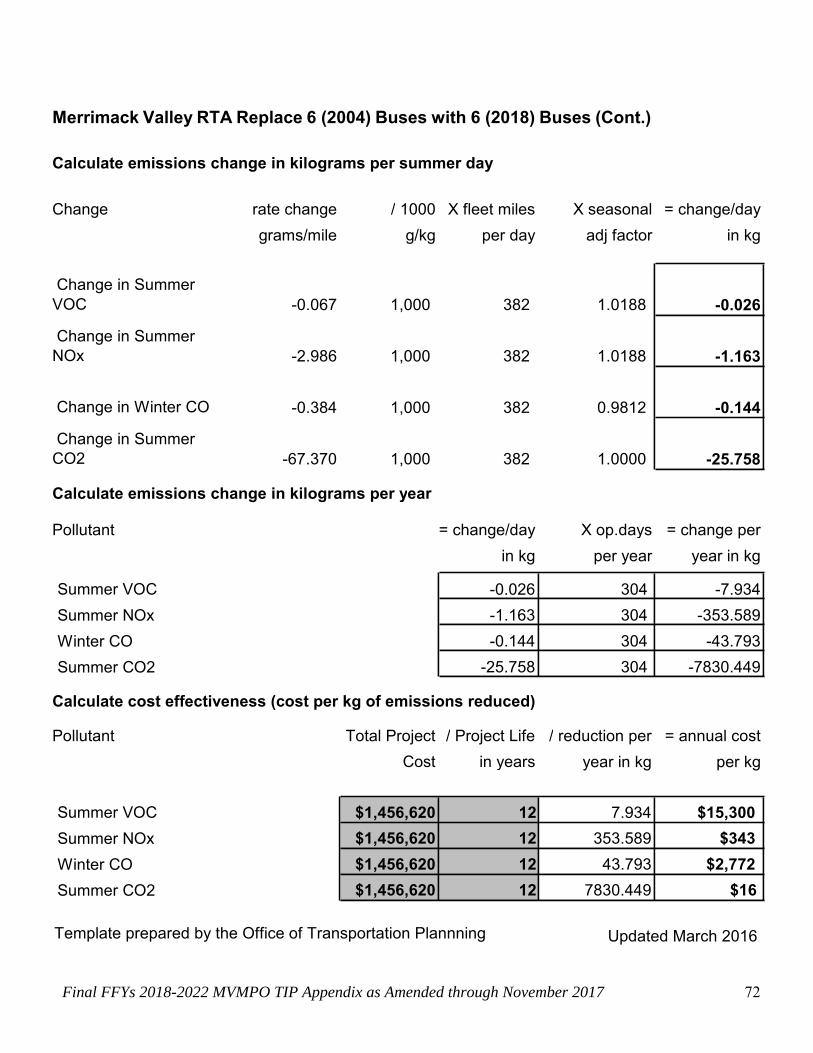
$ 2,689,500
Quantified
15,661
Quantified Decrease in Emissions from Bus Replacement
$ 2,689,500
Page 42
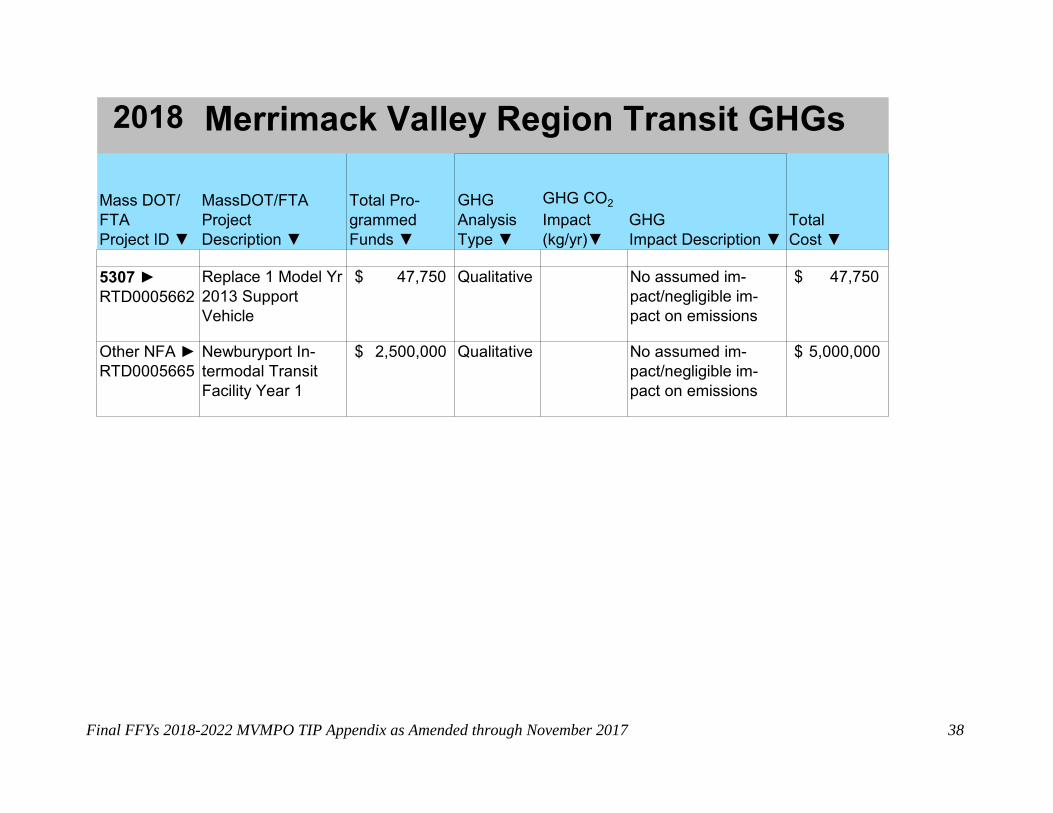
Final FFYs 2018-2022 MVMPO TIP Appendix as Amended through November 2017 38
2018 Merrimack Valley Region Transit GHGs Mass DOT/ MassDOT/FTA FTA Project Project ID ▼ Description ▼
Total Pro-grammed Funds ▼
GHG GHG CO2
Analysis Impact GHG Type ▼ (kg/yr)▼ Impact Description ▼
Total Cost ▼
5307 ► RTD0005662
Replace 1 Model Yr2013 Support Vehicle
$ 47,750
Qualitative
No assumed im-pact/negligible im-pact on emissions
$ 47,750
Other NFA ► RTD0005665
Newburyport In-termodal Transit Facility Year 1
$ 2,500,000
Qualitative
No assumed im-pact/negligible im-pact on emissions
$ 5,000,000
Page 43
Final FFYs 2018-2022 MVMPO TIP Appendix as Amended through November 2017 39
2019 Merrimack Valley Region Transit GHGs
MassDOT/ FTA Project ID ▼
MassDOT/FTA Project De-scription ▼
Total Pro-grammed Funds ▼
GHG Analysis Type ▼
GHG CO2
Impact (kg/yr)▼
GHG Impact Description ▼
Total Cost ▼
5307 ► RTD0005640
Preventive Maintenance Expense
$ 3,250,095
Qualitative
No assumed im-pact/negligible im-pact on emissions
$ 3,250,095
5307 ► RTD0005641
ADA Operating Expense
$ 1,456,420
Qualitative
No assumed im-pact/negligible im-pact on emissions
$ 1,456,420
5307 ► RTD0005644
Short Range TransitPlanning
$ 100,000
Qualitative
No assumed im-pact/negligible im-pact on emissions
$ 100,000
5307 ► RTD0005645
Operating Assistance FY 2020
$ 780,250
Qualitative
No assumed im-pact/negligible im-pact on emissions
$ 780,250
5307 ► RTD0005657
Purchase 3 new 35' buses delivery 2019
$ 1,344,750
Qualitative
No assumed im-pact/negligible im-pact on emissions
$ 1,344,750
Page 44
Final FFYs 2018-2022 MVMPO TIP Appendix as Amended through November 2017 40
2019 Merrimack Valley Region Transit GHGs
MassDOT/ FTA Project ID ▼
MassDOT/FTA Project De-scription ▼
Total Pro-grammed Funds ▼
GHG Analysis Type ▼
GHG CO2
Impact (kg/yr)▼
GHG Impact Description ▼
Total Cost ▼
5307 ► RTD0005663
Replace 1 Model Yr2013 Support Vehicle
$ 49,000
Qualitative
No assumed im-pact/negligible im-pact on emissions
$ 49,000
Other NFA ► RTD0006082
Newburyport In-termodal Transit Facility Year 2
$ 2,500,000
Qualitative
No assumed im-pact/negligible im-pact on emissions
$ 5,000,000
Page 45
Final FFYs 2018-2022 MVMPO TIP Appendix as Amended through November 2017 41
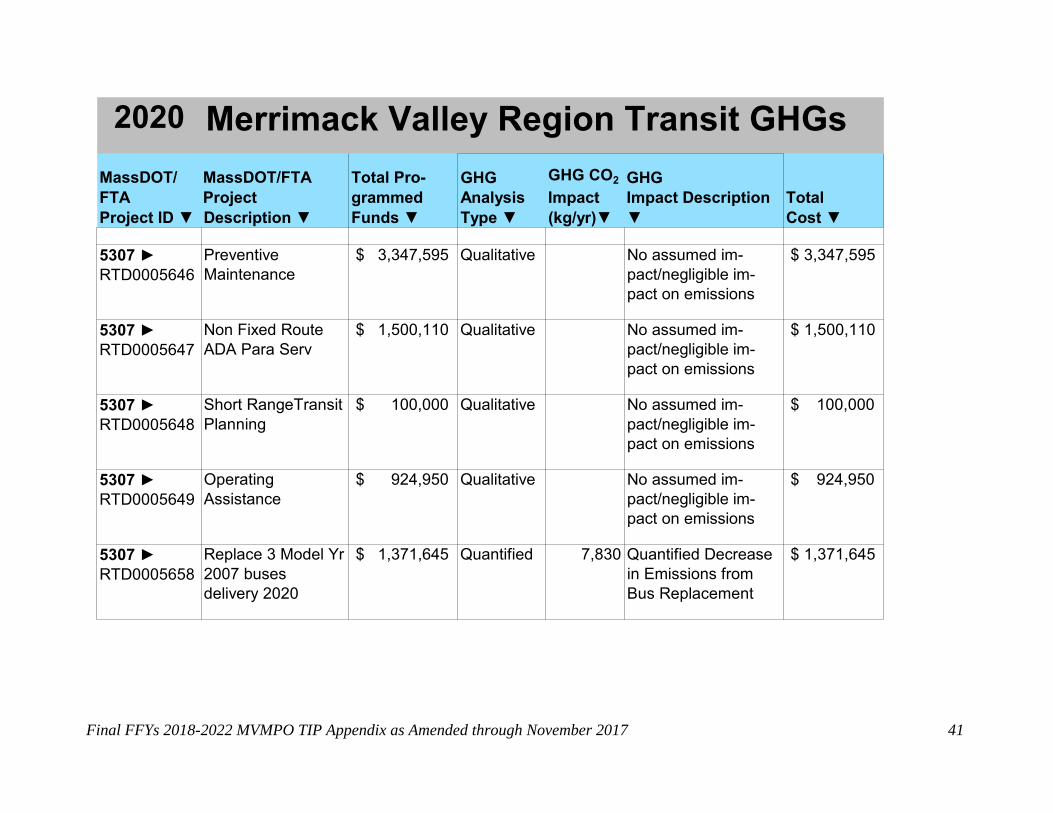
2020 Merrimack Valley Region Transit GHGs MassDOT/ MassDOT/FTA FTA Project Project ID ▼ Description ▼
Total Pro-grammed Funds ▼
GHG GHG CO2 GHG Analysis Impact Impact Description Type ▼ (kg/yr)▼ ▼
Total Cost ▼
5307 ► RTD0005646
Preventive Maintenance
$ 3,347,595
Qualitative
No assumed im-pact/negligible im-pact on emissions
$ 3,347,595
5307 ► RTD0005647
Non Fixed Route ADA Para Serv
$ 1,500,110
Qualitative
No assumed im-pact/negligible im-pact on emissions
$ 1,500,110
5307 ► RTD0005648
Short RangeTransitPlanning
$ 100,000
Qualitative
No assumed im-pact/negligible im-pact on emissions
$ 100,000
5307 ► RTD0005649
Operating Assistance
$ 924,950
Qualitative
No assumed im-pact/negligible im-pact on emissions
$ 924,950
5307 ► RTD0005658
Replace 3 Model Yr2007 buses delivery 2020
$ 1,371,645
Quantified
7,830
Quantified Decrease in Emissions from Bus Replacement
$ 1,371,645
Page 46
Final FFYs 2018-2022 MVMPO TIP Appendix as Amended through November 2017 42
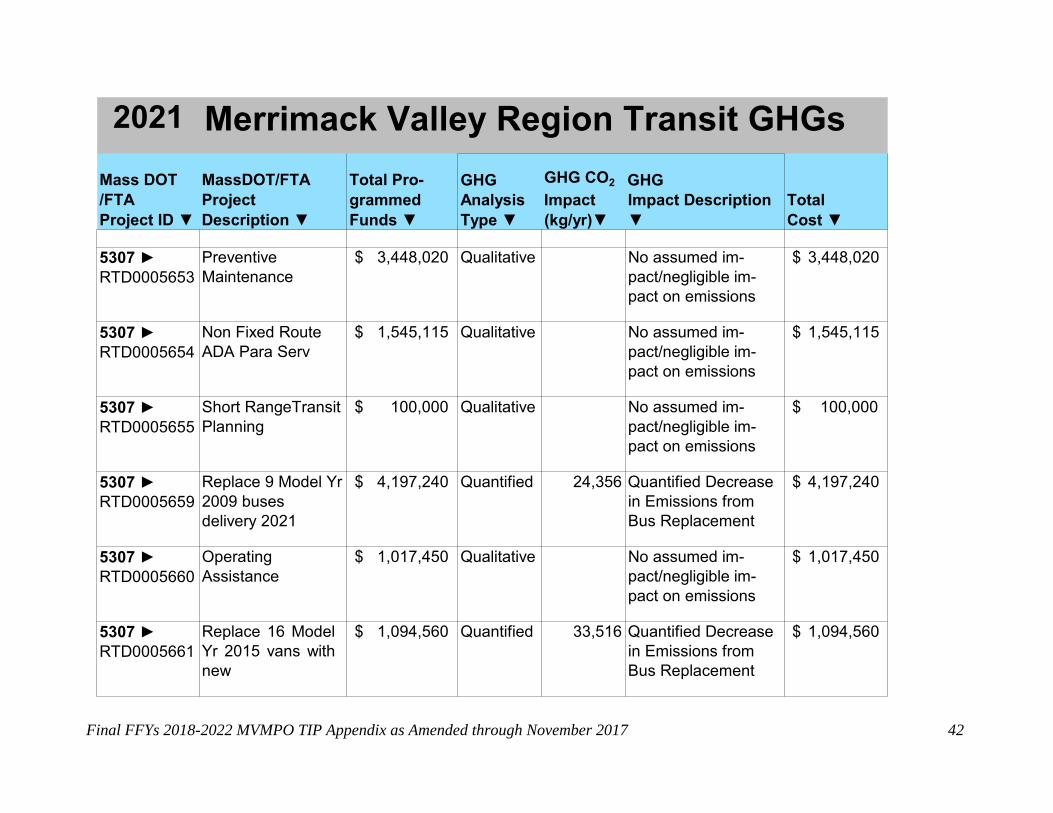
2021 Merrimack Valley Region Transit GHGs Mass DOT MassDOT/FTA /FTA Project Project ID ▼ Description ▼
Total Pro-grammed Funds ▼
GHG GHG CO2 GHG Analysis Impact Impact Description Type ▼ (kg/yr)▼ ▼
Total Cost ▼
5307 ► RTD0005653
Preventive Maintenance
$ 3,448,020
Qualitative
No assumed im-pact/negligible im-pact on emissions
$ 3,448,020
5307 ► RTD0005654
Non Fixed Route ADA Para Serv
$ 1,545,115
Qualitative
No assumed im-pact/negligible im-pact on emissions
$ 1,545,115
5307 ► RTD0005655
Short RangeTransitPlanning
$ 100,000
Qualitative
No assumed im-pact/negligible im-pact on emissions
$ 100,000
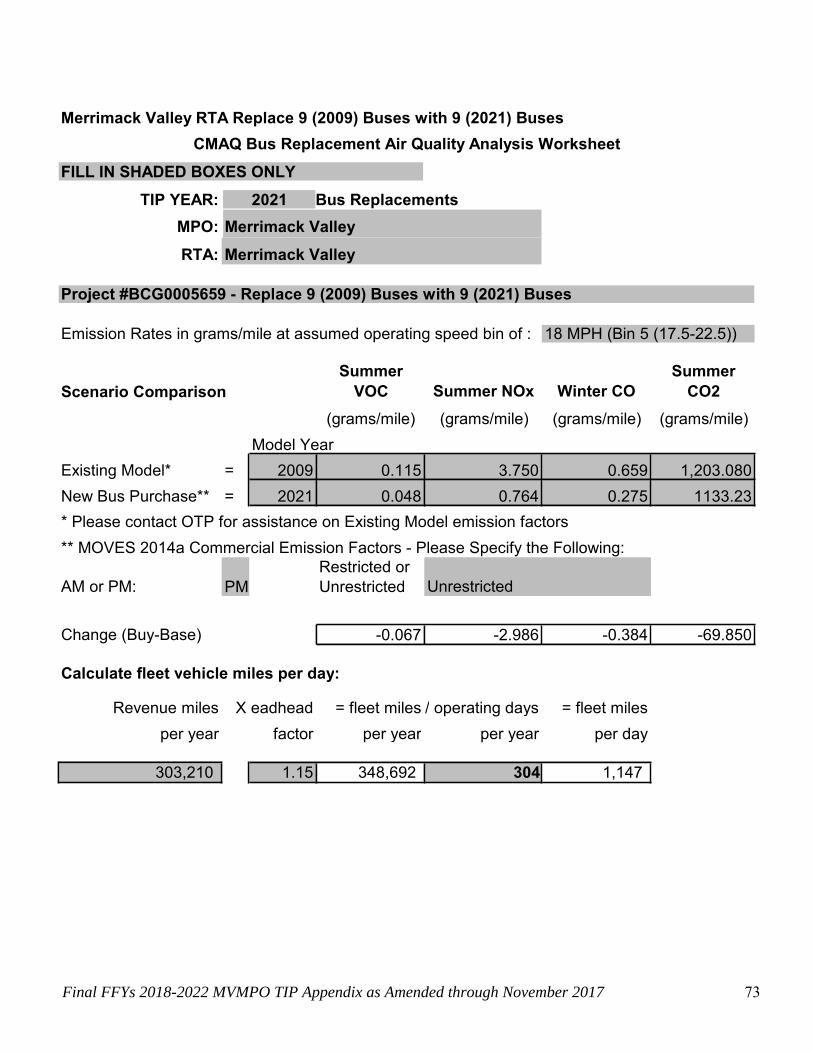
5307 ► RTD0005659
Replace 9 Model Yr2009 buses delivery 2021
$ 4,197,240
Quantified
24,356
Quantified Decrease in Emissions from Bus Replacement
$ 4,197,240
5307 ► RTD0005660
Operating Assistance
$ 1,017,450
Qualitative
No assumed im-pact/negligible im-pact on emissions
$ 1,017,450
5307 ► RTD0005661
Replace 16 Model Yr 2015 vans with new
$ 1,094,560
Quantified
33,516
Quantified Decrease in Emissions from Bus Replacement
$ 1,094,560
Page 47
Final FFYs 2018-2022 MVMPO TIP Appendix as Amended through November 2017 43
2022 Merrimack Valley Region Transit GHGs
MassDOT/ MassDOT/FTA FTA Project Project ID ▼ Description ▼
Total Pro-grammed Funds ▼
GHG GHG CO2 GHG Analysis Impact Impact Description Type ▼ (kg/yr)▼ ▼
Total Cost ▼
5307 ► RTD0006084
Preventive Maintenance
$ 3,551,455
Qualitative
No assumed im-pact/negligible im-pact on emissions
$ 3,551,455
5307 ► RTD0006085
Non Fixed Route ADA Para Serv
$ 1,591,460
Qualitative
No assumed im-pact/negligible im-pact on emissions
$ 1,591,460
5307 ► RTD0006086
Short RangeTransitPlanning
$ 100,000
Qualitative
No assumed im-pact/negligible im-pact on emissions
$ 100,000
5307 ► RTD0006087
Operating Assistance
$ 1,047,970
Qualitative
No assumed im-pact/negligible im-pact on emissions
$ 1,047,970
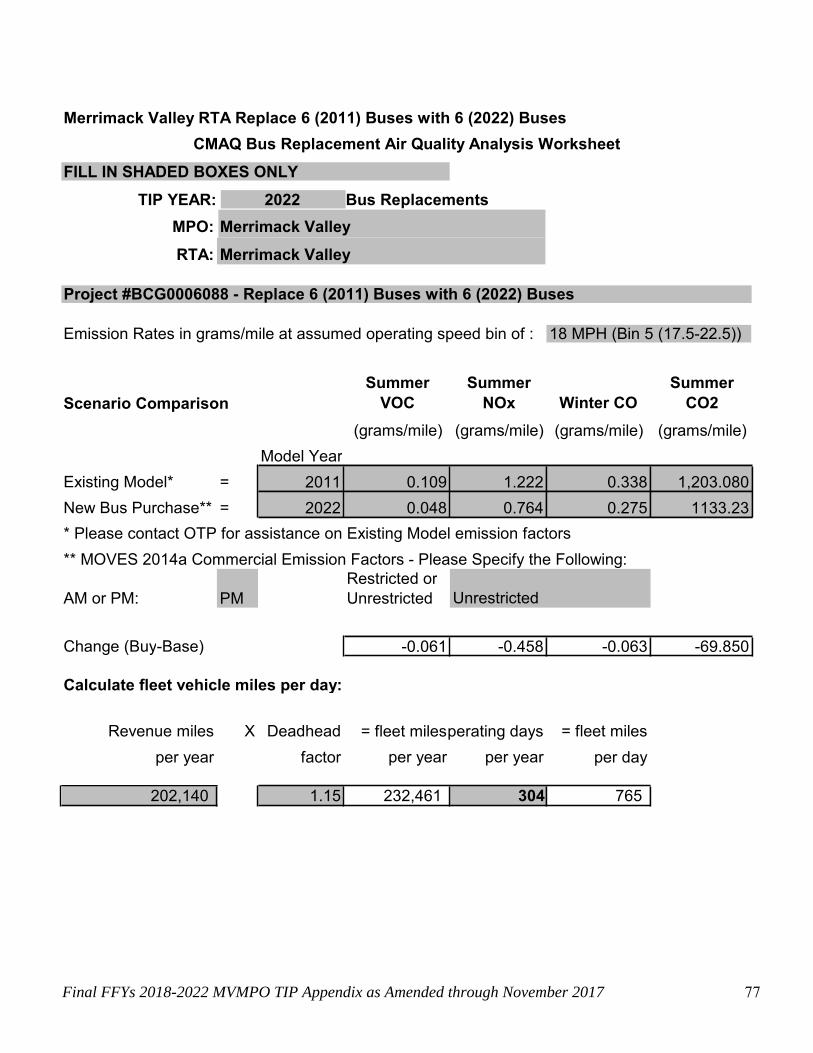
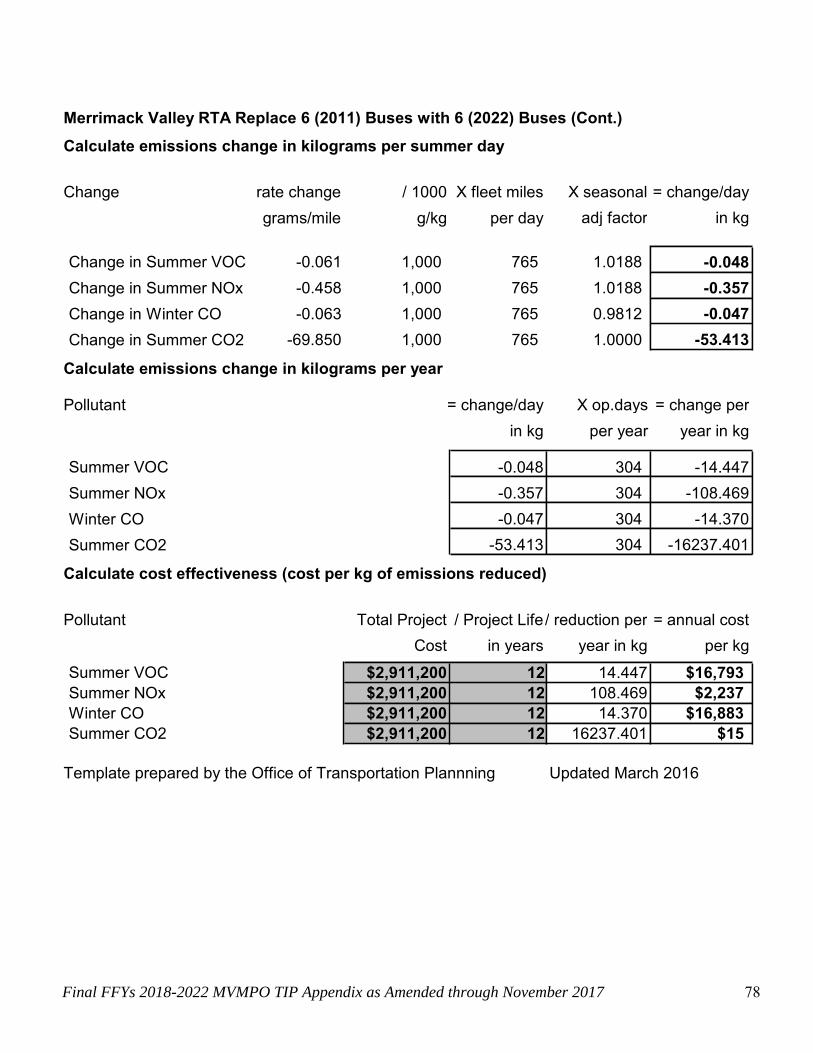
5307 ► RTD0006088
Replace 6 Model Yr2011 buses delivery 2023
$ 2,911,200
Quantified
16,237
Quantified Decrease in Emissions from Bus Replacement
$ 2,911,200
Page 48
Final FFYs 2018-2022 MVMPO TIP Appendix as Amended through November 2017 44
Amesbury Reconstruction of Elm Street CMAQ Air Quality Analysis
CMAQ Air Quality Analysis Worksheet for Complete Streets Project
TIP YEAR:
MPO:
Project:
2019
Merrimack Valley Municipality: Amesbury
# 602418 Reconstruction of Elm Street
Step 1: Calculate New Walk and Bike Miles Traveled:
If VMT reduction per year is known then go to Step 2B, if not proceed with Step 1 :User Input
(blank for default) Default A.
B
B.
C.
D.
E.
F.
G.
H.
I.
J.
K.
L.
Facility Length (L):
Types of Improvements Implemented:
Service Area Radius for Bicycling (RB):
Service Area Radius for Walking (RW):
Service Area of Community(ies) for Bicycling (SAB):
Service Area of Community(ies) for Walking (SAW):
Land Area of Neighborhoods Served (AN): Popula-
tion of Neighborhoods Served (PN):
Population Density of Neighborhoods Served (PD):
Miles
(select Pedestrian, Bicycle, or Both)
0.5
0.25
1.13
0.565
Miles
Miles
Sq. Miles
Sq. Miles
Sq. Miles
Persons
0.5
0.25
L * 2RB = SAB
L * 2RW = SAW
637
720
360
4.7
0.6%
Persons/Sq. Mile
Persons
Persons
Population Served by Facility for Bicycling (PB):
Population Served by Facility for Walking (PW):
Trips per Person per Day in Service Area (T):
PD * SAB = PB
PD * SAW = PW
Trips
Percent
4.7
Baseline Bicycle Mode Share in Service Area (MSB):
7,137
11.2
Both
1.1
FILL IN SHADED BOXES ONLY
Page 49
Final FFYs 2018-2022 MVMPO TIP Appendix as Amended through November 2017 45
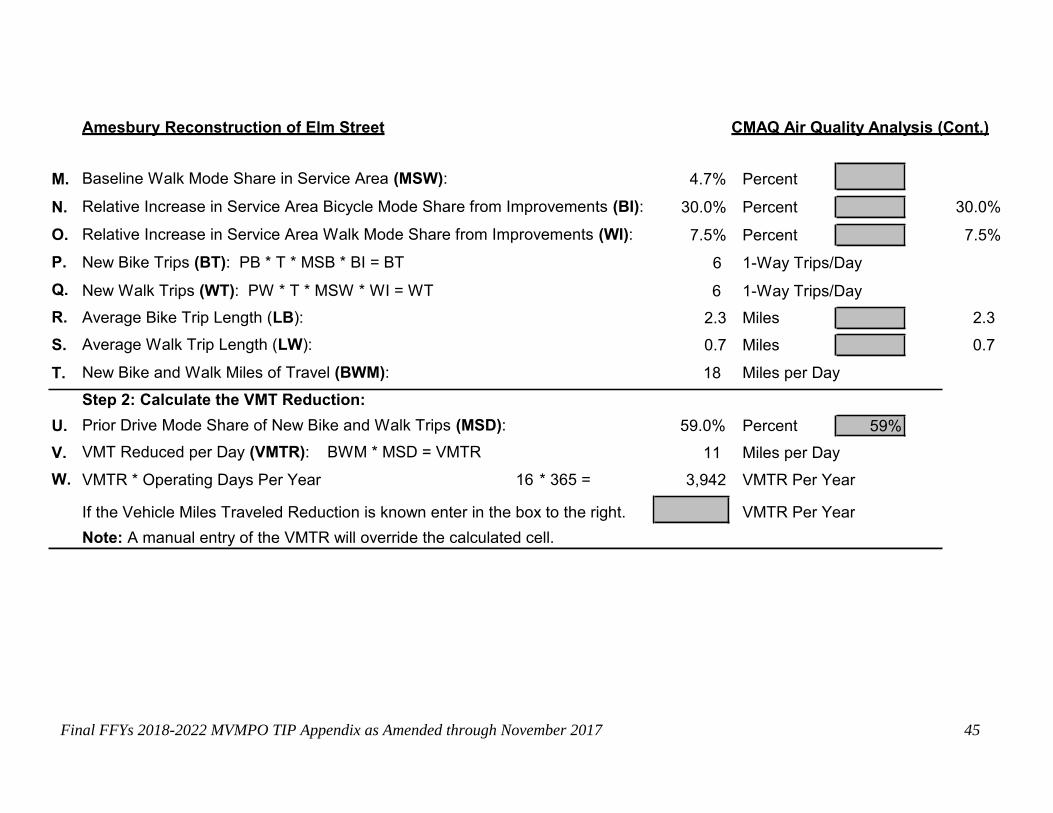
Amesbury Reconstruction of Elm Street CMAQ Air Quality Analysis (Cont.)
M.
N.
O.
P.
Q.
R.
S.
T.
Baseline Walk Mode Share in Service Area (MSW):
Relative Increase in Service Area Bicycle Mode Share from Improvements (BI):
Relative Increase in Service Area Walk Mode Share from Improvements (WI):
New Bike Trips (BT): PB * T * MSB * BI = BT
New Walk Trips (WT): PW * T * MSW * WI = WT
Average Bike Trip Length (LB):
Average Walk Trip Length (LW):
New Bike and Walk Miles of Travel (BWM):
4.7%
30.0%
7.5%
6
6
2.3
0.7
18
Percent
Percent
Percent
30.0%
7.5%
1-Way Trips/Day
1-Way Trips/Day
Miles
Miles
2.3
0.7
Miles per Day
Step 2: Calculate the VMT Reduction:
Prior Drive Mode Share of New Bike and Walk Trips (MSD):U.
V.
W.
59.0%
11
3,942
Percent
VMT Reduced per Day (VMTR):
VMTR * Operating Days Per Year
BWM * MSD = VMTR Miles per Day
VMTR Per Year16 * 365 =
If the Vehicle Miles Traveled Reduction is known enter in the box to the right.
Note: A manual entry of the VMTR will override the calculated cell.
VMTR Per Year
59%
Page 50
Final FFYs 2018-2022 MVMPO TIP Appendix as Amended through November 2017 46
Amesbury Reconstruction of Elm Street CMAQ Air Quality Analysis (Cont.)
Step 3: MOVES 2014a Emission Factors for Unrestricted PM:
Note: Use 35 MPH as a default if average speed is not known. Speed Used:
2020 Passenger
Summer VOC Factor
grams/mile
2020 Passenger
Summer NOx Factor
grams/mile
2020 Passenger
Summer CO Factor
grams/mile
2020 Passenger
Summer CO2 Factor
grams/mile
Step 4: Calculate emissions reductions in kilograms per year (Seasonally Adjusted):
Summer VOC Summer NOx Summer CO Summer CO2
Step 5: Calculate cost effectiveness (first year cost per kg of emissions reduced)
Project
Cost
Emission Reduction
in kg per year
0.1 =
0.3 =
8.4 =
1,335.5 =
First year cost
per kilogram
$8,355,241
$3,058,798
$118,866
$749
Emission
Summer VOC
Summer NOx
Summer CO
Summer CO2
/
/
/
/
$1,000,000
$1,000,000
$1,000,000
Spreadsheet Template Prepared by Office of Transportation Planning Updated March 2016
$1,000,000
1,335.5 8.4 0.3 0.1
0.030
0.081 2.095 338.769
Eastern35 MPH
Page 51
Final FFYs 2018-2022 MVMPO TIP Appendix as Amended through November 2017 47
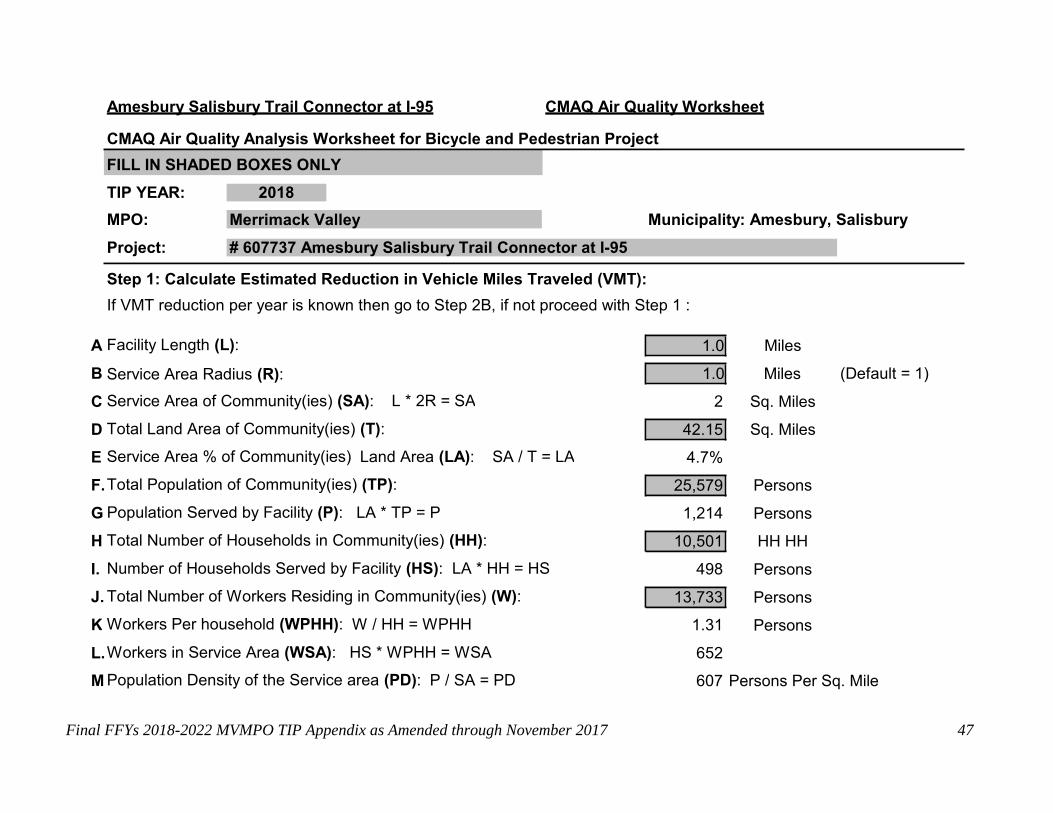
Amesbury Salisbury Trail Connector at I-95 CMAQ Air Quality Worksheet
CMAQ Air Quality Analysis Worksheet for Bicycle and Pedestrian Project
TIP YEAR:
MPO:
Project:
2018
Merrimack Valley Municipality: Amesbury, Salisbury
# 607737 Amesbury Salisbury Trail Connector at I-95
Step 1: Calculate Estimated Reduction in Vehicle Miles Traveled (VMT):
If VMT reduction per year is known then go to Step 2B, if not proceed with Step 1 :
A Facility Length (L):
B Service Area Radius (R):
C Service Area of Community(ies) (SA):
D Total Land Area of Community(ies) (T):
Miles
Miles
Sq. Miles
Sq. Miles
(Default = 1)
L * 2R = SA 2
E Service Area % of Community(ies) Land Area (LA): SA / T = LA 4.7%
F. Total Population of Community(ies) (TP): Persons
Persons
HH HH
Persons
Persons
Persons
G Population Served by Facility (P): LA * TP = P 1,214
H Total Number of Households in Community(ies) (HH):
I. Number of Households Served by Facility (HS): LA * HH = HS 498
J. Total Number of Workers Residing in Community(ies) (W):
K Workers Per household (WPHH):
L. Workers in Service Area (WSA):
W / HH = WPHH
HS * WPHH = WSA
1.31
652
M Population Density of the Service area (PD): P / SA = PD 607 Persons Per Sq. Mile
13,733
10,501
25,579
42.15
1.0
1.0
FILL IN SHADED BOXES ONLY
Page 52
Final FFYs 2018-2022 MVMPO TIP Appendix as Amended through November 2017 48
Amesbury Salisbury Trail Connector at I-95 CMAQ Air Quality Worksheet (Cont.)
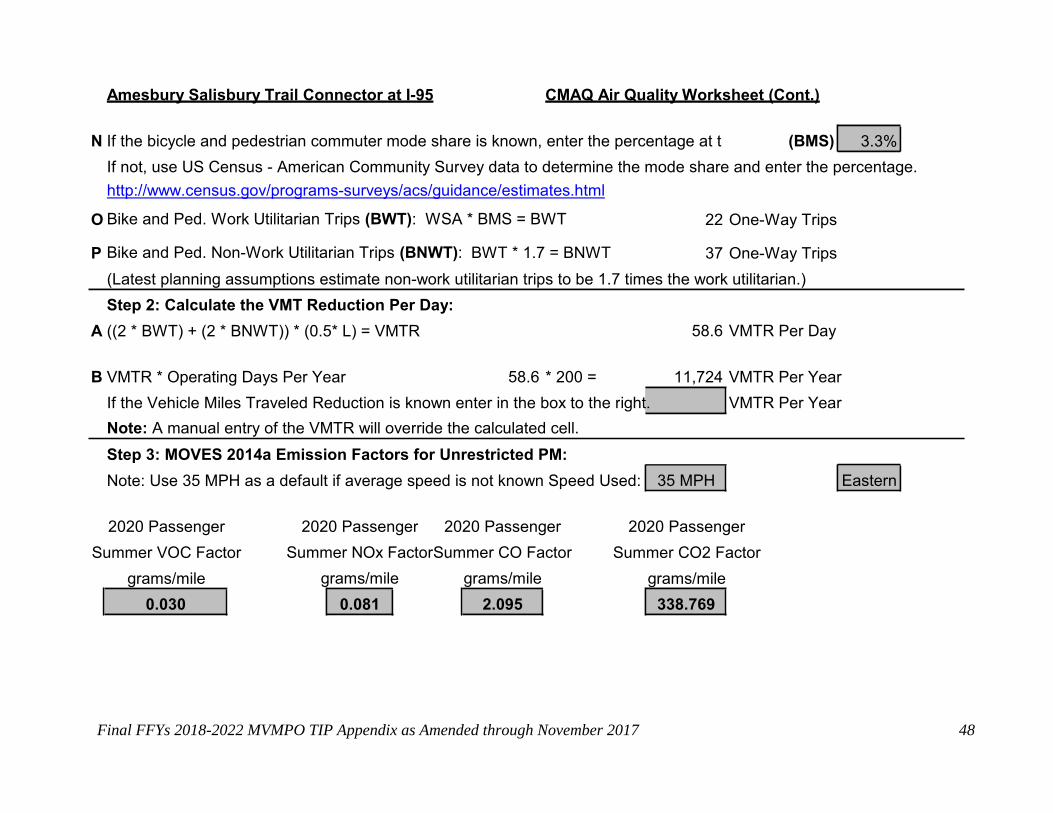
N If the bicycle and pedestrian commuter mode share is known, enter the percentage at t (BMS)
If not, use US Census - American Community Survey data to determine the mode share and enter the percentage.
http://www.census.gov/programs-surveys/acs/guidance/estimates.html
O Bike and Ped. Work Utilitarian Trips (BWT): WSA * BMS = BWT 22 One-Way Trips
P Bike and Ped. Non-Work Utilitarian Trips (BNWT): BWT * 1.7 = BNWT 37 One-Way Trips
(Latest planning assumptions estimate non-work utilitarian trips to be 1.7 times the work utilitarian.)
Step 2: Calculate the VMT Reduction Per Day:
A ((2 * BWT) + (2 * BNWT)) * (0.5* L) = VMTR 58.6 VMTR Per Day
B VMTR * Operating Days Per Year 58.6 * 200 = 11,724 VMTR Per Year
If the Vehicle Miles Traveled Reduction is known enter in the box to the right. VMTR Per Year
Note: A manual entry of the VMTR will override the calculated cell.
Step 3: MOVES 2014a Emission Factors for Unrestricted PM:
Note: Use 35 MPH as a default if average speed is not known Speed Used:
2020 Passenger
Summer VOC Factor
grams/mile
2020 Passenger 2020 Passenger 2020 Passenger
Summer CO2 Factor
grams/mile
Summer NOx FactorSummer CO Factor
grams/mile grams/mile
338.769 2.095 0.081 0.030
Eastern35 MPH
3.3%
Page 53
Final FFYs 2018-2022 MVMPO TIP Appendix as Amended through November 2017 49
Amesbury Salisbury Trail Connector at I-95 CMAQ Air Quality Worksheet (Cont.)
Step 4: Calculate emissions reductions in kilograms per year (Seasonally Adjusted):
Summer VOC Summer NOx Summer CO Summer CO2
Step 5: Calculate cost effectiveness (first year cost per kg of emissions reduced)
Project
Cost
Emission Reduction
in kg per year
0.4 =
1.0 =
25.0 =
3,971.6 =
First year cost
per kilogram
$7,523,308
$2,754,233
$107,030
$674
Emission
Summer VOC
Summer NOx
Summer CO
Summer CO2
/
/
/
/
Spreadsheet Template Prepared by Office of Transportation Planning Updated March 2016
$2,677,798
$2,677,798
$2,677,798
$2,677,798
3,971.6 25.0 1.0 0.4
Page 54
Final FFYs 2018-2022 MVMPO TIP Appendix as Amended through November 2017 50
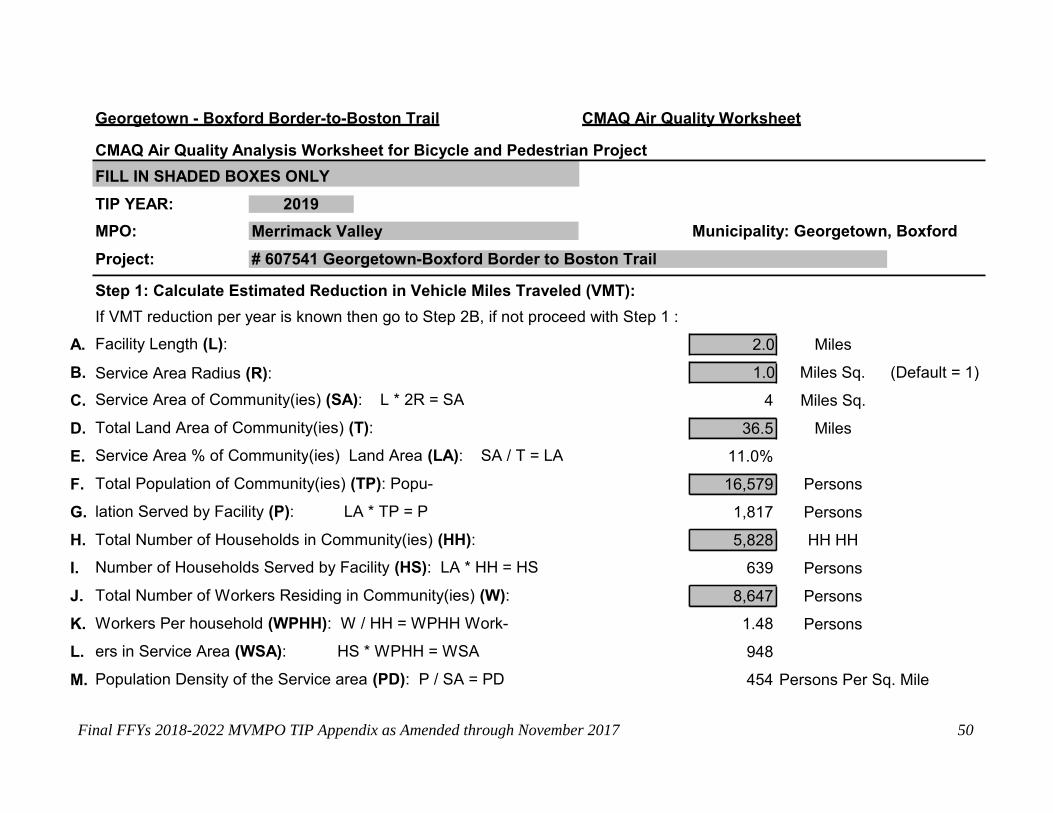
Georgetown - Boxford Border-to-Boston Trail CMAQ Air Quality Worksheet
CMAQ Air Quality Analysis Worksheet for Bicycle and Pedestrian Project
TIP YEAR:
MPO:
Project:
2019
Merrimack Valley Municipality: Georgetown, Boxford
# 607541 Georgetown-Boxford Border to Boston Trail
Step 1: Calculate Estimated Reduction in Vehicle Miles Traveled (VMT):
If VMT reduction per year is known then go to Step 2B, if not proceed with Step 1 :
Facility Length (L):
Service Area Radius (R):
A.
B.
C.
D.
E.
F.
G.
H.
I.
J.
K.
L.
M.
Miles
Miles Sq.
Miles Sq.
Miles
(Default = 1)
Service Area of Community(ies) (SA):
Total Land Area of Community(ies) (T):
L * 2R = SA 4
Service Area % of Community(ies) Land Area (LA):
Total Population of Community(ies) (TP): Popu-
lation Served by Facility (P): LA * TP = P
Total Number of Households in Community(ies) (HH):
SA / T = LA 11.0%
Persons
Persons
HH HH
Persons
Persons
Persons
1,817
Number of Households Served by Facility (HS): LA * HH = HS
Total Number of Workers Residing in Community(ies) (W):
Workers Per household (WPHH): W / HH = WPHH Work-
ers in Service Area (WSA): HS * WPHH = WSA
Population Density of the Service area (PD): P / SA = PD
639
1.48
948
454 Persons Per Sq. Mile
8,647
5,828
16,579
36.5
1.0
2.0
FILL IN SHADED BOXES ONLY
Page 55
Final FFYs 2018-2022 MVMPO TIP Appendix May 2017 51
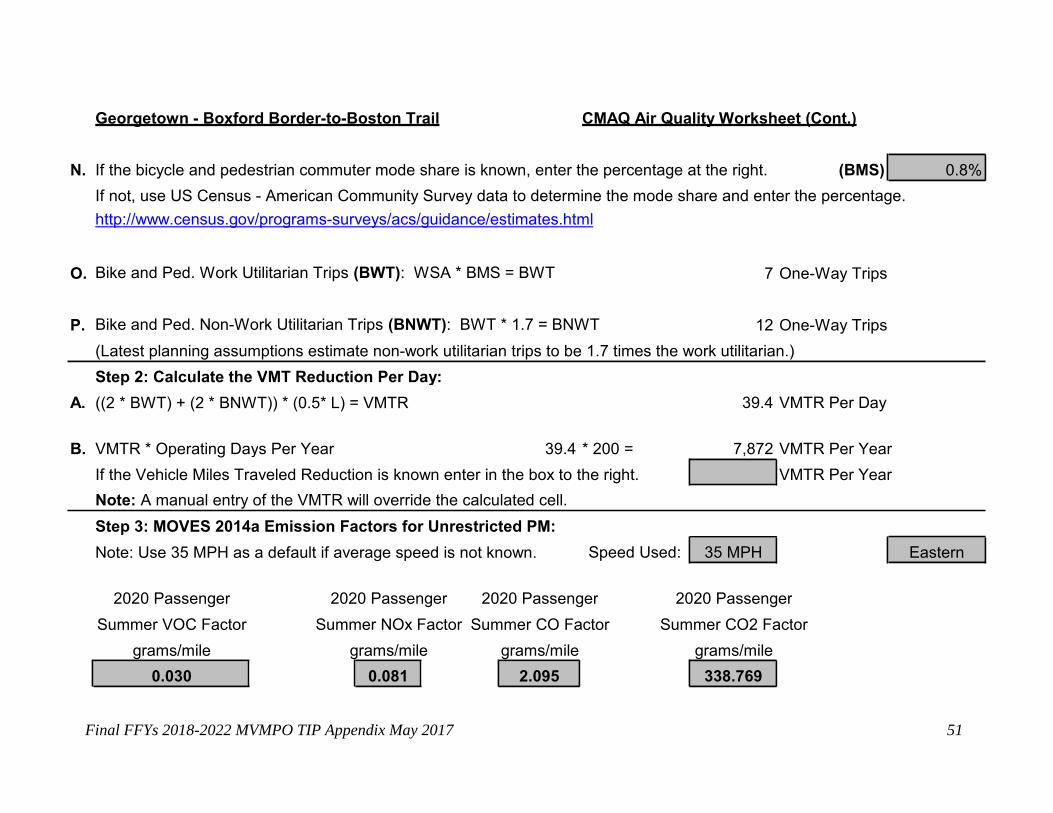
Georgetown - Boxford Border-to-Boston Trail CMAQ Air Quality Worksheet (Cont.)
N. If the bicycle and pedestrian commuter mode share is known, enter the percentage at the right. (BMS)
If not, use US Census - American Community Survey data to determine the mode share and enter the percentage.
http://www.census.gov/programs-surveys/acs/guidance/estimates.html
Bike and Ped. Work Utilitarian Trips (BWT): WSA * BMS = BWTO. 7 One-Way Trips
Bike and Ped. Non-Work Utilitarian Trips (BNWT): BWT * 1.7 = BNWTP. 12 One-Way Trips
(Latest planning assumptions estimate non-work utilitarian trips to be 1.7 times the work utilitarian.)
Step 2: Calculate the VMT Reduction Per Day:
((2 * BWT) + (2 * BNWT)) * (0.5* L) = VMTR A. 39.4 VMTR Per Day
B. VMTR * Operating Days Per Year 39.4 * 200 = 7,872 VMTR Per Year
If the Vehicle Miles Traveled Reduction is known enter in the box to the right.
Note: A manual entry of the VMTR will override the calculated cell.
VMTR Per Year
Step 3: MOVES 2014a Emission Factors for Unrestricted PM:
Note: Use 35 MPH as a default if average speed is not known. Speed Used:
2020 Passenger
Summer VOC Factor
grams/mile
2020 Passenger
Summer NOx Factor
grams/mile
2020 Passenger
Summer CO Factor
grams/mile
2020 Passenger
Summer CO2 Factor
grams/mile
338.769 2.095 0.081 0.030
Eastern 35 MPH
0.8%
Page 56
Final FFYs 2018-2022 MVMPO TIP Appendix as Amended through November 2017 52
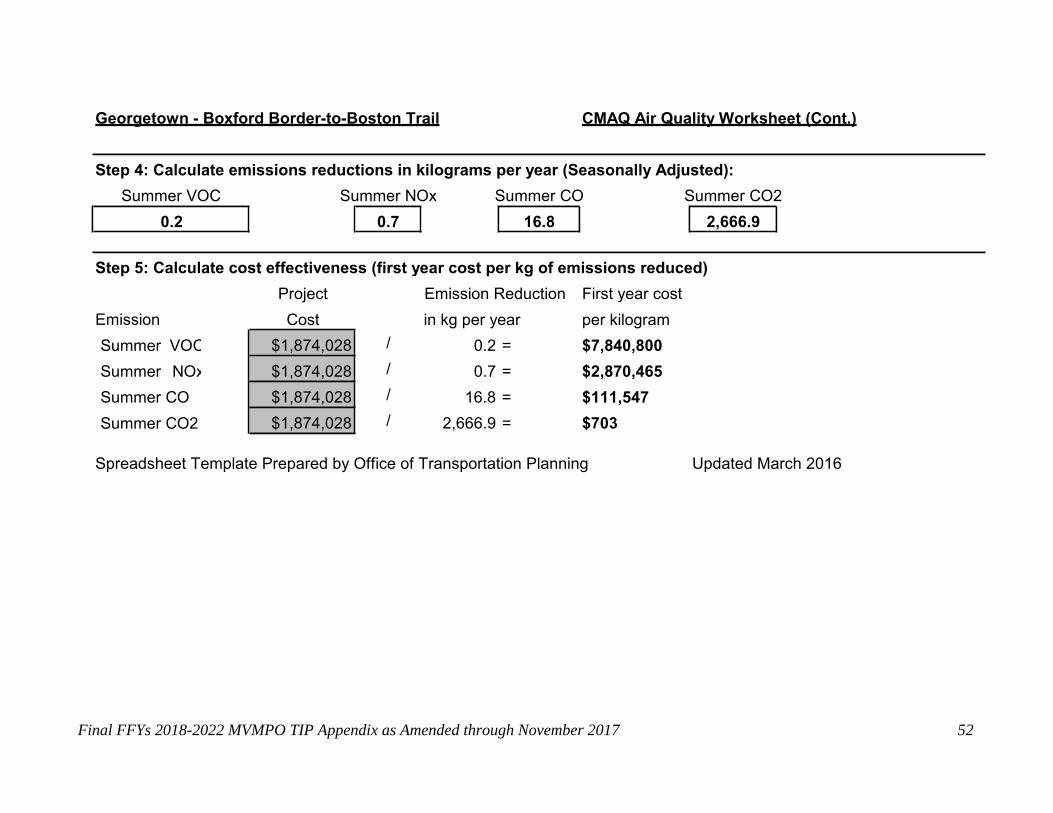
Georgetown - Boxford Border-to-Boston Trail CMAQ Air Quality Worksheet (Cont.)
Step 4: Calculate emissions reductions in kilograms per year (Seasonally Adjusted):
Summer VOC Summer NOx Summer CO Summer CO2
Step 5: Calculate cost effectiveness (first year cost per kg of emissions reduced)
Project
Cost
Emission Reduction
in kg per year
0.2 =
0.7 =
16.8 =
2,666.9 =
First year cost
per kilogram
$7,840,800
$2,870,465
$111,547
$703
Emission
Summer VOC
Summer NOx
Summer CO
Summer CO2
/
/
/
/
Spreadsheet Template Prepared by Office of Transportation Planning Updated March 2016
$1,874,028
$1,874,028
$1,874,028
$1,874,028
2,666.9 16.8 0.7 0.2
Page 57
Final FFYs 2018-2022 MVMPO TIP Appendix as Amended through November 2017 53
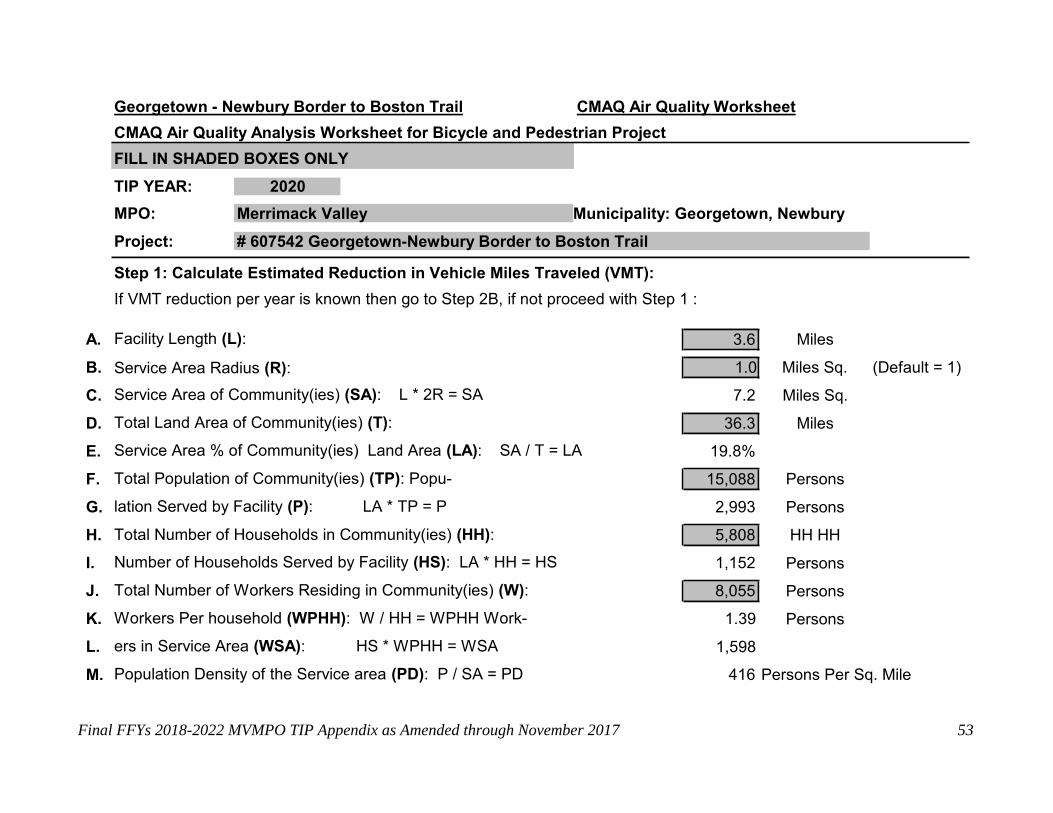
Georgetown - Newbury Border to Boston Trail CMAQ Air Quality Worksheet
CMAQ Air Quality Analysis Worksheet for Bicycle and Pedestrian Project
TIP YEAR:
MPO:
Project:
2020
Merrimack Valley Municipality: Georgetown, Newbury
# 607542 Georgetown-Newbury Border to Boston Trail
Step 1: Calculate Estimated Reduction in Vehicle Miles Traveled (VMT):
If VMT reduction per year is known then go to Step 2B, if not proceed with Step 1 :
Facility Length (L):
Service Area Radius (R):
Service Area of Community(ies) (SA):
Total Land Area of Community(ies) (T):
A.
B.
C.
D.
E.
F.
G.
H.
I.
J.
K.
L.
M.
Miles
Miles Sq.
Miles Sq.
Miles
(Default = 1)
L * 2R = SA 7.2
Service Area % of Community(ies) Land Area (LA):
Total Population of Community(ies) (TP): Popu-
lation Served by Facility (P): LA * TP = P
Total Number of Households in Community(ies) (HH):
SA / T = LA 19.8%
Persons
Persons
HH HH
Persons
Persons
Persons
2,993
Number of Households Served by Facility (HS): LA * HH = HS
Total Number of Workers Residing in Community(ies) (W):
Workers Per household (WPHH): W / HH = WPHH Work-
ers in Service Area (WSA): HS * WPHH = WSA
Population Density of the Service area (PD): P / SA = PD
1,152
1.39
1,598
416 Persons Per Sq. Mile
8,055
5,808
15,088
36.3
1.0
3.6
FILL IN SHADED BOXES ONLY
Page 58
Final FFYs 2018-2022 MVMPO TIP Appendix May 2017 54
Georgetown - Newbury Border to Boston Trail CMAQ Air Quality Worksheet (Cont.)
N. If the bicycle and pedestrian commuter mode share is known, enter the percentage at the ri (BMS)
If not, use US Census - American Community Survey data to determine the mode share and enter the percentage.
http://www.census.gov/programs-surveys/acs/guidance/estimates.html
O. Bike and Ped. Work Utilitarian Trips (BWT): WSA * BMS = BWT 24 One-Way Trips
P. Bike and Ped. Non-Work Utilitarian Trips (BNWT): BWT * 1.7 = BNWT 40 One-Way Trips
(Latest planning assumptions estimate non-work utilitarian trips to be 1.7 times the work utilitarian.)
Step 2: Calculate the VMT Reduction Per Day:
((2 * BWT) + (2 * BNWT)) * (0.5* L) = VMTR A. 231.5 VMTR Per Day
B. VMTR * Operating Days Per Year 231.5 * 200 = 46,290 VMTR Per Year
If the Vehicle Miles Traveled Reduction is known enter in the box to the right.
Note: A manual entry of the VMTR will override the calculated cell.
VMTR Per Year
Step 3: MOVES 2014a Emission Factors for Unrestricted PM:
Note: Use 35 MPH as a default if average speed is not known. Speed Used:
2020 Passenger
Summer VOC Factor
grams/mile
2020 Passenger
Summer NOx Factor
grams/mile
2020 Passenger
Summer CO Factor
grams/mile
2020 Passenger
Summer CO2 Factor
grams/mile
338.7692.095 0.081 0.030
Eastern 35 MPH
1.5%
Page 59
Final FFYs 2018-2022 MVMPO TIP Appendix as Amended through November 2017 55
Georgetown - Newbury Border to Boston Trail CMAQ Air Quality Worksheet (Cont.)
Step 4: Calculate emissions reductions in kilograms per year (Seasonally Adjusted):
Summer VOC Summer NOx Summer CO Summer CO2
Step 5: Calculate cost effectiveness (first year cost per kg of emissions reduced)
Project
Cost
Emission Reduction
in kg per year
1.4 =
3.8 =
98.8 =
15,681.6 =
First year cost
per kilogram
$3,088,934
$1,130,838
$43,945
$277
Emission
Summer VOC
Summer NOx
Summer CO
Summer CO2
/
/
/
/
Spreadsheet Template Prepared by Office of Transportation Planning Updated March 2016
$4,341,120
$4,341,120
$4,341,120
$4,341,120
15,681.698.8 3.8 1.4
Page 60
Final FFYs 2018-2022 MVMPO TIP Appendix as Amended through November 2017 56
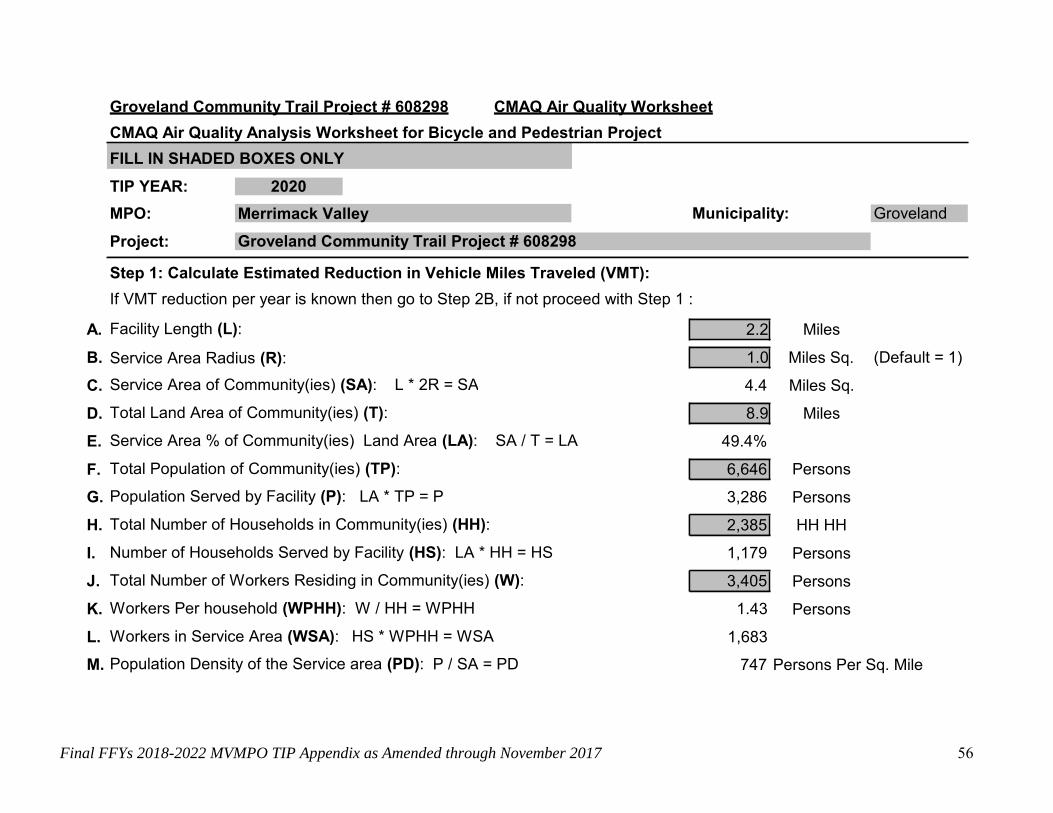
Groveland Community Trail Project # 608298 CMAQ Air Quality Worksheet
CMAQ Air Quality Analysis Worksheet for Bicycle and Pedestrian Project
TIP YEAR:
MPO:
Project:
2020
Merrimack Valley Municipality: Groveland
Groveland Community Trail Project # 608298
Step 1: Calculate Estimated Reduction in Vehicle Miles Traveled (VMT):
If VMT reduction per year is known then go to Step 2B, if not proceed with Step 1 :
A.
B.
C.
D.
E.
F.
Facility Length (L):
Service Area Radius (R):
Service Area of Community(ies) (SA):
Total Land Area of Community(ies) (T):
Miles
Miles Sq.
Miles Sq.
Miles
(Default = 1)
L * 2R = SA 4.4
Service Area % of Community(ies) Land Area (LA):
Total Population of Community(ies) (TP):
SA / T = LA 49.4%
Persons
Persons
HH HH
Persons
Persons
Persons
G. Population Served by Facility (P): LA * TP = P 3,286
H.
I.
J.
K.
L.
Total Number of Households in Community(ies) (HH):
Number of Households Served by Facility (HS): LA * HH = HS
Total Number of Workers Residing in Community(ies) (W):
Workers Per household (WPHH): W / HH = WPHH
Workers in Service Area (WSA): HS * WPHH = WSA
1,179
1.43
1,683
M. Population Density of the Service area (PD): P / SA = PD 747 Persons Per Sq. Mile
3,405
2,385
6,646
8.9
1.0
2.2
FILL IN SHADED BOXES ONLY
Page 61
Final FFYs 2018-2022 MVMPO TIP Appendix as Amended through November 2017 57
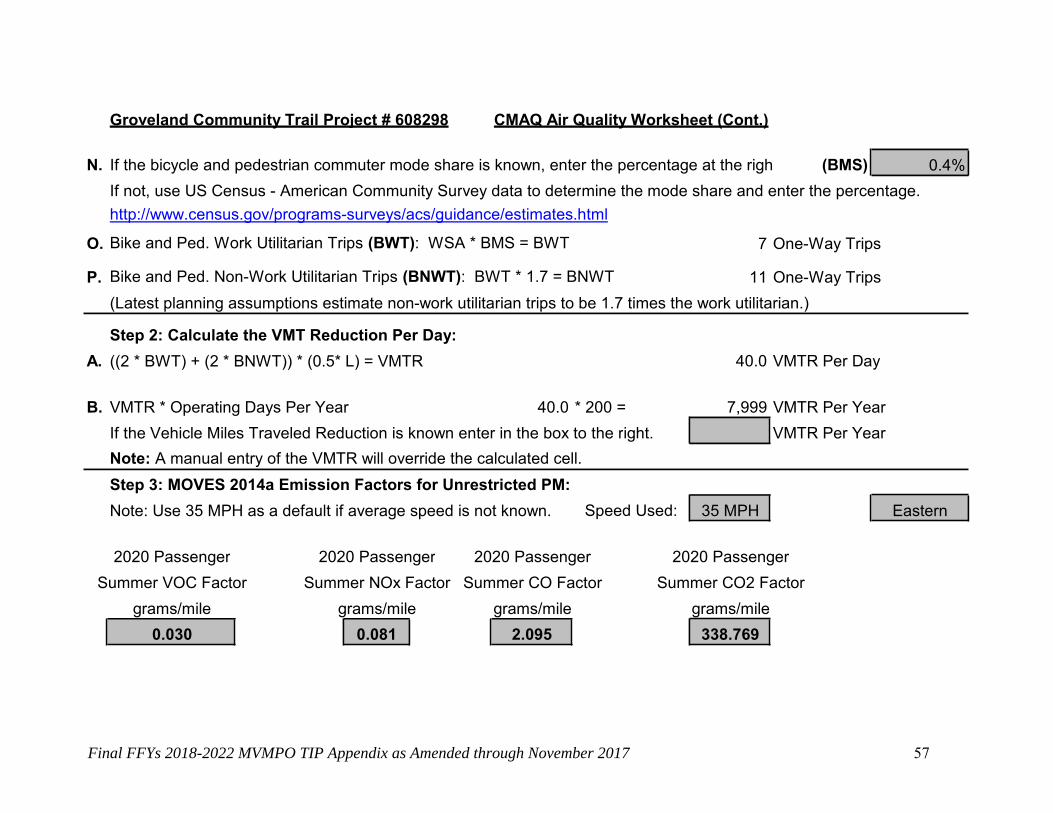
Groveland Community Trail Project # 608298 CMAQ Air Quality Worksheet (Cont.)
N. If the bicycle and pedestrian commuter mode share is known, enter the percentage at the righ (BMS)
If not, use US Census - American Community Survey data to determine the mode share and enter the percentage.
http://www.census.gov/programs-surveys/acs/guidance/estimates.html
O. Bike and Ped. Work Utilitarian Trips (BWT): WSA * BMS = BWT 7 One-Way Trips
Bike and Ped. Non-Work Utilitarian Trips (BNWT): BWT * 1.7 = BNWT P. 11 One-Way Trips
(Latest planning assumptions estimate non-work utilitarian trips to be 1.7 times the work utilitarian.)
Step 2: Calculate the VMT Reduction Per Day:
((2 * BWT) + (2 * BNWT)) * (0.5* L) = VMTR A. 40.0 VMTR Per Day
B. VMTR * Operating Days Per Year 40.0 * 200 = 7,999 VMTR Per Year
If the Vehicle Miles Traveled Reduction is known enter in the box to the right.
Note: A manual entry of the VMTR will override the calculated cell.
VMTR Per Year
Step 3: MOVES 2014a Emission Factors for Unrestricted PM:
Note: Use 35 MPH as a default if average speed is not known. Speed Used:
2020 Passenger
Summer VOC Factor
grams/mile
2020 Passenger
Summer NOx Factor
grams/mile
2020 Passenger
Summer CO Factor
grams/mile
2020 Passenger
Summer CO2 Factor
grams/mile
338.769 2.095 0.081 0.030
Eastern 35 MPH
0.4%
Page 62
Final FFYs 2018-2022 MVMPO TIP Appendix as Amended through November 2017 58
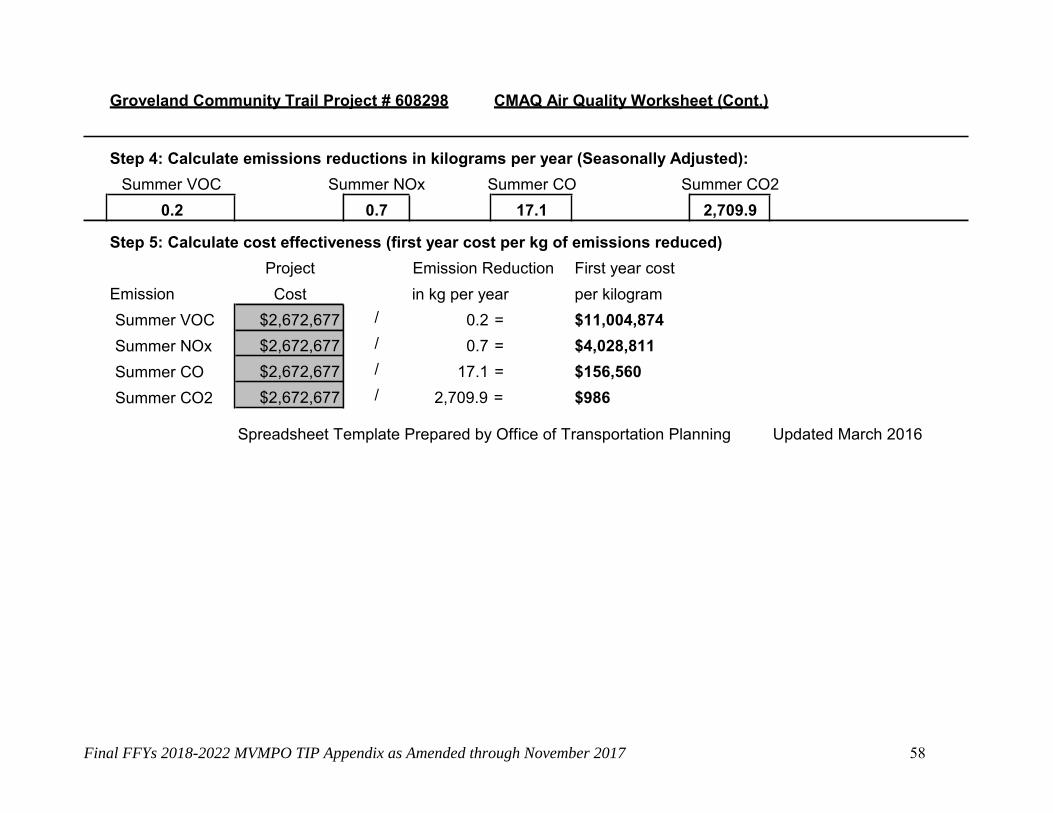
Groveland Community Trail Project # 608298 CMAQ Air Quality Worksheet (Cont.)
Step 4: Calculate emissions reductions in kilograms per year (Seasonally Adjusted):
Summer VOC Summer NOx Summer CO Summer CO2
Step 5: Calculate cost effectiveness (first year cost per kg of emissions reduced)
Project
Cost
Emission Reduction
in kg per year
0.2 =
0.7 =
17.1 =
2,709.9 =
First year cost
per kilogram
$11,004,874
$4,028,811
$156,560
$986
Emission
Summer VOC
Summer NOx
Summer CO
Summer CO2
/
/
/
/
Spreadsheet Template Prepared by Office of Transportation Planning Updated March 2016
$2,672,677
$2,672,677
$2,672,677
$2,672,677
0.2
0.7 17.1 2,709.9
Page 63
Final FFYs 2018-2022 MVMPO TIP Appendix as Amended through November 2017 59
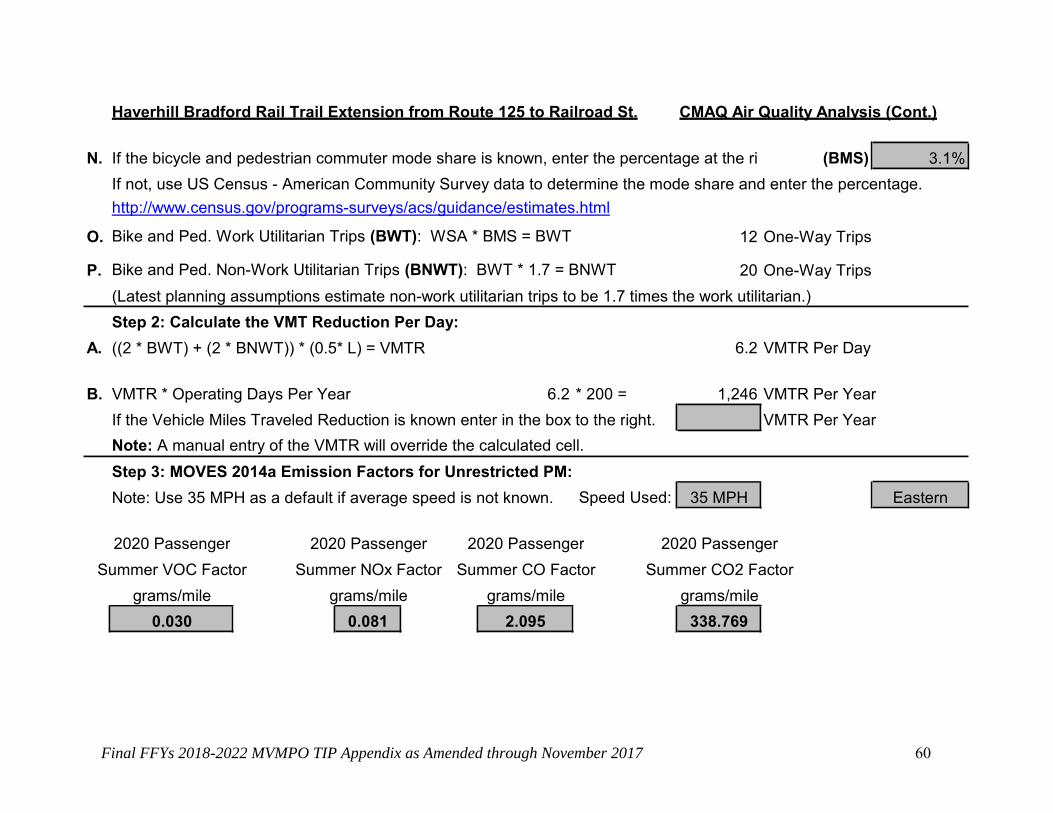
Haverhill Bradford Rail Trail Extension from Route 125 to Railroad St. CMAQ Air Quality Analysis
CMAQ Air Quality Analysis Worksheet for Bicycle and Pedestrian Project
TIP YEAR:
MPO:
Project:
2019
Merrimack Valley Municipality: Haverhill
# 608027 Bradford Rail Trail Extension from Route 125 to Railroad Street
Step 1: Calculate Estimated Reduction in Vehicle Miles Traveled (VMT):
If VMT reduction per year is known then go to Step 2B, if not proceed with Step 1 :
Facility Length (L):
Service Area Radius (R):
Service Area of Community(ies) (SA):
Total Land Area of Community(ies) (T):
A.
B.
C.
D.
E.
F.
G.
H.
I.
J.
K.
L.
M.
Miles
Miles Sq.
Miles Sq.
Miles
(Default = 1)
L * 2R = SA 0.4
Service Area % of Community(ies) Land Area (LA):
Total Population of Community(ies) (TP): Popu-
lation Served by Facility (P): LA * TP = P
Total Number of Households in Community(ies) (HH):
SA / T = LA 1.2%
Persons
Persons
HH HH
Persons
Persons
Persons
752
Number of Households Served by Facility (HS): LA * HH = HS
Total Number of Workers Residing in Community(ies) (W):
Workers Per household (WPHH): W / HH = WPHH Work-
ers in Service Area (WSA): HS * WPHH = WSA
Population Density of the Service area (PD): P / SA = PD
288
1.29
372
1,881 Persons Per Sq. Mile
30,696
23,781
62,079
33
1.0
0.2
FILL IN SHADED BOXES ONLY
Page 64
Final FFYs 2018-2022 MVMPO TIP Appendix as Amended through November 2017 60
Haverhill Bradford Rail Trail Extension from Route 125 to Railroad St. CMAQ Air Quality Analysis (Cont.)
N. If the bicycle and pedestrian commuter mode share is known, enter the percentage at the ri (BMS)
If not, use US Census - American Community Survey data to determine the mode share and enter the percentage.
http://www.census.gov/programs-surveys/acs/guidance/estimates.html
O. Bike and Ped. Work Utilitarian Trips (BWT): WSA * BMS = BWT 12 One-Way Trips
Bike and Ped. Non-Work Utilitarian Trips (BNWT): BWT * 1.7 = BNWT P. 20 One-Way Trips
(Latest planning assumptions estimate non-work utilitarian trips to be 1.7 times the work utilitarian.)
Step 2: Calculate the VMT Reduction Per Day:
((2 * BWT) + (2 * BNWT)) * (0.5* L) = VMTR A. 6.2 VMTR Per Day
B. VMTR * Operating Days Per Year 6.2 * 200 = 1,246 VMTR Per Year
If the Vehicle Miles Traveled Reduction is known enter in the box to the right.
Note: A manual entry of the VMTR will override the calculated cell.
VMTR Per Year
Step 3: MOVES 2014a Emission Factors for Unrestricted PM:
Note: Use 35 MPH as a default if average speed is not known. Speed Used:
2020 Passenger
Summer VOC Factor
grams/mile
2020 Passenger
Summer NOx Factor
grams/mile
2020 Passenger
Summer CO Factor
grams/mile
2020 Passenger
Summer CO2 Factor
grams/mile
338.769 2.095 0.081 0.030
Eastern 35 MPH
3.1%
Page 65
Final FFYs 2018-2022 MVMPO TIP Appendix as Amended through November 2017 61
Haverhill Bradford Rail Trail Extension from Route 125 to Railroad St. CMAQ Air Quality Analysis (Cont.)
Step 4: Calculate emissions reductions in kilograms per year (Seasonally Adjusted):
Summer VOC Summer NOx Summer CO Summer CO2
Step 5: Calculate cost effectiveness (first year cost per kg of emissions reduced)
Project
Cost
Emission Reduction
in kg per year
0.0 =
0.1 =
2.7 =
422.0 =
First year cost
per kilogram
$31,101,222
$11,385,951
$442,461
$2,787
Emission
Summer VOC
Summer NOx
Summer CO
Summer CO2
/
/
/
/
Spreadsheet Template Prepared by Office of Transportation Planning Updated March 2016
$1,176,240
$1,176,240
$1,176,240
$1,176,240
422.0 2.7 0.1 0.0
Page 66
Final FFYs 2018-2022 MVMPO TIP Appendix as Amended through November 2017 62
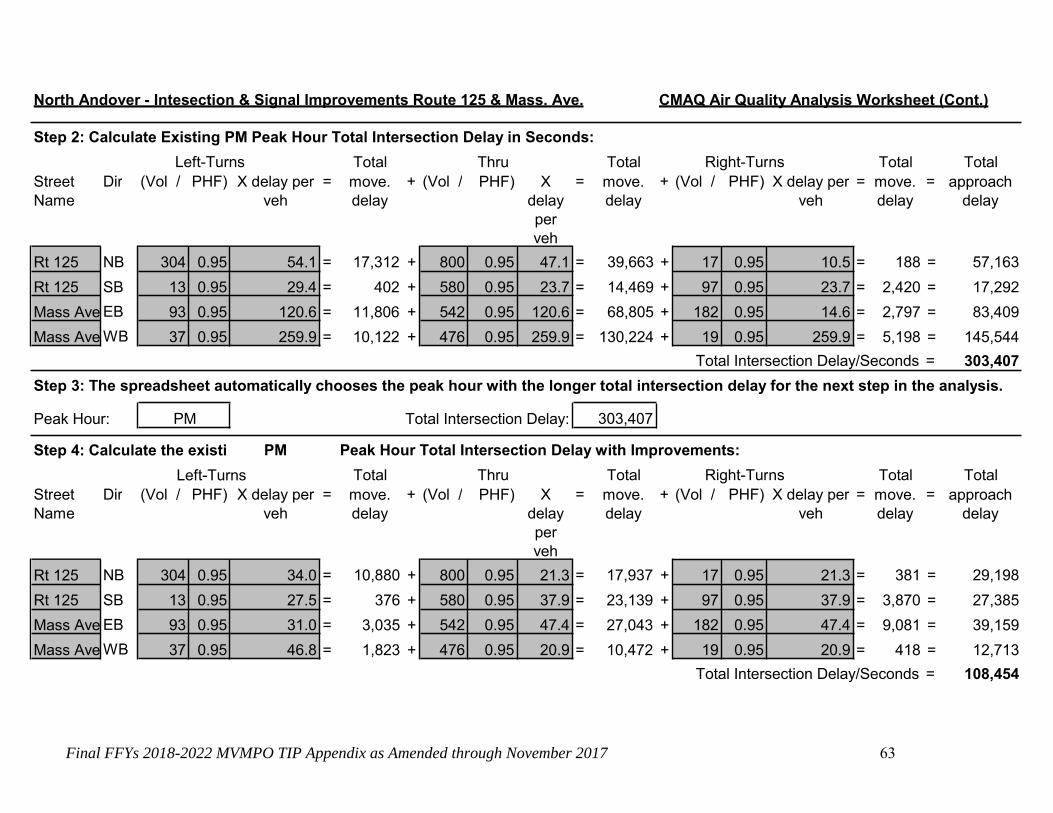
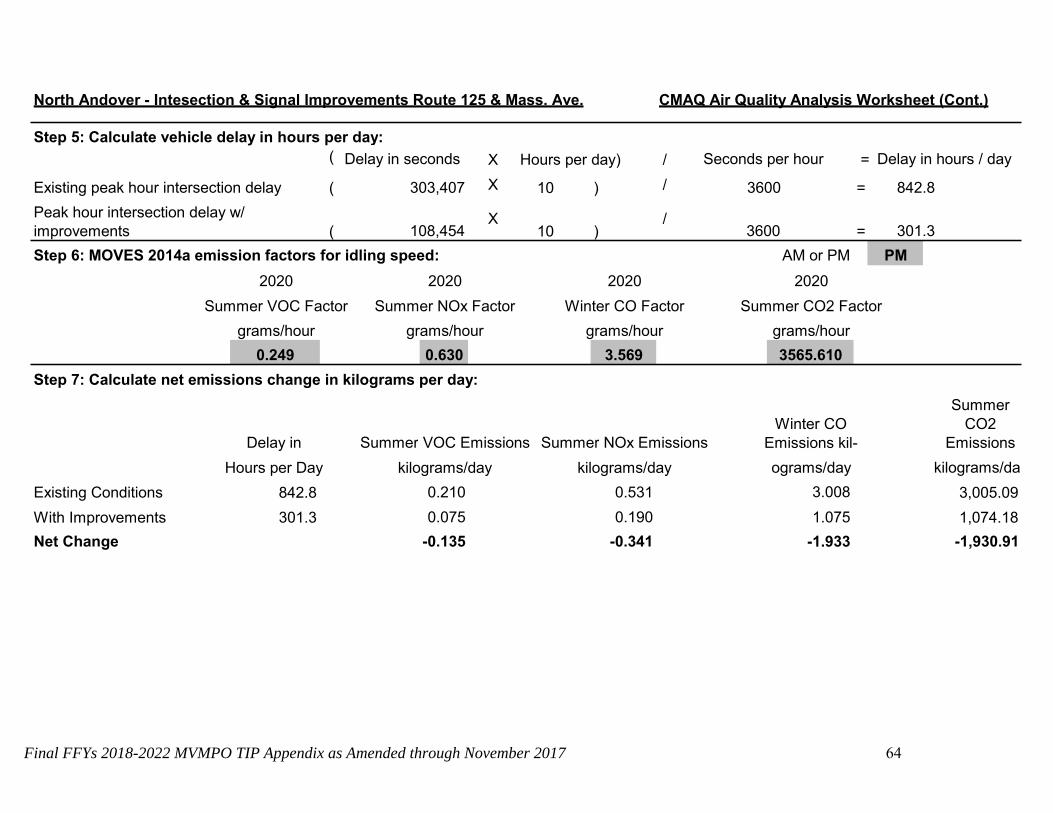
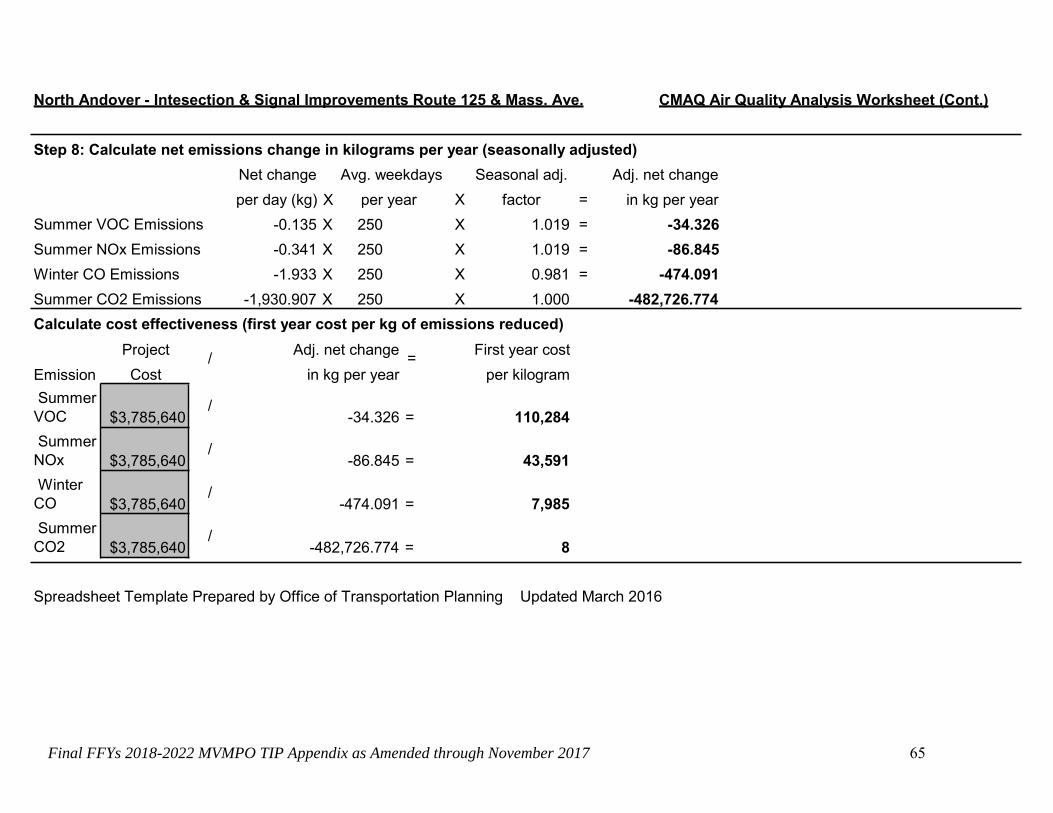
North Andover - Intesection & Signal Improvements Route 125 & Mass. Ave. CMAQ Air Quality Analysis Worksheet
CMAQ Air Quality Analysis Worksheet for Traffic Flow and Intersection Improvements
TIP YEAR
MPO:
Project:
Municipality:
Step 1: Calculate Existing AM Peak Hour Total Intersection Delay in Seconds:Left-Turns Total
move. delay
ThruPHF)
Total move. delay
Right-Turns Totalmove. delay
Total approach
delay Street Name
Dir (Vol / PHF) X delay per veh
= + (Vol / Xdelay per veh
= + (Vol / PHF) X delay perveh
= =
NB
SB
EB
WB
=
=
=
=
2,553
1,046
5,016
198
+
+
+
+
=
=
=
=
6,300
19,777
22,410
11,329
+
+
+
+
=
=
=
=
154 =
3,696 =
2,454 =
519 =
9,007
24,519
29,880
12,047
75,453 Total Intersection Delay/Seconds =
12 0.95 12.2
114 0.95 30.8
185 0.95 12.6
21 0.95 23.5
350 0.95 17.1
610 0.95 30.8
411 0.95 51.8
458 0.95 23.5
134
0.95
18.1
36
0.95
27.6
92
0.95
51.8
8
0.95
23.5
Rt 125
Rt 125
Mass Ave
Mass Ave
# 606159 Intersection & Signal Improvements at Route 125 & Massachusetts Avenue
North Andover Merrimack Valley
2018
FILL IN SHADED BOXES ONLY
Page 67
Final FFYs 2018-2022 MVMPO TIP Appendix as Amended through November 2017 63
North Andover - Intesection & Signal Improvements Route 125 & Mass. Ave. CMAQ Air Quality Analysis Worksheet (Cont.)
Step 2: Calculate Existing PM Peak Hour Total Intersection Delay in Seconds:
Left-Turns Totalmove. delay
ThruPHF)
Total move. delay
Right-Turns Totalmove. delay
Total approach
delay Street Name
Dir (Vol / PHF) X delay per veh
= + (Vol / Xdelay per veh
= + (Vol / PHF) X delay perveh
= =
NB
SB
EB
WB
=
=
=
=
17,312
402
11,806
10,122
+
+
+
+
=
=
=
=
39,663
14,469
68,805
130,224
+
+
+
+
=
=
=
=
188 =
2,420 =
2,797 =
5,198 =
57,163
17,292
83,409
145,544
303,407 Total Intersection Delay/Seconds =
Step 3: The spreadsheet automatically chooses the peak hour with the longer total intersection delay for the next step in the analysis.
Peak Hour: Total Intersection Delay:
Step 4: Calculate the existi
Left-Turns
PM Peak Hour Total Intersection Delay with Improvements:
Totalmove. delay
ThruPHF)
Total move. delay
Right-Turns Totalmove. delay
Total approach
delay Street Name
Dir (Vol / PHF) X delay per veh
= + (Vol / Xdelay per veh
= + (Vol / PHF) X delay perveh
= =
NB
SB
EB
WB
=
=
=
=
10,880
376
3,035
1,823
+
+
+
+
=
=
=
=
17,937
23,139
27,043
10,472
+
+
+
+
=
=
=
=
381 =
3,870 =
9,081 =
418 =
29,198
27,385
39,159
12,713
108,454 Total Intersection Delay/Seconds =
17 0.95 21.3
97 0.95 37.9
182 0.95 47.4
19 0.95 20.9
800 0.95 21.3
580 0.95 37.9
542 0.95 47.4
476 0.95 20.9
304
0.95
34.0
13
0.95
27.5
93
0.95
31.0
37
0.95
46.8
Rt 125
Rt 125
Mass Ave
Mass Ave
303,407 PM
17 0.95 10.5
97 0.95 23.7
182 0.95 14.6
19 0.95 259.9
800 0.95 47.1
580 0.95 23.7
542 0.95 120.6
476 0.95 259.9
304
0.95
54.1
13
0.95
29.4
93
0.95
120.6
37
0.95
259.9
Rt 125
Rt 125
Mass Ave
Mass Ave
Page 68
Final FFYs 2018-2022 MVMPO TIP Appendix as Amended through November 2017 64
North Andover - Intesection & Signal Improvements Route 125 & Mass. Ave. CMAQ Air Quality Analysis Worksheet (Cont.)
Step 5: Calculate vehicle delay in hours per day:( Delay in seconds
303,407
Seconds per hour
3600
Delay in hours / day
842.8
X
X
Hours per day) /
/
=
=Existing peak hour intersection delay
Peak hour intersection delay w/ improvements
( 10 )
X /108,454 3600 301.3( 10 ) =
2020
Summer VOC Factor
grams/hour
2020
Summer NOx Factor
grams/hour
2020
Winter CO Factor
grams/hour
2020
Summer CO2 Factor
grams/hour
Step 7: Calculate net emissions change in kilograms per day:
Summer CO2
Emissions
kilograms/da
3,005.09
1,074.18
-1,930.91
Winter COEmissions kil-
ograms/day
3.008
1.075
-1.933
Delay in
Hours per Day
842.8
301.3
Summer VOC Emissions
kilograms/day
0.210
0.075
-0.135
Summer NOx Emissions
kilograms/day
0.531
0.190
-0.341
Existing Conditions
With Improvements
Net Change
0.249
0.630 3.569 3565.610
Step 6: MOVES 2014a emission factors for idling speed: AM or PM PM
Page 69
Final FFYs 2018-2022 MVMPO TIP Appendix as Amended through November 2017 65
North Andover - Intesection & Signal Improvements Route 125 & Mass. Ave. CMAQ Air Quality Analysis Worksheet (Cont.)
Step 8: Calculate net emissions change in kilograms per year (seasonally adjusted)
Net change
per day (kg) X
-0.135 X
-0.341 X
-1.933 X
-1,930.907 X
Avg. weekdays
per year
250
250
250
250
Seasonal adj.
factor
1.019
1.019
0.981
1.000
Adj. net change
in kg per year
-34.326
-86.845
-474.091
-482,726.774
X
X
X
X
X
=
=
=
=
Summer VOC Emissions
Summer NOx Emissions
Winter CO Emissions
Summer CO2 Emissions
Calculate cost effectiveness (first year cost per kg of emissions reduced)
Project
Cost
Adj. net change
in kg per year
First year cost
per kilogram/ =
Emission
Summer VOC
Summer NOx
Winter CO
Summer CO2
/ -34.326 = 110,284
/ -86.845 = 43,591
/ -474.091 = 7,985
/ -482,726.774 = 8
Spreadsheet Template Prepared by Office of Transportation Planning Updated March 2016
$3,785,640
$3,785,640
$3,785,640
$3,785,640
Page 70
Final FFYs 2018-2022 MVMPO TIP Appendix as Amended through November 2017 66
Salisbury Multi-Use Trail Extension (Borders to Boston) CMAQ Air Quality Analysis
CMAQ Air Quality Analysis Worksheet for Bicycle and Pedestrian Project
TIP YEAR:
MPO:
Project:
2018
Merrimack Valley Municipality: Salisbury
Step 1: Calculate Estimated Reduction in Vehicle Miles Traveled (VMT):
If VMT reduction per year is known then go to Step 2B, if not proceed with Step 1 :
Facility Length (L):
Service Area Radius (R):
Service Area of Community(ies) (SA):
Total Land Area of Community(ies) (T):
A.
B.
C.
D.
E.
F.
G.
H.
I.
J.
K.
L.
M.
Miles
Miles Sq.
Miles Sq.
Miles
(Default = 1)
L * 2R = SA 4.6
Service Area % of Community(ies) Land Area (LA):
Total Population of Community(ies) (TP): Popu-
lation Served by Facility (P): LA * TP = P
Total Number of Households in Community(ies) (HH):
SA / T = LA 29.9%
Persons
Persons
HH HH
Persons
Persons
Persons
2,590
Number of Households Served by Facility (HS): LA * HH = HS
Total Number of Workers Residing in Community(ies) (W):
Workers Per household (WPHH): W / HH = WPHH Work-
ers in Service Area (WSA): HS * WPHH = WSA
Population Density of the Service area (PD): P / SA = PD
1,029
1.27
1,302
563 Persons Per Sq. Mile
4,360
3,446
8,672
15.4
1.0
2.3
# 605020 Salisbury Multi-use Trail Extension (Borders to Boston Trail)
FILL IN SHADED BOXES ONLY
Page 71
Final FFYs 2018-2022 MVMPO TIP Appendix as Amended through November 2017 67
Salisbury Multi-Use Trail Extension (Borders to Boston) CMAQ Air Quality Analysis (Cont.)
N. If the bicycle and pedestrian commuter mode share is known, enter the percentage at the (BMS)
If not, use US Census - American Community Survey data to determine the mode share and enter the percentage.
http://www.census.gov/programs-surveys/acs/guidance/estimates.html
Bike and Ped. Work Utilitarian Trips (BWT): WSA * BMS = BWT
Bike and Ped. Non-Work Utilitarian Trips (BNWT): BWT * 1.7 = BNWT
O.
P.
44 One-Way Trips
75 One-Way Trips
(Latest planning assumptions estimate non-work utilitarian trips to be 1.7 times the work utilitarian.)
Step 2: Calculate the VMT Reduction Per Day:
((2 * BWT) + (2 * BNWT)) * (0.5* L) = VMTR A. 275.0 VMTR Per Day
B. VMTR * Operating Days Per Year 275.0 * 200 = 54,995 VMTR Per Year
If the Vehicle Miles Traveled Reduction is known enter in the box to the right.
Note: A manual entry of the VMTR will override the calculated cell.
VMTR Per Year
Step 3: MOVES 2014a Emission Factors for Unrestricted PM:
Note: Use 35 MPH as a default if average speed is not known. Speed Used:
2020 Passenger
Summer VOC Factor
grams/mile
2020 Passenger
Summer NOx Factor
grams/mile
2020 Passenger
Summer CO Factor
grams/mile
2020 Passenger
Summer CO2 Factor
grams/mile
338.769 2.095 0.081 0.030
Eastern 35 MPH
3.4%
Page 72
Final FFYs 2018-2022 MVMPO TIP Appendix as Amended through November 2017 68
Salisbury Multi-Use Trail Extension (Borders to Boston) CMAQ Air Quality Analysis (Cont.)
Step 4: Calculate emissions reductions in kilograms per year (Seasonally Adjusted):
Summer VOC Summer NOx Summer CO Summer CO2
Step 5: Calculate cost effectiveness (first year cost per kg of emissions reduced)
Project
Cost
Emission Reduction
in kg per year
1.7 =
4.6 =
117.4 =
18,630.6 =
First year cost
per kilogram
$3,686,512
$1,349,608
$52,446
$330
Emission
Summer VOC
Summer NOx
Summer CO
Summer CO2
/
/
/
/
$6,155,240
$6,155,240
$6,155,240
$6,155,240
18,630.6 117.4 4.6 1.7
Page 73
Final FFYs 2018-2022 MVMPO TIP Appendix as Amended through November 2017 69
Merrimack Valley RTA Replace 6 (2004) Buses with 6 (2018) Buses
CMAQ Bus Replacement Air Quality Analysis Worksheet
FILL IN SHADED BOXES ONLY
TIP YEAR: 2018 Bus Replacements
MPO: Merrimack Valley
RTA: Merrimack Valley
Emission Rates in grams/mile at assumed operating speed bin of :
Scenario Comparison Summer VOC Summer NOx Winter CO
(grams/mile)
Summer CO2
(grams/mile)(grams/mile) (grams/mile)
Model Year
Existing Model* = New Bus Purchase** =
* Please contact OTP for assistance on Existing Model emission factors
** MOVES 2014a Commercial Emission Factors - Please Specify the Following:
Restricted orUnrestrictedAM or PM:
Change (Buy-Base)
Calculate fleet vehicle miles per day:
Revenue miles
per year
X Deadhead
factor
= fleet miles / operating days = fleet miles
per year per year per day
1.15 232,461 304 765 202,140
-1.686 -6.778 -2.905
-67.370
Unrestricted
PM
2004
1.734
7.542
3.180
1,200.600
2018
0.048
0.764
0.275
1133.23
18 MPH (Bin 5 (17.5-22.5))
Project #BCG0005656 # RTD0004954 - Replace 6 (2004) Buses with 6 (2018) Buses
Page 74
Final FFYs 2018-2022 MVMPO TIP Appendix as Amended through November 2017 70
Merrimack Valley RTA Replace 6 (2004) Buses with 6 (2018) Buses (Cont.)
Calculate emissions change in kilograms per summer day
Change rate change
grams/mile
/ 1000
g/kg
X fleet miles
per day
X seasonal
adj factor
= change/day
in kg
Change in Summer VOC Change in
Summer NOx Change in
Winter CO Change in
Summer CO2
-1.686 1,000 765 1.0188
-6.778 1,000 765 1.0188
-2.905 1,000 765 0.9812
-67.370 1,000 765 1.0000
Calculate emissions change in kilograms per year
Pollutant = change/day
in kg
X op.days
per year
= change per
year in kg
Summer VOC
Summer NOx
Winter CO
Summer CO2
Calculate cost effectiveness (cost per kg of emissions reduced)
Pollutant Total Project
Cost
/ Project Life reduction per = annual cost
per kgin years year in kg
Summer VOC
Summer NOx
Winter CO
Summer CO2
Template Prepared by Office of Transportation Planning Updated March 2016
$2,725,755 12 399.298 $569
$2,725,755 12 1605.242 $142
$2,725,755 12 662.604 $343
$2,725,755 12 15660.898 $15
-1.313 304
-399.298
-5.280 304
-1605.242
-2.180 304
-662.604
-51.516 304
-15660.898
-1.313
-5.280
-2.180
-51.516
Page 75
Final FFYs 2018-2022 MVMPO TIP Appendix as Amended through November 2017 71
Merrimack Valley RTA Replace 6 (2004) Buses with 6 (2018) Buses
CMAQ Bus Replacement Air Quality Analysis Worksheet
FILL IN SHADED BOXES ONLY
TIP YEAR: 2020 Bus Replacements
MPO: Merrimack Valley
RTA: Merrimack Valley
Emission Rates in grams/mile at assumed operating speed bin of :
SummerVOC
(grams/mile)
SummerNOx
(grams/mile)
Winter CO
(grams/mile)
Summer CO2
(grams/mile)
Scenario Comparison
Model Year
Existing Model*
New Bus Purchase**
=
=
* Please contact OTP for assistance on Existing Model emission factors
** MOVES 2014a Commercial Emission Factors - Please Specify the Following: Restricted orUnrestrictedAM or PM:
Change (Buy-Base)
Calculate fleet vehicle miles per day:
Revenue miles
per year
X Deadhead = fleet miles perating days = fleet miles
per day factor per year per year
1.15 116,231 304 382 101,070
-0.067 -2.986 -0.384 -67.370
Unrestricted PM
2007 0.115 3.750 0.659 1,200.600
2020 0.048 0.764 0.275 1133.23
18 MPH (Bin 5 (17.5-22.5))
Project #BCG0005658 # RTD0004956 - Replace 3 (2007) Buses with 3 (2020) Buses
Page 76
Final FFYs 2018-2022 MVMPO TIP Appendix as Amended through November 2017 72
Merrimack Valley RTA Replace 6 (2004) Buses with 6 (2018) Buses (Cont.)
Calculate emissions change in kilograms per summer day
Change rate change
grams/mile
/ 1000
g/kg
X fleet miles
per day
X seasonal
adj factor
= change/day
in kg
Change in Summer VOC Change in Summer
NOx
-0.067 1,000 382 1.0188
-2.986 1,000 382 1.0188
Change in Winter CO Change in Summer
CO2
-0.384 1,000 382 0.9812
-67.370 1,000 382 1.0000
Calculate emissions change in kilograms per year
Pollutant = change/day
in kg
X op.days
per year
= change per
year in kg
Summer VOC
Summer NOx
Winter CO
Summer CO2
Calculate cost effectiveness (cost per kg of emissions reduced)
Pollutant Total Project / Project Life / reduction per
year in kg
= annual cost
per kgCost in years
Summer VOC
Summer NOx
Winter CO
Summer CO2
Template prepared by the Office of Transportation Plannning Updated March 2016
$1,456,620 12 7.934 $15,300
$1,456,620 12 353.589 $343
$1,456,620 12 43.793 $2,772
$1,456,620 12 7830.449 $16
-0.026 304 -7.934
-1.163 304 -353.589
-0.144 304 -43.793
-25.758 304 -7830.449
-0.026
-1.163
-0.144
-25.758
Page 77
Final FFYs 2018-2022 MVMPO TIP Appendix as Amended through November 2017 73
Merrimack Valley RTA Replace 9 (2009) Buses with 9 (2021) Buses
CMAQ Bus Replacement Air Quality Analysis Worksheet
FILL IN SHADED BOXES ONLY
TIP YEAR: 2021 Bus Replacements
MPO: Merrimack Valley
RTA: Merrimack Valley
Project #BCG0005659 - Replace 9 (2009) Buses with 9 (2021) Buses
Emission Rates in grams/mile at assumed operating speed bin of : 18 MPH (Bin 5 (17.5-22.5))
SummerVOC
(grams/mile)
Model Year
SummerCO2
(grams/mile)
Scenario Comparison Summer NOx
(grams/mile)
Winter CO
(grams/mile)
Existing Model* =
New Bus Purchase** =
* Please contact OTP for assistance on Existing Model emission factors
** MOVES 2014a Commercial Emission Factors - Please Specify the Following: Restricted orUnrestrictedAM or PM:
Change (Buy-Base)
Calculate fleet vehicle miles per day:
Revenue miles
per year
X eadhead
factor
= fleet miles / operating days = fleet miles
per day per year per year
1.15 348,692 304 1,147 303,210
-0.067 -2.986 -0.384 -69.850
Unrestricted PM
2009
0.115 3.750 0.659
1,203.080
2021
0.048 0.764 0.275
1133.23
Page 78
Final FFYs 2018-2022 MVMPO TIP Appendix as Amended through November 2017 74
Merrimack Valley RTA Replace 9 (2009) Buses with 9 (2021) Buses (Cont.)
Calculate emissions change in kilograms per summer day
Change rate change
grams/mile
/ 1000
g/kg
X fleet miles
per day
X seasonal
adj factor
= change/day
in kg
Change in Summer VOC
Change in Summer NOx
Change in Winter CO
Change in Summer CO2
-0.067
-2.986
-0.384
-69.850
1,000
1,000
1,000
1,000
1,147
1,147
1,147
1,147
1.0188
1.0188
0.9812
1.0000
Calculate emissions change in kilograms per year
Pollutant = change/day
in kg
X op.days
per year
= change per
year in kg
Summer VOC
Summer NOx
Winter CO
Summer CO2
Calculate cost effectiveness (cost per kg of emissions reduced)
Pollutant Total Project
Cost
/ Project Life / reduction per = annual cost
per kgin years year in kg
Summer VOC
Summer NOx
Winter CO
Summer CO2
Template prepared by the Office of Transportation Plannning Updated March 2016
$3,357,795 12 23.802 $11,756
$3,357,795 12 1060.767 $264
$3,357,795 12 131.380 $2,130
$3,357,795 12 24356.101 $11
-0.078 304
-23.802
-3.489 304
-1060.767
-0.432 304
-131.380
-80.119 304
-24356.101
-0.078
-3.489
-0.432
-80.119
Page 79
Final FFYs 2018-2022 MVMPO TIP Appendix as Amended through November 2017 75
Merrimack Valley RTA Replace 16 (2015) Vans with 16 (2021) Vans
CMAQ Bus Replacement Air Quality Analysis Worksheet
FILL IN SHADED BOXES ONLY
TIP YEAR: 2021 Bus Replacements
MPO: Merrimack Valley
RTA: Merrimack Valley
Emission Rates in grams/mile at assumed operating speed bin of : 18 MPH (Bin 5 (17.5-22.5))
SummerVOC
(grams/mile)
SummerCO2
(grams/mile)
Scenario Comparison Summer NOx Winter CO
(grams/mile) (grams/mile)
Model Year
Existing Model* =
New Bus Purchase** =
* Please contact OTP for assistance on Existing Model emission factors
** MOVES 2014a Commercial Emission Factors - Please Specify the Following: Restricted orUnrestrictedAM or PM:
Change (Buy-Base)
Calculate fleet vehicle miles per day:
Revenue miles
per year
X Deadhead
factor
= fleet miles operating days = fleet miles
per year per year per day
1.14 513,018 304 1,688 450,016
-0.005 -0.033 -1.421 -65.331
Unrestricted PM
2015 0.008 0.058 2.014
501.185
2021 0.003 0.025 0.593
435.854
Project #BCG0005661 - Replace 16 (2015) Vans with 16 (2021) vans
Page 80
Final FFYs 2018-2022 MVMPO TIP Appendix as Amended through November 2017 76
Merrimack Valley RTA Replace 16 (2015) Vans with 16 (2021) Vans (Cont.)
Calculate emissions change in kilograms per summer day
Change rate change
grams/mile
/ 1000
g/kg
X fleet miles
per day
X seasonal
adj factor
= change/day
in kg
Change in Summer VOC
Change in Summer NOx
Change in Winter CO
Change in Summer CO2
-0.005
-0.033
-1.421
-65.331
1,000
1,000
1,000
1,000
1,688
1,688
1,688
1,688
1.0188
1.0188
0.9812
1.0000
Calculate emissions change in kilograms per year
Pollutant = change/day
in kg
X op.days
per year
= change per
year in kg
Summer VOC
Summer NOx
Winter CO
Summer CO2
Calculate cost effectiveness (cost per kg of emissions reduced)
Pollutant Total Project
Cost
/ Project Life eduction per = annual cost
per kgin years year in kg
Summer VOC
Summer NOx
Winter CO
Summer CO2
Template prepared by the Office of Transportation Plannning Updated March 2016
$875,650 4 2.613 $83,768
$875,650 4 17.248 $12,692
$875,650 4 715.294 $306
$875,650 4 33515.995 $7
-0.009 304
-2.613
-0.057 304
-17.248
-2.353 304
-715.294
-110.250 304
-33515.995
-0.009
-0.057
-2.353
-110.250
Page 81
Final FFYs 2018-2022 MVMPO TIP Appendix as Amended through November 2017 77
Merrimack Valley RTA Replace 6 (2011) Buses with 6 (2022) Buses
CMAQ Bus Replacement Air Quality Analysis Worksheet
FILL IN SHADED BOXES ONLY
TIP YEAR: 2022 Bus Replacements
MPO: Merrimack Valley
RTA: Merrimack Valley
Project #BCG0006088 - Replace 6 (2011) Buses with 6 (2022) Buses
Emission Rates in grams/mile at assumed operating speed bin of : 18 MPH (Bin 5 (17.5-22.5))
SummerVOC
(grams/mile)
SummerNOx
(grams/mile)
SummerCO2
(grams/mile)
Scenario Comparison Winter CO
(grams/mile)
Model Year
Existing Model* =
New Bus Purchase** =
* Please contact OTP for assistance on Existing Model emission factors
** MOVES 2014a Commercial Emission Factors - Please Specify the Following: Restricted orUnrestrictedAM or PM:
Change (Buy-Base)
Calculate fleet vehicle miles per day:
Revenue miles
per year
X Deadhead
factor
= fleet milesperating days = fleet miles
per day per year per year
1.15 232,461 304 765 202,140
-0.061 -0.458 -0.063 -69.850
Unrestricted PM
2011 0.109 1.222 0.338
1,203.080
2022 0.048 0.764 0.275
1133.23
Page 82
Final FFYs 2018-2022 MVMPO TIP Appendix as Amended through November 2017 78
Merrimack Valley RTA Replace 6 (2011) Buses with 6 (2022) Buses (Cont.)
Calculate emissions change in kilograms per summer day
Change rate change
grams/mile
/ 1000
g/kg
X fleet miles
per day
X seasonal = change/day
adj factor in kg
Change in Summer VOC
Change in Summer NOx
Change in Winter CO
Change in Summer CO2
-0.061
-0.458
-0.063
-69.850
1,000
1,000
1,000
1,000
765
765
765
765
1.0188
1.0188
0.9812
1.0000
Calculate emissions change in kilograms per year
Pollutant = change/day
in kg
X op.days
per year
= change per
year in kg
Summer VOC
Summer NOx
Winter CO
Summer CO2
Calculate cost effectiveness (cost per kg of emissions reduced)
Pollutant Total Project / Project Life/ reduction per = annual cost
Cost in years year in kg per kg
Summer VOC Summer NOx Winter CO Summer CO2
Template prepared by the Office of Transportation Plannning Updated March 2016
$2,911,200 12 14.447 $16,793$2,911,200 12 108.469 $2,237$2,911,200 12 14.370 $16,883$2,911,200 12 16237.401 $15
-0.048 304
-14.447
-0.357 304
-108.469
-0.047 304
-14.370
-53.413 304
-16237.401
-0.048
-0.357
-0.047
-53.413
Page 83
Final FFYs 2018-2022 MVMPO TIP Appendix as Amended through November 2017 79
Appendix F Completed Highway and Transit Projects GHG Summary
Page 84
Final FFYs 2018-2022 MVMPO TIP Appendix as Amended through November 2017 80
Merrimack Valley Region MPO Completed Highway Projects GHG Summary
MassDOT Project ID ▼
MassDOT Project Description▼
Total Program- med Funds ▼
GHG Analysis Type ▼
GHG CO2
Impact (kg/yr) ▼
GHG Impact Description ▼
Additional Description ▼
Fiscal Year of Contract Award (2015 and forward)▼
606161
HAVERHILL - IMPROVEMENTS ON MAIN STREET (ROUTE 125)
$ 3,635,519
Quantified
16,491
Quantified Decrease in Emissions from Traffic Operational Improvement
Advertised 9/17/2016 Notice to Proceed 4/12/17
2017
606503
NEWBURYPORT CLIPPER CITY RAIL TRAIL ALONG THE CITY BRANCH (PHASE II)
$ 4,061,158
Quantified
34,996
Quantified Decrease in Emissions from Bicycle and Pedes-trian Infrastructure
Advertised 9/19/2015 Notice to Proceed 4/1/2016
2016
Page 85
Final FFYs 2018-2022 MVMPO TIP Appendix as Amended through November 2017 81
Merrimack Valley Region MPO Completed Transit Projects GHG Summary
FTA Acti- vity Line Item ▼
Transit Agency ▼
Project Description▼
Total Cost ▼
GHG Analysis Type ▼
GHG CO2
Impact (kg/yr) ▼
GHG Impact Description ▼
Fiscal Year Program- med (2015 and forward)▼
MVRTA
Purchase -Replacement: Vans 11 Model Year 2009Delivery 2015
$ 627,000
Quantified
41,814
Quantified De-crease in Emis-sions from Bus Replacement
2015
111202
MVRTA
Replace 10 of 17 Model Year 2004 Transit Buses with new buses (Delivery 2016)
$4,200,000
Quantified
12,557
Quantified De-crease in Emis-sions from Bus Replacement
2015
111215
MVRTA
Replace 5 Model Year 2011 Paratransit Vehicles(Delivery 2016)
$ 320,000
Quantified
15,992
Quantified De-crease in Emis-sions from Bus Replacement
2016
111202
MVRTA
Replace 7 Model Year 2004 Buses with new
$2,989,000
Quantified
18,271
Quantified De-crease in Emis-sions from Bus Replacement
2017
Page 86
Final FFYs 2018-2022 MVMPO TIP Appendix as Amended through November 2017 82
Page intentionally left blank.
Page 87
Final FFYs 2018-2022 MVMPO TIP Appendix as Amended through November 2017 83
Appendix G List of Acronyms
Page 88
Final FFYs 2018-2022 MVMPO TIP Appendix as Amended through November 2017 84
MVMPO List of Commonly Used Acronyms
A AADT Average Annual Daily Traffic
AASHTO American Association of State Highway Transpor-
tation Officials
ABP MassDOT Accelerated Bridge Program
AC Advance Construction
ADA Americans with Disabilities Act (1990)
ADT Average Daily Traffic
ARRA American Recovery and Reinvestment Act (of
2009)
AQ Air Quality
B B to B Border to Boston Rail Trail
BR, BR-On, BR-Off Bridge Rehabilitation or Replacement (On- or Off-
National Highway System)
C (C) Type of Project = Capital Improvement
3C Continuing, Comprehensive and Coordinated
(Transportation Planning)
CAAA Clean Air Act Amendments of 1990
CFR Code of Federal Regulations
CIP Capital Investment Plan
CLF Conservation Law Foundation
CMAQ Congestion Mitigation and Air Quality Improve-
ment Program
CMP Congestion Management Process
CMR Code of Massachusetts Regulations
CNG Compressed Natural Gas
CO Carbon Monoxide
Page 89
Final FFYs 2018-2022 MVMPO TIP Appendix as Amended through November 2017 85
D DEP Department of Environmental Protection
DOT Department of Transportation
DPW Department of Public Works
E EB Eastbound
EIR Environmental Impact Report
EIS Environmental Impact Statement
EJ Environmental Justice
ENF Environmental Notification Form
E.O. Executive Order (of the Governor of the Com-
monwealth)
EPA U.S. Environmental Protection Agency
F FA Federal-Aid
FAPRO Federal Aid Program Reimbursement Office
FAST Act Fixing America’s Surface Transportation Act legis-
lation signed into law December 4, 2015
FHWA Federal Highway Administration
FTA Federal Transit Administration
FY (State) Fiscal Year
FFY Federal Fiscal Year
G GANs Grant Anticipation Notes
GHG Greenhouse Gas
H HPP USDOT High Priority Project
HSIP Highway Safety Improvement Program
Page 90
Final FFYs 2018-2022 MVMPO TIP Appendix as Amended through November 2017 86
I IM Interstate Maintenance
ITS Intelligent Transportation System
ISTEA Intermodal Surface Transportation Efficiency Act of
1991
L LEP Limited English Proficiency
LOS Level of Service
LTA Local Technical Assistance
M (M) Type of project = Maintenance
MAP-21 Moving Ahead for Progress in the 21st Century legis-
lation signed into law July 6, 2012
MassDOT Massachusetts Department of Transportation
MCAD Massachusetts Commission Against Discrimination
MEPA Massachusetts Environmental Policy Act
M.G.L. Massachusetts General Laws
MOA Memorandum of Agreement
MOD Massachusetts Office on Disabilities
MOU Memorandum of Understanding
MPO Metropolitan Planning Organization
MVMPO Merrimack Valley Metropolitan Planning Organiza-
tion
MVPC Merrimack Valley Planning Commission
MVPGS Merrimack Valley Priority Growth Strategy
MVRTA Merrimack Valley Regional Transit Authority
N (N) Type of project = other, not capital expense, or oper-
ating expense, but other such as planning or design
Page 91
Final FFYs 2018-2022 MVMPO TIP Appendix as Amended through November 2017 87
NAAQS National Ambient Air Quality Standards
NARC National Association of Regional Councils
NB Northbound
NEPA National Environmental Policy Act
NFA Non-Federal Aid
NHS National Highway System
NMCOG Northern Middlesex Council of Governments
NOx Nitrogen Oxide
NPRM Notice of Proposed Rulemaking (Federal Register)
O (O) Type of Project = Operating Expense
O&M Operations and Maintenance
P PCI Pavement Condition Index
PDA Priority Development Area
PL (Metropolitan) Planning Funds
PMS Pavement Management System
PPP Public Participation Plan
PRC (MassDOT) Project Review Committee
PSAC Project Selection Advisory Council
PS&E The Plans, Specifications and Estimate to be used
by contractors to bid on construction proposals
R RGGI Regional Greenhouse Gas Initiative
ROW Right-of-Way
RPA Regional Planning Agency
RPMS Regional Pavement Management System
RTA Regional Transit Authority
RTP Regional Transit Plan
Page 92
Final FFYs 2018-2022 MVMPO TIP Appendix as Amended through November 2017 88
S SAFETEA-LU Safe, Accountable, Flexible, Efficient Transporta-
tion Equity Act: A Legacy for Users
SB Southbound
SD Structurally Deficient
SGR State of Good Repair
SIP State (Air Quality) Implementation Plan
SOV Single Occupancy Vehicle
SPR Statewide Planning and Research Funds
STBG Surface Transportation Block Grant Program
STIP Statewide Transportation Improvement Program
STP Surface Transportation Program
T TA Transportation Alternatives
TAP Transportation Alternatives Program
TCSP Transportation and Community System Preserva-
tion Grant Program
TDM Transportation Demand Management
TEA-21 Transportation Equity Act for the 21st Century
TEC Transportation Project Evaluation Criteria
TIP Transportation Improvement Program
TMA Transportation Management Area
TMC Turning Movement Count
TOD Transit-Oriented Development
TRB Transportation Research Board
U UPWP Unified Planning Work Program
USDOT U.S. Department of Transportation
Page 93
Final FFYs 2018-2022 MVMPO TIP Appendix as Amended through November 2017 89
V V/C Volume/Capacity Ratio
VMT Vehicle Miles Traveled
VOC Volatile Organic Compound
W WB Westbound
Massachusetts Executive Orders
EO 526 Nondiscrimination, Diversity, Equal Employment
Opportunity and Affirmative Action
EO 12898 Environmental Justice in Minority and Low Income
Populations, February 1994
EO 13166 Improving Access to Programs (and Services) for
persons with limited English Proficiency
Page 94
Final FFYs 2018-2022 MVMPO TIP Appendix as Amended through November 2017 90
Page intentionally left blank.
Page 95
Final FFYs 2018-2022 MVMPO TIP Appendix as Amended through November 2017 91
Appendix H Key to Maps Showing Locations of Transportation Projects
Page 96
Final FFYs 2018-2022 MVMPO TIP Appendix as Amended through November 2017 92
Appendix H Key to Maps Showing Locations of Transportation Projects
Map
Number
Project
Number City/Town Project Description
1 602418 Amesbury Amesbury – Reconstruction of Elm Street
1 607737 Amesbury/
Salisbury
Amesbury – Salisbury Trail Connector
at I-95
2 607541 Georgetown-
Boxford
Georgetown – Boxford Border to Boston
Trail from Georgetown Road to West Main
Street (Route 97)
2 607542 Georgetown-
Newbury
Georgetown– Newbury Border to Boston
Trail (Northern Georgetown to Byfield
Section)
3 608298 Groveland Groveland- Groveland Community Trail,
from Main Street to King Street
3 605753 Groveland
Groveland- Reconstruction of Route 97
(School Street) from Parker Street to
Gardner Street
4 608027 Haverhill Haverhill- Bradford Rail Trail Extension,
from Route 125 to Railroad Street
5 605306 Haverhill
Haverhill – Bridge Replacement,
H-12- 039, I-495 (NB & SB) over Merrimack
River
6 608809
Lawrence /
North
Andover
Resurfacing Rt.114 from I-495 to Middleton
Townline
Page 97
Final FFYs 2018-2022 MVMPO TIP Appendix as Amended through November 2017 93
Appendix H Key to Maps Showing Locations of Transportation Projects
(Continued)
Map
Number
Project
Number City/Town Project Description
7 608494
Newbury /
Newburyport
/ Salisbury
Resurfacing of Route 1
8 RTD –
5219 MVRTA
Newburyport – Intermodal Transit Parking
Facility Construction
8 608792 Newburyport Newburyport SRTS Middle and Elementary
Schools
9 608095 North
Andover
North Andover- Corridor Improvements on
Route 114, between Route 125 (Andover
Street) & Stop & Shop driveway
10 606159 North
Andover
North Andover – Intersection & Signal
Improvements at Route 125 & Massachusetts
Avenue
11 605020 Salisbury Salisbury - Multi-use Trail Extension (Borders
to Boston Trail)
Page 98
Final FFYs 2018-2022 MVMPO TIP Appendix as Amended through November 2017 94
Page intentionally left blank.
Page 99
Final FFYs 2018-2022 MVMPO TIP Appendix as Amended through November 2017 95
Appendix I Comments Received on Draft 2018 to 2022 TIP
Page 100
Final FFYs 2018-2022 MVMPO TIP Appendix as Amended through November 2017 96
Comments Received on Draft MVMPO 2018-2022 TIP
MVRTA Comment: Correction needs to be made – FY 2022 – delivery of 6 new buses to re-
place 6 model year 2011 delivery should be in year 2023 not 2022 – the RTACAP will then be
available in State FY 2023 – that’s why there is $0 under State and the $582,240 under local
(the place holder number).
Response: Change made.
MassDOT Comments: The MassDOT comments are contained in the two page letter that
follows on pages 97 and 98.
Response: The requested changes have been made.
Please note that the changes related to “the error in the Total Quantified Impact field at the
bottom of the sheet” do not relate to the Draft document sent out to public review. These
changes have been made to a template of projects MassDOT prepares, the Draft document
itself did not have errors in the Total Quantified GHG numbers.
MassDOT Additional Comment: MassDOT additionally commented that the project descrip-
tion of project # 605306 has been changed from “Haverhill – Superstructure Replacement, H-
12-039, I-495 (NB & SB) over Merrimack River” to “Haverhill – Bridge Replacement, H-12-
039, I-495 (NB & SB) over Merrimack River”.
Response: The change has been made.
FHWA Comments: The FHWA comments are contained in the chart titled “TIP Review
Checklist” on pages 99 to 106 below. The column labeled “Responses” are the responses to
the FHWA “Comments” column.
Repsonse: The reponses to FHWA comments are in the “Responses” column. Two new ta-
bles have been added to the document in response to the FHWA comments.
The first is in the Performance Measures section, the table starts on page 13 of the Main
document and lists all of the programmed projects and which Federal performance target(s),
the project will help meet.
The second is in the Equity Analysis section on page 129 of the Main document, the table
summarizes the percent of population in Title VI / EJ communities relative to the percent of
Federal highway funding programmed. This table illustrates consistency between the percent
of population in Tilte VI / EJ areas and the percent of funding in those areas.
Conservation Law Foundation (“CLF”) Comments: See letter on pages 107 to 108.
Page 101
Final FFYs 2018-2022 MVMPO TIP Appendix as Amended through November 2017 97
massDOTCharles D. Baker; Governor Karyn E. Polito, Ueutenant Governor Stephanie Pollack, MassDOT Secretary & CEO Massachusetts Department of Transportation
May 15, 2017
Karen Sawyer Conard, Executive DirectorMerrimack Valley Planning Commission 160 Main Street Haverhill, MA 01830
Dear Ms. Conard:
The Massachusetts Department of Transportation (MassDOT) Office of Transportation Planning (OTP) has reviewed the draft 2018-2022 Transportation Improvement Program (TIP) released by the Merrimack Valley Metropolitan Planning Organization (MPO) on April26, 2017. The following MassDOT comments include both general guidance and specific comments on the MPO's 3C planning process related to the content of this doc-ument as released for public review.
Please note the following comments specific to the information contained in the MPO'sdraft 2018-2022 TIP.
Narrative
• Pages 10-12- Please maintain font consistency
Federal Highway Project Listing
FFY 2021 • 608095 - Please follow Advanced Construction (AC) nomenclature in Additional
Information • 607542- Please change MPQ to Merrimack Valley
GHG Impacts
2018 Highway Tab
•
•
608809 - label as qualitative decrease
Please address the error in the Total Quantified Impact field at the bottom of the sheet.
2019 Highway Tab
•
•
•
608792 - label as qualitative decrease
602418 - GHG impacts should be shown in the last year of funding
Please address the error in the Total Quantified Impact field at the bottom of the sheet.
Ten Park Plaza, Suite 4160, Boston,MA 021 1 6
Tel: 857-368-4636,TTY:857-368-0655 www.mass.govjmassdot
Page 102
Final FFYs 2018-2022 MVMPO TIP Appendix May 2017 98
2020 Highway Tab
• 602418 - GHG impacts should be shown in the last year of funding
• Please address the error in the Total Quantified Impact field in Section 2C at the
bottom of the sheet.
Completed Highway projects
• Please add fiscal years.
Equity Analysis
• Equity analysis provides data but does not include a conclusion. Please addnarrative to conclude the results of the analysis and explain if the program is
equitable.
Executive D rector Office of Transportation Planning
Cc: Jeffrey McEwen, Division Administrator, Federal Highway Administration Mary Beth Mello, Regional Administrator, Federal Transit Administration Paul Stedman, District 4 Highway Director Astrid Glynn, Rail and Transit Division Administrator
1
Page 103
Final FFYs 2018-2022 MVMPO TIP Appendix as Amended through November 2017 99
TIP Review Checklist
23 CFR 450.326 ‐‐"DEVELOPMENT AND CONTENT OF THE TRANSPORTATION IMPROVEMENT PROGRAM (TIP) YES NO N/A COMMENTS Responses
Does the TIP cover a period of at least four years and is it
updated every four years or more frequently?
450.326(a)
YES
Is the TIP cycle compatible with the STIP cycle?
450.326(a) YES
If a non‐attainment or maintenance area, has the MPO
made a conformity determination? 450.326(a)
X
Were all interested parties given a reasonable op‐
portunity to comment on the TIP as required by
450.316(a) & 450.326(b)?
YES
Solicitation plan is comprehensive;In
Process Was the TIP made available for public review and in ac‐
cessible formats, including the Web? 450.326(b) & 23
CFR 450.316(a)
PDF is not widely considered an
acessible format because it is not
readable by older screen readers.
Can the MPO provide an html
version too?
Originally software issues pre‐
vented a readable conversion
to html. The issues have been
resolved and therefore an
html version will be created.
Page 104
Final FFYs 2018-2022 MVMPO TIP Appendix as Amended through November 2017 100
TIP Review Checklist
23 CFR 450.326 ‐‐"DEVELOPMENT AND CONTENT OF THE TRANSPORTATION IMPROVEMENT PROGRAM (TIP) YES NO N/A COMMENTS Responses Were performance targets clearly identified (450.306(d))
and is there a method to evaluate progress? 450.326 (c)
X
Performance targets under the new
rule are being developed by
MassDOT and the MPOs. The dis‐
cussion beginning on page 10 does
not contain information about per‐
formance monitoring and the effec‐
tiveness of the previous TIP in meet‐
ing any established targets. A moni‐
toring and reporting system that
demonstrates the previous
TIP's effectiveness in meeting those
targets will need to be included in
this section, if not provided else‐
where in the TIP. Although this may
not be an absolute
requirement at this time. I would
encourage more discussion to help
shape this section as a template for
the next TIP.
A paragraph has been added to
page 12 of the Main document ‐
"Monitoring Progress in
Meeting Targets".
Page 105
Final FFYs 2018-2022 MVMPO TIP Appendix as Amended through November 2017 101
TIP Review Checklist
been added with a column that
23 CFR 450.326 ‐‐"DEVELOPMENT AND CONTENT OF THE TRANSPORTATION IMPROVEMENT PROGRAM (TIP) YES NO N/A COMMENTS Responses Does the TIP include a description of its anticipated effect
in achieving performance targets, linking investment pri‐
orities to targets? 450.326(d)
X
There will need to be a discussion
on how the investment priorities in
this TIP serve to meet the perfor‐
mance targets.
A table of highway projects
programmed in this TIP has
lists the Federal Performance
Target(s) that the project will
help meet. (Pages 13 to 16 of
the Main document). Does the TIP include both capital and non‐capital projects
(or project phases)? 23 CFR 450.326(e)
X
Does the TIP include all regionally significant projects,
regardless of funding source? 23 CFR 450.326(f)
X
Page 106
Final FFYs 2018-2022 MVMPO TIP Appendix as Amended through November 2017 102
TIP Review Checklist
23 CFR 450.326 ‐‐"DEVELOPMENT AND CONTENT OF THE TRANSPORTATION IMPROVEMENT PROGRAM (TIP) YES NO N/A COMMENTS Responses Does the TIP include for each project or phase (e..g. pre‐
liminary engineering, enviroronment/NEPA, right‐of‐
way, design or construction) the following: sufficient
descriptive material (i.e. type of work, termini and
length) to identify the project or phase; estimated total
project cost, or a project cost range, which may extend
beyond the four years of the TIP; the amount of Federal
funds proposed to be obligated during each program
year (for the first year, this includes the proposed cate‐
gory of Federal funds and source(s) of non‐Federal
funds, for the second, third and fourth years, this in‐
cludes the likely category or possible categories of Fed‐
eral funds and sources of non‐Federal funds; and
identification of the agencies responsible for carrying out
the project or phase; In nonattainment or maintenance
areas: 1) identification or TCM projects in the SIP; and 2)
must be in sufficient detail to make an air quality
analysis; In areas requiring ADA paratransit and key
station plans, identify projects that will support the
implementaiton of these plans. 23 CFR 450.326(g)
X
Page 107
Final FFYs 2018-2022 MVMPO TIP Appendix as Amended through November 2017 103
TIP Review Checklist
23 CFR 450.326 ‐‐"DEVELOPMENT AND CONTENT OF THE TRANSPORTATION IMPROVEMENT PROGRAM (TIP) YES NO N/A COMMENTS Responses
In nonattainment or maintenance areas, are project
classifications consistent with the "exempt project" clas‐
sifications contained in the EPA regs (40 CFR Part 93,
Subpart A) ? 450.326(h)
Are the projects or project phases identified in the TIP
consistent with the approved metropolitan transpor‐
tation plans? 23 CFR 450.326(i)
It would be helpful to explain any
variances in programming from the
project flow identified in the MTP.
A paragraph has been added on
page 9 of the Main document.
Does the TIP contain a financial plan that demonstrates
how the approved TIP can be implemented? 23 CFR
450.326(j)
X
Page 108
Final FFYs 2018-2022 MVMPO TIP Appendix as Amended through November 2017 104
TIP Review Checklist
and subtotals. This information
23 CFR 450.326 ‐‐"DEVELOPMENT AND CONTENT OF THE TRANSPORTATION IMPROVEMENT PROGRAM (TIP) YES NO N/A COMMENTS Responses Does the financial plan identify all public and private
funding sources that are reasonably expected to be
available? 23 CFR 450.326(j)
X
The plan could be more clear about
target funds available vs. target
funds programmed. The roll‐up of
all funds makes it difficult to distin‐
guish.
The Summaries of Highway
Funding Categories on pages 90
to 94 of the Main document
have been updated to include a
separate Target Funding section
is also on the first page of each
year in the project listings in
"Section 1A Fiscal Constraint
Analysis" following "Section 1A
Regionally Prioritized Projects"
where the projects using Re‐
gional Target Funding are
listed. If the financial plan includes an recommendations for
new funding sources, are strategies to ensure their
availability identified? 23 CFR 450.326(j)
X
not discussed
Does the financial plan reflect revenue and cost
estimates in "year of expenditure dollars", using an
inflation rate based on reasonable financial principles
and information? 23 CFR 450.326(j)
X
Does the TIP demonstrate financial constraint and is it
maintained by year? 23 CFR 450.326(k) X
Page 109
Final FFYs 2018-2022 MVMPO TIP Appendix as Amended through November 2017 105
TIP Review Checklist
throughout the region, similar to
23 CFR 450.326 ‐‐"DEVELOPMENT AND CONTENT OF THE TRANSPORTATION IMPROVEMENT PROGRAM (TIP) YES NO N/A COMMENTS Responses In nonattainment or maintenance areas, are projects
included in the first 2 years s limited to those for which
funds are available or committed? 450.326(k)
X
Does the TIP identify the criteria and process for
prioritizing projects for inclusion in the TIP and any
changes in priorities from previous TIPs? 23 CFR
450.326(n)(1)
X
Does the TIP list major projects from the previous TIP
that were implemented and identify any significant de‐
lays in the planned implementation of major projects?
23 CFR 450.326(n)(2)
X
It doesn't appear that Part C.3. in‐
clude a status of all projects in the
region? Wouldn't you want the sta‐
tus to square with the programmed
funding allocated
what you estimated/programmed in
the financial plan? Because you lay‐
out the financial plan to include in‐
vestments with both target and
non‐target funds, I would suggest a
status table on non‐target State pro‐
jects as well.
All previous first year (2017)
projects, both Target and
Statewide were included in the
table in community order, the
table is now separated into two
tables, Target Projects and
Statewide Projects.
If a non‐attainment or maintenance area, does the TIP
describe the progress in implementing any required
TCMs, in accordance with 40 CFR Part 93? 23 CFR
450.326(n)(3)
X
Page 110
Final FFYs 2018-2022 MVMPO TIP Appendix as Amended through November 2017 106
TIP Review Checklist
Additional Notes: Page 9‐‐TIP requirements are now at 450.326, rather
than 450.324. Change made
23 CFR 450.326 ‐‐"DEVELOPMENT AND CONTENT OF THE TRANSPORTATION IMPROVEMENT PROGRAM (TIP) YES NO N/A COMMENTS Responses
If a nonattainment or maintenance area, is the MPO in a
conformity lapse period (12‐month)? X
See 450.326(o) for specifics
Were all projects that were advanced in place of others
within the first 4 years of the TIP, subject to the project
selection requirements of 450.332? 450.326(p)
X
Does the TIP include a self‐certification signed by the
MPO and the State certifying that the metropolitan
transportation planning process is being carried out in
accordance with all applicable requirements?
23 CFR 450.334(a)
X
Item #5 of the self‐certification
should reflect current authorization
FAST ACT. See 23 CFR 450.336(a)
Change made.
Page 111
Final FFYs 2018-2022 MVMPO TIP Appendix as Amended through November 2017 107
May 18, 2017
BY EMAIL
Anthony Komornick Transportation Program Manager Merrimack Valley Metropolitan Planning Organization c/o Merrimack Valley Planning Commission 160 Main Street Haver-hill, MA 01830 [email protected]
Re: Merrimack Valley Metropolitan Planning OrganizationDraft FY2018-2022 Transportation Improvement Program
Dear Mr. Komornick:
Conservation Law Foundation (“CLF”) submits these comments for consideration by theCentral Massachusetts Regional Planning Commission (“MPO”) during the written comment period for the Draft 2018-2022 Transportation Improvement Program (“TIP”). CLF is a non-profit, member-supported regional environmental organization working to conserve natural re-sources, protect public health, and promote thriving communities for all throughout New Eng-land. CLF has long advocated for enhanced public transportation in New England.
CLF supports a balanced TIP that enhances public transportation, pedestrian and bicycleinfrastructure, increases mobility for all, and protects the environment. As such, we support projects such as the following:
Project ID # 605020 in FY 2018 which extends the Border to Boston trail in Salisbury.
Project ID # 607737 in FY 2018 which constructs a trail connector at I-95 in Amesbury.
Project ID # 608298 in FY 2019 which extends the Groveland Community Trail fromMain Street to King Street.
Project ID # MV0001 in FY 2019 which flexes funds for MVRTA new bus upgrade tocleaner fuel buses.
Project ID # 608792 in FY 2019 which implements improvements at Nock MiddleSchool & Molin Upper Elementary School.
Page 112
Final FFYs 2018-2022 MVMPO TIP Appendix as Amended through November 2017 108
Project ID # 608027 in FY 2020 which extends the Bradford Rail Trail from Route 125 toRailroad Street in Haverhill.
Project ID #607541 in FY 2020 which extends the Border to Boston trail from Georgetown Road to West Main Street (Route 97) in Georgetown and Boxford.
Project ID # 607542 in FY 2021 which extends the Border to Boston Trail from NorthernGeorgetown to the Byfield section in Georgetown and Newbury.
CLF applauds the MPO for dedicating flex funding to purchase hybrid buses in supportof regional transit. In fact, CLF often highlights this laudable action to other MPOs in the Com-monwealth. Looking forward, CLF hopes to see further investment in the Merrimack Valley Re-gional Transit Authority and completion of the Border to Boston Trail.
Thank you for your consideration of these comments. If you have any questions, I can bereached by phone at (617) 850-1702 or by email at [email protected]
Sincerely,
Anne C. Lemelin Legal Fellow/Attorney
‐2‐
Page 113
Final FFYs 2018-2022 MVMPO TIP Appendix as Amended through November 2017 109
Appendix J October 2017 Amendments and Comments
Page 114
Final FFYs 2018-2022 MVMPO TIP Appendix as Amended through November 2017 110
MVMPO FFYs 2018-2022 Transportation Improvement Program
October 2017 Proposed Amendments
October 2017 Proposed Amendment # 1:
Amend Highway project # 605306 (Haverhill – Bridge Replacement, H-12-039, I-
495 (NB & SB) over Merrimack River) to increase total project cost to
$116,603,655 from $79,000,000 and add a fifth year to the project so that it is Ad-
vance Construction in FFYs 2018 to 2022, funded with Statewide NHPP-On Sys-
tem Funds, $23,320,731 per year for five years.
Comments:
No comments were received on Proposed Amendment # 1.
October 2017 Proposed Amendment # 2:
Amend to Add project # 608852 (Lawrence – Replace Superstructure
of Bridge L-04-021 Rte. 114 over Shawsheen River) to FFY 2022 to be
funded with Statewide Bridge Program Systematic Maintenance Fund-
ing.
Comments:
MassDOT District 4 stated that this superstructure replacement project was pro-
posed for funding using District Maintenance funds, however it was brought to the
attention of the distributor of the funds that this bridge requires more than mainte-
nance and actually needs to be widened to reduce a bottleneck, a project which
will cost much more than the $2,040,000 available in the maintenance fund.
The City of Lawrence provided comments in the letter on the following page.
Response:
Proposed Amendment # 2 was Tabled while the District and the City address the
funding issues.
Page 115
Final FFYs 2018-2022 MVMPO TIP Appendix as Amended through November 2017 111