96
Appendix

Appendix


Summary of Position and Full-Time Equivalent (FTE) Changes by Department:
This table provides a summary of total position and FTE changes by department for 2010, 2011, and
2012. Position counts for a department may exceed FTE counts as position counts tally part-time posi-
tions as discrete items.
City of Seattle—2012 Proposed Budget - 787 -

City of Seattle—2012 Proposed Budget - 788 -
Summary of Position and Full-Time Equivalent (FTE) Changes by Department
NOTES:
* Budgeted Positions/FTEs are based on 2010/2011 Position Authorization Ordinances 123308/123626.
** 2011-12 Changes represent Supplemental Oridinances, 2012 Endorsed Changes, and the 2012 Adopted Budget changes.
*** The Deparment of Executive Administration and the Fleets and Facilities Department were merged into the Department of Finance and
Administrative Services in 2011.
Department
Position
Count
FTE
Count
Position
Count
FTE
Count
Position
Count
FTE
Count
Position
Count
FTE
Count
Office of Arts and Cultural Affairs 25 23.10 23 20.60 (1) (0.75) 22 19.85
Office of City Auditor 8 8.00 8 8.00 1 1.00 9 9.00
Department of Finance 37 36.00
City Budget Office - - 29 28.50 (1) (1.00) 28 27.50
Seattle Center 280 263.23 264 245.12 - - 264 245.12
Civil Service Commissions - - - - 3 2.60 3 2.60
Civil Service Commission 2 1.80 2 1.80 (2) (1.80) - -
Department of Information
Technology213 210.00 199 195.00 (5) (4.75) 194 190.25
Department of Neighborhoods 95 87.50 81 74.75 (36) (33.25) 45 41.50
Department of Planning and
Development417 413.00 402 397.75 (7) (6.75) 395 391.00
Department of Parks and
Recreation1,106 1,011.16 993 890.89 (13) (26.80) 980 864.09
Educational and Developmental
Services Levy- - - - 8 8.00 8 8.00
Ethics and Elections Commission 6 5.20 6 5.20 1 1.00 7 6.20
Fleets and Facilities Department
***317 314.50 - - - - -
Department of Executive
Administration ***251 248.50 - - - - - -
Department of Finance &
Administrative Services***- - 529 523.75 (1) (2.00) 528 521.75
Human Services Department 339 331.35 331 323.10 (6) (7.00) 325 316.10
Office of the Hearing Examiner 5 4.63 5 4.63 - - 5 4.63
Office of Immigrant and Refugee
Affairs- - - - 2 2.00 2 2.00
Law Department 161 156.10 160 155.10 6 5.50 166 160.60
Legislative Department 89 89.00 86 86.00 1 1.00 87 87.00
Office of the Mayor 29 28.50 29 28.50 - - 29 28.50
Neighborhood Matching Subfund - - - - 6 6.00 6 6.00
Seattle Office for Civil Rights 24 22.50 23 21.50 1 1.00 24 22.50
Office of Economic Development 20 20.00 22 22.00 2 2.00 24 24.00
Office of Housing 42 40.50 40 38.50 (1) (1.00) 39 37.50
Office of Intergovernmental
Relations12 11.50 12 11.50 (1) (1.00) 11 10.50
Office of Sustainability and
Environment8 8.00 11 11.00 4 3.75 15 14.75
Personnel Department 119 116.50 107 104.25 (1) (1.00) 106 103.25
Public Safety Civil Service
Commission1 1.00 1 1.00 (1) (1.00) - -
2012 Estimate2011-12 Change **2011 Authorized *2010 Authorized *

City of Seattle—2012 Proposed Budget - 789 -
Summary of Position and Full-Time Equivalent (FTE) Changes by Department
NOTES:
* Budgeted Positions/FTEs are based on 2010/2011 Position Authorization Ordinances 123308/123626.
**** Personnel figures for The Seattle Public Library are for informational puposes only. The Library's position list is established by the Library
Board of Trustees.
** 2011-12 Changes represent Supplemental Oridinances, 2012 Endorsed Changes, and the 2012 Adopted Budget changes.
*** The Deparment of Executive Administration and the Fleets and Facilities Department were merged into the Department of Finance and
Administrative Services in 2011.
Department
Position
Count
FTE
Count
Position
Count
FTE
Count
Position
Count
FTE
Count
Position
Count
FTE
Count
Employees' Retirement System 16 15.50 16 15.50 2 2.50 18 18.00
Seattle City Light 1,881 1,872.10 1,818 1,810.75 - - 1,818 1,810.75
Seattle Department of
Transportation797 792.50 771 768.50 (48) (48.50) 723 720.00
Seattle Fire Department 1,178 1,156.55 1,173 1,151.55 1 1.00 1,174 1,152.55
Seattle Municipal Court 238 226.10 226 214.10 - - 226 214.10
Seattle Police Department 1,943 1,930.25 1,951 1,938.35 (2) (2.00) 1,949 1,936.35
Seattle Public Utilities 1,460 1,451.25 1,428 1,420.75 (8) (7.70) 1,420 1,413.05
Total Budgeted Positions / FTEs 11,119 10,895.82 10,746 10,517.94 (96) (108.95) 10,650 10,408.99
The Seattle Public Library **** 638 527.40 617 509.95 (1) (1.20) 616 508.75
CityWide Positions / FTEs 11,757 11,423.2 11,363 11,027.9 (97) (110.15) 11,266 10,918
2010 Authorized * 2011 Authorized * 2011-12 Change ** 2012 Estimate


City of Seattle—2012 Proposed Budget - 791 -
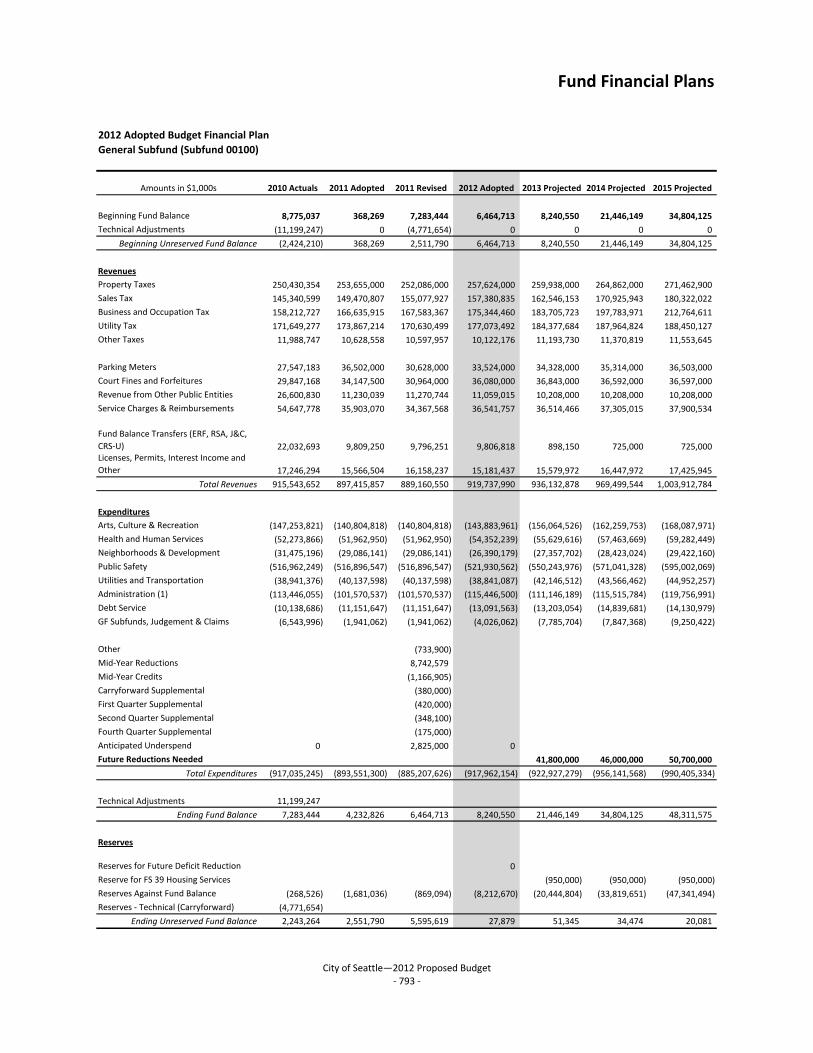
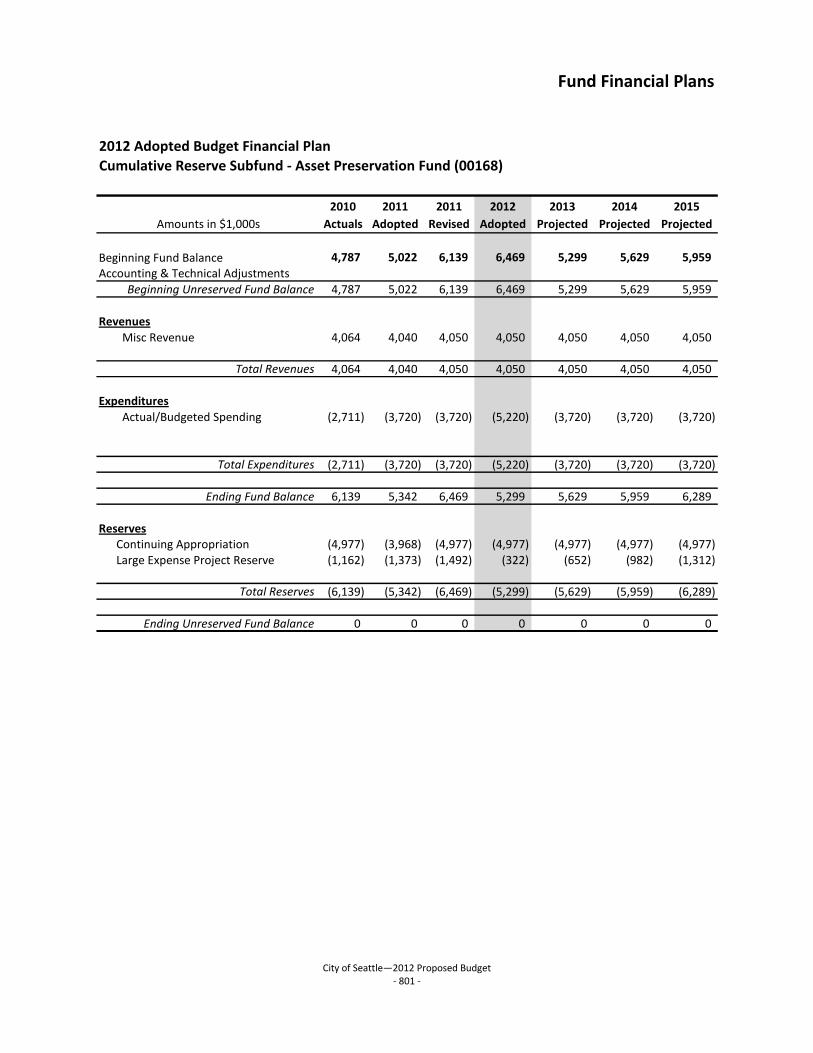
Fund Financial Plans:
A six-year financial plan is included for major City funds. The six-year financial plans include informa-
tion about fund revenues, expenditures, reserves and fund balances, covering the following mile-
stones: 2010 actual results, 2011 adopted, 2011 revised, 2012 adopted, and projections for 2013 –
2015. These funds allow the reader to see trends for major City funds.

City of Seattle—2012 Proposed Budget - 792 -
Fund Financial Plans
City of Seattle—2012 Proposed Budget - 792 -
Fund # Fund Name Page
00100 General Subfund ………………………………………………………………………………………………… 793
00140 Arts Account ……………………………………………………………………………………………………. 794
00160 Cable Television Franchise Sub-Fund ……………………………………………………………….. 795
00161 Cumulative Reserve Subfund, Real Estate Excise Tax II Subaccount …………………. 796
00163 Cumulative Reserve Subfund, Real Estate Excise Tax I Subaccount ………………….. 797
00164 Cumulative Reserve Subfund, Unrestricted Subaccount …………………………………… 798
00165 Neighborhood Matching Subfund ……………………………………………………………………. 799
00166 Cumulative Reserve Subfund - Revenue Stabilization Account ………………………… 800
00168 Cumulative Reserve Subfund, - Asset Preservation Subaccount ………………………. 801
00169 Cumulative Reserve Subfund, Street Vacation Subaccount ……………………………… 802
00185 Emergency Subfund …………………………………………………………………………………………. 803
10200 Park and Recreation Fund ………………………………………………………………………………… 804
10300 Transportation Master Fund ……………………………………………………………………………. 805
10410 Library Fund …………………………………………………………………………………………………….. 807
10810 Streetcar Fund …………………………………………………………………………………………………. 808
11410 Seattle Center Fund …………………………………………………………………………………………. 809
15700 Planning and Development Fund ……………………………………………………………………… 810
16200 Human Services Operating Fund ……………………………………………………………………… 811
17856 2004 Families and Education Subfund of the Educational and Developmental Services Fund …………………………………………………………………………………………………… 812
17857 2012 Families and Education Subfund of the Educational and Developmental Services Fund …………………………………………………………………………………………………… 813
34440 2003 Fire Facilities Fund …………………………………………………………………………………… 814
41000 City Light Fund …………………………………………………………………………………………………. 815
43000 Water Fund ……………………………………………………………………………………………………… 817
44010 Drainage and Wastewater Fund ………………………………………………………………………. 819
45010 Solid Waste Fund ……………………………………………………………………………………………… 821
46010 Parking Garage Operations Fund ……………………………………………………………………… 823
50300 Fleets and Facilities Fund ………………………………………………………………………………… 824
50410 Information Technology Fund ………………………………………………………………………….. 825
60200 Firemen's Pension Fund …………………………………………………………………………………… 826
60400 Police Relief and Pension Fund ………………………………………………………………………… 827
62600 Municipal Arts Fund …………………………………………………………………………………………. 828
City of Seattle—2012 Proposed Budget - 793 -
Fund Financial Plans
2012 Adopted Budget Financial Plan
General Subfund (Subfund 00100)
Amounts in $1,000s 2010 Actuals 2011 Adopted 2011 Revised 2012 Adopted 2013 Projected 2014 Projected 2015 Projected
Beginning Fund Balance 8,775,037 368,269 7,283,444 6,464,713 8,240,550 21,446,149 34,804,125
Technical Adjustments (11,199,247) 0 (4,771,654) 0 0 0 0
Beginning Unreserved Fund Balance (2,424,210) 368,269 2,511,790 6,464,713 8,240,550 21,446,149 34,804,125
Revenues
Property Taxes 250,430,354 253,655,000 252,086,000 257,624,000 259,938,000 264,862,000 271,462,900
Sales Tax 145,340,599 149,470,807 155,077,927 157,380,835 162,546,153 170,925,943 180,322,022
Business and Occupation Tax 158,212,727 166,635,915 167,583,367 175,344,460 183,705,723 197,783,971 212,764,611
Utility Tax 171,649,277 173,867,214 170,630,499 177,073,492 184,377,684 187,964,824 188,450,127
Other Taxes 11,988,747 10,628,558 10,597,957 10,122,176 11,193,730 11,370,819 11,553,645
Parking Meters 27,547,183 36,502,000 30,628,000 33,524,000 34,328,000 35,314,000 36,503,000
Court Fines and Forfeitures 29,847,168 34,147,500 30,964,000 36,080,000 36,843,000 36,592,000 36,597,000
Revenue from Other Public Entities 26,600,830 11,230,039 11,270,744 11,059,015 10,208,000 10,208,000 10,208,000
Service Charges & Reimbursements 54,647,778 35,903,070 34,367,568 36,541,757 36,514,466 37,305,015 37,900,534
Fund Balance Transfers (ERF, RSA, J&C,
CRS-U) 22,032,693 9,809,250 9,796,251 9,806,818 898,150 725,000 725,000Licenses, Permits, Interest Income and
Other 17,246,294 15,566,504 16,158,237 15,181,437 15,579,972 16,447,972 17,425,945
Total Revenues 915,543,652 897,415,857 889,160,550 919,737,990 936,132,878 969,499,544 1,003,912,784
Expenditures
Arts, Culture & Recreation (147,253,821) (140,804,818) (140,804,818) (143,883,961) (156,064,526) (162,259,753) (168,087,971)
Health and Human Services (52,273,866) (51,962,950) (51,962,950) (54,352,239) (55,629,616) (57,463,669) (59,282,449)
Neighborhoods & Development (31,475,196) (29,086,141) (29,086,141) (26,390,179) (27,357,702) (28,423,024) (29,422,160)
Public Safety (516,962,249) (516,896,547) (516,896,547) (521,930,562) (550,243,976) (571,041,328) (595,002,069)
Utilities and Transportation (38,941,376) (40,137,598) (40,137,598) (38,841,087) (42,146,512) (43,566,462) (44,952,257)
Administration (1) (113,446,055) (101,570,537) (101,570,537) (115,446,500) (111,146,189) (115,515,784) (119,756,991)
Debt Service (10,138,686) (11,151,647) (11,151,647) (13,091,563) (13,203,054) (14,839,681) (14,130,979)
GF Subfunds, Judgement & Claims (6,543,996) (1,941,062) (1,941,062) (4,026,062) (7,785,704) (7,847,368) (9,250,422)
Other (733,900)
Mid-Year Reductions 8,742,579
Mid-Year Credits (1,166,905)
Carryforward Supplemental (380,000)
First Quarter Supplemental (420,000)
Second Quarter Supplemental (348,100)
Fourth Quarter Supplemental (175,000)
Anticipated Underspend 0 2,825,000 0
Future Reductions Needed 41,800,000 46,000,000 50,700,000
Total Expenditures (917,035,245) (893,551,300) (885,207,626) (917,962,154) (922,927,279) (956,141,568) (990,405,334)
Technical Adjustments 11,199,247
Ending Fund Balance 7,283,444 4,232,826 6,464,713 8,240,550 21,446,149 34,804,125 48,311,575
Reserves
Reserves for Future Deficit Reduction 0
Reserve for FS 39 Housing Services (950,000) (950,000) (950,000)
Reserves Against Fund Balance (268,526) (1,681,036) (869,094) (8,212,670) (20,444,804) (33,819,651) (47,341,494)
Reserves - Technical (Carryforward) (4,771,654)
Ending Unreserved Fund Balance 2,243,264 2,551,790 5,595,619 27,879 51,345 34,474 20,081

Fund Financial Plans
City of Seattle—2012 Proposed Budget - 794 -
2012 Adopted Budget Financial Plan
Arts Account ( Fund 00140)
2010 2011 2011 2012 2013 2014 2015
Amounts in $1,000s Actuals Adopted Revised Adopted Projected Projected Projected
Beginning Fund Balance 749 296 716 220 150 927 1,046
Accounting Adjustments 0 0 0 0 0 0 0
Beginning Unreserved Fund Balance 749 296 716 220 150 927 1,046
Revenues
Interest Earnings 9 10 10 12 15 20 20
Interest Increase / (Decrease) (2) 0 0 0 0 0 0
Admissions Tax Allocation to OACA 3,761 4,176 4,176 4,967 4,527 3,977 4,500
ARRA Grant 145
Total Revenues 3,914 4,186 4,186 4,979 4,542 3,997 4,520
Expenditures
Administrative Services (517) (343) (330) (384) (396) (408) (420)
Arts Account 0 0 0 0 0 0 0
Cultural Partnerships (2,873) (2,609) (3,003) (3,043) (2,877) (2,963) (3,052)
Community Development and Outreach (450) (451) (415) (478) (492) (507) (522)
Contract with DPR for Arts Programming 0 (1,020) (934) (1,144) 0 0 0
Q1 Suplemental/Carryforward (108)
Total Expenditures (3,947) (4,423) (4,682) (5,049) (3,765) (3,878) (3,994)
Ending Fund Balance 716 59 220 150 927 1,046 1,571
Reserves
Operating Reserve 0 0 0 (150) (400) (400) (400)
Encumbrances (409) 0 0 0 0 0 0
Total Reserves (409) 0 0 (150) (400) (400) (400)
Ending Unreserved Fund Balance 307 59 220 0 527 646 1,171

Fund Financial Plans
City of Seattle—2012 Proposed Budget - 795 -
2012 Adopted Budget Financial PlanCable Television Franchise Subfund (00160)
2010 2011 2011 2012 2013 2014 2015
Amounts in $1,000s Actuals Adopted Revised Adopted Projected 3 Projected 3 Projected 3
Beginning Fund Balance 6,079 4,780 5,068 4,697 3,994 3,434 2,782
Accounting & Technical Adjustments (5)Beginning Unreserved Fund Balance 6,074 4,780 5,068 4,697 3,994 3,434 2,782
Revenues
Franchise Fees 1 6,902 6,987 7,313 7,423 7,608 7,798 7,993
Misc. Revenues/Rebates 5 9
Interest Earnings 2 36 61 49 46 40 31 21
Total Revenues 6,938 7,048 7,362 7,478 7,648 7,830 8,015
Expenditures3
Finance and Administration (284) (290) (290) (300) (312) (324) (337)Technology Leadership and
Governance(306) (276) (276) (265) (272) (283) (294)
Technology Infrastructure (916) (1,426) (1,426) (1,412) (909) (945) (983)
Cable Funding -- Email (560) (582) (605)
Office of Electronic Communication(6,247) (5,369) (5,456) (6,014) (5,966) (6,157) (6,408)
Support to Library (190) (190) (190) (190) (190) (190) (190)
Other Supplemental Ordinances (95)
Total Expenditures (7,944) (7,551) (7,733) (8,181) (8,209) (8,481) (8,818)
Ending Fund Balance 5,068 4,276 4,697 3,994 3,434 2,782 1,979
Reserves
Designation for Cable Programs (2,995) (2,318) (2,311) (1,614) (1,082) (544) 0
Cash Float & Revenue Projection
Reserves 4(1,192) (1,133) (1,160) (1,227) (1,231) (1,272) (1,323)
Equipment Replacement for Capital
Acquisitions(600) (600) (600) (600) (600) (600) (600)
Total Reserves (4,786) (4,051) (4,070) (3,441) (2,913) (2,416) (1,923)
Ending Unreserved Fund Balance 282 225 627 553 521 366 56
Assumptions:1 Cable Franchise Fees for Revised 2011 based on YTD Jan-Jun Actuals in 2011. For future years, the model assumes
Franchise Fee revenue increases 1.5% in 2012 and 2.5% thereafter.
2 Interest rate on cash revised down to 1.0% from the 1.5% used when building the 2011 adopted/2012 endorsed budget.
3 Estimated Expenditures for 2013, 2014 and 2015 assume a 4% inflation rate. Exceptions to this are spending of
"Designation for Cable Programs" (Comcast Grant Obligations, spending finite grant funding), annual $190K Library
contributions, and Office of Electronic Communication's budgeted CIP spending4 Cash Float and Revenue Projections Reserve calculated as 15% of Expenditures. 5 Represents Impact from 2012 GS-72-1-A-2.

Fund Financial Plans
City of Seattle—2012 Proposed Budget - 796 -
2012 Adopted Budget Financial Plan
Cumulative Reserve Subfund - REET II (Fund 00161)
2010 2011 2011 2012 2013 2014 2015
Amounts in $1,000s Actuals Adopted Revised Adopted Projected Projected Projected
Beginning Fund Balance 13,794 10,577 10,246 11,840 9,308 14,408 21,333
Accounting & Technical Adjustments
Beginning Unreserved Fund Balance 13,794 10,577 10,246 11,840 9,308 14,408 21,333
Revenues
Real Estate Excise Taxes 11,842 11,897 14,550 14,462 16,994 19,931 22,336
Total Revenues 11,842 11,897 14,550 14,462 16,994 19,931 22,336
Expenditures
Direct CRS Spending (8,707) (5,819) (5,819) (5,600) (4,071) (4,072) (4,072)
CIP Supported Projects (6,682) (7,138) (7,138) (11,069) (7,822) (8,934) (8,307)
ADA Projects (325)
Total Expenditures (15,389) (12,957) (12,957) (16,994) (11,893) (13,006) (12,379)
Ending Fund Balance 10,246 9,517 11,840 9,308 14,408 21,333 31,290
Reserves
Continuing Appropriation (7,857) (8,487) (7,916) (7,846) (7,846) (7,846) (7,846)
Reserve for American Disabilities Act (1,925) (2,000) (4,000)
Reserve for Neighborhood (NSF) (1,000) (2,000) (3,000)
Reserve for Asset Preservation (SCA) (2,675) (2,675)
Reserve for Major Maintenance (1,600) (1,800) (8,750)
Fund Balance Target Reserve (1,000) (1,000) (1,000) (1,400) (2,000) (5,000) (5,000)
Total Reserves (8,857) (9,487) (8,916) (9,246) (14,371) (21,321) (31,271)
Ending Unreserved Fund Balance 1,389 30 2,924 62 38 12 19

Fund Financial Plans
City of Seattle—2012 Proposed Budget - 797 -
2012 Adopted Budget Financial PlanCumulative Reserve Subfund - REET I (Fund 00163)
2010 2011 2011 2012 2013 2014 2015
Amounts in $1,000s Actuals Adopted Revised Adopted Projected Projected Projected
Beginning Fund Balance 29,729 28,015 21,186 21,405 19,666 20,928 31,437
Accounting & Technical Adjustments
Beginning Unreserved Fund Balance 29,729 28,015 21,186 21,405 19,666 20,928 31,437
Revenues
Real Estate Excise Taxes 11,804 11,897 14,550 14,462 16,994 19,931 22,336
Total Revenues 11,804 11,897 14,550 14,462 16,994 19,931 22,336
Expenditures
Direct CRS Spending (3,247) (3,912) (3,912) (2,031) (874) (874) (874)
CIP Supported Projects (17,099) (10,463) (10,419) (12,496) (14,857) (8,548) (8,561)
ADA Projects (1,675)
Total Expenditures (20,346) (14,375) (14,331) (16,202) (15,731) (9,422) (9,435)
Ending Fund Balance 21,186 25,537 21,405 19,666 20,928 31,437 44,337
Reserves
Continuing Appropriation (17,320) (24,538) (17,317) (17,317) (17,317) (17,317) (17,317)Reserve for American Disabilities Act
Projects(1,075) (5,500) (6,500)
Reserve for Asset Preservation /Major
Maintenance(3,500) (15,500)
Fund Balance Target Reserve (1,000) (999) (1,000) (2,250) (2,500) (5,000) (5,000)
Total Reserves (18,320) (25,537) (18,317) (19,567) (20,892) (31,317) (44,317)
Ending Unreserved Fund Balance 2,866 (0) 3,088 99 36 120 20

Fund Financial Plans
City of Seattle—2012 Proposed Budget - 798 -
2012 Adopted Budget Financial PlanCumulative Reserve Subfund - Unrestricted (Fund 00164)
2010 2011 2011 2012 2013 2014 2015
Amounts in $1,000s Actuals Adopted Revised Adopted Projected Projected Projected
Beginning Fund Balance (1,240) 21,549 (4,933) (3,912) (2,581) 4,648 2,560
Accounting & Technical Adjustments
Beginning Unreserved Fund Balance (1,240) 21,549 (4,933) (3,912) (2,581) 4,648 2,560
Revenues
Grants/Levy/Donations/Other 6,389 4,321 4,244 4,431 4,617 3,182 3,024
Misc Revenues 1 1,129 1,598 1,559 1,370 1,409 590 590
Property Sales 20,000 20,000 8,500
General Fund Support 500 500 500 500
Total Revenues 27,517 5,919 25,803 6,301 15,025 4,272 4,114
Expenditures
Direct CRS Spending (1,135) (1,187) (1,187) (1,148) (1,100) (74) (74)
CIP Supported Projects (10,075) (3,595) (3,595) (3,822) (4,196) (3,787) (3,632)
MOHAI Payment 2 (20,000) (11,500) (11,500) (2,500) (2,500) (3,500)
Support to General Fund (8,500) (8,500)
Total Expenditures (31,210) (24,782) (24,782) (4,970) (7,796) (6,361) (7,206)
Ending Fund Balance (4,933) 2,686 (3,912) (2,581) 4,648 2,560 (532)
Reserves
Continuing Appropriation (6,087) (7,825) (6,087) (6,087) (6,087) (6,087) (6,087)
Total Reserves (6,087) (7,825) (6,087) (6,087) (6,087) (6,087) (6,087)
Ending Unreserved Fund Balance (11,020) (5,139) (10,000) (8,669) (1,439) (3,527) (6,619)
Assumptions:
1) Includes Intersest Earnings, Street Vacations, Parking Fees
2) The CRS-Unrestricted Subaccount was used to facilitate the distribution of the proceeds from the sale of McCurdy
Park facilities formerly occupied by the Museum of History and Industry (MOHAI). In accordance with the settlement
agreement between the City of Seattle and MOHAI, the City received $20 million of sale proceeds in 2010 from the State
and transferred this full amount to MOHAI. An additional $20 million of McCurdy Park facilities sale proceeds from the
State was received in 2011. From this second $20 million payment, $11.5 million was transferred to MOHAI in 2011,
with the remaining $8.5 million to be paid from the City to MOHAI in three annual installments between 2013 and 2015.
The 2013 through 2015 payments are anticipated to be supported by land sale proceeds.

Fund Financial Plans
City of Seattle—2012 Proposed Budget - 799 -
2012 Adopted Budget Financial Plan
Neighborhood Matching Subfund (Fund 00165)
2010 2011 2011 2012 2013 2014 2015
Amounts in $1,000s Actuals Adopted Revised Adopted Projected Projected Projected
Beginning Fund Balance 4,198 3,860 4,284 4,085 3,771 3,451 3,124
Accounting Adjustments 0 0 0 0 0 0 0
Beginning Unreserved Fund Balance 4,198 3,860 4,284 4,085 3,771 3,451 3,124
Revenues
Intergov. Transfer from Finance General 3,354 2,939 2,939 2,779 2,835 2,891 2,949
Mid Year Cut (101) (88)
Total Revenues 3,253 2,939 2,851 2,779 2,835 2,891 2,949
Expenditures
Large Project Fund (1,116) (1,182) (1,031) (1,198) (1,221) (1,246) (1,271)
Community Granting Division (866) (744) (716) (710) (724) (738) (753)
Small and Simple Fund (1,105) (1,308) (1,288) (1,171) (1,194) (1,218) (1,243)
Small Sparks Fund (58) (15) (15) (15) (15) (16) (16)
Tree Fund (23) 0 0 0 0 0 0
Total Expenditures (3,167) (3,249) (3,050) (3,093) (3,155) (3,218) (3,282)
Ending Fund Balance 4,284 3,550 4,085 3,771 3,451 3,124 2,791
Reserves
Encumbrances (1,551) (1,628) (1,628) (1,628) (1,628) (1,628) (1,628)
Other Reserves (2,425) (1,608) (2,033) (2,032) (1,706) (1,366) (1,013)
Total Reserves (3,976) (3,236) (3,661) (3,660) (3,334) (2,994) (2,641)
Ending Unreserved Fund Balance 309 314 424 111 117 130 150

Fund Financial Plans
City of Seattle—2012 Proposed Budget - 800 -
2012 Adopted Budget Financial PlanCumulative Reserve Subfund - Revenue Stabalization (00166)
2010 2011 2011 2012 2013 2014 2015
Amounts in $1,000s Actuals Adopted Revised Adopted Projected Projected Projected
Beginning Fund Balance 21,724 10,469 10,469 11,219 13,169 17,169 21,169
Accounting & Technical Adjustments
Beginning Unreserved Fund Balance 21,724 10,469 10,469 11,219 13,169 17,169 21,169
Revenues
General Fund Support 5,225 750 750 1,950 4,000 4,000 4,000
Total Revenues 5,225 750 750 1,950 4,000 4,000 4,000
ExpendituresCY Actual / Budgeted Appropriations (16,480)
Total Expenditures (16,480) 0 0 0 0 0 0
Ending Fund Balance 10,469 11,219 11,219 13,169 17,169 21,169 25,169
Reserves
Continuing Appropriation
Total Reserves 0 0 0 0 0 0 0
Ending Unreserved Fund Balance 10,469 11,219 11,219 13,169 17,169 21,169 25,169
Fund Financial Plans
City of Seattle—2012 Proposed Budget - 801 -
2012 Adopted Budget Financial Plan
Cumulative Reserve Subfund - Asset Preservation Fund (00168)
2010 2011 2011 2012 2013 2014 2015
Amounts in $1,000s Actuals Adopted Revised Adopted Projected Projected Projected
Beginning Fund Balance 4,787 5,022 6,139 6,469 5,299 5,629 5,959
Accounting & Technical Adjustments
Beginning Unreserved Fund Balance 4,787 5,022 6,139 6,469 5,299 5,629 5,959
Revenues
Misc Revenue 4,064 4,040 4,050 4,050 4,050 4,050 4,050
Total Revenues 4,064 4,040 4,050 4,050 4,050 4,050 4,050
Expenditures
Actual/Budgeted Spending (2,711) (3,720) (3,720) (5,220) (3,720) (3,720) (3,720)
Total Expenditures (2,711) (3,720) (3,720) (5,220) (3,720) (3,720) (3,720)
Ending Fund Balance 6,139 5,342 6,469 5,299 5,629 5,959 6,289
Reserves Continuing Appropriation (4,977) (3,968) (4,977) (4,977) (4,977) (4,977) (4,977) Large Expense Project Reserve (1,162) (1,373) (1,492) (322) (652) (982) (1,312)
Total Reserves (6,139) (5,342) (6,469) (5,299) (5,629) (5,959) (6,289)
Ending Unreserved Fund Balance 0 0 0 0 0 0 0

Fund Financial Plans
City of Seattle—2012 Proposed Budget - 802 -
2012 Adopted Budget Financial PlanCumulative Reserve Subfund - Street Vacation Fund (00169)
2010 2011 2011 2012 2013 2014 2015
Amounts in $1,000s Actuals Adopted Revised Adopted Projected Projected Projected
Beginning Fund Balance 1,332 712 86 955 747 1,765 1,965
Accounting & Technical Adjustments
Beginning Unreserved Fund Balance 1,332 712 86 955 747 1,765 1,965
Revenues
Misc Revenue 643 1,048 1,169 980 1,019 200 200
Total Revenues 643 1,048 1,169 980 1,019 200 200
Expenditures
Actual/Budgeted Spending (1,888) (300) (300) (1,189)
Total Expenditures (1,888) (300) (300) (1,189) 0 0 0
Ending Fund Balance 86 1,460 955 747 1,765 1,965 2,165
Reserves Continuing Appropriation (624) (624) (624) (624) (624) (624) (624)
Total Reserves (624) (624) (624) (624) (624) (624) (624)
Ending Unreserved Fund Balance (537) 836 331 123 1,142 1,342 1,542

Fund Financial Plans
City of Seattle—2012 Proposed Budget - 803 -
2012 Adopted Budget Financial PlanEmergency Fund - (Fund 00185)
2010 2011 2011 2012 2013 2014 2015
Amounts in $1,000s Actuals Adopted Revised Adopted Projected Projected Projected
Beginning Fund Balance 45,533 45,286 45,501 43,921 44,306 44,746 46,121
Accounting & Technical Adjustments
Beginning Unreserved Fund Balance 45,533 45,286 45,501 43,921 44,306 44,746 46,121
Revenue
CY Actual/Budget Contributions 385 440 1,375 2,050
Total Revenues 0 0 0 385 440 1,375 2,050
Expenditures
CY Actual / Budgeted Appropriations (32) (750) (750)
Supplementals (595)2010 Carry Forward (235)
Total Expenditures (32) (750) (1,580) 0 0 0 0
Ending Fund Balance 45,501 44,536 43,921 44,306 44,746 46,121 48,171
Reserves
Continuing Appropriation (235) Reserve for Asset Valuation Change
Total Reserves (235) 0 0 0 0 0 0
Ending Unreserved Fund Balance 45,266 44,536 43,921 44,306 44,746 46,121 48,171

Fund Financial Plans
City of Seattle—2012 Proposed Budget
2012 Adopted Budget Financial PlanParks and Recreation Operating Fund (10200)
2010 2011 2011 2012 2013 2014 2015Amounts in $1,000s Actuals Adopted Revised Adopted Projected Projected Projected
Beginning Fund Balance 5,541 2,630 8,110 3,784 2,148 2,148 2,148 Carry Forward / Encumbrances 0 0 0 0 0 0 0
Beginning Unreserved Fund Balance 5,541 2,630 8,110 3,784 2,148 2,148 2,148
RevenuesGolf 9,516 9,950 9,960 9,914 10,112 10,314 10,520 Aquarium 7,227 4,713 4,346 3,883 3,494 3,145 2,830 Seattle Conservation Corps 2,838 4,073 4,088 3,916 3,995 4,074 4,156 Charges for Services 11,892 13,189 13,189 13,452 13,721 13,996 14,276 General Government Support 82,575 80,057 78,129 81,464 84,583 86,275 88,000 Intergovernmental Support 54 0 0 0 0 0 0 Miscellaneous Revenue 1,199 563 563 503 513 524 534 Transfers from City Funds 8,149 7,942 7,958 8,188 8,352 8,519 8,690
Total Revenues 123,450 120,487 118,234 121,320 124,770 126,846 129,006
ExpendituresEnterprise 0 0 0 0 0 0 0 Environmental Learning and Programs (3,654) (3,518) (3,546) (3,747) (3,827) (3,903) (3,981)Facility and Structure Maintenance (12,498) (12,958) (13,207) (13,617) (13,906) (14,184) (14,468)Finance and Administration (6,985) (8,833) (8,760) (7,885) (8,053) (8,214) (8,379)Golf (8,422) (9,017) (9,028) (9,418) (9,609) (9,802) (9,998)Golf Capital Reserve (824) (435) (435) 0 0 0 0 Judgment and Claims (1,642) (1,143) (1,143) (1,143) (1,166) (1,190) (1,213)Natural Resources Management (6,169) (6,318) (6,472) (6,599) (6,740) (6,875) (7,012)
Park Cleaning, Landscaping, and Restoration (23,429) (24,666) (24,564) (26,357) (26,911) (27,450) (27,999)Planning, Development, and Acquisition (6,003) (6,714) (7,219) (6,251) (6,387) (6,514) (6,645)Policy Direction and Leadership (3,747) (3,735) (3,628) (5,000) (5,106) (5,209) (5,313)Recreation Facilities and Programs (22,333) (21,828) (21,772) (21,042) (21,178) (21,601) (22,034)Seattle Aquarium (7,849) (4,713) (4,346) (3,876) (3,494) (3,145) (2,830)Seattle Conservation Corps (3,264) (4,073) (4,088) (3,913) (3,995) (4,074) (4,156)Swimming, Boating, and Aquatics (7,699) (7,288) (7,291) (7,521) (7,678) (7,832) (7,988)Woodland Park Zoo (6,363) (6,484) (6,484) (6,588) (6,719) (6,854) (6,991)Q1 Supplemental (511)Q2 Supplemental (25)
Total Expenditures (120,880) (121,724) (122,520) (122,956) (124,770) (126,846) (129,006)
Less Capital Improvements (Westbridge Debt) (40) (40)
Ending Fund Balance 8,110 1,353 3,784 2,148 2,148 2,148 2,148
ReservesWestbridge debt service payments (829) (829) (829) (829) (829) (829) (829)Golf Capital Reserve transfer in 1Q 0 0 0 0 0 0 Excess Charter/GF removed in 1Q 0 0 0 0 0 0 0
Total Reserves (829) (829) (829) (829) (829) (829) (829)
Ending Unreserved Fund Balance 7,281 523 2,955 1,319 1,319 1,319 1,319

Fund Financial Plans
City of Seattle—2012 Proposed Budget - 805 -
2012 Adopted Budget Financial PlanTransportation Master Fund Financial Plan (103XX)
Amounts in $1,000s 2010 Actuals 2011 Adopted 2011 Revised 2012 Adopted
2013
Projected
2014
Projected
2015
Projected
Beginning Fund Balance 34,155,520 29,620,644 33,136,065 0 0 0 0
Accounting/Technical Adjustments (1,009,657)Carry Forward / Encumbrances
Beginning Unreserved Fund Balance 33,145,863 29,620,644 33,136,065 0 0 0 0
Revenues
Interest Earnings 161,692
BTG EHT 603,910
IF Employee Hrs Tax Penalty 190,767
BTG CPT 24,172,892 22,387,240 23,547,965 24,607,623 25,346,000 26,106,380 26,889,571
BTG Levy 39,611,574 40,141,000 39,982,000 40,694,000 41,487,000 42,221,000 43,005,000
CPT 2.5% 4,941,424 5,886,991 6,151,906 6,336,463 6,526,557 6,722,354
Vehicle License Fee 4,506,994 4,650,000 6,800,000 6,868,000 6,937,000 7,006,370
GF 37,723,452 38,913,576 38,723,576 37,635,725 37,927,160 39,444,246 41,022,016
Gas Tax 12,995,266 13,691,088 12,691,088 12,964,909 12,964,909 12,964,909 12,964,909
CRS - REET II 8,537,878 4,232,950 4,232,950 4,071,000 2,700,000 2,700,000 2,700,000
CRS - Street Vacation 300,000 300,000 1,188,500
CRS - Unrestricted - Proposition 2 0 0 1,074,150 1,025,625 504,500 256,250
Other Street Use & Curb Permit 5,010,412 6,938,241 5,047,386 5,352,435 5,566,532 5,789,194 6,020,761
Other Non-Business Licenses/PE 625,377 805,506 805,506 917,418 917,418 917,418 917,418
Interlocal Grants 213,332 1,425,046
Private Reimbursements 650,000 650,000 5,750,000 375,000
Other Protective Inspection 1,088,978 900,234 933,173 959,606 997,990 1,037,910 1,079,426
Street Maintenance & Repair 826,038 934,231 803,961 954,366 992,541 1,032,242 1,073,532
Other Charges - Transportation 45,794,651 42,912,915 41,230,389 62,754,266 61,938,060 37,709,745 12,047,550
Federal Grants 30,208,425 14,148,801 29,283,081 16,868,153 7,048,000
State Grants 6,698,663 24,435,797 24,835,797 21,389,519 24,420,135 27,824,159 27,627,394
LTGO Bond Proceeds 41,729,089 61,686,000 61,686,000 30,977,891 24,701,351 14,977,000 10,000 Local Improvement District Bond
Proceeds 30,400,000 Long-Term Intergovernmental Loan
Proceeds 4,200,000 4,200,000 1,800,000
IF Architect/Engineering Services 354,000 690,338
IF Other Charges - Transportation 12,512,965 13,411,892 9,039,315 6,602,429 6,857,758 7,132,068 7,417,351
IF Capital Contributions & Grants 1,364,550 1,364,550 2,000,000 12,500,000 10,400,000
Seattle City Light Fund 800,000 800,000 2,207,000 3,531,000 1,000,000 1,000,000
Seawall Levy 81,800,000 91,200,000
To Be Determined: Capital 7,622,000 32,234,000 20,927,000
Other - Voter Approved Levies, etc. 962,007 150,000
Loan from CPT Fund Balance 660,372
Emergency Subfund 495,000
Rubble Yard Property Proceeds 19,800,000
Finance General: Rubble Yard Reserve 5,860,000 2,240,000
Surplus Property Sales² 27,900,000 8,645,000
Total Revenues 270,327,740 302,302,439 331,138,728 295,499,942 326,573,281 370,143,328 340,286,903
Notes:
1. Expenditures in the Department Management BCL in 2012 include an $8.1 million appropriation which is necessary to transfer Rubble Yard proceeds
to Finance General, per Council's direction.
2. This plan assumes that certain specified property will be sold to repay the South Lake Union Streetcar Interfund capital loan in 2014, as authorized by
Ordinances 122603 and 123748.
3. This plan reflects the proposal to use Rubble Yard proceeds to cover core services in 2013 and 2014. Beginning in 2015, this gap will need to be
addressed either with new revenues, expenditure reductions, or a combination of the two.
(Continued on next page)

2012 Adopted Budget Financial Plan
Transportation Master Fund Financial Plan (103XX)
(Cont'd)
Amounts in $1,000s 2010 Actuals 2011 Adopted 2011 Revised 2012 Adopted 2013 Projected 2014 Projected 2015 Projected
Total Revenues 270,327,740 302,302,439 331,138,728 295,499,942 326,573,281 370,143,328 340,286,903
Expenditures
Bridges & Structures (7,225,450) (7,525,676) (7,486,601) (7,721,299) (8,036,754) (8,358,224) (8,692,553)
Department Management¹ 1,321,511 (712,185) (462,824) (10,568,516) (2,607,266) (2,711,557) (2,820,019)
Engineering Services (2,320,942) (1,891,726) (1,861,726) (1,624,523) (1,690,946) (1,758,584) (1,828,928)
General Expense (17,753,178) (22,787,184) (22,787,184) (30,286,344) (32,928,137) (36,809,343) (33,956,155)
Major Maintenance/Replacement (CIP) (55,209,214) (52,572,000) (69,087,742) (41,529,999) (52,802,049) (50,869,000) (36,874,586)
Major Projects (CIP) (78,393,237) (105,133,979) (105,159,455) (99,351,944) (136,293,318) (157,951,273) (164,781,239)
Mobility-Capital (CIP) (42,967,917) (32,634,416) (44,835,722) (46,482,389) (16,478,476) (21,259,950) (19,744,875)
Mobility-Operations (30,601,215) (36,842,898) (36,734,042) (35,139,563) (35,843,101) (37,276,825) (38,767,898)
ROW Management (9,881,611) (12,134,526) (10,782,125) (11,524,423) (11,996,864) (12,476,738) (12,975,808)
Street Maintenance (23,017,719) (30,059,962) (24,349,577) (22,019,373) (23,432,139) (24,369,425) (25,344,202)
Urban Forestry (4,288,564) (4,103,255) (4,403,255) (4,402,628) (4,582,652) (4,765,958) (4,956,596)
Total Expenditures (270,337,536) (306,397,810) (327,950,254) (310,651,001) (326,691,703) (358,606,878) (350,742,859)
TBD Revenue or Expenditure Reductions3 2,359,550
Ending Fund Balance 33,136,067 25,525,273 36,324,539 21,173,480 21,055,058 32,591,509 24,495,103
Reserves
Rubble Yard Reserve (16,800,000) (2,057,420)
Continuing Appropriations (32,446,057) (30,000,000) (22,929,902) (23,000,000) (23,000,000) (23,000,000) (23,000,000)
Total Reserves (32,446,057) (30,000,000) (39,729,902) (25,057,420) (23,000,000) (23,000,000) (23,000,000)
Ending Unreserved Fund Balance 690,008 (4,474,727) (3,405,363) (3,883,940) (1,944,942) 9,591,509 1,495,103
Notes:
1. Expenditures in the Department Management BCL in 2012 include an $8.1 million appropriation which is necessary to transfer Rubble Yard proceeds to Finance
General, per Council's direction.
2. This plan assumes that certain specified property will be sold to repay the South Lake Union Streetcar Interfund capital loan in 2014, as authorized by
Ordinances 122603 and 123748.
3. This plan reflects the proposal to use Rubble Yard proceeds to cover core services in 2013 and 2014. Beginning in 2015, this gap will need to be addressed
either with new revenues, expenditure reductions, or a combination of the two.
Fund Financial Plans
City of Seattle—2012 Proposed Budget - 806 -
(Cont’d.)

Fund Financial Plans
City of Seattle—2012 Proposed Budget - 807 -
2012 Adopted Budget Financial PlanThe Seattle Public Library (10410)
2010 2011 2011 2012 2013 2014 2015
Amounts in $1,000s Actuals Adopted Revised Adopted Projected Projected Projected
Beginning Fund Balance 623 334 926 473 473 473 473
Accounting Adjustments (7)
Beginning Unreserved Fund Balance 616 334 926 473 473 473 473
Revenues
Copy Services 51 75 63 60 60 60 60
Pay for Print 148 159 146 159 159 159 159
Fines/Fees 1,299 1,674 1,498 1,564 1,564 1,564 1,564
Parking - Central Library 275 300 297 300 300 300 300
Space Rental 400 150 150 150 150 150
Concessions Proceeds 4 3 3 3 3 3 3
Salvage Sales/Materials 62 50 50 50 50 50 50
Misc Revenue 5 3 5 3 3 3 3
Cable Franchise Fees 190 190 190 190 190 190 190
General Subfund Support 48,032 47,299 47,149 49,325 51,298 53,350 55,483
Total Revenues 50,067 50,153 49,550 51,804 53,777 55,829 57,962
Expenditures
Administrative Services (8,446) (9,072) (9,072) (9,376) (9,477) (9,856) (10,250)
City Librarian's Office (1,232) (986) (986) (1,030) (982) (1,021) (1,062)
Human Resource (1,115) (1,018) (1,018) (1,038) (1,056) (1,098) (1,142)
Public Services 0 0
Technology and Collection Services 0 0
Library Services Division (36,106) (35,857) (35,707) (37,118) (39,018) (40,578) (42,202)
Information Technology (2,858) (3,221) (3,221) (3,242) (3,344) (3,478) (3,617)
Extension of Closure Week/Staff Furlough or
replacement with an Equivalent Reduction
(638) (664) (690)
Information Technology Infrastructure (400) (416) (433)
Potential Increased Facilities Maintenance (688) (716) (744)
Balancing Reduction (for unfunded inflation) 99 202 310
Balancing Reduction (for potential items) 1,726 1,795 1,867
Total Expenditures (49,757) (50,153) (50,003) (51,804) (53,777) (55,828) (57,962)
Ending Fund Balance 926 334 473 473 473 473 473
Reserves
Encumbrances
Known Liability (372) (372) (372) (372) (372) (372)
Total Reserves (372) 0 (372) (372) (372) (372) (372)
Ending Unreserved Fund Balance 554 334 101 101 101 101 101
Notes:
1. The Library has not decided to continue a week furlough beyond 2012. If the funding for the furlough is not restored in 2013,
the Library may be required to implement a replacement $650,000 reduction in order to achieve the target savings.
2. The Balancing Reduction includes increments necessary to cover "Unfunded Inflation." The non-General fund revenue lines
are not expected to increase from year to year, creating a gap with expenditures that are growing by 4% annually. The amounts
are $99k in 2013, $202k in 2014, and $310k in 2015.

Fund Financial Plans
City of Seattle—2012 Proposed Budget - 808 -
2012 Adopted Budget Financial Plan
Seattle Streetcar Fund (Fund 10810)
Amounts in $1,000s 2010 Actuals
2011
Adopted
2011
Revised
2012
Adopted
2013
Projected
2014
Projected
2015
Projected
Beginning Fund Balance (3,241,592) (3,023,967) (3,465,169) (3,510,533) (3,646,034) (3,649,222) (3,645,893)Accounting & Technical Adjustments (308)
Beginning Unreserved Fund Balance (3,241,900) (3,023,967) (3,465,169) (3,510,533) (3,646,034) (3,649,222) (3,645,893)
RevenuesSponsorship Revenues 196,775 450,000 315,000 300,000 330,000 346,500 356,895 Farebox Recovery 86,304 0 90,619 95,150 98,004 100,945 103,973 FTA Funds 131,040 190,000 285,630 390,000 195,700 201,571 207,618 TBD Revenues 55,000 100,000 35,000
Total Revenues 414,119 640,000 691,249 785,150 678,704 749,016 703,486
Expenditures
Streetcar Operations and Maintenance (637,388) (611,716) (685,656) (878,273) (627,998) (690,640) (649,791)
Total Expenditures (637,388) (611,716) (685,656) (878,273) (627,998) (690,640) (649,791)
Pre-Adjustments Fund Balance (3,465,169) (2,995,683) (3,459,576) (3,603,656) (3,595,328) (3,590,846) (3,592,198)
Interest Expense 0 (46,983) (50,957) (52,378) (53,894) (55,047) (56,045)Anticipated Underspend 10,000
Ending Fund Balance (3,465,169) (3,042,666) (3,510,533) (3,646,034) (3,649,222) (3,645,893) (3,648,243)
Notes:
Through an interfund loan from the City's Cash Pool, the Seattle Streetcar Fund is authorized by Ordinance 123102 to carry a negative
balance of $3.65 million.
Interest Expense for 2010 was included in 2010 Actual Expenditures total of $637,388, which is why the Interest Expense for 2010 shows as
$0.

Fund Financial Plans
City of Seattle—2012 Proposed Budget
2012 Adopted Budget Financial Plan
Seattle Center Fund (11410)
2010 2011 2011 2012 2013 2014 2015
Amounts in $1,000s Actuals Adopted Revised Adopted Projected Projected Projected
Beginning Fund Balance 1,208 1,208 1,874 1,874 1,898 1,923 1,949
Accounting Adjustments (22) 0 0 0 0 0 0
Beginning Unreserved Fund Balance 1,186 1,208 1,874 1,874 1,898 1,923 1,949
Revenues
Access (Monorail and Parking) 4,393 4,842 4,842 5,052 5,254 5,464 5,683
Administration 1,564 1,629 1,629 1,657 1,723 1,792 1,864
Campus Grounds (Rent & Leases) 1,796 2,122 2,122 2,109 2,193 2,281 2,372
Campus Commercial Events 1,100 1,275 1,275 1,302 1,354 1,408 1,465
Community Programs 73 410 410 411 427 445 462
Cultural Facilities (Rent & Leases) 1,335 1,349 1,349 1,265 1,316 1,368 1,423
Debt 137 139 139 136 141 147 153
Festivals 633 519 519 528 549 571 594
General Subfund Support 11,686 11,699 11,435 11,337 11,790 12,262 12,753
Judgment & Claims 608 932 932 932 969 1,008 1,048
KeyArena 7,067 5,265 5,265 5,807 6,039 6,281 6,532
McCaw Hall 3,766 3,797 3,797 3,950 4,108 4,272 4,443
Total Revenues 34,158 33,978 33,714 34,486 35,865 37,300 38,792
Expenditures
Access (Monorail and Parking) (1,057) (1,103) (1,103) (1,135) (1,181) (1,228) (1,277)
Administration (6,894) (6,963) (6,878) (6,921) (7,198) (7,486) (7,785)
Campus Grounds (11,763) (11,543) (11,414) (11,560) (12,023) (12,503) (13,004)
Campus Commercial Events (700) (923) (913) (942) (980) (1,019) (1,060)
Community Programs (2,090) (1,979) (1,979) (2,037) (2,119) (2,204) (2,292)
Cultural Facilities (242) (148) (148) (213) (221) (230) (239)
Debt (137) (139) (139) (136) (141) (147) (153)
Festivals (750) (823) (823) (715) (744) (774) (805)
Judgment & Claims (608) (932) (932) (932) (969) (1,008) (1,048)
KeyArena (5,594) (5,490) (5,450) (5,801) (6,033) (6,274) (6,525)
McCaw Hall (3,635) (3,936) (3,936) (4,069) (4,232) (4,401) (4,577)
Total Expenditures (33,470) (33,978) (33,714) (34,462) (35,841) (37,274) (38,765)
Ending Fund Balance 1,874 1,208 1,874 1,898 1,923 1,949 1,975
Reserves
McCaw Hall Reserves (987) (843) (1,037) (1,087) (1,087) (1,087) (1,087)
Inventories (259) (272) (259) (259) (259) (259) (259)
Capital Improvement 0 0 0 0 0 0
Total Reserves (1,246) (1,115) (1,296) (1,346) (1,346) (1,346) (1,346)
Ending Unreserved Fund Balance 628 92 578 552 577 603 629
Cash Adjustments
Leases in Arrears 1 (1,000) 0 (1,300) (1,300) 0 0 0
Total Cash Adjustments (1,000) 0 (1,300) (1,300) 0 0 0
Assumptions1 Through actively working to both increase revenues, and to manage expenditures in 2012, Seattle Center seeks to increase fund balance in
order to move the fund out of a negative cash position, which exists due to several non-profit tenants having leases in arrears.

Fund Financial Plans
City of Seattle—2012 Proposed Budget - 810 -
2012 Proposed Budget Financial Plan
Planning and Development Fund (15700)
2010 2011 2011 2012 2013 2014 2015
Amounts in $1,000s Actuals Adopted Revised Adopted Projected Projected Projected
Beginning Fund Balance 13,030 5,737 3,900 3,870 4,522 5,756 7,064
Accounting Adjustments (2,312)
Beginning Unreserved Fund Balance 10,717 5,737 3,900 3,870 4,522 5,756 7,064
Revenues
Boiler 1,081 1,211 1,272 1,285 1,134 1,145 1,215
Building Development 15,314 16,945 18,708 18,716 20,322 22,031 23,757
Contingent Revenues - Unaccessed 0 6,199 0 6,620 6,620 6,620 6,620
Cum. Reserve Subfund-REET I - TRAO 61 150 150 155 159 164 169
Cum. Reserve Subfund-Unrestricted - Design
Commission278 370 300 303 312 321 331
Cum. Reserve Subfund-Unrestricted - TRAO 37 74 62 76 79 81 83
Electrical 3,606 4,464 4,370 4,694 5,067 5,117 5,428
Elevator 2,484 2,589 2,741 2,769 2,897 2,926 3,104
General Fund 9,728 9,120 8,905 9,196 9,472 9,756 10,048
Grants/MOAs - All Else 442 281 521 412 282 288 300
Grants/MOAs - Green Building Team - SPU &
SCL541 588 619 0 0 0 0
Grants/MOAs - SPU MOA for Side Sewer &
Drainage1,070 1,350 1,126 1,137 1,171 1,207 1,243
Interest 88 100 51 50 50 50 50
Land Use 3,724 3,664 3,416 3,656 4,218 4,261 4,307
Other 1,378 1,181 1,284 1,300 1,341 1,355 1,437
Site Review 1,176 1,260 1,363 1,377 1,497 1,512 1,604
Total Revenues 41,007 49,547 44,889 51,745 54,621 56,834 59,694
Expenditures
Annual Certification and Inspection (3,783) (3,968) (3,938) (3,980) (4,099) (4,222) (4,349)
Code Compliance (4,660) (4,622) (4,518) (4,796) (4,940) (5,089) (5,241)
Construction Inspections (12,075) (13,308) (11,326) (13,750) (14,163) (14,588) (15,025)
Construction Permit Services (14,633) (17,151) (12,918) (17,544) (18,071) (18,613) (19,171)
Department Leadership 0 0 0 0 0 0 0
Land Use Services (4,452) (3,728) (4,554) (4,258) (4,386) (4,517) (4,653)
Planning (7,264) (6,724) (7,005) (5,464) (5,628) (5,797) (5,971)
Process Improvements and Technology (957) (776) (660) (1,300) (2,100) (2,700) (2,000)
Total Expenditures (47,825) (50,277) (44,919) (51,093) (53,387) (55,526) (56,411)
Ending Fund Balance 3,900 5,007 3,870 4,522 5,756 7,064 10,347
Reserves
Core Staffing (1,194) (868) (1,099) (754) (1,757) (3,762) (6,972)
Process Improvements and Technology (81) 16 (35) (30) (29) (55) (60)
Total Reserves (1,276) (852) (1,134) (784) (1,786) (3,818) (7,032)
Ending Unreserved Fund Balance 2,624 4,154 2,736 3,738 3,970 3,246 3,316

Fund Financial Plans
City of Seattle—2012 Proposed Budget - 811 -
2012 Adopted Budget Financial PlanHuman Services Opearting Fund Financial Plan (16200)
2010 2011 2011 2012 2013 2014 2015
Amounts in $1,000s Actuals Adopted Revised Adopted Projected Projected Projected
Beginning Fund Balance 6,698 5,169 6,438 4,274 2,815 1,327 44
Accounting Adjustments
Beginning Unreserved Fund Balance 6,698 5,169 6,438 4,274 2,815 1,327 44
Revenues
ARRA Grants 2,479 2,415 2,470 77 - - -
Contributions / Private Sources 209 169 169 92 - - -
Federal Grants 42,611 62,344 62,974 35,915 36,813 37,733 38,677
Fines & Penalties 51 25 50 25 50 50 50
General Fund 52,274 51,963 51,935 54,352 56,526 58,787 61,139
Housing Levy - - - 850 850 850 850
Interlocal Grants 652 1,063 1,363 580 603 627 652
Investment Earnings 65 62 65 80 80 80 80
State Grants 15,147 15,887 14,597 15,276 15,887 16,523 17,183
Utility Funds 1,337 1,385 1,385 1,341 1,394 1,450 1,508
Total Revenues 114,824 135,357 135,007 108,588 112,204 116,100 120,139
Expenditures
Self-Sufficiency (1,976) (1,810) (1,810)
Domestic and Sexual Violence Prevention (4,646) (4,583) (4,670)
Early Learning and Family Support (13,947) (13,673) (13,196)Community Facilities (639) (591) (591)Youth Development and Achievement (10,438) (10,477) (10,598)Aging and Disability Services - AAA (39,093) (58,474) (58,318) (32,777) (33,637) (34,520) (35,427)
Community Support and Self-Sufficiency - - - (11,850) (12,286) (12,738) (13,207)
Leadership and Administration (7,465) (7,739) (7,739) (7,285) (7,534) (7,792) (8,060)Public Health Services (11,149) (11,142) (11,142) (11,870) (12,422) (12,919) (13,436)Transitional Living and Support (25,731) (28,430) (29,105) (28,820) (29,769) (30,750) (31,766)Youth and Family Empowerment - - - (17,445) (18,043) (18,663) (19,306)
Total Expenditures (115,085) (136,920) (137,170) (110,047) (113,692) (117,383) (121,201)
Ending Fund Balance 6,438 3,606 4,274 2,815 1,327 44 (1,018)
Reserves
Continuing Appropriations (Non-Grant
Funded) (256) - (84) (84) (84) (84) (84)
Mandatory Reserve for Child Care Bonus
Funds (2,407) (1,725) (1,907) (1,407) - - -
Other Mandatory Restrictions (2,443) (1,663) (1,599) (1,066) (1,066) (1,066) (1,066)Reserve for Cash Flow and Benefits/Paid
Leave (200) (200) (200) (200) (200) (200) (200)
Total Reserves (5,306) (3,588) (3,790) (2,757) (1,350) (1,350) (1,350)
Ending Unreserved Fund Balance 1,132 18 484 58 (23) (1,306) (2,368)
Note:
Figures beyond the 2012 adopted budget are merely projections and future adjustments will be required in order to balance.

Fund Financial Plans
City of Seattle—2012 Proposed Budget - 812 -
2012 Adopted Budget Financial Plan
Families & Education Levy Financial Plan (17856)
2010 2011 2011 2012 2013 2014 2015
Amounts in $1,000s Actuals Adopted Revised Adopted Projected4 Projected4 Projected4
Beginning Fund Balance 16,591 12,442 15,166 13,730 2,417 0 0
Accounting Adjustments (18)
Beginning Unreserved Fund Balance 16,573 12,442 15,166 13,730 2,417 0 0
Revenues
Property Tax 16,575 16,620 16,620 349
Investment Earnings 186 247 247 269
Unrealized Gains/losses of Investments (48)
Medicaid Match Grant Rev 170
Supplemental Revenue-Medicaid Match 250
Total Revenues 16,883 16,867 17,117 618 0 0 0
Expenditures
Early Learning (4,252) (4,209) (4,210) (2,518) (783)
Family Support & Involvement (3,018) (3,083) (2,667) (2,096) (49)
Support for High Risk Youth (1,296) (1,327) (1,468) (902) (560)
Out of School Time (2,975) (2,963) (2,963) (1,991) (498)
Student Health (4,022) (4,083) (4,499) (2,776) (300)
Crossing Guards (264) (149)
Administration & Evaluation (852) (747) (780) (506) (83)
Middle School Support (1,484) (1,420) (1,512) (991) (34)
Academic Improvement (126) (55) (55) (150) (110)
Revenue Backed Contracts-Medicaid Match
Grant
Q1 Supplemental-Medicaid Match (250)
Total Expenditures (18,290) (17,887) (18,552) (11,931) (2,417) 0 0
Ending Fund Balance 15,166 11,421 13,730 2,417 0 0 0
Reserves
Encumbrances1 (415) (415) (415)
Continuing Projects2 (2,440) (2,440) (2,025)
Reserve for out-year project spending3 (12,311) (8,566) (11,290) (2,417)
Total Reserves (15,166) (11,421) (13,730) (2,417) 0 0 0
Ending Unreserved Fund Balance 0 0 0 0 0 0 0
Notes:
2 Funding allocated to projects that are not yet encumbered.
1 Represents unspent balances on school-year contracts. The 2011 amount represents OFE's best estimate of future
encumbrance balances based on prior year information.
3 The 2004 Levy funding plan assumed excess revenue to be earned in the first year that would fund projects in the later years
of the Levy.
4 Represents OFE's best estimate for Levy expenditures beyond 2012, the Levy's last year; however final expenditures from
Fund 17856 may occur beyond 2013.

Fund Financial Plans
City of Seattle—2012 Proposed Budget - 813 -
2012 Adopted Budget Financial Plan
Families & Education Levy Financial Plan (17857)
2010 2011 2011 2012 2013 2014 2015
Amounts in $1,000s Actuals Adopted Revised Adopted Projected Projected Projected
Beginning Fund Balance 24,383 32,571 36,878
Accounting Adjustments
Beginning Unreserved Fund Balance 0 0 0 0 24,383 32,571 36,878
Revenues
Property Tax 31,659 32,195 32,565 32,917
Investment Earnings 264 573 682 908
Unrealized Gains/losses of Investments
Medicaid Match Grant Rev
Supplemental Revenue
Total Revenues 0 0 0 31,923 32,769 33,248 33,825
Expenditures
Early Learning (1,706) (5,765) (7,249) (8,178)
Elementary (1,394) (4,610) (5,759) (6,965)
Middle Schools (1,421) (4,695) (5,657) (6,214)
High Schools (831) (2,547) (2,605) (2,719)
Health (1,711) (5,509) (6,187) (6,336)
Administration (409) (1,254) (1,283) (1,314)
Evaluation (67) (200) (200) (200)
Total Expenditures 0 0 0 (7,540) (24,581) (28,941) (31,926)
Ending Fund Balance 0 0 0 24,383 32,571 36,878 38,777
Reserves
Encumbrances
Reserve for out-year project spending1(24,383) (32,571) (36,878) (38,777)
Total Reserves 0 0 0 (24,383) (32,571) (36,878) (38,777)
Ending Unreserved Fund Balance 0 0 0 0 (0) (0) (0)
Notes:
1The 2011 Levy funding plan assumed excess revenue to be earned in the first year that will fund projects in the later years
of the Levy.

Fund Financial Plans
City of Seattle—2012 Proposed Budget - 814 -
2012 Adopted Budget Financial PlanFire Facilities Levy (Fund 34440)
2010 2011 2011 2012 2013 2014 2015
Amounts in $1,000s Actuals Adopted Revised Adopted Projected Projected Projected
Beginning Fund Balance 31,245 22,150 24,442 32,083 6,891 2,764 2,764
Accounting & Technical Adjustments (25)
Beginning Unreserved Fund Balance 31,220 22,150 24,442 32,083 6,891 2,764 2,764
Revenue
Real & Personal Property Tax 1 11,782 11,750 11,750 7,659 209
Interest Earnings 270 176 176 115 3
Unrealized Gains/Losses-Inv GASB31 (85)
Parking Revenues and Reimbursement for
Federal Capital Contribution/Grant-Direct 2,891 3,233
Property Sales (anticipated) 400 1,000 1,018
Total Revenues 11,967 12,326 14,817 8,774 4,463 0 0
Expenditures
Neighborhood Stations (18,683) (5,300) (5,017) (28,101) (7,874)
Support Facilities (17)
Emergency Preparedness
Marine Program (44) (1,873) (2,158) (5,865) (716)
Total Expenditures (18,744) (7,173) (7,176) (33,966) (8,590) 0 0
Ending Fund Balance 24,442 27,302 32,083 6,891 2,764 2,764 2,764
Reserves
Continuing Appropriation (31,383) (30,084) (30,569) (5,835)
Anticipated Future Appropriation (2,764) (2,764) (2,764)
Total Reserves (31,383) (30,084) (30,569) (5,835) (2,764) (2,764) (2,764)
Ending Unreserved Fund Balance 2 (6,941) (2,782) 1,514 1,056 0 0 0
Notes:1 Revenues from the levy end in 2012. 2 Ending Unreserved Fund Balance is negative as the Continuing Appropriation reserve includes up front budget authority
for designated projects in future years.

Fund Financial Plans
City of Seattle—2012 Proposed Budget - 815 -
NOTES:
The Financial Plan represents the forecasted cash flows used in the utility's Financial Planning Model (FPM) as of 8/12/11, which was used to develop the 2012 Proposed
Budget. The FPM is used to evaluate City Light rate impacts, potential bond offerings, and the financial performance of the utility. The FPM is updated weekly and is
expected to deviate from this Financial Plan over time.
c) The Financial Plan explicitly shows bond proceeds as a source of funds, while bond proceeds are embedded within the transfer line of the budget’s Revenue Table.
The Financial Plan has been revised to reflect Council's budget action on the 2012 Adopted Budget. Council directed additional surplus funds into the RSA at the end of
2011 which is projected to bring the RSA to $139 million and eliminate the need for an RSA Surcharge. The Financial Plan has been revised to show an increased
drawdown of the RSA, no anticipated revenue from the RSA Surcharge, and reduced balances in the Light Fund.
The Financial Plan differs from the revenue and expenses shown in the 2011 Adopted and 2012 Adopted Budget in several ways, including:
a) The Financial Plan shows Wholesale Revenue and Power Marketing Revenue as net of expenses, while the budget reflects the gross revenues and expenses of these
functions.
b) The Financial Plan shows retail revenue as gross revenue, while the budget’s Revenue Table shows retail revenue net of rate discounts to low-income customers.
(Continued on next page)
2012 Adopted Budget Financial Plan
Seattle City Light (Fund 41000)
2010 2011 2011 2012 2013 2014 2015
Amounts in $1,000s Actuals Adopted Revised Adopted Projected Projected Projected
Beginning Cash Balance 64,334,520 183,548,957 197,132,840 303,937,379 257,437,954 282,313,428 252,580,422
Carry Forward / Encumbrances/Adjustments
Revised Beginning Cash Balance 64,334,520 183,548,957 197,132,840 303,937,379 257,437,954 282,313,428 252,580,422
Revenues
Retail Power Sales before Discounts 608,597,351 651,528,445 664,498,659 678,946,306 734,321,025 784,222,625 816,804,858
Revenue from RSA Surcharge 18,348,507 0 0 0 0 0 0
Wholesale Power, Net 54,151,397 96,823,607 110,552,086 60,470,941 104,253,869 101,040,761 99,096,699
Power Contracts 19,829,036 21,206,939 17,056,214 15,961,597 16,547,786 17,020,398 16,056,549
Power Marketing, Net 14,085,877 15,608,356 16,098,671 7,952,887 8,430,427 8,946,886 7,319,457
Other Outside Sources 31,379,069 30,139,990 31,306,752 34,511,897 30,380,957 31,167,967 32,236,978
Interest on Cash Accounts 3,846,132 4,514,248 5,187,343 5,377,885 6,721,373 8,188,127 10,278,225
Cash from (to) Rate Stabilization Account (54,265,627) (22,033,254) (59,734,397) 41,619,061 48,053 (872,339) (2,655,968)
Cash from Contributions 21,284,913 31,607,783 15,917,127 30,387,741 26,520,562 23,395,295 23,546,403
Cash from Bond Proceeds 175,847,865 188,296,538 153,725,502 212,761,537 235,529,652 217,765,195 162,982,681
Total Revenues 893,104,521 1,017,692,652 954,607,957 1,087,989,852 1,162,753,704 1,190,874,916 1,165,665,882
Expenditures
Power Contracts (268,865,453) (272,929,250) (257,391,495) (266,098,516) (295,328,398) (307,695,370) (317,231,130)
Production (28,308,908) (34,916,425) (33,505,738) (35,792,484) (36,577,193) (37,699,132) (38,903,772)
Transmission (7,616,076) (9,467,918) (8,771,647) (9,658,979) (9,873,939) (10,095,015) (10,322,566)
Distribution (54,630,469) (67,199,039) (63,995,617) (67,973,687) (66,596,860) (68,080,486) (69,688,151)
Conservation (3,215,344) (11,031,407) (7,183,713) (11,572,455) (8,247,906) (8,455,982) (8,646,602)
Customer Accounting (28,106,370) (29,999,327) (30,034,299) (30,600,515) (31,239,418) (31,935,684) (32,689,337)
Administration (47,557,606) (70,222,686) (66,166,037) (64,926,425) (79,789,443) (75,591,315) (72,422,485)
Rate Discounts (6,410,293) (6,826,147) (6,948,869) (7,011,266) (7,604,547) (8,078,656) (8,403,816)
Uncollectable Accounts (8,030,451) (5,847,876) (6,331,471) (6,097,521) (6,591,338) (7,037,067) (7,330,867)
Taxes and Franchise Payments (70,380,947) (73,622,669) (74,900,059) (78,044,094) (85,107,550) (90,315,545) (92,694,819)
Debt Service (118,371,944) (142,658,754) (142,079,534) (172,814,672) (177,824,443) (196,653,223) (206,317,621)
Capital Expenditures (218,609,847) (290,700,410) (290,286,533) (319,830,845) (334,096,086) (323,566,741) (278,230,574)
Technical and Accounting Adjustments 99,797,507 40,205,971 139,791,595 (64,067,817) 998,892 (55,403,707) 7,243,794
Total Expenditures (760,306,201) (975,215,936) (847,803,418) (1,134,489,277) (1,137,878,229) (1,220,607,922) (1,135,637,946)
Ending Cash Balance 197,132,840 226,025,673 303,937,379 257,437,954 282,313,428 252,580,422 282,608,358
Reserves
Construction Account (56,981,424) 0 (13,807,551) 0 (75,449,168) (29,503,733) (28,075,472)
Other Restricted Accounts (3,954,122) (13,966,061) (15,822,821) (28,026,748) (48,811,767) (72,538,765) (98,276,780)
Operating Contingency Reserve 0 0 0 0 0 0 0
Rate Stabilization Account (79,265,627) (101,102,938) (139,000,024) (97,380,963) (97,332,910) (98,205,249) (100,861,217)
Total Reserves (140,201,173) (115,068,999) (168,630,396) (125,407,711) (221,593,846) (200,247,747) (227,213,469)
Unreserved Ending Cash Balance 56,931,666 110,956,674 135,306,982 132,030,242 60,719,582 52,332,674 55,394,889

Fund Financial Plans
City of Seattle—2012 Proposed Budget - 816 -
(Cont’d.)
2012 Adopted Budget Financial Plan
Seattle City Light (Fund 41000)
2010 2011 2011 2012 2013 2014 2015
Amounts in $1,000s Actuals Adopted Revised Adopted Projected Projected Projected
Unreserved Ending Cash Balance 56,931,666 110,956,674 135,306,982 132,030,242 60,719,582 52,332,674 55,394,889
NOTES:
2010 2011 2011 2012 2013 2014 2015Financial Performance Actuals Adopted Revised Proposed Projected Projected Projected
Average System Rate before Discounts
($/MWh) $64.70 $69.17 $68.88 $70.49 $75.88 $80.47 $83.23
Rate Change from Prior Year (Systemwide) 13.8% 4.3% 4.3% 3.2% 7.6% 6.0% 3.4%
Retail Market Information
Average Residential Monthly Bill (before
discounts) $51.71 $53.81 $53.50 $54.97 $60.28 $63.52 $65.02
Percentage Change 17.5% 1.9% 3.5% 2.8% 9.7% 5.4% 2.4%
Cash Financing of CIP
In-Year Percentage 20% 35% 47% 33% 30% 33% 41%
2011-2016 Average Percentage n/a 41% 38% 38% 38% 38% 38%
Debt Service Coverage 1.78 1.80 2.09 1.79 1.80 1.80 1.80
NOTES
d) The Financial Plan shows revenue from the Rate Stabilization Account (RSA) surcharge and transfer from/to the RSA, while the budget’s Revenue Table shows revenues
from the RSA surcharge only.
e) The Financial Plan projects 2012 net wholesale revenue based on the 8/12/11 FPM forecast, which is $41.6 million lower than the RSA target amount of net wholesale
revenue. The Fund Table and Revenue Table in the 2012 Adopted Budget use the RSA target amount for net wholesale revenue and assume that there will be no
drawdown of the RSA in 2012.
f) The data source for 2010 Actuals for all Financial Performance indicators except for Debt Service Coverage is the current rate forecast for 2011-2015
g) The Average Residential Monthly bill is reported as calculated in the financial forecast model Key Financial Indicators table, which assumes that average residential
consumption is 710kWh

Fund Financial Plans
City of Seattle—2012 Proposed Budget - 817 -
2012 Adopted Financial Plan
Water Fund (Fund 43000)
2010 2011 2011 2012 2013 2014 2015
Amounts in $1,000s Actuals Adopted Revised Adopted Projected Projected Projected
OPERATING CASH
8,194 7,080 8,434 7,120 7,435 7,899 8,118
SourcesIncome Statement Items (in order of IS)Retail Water Sales 136,443 141,204 138,909 152,537 165,648 180,251 188,785 Wholesale Water Sales 44,830 47,200 45,902 47,574 47,268 47,103 46,794 Facilities Charges 242 173 242 2,199 2,199 2,747 2,747 Water Service for Fire Protection 5,958 6,659 6,635 7,052 7,658 8,333 8,728 Tap Fees 2,855 4,000 2,400 3,038 3,075 3,114 3,153 Other Operating Revenues 1,875 1,897 1,940 1,994 2,038 2,089 2,141 Build America Bond Interest Income 2,195 2,135 2,135 2,135 2,135 2,135 2,135 Rentals--Non-City 395 391 605 415 425 436 447 Other Non-Operating Revenue 385 243 508 379 384 389 394 Capital Grants and Contributions 1,605 3,143 1,709 1,854 1,883 1,916 1,964 Operating Grants 540 0 104 0 0 0 0 Transfers from Construction Fund 45,447 57,759 53,160 30,114 38,589 28,079 33,904 Investment Income (See Construction Fund) 0 0 0 0 0 0 0 Public Works Loan Proceeds 9,000 0 0 0 0 0 0 Inventory Purchased by SDOT 708 741 741 755 770 786 802 Op Transfer In - Rev Stab Subfund 3,000 1,434 1,434 0 0 0 0 Op Transfer In - Rev Stab Subfnd - BPA Acct 680 81 0 0 0 0 0 Call Center Reimbursement from SCL 1,638 1,727 1,722 1,685 1,719 1,753 1,788 GF Reimb Abandoned Vehicles 53 54 54 0 56 57 58 Reimbursement for NS activities 39 180 40 41 42 43 44
257,888 269,022 258,240 251,773 273,891 279,230 293,883
UsesCIPDistribution (17,525) (20,492) (20,492) (15,194) (19,778) (20,394) (22,751)Habitat Conservation Program (5,798) (11,123) (11,123) (4,913) (3,372) (3,649) (2,945)Shared Cost Projects (10,003) (15,048) (15,282) (14,641) (18,164) (17,696) (17,590)Technology (3,331) (4,770) (4,770) (5,358) (7,709) (8,685) (6,456)Transmission (1,017) (1,688) (1,686) (1,343) (3,027) (3,076) (3,137)Water Quality & Treatment (20,970) (18,329) (17,921) (6,613) (5,293) (1,547) (202)Water Resources (5,813) (6,516) (8,016) (5,616) (5,576) (8,743) (8,741)Watershed Stewardship (865) (1,142) (1,142) (1,828) (1,035) (729) (600)
CIP Subtotal (65,322) (79,108) (80,432) (55,506) (63,954) (64,519) (62,422)
Accomplishment Rate Adjustment 7,911 8,043 8,326 9,593 9,678 9,363
O&MAdministration (6,946) (4,137) (5,469) (8,743) (9,093) (9,457) (9,835)Customer Service (9,062) (10,222) (10,209) (10,010) (10,411) (10,827) (11,260)General Expense (131,481) (134,772) (133,438) (136,550) (142,012) (147,693) (153,600)Other Operating (41,835) (47,068) (47,068) (47,754) (49,664) (51,650) (53,716)
O&M subtotal (189,323) (196,199) (196,184) (203,058) (211,180) (219,627) (228,412)
(254,645) (267,396) (268,573) (250,238) (265,541) (274,468) (281,471)
(3,003) (1,670) 9,018 (1,219) (7,885) (4,544) (12,206)
8,434 7,036 7,120 7,435 7,899 8,118 8,324
(Continued on Next Page)
Beginning Operating Cash Balance
Total Sources
Total Uses
Adjustments
Ending Operating Cash Balance

Fund Financial Plans
City of Seattle—2012 Proposed Budget - 818 -
2012 Adopted Financial Plan
Water Fund (Fund 43000) (cont'd.)
2010 2011 2011 2012 2013 2014 2015Amounts in $1,000s Actuals Adopted Revised Adopted Projected Projected Projected
CONSTRUCTION FUND
15,646 77,220 99,124 33,523 3,457 42,647 14,642
Bond Proceeds 132,748 33,232 0 0 81,830 0 74,468Transfer to Bond Reserve Account (7,748) (1,709) 0 0 (4,175) 0 (3,799)Transfers to Operating Fund (45,447) (57,759) (53,160) (30,114) (38,589) (28,079) (33,904)
Interest 3,926 538 (12,441) 48 125 73 79
99,124 51,521 33,523 3,457 42,647 14,642 51,486
RESERVESBond Reserve Account (16,684) (18,933) (16,904) (17,072) (22,673) (23,271) (27,104)Revenue Stabilization Fund (10,434) (9,000) (9,000) (9,072) (9,297) (9,524) (9,757)BPA Account (563) 0 0 0 0 0 0 Vendor Deposit (13) 0 0 0 0 0 0
(27,694) (27,933) (25,904) (26,144) (31,971) (32,795) (36,860)
FINANCIAL PERFORMANCE THROUGH END OF RATE PERIOD (2014)
Percent Increase (SYSTEM) Wholesale 2.2% -1.0% -1.0% 18.0% 0.0% 0.0% Retail 7.7% 3.5% 3.5% 8.7% 8.7% 8.5%
Typical Retail Single Family Residential Average Monthly Bill (5 ccf / mo) * $30.67 $34.01 $31.70 $33.95 $36.38 $38.93 Percent Increase 7.7% 3.3% 3.4% 7.1% 7.2% 7.0%
Target
Net Income Generally positive $709 $2,386 ($2,579) $5,997 $7,630 $15,727
Year End Cash Balance 1/12 Oper Exp $8,434 $7,036 $7,120 $7,435 $7,899 $8,118 Target $6,450 $7,036 $7,125 $7,435 $7,899 $8,118
Cash Financing of CIP -Single Year Min 15% 21.8% 18.5% 16.1% 38.3% 35.2% 48.6%
-Avg of Rate Period Min 20% 17.0% 17.7% 40.8%
Debt Service Coverage 1.70 1.59 1.52 1.45 1.58 1.62 1.70
* The typical customer's water use as measured per 100 cubic feet (ccf) has fallen due to conservation from 5.5 ccf in the2009-2011 rate proposal to 5.0 ccf in the 2012-2014 rate proposal. The typical bills displayed above have been calculated using the5.0 ccf figure.
Ending Construction Fund Balance
Total Reserves
Beginning Construction Fund Balance

Fund Financial Plans
City of Seattle—2012 Proposed Budget - 819 -
2012 Adopted Financial Plan1
Drainage and Wastewater Fund (Fund 44010)
2010 2011 2011 2012 2013 2014 2015Amounts in $1,000s Actuals Adopted Revised Adopted Projected Projected Projected
OPERATING CASH
23,525 12,601 30,256 21,285 10,700 10,399 10,418
SourcesWastewater Utility Services 186,655 210,512 206,372 211,886 232,216 230,967 226,547Drainage Utility Services 58,292 67,129 67,204 75,129 87,049 89,175 99,444Side Sewer Permit Fees 862 862 905 905 905 905 905Drainage Permit Fees 197 197 214 214 214 214 214Other Operating Revenues 156 160 68 53 49 49 49GIS CGDB Corporate Support (N2408 and N2418) 788 1,148 1,148 1,171 1,171 1,171 1,171GIS Maps & Publications (N2409 and 2419) 158 158 158 158 158 158 158Parks & Other City Depts. (N4405) 1,126 502 502 511 511 511 511SCL Fund (N4403) 235 338 338 339 339 339 339SCL for ReLeaf 0 0 0 80 80 80 80SDOT Fund (N4404) 3,693 1,630 1,630 3,571 1,250 1,250 1,250GF - Various GIS & Eng Svcs (N4303 & N2418) 955 881 956 1,205 1,205 1,205 1,205Investment Income (see Construction Fund) 0 0 0 0 0 0 0Capital Grants & Contributions (excl. donated assets) 3,173 4,923 3,916 4,525 1,700 1,700 1,700Operating Grants 300 300 315 315 300 300 300Call Center Reimbursement from SCL 1,772 1,676 1,671 1,689 1,689 1,689 1,689GF - Transfer In -- Restore Our Waters 107 184 109 0 0 0 0
Transfer from Construction Fund 2 42,217 57,419 54,403 69,860 92,413 64,709 69,282
GF Reimbursement of Abandoned Vehicles 51 52 52 0 0 0 0
Build America Bond Interest Income 1,645 0 1,886 1,886 1,886 1,886 1,886
Technical Adjustments 0 960 0 0 0 0 0
302,383 349,032 341,850 373,498 423,135 396,308 406,731
UsesCIPCombined Sewer Overflow (16,996) (17,807) (18,062) (26,888) (53,217) (29,496) (35,961)Flooding, Sewer Back-up, and Landslides (14,906) (35,070) (37,870) (24,186) (26,294) (19,210) (18,283)Protection of Beneficial Uses (1,863) (2,283) (5,025) (4,800) (6,135) (2,798) (2,702)Rehabilitation (9,526) (6,472) (6,472) (12,623) (14,388) (13,965) (14,681)Sediments (4,051) (6,350) (6,350) (5,595) (2,102) (1,457) (1,207)Shared Cost Projects (8,347) (11,804) (12,025) (14,931) (13,289) (12,571) (11,141)Technology (2,456) (4,062) (4,062) (4,815) (7,331) (7,551) (5,302)
CIP Subtotal (58,146) (83,848) (89,866) (93,838) (122,756) (87,048) (89,277)
Accomplishment Rate Adjustment 0 8,385 8,987 9,384 12,276 8,705 8,928
O&MGeneral Expense (197,015) (215,411) (215,546) (219,634) (228,400) (237,536) (247,037)Administration (3,881) (3,102) (3,965) (5,594) (5,817) (6,050) (6,292)Customer Service (5,976) (7,090) (7,077) (7,426) (7,742) (8,052) (8,374)Other Operating (42,678) (49,113) (50,329) (51,117) (53,162) (55,288) (57,500)
O&M Subtotal (249,550) (274,716) (276,917) (283,771) (295,122) (306,926) (319,203)
(307,696) (350,179) (357,797) (368,225) (405,602) (385,270) (399,553)
12,044 (1,032) 6,977 (15,858) (17,834) (11,019) (7,254)
30,256 10,421 21,285 10,700 10,399 10,418 10,342
(Continued on Next Page)
Total Uses
Beginning Operating Cash Balance
Total Sources
Ending Operating Cash Balance
Adjustments

Fund Financial Plans
City of Seattle—2012 Proposed Budget - 820 -
2012 Adopted Financial Plan1
Drainage and Wastewater Fund (Fund 44010) (cont'd.)
2010 2011 2011 2012 2013 2014 2015Amounts in $1,000s Actuals Adopted Revised Adopted Projected Projected Projected
CONSTRUCTION FUND
116,140 62,031 76,519 22,886 61,141 73,755 10,067
Bond Proceeds 0 0 0 107,087 104,268 0 105,394 Transfers to Operating Fund (42,217) (57,419) (54,403) (69,860) (92,413) (64,709) (69,282)
Interest 2,595 784 771 1,028 759 1,021 843
76,519 5,397 22,886 61,141 73,755 10,067 47,022
RESERVESBond Reserve Account (12,757) (12,757) (12,757) (19,028) (29,455) (29,455) (39,994)Bond Parity Fund (1,620) (1,620) (1,620) (1,620) (1,620) (1,620) (1,620)Vendor Deposits (745) 0 0 0 0 0 0
(15,122) (14,377) (14,377) (20,648) (31,075) (31,075) (41,614)
FINANCIAL PERFORMANCE THROUGH END OF RATE PERIOD (2012)
Percent Increase (SYSTEM) Wastewater 1.0% 4.1% 4.1% 4.2% Drainage 1.9% 13.1% 13.1% 11.2%
Typical Retail Single Family Residential Wastewater
Average Monthly Bill (4.3 ccf) 2 $38.61 $44.20 $44.20 $45.92 Percent Increase 1.0% 14.5% 14.5% 3.9% Drainage Average Monthly Bill $17.17 $19.58 $19.58 $21.81 Percent Increase 1.9% 14.0% 14.0% 11.4%
Target
Net Income Generally positive $5,851 $11,282 $1,000 $10,000
Year End Cash Balance 1/12 Treatment Cost $30,256 $10,421 $21,285 $10,700 Target $9,274 $10,421 $10,406 $10,303
Cash Financing of CIP
25% (4 year rolling
avg) 25% 25% 25% 26%
Debt Service Coverage 1.80 2.53 2.84 2.61 2.59
Debt to Asset Ratio Less than 70% 62% 61% 61% 66%
NOTES:
Total Reserves
Beginning Construction Fund Balance
Ending Construction Fund Balance
1. This financial plan includes the increase in King County's sewer treatment costs that was passed through to City of Seattle customers
in the 2011 Adopted and 2012 Endorsed Budget. The body of the 2011-2012 Drainage and Wastewater Rate Study did not include the
King County rate increase, the impacts of which are reflected in Appendices A&B of the Rate Study.
2. The typical customer's sewer usage as measured per 100 cubic feet (ccf) has fallen commensurate with reductions in water usage,
and has been adjusted downard in this presentation from 5.2 ccf to 4.3 ccf. The typical bills displayed above have been calculated using
the 4.3 ccf figure.

Fund Financial Plans
City of Seattle—2012 Proposed Budget - 821 -
2012 Adopted Financial PlanSolid Waste Fund (Fund 45010)
2010 2011 2011 2012 2013 2014 2015Amounts in $1,000s Actuals Adopted Revised Adopted Projected Projected Projected
OPERATING CASH
3,872 6,955 10,252 8,203 7,526 12,975 15,933
SourcesOther Nonoperating Revenue 742 0 0 0 0 0 0 Transfer Fee - Out City 160 0 0 0 0 0 0 Operating Fees, Contributions and Grants 782 383 383 0 0 0 0 Residential Services 86,159 92,366 92,019 97,734 107,150 113,060 118,947 Commercial Services 45,279 48,848 46,664 46,933 50,474 50,079 52,512 Recycling and Disposal Station Charges 11,979 12,752 11,930 11,944 12,998 12,966 13,344 Comm'l Disposal (Longhaul) Charges 416 476 471 471 511 511 537 Other Operating Revenue 191 0 0 2 0 0 0 Recovery Fees/Yellow Pages 0 765 234 234 234 234 234 Landfill Closure Fee 14 0 0 0 0 0 0 Transfer Fee - In City 3,766 4,043 3,941 4,670 5,266 5,917 5,623General Subfund - Operating Transfer In 0 0 0 0 0 0 0 Transfers from Construction Fund 16,968 23,505 34,231 16,946 13,179 43,197 33,292 GSF - Transfer In - Aband'd Vehicle Calls 51 52 52 0 0 0 0 KC Reimb for Local Hzrd Waste Mgt Prgm 2,067 2,418 2,418 2,418 2,418 2,418 2,418 Call Center Reimbursement from SCL 1,567 1,676 1,671 1,671 1,671 1,671 1,671 Recyling Processing Revenues 2,941 0 3,000 2,000 2,000 2,000 2,000
173,084 187,285 197,015 185,023 195,902 232,054 230,578
UsesCIPNew Facilities (15,081) (25,710) (45,635) (13,845) (11,322) (45,822) (36,301)Rehabilitation and Heavy Equipment (5,843) (262) (343) (397) (224) (42) (54)Shared Cost Projects (1,650) (1,860) (2,236) (2,536) (2,208) (1,954) (1,918)Technology (988) (1,415) (1,415) (1,665) (4,334) (5,126) (2,658)
CIP Subtotal (23,562) (29,248) (49,629) (18,443) (18,088) (52,944) (40,930)
Accomplishment Adjustment 2,925 4,963 1,844 1,809 5,294 4,093
O&MAdministration (4,707) (5,163) (5,585) (5,180) (5,387) (5,602) (5,826)Customer Service (11,369) (12,871) (12,859) (13,310) (13,843) (14,396) (14,972)General Expense (117,743) (125,940) (126,418) (129,668) (134,855) (140,249) (145,859)Other Operating (12,572) (15,808) (15,808) (16,464) (17,123) (17,808) (18,520)
O&M Subtotal (146,391) (159,783) (160,670) (164,622) (171,207) (178,055) (185,178)
(169,953) (186,106) (205,336) (181,221) (187,487) (225,705) (222,015)
3,248 3,128 6,272 (4,479) (2,967) (3,391) (3,157)
10,252 11,262 8,203 7,526 12,975 15,933 21,339
(Continued on Next Page)
Beginning Operating Cash Balance
Total Sources
Total Uses
Adjustments
Ending Operating Cash Balance

Fund Financial Plans
City of Seattle—2012 Proposed Budget - 822 -
2012 Adopted Financial Plan
Solid Waste Fund (Fund 45010) (cont'd.)
2010 2011 2011 2012 2013 2014 2015Amounts in $1,000s Actuals Adopted Revised Adopted Projected Projected Projected
CONSTRUCTION FUND
28,207 10,380 11,452 26,066 9,180 71,074 28,389
Bond Proceeds - 63,212 48,781 - 74,643 44,104 Transfers to Operating Fund (16,968) (23,505) (34,231) (16,946) (13,179) (43,197) (33,292)
Interest 213 606 64 60 430 512 242
11,452 50,692 26,066 9,180 71,074 28,389 39,443
RESERVES
Bond Reserve Account - (7,813) (4,878) (4,878) (13,089) (13,089) (17,499)
- (7,813) (4,878) (4,878) (13,089) (13,089) (17,499)
FINANCIAL PERFORMANCE THROUGH END OF RATE PERIOD (2012)
Percent Increase (SYSTEM) 8.0% 6.0% 6.0% 3.5%
Typical Retail Single Family Residential Average Monthly Bill $32.70 $34.75 $34.75 $37.00 Percent Increase 12.0% 6.3% 6.3% 6.5%
Target
Net Income Generally positive $5,986 $171 $100 ($1,928)
Year End Cash Balance
20 days contract
costs $10,252 $11,262 $8,203 $7,526 Target $4,869 $4,990 $4,869 $5,036
Cash Financing of CIP
$2.5M (in 2003 $)
or 10% $6,594 $2,929 $7,929 $2,988 Target $3,000 $2,929 $4,467 $2,988
Debt Service Coverage 1.70 5.05 4.09 4.06 3.14
Ending Construction Fund Balance
Total Reserves
Beginning Construction Fund Balance

Fund Financial Plans
City of Seattle—2012 Proposed Budget - 823 -
2012 Adopted Budget Financial PlanPacific Parking Garage (Fund 46010 )
2010 2011 2011 2012 2013 2014 2015
Amounts in $1,000s Actuals Adopted Revised Adopted Projected Projected Projected
Beginning Fund Balance (388) 1,078 (1,322) (3,256) (5,096) (7,001) (8,873)
Accounting Adjustments
Beginning Unreserved Fund Balance (388) 1,078 (1,322) (3,256) (5,096) (7,001) (8,873)
Revenues
Parking Revenue 7,856 8,582 7,201 7,621 7,849 8,085 8,327
City Parking Tax 1 (657) (879) (738) (781) (804) (828) (853)
Sales Tax (625) (668) (561) (593) (611) (630) (648)
Interest earning and Other 6 6 6 6 6 6 6
Total Revenues 6,580 7,041 5,908 6,253 6,440 6,633 6,831
Expenditures
AMPCO System Parking (1,571) (1,800) (1,723) (1,780) (1,833) (1,888) (1,944)
B&O Tax (45) (47) (40) (43) (44) (45) (47)
Condominium fees (518) (531) (534) (549) (566) (583) (601)
Other 2 (348) (277) (358) (369) (380) (392) (403)
Debt Service (5,032) (5,187) (5,187) (5,352) (5,522) (5,597) (5,765)
Total Expenditures (7,514) (7,842) (7,842) (8,093) (8,345) (8,505) (8,760)
Ending Fund Balance (1,322) 277 (3,256) (5,096) (7,001) (8,873) (10,802)
Reserves
Reserve for Loan Repayment 0 (2,000) 0 0 0 0
Total Reserves 0 (2,000) 0 0 0 0 0
Ending Unreserved Fund Balance (1,322) (1,723) (3,256) (5,096) (7,001) (8,873) (10,802)
Assumptions:1 City Parking Tax Rate:
June 2009-Dec. 2010 10.0%
Jan. 2011-2014 12.5%2 Other expenditure line inludes administrative costs and credt card handling fees3 A loan to this fund authorizing up to $4 million was passed by Council in September 2011 (CB 117270)

Fund Financial Plans
City of Seattle—2012 Proposed Budget - 824 -
2012 Adopted Budget Financial PlanFinance and Administrative Services (Fund 50300)
2010 2011 2011 2012 2013 2014 2015
Amounts in $1,000s Actuals* Adopted Revised Adopted Projected Projected Projected
Beginning Fund Balance 20,162 20,183 22,522 17,289 13,415 9,049
Accounting Adjustments
Beginning Unreserved Fund Balance 0 20,162 20,183 22,522 17,289 13,415 9,049
Revenues
External - Revenue and Consumer Affairs 1,356 1,356 1,450 1,450 1,450 1,450
External - Animal Shelter 1,279 1,279 1,279 1,279 1,279 1,279
External - Facilities 2,191 2,723 2,192 2,192 2,192 2,192
External - Fleets 960 960 956 945 945 945
External - Other Misc 230 280 672 212 212 212
External - Parking 2,086 2,086 2,091 2,091 2,091 2,091
Grants 121
Interest 280 280 280 280 280 280
Interfund - Facilities 57,308 59,208 56,316 58,569 60,912 63,348
Interfund - Fleet 42,327 42,327 44,271 46,042 47,883 49,799
Interfund - Other Misc 1,827 1,827 1,808 3,900 4,056 4,218
Interfund - Parking 698 698 698 726 755 785
Interfund_Capital Development and Construction Management 3,312 3,312 3,486 3,626 3,771 3,922
Interfund - Risk Management 1,353 1,353 1,397 1,453 1,511 1,571
Interfund - Economics & Fiscal Management 1,377 1,377 1,555 1,618 1,682 1,750
Interfund - Financial Services 8,469 8,512 12,101 12,585 13,089 13,612
Interfund - Business Technology 9,162 9,162 8,413 8,750 9,100 9,464
Interfund - Revenue & Consumer Affairs 4,408 4,408 1,257 1,307 1,360 1,414
Interfund - Contracting & Purchasing Services 3,020 3,020 3,234 3,364 3,498 3,638
Interfund - Animal Shelter 2,127 2,127 2,265 2,355 2,450 2,548
Interfund - Office of Constituent Services 1,423 1,423 2,549 3,120 3,245 3,375
Interfund -Capital Improvements (CIP subfund 50390)** 3,500 3,500 3,500 3,500 3,500 3,500
Total Revenues 0 148,695 151,341 151,771 159,363 165,260 171,392
Expenditures
Budget and Central Services (5,572) (4,014) (3,931) (4,095) (4,259) (4,429)
Facility Operations (65,355) (64,930) (65,819) (68,467) (71,206) (74,054)
Fleet Services (39,723) (39,416) (45,705) (47,557) (49,459) (51,437)
Judgment and Claims (362) (362) (362) (376) (392) (407)
Capital Development and Construction Management (2,855) (2,855) (2,945) (3,068) (3,191) (3,319)
Financial Services (9,858) (12,727) (13,239) (13,788) (14,339) (14,913)
Business Technology (8,106) (9,801) (10,270) (10,693) (11,120) (11,565)
Revenue and Consumer Affairs (4,998) (2,379) (2,348) (2,446) (2,544) (2,646)
City Purchasing and Contracting Services (3,018) (2,890) (3,005) (3,131) (3,256) (3,386)
Seattle Animal Shelter (3,005) (3,086) (3,038) (3,164) (3,291) (3,423)
Office of Constituent Services (1,150) (1,150) (2,842) (2,952) (3,070) (3,193)
Interfund transfers - Depts (749)
Interfund transfers - GF (1,143)
Capital Improvements (CIP subfund 50390)** (3,500) (3,500) (3,500) (3,500) (3,500) (3,500)
Total Expenditures 0 (147,503) (149,001) (157,004) (163,237) (169,626) (176,272)
Ending Fund Balance 0 21,354 22,522 17,289 13,415 9,049 4,169
Reserves
Continuing Appropriations
Working Capital - Fleets (712) (475)
Working Capital - Operations
Working Capital - Financial and Technical Services
Working Capital - Animal Shelter
Working Capital - Constituent Services
Total Reserves 0 0 (712) (475) 0 0 0
0Ending Unreserved Fund Balance 0 21,354 21,810 16,814 13,415 9,049 4,169
**Budget authority is appropriated in the CIP (A1GM1)
* The Department of Finance and Administrative Services (FAS) began operations on Jauary 01, 2011. The new deparment was created from mergering
the Fleets and Faciliities Department with the Department of Executive Admistration.

Fund Financial Plans
City of Seattle—2012 Proposed Budget - 825 -
2010 2011 2011 2012 2013 2014 2015
Amounts in $1,000s Actuals Adopted Revised 7, 8 Adopted Projected 1 Projected 2 Projected 2
Beginning Budgetary Fund Balance 29,694 11,231 20,213 12,458 13,362 15,235 16,681
Accounting Adjustments (6,656)
Revised Beginning Fund Balance 23,038 11,231 20,213 12,458 13,362 15,235 16,681
Revenues
Grant Revenues 2,357 2,131
Cable Fund Revenues 7,604 7,361 7,543 7,991 8,049 8,328 8,672
Non-City Agency Revenues 3,481 1,476 1,476 1,547 1,618 1,682 1,749
City Agency Revenues (non GF) 15,977 18,149 18,030 17,830 18,576 18,128 18,853
City Agency Revenues (GF) 16,480 17,537 17,144 17,932 19,344 19,475 20,190
Sources to be Specified/Projects/Rate Billings 1,868 4,565 4,616 4,801 5,024 5,225 5,434
Interest Earnings 202
Other 3 (824) (824) (45) (47) (49) (51)
TBD 9 753
Total Revenues 47,970 48,264 50,116 50,056 52,564 53,543 54,848
Expenditures
Finance & Administration BCL (2,285) (4,130) (4,330) (4,598) (4,625) (4,810) (5,003)
Technology Leadership & Governance BCL (2,198) (2,144) (2,144) (1,972) (2,051) (2,133) (2,218)
Technology Infrastructure BCL (39,470) (32,766) (41,104) (32,092) (34,556) (37,652) (37,610)
Office of Electronic Communications BCL (7,066) (6,447) (7,051) (7,248) (7,255) (7,502) (7,812)
Debt Service 4 224 (3,431) (3,242) (3,242) (2,206)
Total Expenditures (50,795) (48,918) (57,871) (49,151) (50,692) (52,097) (52,643)
Ending Fund Balance 20,213 10,578 12,458 13,362 15,235 16,681 18,886
Reserves
Continuing appropriation and Encumbrances (2,193)
Petty Cash, Inventories, and Prepaid Expenses (457)
Radio and Video Reserves 5 (11,134) (5,510) (7,479) (8,583) (10,577) (12,607) (14,672)
Cash Float 6 (4,635) (4,277) (4,318) (3,764) (3,891) (3,999) (4,041)
Total Reserves (17,962) (10,244) (11,796) (12,348) (14,468) (16,606) (18,713)
Ending Unreserved Fund Balance 2,251 333 662 1,015 766 75 173
Assumptions:
5 Assumes collection of handset reserve for Police & Fire at $1.65 million per year beginning 2013.
7 Supplementals, Abandonments, and Mid-Year Reductions are incorporated into the expenditure lines in the following amounts:
2011 Mid Year Reduction (254,333)$
2011 3Q Abandonments (1,412,930)$
2011 -- Ordinance 123618 799,492$
2011 -- Ordinance 123640 87,000$
2011 -- Council Bill 117207 95,000$ 8 Includes Carry Forward / Encumbrances in expenditure lines. 9 2014 CIP funding has not been determined yet
6 Internal DoIT policy establishes a cash float of approximately 90 days of reimbursable expenses .
2012 Adopted Budget Financial Plan
Information Technology Fund (50410)
1 Assumes 4 % growth starting in 2013. 2 Assumes 4 % growth starting in 2013 adjusted for one time revenues or expenditures. Also excludes GODA bond revenue collections after 3 Represents Anticipated Customer Rebates4 Debt Service on Bonds Issued in 2009 and 2010 ends in 2013.

Fund Financial Plans
City of Seattle—2012 Proposed Budget - 826 -
2012 Proposed Budget Financial Plan
Fire Pension Fund (Fund 60200)
2010 2011 2011 2012 2013 2014 2015
Amounts in $1,000s Actuals Adopted Revised Adopted Projected Projected Projected
Beginning Fund Balance 13,273 11,594 11,385 10,451 10,076 14,628 19,209
Accounting Adjustments 29
Revised Beginning Fund Balance 13,302 11,594 11,385 10,451 10,076 14,628 19,209
Revenues
General Subfund 17,531 17,759 17,758 18,875 23,903 23,952 24,002
Fire Insurance Premium Tax 867 867 903 939 958 977 996
Interest earnings on Actuarial Account at 1% rate 96 141 187
Total Revenues 18,398 18,625 18,661 19,814 24,957 25,070 25,186
Expenditures
Death Benefits (11) (15) (15) (15) (15) (15) (15)
Medical Benefits Paid (10,477) (10,700) (10,100) (10,700) (11,733) (11,788) (11,846)
Pension Benefits Paid (9,160) (8,861) (8,913) (8,889) (8,060) (8,078) (8,083)
Administration (666) (567) (567) (585) (597) (609) (621)
Transfer to Actuarial Account 0 0 0 0 (4,440) (4,422) (4,417)
Total Expenditures (20,314) (20,143) (19,595) (20,189) (24,845) (24,912) (24,982)
Ending Fund Balance 11,385 10,077 10,451 10,076 14,628 19,209 23,829
Reserves
Contingency Reserve (500) (500) (500) (500) (500) (500) (500)
Actuarial Account (9,577) (9,577) (9,577) (9,577) (14,128) (18,709) (23,329)
Total Reserves (10,077) (10,077) (10,077) (10,077) (14,628) (19,209) (23,829)
Ending Unreserved Fund Balance 1,309 0 375 (0) 0 0 0
Notes: The Firefighters’ Pension Fund is composed of a Contingency Reserve and the Actuarial Account Balance. City Financial
Policy specifies a target fund balance of $500,000 in the Contingency Reserve. The 2011 Adopted Budget included legislation that
would continue the suspension of transfers into the Actuarial Account for 2011 and 2012. Prior to the 2011 Adopted Budget,
these two fund reserves were not shown separately.

Fund Financial Plans
City of Seattle—2012 Proposed Budget - 827 -
2012 Adopted Budget Financial Plan
Police Pension Fund (Fund 60400)
2010 2011 2011 2012 2013 2014 2015
Amounts in $1,000s Actuals Adopted Revised Adopted Projected Projected Projected
Beginning Fund Balance 280 1,133 1,119 2,621 1,868 1,126 500
Accounting & Technical Adjustments 49 0 0 0 0 0 0
Beginning Unreserved Fund Balance 329 1,133 1,119 2,621 1,868 1,126 500
Revenues
General Subfund 22,302 22,255 22,255 21,730 22,287 22,736 23,603
Police Auction Proceeds 114 140 115 120 120 120 120
Total Revenues 22,416 22,395 22,370 21,850 22,407 22,856 23,723
Expenditures
Death Benefits (18) (15) (15) (15) (15) (15) (15)
Medical Benefits Paid (12,052) (13,492) (11,700) (13,000) (13,406) (13,673) (13,861)
Pension Benefits Paid (9,034) (9,096) (8,668) (9,052) (9,181) (9,237) (9,278)
Administration (522) (425) (485) (536) (547) (558) (569)
Total Expenditures (21,626) (23,028) (20,868) (22,603) (23,149) (23,483) (23,723)
Ending Fund Balance 1,119 500 2,621 1,868 1,126 500 500
Reserves
Contingency Reserve (500) (500) (500) (500) (500) (500) (500)
Rate Stabilization Reserve (1,368) (626)
Total Reserves (500) (500) (500) (1,868) (1,126) (500) (500)
Ending Unreserved Fund Balance 619 0 2,121 0 0 (0) (0)

Fund Financial Plans
City of Seattle—2012 Proposed Budget - 828 -
2012 Adopted Budget Financial Plan
Municipal Arts Fund (Fund 62600)
2010 2011 2011 2012 2013 2014 2015
Amounts in $1,000's Actuals Adopted Revised Adopted Projected Projected Projected
Beginning Fund Balance 5,445 5,536 5,782 4,199 4,187 4,129 4,024
Accounting Adjustments (6) 0 0 0 0 0 0
Revised Beginning Fund Balance 5,439 5,536 5,782 4,199 4,187 4,129 4,024
Revenues
State Grant 0 0 0 0 0 0 0
Public Art Management Fees 186 186 196 186 186 186 186
Interest Earnings 58 100 55 100 100 100 100
Interest Increase / (Decrease) (11) 0 0 0 0 0 0
1% for Art Revenues 1,903 2,407 2,300 2,018 2,018 2,018 2,018
Miscellaneous Revenues 51 9 10 9 9 9 9
Total Revenues 2,187 2,702 2,561 2,312 2,312 2,312 2,312
Expenditures
Public Art Program (1,844) (2,693) (3,419) (2,324) (2,370) (2,418) (2,466)
Quarterly Suplemental/Carryforward
Encumbrance Payoff (726)
Total Expenditures (1,844) (2,693) (4,145) (2,324) (2,370) (2,418) (2,466)
Ending Fund Balance 5,782 5,545 4,199 4,187 4,129 4,024 3,870
Reserves
Operating Reserves (65)
Encumbrances (660) 0 0 0 0 0 0
Total Reserves (726) 0 0 0 0 0 0
Ending Unreserved Fund Balance 5,057 5,545 4,199 4,187 4,129 4,024 3,870

City of Seattle—2012 Proposed Budget - 829 -
Cost Allocation Tables:
These tables provide information about how the City allocates internal service costs (i.e. overhead pro-vided by City agencies to other City agencies) to customer agencies.

City of Seattle—2012 Proposed Budget - 830 -

City of Seattle—2012 Proposed Budget - 831 -
Cost Allocation

City of Seattle—2012 Proposed Budget - 832 -
Cost Allocation

City of Seattle—2012 Proposed Budget - 833 -
Cost Allocation

City of Seattle—2012 Proposed Budget - 834 -
Cost Allocation

City of Seattle—2012 Proposed Budget - 835 -
Cost Allocation

City of Seattle—2012 Proposed Budget - 836 -
Cost Allocation
Program Org Allocation Formula Departments Affected
Data Backbone D3308 Percent of adopted budget Six funds
Internet Services D3308 Percent of adopted budget Seven funds
Data Network Services
D3308 Billed on use of services; hourly rates for service changes; connection charge for all central campus offices except SCL and SPL
All departments except SCL, SPL
Enterprise Computing Services
D3301 Allocated to customer departments based on pages printed, number of operating systems, number of batch jobs, number of gigabytes, number of units of cabinet storage, number of virtual servers, number of web applications, number of CPUs, and number of SharePoint site collections.
Citrix services billed based on number of Citrix accounts
All departments except SPL
Messaging, Collaboration, and Directory Services
D3302 Allocated to customer departments based on number of email addresses.
Blackberry support billed based on number of Blackberry units.
All departments except SPL
Technical Support Services (Desktops)
D3304 Allocated to customer departments based on number of desktops and printers
Participants
Service Desk D3310 Allocated to customer departments based on number of email addresses
Participants
Telephone System Services
D3305 Telephone rates; IVR: funded based on historical usage
Telephone Rates: All departments
IVR: Participants
Cellular and Wireless Charges
D3305 Airtime and equipment charges for cell phones and wireless modems based on actual usage and billing from carriers.
Participants
Radio Network D3306 Radio network access fee and reserves; monthly charge for pagers
Access fee: Participants
Monthly lease charge: Participants
Communications Shop D3307 Labor rates Police, Fire, SPU, Seattle Center; other departments may select this service
Telecommunications Engineering & Project Management
D3311 Labor Rates Optional
Citywide Web Team D4401 Percent of adopted budget Six funds (including Cable Fund)
Community Technology
D4403 Cable Subfund Contstituents?
DEPARTMENT OF INFORMATION TECHNOLOGY (DOIT) COST ALLOCATION METHODOLOGIES – B(3)

City of Seattle—2012 Proposed Budget - 837 -
Cost Allocation

City of Seattle—2012 Proposed Budget - 838 -
Cost Allocation

City of Seattle—2012 Proposed Budget - 839 -
Cost Allocation

City of Seattle—2012 Proposed Budget - 840 -
Cost Allocation
Central Service Cost Allocations by paying funds – Informational Only These transfers reflect reimbursements for general government work performed on behalf of certain revenue generating departments.
2011 Adopted
2012 Endorsed
2012 Adopted
City Budget Office 868,356 896,386 855,504
Personnel 4,402,971 4,502,506 4,407,812
MISC
13,545,249 13,914,976
14,386,164
Total Interfund Transfers
18,816,576
19,313,868
19,649,481
Interfund Transfers to City Budget Office (CBO) Seattle City Light 308,607 318,569 304,040
Seattle Public Utilities 255,399 263,643 251,619
Seattle Department of Transportation 212,832 219,702 209,682
Department of Planning Development 70,235 72,502 69,195
Retirement 21,283 21,970 20,968
Total Interfund Transfers to CBO 868,356 896,386 855,504
Intefund Transfers to Personnel Seattle City Light 1,844,948 1,886,610 1,846,187
Seattle Public Utilities 1,333,940 1,363,773 1,366,722
Seattle Department of Transportation 855,089 874,744 823,401
Department of Planning Development 355,771 363,856 358,007
Retirement 13,223 13,523 13,496
Total Interfund Transfers to Personnel 4,402,971 4,502,506 4,407,812
Miscellaneous Interfund Transfers Seattle City Light 3,299,976 3,382,992 3,761,690
Seattle Public Utilities 3,335,397 3,425,517 3,596,184
Seattle Department of Transportation 4,189,304 4,306,946 4,320,975
Department of Planning Development 2,651,627 2,728,562 2,637,310
Retirement 68,944 70,961 70,005
Total Miscellaneous Interfund Transfers
13,545,249
13,914,976
14,386,164

Statements of Legislative Intent (SLI):
This section describes the Statements of Legislative Intent (SLIs) adopted by the City Council. SLIs pro-vide specific direction to departments on various work plan items for 2012.
City of Seattle—2012 Proposed Budget - 841 -

Statement of Legislative Intent – Summary by Council Committee
# SLI NO.
1 SLI 32-1-A-1
2 SLI 47-1-A-1
3 SLI 58-1-A-2
4 SLI 75-1-A-2
5 SLI 21-1-A-2
6 SLI 35-1-A-2
7 SLI 50-1-A-2
8 SLI 53-3-A-1
9 SLI 54-1-A-1
10 SLI 7-1-A-1
11 SLI 13-1-A-1
12 SLI 14-1-A-2
13 SLI 81-1-A-1
14 SLI 83-1-A-1
Review of SPU financial policies
Monitoring and assessing HSD refugee and immigrant job readiness training,
family support, community organizing and leadership development programs in
2012
TITLE
Library, Utilities and Center Committee
Housing, Human Services, Health and Culture Committee
Government Performance and Finance Committee
Redevelopment of Fire Station 39
Funding options for arts-related programs at the Department of Parks and
Recreation
Parks Long-Term Funding Options
Parks and Neighborhoods Committee
Require health outcomes as part of performance pay in City contracts for
uninsured medical and dental services
HSD utility low income customer enrollment and outreach
SPU update of tap fees and related work processes
SPU recycling work plan priorities
Seattle Center Interfund Loan Repayment Plan
Inventory of staffing support provided to boards and commissions
Report from FAS on major maintenance of mutual and offsetting benefit lease
properties
A review of information technology systems and protocols Citywide to identify
efficiency, effectiveness, and security improvements
Report to examine potential City support for a new Bruce Lee Action Museum
2012 Adopted Budget
City of Seattle—2012 Proposed Budget - 842 -

Statement of Legislative Intent – Summary by Council Committee
City of Seattle—2012 Proposed Budget - 843 -
# SLI NO.
Planning, Land Use and Sustainability Committee
15 SLI 63-1-A-1
16 SLI 65-1-A-1
Public Safety, Civil Rights and Technology Committee
17 SLI 23-1-A-1
18 SLI 24-1-A-1
19 SLI 46-1-A-1
Transportation Committee
20 SLI 114-2-A-2
DPD - Planning Division Work Program Development and Reporting
DPD report to Council on Hansen permitting software replacement or upgrade
Test of body-mounted video cameras
Neighborhood Policing Plan Update
Annual reports on workforce and contracting equity
Third Avenue Transit Corridor Initiative
TITLE
2012 Adopted Budget

Statement of Legislative Intent – Full Text by Council Committee
2012 Adopted Budget
GOVERNMENT PERFORMANCE AND FINANCE COMMITTEE
1. Seattle Center Interfund Loan Repayment Plan [SLI 32-1-A-1]
Statement of Legislative Intent:
In June 2011, the City Council passed Ordinance 123644, which authorized Seattle Center to borrow up to $3 mil-lion from the City’s Consolidated Cash Pool. The loan was intended to place Seattle Center in a positive cash posi-tion after some of its 2010 and 2011 collected revenues fell short of budgeted amounts. In 2012, the Council re-quests that Seattle Center work with the City Budget Office (CBO) to develop a repayment plan for the interfund loan and provide regular updates to the Council on repayment progress. Full repayment of Seattle Center’s loan is due by December 31, 2012.
It is the Council’s intent that Seattle Center, with assistance from CBO, complete the following in 2012:
By March 31, 2012, a detailed repayment plan for Seattle Center’s interfund loan. The repayment plan should describe the specific actions Seattle Center expects to undertake in 2012 in order to pay off its loan and quantify the amount of revenue associated with each action.
By August 31, 2012, an initial report on loan repayment progress. Each loan repayment progress report should identify the amount of the loan outstanding and summarize Seattle Center’s progress toward achieving the specific revenue and repayment goals articulated in the repayment plan.
By December 31, 2012, a second and final report on loan repayment progress.
The repayment plan and progress reports should be delivered to the full memberships of the Council’s Govern-ment Performance and Finance Committee (GP&F) and Library, Utilities and Center Committee (LUC). A staff presentation on the content of the repayment plan will be scheduled for a GP&F Committee meeting following the Committees’ receipt of the plan. Presentations on the content of the progress reports may also be requested.
Background:
The Seattle Municipal Code (SMC) authorizes the Director of Finance to carry individual City funds, such as the Seattle Center Fund, in a negative cash position for periods of up to 90 days. For periods longer than 90 days, an interfund loan must be approved via ordinance. The Seattle Center Fund reached the 90 day threshold in April 2011 and in June the Council passed Ordinance 123644, which authorized Seattle Center to borrow up to $3 mil-lion from the City’s Consolidated Cash Pool. Some of the factors contributing to Seattle Center’s current financial challenges include the following:
Nonpayment of rent by nonprofit tenants affected by the economic downturn;
Loss of title sponsorship revenue for KeyArena; and
Reduced rent revenues for the portion of the campus previously occupied by the Fun Forest. (These revenues will increase when the Chihuly garden exhibition opens to the public in 2012.)
City of Seattle—2012 Proposed Budget - 844 -

2012 Statements of Legislative Intent
GOVERNMENT PERFORMANCE AND FINANCE COMMITTEE
1. Seattle Center Interfund Loan Repayment Plan [SLI 32-1-A-1]
(Cont’d.)
Ordinance 123644 specifies that Seattle Center must repay its loan in full (principal and interest) by no later than December 31, 2012, and applies an interest rate equivalent to the current rate of return of the Consoli-dated Cash Pool (presently around 0.8%). Seattle Center currently estimates it will have to generate about $1 million in unbudgeted cash receipts during the remaining term of the loan in order to repay what it will have borrowed from the Consolidated Cash Pool.
Responsible Council Committee: Government Performance and Finance
Date Due to Council: Interfund loan repayment plan by March 31, 2012
First repayment progress report by August 31, 2012
Second repayment progress report by December 31, 2012
2. Inventory of staffing support provided to boards and commissions [SLI 47-1-A-1]
Statement of Legislative Intent:
Council requests that the Executive provide an inventory summarizing the level of staffing and financial support that is now provided to the City’s various boards, commissions and comparable advisory bodies. As the City continues to face significant financial challenges, the Council is interested in understanding whether the cur-rent staffing approach is the most cost-effective possible and whether other staffing models could be devel-oped.
Responsible Council Committee: Government Performance and Finance
Date Due to Council: June 30, 2012
3. Report from FAS on major maintenance of mutual and offsetting benefit lease properties [SLI 58-1-A-2]
Statement of Legislative Intent:
The Council requests that the Department of Finance and Administrative Services provide two reports to the Council related to major maintenance of the City’s mutual and offsetting benefit (MOB) properties.
The first report, which shall be provided by March 31st, shall estimate the cost of repairs needed to building systems, including roofs, to maintain MOB properties in a tenantable condition and shall set out options for funding repairs including, but not limited to, an assessment of eligibility and availability of American Recovery and Reinvestment Act retrofit funds and uncommitted real estate excise tax revenue.
The second report, which shall be provided by June 30th, shall present a review of the present MOB situation, policies for MOB leases, and options for MOB facilities, including disposition of the property to current tenants or entities that would ensure that the buildings continue to be leased to organizations providing a public bene-fit. This report shall be developed with input from current tenants and shall be informed by a survey of current MOB tenants to assess their ability to pay the lesser of fair market rent or standard City rent for similar facili-ties.
City of Seattle—2012 Proposed Budget - 845 -

1 Rules Governing the City’s Mutual and Offsetting Benefit (MOB) Properties. Section V.H. 1 Ibid at Section IX.A and IX.B.1. 1 Id. at Section IX.8.
GOVERNMENT PERFORMANCE AND FINANCE COMMITTEE
2012 Statements of Legislative Intent
3. Report from FAS on major maintenance of mutual and offsetting benefit lease properties [SLI 58-1-A-2]
(Cont’d.)
Background:
MOB properties are buildings owned by the City and leased to tenants who provide some public service. Ten-ants pay fair market rent, which is divided into cash rent and service rent. Cash rent is paid in cash. Service rent is delivered in the form of services provided to the community. Examples of services provided as rent include reduced cost medical care, nutrition education, meals for the elderly, operation of foodbanks, social service referrals, and transitional housing for homeless teen mothers.
The proposed budget appropriates $1.9 million from the insurance settlement for the 2010 Sunny Jim fire for major maintenance of six mutual and offsetting benefit buildings. Lessees of these properties include: 1) the Central Area Motivation Program, 2) the Central Area Senior Center, 3) the Northwest Senior Center, 4) the Southeast Health Clinic, 5) the South Park Community Service Center, and 6) the Teen Mother Center.
Major maintenance proposed by the Department of Finance and Administrative Services (FAS) would be lim-ited to roof replacement for each building. However, in addition to roof replacement, systems in many of these buildings also need other major maintenance. FAS has not estimated the cost of those additional repairs. The estimated cost by facility for roof replacement only, prioritized in order of deteriorated condition, is set out in the table below.
Facility Name/ (Organization) Estimate
SE Health Clinic 485,000$
Central Area Senior Center (Senior Services) 455,000$
South Park Community Service Center (SPARC) 275,000$
Central Area Motivation Program (CAMP) 315,000$
Teen Mother Center (Goodwill Missionary Baptist Church) 105,000$
Northwest Senior Center in Ballard (Senior Services) 265,000$
Subtotal: 1,900,000$
Source: FAS
2
1
3
Leases for these buildings are governed by the Rules Governing the City’s Mutual and Offsetting Benefit (MOB) Properties (MOB Lease Rules), which were most recently amended by the Council through Resolution 27712 in 1988. These rules state that the City “shall be responsible for all normal repairs to roofs, walls, and foundations” (Emphasis Added).
1
However, the MOB Lease Rules clearly contemplate that cash rent will cover some major maintenance. Specifically, under the MOB Lease Rules, cash rent should be a portion of the fair market rental value determined by an appraisal performed every five years and should cover the amortized major maintenance costs over a 40 year life cycle.
2
Additionally, after the third year of an initial lease, the MOB Lease Rules require that cash rent covers 50% of administrative and major maintenance costs. The remainder of the administrative and major maintenance costs are to be made up through General Fund support.
3 In 2010 the Council increased the General Fund support for major
maintenance of MOB facilities from $200,000 annually to $350,000 annually. FAS estimates that with the increase and with rent from tenants, the ongoing annual needed City support for major maintenance is about $129,000 more than is currently provided.
1 Rules Governing the City’s Mutual and Offsetting Benefit (MOB) Properties. Section V.H. 2 Ibid at Section IX.A and IX.B.1. 3 Id. at Section IX.8.
City of Seattle—2012 Proposed Budget - 846 -

GOVERNMENT PERFORMANCE AND FINANCE COMMITTEE
3. Report from FAS on major maintenance of mutual and offsetting benefit lease properties [SLI 58-1-A-2]
Background: (Cont’d.)
Responsible Council Committee: Government Performance and Finance
Date Due to Council: March 31 (First Report), June 30 (Second Report)
Central Staff reviewed the leases for the above facilities. The oldest lease, to the Central Area Senior Center, dates to 1974. The City entered into the most recent lease, to the Goodwill Development Association for the Teen Mother Center, in 2008. Many of these leases do not appear to be consistent with MOB Lease Rules. For example, cash rents payable under the older leases do not appear to be based on recent appraisals of fair market rent and in one newer lease the City has elected to charge only service rent. These discrepancies reflect decisions made by previous administrations and Councils that the value of services provided by the current tenants are sufficient to cover fair market rent. However, those decisions may have compounded the
challenge of adequately maintaining these City-owned buildings.
4. A review of information technology systems and protocols Citywide to identify efficiency, effectiveness, and security improvements [SLI 75-1-A-2]
Statement of Legislative Intent:
The Council requests that the Executive branch conduct a review of information technology (IT) systems and protocols Citywide to identify efficiency, effectiveness, and security improvements. This review should result in specific actionable recommendations to improve service to users, standardize systems and protocols, and achieve cost efficiencies. The review should consider any reasonable recommendations that can achieve the purposes of this review, including, but not limited to, software standardization, uniform protocols for access and use of IT systems and software, department-specific applications and approval standards for such applica-tions.
This review covers all City departments and offices, including the utilities.
This review is not designed or intended to reduce staffing levels, although the recommendations may address that possibility. If staffing reductions are recommended, it is the Council’s desire to achieve these reductions through the normal process of attrition. The review should be a collaborative process that includes the active participation of employees representing departments across City government, perhaps using an Employee In-volvement Committee framework with an independent facilitator.
The Executive may accept the services of interested technology companies for assistance with this review, in-cluding the development of recommendations. King County accepted the contributed services of Microsoft when a similar review of IT services was completed in 2008. If the contributed services of an interested tech-nology company are accepted, the company must disclose at the time of being retained whether or not it has an interest in securing paid services or selling products to the City.
The Executive may also retain the services of outside consultants to assist with this review. Up to $150,000 may be used from unreserved fund balance in the Information Technology Fund to pay for these consultant ser-vices.
Responsible Council Committee(s): Public Safety, Civil Rights and Technology; Government Performance and Finance
Date Due to Council: June 1, 2012 (final report and recommendations)
2012 Statements of Legislative Intent
City of Seattle—2012 Proposed Budget - 847 -

HOUSING, HUMAN SERVICES, HEALTH AND CULTURE COMMITTEE
2012 Statements of Legislative Intent
5. Report to examine potential City support for a new Bruce Lee Action Museum [SLI 21-1-A-2]
Statement of Legislative Intent:
The Council requests that the Office of Arts and Cultural Affairs (OACA), in cooperation with the Office of Eco-nomic Development (OED), the Department of Finance and Administrative Services (FAS), Department of Neighborhoods (DON), and other appropriate City departments, develop a report to Council examining the extent to which City (and other public agency) resources are available to support the creation and ongoing funding of a new museum to showcase Bruce Lee.
Bruce Lee (born Lee Jun-fan - 李 振 藩) was a notable martial arts expert and actor who lived in Seattle in the late
1950’s through mid 1960’s. Upon his death in 1973 his remains were interred at Lakeview Cemetery in North Capitol Hill, adjacent to Volunteer Park. In June 2011, plans for a proposed museum at his former Hong Kong resi-dence, developed with support of his family, were abandoned. The family has now expressed interest in develop-ing the museum in Seattle, preferably within the City’s Chinatown-International District.
The Lee Family Foundation has developed a museum concept, known as the Bruce Lee Action Museum, which envisions a building housing a significant collection of Bruce Lee memorabilia that includes personal items, writ-ings and objects of historical significance, a meeting room, a theatre and gift shop, a café, research library and a space for temporary exhibits. Council sees this as a unique opportunity for the City, one that could provide both a new cultural facility showcasing a figure in Seattle’s recent history, as well as a means for providing economic development and community building opportunities for the Chinatown-International District.
Once a viable plan has been brought forward for the Bruce Lee Action Museum by the Lee Family Foundation, the Council requests that a report be prepared that analyzes the following items:
1. Suitable locations for the museum that are owned by the City, or other public agency, and that could be used to locate such a stand- alone or mixed use facility, taking into account:
Site availability
Proximity to other cultural facilities
Ease of access to the transportation network
Location in relationship to the Chinatown-International District
2. If the City or public agency does not own a suitable piece of property to house such a facility, support that could be provided by the City in assisting with private property acquisition.
3. Public and private funding strategies and sources that could provide short and long-term capital, operations and maintenance funding.
City of Seattle—2012 Proposed Budget - 848 -

5. Report to examine potential City support for a new Bruce Lee Action Museum [SLI 21-1-A-2] (Cont’d.)
HOUSING, HUMAN SERVICES, HEALTH AND CULTURE COMMITTEE
2012 Statements of Legislative Intent
Statement of Legislative Intent:
4. The direct and indirect economic impact that such a facility could have on its surrounding community, in the form of:
Job creation
Increased access to cultural facilities
Economic impacts on surrounding businesses.
The City Council acknowledges that the proposed August 1, 2012 reporting date may need to be extended, if there are significant delays that prevent the presentation of a final plan to OACA.
Responsible Council Committee: Housing, Human Services, Health & Culture
Date Due to Council: August 1, 2012
6. Redevelopment of Fire Station 39 [SLI 35-1-A-2]
Statement of Legislative Intent:
The Council requests the Executive, including the Finance and Administrative Services Department and the Of-fice of Housing, to develop a proposal for the future redevelopment at the site of the old Fire Station (FS) 39 in Lake City to include, at a minimum, long-term housing for low-income or formerly homeless individuals and/or families. The Executive is requested to involve community stakeholders in the development of a proposal for this site. This proposal may include the provision of services for homeless and/or low income individuals and families. The result of this work will be either a Request For Proposal (RFP) or Request for Qualifications (RFQ) for development of this site and legislation that would authorize the sale or transfer of the property for such development.
The plan for sale or transfer of the property should identify a strategy for addressing the need to replenish the Fire Facilities and Emergency Response Levy program, which by current City policy is to receive the proceeds from the sale of FS 39. The Fire Levy program financial plan includes an estimated revenue of $800,000 from this sale.
Background:
The development of the City owned FS 39 site as a shelter (in the short term) or as housing for homeless indi-viduals and families (in the long term) was examined as part of the Council’s report on alternatives for homeless services prepared in response to Resolution 31292. Due to the existing conditions of FS 39 and building code regulations, extensive and costly renovations of the building would have been required for its use as year-round shelter. Discussions were held with community members over the summer about the shelter proposal and sug-gestions for addressing concerns about this proposal were received by the Council and Mayor.
City of Seattle—2012 Proposed Budget - 849 -

HOUSING, HUMAN SERVICES, HEALTH AND CULTURE COMMITTEE
2012 Statements of Legislative Intent
6. Redevelopment of Fire Station 39 [SLI 35-1-A-2] (Cont’d.)
A proposal to allow FS 39 to be used as a winter only shelter with day services has been developed by the Seattle Union Gospel Mission (SUGM) and is now being evaluated by the City with input from the local community. It is possible that a time-limited use of FS 39 for this purpose would be allowed under the existing building code regu-lations and would not require the extensive renovations required if the entire building was used for year-round 24/7 shelter and services. The Department of Planning and Development (DPD), and Finance and Administrative Services (FAS) are exploring the feasibility of this proposal. SUGM would operate the facility at no cost to the City. The SUGM proposal does incorporate a number of the suggestions made by the community in an effort to respond to concerns raised by neighboring residents and businesses. This proposal would allow the FS 39 building to be used for this purpose only during the Winter months – November to end of March/April.
The Mayor and Council are supportive of the future redevelopment of FS 39 as long-term housing for low-income or formerly homeless individuals and/or families that may include the provision of services, as well. The Mayor has indicated his support for allocating $950,000 in the 2013 budget for the one-time capital costs for such rede-velopment. If the property is redeveloped as low-income housing, Housing Levy funding could be used for the housing portions of the redevelopment. Housing Levy funding cannot be used for the service or commercial space or other space unrelated to the housing on site. As noted in the Council’s report, development of this site as low-income housing for homeless individuals and families would be consistent with the Ten Year Plan to End Homelessness and could also provide housing for those on the street who do not have access to shelter or hous-ing.
Responsible Council Committee: Housing, Human Services, Health & Culture
Date Due to Council: March 30, 2012
7. Monitoring and assessing HSD refugee and immigrant job readiness training, family support, commu-nity organizing and leadership development programs in 2012 [SLI 50-1-A-2]
Statement of Legislative Intent:
This Statement of Legislative Intent (SLI) requests the Human Services Department (HSD) to monitor and assess the impacts (if any) associated with repurposing existing funding for Immigrant and Refugee Family Support to the newly proposed Immigrant and Refugee Youth Job Readiness Training program. Recognizing that nearly 400 parents currently receive family support assistance on an annual basis, Council is interested in ensuring that to the extent possible, any loss of service delivery is mitigated through other HSD programs and potentially, if ap-proved by voters, the Families and Education Levy (F&E Levy). In addition, HSD plans to release a Policy Advocacy and Technical Assistance Request for Investment (RFI) in 2012 that includes funding for leadership development and coalition building for people of color and refugee and immigrant communities.
City of Seattle—2012 Proposed Budget - 850 -
7. Monitoring and assessing HSD refugee and immigrant job readiness training, family support, commu-nity organizing and leadership development programs in 2012 [SLI 50-1-A-2]
(Cont’d.)
HSD is requested to provide the Council with a report that includes the following:
Updated inventory of HSD funded immigrant and refugee family support programming that includes any City or external funding changes for these programs. This information should include a comparison of 2011 and 2012 program funding sources (City and other). This is intended to identify whether City lever-age of external funding for these programs has changed and what impacts that might have on service delivery.
Updated information related to any F&E Levy programs that provide family support services for immi-grants and refugees. This information will not be available prior to adoption of the 2012 Budget. Council will want a summary of funding and outcomes associated with the F&E Levy programs that meet the objective of providing family support services to immigrants and refugees.
An assessment based on feedback from agencies and service providers, community stakeholders, the City’s Immigrant and Refugee Commission, and any other relevant sources regarding community family support needs. This is intended to identify whether any service gaps are emerging either as a result of repurposing of City funds or occurring in the community in general due to other factors.
An update of the results from the Job Readiness Training RFI with a summary of contracted performance outcomes and a progress report related to implementation. In addition to providing an update on the Job Readiness Training RFI, HSD is requested to work with the Office for Education (OFE) to integrate the job readiness program with the Families and Education Levy programming focused on immigrant and refugee youth and families in order to develop specific measurable outcomes and align and coordinate efforts to most effectively and strategically deploy limited resources. The department is expected to report on the outcome of this coordination with OFE as part of its update to Council.
An update of the result of the Policy Advocacy and Technical Assistance RFI with a summary of con-tracted performance outcomes and progress report related to the $120,000 proposed to support people of color and refugee and immigrant communities in leadership development, coalition building and other activities.
HSD is requested to coordinate information related to this SLI and consult with the appropriate City department providing staff support to the City’s Immigrant and Refugee Commission prior to developing a final report for Council review. HSD is requested to provide the Council Human Services Committee with a report on the ele-ments of this SLI no later than August 1, 2012.
2012 Statements of Legislative Intent
City of Seattle—2012 Proposed Budget - 851 -
HOUSING, HUMAN SERVICES, HEALTH AND CULTURE COMMITTEE

7. Monitoring and assessing HSD refugee and immigrant job readiness training, family support, commu-nity organizing and leadership development programs in 2012 [SLI 50-1-A-2]
(Cont’d.)
Background:
In 2012, HSD intends to allocate $465,000 to service providers and agencies through a competitive RFI process for a new immigrant and refugee youth job readiness training program. The plan calls for repurposing $315,000 of existing funds allocated to agencies to provide family support services to immigrant and refugees with children in school. Given the new goal of implementing an intensive and integrated approach to family support as it relates to job readiness training, this program will more narrowly focus on families with youth in the age range of 15-20.
In addition, $120,000 has been allocated in the 2012 budget to support community organizing and leadership development efforts within communities of color and immigrant and refugee communities. This funding is in-tended to increase the level of civic engagement and involvement in public policy making by individuals from these communities.
As a result of new funding and policy shifts, Council is interested in monitoring general immigrant and refugee programming in the context of these changes.
Responsible Council Committee: Housing, Human Services, Health & Culture
Date Due to Council: August 1, 2012
2012 Statements of Legislative Intent
8. Require health outcomes as part of performance pay in City contracts for uninsured medical and dental services [SLI 53-3-A-1]
Statement of Legislative Intent:
The Human Services Department (HSD) is requested to work with Public Health – Seattle & King County (Public Health) to develop and implement health outcomes as part of the performance pay in the City’s contracts for medical and dental services for uninsured clients.
Background.
In 2011 the City provided $6,284,074 for primary medical and dental care services for uninsured Seattle resi-dents, Medicaid access and outreach services, specialty care access services, and staffing and administrative costs including funding for a .75 FTE at Public Health Seattle King County who negotiates and manages the contracts with community health care clinic providers.
HSD requires performance based contracts and determines the outcomes and performance measures providers must meet in city funded programs. HSD then contracts with Public Health who in turn contracts with community health care clinic providers. In 2011 the outcomes and performance measures in the contracts were 1) the num-ber of visits by uninsured Seattle residents, 2) the number of clients enrolled in health coverage, and 3) quality of care goals: for patients with chronic conditions such as diabetes and hypertension, those needing prenatal care, and for children who need immunizations. Additional quality of care goals may be appropriate. However, while
City of Seattle—2012 Proposed Budget - 852 -
HOUSING, HUMAN SERVICES, HEALTH AND CULTURE COMMITTEE

8. Require health outcomes as part of performance pay in City contracts for uninsured medical and dental services [SLI 53-3-A-1]
(Cont’d.)
25% of the contract funding must be earned, currently the only performance requirements tied to reimburse-
ment are that providers meet their targeted number of visits by uninsured Seattle residents and their targeted
number of enrollments in health coverage; reimbursement is not tied to quality of care goals.
HSD is currently finalizing its Healthy Families, Healthy Communities strategic plan. The strategic plan is intended to address three charges that the Mayor’s Office and City Council gave to HSD in July 2010: 1) create a seamless service delivery system, 2) reorganize and redesign HSD’s contracting infrastructure and process; and 3) develop a data-driven environment that guides investments. Reviewing the City’s investments for uninsured medical and dental visits to more clearly identify the health outcomes the City is investing in and tying health outcomes to performance pay is aligned with the Department’s work on its strategic plan.
Timeline
HSD is requested to work with Public Health in 2012 to require health outcomes as part of performance pay in the City’s 2013 contracts for medical and dental services for uninsured Seattle residents. HSD is also requested to report back to the Council’s Housing, Human Services, Health and Culture committee with the changes they will be making in the City’s 2013 contracts for medical and dental services for uninsured Seattle residents by June 30, 2012.
Responsible Council Committee: Housing, Human Services, Health & Culture
Date Due to Council: By June 30, 2012
2012 Statements of Legislative Intent
City of Seattle—2012 Proposed Budget - 853 -
9. HSD utility low income customer enrollment and outreach [SLI 54-1-A-1]
Statement of Legislative Intent:
The Council requests that the Human Services Department (HSD) submit a report that reviews its Utility Discount Program (UDP) for low income customer enrollment and outreach. The report should be developed in coordina-tion with Seattle Public Utilities (SPU) and Seattle City Light (SCL) and include the following elements relating to HSD staffing and work processes for utility low income customer enrollment and outreach programs:
1. Compare 2012 HSD staffing, work processes and costs to 2010 staffing, work processes, and costs.
2. Show how performance targets are being met after 2011 implementation of HSD’s recently updated utility low income customer enrollment work processes compared to past years.
3. Identify aspects of HSD’s UDP that are working well and the aspects that could be improved to bet-ter meet performance targets and reduce costs. Recommend specific further improvements, a schedule for implementing those improvements, and a timeframe within which performance tar-gets can be met after implementation.
Responsible Council Committee: Housing, Human Services, Health & Culture
Date Due to Council: March 31, 2012
HOUSING, HUMAN SERVICES, HEALTH AND CULTURE COMMITTEE

2012 Statements of Legislative Intent
City of Seattle—2012 Proposed Budget - 854 -
LIBRARY, UTILITIES AND CENTER COMMITTEE
Statement of Legislative Intent:
The Council requests that Seattle Public Utilities (SPU) submit a report that:
1. Evaluates the formula used to calculate tap fees charged when a new water service is connected to the City system, with a goal of adjusting the formula to recover to the greatest extent possible SPU’s cost of providing new taps services.
2. Evaluates the work processes used to connect new water taps to the City system and identifies op-portunities to conduct the work more efficiently to lower the cost of new taps services.
3. Recommends how to narrow the gap between new taps revenues and expenditures by updating the formula for calculating tap fees, reducing cost of new taps services through more efficient work processes, or both. The recommendations should seek to reduce the gap by at least $250,000 in 2013 and an additional $250,000 (for a total reduction of at least $500,000) in 2014.
Responsible Council Committee(s): Library, Utilities and Center
Date Due to Council: May 1, 2012
10. SPU update of tap fees and related work processes [SLI 7-1-A-1]
11. Review of SPU financial policies [SLI 13-1-A-1]
Statement of Legislative Intent:
The Council requests that Seattle Public Utilities (SPU) submit a report that reviews its financial policies, with an emphasis on drainage and wastewater policies including the policy for the cash contribution to the capital improvement program (CIP). The report should include:
1. A summary of financial policies for SPU’s Funds and an explanation of why each policy target was selected.
2. A comparison of SPU financial policies and bond ratings to those of other comparable utilities and Seattle City Light.
3. An evaluation of the Drainage and Wastewater Fund cash-to-CIP policy that considers a change from a 25% CIP cash contribution to a 20% cash contribution. The evaluation should show any revenue requirement savings, the rate path through 2017 if a 20% cash-to-CIP policy were adopted and the long-term implications for debt outstanding. It also should explain any financial risks associated with such a change.
Responsible Council Committee(s): Library, Utilities and Center
Date Due to Council: January 31, 2012

LIBRARY, UTILITIES AND CENTER COMMITTEE
2012 Statements of Legislative Intent
12. SPU recycling work plan priorities [SLI 14-1-A-1]
Statement of Legislative Intent:
The Council requests that Seattle Public Utilities (SPU) submit a detailed 2012 work plan for working toward Resolution 30990’s goal of 60% recycling. Although progress has been made toward the City’s recycling goal, de-tailed 2012 activities to achieve the goal are not shown in the proposed budget. The work plan requested in this Statement of Legislative Intent (SLI) should:
1. Identify base activities and new actions that contribute to achieving the recycling goal, including an estimate of the amount of contribution (in tons and % goal achievement) for each activity and a brief explanation of the criteria used to identify the actions as priorities.
2. Show funding estimates for each action and the combination of resources (SPU staff hours, consult-ant contracts, etc.) assigned to the actions.
3. Compare the actions in the 2012 work plan to those recommended in the draft Seattle Solid Waste Plan 2011 Revision, and explain any differences between the 2012 work plan and draft Solid Waste Plan-recommended actions.
Responsible Council Committee(s): Library, Utilities and Center
Date Due to Council: January 15, 2012
PARKS AND NEIGHBORHOODS COMMITTEE
13. Funding options for arts-related programs at the Department of Parks and Recreation [SLI 81-1-A-1]
Statement of Legislative Intent:
The Council requests that the Department of Parks and Recreation (DPR) submit a plan that details future funding options for its three arts-related programs – Downtown Arts in Parks, Langston Hughes Performing Arts Center (LHPAC) and Outdoor Neighborhood Parks – whose funding from Admissions Tax revenues will end after Decem-ber 31, 2012.
In November 2010, the Council adopted Ordinance 123460, which authorized the temporary transfer (until De-cember 31, 2012) of 25% of Admission Tax revenues appropriated to the Office of Arts and Cultural Affairs to DPR. It is Council’s understanding that beginning with the 2013-2014 Proposed budget, General Subfund (GSF) or other ongoing financial support will be needed for these programs.
The plan presented by DPR should include:
1. The estimated amount of financial support for each of these programs, starting with the 2013-2014 budget, including details on GSF or non- GSF support;

2012 Statements of Legislative Intent
PARKS AND NEIGHBORHOODS COMMITTEE
2. The estimated amount of financial support for each of these programs, starting with the 2013-2014 budget, including details on GSF or non- GSF support;
3. The extent of any required program or staffing reductions to support the three programs, as of January 1, 2013;
4. The extent to which public/private partnerships can provide funding for each program;
5. Options that provide long-term financial support to maintain and operate LHPAC, including:
a. Whether expanding the use of the facility to additional arts or cultural organizations would result in greater financial stability for the facility,
b. Whether the City should contract with a non-city organization to operate the facility,
c. Whether the facility should be sold, leased or transferred to a group or organization to benefit arts or cultural organizations, or
d. Other options that provide long-term financial stability to continue operation of the facility.
(Cont’d.)
13. Funding options for arts-related programs at the Department of Parks and Recreation [SLI 81-1-A-1]
Responsible Council Committee: Parks and Neighborhoods
Date Due to Council: June 1, 2012
14. Funding options for arts-related programs at the Department of Parks and Recreation [SLI 83-1-A-1]
Statement of Legislative Intent:
The City Council requests that the Parks Superintendent work with the Board of Parks Commissioners andother interested community partners, the City Budget Office, the Mayor’s Office, the City Attorney’s Office, and Council staff in 2012 to explore potential new sources of ongoing revenue for parks operations. This work should include the preparation of two written reports for the Council’s review. The written reports should include, but not be limited to: (1) information on revenue sources used to fund parks operations in other jurisdictions, (2) the pros and cons of any potential new revenue sources, (3) the amount and stability of those revenue sources, and (4) descriptions of any required changes to state or municipal law. The reports should also include a definition of parks service levels and the amount of revenue required to support those service levels. The reports should take into account the City’s larger financial picture and how the options described in the reports fit in with that picture and with the city’s other fiscal priorities.
Background:
Seattle voters last approved parks levies in 2000 and 2008. Under both levies, most of the revenues raised were allocated for capital expenses, including land acquisitions and the development or renovation of parks facilities and open spaces. These new investments have increased the Department of Parks and Recreation’s (DPR) opera-tional responsibilities; however, funding for parks operations has not kept pace. Additionally, DPR’s largest source of revenue, the City’s General Subfund (GSF), is subject to fluctuations related to changing economic

14. Funding options for arts-related programs at the Department of Parks and Recreation [SLI 83-1-A-1]
PARKS AND NEIGHBORHOODS COMMITTEE
2012 Statements of Legislative Intent
(Cont’d.)
conditions and budgetary pressures. GSF support currently accounts for about two thirds of DPR’s total annual revenues. Consequently, the Council is interested in identifying new, stable, ongoing revenue sources to support parks operations.
Responsible Council Committee: Parks and Neighborhoods
Date Due to Council: Preliminary report due by June 30, 2012.
Final report due by January 2, 2013.
PLANNING, LAND USE AND SUSTAINABILITY COMMITTEE
15. DPD - Planning Division Work Program Development and Reporting [SLI 63-1-A-1]
Statement of Legislative Intent:
The Council requests that the Department of Planning and Development report to the Council periodically on work program development for the Planning Division.
In the 2011 adopted budget the Council included Statement of Legislative Intent (SLI) 42-1-A-1 that directed DPD to develop a multi-year work program that could be used as a shared tool by the Council and Mayor to prioritize resources among projects in the Planning (Budget Control Level) BCL. Among other things, the Planning BCL con-tains functions in DPD that develop policy and regulations that are incorporated into the Comprehensive Plan, the Land Use Code, and other policy and regulatory documents that govern development of the built environ-ment. Consistent with SLI 42-1-A-1, the Planning Division Director reports quarterly on work program develop-ment and briefs the Committee on the Built Environment (renamed the Planning, Land Use and Sustainability Committee in 2012) on proposed new projects. This budget action continues the required work program report-ing.
The work program SLI 1) allows the Council to periodically monitor the Planning Division’s work program develop-ment to ensure that it is consistent with Council priorities, 2) gives the Council an opportunity to provide input on mid-year work program changes, and 3) creates a forum for the Executive and the Council to arrive at shared priorities. If issues emerge for the Mayor and Council during the year, those initiatives can be considered with a better understanding as to what the trade-offs might be among existing priorities.
Frequency of Report:
The reports should be provided quarterly to the Council in advance of the quarterly supplemental budget and grant acceptance ordinances and never later than March 31st, June 30th, September 30th, and December 31st, 2012. The report may be provided concurrently with regularly scheduled reports by the DPD Director to the Plan-ning, Land Use and Sustainability Committee.
City of Seattle—2012 Proposed Budget - 857 -

2012 Statements of Legislative Intent
City of Seattle—2012 Proposed Budget - 858 -
15. DPD - Planning Division Work Program Development and Reporting [SLI 63-1-A-1]
PLANNING, LAND USE AND SUSTAINABILITY COMMITTEE
(Cont’d.)
Contents of Report: Each report shall contain the following:
An up-to-date work program;
A narrative description of any new or changed projects proposed by the Executive or Council;
Approximate FTE assignments by project; and
A summary table identifying by project and fund source all anticipated resources likely to flow from quarterly grant acceptance and supplemental budget ordinances or from any other sources not required to be appropri-ated through a supplemental budget ordinance.
Consistent with Green Sheet 66-1-A-1, the first quarter report shall include a proposal for an incremental ap-proach to the 7-year Comprehensive Plan Update required by RCW 36.70A.130 that would require no more than $150,000 be expended on the effort in 2012 and would allow for Council action by 2015.
Responsible Council Committee: Planning, Land Use and Sustainability
Date Due to Council: March 31, 2012, June 30, 2012, September 30, 2012, December 31, 2012
16. DPD report to Council on Hansen permitting software replacement or upgrade [SLI 65-1-A-1]
Statement of Legislative Intent:
The Council requests that the Department of Planning and Development (DPD) report to the Council by June 30, 2012 on options for replacing or upgrading the Hansen permitting software system. The Council further requests that DPD provide this report prior to issuing any requests for proposals to identify vendors for replacement soft-ware.
Background:
The budget appropriates $550,000 to the Process Improvement and Technology (PI&T) budget control level to review options for replacing or updating the Hansen permitting software system. This system was first put into operation in 2001 and replaced the 1980s era Permit Tracking System (PTS). The total cost over six years of mak-ing Hansen fully operational and migrating from PTS was approximately $11 million.
The current version of Hansen is reaching the end of its useful life and vendor support for the current version may soon be unavailable. Approximately $200,000 of the appropriation is to complete an upgrade to the Oracle database that began in 2011. Approximately $350,000 of the appropriation is to analyze options for future re-placement of or upgrade to Hansen to ensure ongoing vendor support and compatibility with Windows 7 and Internet Explorer 9.

2012 Statements of Legislative Intent
16. DPD report to Council on Hansen permitting software replacement or upgrade [SLI 65-1-A-1]
PLANNING, LAND USE AND SUSTAINABILITY COMMITTEE
(Cont’d.)
Information provided by DPD indicates that work products anticipated from the options analysis may include:
1. Defining current permitting system requirements and key business processes;
2. Identifying impacts to peripheral systems and other possible impacts related to Hansen upgrade or replacement;
3. Information Gathering – site visits with similar size and complexity jurisdictions to gather lessons learned and successes with their permitting systems;
4. Conducting requests for interest to identify potential vendor products that meet requirements;
5. Developing fit/gap analyses to determine feasible replacement solutions to fit requirements;
6. Conducting cost/benefit analyses for top options which may include:
a. Upgrading to Hansen version 8,
b. Replacement with a new vendor solution, or
c. Replacement with an in-house developed solution;
7. Recommending an approach, which includes identifying a best scenario that meets DPD business proc-ess needs with the least amount of disruption to current business;
8. Conducting a request for proposals, if needed, to identify a vendor if a replacement option is chosen; and
9. Developing a project plan, schedule, timeline, resource requirements, etc… for an upgrade project, which might be implemented in 2012 or 2013.
Responsible Council Committee:
Date Due to Council: June 30, 2012
PUBLIC SAFETY, CIVIL RIGHTS AND TECHNOLOGY COMMITTEE
17. Test of body-mounted video cameras [SLI 23-1-A-1]
Statement of Legislative Intent:
In approving the budget for the Police Department, it is the Council’s intent that the Department test the use of body-mounted video cameras by police officers, and that this test inform the Mayor’s 2013 Proposed Budget.
This project will begin with a test of the cameras by officers in cars assigned to traffic enforcement. This phase will last 90 days. The next phase, also 90 days, will be a test of the cameras by patrol officers in the West Precinct. One objective of these phases is to compare the quality and content of videos recorded by the body-mounted cameras to those recorded by the cameras already installed in traffic and patrol cars. Another is to begin evaluat-ing alternative protocols for managing the use of the cameras and recordings.
City of Seattle—2012 Proposed Budget - 859 -

2012 Statements of Legislative Intent
PUBLIC SAFETY, CIVIL RIGHTS AND TECHNOLOGY COMMITTEE
17. Test of body-mounted video cameras [SLI 23-1-A-1]
(Cont’d.)
It is the Council’s intent that the Executive develop options for deploying body-mounted cameras soon enough to provide a basis for funding options for the 2013 Budget. The Council requests a written report from the Executive by the end of July on the results of the test. This report should describe the costs and benefits of any reasonable alternative deployments, so that the Council can evaluate this aspect of the 2013 Proposed Budget in its own deliberations.
The Council recognizes that the use of body-mounted video cameras may be subject to collective bargaining with the Seattle Police Officers’ Guild.
Responsible Council Committee: Public Safety, Civil Rights and Technology
Date Due to Council: July 31, 2012
18. Neighborhood Policing Plan Update [SLI 24-1-A-1]
City of Seattle—2012 Proposed Budget - 860 -
Statement of Legislative Intent:
In approving the budget for the Police Department, it is the Council’s intent that the Department update and re-fine the Neighborhood Policing Plan and that the Mayor propose a 2013 budget consistent with the updated plan. The Council requests that the Department provide the updated plan no later than June of 2012.
The Council expects the updated plan to be fiscally realistic. The purpose of the plan is to show how to provide the most public safety for the resources available.
This statement of intent outlines topics the updated plan should address.
Background:
The current Neighborhood Policing Plan reflects six years of discussion among the Police Department, the Execu-tive and the Council about increasing the ability of patrol officers to improve public safety throughout the city:
In a 2006 Statement of Legislative Intent (SLI), the Council asked the Department to expedite the imple-mentation of geographic based policing to better match patrol deployment with patrol workload in or-der to improve the Department’s ability to respond to emergency calls and increase the amount of time patrol officers spend on proactive policing. In another 2006 SLI, the Council proposed that the Council and Executive jointly develop performance measures for the Department.
In October 2006, Resolution 30930 asked the Mayor to recommend the appropriate number of police officers for the years 2008 through 2012 based on desired public safety outcomes and to propose a 2008 budget consistent with this plan.

City of Seattle—2012 Proposed Budget - 861 -
2012 Statements of Legislative Intent
PUBLIC SAFETY, CIVIL RIGHTS AND TECHNOLOGY COMMITTEE
18. Neighborhood Policing Plan Update [SLI 24-1-A-1]
(Cont’d.)
In March 2007, the Department issued the Neighborhood Policing Plan (NPP), which proposed to redraw patrol beats, create new patrol work shifts and add 105 patrol officers between 2008 and 2012, all to make patrol officers available when and where they are needed and to give them more time for proac-tive work.
In September 2007, Resolution 31014 endorsed the NPP; Resolution 30996 established performance measures for the Department; and the Mayor proposed a 2008 budget to implement the NPP. The Council approved the budget in November 2007.
In 2008 and 2009 combined the Department exceeded the hiring goals of the NPP with a net increase of 69 offi-cers in those two years. Due to budget constraints the Department stopped hiring in mid-2010, leading to a net decrease of 44 officers in 2010 and 2011 combined. The 2012 Proposed Budget proposes no change in the num-ber of officers. As a result, by the end of 2012, the Department will have added 25 officers over the five years covered by the NPP rather than the planned 105. Because it has not met the NPP hiring goals, it has not yet es-tablished new work shifts for patrol officers. It remains uncertain whether and when the NPP will be imple-mented.
Topics the updated Neighborhood Policing Plan should address:
1. Core NPP principles
The Council continues to support the core principles of the NPP:
Patrol officers should be deployed in ways that strengthen officers’ sense of ownership of the neighborhoods they serve.
Patrol deployment should match workload by geography and time.
Responses to 911 calls and proactive policing should be provided equitably and dependably in all parts of the city at all times.
Proactive time should be used to achieve public safety outcomes identified by command staff and the public.
2. Measuring NPP implementation
The first three principles above imply that patrol officers in every beat in the city should have enough proactive time to address neighborhood crime problems at the times those problems can be addressed most effectively. Successful implementation of the plan should be measured in part by whether this is the case. The proactive work of specialized units within the five precincts is a valuable supplement to the proactive work of patrol offi-cers, but is not a substitute for it.

City of Seattle—2012 Proposed Budget - 862 -
2012 Statements of Legislative Intent
PUBLIC SAFETY, CIVIL RIGHTS AND TECHNOLOGY COMMITTEE
18. Neighborhood Policing Plan Update [SLI 24-1-A-1]
(Cont’d.)
3. Improving patrol shifts
The plan to hire 105 additional officers assumed that meeting the objectives for 911 response and proactive time would require at least 605 patrol officers. This in turn assumed that all patrol officers would work 10-hour shifts. A shift structure combining 9-hour shifts and 10-hour shifts may be more efficient, and thus may make it possible to meet the objectives with fewer patrol officers. The Council believes such a shift structure can be beneficial to individual officers as well as to the public.
4. Roles of officers outside patrol
Because the NPP would create more time for patrol officers to investigate and otherwise address neighborhood crime problems, it implies a complementary change in the roles of precinct detectives, centralized investigation units and other centralized sworn mission specialists who also address neighborhood crime problems. The City’s budget situation may require that any patrol staffing requirements be met in part by transferring officers from other units into patrol rather than only by adding officers to the Department. For these reasons an updated plan should comprehend the work of sworn mission specialists as well as patrol officers.
5. Using scientific knowledge
The goal of giving patrol officers more useful proactive time is based in part on research showing that focused problem solving by officers is among the most effective forms of policing for preventing crime. The science of what works in policing has continued to progress in the years since the plan was proposed. The Department and the City should take advantage of this knowledge on a continuing basis. The recent Drug Market Initiative and the Department’s intention to explore the benefits of place-based policing are excellent examples.
6. Limiting change in the number of officers
Large fluctuations in the number of officers hired each year create inefficiency in recruiting, evaluating and train-ing new officers. When the Department meets budget by stopping hiring entirely, the number of fully trained officers continues to decline well after hiring resumes. When Mayor and Council ask the Department to meet higher staffing goals fast, the training operation must increase fast, and the quality of recruits and the quality of the training they receive may go down. For these reasons the City and the Department should limit year-to-year changes in the number of officers hired. A reasonable target may be to limit annual hiring to a range between one-third more and one-third less than the number needed to replace the officers who leave the force in the year.
Responsible Council Committee: Public Safety, Civil Rights and Technology
Date Due to Council: June 29, 2012

City of Seattle—2012 Proposed Budget - 863 -
2012 Statements of Legislative Intent
19. Annual reports on workforce and contracting equity [SLI 46-1-A-1]
PUBLIC SAFETY, CIVIL RIGHTS AND TECHNOLOGY COMMITTEE
Statement of Legislative Intent:
The Council requests that the Executive present the following two reports to the Energy, Technology, and Civil Rights Committee by July 10, 2012 and July 10, 2013:
1. A joint report from the Personnel Department and the Seattle Office for Civil Rights (SOCR) on workforce eq-uity that presents an analysis of past year results, both citywide and by individual department, provides updates on new initiatives pursued over the past year, identifies both positive steps and areas needing improvement, and recommends strategies to address challenges in reaching workforce equity.
2. A joint report from Finance and Administrative Services (FAS) and SOCR on contracting equity that presents an analysis of past year results, both citywide and by individual department, provides updates on new initiatives pursued over the past year, identifies both positive steps and areas needing improvement, and recommends strategies to address challenges in reaching contracting equity.
The reports would be submitted just before the mid-year presentations by individual departments to the Council describing their efforts to advance the City’s Race and Social Justice Initiative (RSJI), including workforce and con-tracting equity, and would inform the Council’s review of department presentations.
Responsible Council Committee: Public Safety, Civil Rights and Technology
Date Due to Council: July 10, 2012 and July 10, 2013
TRANSPORTATION COMMITTEE
20. Third Avenue Transit Corridor Initiative [SLI 114-2-A-2]
Statement of Legislative Intent:
The Council requests the Executive create a task force to identify actions needed to improve the functionality, urban design, safety and security of the downtown Third Ave Transit Corridor, as well as to recommend options for addressing the impacts on tourism, economic development and social equity arising from the elimination of Metro’s Ride Free Area (RFA). Multiple City departments will need to be represented on the task force, including the Seattle Department of Transportation, Seattle Police Department, Seattle Public Utilities, Department of Planning and Development and the Office of Economic Development. Given that the impending elimination of Metro’s RFA will significantly affect the corridor, King County Metro Transit will also need to be a key player in developing recommendations and a strategy for implementing those recommendations, as will representatives from the neighboring business com-munity, the Downtown Seattle Association, non-profit service providers and other stakeholders. This effort would build on previous work conducted by the City and other agencies and stakeholders over the past few years along Third Avenue, with the goal of reassessing existing programs and previous plans in light of current conditions and the impending transit changes. The team will be tasked with identifying short term and long term actions, poten-tial changes in policy, resource needs and possible funding sources and strategies.

City of Seattle—2012 Proposed Budget - 864 -
2012 Statements of Legislative Intent
TRANSPORTATION COMMITTEE
20. Third Avenue Transit Corridor Initiative [SLI 114-2-A-2]
(Cont’d.)
In support of this effort, Council plans to appropriate additional funding for regular cleaning in the corridor and set aside one-time capital funding to support appropriate infrastructure investments. The Council looks forward to recommendations from the task force about how best to invest these dollars. The following highlights some of the key challenges to be addressed by the task force:
Continuing coordination with King County to mitigate the impact of the elimination of the RFA (scheduled for October 2012), both with regard to concerns about social equity and impacts on transit operations;
Improving signage, lighting and/or other physical changes that improve visitors’ feelings of safety and security;
Identifying and implementing effective means of policing the corridor and ensuring public safety, par-ticularly in hotspots such as Third and Lenora and Third between Pike and Pine;
Development of a pilot “hot spot” policing initiative with identifiable outcomes and strategies to track and reduce reported and on-view criminal activity within targeted zones within the Third Avenue Transit Corridor. In developing and executing this proposal, SPD should involve relevant adjacent property own-ers. other government agencies, including the State Department of Corrections and King County Transit Police and other relevant stakeholders. SPD should use an evidence-based hot spot problem-solving process as described in the March 29, 2011 Office of City Auditor report “Addressing Crime and Disorder in Seattle's ‘Hot Spots’: What Works?”
Integrating well-maintained transit waiting areas into the streetscape in a manner that serves transit operations and improves perceptions of public safety and security, while maintaining pedestrian access to neighboring businesses;
Engaging adjacent building owners/businesses to coordinate and improve street edges and improve stewardship of sidewalks, building entrances and retail fronts;
Expanding existing efforts to remove trash and clean sidewalks on a daily basis;
Promoting increased and more vibrant retail activity; and
Engaging low-income housing operators and social service providers in their efforts to maintain security and livability near their entrances.
Background: On August 16, 2011, the King County Council enacted Ordinance 17169, imposing a two-year congestion reduc-tion charge of $20 on vehicle registration renewals. The County legislation also included a provision ( Sec. 11) discontinuing the downtown RFA by October 2012. The County Executive has until May 2012 to submit to the County Council an implementation plan for elimination of the RFA. King County Metro has convened several work groups to develop the implementation plan. Seattle staff are participating in the two groups focused on human service impacts and bus speed and reliability. The RFA was established in 1973 as part of an effort to revitalize downtown, but allowing riders to board down-town without payment has also allowed large masses of buses to move more quickly through downtown and to stay on schedule in the area where a huge proportion of the system’s riders board or alight. Now that most riders carry Orca cards, buses board more quickly. However, with the high level of regional and local buses working their way through downtown, Metro and SDOT planners still have concerns about delays when the RFA ceases. Moreover, in the nearly 40 years the RFA has been in place, many human service providers have located within the RFA. Even though Metro plans to continue and expand a robust free and reduced fare ticket program, these service providers and advocates have expressed concerns about a loss of mobility for homeless and other vulner-able populations.

2012 Statements of Legislative Intent
TRANSPORTATION COMMITTEE
20. Third Avenue Transit Corridor Initiative [SLI 114-2-A-2]
(Cont’d.)
Additionally, Third Avenue has long had problems with poor urban design, insufficient lighting, crime, graffiti and trash on the street. A handful of storefront businesses and building entrances have become nodes for loitering, with a couple street corners in particular perceived to operate day and night as open-air drug markets. In the last few years there have been some high profile violent crimes on Third Avenue. All this, along with several empty storefronts, has created a popular perception that Third Avenue and the downtown commercial core as a whole are becoming more dangerous. Downtown stakeholders have long recognized these problems. In 2007, the City of Seattle, King County Metro and the Downtown Seattle Association negotiated a Memorandum of Understanding to assign responsibilities for a long list of short-term improvements in the areas of Public Safety, Cleaning and Trash Collection, Lighting, Ur-ban Design and Tracking Programs. The MOU was never executed. Department of Planning and Development also undertook development of an urban design study that produced a two-part set of recommendations on bus shelters, signage, glass canopies, landscaping, sidewalk improvements, storefront improvements and public art. That plan was never implemented although the recommendations were well received by stakeholders.
The City Auditor recently identified a growing body of criminology research that demonstrates that policing strategies focused on specific, small areas within neighborhoods are effective at reducing criminal activity and increasing safety in those areas. The report found that a majority of crime in Seattle occurs on a very limited number of block faces and that these locations of concentrated criminal activity do not materially change from year to year. Several block faces along the Third Avenue corridor in Downtown Seattle experience significant lev-els of criminal activity and the Council regularly hears concerns from residents, employees, and business and property owners regarding the level of illegal activity in specific areas.
Responsible Council Committees: Transportation, Public Safety, Civil Rights and Technology
Date Due to Council: Written quarterly reports or briefings due in March 31, June 30, September 30, and Decem-ber 31, 2012
NOTE: This SLI is listed under two Committees.
City of Seattle—2012 Proposed Budget - 865 -

City of Seattle—2012 Proposed Budget - 866 -

Glossary:
The glossary provides definitions of terms specific to governmental budgeting that are used through-out the budget book.
City of Seattle—2012 Proposed Budget - 867 -

City of Seattle—2012 Proposed Budget - 868 -
Glossary
Abrogate: A request to eliminate a position. Once a position is abrogated, it cannot be administratively reinstated. If the body of work returns, a department must request new position authority from the City Council. Appropriation: A legal authorization granted by the City Council, the City’s legislative authority, to make expenditures and incur obligations for specific purposes. Biennial Budget: A budget covering a two-year period. Under state law, a biennium begins with an odd-numbered year. Budget - Adopted and Proposed: The Mayor submits to the City Council a recommended expenditure and revenue level for all City operations for the coming fiscal year as the Proposed Budget. When the City Council agrees upon the revenue and expenditure levels, the Proposed Budget becomes the Adopted Budget, funds are appropriated, and legal expenditure limits are established. Budget - Endorsed: The City of Seattle implements biennial budgeting through the sequential adoption of two one-year budgets. When adopting the budget for the first year of the biennium, the Council endorses a budget for the second year. The Endorsed Budget is the basis for a Proposed Budget for the second year of the biennium, and is reviewed and adopted in the fall of the first year of the biennium. Budget Control Level: The level at which expenditures are controlled to meet State and City budget law provisions. Capital Improvement Program (CIP): Annual appropriations from specific funding sources are shown in the City's budget for certain capital purposes such as street improvements, building construction, and some kinds of facility maintenance. These appropriations are supported by a six-year allocation plan detailing all projects, fund sources, and expenditure amounts, including many multi-year projects that require funding beyond the one-year period of the annual budget. The allocation plan covers a six-year period and is produced as a separate document from the budget document. Chart of Accounts: A list of expenditure, revenue, and other accounts describing and categorizing financial transactions. Community Development Block Grant (CDBG): A U.S. Department of Housing and Urban Development (HUD) annual grant to Seattle and other local governments to support economic development projects, human services, low-income housing, and services in low-income neighborhoods. Comprehensive Annual Financial Report of the City (CAFR): The City’s annual financial statement prepared by the Department of Finance and Administrative Services. Cost Allocation: Distribution of costs based on some proxy for costs incurred or benefits received.

City of Seattle—2012 Proposed Budget - 869 -
Cumulative Reserve Subfund (CRS): A significant source of ongoing local funding to support capital projects in general government departments. The CRS consists of two accounts: the Capital Projects Account and the Revenue Stabilization Account. The Capital Projects Account has six subaccounts: REET I, REET II, Unrestricted, South Lake Union Property Proceeds, Asset Preservation Subaccount - Fleets and Facilities, and the Street Vacation Subaccount. The Real Estate Excise Tax (REET) is levied on all sales of real estate, with the first .25% of the locally imposed tax going to REET I and the sec-ond .25% to REET II. State law specifies how each REET can be spent. Debt Service: Annual principal and interest payments the City owes on money it has borrowed. Education and Developmental Services Levy (Families and Education Levy): In September 2004, voters approved a new Families and Education Levy for $116.7 million to be collected from 2005 through 2011. This is the third levy of this type, replacing ones approved in 1990 and 1997. Appropriations are made to various budget control levels grouped together in the Educational and Developmental Services section of the budget, and are overseen by the Department of Neighborhoods. Appropriations then are made to specific departments to support school- and community-based pro-grams for children and families. Errata: Adjustments, corrections, and new information sent by departments through the City Budget Office to the City Council during the Council’s budget review as an adjunct to the Mayor’s Proposed Budget. The purpose is to adjust the Proposed Budget to reflect information not available upon sub-mittal and to correct inadvertent errors.
Full-Time Equivalent (FTE): A term expressing the amount of time for which a position has been budgeted in relation to the amount of time a regular, full-time employee normally works in a year. Most full-time employees (1.00 FTE) are paid for 2,088 hours in a year (or 2,096 in a leap year). A position budgeted to work half-time for a full year, or full-time for only six months, is 0.50 FTE.
Fund: An accounting entity with a set of self-balancing revenue and expenditure accounts used to re-cord the financial affairs of a governmental organization.
Fund Balance: The difference between the assets and liabilities of a particular fund. This incorporates the accumulated difference between the revenues and expenditures each year.
General Fund: A central fund into which most of the City’s general tax revenues and discretionary re-sources are pooled, and which is allocated to support many of the operations of City government. Be-ginning with the 1997 Adopted Budget, the General Fund was restructured to encompass a number of subfunds, including the General Fund Subfund (comparable to the “General Fund” in prior years) and other subfunds designated for a variety of specific purposes. These subfunds are listed and explained in more detail in department chapters, as well as in the Funds, Subfunds, and Other section of the budget document.
Glossary

City of Seattle—2012 Proposed Budget - 870 -
Grant-Funded Position: A position funded 50% or more by a categorical grant to carry out a specific project or goal. Seattle Municipal Code 4.04.030 specifies that “categorical grant” does not include Community Development Block Grant funds, nor any funds provided under a statutory entitlement or distribution on the basis of a fixed formula including, but not limited to, relative population.
Neighborhood Matching Subfund (NMF): A fund supporting partnerships between the City and neighborhood groups to produce neighborhood‑initiated planning, organizing, and improvement pro-jects. The City provides a cash match to the community’s contribution of volunteer labor, materials, professional services, or cash. The NMF is administered by the Department of Neighborhoods.
Operating Budget: That portion of a budget dealing with recurring expenditures such as salaries, elec-tric bills, postage, printing, paper supplies, and gasoline.
Position/Pocket Number: A term referring to the title and unique position identification number as-signed to each position authorized by the City Council through the budget or other ordinances. Posi-tions may have a common title name, but each position has its own unique identification number as-signed by the Records Information Management Unit of the Personnel Department at the time position authority is approved by the City Council. Only one person at a time can fill a regularly budgeted posi-tion. An exception is in the case of job-sharing, where two people work part-time in one full-time posi-tion.
Program: A group of services within a department, aligned by common purpose.
Reclassification Request: A request to change the job title or classification for an existing position. Reclassifications are subject to review and approval by the Classification/Compensation Unit of the Personnel Department and are implemented upon the signature of the Personnel Director, as long as position authority has been established by ordinance.
Reorganization: Reorganization refers to changes in the budget and reporting structure within depart-ments.
SUMMIT: The City’s central accounting system managed by the Department of Executive Administra-tion.
Sunsetting Position: A position funded for only a specified length of time by the budget or enabling ordinance.
Glossary
City of Seattle—2012 Proposed Budget - 871 -
Type of Position: There are two types of budgeted positions. They are identified by one of the following characters: F for Full-Time or P for Part-Time.
Regular Full-Time is defined as a position budgeted for 2,088 compensated hours per year, 40 hours per week, 80 hours per pay period, and is also known as one full-time equivalent (FTE).
Regular Part-Time is defined as a position designated as part time, and requiring an average of 20 hours or more, but less than 40 hours of work per week during the year. This equates to an FTE value of at least 0.50 and no more than 0.99.
Glossary

City of Seattle—2012 Proposed Budget - 872 -

City of Seattle—2012 Proposed Budget - 873 -
Statistics:
This table provides high-level statistical information about the City of Seattle, including demographic data and historical budget data by department.

City of Seattle—2012 Proposed Budget - 874 -
Statistics MISCELLANEOUS STATISTICS
December 31, 2010 - Unless Otherwise Indicated
CITY GOVERNMENT Date of incorporation December 2, 1869
Present charter adopted March 12, 1946
Form: Mayor-Council (Nonpartisan)
GEOGRAPHICAL DATA Location:
Between Puget Sound and Lake Washington
125 nautical miles from Pacific Ocean
110 miles south of Canadian border
Altitude:
Sea level 521 feet
Average elevation 10 feet
Land area 83.1 square miles
Climate
Temperature
30-year average, mean annual 52.4
January 2010 average high 51.5
January 2010 average low 42.5
July 2010 average high 74.9
July 2010 average low 54.2
Rainfall
30-year average, in inches 36.35
2010-in inches 46.99
POPULATION
Year
City of
Seattle
Seattle
Metropolitan Area ab
1910 237,194 N/A
1920 315,685 N/A
1930 365,583 N/A
1940 368,302 N/A
1950 467,591 844,572
1960 557,087 1,107,203
1970 530,831 1,424,611
1980 493,846 1,607,618
1990 516,259 1,972,947
2000 563,374 2,279,100
2001 568,100 2,376,900
2002 570,800 2,402,300
2003 571,900 2,416,800
2004 572,600 2,433,100
2005 573,000 2,464,100
2006 578,700 2,507,100
2007 586,200 2,547,600
2008 592,800 2,580,800
2009 602,000 2,613,600
2010 612,000 2,644,500 King County 1,933,400
Percentage in Seattle 32 a Source: Washington State Office of Financial Management.
b Based on population in King and Snohomish Counties.
ELECTIONS (November 2) Active registered voters 369,451
Percentage voted last general election 72.79
Total voted 268,923
PENSION BENEFICIARIES Employees’ Retirement 5,428
Firemen’s Pension 828
Police Pension 838
VITAL STATISTICS
Rates per thousand of residents
Births (2009) 13.4
Deaths (2009) 7.0
PUBLIC EDUCATION (2010-11 School Year)
Enrollment (October 1) 46,813
Teachers and other certified employees (October 1) 3,211
School programs
Regular elementary programs 55
Regular middle school programs 9
Regular high school programs 10
K-8 school programs 10
Alternative/Non-traditional school programs 8
Total number of school programs 92 PROPERTY TAXES Assessed valuation (January 2010 ) $123,684,314,249
Tax levy (City) $359,800,747
EXAMPLE – PROPERTY TAX ASSESSMENTS
Real value of property $448,500
Assessed value $448,500
Property Tax Levied By
Dollars per
Thousand
Tax Due
City of Seattle $2.92492 $1,311.83
Emergency Medical Services 0.30000 134.55 State of Washington 2.22253 996.80
School District No. 1 1.98477 890.17
King County 1.28499 576.32
Port of Seattle 0.21597 96.86
King County Ferry District 0.00348 1.56
King County Flood Control Zone 0.10514 47.16 Totals $9.04180 $4,055.25 PORT OF SEATTLE Bonded Indebtedness
General obligation bonds $ 335,500,000
Utility revenue bonds 2,943,940,000
Passenger facility charges bonds 177,485,000
Commercial Paper 94,305,000
Waterfront (mileage)
Salt water 13.4
Fresh water 0.7
Value of Land Facilities
Waterfront $2,060,540,276
Sea-Tac International Airport $4,906,235,676
Marine Container Facilities/Capacities
4 container terminals with 11 berths covering 507 acres
2.14 million TEU’s (20-ft. equivalent unit containers)
1 grain facility, 1 general cargo facility, 1 barge terminal
2 cruise terminals
Sea-Tac International Airport
Scheduled passenger airlines 26
Cargo airlines 5
Charter airlines 3
Loading bridges 74

City of Seattle—2012 Proposed Budget - 875 -
Statistics
OPERATING INDICATORS
BY DEPARTMENT/OFFICE
Last Ten Fiscal Years
2010 2009 2008 2007 2006 PUBLIC SAFETY Fire Property fire loss Total City $11,021,455 $22,217,971 $16,351,377 $17,664,500 $18,340,656 Per capita $18.11 $36.91 $27.52 $32.76 $31.69 Police Municipal Court filings and citations Non-traffic criminal filings 9,908 10,724 9,461 12,003 12,882 Traffic criminal filings 4,752 5,344 5,124 5,100 4,156 DUI filings 1,343 1,422 1,167 1,390 1,496 Non-traffic infraction filings 5,501 6,111 6,437 7,880 7,310 Traffic infraction filings 55,108 57,960 69,949 74,490 59,828 Parking infractions 600,543 568,616 477,024 430,240 385,852 ARTS, CULTURE, AND RECREATION Library Library cards in force 502,903 465,325 432,790 448,104 403,415 Parks and Recreation Park use permits issued Number 614 639 599 529 667 Amount $302,690 $204,527 $212,403 $75,459 $217,782 Facility use permits issued including pools Number 27,384 26,922 24,977 23,487 N/A Amount $5,014,973 $4,957,236 $2,571,854 $2,374,230 N/A Facility use permits issued excluding pools Number 26,661 26,190 23,577 22,113 2,314 Amount $4,480,703 $4,469,322 $2,127,367 $1,997,402 $790,551 Picnic permits issued Number 3,658 3,547 3,420 3,469 3,253 Amount $303,075 $249,110 $228,965 $229,715 $220,595 Ball field usage Scheduled hours 125,891 161,937 147,911 145,481 144,760 Amount $1,909,705 $1,457,708 $1,444,393 $1,600,578 $1,413,035 Weddings Number 272 268 235 254 238 Amount $89,350 $91,238 $80,955 $87,900 $82,079 NEIGHBORHOODS AND DEVELOPMENT Planning and Development Permits Number issued 6,287 5,917 7,890 8,865 8,576 Value of issued permits $1,582,129,040 $1,987,486,066 $2,580,055,297 $3,097,812,568 $2,021,878,195 UTILITIES AND TRANSPORTATION City Light Customers 398,858 394,731 387,715 383,127 379,230 Operating revenues $732,977,819 $723,128,042 $877,392,652 $832,524,784 $831,810,233 Water Population served 1,431,252 1,419,390 1,401,000 1,338,974 1,454,586 Billed water consumption, daily average, in gallons 110,424,484 122,038,356 117,406,451 120,690,060 124,955,842 Operating revenues $195,203,465 $191,369,588 $164,405,030 $160,161,307 $155,175,008 Drainage and Wastewater Operating revenues $249,733,795 $250,194,607 $224,109,335 $202,407,690 $186,832,412 Solid Waste Customers Residential garbage customers 165,541 167,047 166,914 166,052 165,551 Residential dumpsters customers 126,593 127,971 122,503 119,667 117,899 Commercial garbage customers 8,248 8,462 9,747 8,505 8,481 Operating revenues $150,905,931 $135,641,160 $124,353,043 $121,930,923 $112,474,339

City of Seattle—2012 Proposed Budget - 876 -
Statistics
OPERATING INDICATORS
BY DEPARTMENT/OFFICE
Last Ten Fiscal Years
2005 2004 2003 2002 2001 PUBLIC SAFETY Fire Property fire loss Total City $16,657,222 $45,790,140 $22,433,417 $27,874,071 $62,898,264 Per capita $29.13 $80.07 $39.23 $49.48 $110.72 Police Municipal Court filings and citations Non-traffic criminal filings 12,098 10,704 10,502 10,283 12,948 Traffic criminal filings 2,098 N/A N/A N/A N/A DUI filings 1,437 N/A N/A N/A N/A Non-traffic infraction filings 7,416 6,715 17,350 17,515 24,475 Traffic infraction filings 59,120 56,556 72,104 74,076 85,001 Parking infractions 438,303 505,790 441,048 428,960 442,331 ARTS, CULTURE, AND RECREATION Library Library cards in force 454,990 386,127 352,194 377,720 494,353 Parks and Recreation Park use permits issued Number 649 658 633 736 546 Amount $229,420 $371,419 $457,360 $327,115 $282,275 Facility use permits issued including pools Number N/A N/A N/A N/A N/A Amount N/A N/A N/A N/A N/A Facility use permits issued excluding pools Number N/A N/A N/A N/A N/A Amount $567,975 $377,523 $338,630 $300,508 $324,237 Picnic permits issued Number 3,273 3,028 2,921 3,205 3,764 Amount $218,045 $194,404 $175,663 $172,942 $129,018 Ball field usage Scheduled hours 142,360 147,482 138,976 137,127 125,371 Amount $1,474,107 $1,236,699 $982,042 $563,629 $476,174 Weddings Number 197 165 160 147 108 Amount $69,670 $36,770 $38,820 $34,065 $29,445 NEIGHBORHOODS AND DEVELOPMENT Planning and Development Permits Number issued 7,178 7,209 6,683 5,223 6,646 Value of issued permits $1,681,651,482 $1,597,232,563 $1,175,475,274 $970,072,275 $1,736,681,088 UTILITIES AND TRANSPORTATION City Light Customers 375,869 372,818 365,445 360,632 350,000 Operating revenues $748,552,561 $777,918,589 $741,761,472 $709,330,438 $632,453,970 Water Population served 1,350,346 1,348,200 1,330,327 1,340,012 1,327,742 Billed water consumption, daily average, in gallons 118,854,138 127,725,423 130,670,298 126,694,524 123,000,000 Operating revenues $146,118,856 $141,313,235 $129,561,327 $118,160,130 $105,345,318 Drainage and Wastewater Operating revenues $176,482,071 $162,117,805 $150,721,637 $144,485,761 $136,238,195 Solid Waste Customers Residential garbage customers 165,561 163,977 91,317 180,798 159,454 Residential dumpsters customers 115,838 155,581 111,822 110,807 108,886 Commercial garbage customers 8,697 8,618 8,710 8,856 9,092 Operating revenues $111,230,835 $112,167,705 $111,738,282 $112,089,944 $105,510,879

City of Seattle—2012 Proposed Budget - 877 -
CAPITAL ASSET STATISTICS
BY DEPARTMENT/OFFICE
Last Ten Fiscal Years
2010 2009 2008 2007 2006 PUBLIC SAFETY Fire Boats 3 3 3 2 2 Fire-fighting apparatus 162 162 162 163 163 Stations 33 33 33 33 33 Training towers 2 2 2 1 1 Alarm center 1 1 1 1 1 Utility shop 1 1 1 1 1 Police Precincts 5 5 5 5 5 Detached units 7 7 7 7 7 Vehicles Patrol cars 270 270 270 265 252 Motorcycles 37 37 37 45 50 Scooters 63 58 58 50 53 Trucks, vans, minibuses 86 84 84 81 81 Automobiles 194 194 194 197 194 Patrol boats 10 10 10 10 10 Bicycles 154 146 146 137 137 Horses 8 8 8 8 8 ARTS, CULTURE AND RECREATION Library Central and branch libraries 27 27 27 24 24 Mobile units 4 4 4 4 4 Books, audio and video materials, newspapers, and magazines - circulated 11,376,194 11,914,050 10,025,029 9,085,490 8,661,263 Collection, print and non-print 2,280,511 2,294,601 2,446,355 2,352,381 2,273,440 Parks and Recreation Major parks 14 13 13 13 13 Open space acres acquired since 1989 665 663 654 638 630 Total acreage 6,188 6,185 6,171 6,155 6,036 Children's play areas 135 133 131 130 130 Neighborhood playgrounds 40 38 38 38 38 Community playfields 38 38 33 33 33 Community recreation centers 26 26 26 26 26 Visual and performing arts centers 6 6 6 6 6 Theaters 2 2 2 2 2 Community indoor swimming pools 8 8 8 8 8 Outdoor heated pools (one saltwater) 2 2 2 2 2 Boulevards 18 18 18 18 18 Golf courses (includes one pitch and putt) 5 5 5 5 5 Squares, plazas, triangles 64 64 62 62 62 Viewpoints 11 9 8 8 8 Bathing beaches (life-guarded) 9 9 9 9 9 Bathing beaches 9 9 9 9 9
Aquarium specimens on exhibit a 0
10,588 10,216 10,655 10,655
a As of 2010 the Parks and Recreation Department no longer manages aquarium specimens.
Statistics

City of Seattle—2012 Proposed Budget - 878 -
CAPITAL ASSET STATISTICS
BY DEPARTMENT/OFFICE
Last Ten Fiscal Years
2005 2004 2003 2002 2001 PUBLIC SAFETY Fire Boats 2 2 2 2 2 Fire-fighting apparatus 163 163 163 170 177 Stations 33 33 33 33 33 Training tower 1 1 1 1 1 Alarm center 1 1 1 1 1 Utility shop 1 1 1 1 1 Police Precincts 5 5 5 5 4 Detached units 7 7 7 7 13 Vehicles Patrol cars 252 252 252 252 252 Motorcycles 48 48 41 41 38 Scooters 55 58 63 63 69 Trucks, vans, minibuses 79 69 67 67 62 Automobiles 189 187 181 181 173 Patrol boats 9 7 7 7 7 Bicycles 137 126 126 117 126 Horses 8 9 9 10 9 ARTS, CULTURE AND RECREATION Library Central and branch libraries 24 24 24 24 23 Mobile units 4 4 4 4 4 Books, audio and video materials, newspapers, and magazines - circulated 7,449,761 6,575,866 5,804,388 6,175,027 5,695,182 Collection, print and non-print 2,173,903 1,889,599 2,004,718 2,031,276 2,002,866 Parks and Recreation Major parks 13 13 13 13 13 Open space acres acquired since 1989 630 630 630 630 600 Total acreage 6,036 6,036 6,036 6,036 6,006 Children's play areas 130 130 130 130 130 Neighborhood playgrounds 38 38 38 38 38 Community playfields 33 33 33 33 33 Community recreation centers 25 25 24 24 24 Visual and performing arts centers 6 6 6 6 6 Theaters 2 2 2 2 2 Community indoor swimming pools 8 8 8 8 8 Outdoor heated pools (one saltwater) 2 2 2 2 2 Boulevards 18 18 18 18 18 Golf courses (includes one pitch and putt) 5 5 5 5 5 Squares, plazas, triangles 62 62 62 62 62 Viewpoints 8 8 8 8 8 Bathing beaches (life-guarded) 9 7 7 9 9 Bathing beaches 9 9 9 9 9
Aquarium specimens on exhibit a 14,600 14,577 14,577 20,825 20,825
a As of 2010 the Parks and Recreation Department no longer manages aquarium specimens.
Statistics

Statistics
CAPITAL ASSET STATISTICS
BY DEPARTMENT/OFFICE
Last Ten Fiscal Years
2010 2009 2008 2007 2006 UTILITIES AND TRANSPORTATION City Light Plant capacity (KW) 1,920,700 1,920,700 1,920,700 1,920,700 1,920,700 Maximum system load (KW) 1,841,255 1,858,735 1,900,878 1,767,805 1,822,342 Total system energy (1,000 KW) (firm load) 9,865,376 10,139,898 10,323,915 10,203,415 9,990,486 Meters 406,195 402,854 394,455 391,022 385,621 Water Reservoirs, standpipes, tanks 27 27 30 30 29 Fire hydrants 18,503 18,473 18,436 18,398 18,347 Water mains Supply, in miles 187 187 224 182 182 Distribution, in miles 1,714 1,714 1,673 1,674 1,704 Water storage, in thousand gallons 338,869 302,880 370,000 377,080 377,080 Meters 188,322 188,226 187,154 185,395 183,699 Drainage and Wastewater Combined sewers, life-to-date, in miles 471 472 473 444 444 Sanitary sewers, life-to-date, in miles 957 956 958 985 985 Storm drains, life-to-date, in miles 473 470 473 472 472 Pumping stations 66 67 65 68 68 Solid Waste Transfer stations 2 2 2 2 2 Transportation Arterial streets, in miles 1,537 1,531 1,531 1,531 1,534 Non-arterial streets (paved and unpaved), in miles 2,411 2,412 2,412 2,412 2,412 Sidewalks, in miles 2,262 2,262 2,258 2,256 1,956 Stairways 507 498 494 482 482 Length of stairways, in feet 35,061 35,181 35,215 34,775 34,643 Number of stairway treads 24,009 23,950 23,666 23,407 23,211 Street trees City-maintained 40,000 40,000 40,000 35,000 34,000 Maintained by property owners 125,000 125,000 125,000 105,000 100,000 Total platted streets, in miles 1,666 1,666 1,666 1,666 1,666 Traffic signals 1,053 1,040 1,030 1,001 991 Parking meters Downtown 231 941 941 700 747 Outlying 85 97 97 300 353 Parking pay stations
Downtown a
998 856 850 1,215 925
Outlying a 1,227 1,315 1,127 630 565 Bridges (movable) - City-owned and -operated 4 4 4 4 4 Bridges (fixed) City maintenance 90 88 88 88 84 Partial City maintenance 44 54 55 55 55 Retaining walls/seawalls 592 592 582 582 582
a City redefined areas starting in 2008.
City of Seattle—2012 Proposed Budget - 879 -

Statistics
CAPITAL ASSET STATISTICS
BY DEPARTMENT/OFFICE
Last Ten Fiscal Years
2005 2004 2003 2002 2001 UTILITIES AND TRANSPORTATION City Light Plant capacity (KW) 1,920,700 1,920,700 1,920,700 1,920,700 1,920,700 Maximum system load (KW) 1,714,080 1,798,926 1,645,998 1,689,666 1,661,842 Total system energy (1,000 KW) (firm load) 9,703,046 9,560,928 9,610,856 9,610,761 9,510,504 Meters 382,436 379,599 380,828 379,257 375,953 Water Reservoirs, standpipes, tanks 38 68 38 32 32 Fire hydrants 18,475 18,762 18,356 18,635 18,345 Water mains Supply, in miles 181 181 181 173 171 Distribution, in miles 1,644 1,657 1,662 1,662 1,693 Water storage, in thousand gallons 494,080 494,080 506,570 506,570 506,570 Meters 182,037 181,038 180,149 179,268 179,330 Drainage and Wastewater Combined sewers, life-to-date, in miles 464 451 587 584 583 Sanitary sewers, life-to-date, in miles 968 972 908 825 906 Storm drains, life-to-date, in miles 474 467 461 461 459 Pumping stations 68 68 68 68 68 Solid Waste Transfer stations 2 2 2 2 2 Transportation Arterial streets, in miles 1,534 1,534 1,534 1,508 1,524 Non-arterial streets (paved and unpaved), in miles 2,412 2,412 2,412 2,412 2,706 Sidewalks, in miles 1,956 1,954 1,953 1,952 1,952 Stairways 482 479 479 471 471 Length of stairways, in feet 34,643 33,683 33,683 32,787 32,787 Number of stairway treads 23,211 22,471 22,471 22,108 22,108 Street trees City-maintained 34,000 34,000 34,000 31,000 31,000 Maintained by property owners 100,000 100,000 100,000 90,000 90,000 Total platted streets, in miles 1,666 1,666 1,666 1,741 1,658 Traffic signals 1,000 1,000 1,000 1,000 1,000 Parking meters Downtown 2,819 4,298 7,136 6,836 6,720 Outlying 904 1,967 1,967 1,956 2,003 Parking pay stations
Downtown a 758 500 N/A N/A N/A
Outlying a 318 N/A N/A N/A N/A
Bridges (movable) - City-owned and -operated 4 4 4 4 4 Bridges (fixed) City maintenance 84 85 85 86 86 Partial City maintenance 61 58 58 58 58 Retaining walls/seawalls 582 561 561 586 586
a City redefined areas starting in 2008.
City of Seattle—2012 Proposed Budget - 880 -


