UNITED STATES SECURITIES AND EXCHANGE COMMISSION Washington, D.C. 20549 FORM 10-Q ☒ QUARTERLY REPORT PURSUANT TO SECTION 13 OR 15(d) OF THE SECURITIES EXCHANGE ACT OF 1934 For the quarterly period ended June 30, 2021 ☐ TRANSITION REPORT PURSUANT TO SECTION 13 OR 15(d) OF THE SECURITIES EXCHANGE ACT OF 1934 FOR THE TRANSITION PERIOD FROM _______ TO _______ Commission File Number 001-37389 APPLE HOSPITALITY REIT, INC. (Exact name of registrant as specified in its charter) Virginia 26-1379210 (State or other jurisdiction of incorporation or organization) (I.R.S. Employer Identification No.) 814 East Main Street Richmond , Virginia 23219 (Address of principal executive offices) (Zip Code) (804) 344-8121 (Registrant's telephone number, including area code) Securities registered pursuant to Section 12(b) of the Act: Title of each class Trading Symbol(s) Name of each exchange on which registered Common Shares, no par value APLE New York Stock Exchange Indicate by check mark whether the registrant (1) has filed all reports required to be filed by Section 13 or 15(d) of the Securities Exchange Act of 1934 during the preceding 12 months (or for such shorter period that the registrant was required to file such reports), and (2) has been subject to such filing requirements for the past 90 days. Yes ☒ No ☐ Indicate by check mark whether the registrant has submitted electronically every Interactive Data File required to be submitted pursuant to Rule 405 of Regulation S-T (§232.405 of this chapter) during the preceding 12 months (or for such shorter period that the registrant was required to submit such files). Yes ☒ No ☐ Indicate by check mark whether the registrant is a large accelerated filer, an accelerated filer, a non-accelerated filer, a smaller reporting company, or an emerging growth company. See the definitions of “large accelerated filer,” “accelerated filer,” “smaller reporting company,” and “emerging growth company” in Rule 12b-2 of the Exchange Act. Large accelerated filer ☒ Accelerated filer ☐ Non-accelerated filer ☐ Smaller reporting company ☐ Emerging growth company ☐ If an emerging growth company, indicate by check mark if the registrant has elected not to use the extended transition period for complying with any new or revised financial accounting standards provided pursuant to Section 13(a) of the Exchange Act.☐ Indicate by check mark whether the registrant is a shell company (as defined in Rule 12b-2 of the Exchange Act). Yes ☐ No ☒ Number of registrant’s common shares outstanding as of August 2, 2021: 228,340,959
Transcript
UNITED STATESSECURITIES AND EXCHANGE COMMISSION
Washington, D.C. 20549
FORM 10-Q
☒☒ QUARTERLY REPORT PURSUANT TO SECTION 13 OR 15(d) OF THE SECURITIES EXCHANGE ACT OF 1934
For the quarterly period ended June 30, 2021
☐☐ TRANSITION REPORT PURSUANT TO SECTION 13 OR 15(d) OF THE SECURITIES EXCHANGE ACT OF 1934 FOR THE TRANSITIONPERIOD FROM _______ TO _______
Commission File Number 001-37389
APPLE HOSPITALITY REIT, INC.(Exact name of registrant as specified in its charter)
Virginia 26-1379210
(State or other jurisdictionof incorporation or organization) (I.R.S. Employer
Identification No.)
814 East Main StreetRichmond, Virginia 23219
(Address of principal executive offices) (Zip Code)
(804) 344-8121(Registrant's telephone number, including area code)
Securities registered pursuant to Section 12(b) of the Act:
Title of each class Trading Symbol(s) Name of each exchange on which registeredCommon Shares, no par value APLE New York Stock Exchange
Indicate by check mark whether the registrant (1) has filed all reports required to be filed by Section 13 or 15(d) of the Securities Exchange Act of 1934 during
the preceding 12 months (or for such shorter period that the registrant was required to file such reports), and (2) has been subject to such filing requirements for the past90 days. Yes ☒ No ☐
Indicate by check mark whether the registrant has submitted electronically every Interactive Data File required to be submitted pursuant to Rule 405 of RegulationS-T (§232.405 of this chapter) during the preceding 12 months (or for such shorter period that the registrant was required to submit such files). Yes ☒ No ☐
Indicate by check mark whether the registrant is a large accelerated filer, an accelerated filer, a non-accelerated filer, a smaller reporting company, or an emerginggrowth company. See the definitions of “large accelerated filer,” “accelerated filer,” “smaller reporting company,” and “emerging growth company” in Rule 12b-2 of theExchange Act.
Large accelerated filer ☒ Accelerated filer ☐ Non-accelerated filer ☐ Smaller reporting company ☐ Emerging growth company ☐
If an emerging growth company, indicate by check mark if the registrant has elected not to use the extended transition period for complying with any new or
revised financial accounting standards provided pursuant to Section 13(a) of the Exchange Act.☐
Indicate by check mark whether the registrant is a shell company (as defined in Rule 12b-2 of the Exchange Act). Yes ☐ No ☒
Number of registrant’s common shares outstanding as of August 2, 2021: 228,340,959
Apple Hospitality REIT, Inc.Form 10-Q
Index
Page
NumberPART I. FINANCIAL INFORMATION Item 1. Financial Statements (Unaudited) 3 Consolidated Balance Sheets – June 30, 2021 and December 31, 2020 3 Consolidated Statements of Operations and Comprehensive Income (Loss) – three and six months ended June 30, 2021 and 2020 4 Consolidated Statements of Shareholders’ Equity – three and six months ended June 30, 2021 and 2020 5 Consolidated Statements of Cash Flows – six months ended June 30, 2021 and 2020 6 Notes to Consolidated Financial Statements 7 Item 2. Management's Discussion and Analysis of Financial Condition and Results of Operations 22 Item 3. Quantitative and Qualitative Disclosures About Market Risk 41 Item 4. Controls and Procedures 41 PART II. OTHER INFORMATION Item 1. Legal Proceedings 42 Item 6. Exhibits 42 Signatures 43
This Form 10-Q includes references to certain trademarks or service marks. The AC Hotels by Marriott®, Aloft Hotels®, Courtyard by Marriott®, Fairfield byMarriott®, Marriott® Hotels, Residence Inn by Marriott®, SpringHill Suites by Marriott® and TownePlace Suites by Marriott® trademarks are the property of MarriottInternational, Inc. or one of its affiliates. The Embassy Suites by Hilton®, Hampton by Hilton®, Hampton Inn by Hilton®, Hampton Inn & Suites by Hilton®, HiltonGarden Inn®, Home2 Suites by Hilton® and Homewood Suites by Hilton® trademarks are the property of Hilton Worldwide Holdings Inc. or one or more of itsaffiliates. The Hyatt®, Hyatt House® and Hyatt Place® trademarks are the property of Hyatt Hotels Corporation or one or more of its affiliates. For convenience, theapplicable trademark or service mark symbol has been omitted but will be deemed to be included wherever the above referenced terms are used.
Apple Hospitality REIT, Inc.Consolidated Balance Sheets
(in thousands, except share data) June 30, December 31, 2021 2020 (unaudited) Assets
Investment in real estate, net of accumulated depreciation and amortization of $1,228,937 and $1,235,698, respectively $ 4,459,866 $ 4,732,896 Assets held for sale 208,026 5,316 Cash and cash equivalents 2,899 5,556 Restricted cash-furniture, fixtures and other escrows 31,215 28,812 Due from third party managers, net 54,296 22,137 Other assets, net 36,084 35,042
Total Assets $ 4,792,386 $ 4,829,759 Liabilities
Debt, net $ 1,396,408 $ 1,482,571 Finance lease liabilities 222,081 219,981 Accounts payable and other liabilities 79,574 97,860
Total Liabilities 1,698,063 1,800,412 Shareholders' Equity
Preferred stock, authorized 30,000,000 shares; none issued and outstanding - - Common stock, no par value, authorized 800,000,000 shares; issued and outstanding 228,340,959 and 223,212,346 shares, respectively 4,569,332 4,488,419 Accumulated other comprehensive loss (28,076) (42,802)Distributions greater than net income (1,446,933) (1,416,270)
Total Shareholders' Equity 3,094,323 3,029,347
Total Liabilities and Shareholders' Equity $ 4,792,386 $ 4,829,759
See notes to consolidated financial statements.
3
Index
Apple Hospitality REIT, Inc.Consolidated Statements of Operations and Comprehensive Income (Loss)
(Unaudited)(in thousands, except per share data)
Three Months Ended Six Months Ended June 30, June 30,
Total hotel operating expense 135,410 61,817 239,150 217,083 Property taxes, insurance and other 17,321 18,702 37,009 38,297 General and administrative 8,435 6,025 16,554 15,548 Loss on impairment of depreciable real estate assets - 4,382 10,754 4,382 Depreciation and amortization 46,386 49,897 95,096 99,419
Total expense 207,552 140,823 398,563 374,729
Gain (loss) on sale of real estate (864) (54) 3,620 8,785 Operating income (loss) 38,988 (59,799) 11,174 (46,856)
Interest and other expense, net (18,618) (18,386) (37,131) (33,952) Income (loss) before income taxes 20,370 (78,185) (25,957) (80,808)
Income tax expense (87) (58) (195) (204) Net income (loss) $ 20,283 $ (78,243) $ (26,152) $ (81,012) Other comprehensive income (loss):
Interest rate derivatives (1,356) (4,195) 14,726 (46,361) Comprehensive income (loss) $ 18,927 $ (82,438) $ (11,426) $ (127,373) Basic and diluted net income (loss) per common share $ 0.09 $ (0.35) $ (0.12) $ (0.36) Weighted average common shares outstanding - basic and diluted 224,772 223,278 224,255 223,786
See notes to consolidated financial statements.
4
Index
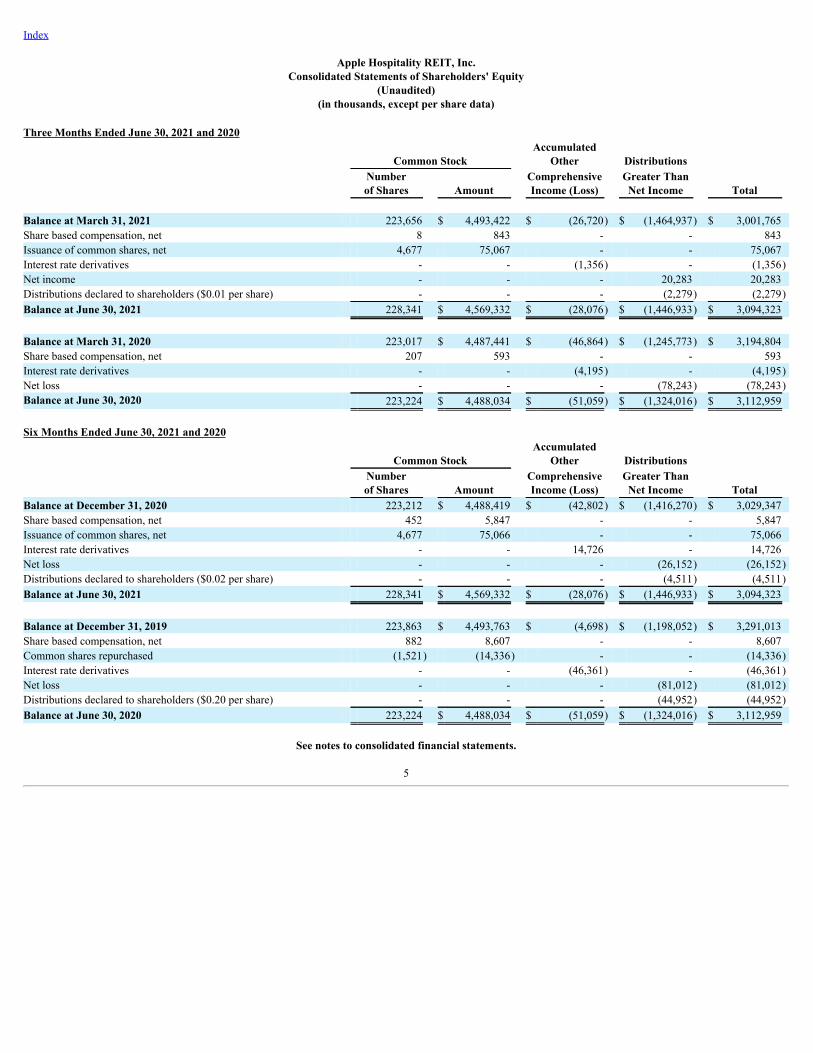
Apple Hospitality REIT, Inc.Consolidated Statements of Shareholders' Equity
(Unaudited)(in thousands, except per share data)
Three Months Ended June 30, 2021 and 2020
Common Stock Accumulated
Other Distributions
Numberof Shares Amount
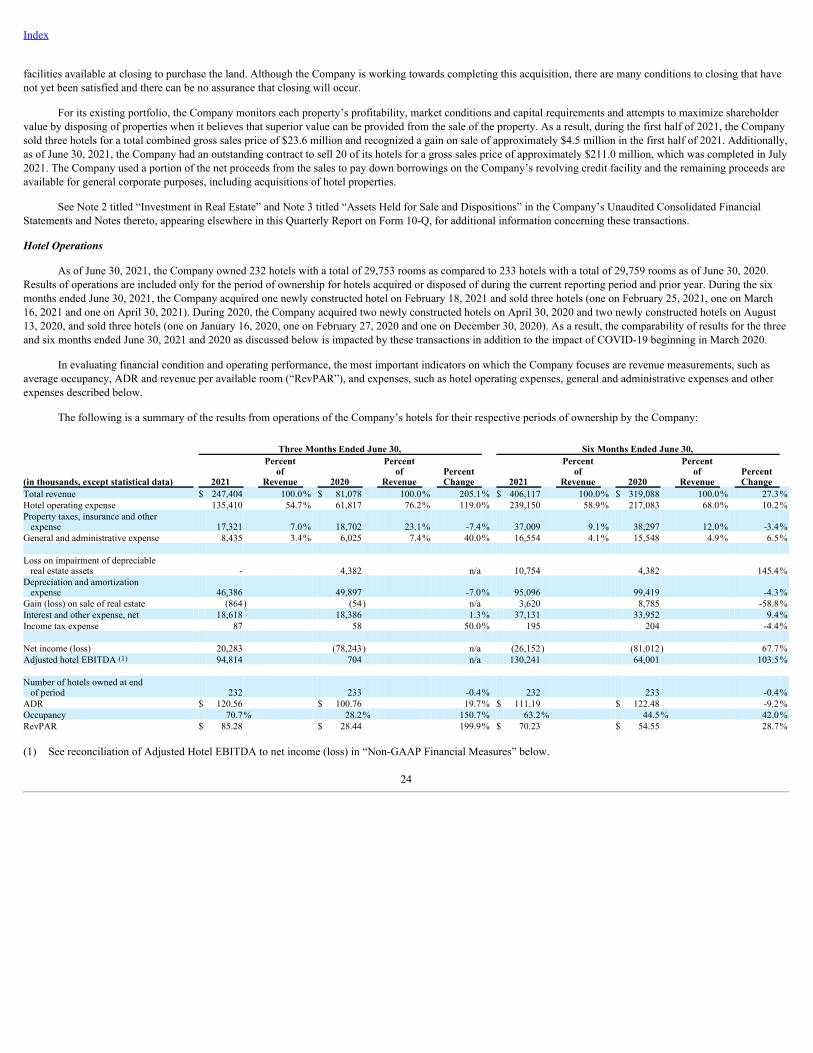
ComprehensiveIncome (Loss)
Greater ThanNet Income Total
Balance at March 31, 2021 223,656 $ 4,493,422 $ (26,720) $ (1,464,937) $ 3,001,765 Share based compensation, net 8 843 - - 843 Issuance of common shares, net 4,677 75,067 - - 75,067 Interest rate derivatives - - (1,356) - (1,356)Net income - - - 20,283 20,283 Distributions declared to shareholders ($0.01 per share) - - - (2,279) (2,279)Balance at June 30, 2021 228,341 $ 4,569,332 $ (28,076) $ (1,446,933) $ 3,094,323 Balance at March 31, 2020 223,017 $ 4,487,441 $ (46,864) $ (1,245,773) $ 3,194,804 Share based compensation, net 207 593 - - 593 Interest rate derivatives - - (4,195) - (4,195)Net loss - - - (78,243) (78,243)Balance at June 30, 2020 223,224 $ 4,488,034 $ (51,059) $ (1,324,016) $ 3,112,959
Six Months Ended June 30, 2021 and 2020
Common Stock Accumulated
Other Distributions
Numberof Shares Amount
ComprehensiveIncome (Loss)
Greater ThanNet Income Total
Balance at December 31, 2020 223,212 $ 4,488,419 $ (42,802) $ (1,416,270) $ 3,029,347 Share based compensation, net 452 5,847 - - 5,847 Issuance of common shares, net 4,677 75,066 - - 75,066 Interest rate derivatives - - 14,726 - 14,726 Net loss - - - (26,152) (26,152)Distributions declared to shareholders ($0.02 per share) - - - (4,511) (4,511)Balance at June 30, 2021 228,341 $ 4,569,332 $ (28,076) $ (1,446,933) $ 3,094,323 Balance at December 31, 2019 223,863 $ 4,493,763 $ (4,698) $ (1,198,052) $ 3,291,013 Share based compensation, net 882 8,607 - - 8,607 Common shares repurchased (1,521) (14,336) - - (14,336)Interest rate derivatives - - (46,361) - (46,361)Net loss - - - (81,012) (81,012)Distributions declared to shareholders ($0.20 per share) - - - (44,952) (44,952)Balance at June 30, 2020 223,224 $ 4,488,034 $ (51,059) $ (1,324,016) $ 3,112,959
See notes to consolidated financial statements.
5
Index
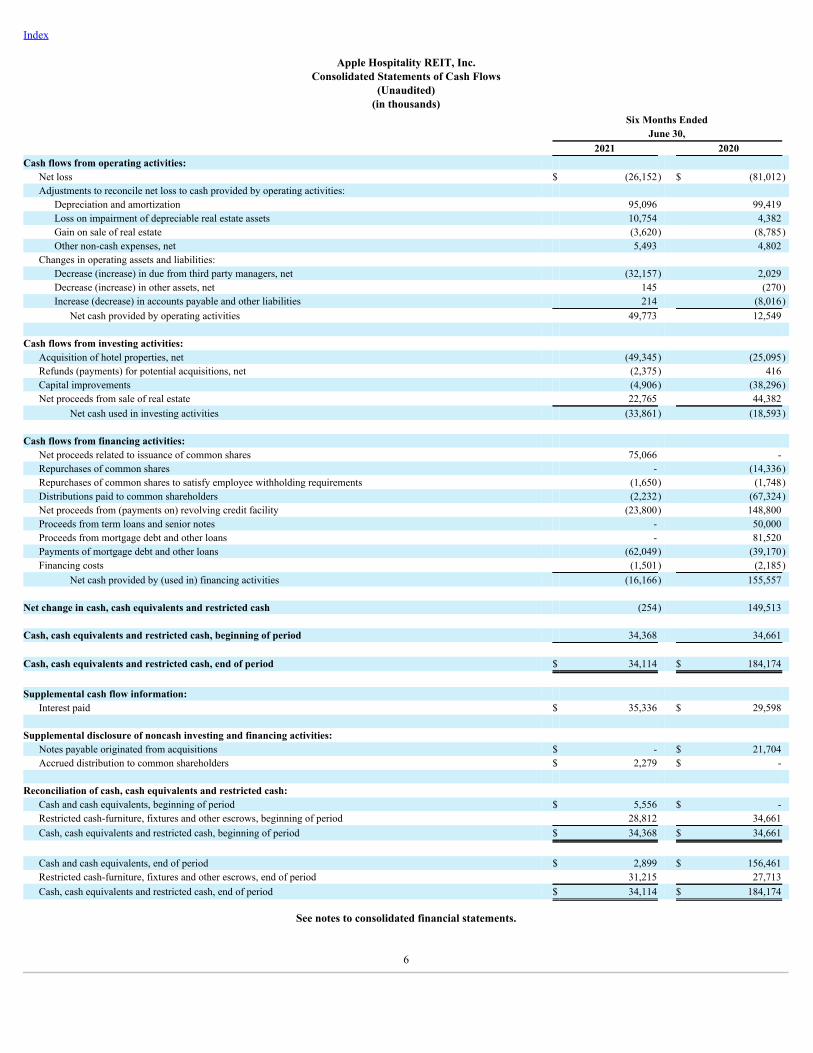
Apple Hospitality REIT, Inc.Consolidated Statements of Cash Flows
(Unaudited)(in thousands)
Six Months Ended June 30,
2021 2020 Cash flows from operating activities:
Net loss $ (26,152) $ (81,012)Adjustments to reconcile net loss to cash provided by operating activities:
Depreciation and amortization 95,096 99,419 Loss on impairment of depreciable real estate assets 10,754 4,382 Gain on sale of real estate (3,620) (8,785)Other non-cash expenses, net 5,493 4,802
Changes in operating assets and liabilities: Decrease (increase) in due from third party managers, net (32,157) 2,029 Decrease (increase) in other assets, net 145 (270)Increase (decrease) in accounts payable and other liabilities 214 (8,016)
Net cash provided by operating activities 49,773 12,549 Cash flows from investing activities:
Acquisition of hotel properties, net (49,345) (25,095)Refunds (payments) for potential acquisitions, net (2,375) 416 Capital improvements (4,906) (38,296)Net proceeds from sale of real estate 22,765 44,382
Net cash used in investing activities (33,861) (18,593) Cash flows from financing activities:
Net proceeds related to issuance of common shares 75,066 - Repurchases of common shares - (14,336)Repurchases of common shares to satisfy employee withholding requirements (1,650) (1,748)Distributions paid to common shareholders (2,232) (67,324)Net proceeds from (payments on) revolving credit facility (23,800) 148,800 Proceeds from term loans and senior notes - 50,000 Proceeds from mortgage debt and other loans - 81,520 Payments of mortgage debt and other loans (62,049) (39,170)Financing costs (1,501) (2,185)
Net cash provided by (used in) financing activities (16,166) 155,557 Net change in cash, cash equivalents and restricted cash (254) 149,513 Cash, cash equivalents and restricted cash, beginning of period 34,368 34,661 Cash, cash equivalents and restricted cash, end of period $ 34,114 $ 184,174 Supplemental cash flow information:
Interest paid $ 35,336 $ 29,598
Supplemental disclosure of noncash investing and financing activities: Notes payable originated from acquisitions $ - $ 21,704 Accrued distribution to common shareholders $ 2,279 $ -
Reconciliation of cash, cash equivalents and restricted cash:
Cash and cash equivalents, beginning of period $ 5,556 $ - Restricted cash-furniture, fixtures and other escrows, beginning of period 28,812 34,661 Cash, cash equivalents and restricted cash, beginning of period $ 34,368 $ 34,661
Cash and cash equivalents, end of period $ 2,899 $ 156,461 Restricted cash-furniture, fixtures and other escrows, end of period 31,215 27,713 Cash, cash equivalents and restricted cash, end of period $ 34,114 $ 184,174
See notes to consolidated financial statements.
6
Index
Apple Hospitality REIT, Inc.Notes to Consolidated Financial Statements
(Unaudited)
1. Organization and Summary of Significant Accounting Policies
Organization
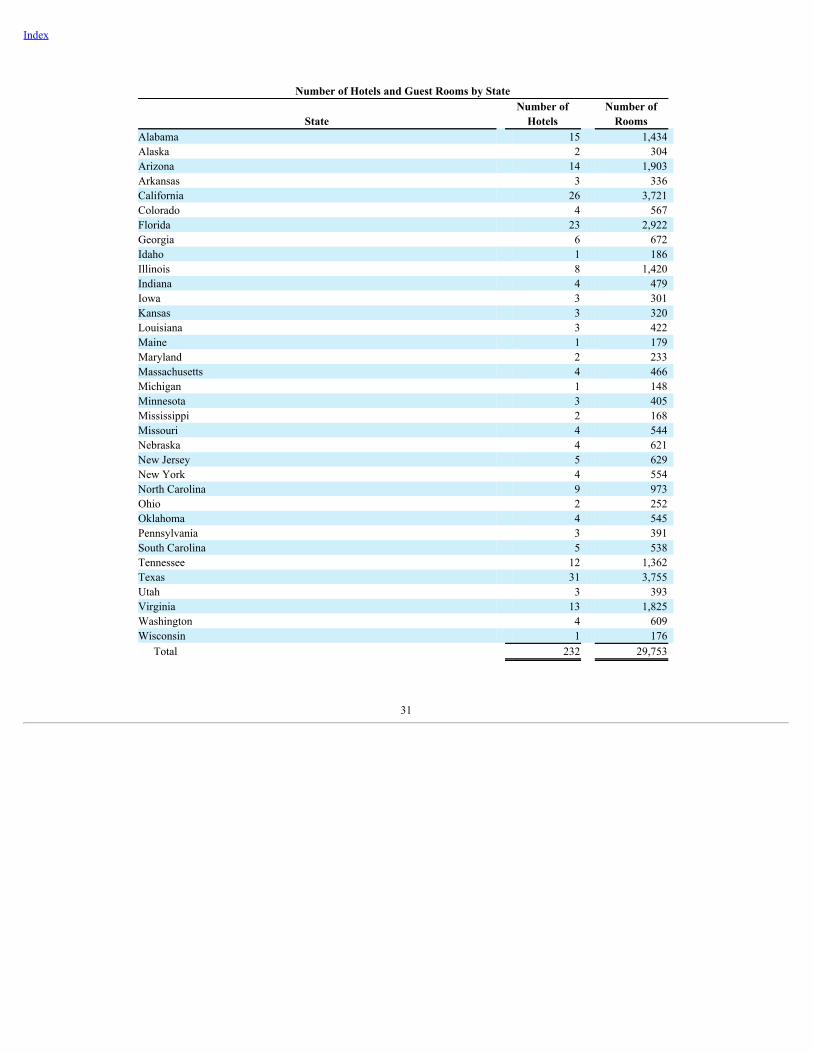
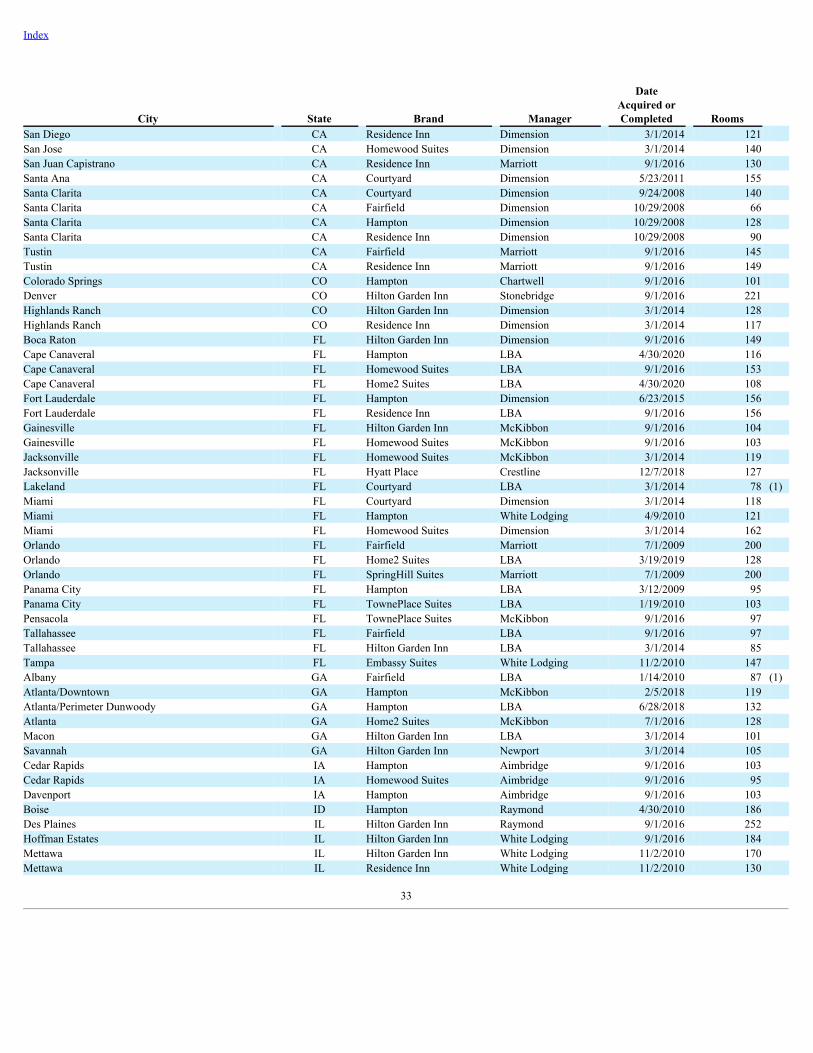
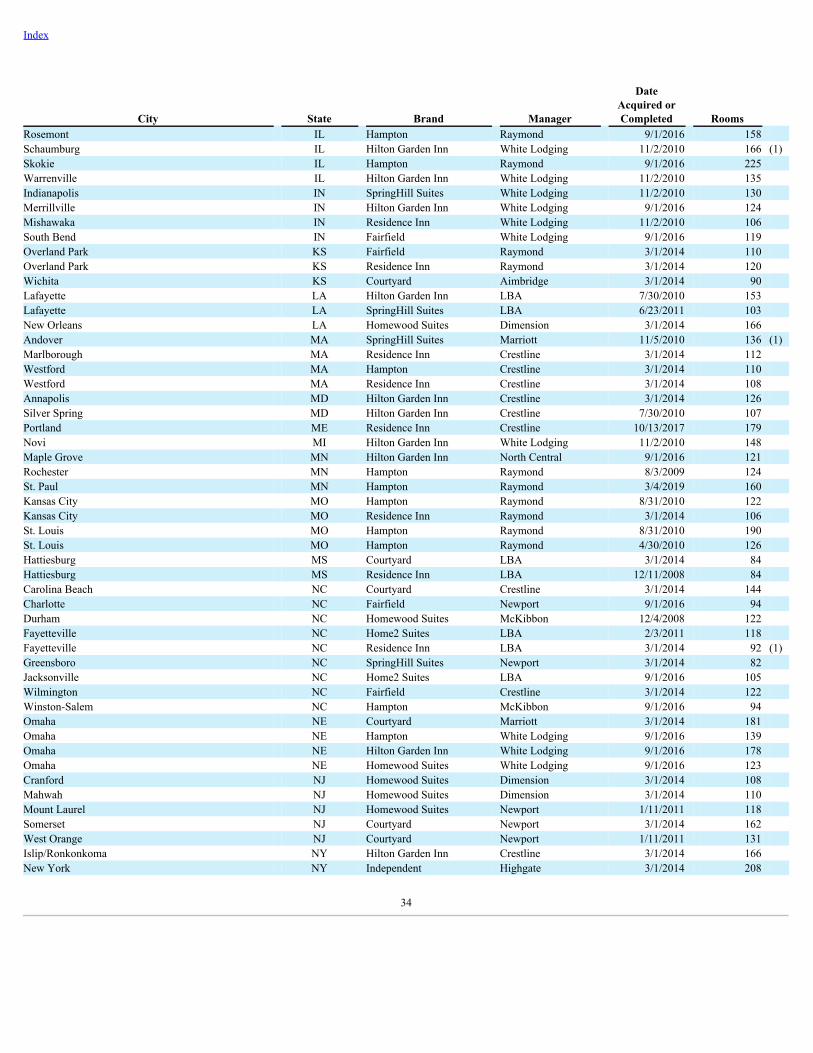
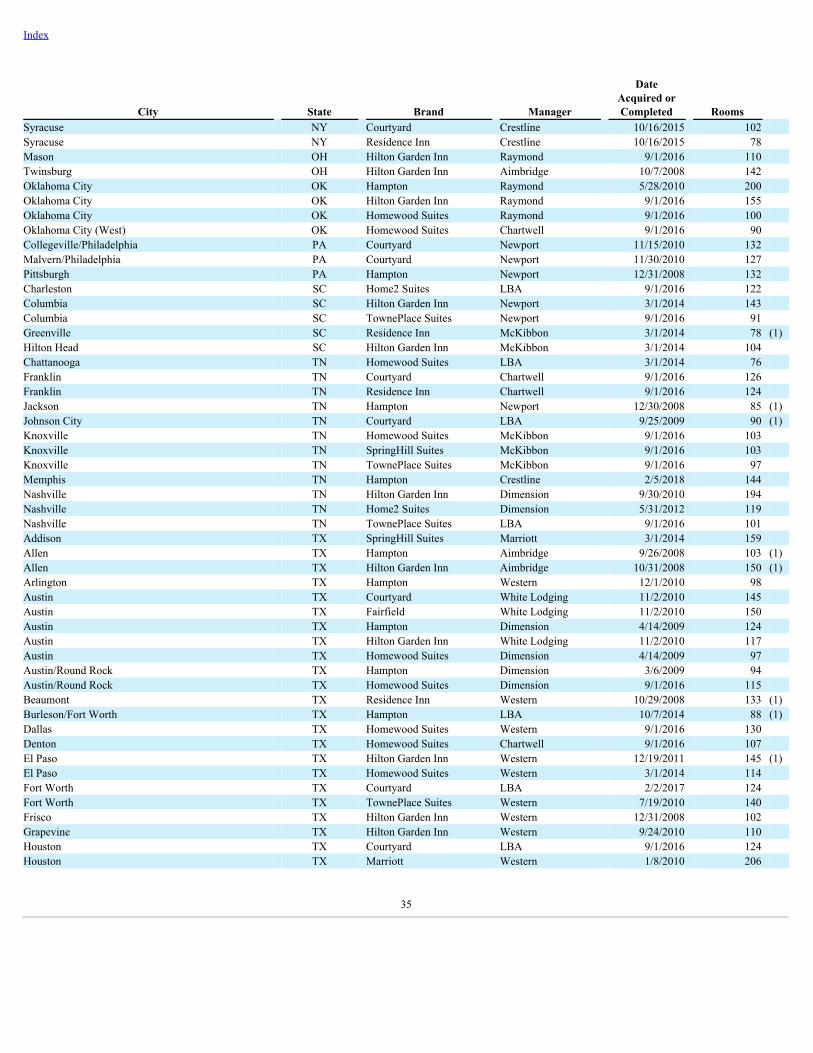
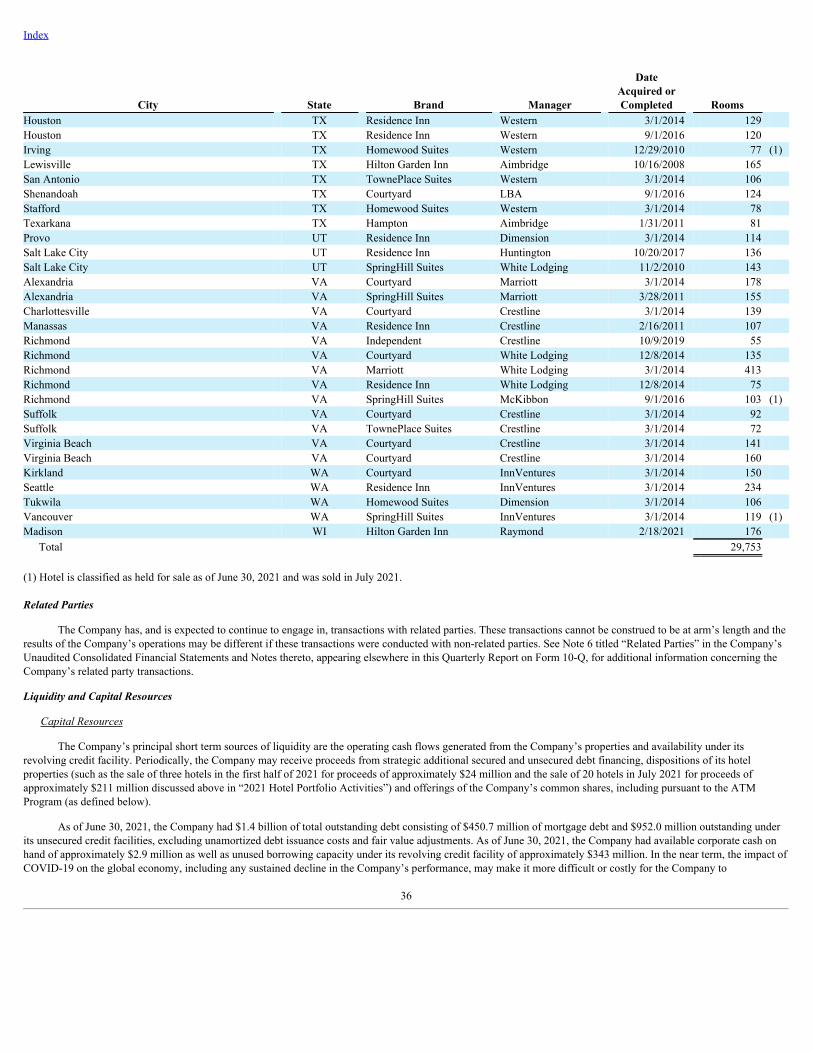
Apple Hospitality REIT, Inc., together with its wholly-owned subsidiaries (the “Company”), is a Virginia corporation that has elected to be treated as a real estateinvestment trust (“REIT”) for federal income tax purposes. The Company is a self-advised REIT that invests in income-producing real estate, primarily in the lodgingsector, in the United States (“U.S.”). The Company’s fiscal year end is December 31. The Company has no foreign operations or assets and its operating structureincludes only one reportable segment. The consolidated financial statements include the accounts of the Company and its subsidiaries. All intercompany accounts andtransactions have been eliminated. Although the Company has interests in potential variable interest entities through its purchase commitments, it is not the primarybeneficiary as the Company does not have any elements of power in the decision-making process of these entities, and therefore does not consolidate the entities. As ofJune 30, 2021, the Company owned 232 hotels with an aggregate of 29,753 rooms located in 35 states, including 20 hotels with 2,133 rooms classified as held for sale,which were sold to an unrelated party in July 2021. The Company’s common shares are listed on the New York Stock Exchange (“NYSE”) under the ticker symbol“APLE.”
Basis of Presentation
The accompanying unaudited consolidated financial statements have been prepared in accordance with the rules and regulations for reporting on Form 10-Q.Accordingly, they do not include all of the information required by U.S. generally accepted accounting principles (“GAAP”) for complete financial statements. In theopinion of management, all adjustments (consisting of normal recurring accruals) considered necessary for a fair presentation have been included. These unauditedfinancial statements should be read in conjunction with the Company’s audited consolidated financial statements included in its Annual Report on Form 10-K for the yearended December 31, 2020 (the “2020 Form 10-K”). Operating results for the three and six months ended June 30, 2021 are not necessarily indicative of the results thatmay be expected for the twelve month period ending December 31, 2021.
Use of Estimates
The preparation of the financial statements in conformity with GAAP requires management to make estimates and assumptions that affect the amounts reported inthe consolidated financial statements and accompanying notes. Actual results could differ from those estimates.
Novel Coronavirus COVID-19 Pandemic
As a result of the current novel coronavirus COVID-19 pandemic (“COVID-19”) and the impact it has had on travel and the broader economy throughout the U.S.since March 2020, the Company’s hotels have experienced significant declines in occupancy, which have had and are expected to continue to have a significant negativeeffect on the Company’s revenue and operating results. While occupancy has recovered significantly during the first six months of 2021, there remains significantuncertainty as to when or if operations at the hotels will return to pre-pandemic levels.
Net Income (Loss) Per Common Share
Basic net income (loss) per common share is computed based upon the weighted average number of shares outstanding during the period. Diluted net income(loss) per common share is calculated after giving effect to all potential common shares that were dilutive and outstanding for the period. Basic and diluted net income(loss) per common share were the same for each of the periods presented.
Accounting Standards Recently Adopted
Reference Rate Reform
In March 2020, the Financial Accounting Standards Board (“FASB”) issued Accounting Standards Update (“ASU”) No. 2020-04, Reference Rate Reform (Topic848), which provides optional guidance through December 31, 2022 to ease the potential burden in accounting for, or recognizing the effects of, reference rate reform onfinancial reporting. In January 2021, the FASB issued 2021-01, Reference Rate Reform (Topic 848), Scope, which further clarified the scope of the reference rate reformoptional practical expedients and exceptions outlined in Topic 848. The amendments in ASU Nos. 2020-04 and 2021-01 apply to contract modifications that replace areference rate affected by reference rate reform, providing optional expedients regarding the measurement of hedge effectiveness in hedging relationships that have beenmodified to replace a reference rate. The guidance in ASU Nos. 2020-04 and 2021-01 became effective upon issuance and the provisions of the ASUs have not had amaterial impact on the Company’s consolidated financial statements and related disclosures as of June 30, 2021. The provisions of these updates will generally affect theCompany by allowing, among other things, the following:
7
Index
• Allowing modifications of the Company’s unsecured credit facilities (as defined below) to replace the London Interbank Offered Rate (LIBOR) with asubstitute index to be accounted for as a non-substantial modification and not be considered a debt extinguishment.
• Allowing changes to the floating interest rate index used in the Company’s interest rate swaps to not be considered a change to the critical terms of thehedge and therefore not requiring a dedesignation of the hedging relationship.
The Company has not entered into any contract modifications yet as it directly relates to reference rate reform but anticipates having to undertake such modifications inthe future as a majority of the Company’s unsecured credit facilities and interest rate swaps are indexed to LIBOR.
Accounting Standards Recently Issued
Accounting for Certain Equity Options
In May 2021, the Financial Accounting Standards Board (“FASB”) issued Accounting Standards Update (“ASU”) No. 2021-04, Issuer’s Accounting for CertainModifications or Exchanges of Freestanding Equity-Classified Written Call Options (Topics 260, 470, 718 and 815), which provides updated guidance to clarify andreduce diversity in an issuer’s accounting for modifications or exchanges of freestanding equity-classified written call options that remain equity classified aftermodification or exchange. The provisions of this update are effective for annual and interim periods beginning after December 15, 2021. The adoption of this update isnot expected to have a material impact on the Company’s consolidated financial statements.
2. Investment in Real Estate
The Company’s investment in real estate consisted of the following (in thousands):
June 30, December 31, 2021 2020
Land $ 692,586 $ 725,512 Building and improvements 4,313,527 4,525,850 Furniture, fixtures and equipment 466,206 499,865 Finance ground lease assets 203,617 203,617 Franchise fees 12,867 13,750 5,688,803 5,968,594 Less accumulated depreciation and amortization (1,228,937) (1,235,698)Investment in real estate, net $ 4,459,866 $ 4,732,896
As of June 30, 2021, the Company owned 232 hotels with an aggregate of 29,753 rooms located in 35 states, including 20 hotels with 2,133 rooms classified as
held for sale, which were sold to an unrelated party in July 2021.
The Company leases all of its hotels to its wholly-owned taxable REIT subsidiary (or a subsidiary thereof) under master hotel lease agreements.
Hotel Acquisitions
The Company acquired one hotel during the six months ended June 30, 2021. The hotel was a newly developed 176-room Hilton Garden Inn in Madison,Wisconsin managed by Raymond and purchased for $49.6 million on February 18, 2021.
During the year ended December 31, 2020, the Company acquired four hotels, including two hotels during the six months ended June 30, 2020. The followingtable sets forth the location, brand, manager, date acquired, number of rooms and gross purchase price, excluding transaction costs, for each hotel. All dollar amounts arein thousands.
City State Brand Manager Date
Acquired Rooms
GrossPurchase
Price Cape Canaveral FL Hampton LBA 4/30/2020 116 $ 24,102 Cape Canaveral FL Home2 Suites LBA 4/30/2020 108 22,602 Tempe AZ Hyatt House Crestline 8/13/2020 105 26,309 Tempe AZ Hyatt Place Crestline 8/13/2020 154 38,279 483 $ 111,292
8
Index
The Company utilized $25.0 million of its available cash and entered into a one-year note payable with the developer secured by the hotels for $21.7 million tofund the purchase price of the Cape Canaveral, Florida hotels. The note payable bore interest, which was payable monthly, at a floating annual rate equal to the LondonInter-Bank Offered Rate for a one-month term (“one-month LIBOR”) plus a margin of 2.0% for the first six months of the loan term and 3.0% for the second six monthsof the loan term. In July 2020, the principal amount of the note was reduced by approximately $1.1 million representing a credit from the developer for sharedconstruction savings, and the note was repaid in full on April 12, 2021. The Company used borrowings under its revolving credit facility to purchase the Tempe, Arizonaand Madison, Wisconsin hotels. The acquisitions of these hotel properties were accounted for as acquisitions of asset groups, whereby costs incurred to effect theacquisitions (which were not significant) were capitalized as part of the cost of the assets acquired. For the one hotel acquired during the six months ended June 30, 2021,the amount of revenue and operating loss included in the Company’s consolidated statement of operations from the date of acquisition through June 30, 2021 wasapproximately $0.7 million and $(1.0) million, respectively. For the two hotels acquired during the six months ended June 30, 2020, the amount of revenue and operatingloss included in the Company’s consolidated statement of operations from the date of acquisition through June 30, 2020 was approximately $0.4 million and $(0.3)million, respectively.
Purchase Contract Commitments
As of June 30, 2021, the Company had an outstanding contract to purchase the fee interest in the land at the Seattle, Washington Residence Inn, currently heldunder a finance ground lease, for a purchase price of $80.0 million, consisting of a $24.0 million cash payment (utilizing available cash or borrowings under theCompany’s unsecured credit facilities) and a one-year note payable to the seller for $56.0 million. The land purchase is expected to close in August 2021 and will beaccounted for as a retirement of the finance lease, with any difference between the carrying amount of the right-of-use asset ($94.9 million as of June 30, 2021) and thefinance lease liability ($110.5 million as of June 30, 2021) applied as an adjustment to the carrying amount of the acquired land. Although the Company is workingtowards completing this acquisition, there are many conditions to closing that have not yet been satisfied and there can be no assurance that closing will occur.
3. Assets Held for Sale and Dispositions
Assets Held for Sale
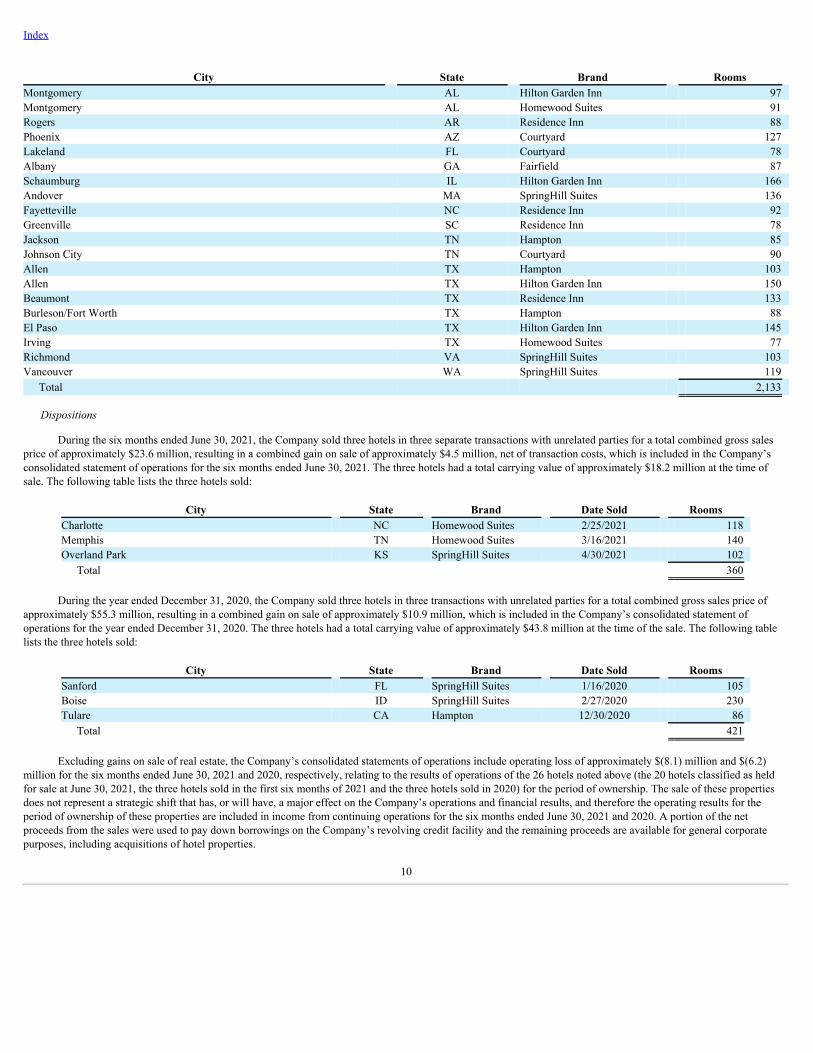
In April 2021, the Company entered into a purchase contract with an unrelated party for the sale of 20 of its hotels for a total gross sales price of approximately$211.0 million. Since the buyer under the contract had completed its due diligence and had made a non-refundable deposit, as of June 30, 2021, the Company classifiedthe hotels as assets held for sale in its consolidated balance sheet at their carrying value. As discussed below, during the first quarter of 2021, the Company recognized animpairment loss to adjust the carrying values of four of these hotels to their fair values. In July 2021, the Company completed the sale of the 20 hotels which resulted in aloss of approximately $0.9 million, consisting primarily of selling costs that were recognized in the second quarter of 2021. A portion of the net proceeds from the salewere used to pay down borrowings on the Company’s revolving credit facility and the remaining proceeds are available for general corporate purposes, includingacquisitions of hotel properties. The following table lists the 20 hotels under the purchase contract:
9
Index
City State Brand Rooms Montgomery AL Hilton Garden Inn 97 Montgomery AL Homewood Suites 91 Rogers AR Residence Inn 88 Phoenix AZ Courtyard 127 Lakeland FL Courtyard 78 Albany GA Fairfield 87 Schaumburg IL Hilton Garden Inn 166 Andover MA SpringHill Suites 136 Fayetteville NC Residence Inn 92 Greenville SC Residence Inn 78 Jackson TN Hampton 85 Johnson City TN Courtyard 90 Allen TX Hampton 103 Allen TX Hilton Garden Inn 150 Beaumont TX Residence Inn 133 Burleson/Fort Worth TX Hampton 88 El Paso TX Hilton Garden Inn 145 Irving TX Homewood Suites 77 Richmond VA SpringHill Suites 103 Vancouver WA SpringHill Suites 119
Total 2,133
Dispositions
During the six months ended June 30, 2021, the Company sold three hotels in three separate transactions with unrelated parties for a total combined gross salesprice of approximately $23.6 million, resulting in a combined gain on sale of approximately $4.5 million, net of transaction costs, which is included in the Company’sconsolidated statement of operations for the six months ended June 30, 2021. The three hotels had a total carrying value of approximately $18.2 million at the time ofsale. The following table lists the three hotels sold:
City State Brand Date Sold Rooms Charlotte NC Homewood Suites 2/25/2021 118 Memphis TN Homewood Suites 3/16/2021 140 Overland Park KS SpringHill Suites 4/30/2021 102
Total 360
During the year ended December 31, 2020, the Company sold three hotels in three transactions with unrelated parties for a total combined gross sales price ofapproximately $55.3 million, resulting in a combined gain on sale of approximately $10.9 million, which is included in the Company’s consolidated statement ofoperations for the year ended December 31, 2020. The three hotels had a total carrying value of approximately $43.8 million at the time of the sale. The following tablelists the three hotels sold:
City State Brand Date Sold Rooms Sanford FL SpringHill Suites 1/16/2020 105 Boise ID SpringHill Suites 2/27/2020 230 Tulare CA Hampton 12/30/2020 86
Total 421
Excluding gains on sale of real estate, the Company’s consolidated statements of operations include operating loss of approximately $(8.1) million and $(6.2)million for the six months ended June 30, 2021 and 2020, respectively, relating to the results of operations of the 26 hotels noted above (the 20 hotels classified as heldfor sale at June 30, 2021, the three hotels sold in the first six months of 2021 and the three hotels sold in 2020) for the period of ownership. The sale of these propertiesdoes not represent a strategic shift that has, or will have, a major effect on the Company’s operations and financial results, and therefore the operating results for theperiod of ownership of these properties are included in income from continuing operations for the six months ended June 30, 2021 and 2020. A portion of the netproceeds from the sales were used to pay down borrowings on the Company’s revolving credit facility and the remaining proceeds are available for general corporatepurposes, including acquisitions of hotel properties.
10
Index
Hotel Sale Contracts and Loss on Impairment of Depreciable Real Estate Assets
During the first quarter of 2021, the Company identified 20 hotels for potential sale and, in April 2021, entered into a purchase contract with an unrelated partyfor the sale of the hotels for a gross sales price of $211.0 million. As a result, the Company recognized impairment losses totaling approximately $9.4 million in the firstquarter of 2021, to adjust the carrying values of four of these hotels to their estimated fair values. The fair values of these properties were based on broker opinions ofvalue using multiple methods to determine their value, including but not limited to replacement value, discounted cash flows and the income approach based on historicaland forecasted operating results of the specific properties. These valuations are Level 3 inputs under the fair value hierarchy. The Company completed the sale of thehotels in July 2021.
Additionally, during the first quarter of 2021, the Company identified the Overland Park, Kansas SpringHill Suites for potential sale and, in February 2021,entered into a purchase contract with an unrelated party for the sale of the hotel for a gross sales price of $5.3 million. As a result, the Company recognized animpairment loss totaling approximately $1.3 million in the first quarter of 2021, to adjust the carrying value of the hotel to its estimated fair value less cost to sell, whichwas based on the contracted sales price, a Level 1 input under the fair value hierarchy. The Company completed the sale of the hotel in April 2021.
In June 2020, the Company entered into a purchase contract with an unrelated party for the sale of its 140-room Memphis, Tennessee Homewood Suites for agross sales price of approximately $9.0 million. As a result, the Company recognized an impairment loss of approximately $4.4 million in the second quarter of 2020,representing the difference between the carrying value of the hotel and the contracted sales price, net of estimated selling costs, which is a Level 1 input under the fairvalue hierarchy. The Company completed the sale of the hotel in March 2021, and used the net proceeds from the sale to pay down borrowings on the Company’srevolving credit facility.
4. Debt
Summary
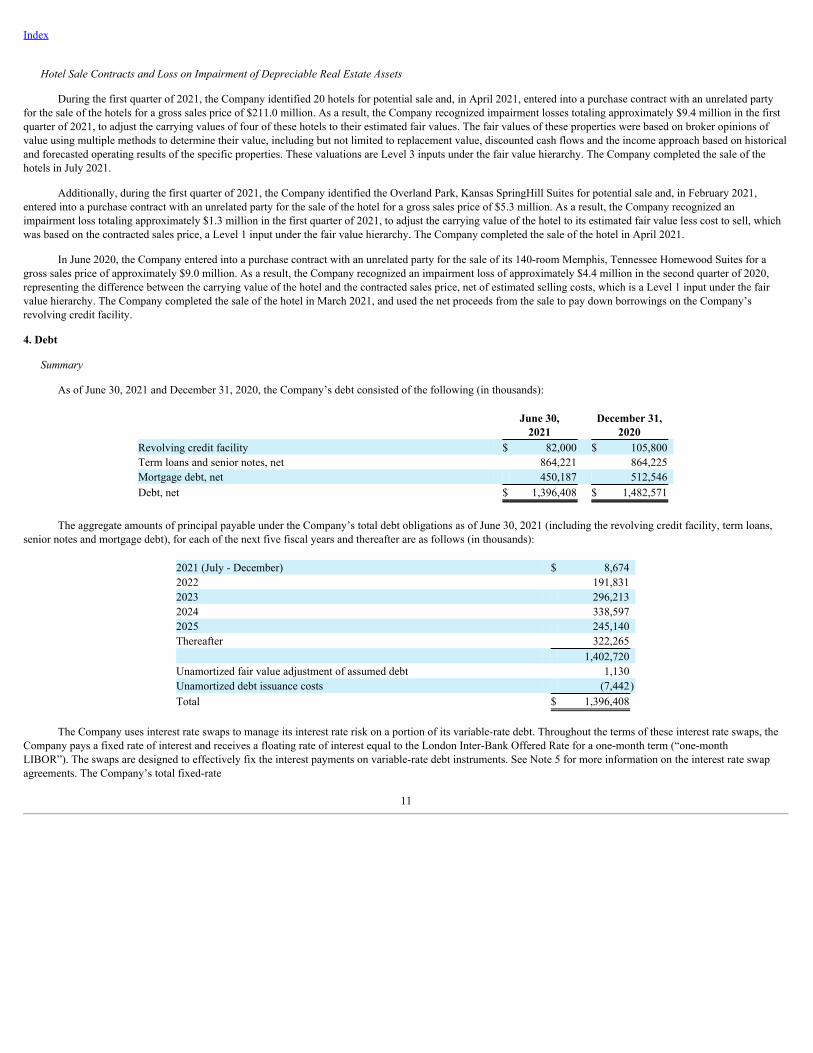
As of June 30, 2021 and December 31, 2020, the Company’s debt consisted of the following (in thousands):
June 30,
2021 December 31,
2020 Revolving credit facility $ 82,000 $ 105,800 Term loans and senior notes, net 864,221 864,225 Mortgage debt, net 450,187 512,546 Debt, net $ 1,396,408 $ 1,482,571
The aggregate amounts of principal payable under the Company’s total debt obligations as of June 30, 2021 (including the revolving credit facility, term loans,senior notes and mortgage debt), for each of the next five fiscal years and thereafter are as follows (in thousands):
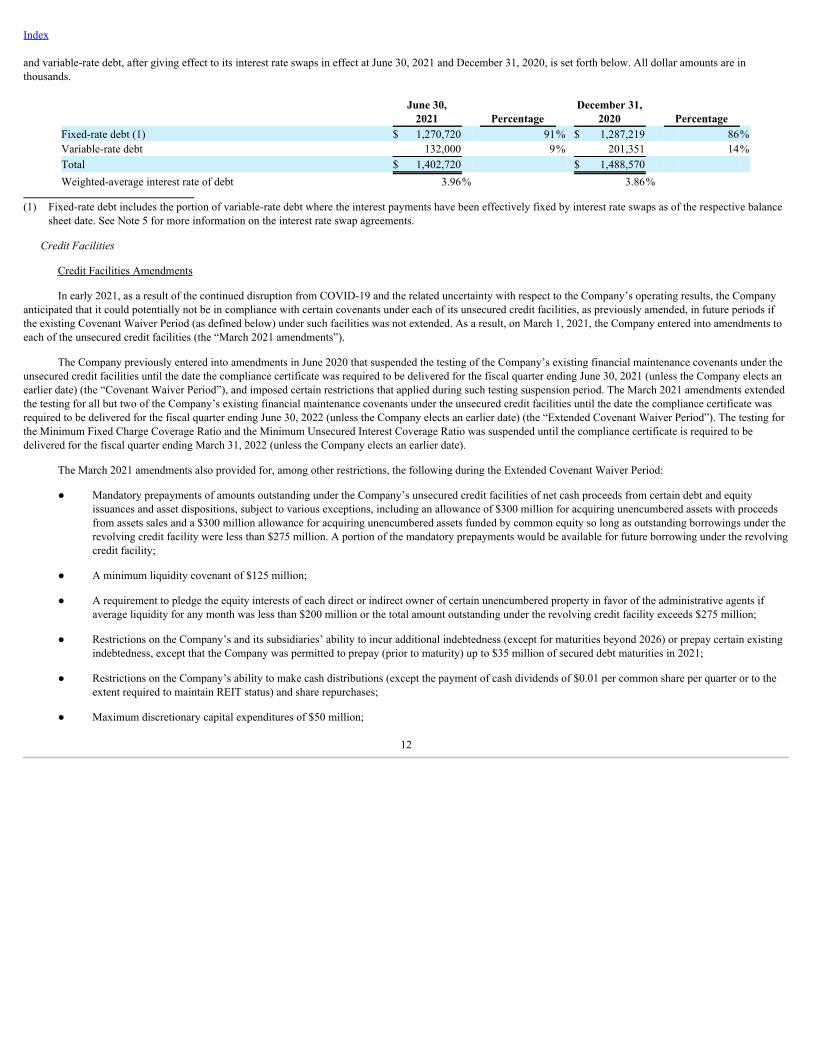
The Company uses interest rate swaps to manage its interest rate risk on a portion of its variable-rate debt. Throughout the terms of these interest rate swaps, the
Company pays a fixed rate of interest and receives a floating rate of interest equal to the London Inter-Bank Offered Rate for a one-month term (“one-monthLIBOR”). The swaps are designed to effectively fix the interest payments on variable-rate debt instruments. See Note 5 for more information on the interest rate swapagreements. The Company’s total fixed-rate
11
Index and variable-rate debt, after giving effect to its interest rate swaps in effect at June 30, 2021 and December 31, 2020, is set forth below. All dollar amounts are inthousands.
(1) Fixed-rate debt includes the portion of variable-rate debt where the interest payments have been effectively fixed by interest rate swaps as of the respective balancesheet date. See Note 5 for more information on the interest rate swap agreements.
Credit Facilities
Credit Facilities Amendments
In early 2021, as a result of the continued disruption from COVID-19 and the related uncertainty with respect to the Company’s operating results, the Companyanticipated that it could potentially not be in compliance with certain covenants under each of its unsecured credit facilities, as previously amended, in future periods ifthe existing Covenant Waiver Period (as defined below) under such facilities was not extended. As a result, on March 1, 2021, the Company entered into amendments toeach of the unsecured credit facilities (the “March 2021 amendments”).
The Company previously entered into amendments in June 2020 that suspended the testing of the Company’s existing financial maintenance covenants under theunsecured credit facilities until the date the compliance certificate was required to be delivered for the fiscal quarter ending June 30, 2021 (unless the Company elects anearlier date) (the “Covenant Waiver Period”), and imposed certain restrictions that applied during such testing suspension period. The March 2021 amendments extendedthe testing for all but two of the Company’s existing financial maintenance covenants under the unsecured credit facilities until the date the compliance certificate wasrequired to be delivered for the fiscal quarter ending June 30, 2022 (unless the Company elects an earlier date) (the “Extended Covenant Waiver Period”). The testing forthe Minimum Fixed Charge Coverage Ratio and the Minimum Unsecured Interest Coverage Ratio was suspended until the compliance certificate is required to bedelivered for the fiscal quarter ending March 31, 2022 (unless the Company elects an earlier date).
The March 2021 amendments also provided for, among other restrictions, the following during the Extended Covenant Waiver Period:
● Mandatory prepayments of amounts outstanding under the Company’s unsecured credit facilities of net cash proceeds from certain debt and equityissuances and asset dispositions, subject to various exceptions, including an allowance of $300 million for acquiring unencumbered assets with proceedsfrom assets sales and a $300 million allowance for acquiring unencumbered assets funded by common equity so long as outstanding borrowings under therevolving credit facility were less than $275 million. A portion of the mandatory prepayments would be available for future borrowing under the revolvingcredit facility;
● A minimum liquidity covenant of $125 million;
● A requirement to pledge the equity interests of each direct or indirect owner of certain unencumbered property in favor of the administrative agents ifaverage liquidity for any month was less than $200 million or the total amount outstanding under the revolving credit facility exceeds $275 million;
● Restrictions on the Company’s and its subsidiaries’ ability to incur additional indebtedness (except for maturities beyond 2026) or prepay certain existingindebtedness, except that the Company was permitted to prepay (prior to maturity) up to $35 million of secured debt maturities in 2021;
● Restrictions on the Company’s ability to make cash distributions (except the payment of cash dividends of $0.01 per common share per quarter or to theextent required to maintain REIT status) and share repurchases;
● Maximum discretionary capital expenditures of $50 million;
12
Index
● Limitations on additional investments; and
● An increase in the applicable interest rate under the unsecured credit facilities until the end of the Extended Covenant Waiver Period to a rate thatcorresponded to the highest leverage-based applicable interest rate margin plus 0.15% with respect to the unsecured credit facilities.
The amendments also modified the calculation of the existing financial covenants for the four quarters subsequent to the end of the Extended Covenant WaiverPeriod to annualize calculated amounts to the extent the most recently ended fiscal quarter was not at least four fiscal quarters from the end of the Extended CovenantWaiver Period, and provided for a LIBOR floor under the credit agreements of 25 basis points for Eurodollar Rate Loans and 1.25% for Base Rate Loans on the revolvingcredit facility, and any term loans under the credit agreements that were not hedged. The March 2021 amendments also modified certain of the existing financialmaintenance covenants to less restrictive levels upon exiting the Extended Covenant Waiver Period as follows (capitalized terms are defined in the credit agreements):
● Maximum Consolidated Leverage Ratio of 8.50 to 1.00 for the first two fiscal quarters, 8.00 to 1.00 for two fiscal quarters, 7.50 to 1.00 for one fiscalquarter and then a ratio of 6.50 to 1.00 thereafter;
● Minimum Fixed Charge Coverage Ratio of 1.05 to 1.00 for the first fiscal quarter, 1.25 to 1.00 for one fiscal quarter and then a ratio of 1.50 to 1.00thereafter;
● Minimum Unsecured Interest Coverage Ratio of no less than 1.25 to 1.00 for one fiscal quarter, 1.50 to 1.00 for one fiscal quarter, 1.75 to 1.00 for onefiscal quarter and a ratio of 2.00 to 1.00 thereafter; and
● Maximum Unsecured Leverage Ratio of 65% for two fiscal quarters and 60% thereafter.
Except as otherwise set forth in the amendments, the terms of the credit agreements remain in effect.
In July 2021, the Company notified its lenders under its unsecured credit facilities that it had elected to exit the Extended Covenant Waiver Period effective onJuly 29, 2021 pursuant to the terms of each of its unsecured credit facilities. Upon exiting the Extended Covenant Waiver Period, the Company is no longer subject to therestrictions described above regarding its investing and financing activities that were applicable during the Extended Covenant Waiver Period, including, but not limitedto, limitations on the acquisition of property, payment of distributions to shareholders, limitations on capital expenditures and use of proceeds from the sale of property orcommon shares of the Company. Those restrictions, including the restriction on payment of distributions to shareholders, were still in place throughout the second quarterof 2021.
As of June 30, 2021, the Company met the applicable financial maintenance covenants based on the annualized results of the three months ended June 30, 2021 atthe levels required for the first quarter tested upon exiting the Extended Covenant Waiver Period. The Company anticipates continuing to meet the applicable financialmaintenance covenants in future periods, although there can be no assurances and the unsecured credit facilities do not provide for the Company re-entering the ExtendedCovenant Waiver Period once it has elected to exit.
$850 Million Credit Facility
The Company utilizes an unsecured “$850 million credit facility” comprised of (i) a $425 million revolving credit facility with an initial maturity date of July 27,2022 (the “Revolving Credit Facility”) and (ii) a $425 million term loan facility consisting of two term loans: a $200 million term loan with a maturity date of July 27,2023, and a $225 million term loan with a maturity date of January 31, 2024 (the “$425 million term loan facility”). Subject to certain conditions including covenantcompliance and additional fees, the $425 million revolving credit facility maturity date may be extended up to one year if certain criteria are met at the time of extension.The Company may make voluntary prepayments in whole or in part, at any time. Interest payments on the $850 million credit facility are due monthly and the interestrate, subject to certain exceptions, is equal to an annual rate of the one-month LIBOR plus a margin ranging from 1.35% to 2.25%, depending upon the Company’sleverage ratio, as calculated under the terms of the credit agreement. As of June 30, 2021, the Company had availability of $343 million under the revolving creditfacility. The Company is also required to pay quarterly an unused facility fee at an annual rate of 0.20% or 0.25% on the unused portion of the $425 million revolvingcredit facility, based on the amount of borrowings outstanding during the quarter.
$225 Million Term Loan Facility
The Company has an unsecured $225 million term loan facility that is comprised of (i) a $50 million term loan with a maturity date of August 2, 2023, and (ii) a$175 million term loan with a maturity date of August 2, 2025. The credit agreement contains requirements and covenants similar to the Company’s $850 million creditfacility. The Company may make voluntary prepayments in whole or in part, at any time, subject to certain conditions. Interest payments on the $225 million term loanfacility are due monthly and the interest rate, subject to certain exceptions, is equal to an annual rate of the one-month LIBOR plus a margin ranging from 1.35% to2.50%, depending upon the Company’s leverage ratio, as calculated under the terms of the credit agreement.
13
Index
2017 $85 Million Term Loan Facility
On July 25, 2017, the Company entered into an unsecured $85 million term loan facility with a maturity date of July 25, 2024, consisting of one term loan thatwas funded at closing (the “2017 $85 million term loan facility”). The credit agreement, as amended and restated in August 2018, contains requirements and covenantssimilar to the Company’s $850 million credit facility. The Company may make voluntary prepayments in whole or in part, at any time, subject to certain conditions.Interest payments on the 2017 $85 million term loan facility are due monthly, and the interest rate, subject to certain exceptions, is equal to an annual rate of the one-month LIBOR plus a margin ranging from 1.30% to 2.10%, depending upon the Company’s leverage ratio, as calculated under the terms of the credit agreement, for theremainder of the term.
2019 $85 Million Term Loan Facility
On December 31, 2019, the Company entered into an unsecured $85 million term loan facility with a maturity date of December 31, 2029, consisting of one termloan funded at closing (the “2019 $85 million term loan facility”). Net proceeds from the 2019 $85 million term loan facility were used to pay down borrowings on theCompany’s revolving credit facility. The credit agreement contains requirements and covenants similar to the Company’s $850 million credit facility. The Company maymake voluntary prepayments in whole or in part, subject to certain conditions. Interest payments on the 2019 $85 million term loan facility are due monthly and theinterest rate, subject to certain exceptions, is equal to an annual rate of the one-month LIBOR plus a margin ranging from 1.70% to 2.55%, depending upon theCompany’s leverage ratio, as calculated under the terms of the credit agreement.
$50 Million Senior Notes Facility
On March 16, 2020, the Company entered into an unsecured $50 million senior notes facility with a maturity date of March 31, 2030, consisting of senior notestotaling $50 million funded at closing (the “$50 million senior notes facility” and, collectively with the $850 million credit facility, the $225 million term loan facility, the2017 $85 million term loan facility and the 2019 $85 million term loan facility, each as amended, the “unsecured credit facilities”). Net proceeds from the $50 millionsenior notes facility were available to provide funding for general corporate purposes. The note agreement contains requirements and covenants similar to the Company’s$850 million credit facility. The Company may make voluntary prepayments in whole or in part, at any time, subject to certain conditions, including make-wholeprovisions. Interest payments on the $50 million senior notes facility are due quarterly and the interest rate, subject to certain exceptions, ranges from an annual rate of3.60% to 4.35% depending on the Company’s leverage ratio, as calculated under the terms of the facility.
14
Index
As of June 30, 2021 and December 31, 2020, the details of the Company’s unsecured credit facilities were as set forth below. All dollar amounts are in thousands.
Outstanding Balance
Interest Rate (1) Maturity
Date June 30,
2021 December 31,
2020 Revolving credit facility (2) LIBOR + 1.40% - 2.25% 7/27/2022 $ 82,000 $ 105,800 Term loans and senior notes
$200 million term loan LIBOR + 1.35% - 2.20% 7/27/2023 200,000 200,000 $225 million term loan LIBOR + 1.35% - 2.20% 1/31/2024 225,000 225,000 $50 million term loan LIBOR + 1.35% - 2.20% 8/2/2023 50,000 50,000 $175 million term loan LIBOR + 1.65% - 2.50% 8/2/2025 175,000 175,000 2017 $85 million term loan LIBOR + 1.30% - 2.10% 7/25/2024 85,000 85,000 2019 $85 million term loan LIBOR + 1.70% - 2.55% 12/31/2029 85,000 85,000 $50 million senior notes 3.60% - 4.35% 3/31/2030 50,000 50,000
Term loans and senior notes at stated value 870,000 870,000
Unamortized debt issuance costs (5,779) (5,775)Term loans and senior notes, net 864,221 864,225 Credit facilities, net (2) $ 946,221 $ 970,025 Weighted-average interest rate (3) 3.86% 3.64%
(1) Interest rates on all of the unsecured credit facilities increased to 0.15% above the highest rate shown for each loan during the Extended Covenant Waiver Period.(2) Excludes unamortized debt issuance costs related to the revolving credit facility totaling approximately $1.8 million and $2.1 million as of June 30, 2021 and
December 31, 2020, respectively, which are included in other assets, net in the Company's consolidated balance sheets.(3) Interest rate represents the weighted-average effective annual interest rate at the balance sheet date which includes the effect of interest rate swaps in effect on
$770.0 million and $745.0 million of the outstanding variable-rate debt as of June 30, 2021 and December 31, 2020, respectively. See Note 5 for more informationon the interest rate swap agreements. The one-month LIBOR at June 30, 2021 and December 31, 2020 was 0.10% and 0.14%, respectively.
Mortgage Debt
As of June 30, 2021, the Company had approximately $450.7 million in outstanding mortgage debt secured by 28 properties with maturity dates ranging fromSeptember 2022 to May 2038, stated interest rates ranging from 3.40% to 5.00% and effective interest rates ranging from 3.40% to 4.97%. The loans generally providefor monthly payments of principal and interest on an amortized basis and defeasance or prepayment penalties if prepaid. As a result of the effects of the COVID-19pandemic on certain hotels, the associated lenders granted temporary deferrals of principal and interest payments during 2020, however all payments resumed as ofDecember 31, 2020. The following table sets forth the hotel properties securing each loan, the interest rate, loan assumption or origination date, maturity date, theprincipal amount assumed or originated, and the outstanding balance prior to any fair value adjustments or debt issuance costs as of June 30, 2021 and December 31,2020 for each of the Company’s mortgage debt obligations. All dollar amounts are in thousands.
15
Index
Location Brand InterestRate (1)
LoanAssumption
orOrigination
Date Maturity
Date
PrincipalAssumed
orOriginated
Outstandingbalance
as ofJune 30,
2021
Outstandingbalance
as ofDecember 31,
2020 Cape Canaveral, FL Hampton (2) 4/30/2020 (3) $ 10,852 $ - $ 10,275 Cape Canaveral, FL Home2 Suites (2) 4/30/2020 (3) 10,852 - 10,275 Colorado Springs, CO Hampton 6.25% 9/1/2016 (4) 7,923 - 7,317 Franklin, TN Courtyard 6.25% 9/1/2016 (4) 14,679 - 13,563 Franklin, TN Residence Inn 6.25% 9/1/2016 (4) 14,679 - 13,563 Grapevine, TX Hilton Garden Inn 4.89% 8/29/2012 9/1/2022 11,810 9,256 9,434 Collegeville/Philadelphia, PA Courtyard 4.89% 8/30/2012 9/1/2022 12,650 9,914 10,105 Hattiesburg, MS Courtyard 5.00% 3/1/2014 9/1/2022 5,732 4,640 4,729 Kirkland, WA Courtyard 5.00% 3/1/2014 9/1/2022 12,145 9,831 10,018 Rancho Bernardo/San Diego, CA Courtyard 5.00% 3/1/2014 9/1/2022 15,060 12,190 12,422 Seattle, WA Residence Inn 4.96% 3/1/2014 9/1/2022 28,269 22,857 23,294 Anchorage, AK Embassy Suites 4.97% 9/13/2012 10/1/2022 23,230 18,313 18,660 Somerset, NJ Courtyard 4.73% 3/1/2014 10/6/2022 8,750 7,042 7,179 Tukwila, WA Homewood Suites 4.73% 3/1/2014 10/6/2022 9,431 7,590 7,737 Huntsville, AL Homewood Suites 4.12% 3/1/2014 2/6/2023 8,306 6,608 6,742 Prattville, AL Courtyard 4.12% 3/1/2014 2/6/2023 6,596 5,248 5,354 San Diego, CA Residence Inn 3.97% 3/1/2014 3/6/2023 18,600 14,761 15,061 Miami, FL Homewood Suites 4.02% 3/1/2014 4/1/2023 16,677 13,270 13,537 New Orleans, LA Homewood Suites 4.36% 7/17/2014 8/11/2024 27,000 22,376 22,766 Westford, MA Residence Inn 4.28% 3/18/2015 4/11/2025 10,000 8,464 8,605 Denver, CO Hilton Garden Inn 4.46% 9/1/2016 6/11/2025 34,118 29,904 30,387 Oceanside, CA Courtyard 4.28% 9/1/2016 10/1/2025 13,655 12,463 12,605 Omaha, NE Hilton Garden Inn 4.28% 9/1/2016 10/1/2025 22,682 20,701 20,936 Boise, ID Hampton 4.37% 5/26/2016 6/11/2026 24,000 21,914 22,146 Burbank, CA Courtyard 3.55% 11/3/2016 12/1/2026 25,564 22,863 23,315 San Diego, CA Courtyard 3.55% 11/3/2016 12/1/2026 25,473 22,782 23,232 San Diego, CA Hampton 3.55% 11/3/2016 12/1/2026 18,963 16,960 17,295 Burbank, CA SpringHill Suites 3.94% 3/9/2018 4/1/2028 28,470 26,679 27,078 Santa Ana, CA Courtyard 3.94% 3/9/2018 4/1/2028 15,530 14,553 14,770 Richmond, VA Courtyard 3.40% 2/12/2020 3/11/2030 14,950 14,594 14,739 Richmond, VA Residence Inn 3.40% 2/12/2020 3/11/2030 14,950 14,594 14,739 Portland, ME Residence Inn 3.43% 3/2/2020 4/1/2030 33,500 33,500 33,500 San Jose, CA Homewood Suites 4.22% 12/22/2017 5/1/2038 30,000 26,853 27,392 $ 575,096 450,720 512,770 Unamortized fair value adjustment of assumed debt 1,130 1,624 Unamortized debt issuance costs (1,663) (1,848)Total $ 450,187 $ 512,546
(1) Interest rates are the rates per the loan agreement. For loans assumed, the Company adjusted the interest rates per the loan agreement to market rates and isamortizing the adjustments to interest expense over the life of the loan.
(2) Interest rate was variable based on one-month LIBOR plus 3.00%. As of April 12, 2021, the date the loan was fully repaid, the interest rate was 3.11%. In July2020, the principal amount of the note was reduced by approximately $1.1 million representing a credit from the developer for shared construction savings.
(3) Loan was repaid in full on April 12, 2021.(4) Loan was repaid in full on June 4, 2021.
5. Fair Value of Financial Instruments
Except as described below, the carrying value of the Company’s financial instruments approximates fair value due to the short-term nature of these financialinstruments.
Debt
The Company estimates the fair value of its debt by discounting the future cash flows of each instrument at estimated market rates consistent with the maturity ofa debt obligation with similar credit terms and credit characteristics, which are Level 3 inputs under the fair value hierarchy. Market rates take into consideration generalmarket conditions and maturity. As of June 30, 2021, both
16
Index
the carrying value and estimated fair value of the Company’s debt were approximately $1.4 billion. As of December 31, 2020, both the carrying value and estimated fairvalue of the Company’s debt were approximately $1.5 billion. Both the carrying value and estimated fair value of the Company’s debt (as discussed above) are net ofunamortized debt issuance costs related to term loans, senior notes and mortgage debt for each specific year.
Derivative Instruments
Currently, the Company uses interest rate swaps to manage its interest rate risk on variable-rate debt. Throughout the terms of these interest rate swaps, theCompany pays a fixed rate of interest and receives a floating rate of interest equal to the one-month LIBOR. The swaps are designed to effectively fix the interestpayments on variable-rate debt instruments. These swap instruments are recorded at fair value and, if in an asset position, are included in other assets, net, and, if in aliability position, are included in accounts payable and other liabilities in the Company’s consolidated balance sheets. The fair values of the Company’s interest rate swapagreements are determined using the market standard methodology of netting the discounted future fixed cash payments and the discounted expected variable cashreceipts, which is considered a Level 2 measurement under the fair value hierarchy. The variable cash receipts are based on an expectation of future interest rates(forward curves) derived from observable market interest rate curves. The following table sets forth information for each of the Company’s interest rate swap agreementsoutstanding as of June 30, 2021 and December 31, 2020. All dollar amounts are in thousands. Fair Value Asset (Liability)
The Company assesses, both at inception and on an ongoing basis, the effectiveness of its qualifying cash flow hedges. As of June 30, 2021, all of the 13 activeinterest rate swap agreements listed above were designated as cash flow hedges. The change in the fair value of the Company’s designated cash flow hedges is recordedto accumulated other comprehensive loss, a component of shareholders’ equity in the Company’s consolidated balance sheets. Amounts reported in accumulated othercomprehensive loss will be reclassified to interest and other expense, net as interest payments are made or received on the Company’s variable-rate derivatives. TheCompany estimates that approximately $11.4 million of net unrealized losses included in accumulated other comprehensive loss at June 30, 2021 will be reclassified asan increase to interest and other expense, net within the next 12 months.
The following table presents the effect of derivative instruments in cash flow hedging relationships in the Company’s consolidated statements of operations andcomprehensive income (loss) for the three and six months ended June 30, 2021 and 2020 (in thousands):
17
Index
Net Unrealized LossRecognized in Other
Comprehensive Income(Loss)
Net Unrealized Loss Reclassifiedfrom Accumulated Other Comprehensive
Income (Loss) to Interest and OtherExpense, net
Three Months Ended June 30, Three Months Ended June 30, 2021 2020 2021 2020 Interest rate derivatives in cash flow hedging relationships $ (4,131) $ (6,394) $ (2,775) $ (2,199)
Net Unrealized Gain (Loss)Recognized in Other
Comprehensive Income (Loss)
Net Unrealized Loss Reclassifiedfrom Accumulated Other Comprehensive
Income (Loss) to Interest and OtherExpense, net
Six Months Ended June 30, Six Months Ended June 30, 2021 2020 2021 2020 Interest rate derivatives in cash flow hedging relationships $ 9,236 $ (48,661) $ (5,490) $ (2,300)
6. Related Parties
The Company has, and is expected to continue to engage in, transactions with related parties. These transactions cannot be construed to be at arm’s length and theresults of the Company’s operations may be different if these transactions were conducted with non-related parties. There have been no changes to the contracts andrelationships discussed in the 2020 Form 10-K. Below is a summary of the significant related party relationships in effect during the six months ended June 30, 2021 and2020.
Glade M. Knight, Executive Chairman of the Company, owns Apple Realty Group, Inc. (“ARG”), which receives support services from the Company andreimburses the Company for the cost of these services as discussed below. Mr. Knight is also currently a partner and Chief Executive Officer of Energy 11 GP, LLC andEnergy Resources 12 GP, LLC, which are the respective general partners of Energy 11, L.P. and Energy Resources 12, L.P., each of which receives support services fromARG.
The Company provides support services, including the use of the Company’s employees and corporate office, to ARG and is reimbursed by ARG for the cost ofthese services. Under this cost sharing structure, amounts reimbursed to the Company include both compensation for personnel and office related costs (including officerent, utilities, office supplies, etc.) used by ARG. The amounts reimbursed to the Company are based on the actual costs of the services and a good faith estimate of theproportionate amount of time incurred by the Company’s employees on behalf of ARG. Total reimbursed costs allocated by the Company to ARG for the six monthsended June 30, 2021 and 2020 totaled approximately $0.3 million and $0.6 million, respectively, and are recorded as a reduction to general and administrative expensesin the Company’s consolidated statements of operations.
As part of the cost sharing arrangement, certain day-to-day transactions may result in amounts due to or from the Company and ARG. To efficiently manage cashdisbursements, the Company or ARG may make payments for the other company. Under this cash management process, each company may advance or defer up to $1million at any time. Each quarter, any outstanding amounts are settled between the companies. This process allows each company to minimize its cash on hand andreduces the cost for each company. The amounts outstanding at any point in time are not significant to either of the companies. As of June 30, 2021 and December 31,2020, total amounts due from ARG for reimbursements under the cost sharing structure totaled approximately $0.1 million and $0.3 million, respectively, and areincluded in other assets, net in the Company’s consolidated balance sheets.
The Company, through its wholly-owned subsidiary, Apple Air Holding, LLC, owns a Learjet used primarily for acquisition, asset management, renovation andinvestor and public relations purposes. The aircraft is also leased to affiliates of the Company based on third party rates, which leasing activity was not significant duringthe reporting periods. The Company also utilizes one aircraft, owned through an entity owned by the Company’s Executive Chairman, for acquisition, asset management,renovation and investor and public relations purposes, and reimburses the entity at third party rates. Total costs incurred for the use of the aircraft during the six monthsended June 30, 2021 and 2020 were less than $0.1 million for each respective period and are included in general and administrative expenses in the Company’sconsolidated statements of operations.
18
Index
7. Shareholders’ Equity
Distributions
Subsequent to the distribution paid in March 2020, the Company announced the suspension of its monthly distributions due to the impact of COVID-19 on itsoperating cash flows. Prior to the suspension of its distributions, the Company’s annual distribution rate, payable monthly, was $1.20 per common share. For the sixmonths ended June 30, 2020, the Company paid distributions of $0.30 per common share for a total of $67.3 million. The distributions paid during the six months endedJune 30, 2020 included the distribution paid in January 2020, totaling $22.4 million, that was declared in December 2019. As discussed in Note 4, as a requirement underthe amendments to its unsecured credit facilities, the Company was restricted in its ability to make distributions during the Extended Covenant Waiver Period, except forthe payment of cash distributions of $0.01 per common share per quarter or to the extent required to maintain REIT status. In the first quarter of 2021, the Companydeclared a quarterly distribution of $0.01 per common share in March 2021, which totaled $2.2 million and was paid on April 15, 2021. In the second quarter of 2021, theCompany declared a quarterly distribution of $0.01 per common share in June 2021, which was paid on July 15, 2021, resulting in an accrued distribution of $2.3 millionincluded in accounts payable and other liabilities in the Company’s consolidated balance sheet at June 30, 2021.
Issuance of Shares
On August 12, 2020, the Company entered into an equity distribution agreement pursuant to which the Company may sell, from time to time, up to an aggregate
of $300 million of its common shares under an at-the-market offering program (the “ATM Program”). During the second quarter of 2021, the Company soldapproximately 4.7 million common shares under its ATM Program at a weighted-average market sales price of approximately $16.26 per common share and receivedaggregate gross proceeds of approximately $76.0 million, before $0.9 million of commissions and issuance costs. The Company used the entire $75.1 million of netproceeds from the sale of these shares to pay down borrowings on its revolving credit facility. As of June 30, 2021, approximately $224.0 million remained available forissuance under the ATM program. The Company plans to use future net proceeds from the sale of these shares to pay down borrowings on its revolving credit facility (ifany). The Company plans to use the corresponding increased availability under the revolving credit facility for general corporate purposes which may include, amongother things, acquisitions of additional properties, the repayment of other outstanding indebtedness, capital expenditures, improvement of properties in its portfolio andworking capital.
Share Repurchases
In May 2021, the Company’s Board of Directors approved a one-year extension of its existing share repurchase program, authorizing share repurchases up to anaggregate of $345 million (the “Share Repurchase Program”). The Share Repurchase Program may be suspended or terminated at any time by the Company and will endin July 2022 if not terminated earlier or extended. During the first six months of 2020, the Company purchased, under its Share Repurchase Program approximately 1.5million of its common shares at a weighted-average market purchase price of approximately $9.42 per common share, for an aggregate purchase price, includingcommissions, of approximately $14.3 million. The shares were repurchased under a written trading plan that provided for share repurchases in open market transactionsand was intended to comply with Rule 10b5-1 under the Securities Exchange Act of 1934, as amended. In March 2020 the Company terminated its written trading planand has not engaged in additional repurchases under the Share Repurchase Program since then. Repurchases under the Share Repurchase Program have been funded, andthe Company intends to fund future purchases, with cash on hand or availability under its unsecured credit facilities subject to any applicable restrictions under theCompany’s unsecured credit facilities. The timing of share repurchases and the number of common shares to be repurchased under the Share Repurchase Program willdepend upon the prevailing market conditions, regulatory requirements and other factors, including compliance with applicable credit facility covenants (if any).
8. Compensation Plans
The Company annually establishes an incentive plan for its executive management. Under the incentive plan for 2021 (the “2021 Incentive Plan”), participants areeligible to receive incentive compensation based on the achievement of certain 2021 performance measures, consisting of operational performance metrics andshareholder return metrics (including shareholder return relative to a peer group and total shareholder return, over one-year, two-year and three-year periods). Withrespect to the operational performance metrics, the first half of the year, for the period of January 1 – June 30, 2021, will be based on operational performance metricsincluding portfolio occupancy growth, expense management, successful negotiation of amendments to each of the Company’s unsecured credit facilities and effectiveallocation of capital to drive incremental returns, with no specific target or weighting assigned to each metric. The Compensation Committee intends to reviewperformance mid-year to determine the feasibility of reverting back to operational performance metrics for the second half of the year that are more consistent with theCompany’s historical operational performance metrics. The operational performance metrics account for 50% of the total target incentive compensation. The shareholderreturn metrics are weighted 75% for relative shareholder return metrics and 25% for total shareholder return metrics, and account for 50% of the total target incentivecompensation. At June 30, 2021, the range of potential aggregate payouts under the 2021 Incentive Plan was $0 - $22.4 million. Based on performance through June 30,2021, the Company has accrued approximately $6.0
19
Index
million as a liability for potential executive incentive compensation payments under the 2021 Incentive Plan, which is included in accounts payable and other liabilities inthe Company’s consolidated balance sheet as of June 30, 2021. Compensation expense recognized by the Company under the 2021 Incentive Plan is included in generaland administrative expenses in the Company’s consolidated statement of operations and totaled approximately $3.1 million and $6.0 million for the three and six monthsended June 30, 2021. Approximately 25% of target awards under the 2021 Incentive Plan, if any, will be paid in cash, and 75% will be issued in stock under theCompany’s 2014 Omnibus Incentive Plan, approximately two-thirds of which will vest in December 2021 and one-third of which will vest in December 2022.
Under the incentive plan for 2020 (the “2020 Incentive Plan”), the Company recorded approximately $1.1 million and $2.5 million in general and administrativeexpenses in its consolidated statement of operations for the three and six months ended June 30, 2020.
During the six months ended June 30, 2020, the Company accrued expense associated with two separation agreements of approximately $1.25 million each,totaling approximately $2.5 million, in connection with the retirements of the Company’s former Executive Vice President and Chief Operating Officer and theCompany’s former Executive Vice President and Chief Financial Officer which amounts were paid in October 2020. The accrued expense was included in general andadministrative expenses in the Company’s consolidated statement of operations for the six months ended June 30, 2020.
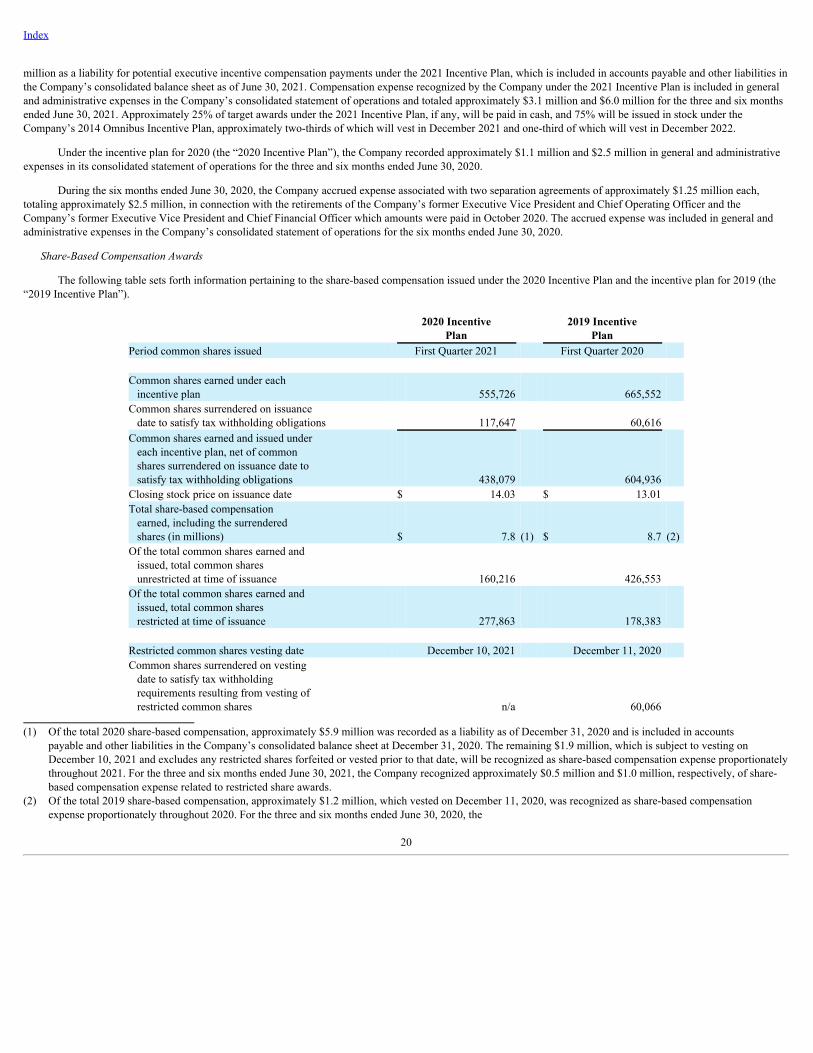
Share-Based Compensation Awards
The following table sets forth information pertaining to the share-based compensation issued under the 2020 Incentive Plan and the incentive plan for 2019 (the“2019 Incentive Plan”).
2020 Incentive
Plan 2019 Incentive
Plan Period common shares issued First Quarter 2021 First Quarter 2020 Common shares earned under each incentive plan 555,726 665,552 Common shares surrendered on issuance date to satisfy tax withholding obligations 117,647 60,616 Common shares earned and issued under each incentive plan, net of common shares surrendered on issuance date to satisfy tax withholding obligations 438,079 604,936 Closing stock price on issuance date $ 14.03 $ 13.01 Total share-based compensation earned, including the surrendered shares (in millions)
$ 7.8 (1) $ 8.7 (2)
Of the total common shares earned and issued, total common shares unrestricted at time of issuance 160,216 426,553 Of the total common shares earned and issued, total common shares restricted at time of issuance 277,863 178,383 Restricted common shares vesting date December 10, 2021 December 11, 2020 Common shares surrendered on vesting date to satisfy tax withholding requirements resulting from vesting of restricted common shares n/a 60,066
(1) Of the total 2020 share-based compensation, approximately $5.9 million was recorded as a liability as of December 31, 2020 and is included in accountspayable and other liabilities in the Company’s consolidated balance sheet at December 31, 2020. The remaining $1.9 million, which is subject to vesting onDecember 10, 2021 and excludes any restricted shares forfeited or vested prior to that date, will be recognized as share-based compensation expense proportionatelythroughout 2021. For the three and six months ended June 30, 2021, the Company recognized approximately $0.5 million and $1.0 million, respectively, of share-based compensation expense related to restricted share awards.
(2) Of the total 2019 share-based compensation, approximately $1.2 million, which vested on December 11, 2020, was recognized as share-based compensationexpense proportionately throughout 2020. For the three and six months ended June 30, 2020, the
20
Index
Company recognized approximately $0.3 million and $0.6 million, respectively, of share-based compensation expense related to restricted share awards.
Additionally, in conjunction with the appointment of five new officers of the Company on April 1, 2020, the Company issued to the new officer group a total ofapproximately 200,000 restricted common shares with an aggregate grant date fair value of approximately $1.8 million. For each grantee, the restricted shares will vest onMarch 31, 2023 if the individual remains in service of the Company through the date of vesting. The expense associated with the awards will be amortized over the 3-year restriction period. For the three months ended June 30, 2021 and 2020, the Company recognized approximately $0.1 million in each respective period, of share-based compensation expense related to these awards, and $0.3 million and $0.1 million, respectively, for the six months ended June 30, 2021 and 2020.
9. Subsequent Events
On July 15, 2021, the Company paid approximately $2.3 million, or $0.01 per outstanding common share, in distributions to its common shareholders.
On July 22, 2021, the Company completed the sale of 20 of its hotels. A portion of the net proceeds from the sale were used to pay down borrowings on theCompany’s revolving credit facility and the remaining proceeds are available for general corporate purposes, including acquisitions of hotel properties. See Note 3 foradditional information concerning this transaction.
In July 2021, the Company entered into a contract for the purchase of two hotels in Portland, Maine, one existing and one currently under development that isplanned to be completed and open for business during the third quarter of 2021, for an anticipated gross purchase price of approximately $117.9 million. The two hotelsconsist of an AC Hotel and an Aloft Hotel containing a total of 335 guest rooms. Although the Company is working towards acquiring these hotels, there are manyconditions to closing that have not yet been satisfied, and there can be no assurance that closings on these hotels will occur under the outstanding purchase contracts.
In July 2021, the Company entered into a contract for the purchase of an existing Hyatt Place hotel in Greenville, South Carolina, containing 130 guest rooms, foran anticipated gross purchase price of approximately $30.0 million. Although the Company is working towards acquiring this hotel, there are many conditions to closingthat have not yet been satisfied, and there can be no assurance that closing on this hotel will occur under the outstanding purchase contract.
In July 2021, the Company entered into a contract for the purchase of an Embassy Suites hotel that will be constructed in Madison, Wisconsin for an anticipatedgross purchase price of approximately $78.6 million, and is expected to contain approximately 260 guest rooms. Although the Company is working towards acquiringthis hotel, there are many conditions to closing that have not yet been satisfied, and there can be no assurance that closing on this hotel will occur under the outstandingpurchase contract.
In July 2021, the Company notified its lenders under its unsecured credit facilities that it had elected to exit the Extended Covenant Waiver Period effective onJuly 29, 2021 pursuant to the terms of each of its unsecured credit facilities, as amended. Upon exiting the Extended Covenant Waiver Period, the Company is no longersubject to the additional restrictions described above in Note 4 regarding its investing and financing activities that were applicable during the Extended Covenant WaiverPeriod, including, but not limited to, limitations on the acquisition of property, payment of distributions to shareholders, limitations on capital expenditures and use ofproceeds from the sale of property or common shares of the Company. Those restrictions, including the restriction on payment of distributions to shareholders, were stillin place throughout the second quarter of 2021. As of June 30, 2021, the Company met the financial maintenance covenants based on the annualized results of the threemonths ended June 30, 2021 at the levels required for the first quarter tested upon exiting the Extended Covenant Waiver Period as described in Note 4.
21
Index Item 2. Management’s Discussion and Analysis of Financial Condition and Results of Operations
Forward-Looking Statements
This Quarterly Report contains forward-looking statements within the meaning of Section 27A of the Securities Act of 1933, as amended, and Section 21E of theSecurities Exchange Act of 1934, as amended. Forward-looking statements are typically identified by use of statements that include phrases such as “may,” “believe,”“expect,” “anticipate,” “intend,” “estimate,” “project,” “target,” “goal,” “plan,” “should,” “will,” “predict,” “potential,” “outlook,” “strategy,” and similar expressions thatconvey the uncertainty of future events or outcomes. Such statements involve known and unknown risks, uncertainties, and other factors which may cause the actualresults, performance, or achievements of the Company to be materially different from future results, performance or achievements expressed or implied by such forward-looking statements.
Currently, one of the most significant factors that could cause actual outcomes to differ materially from the Company’s forward-looking statements continues tobe the adverse effect of COVID-19, including resurgences and variants, on the Company’s business, financial performance and condition, operating results and cashflows, the real estate market and the hospitality industry specifically, and the global economy and financial markets generally. The significance, extent and duration of thecontinued impacts caused by the COVID-19 outbreak on the Company will depend on future developments, which are highly uncertain and cannot be predicted withconfidence at this time, including the scope, severity and duration of the pandemic, the extent and effectiveness of the actions taken to contain the pandemic or mitigateits impact, the speed of the vaccine distribution, the efficacy, acceptance and availability of vaccines, the duration of associated immunity and efficacy of the vaccinesagainst variants of COVID-19, the potential for additional hotel closures/consolidations that may be mandated or advisable, whether based on increased COVID-19 cases,new variants or other factors, the slowing or potential rollback of “reopenings” in certain states, and the direct and indirect economic effects of the pandemic andcontainment measures, among others. Moreover, investors are cautioned to interpret many of the risks identified under the section titled “Risk Factors” in the Company’s2020 Form 10-K as being heightened as a result of the ongoing and numerous adverse impacts of COVID-19. Such additional factors include, but are not limited to, theability of the Company to effectively acquire and dispose of properties; the ability of the Company to successfully integrate pending transactions and implement itsoperating strategy; changes in general political, economic and competitive conditions and specific market conditions; reduced business and leisure travel due to travel-related health concerns, including the widespread outbreak of COVID-19 or an increase in COVID-19 cases or any other infectious or contagious diseases in the U.S. orabroad; adverse changes in the real estate and real estate capital markets; financing risks; changes in interest rates; litigation risks; regulatory proceedings or inquiries;and changes in laws or regulations or interpretations of current laws and regulations that impact the Company’s business, assets or classification as a REIT. Although theCompany believes that the assumptions underlying the forward-looking statements contained herein are reasonable, any of the assumptions could be inaccurate, andtherefore there can be no assurance that such statements included in this Quarterly Report will prove to be accurate. In light of the significant uncertainties inherent in theforward-looking statements included herein, the inclusion of such information should not be regarded as a representation by the Company or any other person that theresults or conditions described in such statements or the objectives and plans of the Company will be achieved. In addition, the Company’s qualification as a REITinvolves the application of highly technical and complex provisions of the Internal Revenue Code of 1986, as amended. Readers should carefully review the risk factorsdescribed in the Company’s filings with the Securities and Exchange Commission (“SEC”), including but not limited to those discussed in the section titled “RiskFactors” in the 2020 Form 10-K. Any forward-looking statement that the Company makes speaks only as of the date of this Quarterly Report. The Company undertakesno obligation to publicly update or revise any forward-looking statements or cautionary factors, as a result of new information, future events, or otherwise, except asrequired by law.
The following discussion and analysis should be read in conjunction with the Company’s Unaudited Consolidated Financial Statements and Notes thereto,appearing elsewhere in this Quarterly Report on Form 10-Q, as well as the information contained in the 2020 Form 10-K.
Overview
The Company is a Virginia corporation that has elected to be treated as a REIT for federal income tax purposes. The Company is self-advised and invests inincome-producing real estate, primarily in the lodging sector, in the U.S. As of June 30, 2021, the Company owned 232 hotels with an aggregate of 29,753 rooms locatedin urban, high-end suburban and developing markets throughout 35 states, including 20 hotels with 2,133 rooms classified as held for sale, which were sold to anunrelated party in July 2021. Substantially all of the Company’s hotels operate under Marriott or Hilton brands. The hotels are operated and managed under separatemanagement agreements with 16 hotel management companies, none of which are affiliated with the Company. The Company’s common shares are listed on the NYSEunder the ticker symbol “APLE.”
The Impact of COVID-19 on the Company and Hospitality Industry
Since first being reported in December 2019, COVID-19 has spread globally, including to every state in the U.S. On March 11, 2020, the World HealthOrganization declared COVID-19 a pandemic, and on March 13, 2020, the U.S. declared a national emergency with respect to COVID-19.
22
Index
The outbreak of COVID-19 has not only specifically reduced travel, but also has had a detrimental impact on regional and global economies and financialmarkets. The global, national and local impact of the outbreak has continued to evolve and many countries, including the U.S., as well as state and local governments,have reacted and continue to react with a wide variety of measures intended to control its spread, including states of emergency, mandatory quarantines, implementationof “stay at home” orders, business closures, border closings, and restrictions on travel and large gatherings, which has resulted in, and may continue to result in,cancellation of events, including sporting events, conferences and meetings. The pandemic triggered a period of material global economic slowdown and the NationalBureau of Economic Research declared that the U.S. entered a recession in February 2020. While the Company’s operating results and the overall economy in the U.S.continue to show signs of recovery, the Company cannot presently determine the extent or duration of the overall operational and financial effects that COVID-19 willhave on the Company, its business, the hospitality industry and the economy, or whether the recovery will continue.
The effects of the pandemic on the hotel industry are unprecedented. COVID-19 disrupted the industry and dramatically reduced business and leisure travel,which has had a significant adverse impact on, and management expects COVID-19 will continue to significantly adversely impact and disrupt, the Company’s business,financial performance and condition, operating results and cash flows. While a number of initial restrictions put into place during 2020 have eased, occupancy andaverage daily rate (“ADR”) during the first two quarters of 2021 were still generally below 2019 pre-pandemic levels. Additionally, while the development anddistribution of vaccines have helped contribute to improved conditions over the first half of 2021, there can be no assurances that the vaccines will contain the spread ofthe virus and its variants and allow the economy to fully recover. The Company expects the decline in revenue associated with COVID-19 and the overall influence onthe U.S. economy to negatively impact the Company’s operating results for an extended period of time. While the Company has experienced significant recoveries inleisure travel through the second quarter of 2021, the Company does not expect a full recovery in results until business travel improves and government restrictions ontravel and business operations are lifted.
Since the beginning of the pandemic, the Company, its management companies and its brands have taken steps to minimize costs and cash outflow to maintain asound liquidity position. The Company has implemented cost elimination and efficiency initiatives at each of the Company’s hotels by reducing labor costs, reducing oreliminating certain amenities and reducing rates under various service contracts, enhanced its sales efforts by focusing on COVID-19-specific demand opportunities incertain markets and has strategically targeted and maximized performance based on available demand, reduced non-essential capital improvement projects planned for2021, and entered into amendments to its unsecured credit facilities that provided for the temporary waiver of financial covenant testing for the majority of its financialmaintenance covenants. Cost reduction initiatives, including those discussed above, are not expected to fully, or even materially, offset revenue losses from COVID-19.The extent and duration of COVID-19 effects continue to remain unknown, and these uncertainties continue to make it difficult to predict operating results for theCompany’s hotels for the near future. Therefore, while the Company has experienced continued improvement through the first half of 2021 and expects continuedimprovement through the rest of the year, future revenues and operating results could be negatively impacted by, among other things, historical seasonal trends, anincrease in COVID-19 cases, state and local governments and businesses reverting back to tighter mitigation restrictions, deterioration of consumer sentiment orsignificant inflationary pressures. Therefore, there can be no assurances that the Company will not experience setbacks or further declines in hotel revenues or earnings atits hotels and the Company cannot predict how long the effects will continue to impact the Company’s operating results as compared to pre-pandemic levels.
2021 Hotel Portfolio Activities
The Company continually monitors market conditions and attempts to maximize shareholder value by investing in properties that it believes provide superiorvalue over the long term. Consistent with this strategy and the Company’s focus on investing in rooms-focused hotels, in 2019 the Company entered into a contract topurchase a 176-room Hilton Garden Inn to be constructed in Madison, Wisconsin. Construction of the hotel was completed in February 2021 and the Company acquiredthe hotel on February 18, 2021 for a gross purchase price of $49.6 million, utilizing borrowings on the Company’s revolving credit facility.
As of July 31, 2021, the Company had separate outstanding contracts for the potential purchase of four hotels, consisting of two hotels in Portland, Maine, onehotel in Greenville, South Carolina and one hotel in Madison, Wisconsin for a total combined purchase price of approximately $226.5 million. Two of the hotels arealready in operation, one is in development and scheduled to open during the third quarter of 2021, and one is in development and scheduled to open no earlier than 2023.Closings on three of these hotels are expected to occur in the second half of 2021, while closing on the remaining hotel is expected upon completion of development.Although the Company is working towards acquiring these hotels, there are many conditions to closing that have not yet been satisfied and there can be no assurance thatclosings on these hotels will occur under the outstanding purchase contracts. The Company plans to utilize its available cash (including a portion of the proceeds from thesale of 20 hotels in July 2021) or borrowings under its unsecured credit facilities available at closing to purchase hotels under contract if closings occur. The Companyalso entered into a contract during the second quarter of 2021 to purchase the fee interest in the land at its Seattle, Washington Residence Inn, which is currently under aground lease, for a purchase price of $80.0 million, consisting of a $24.0 million cash payment and a one-year note payable to the seller for $56.0 million. The landpurchase is expected to close in August 2021 and the Company plans to utilize its available cash (including a portion of the proceeds from the sale of 20 hotels in July2021) or borrowings under its unsecured credit
23
Index
facilities available at closing to purchase the land. Although the Company is working towards completing this acquisition, there are many conditions to closing that havenot yet been satisfied and there can be no assurance that closing will occur.
For its existing portfolio, the Company monitors each property’s profitability, market conditions and capital requirements and attempts to maximize shareholdervalue by disposing of properties when it believes that superior value can be provided from the sale of the property. As a result, during the first half of 2021, the Companysold three hotels for a total combined gross sales price of $23.6 million and recognized a gain on sale of approximately $4.5 million in the first half of 2021. Additionally,as of June 30, 2021, the Company had an outstanding contract to sell 20 of its hotels for a gross sales price of approximately $211.0 million, which was completed in July2021. The Company used a portion of the net proceeds from the sales to pay down borrowings on the Company’s revolving credit facility and the remaining proceeds areavailable for general corporate purposes, including acquisitions of hotel properties.
See Note 2 titled “Investment in Real Estate” and Note 3 titled “Assets Held for Sale and Dispositions” in the Company’s Unaudited Consolidated FinancialStatements and Notes thereto, appearing elsewhere in this Quarterly Report on Form 10-Q, for additional information concerning these transactions.
Hotel Operations
As of June 30, 2021, the Company owned 232 hotels with a total of 29,753 rooms as compared to 233 hotels with a total of 29,759 rooms as of June 30, 2020.Results of operations are included only for the period of ownership for hotels acquired or disposed of during the current reporting period and prior year. During the sixmonths ended June 30, 2021, the Company acquired one newly constructed hotel on February 18, 2021 and sold three hotels (one on February 25, 2021, one on March16, 2021 and one on April 30, 2021). During 2020, the Company acquired two newly constructed hotels on April 30, 2020 and two newly constructed hotels on August13, 2020, and sold three hotels (one on January 16, 2020, one on February 27, 2020 and one on December 30, 2020). As a result, the comparability of results for the threeand six months ended June 30, 2021 and 2020 as discussed below is impacted by these transactions in addition to the impact of COVID-19 beginning in March 2020.
In evaluating financial condition and operating performance, the most important indicators on which the Company focuses are revenue measurements, such asaverage occupancy, ADR and revenue per available room (“RevPAR”), and expenses, such as hotel operating expenses, general and administrative expenses and otherexpenses described below.
The following is a summary of the results from operations of the Company’s hotels for their respective periods of ownership by the Company: Three Months Ended June 30, Six Months Ended June 30,
(in thousands, except statistical data) 2021
Percentof
Revenue 2020
Percentof
Revenue PercentChange 2021
Percentof
Revenue 2020
Percentof
Revenue PercentChange
Total revenue $ 247,404 100.0% $ 81,078 100.0% 205.1% $ 406,117 100.0% $ 319,088 100.0% 27.3%Hotel operating expense 135,410 54.7% 61,817 76.2% 119.0% 239,150 58.9% 217,083 68.0% 10.2%Property taxes, insurance and other expense 17,321 7.0% 18,702 23.1% -7.4% 37,009 9.1% 38,297 12.0% -3.4%General and administrative expense 8,435 3.4% 6,025 7.4% 40.0% 16,554 4.1% 15,548 4.9% 6.5% Loss on impairment of depreciable real estate assets - 4,382 n/a 10,754 4,382 145.4%Depreciation and amortization expense 46,386 49,897 -7.0% 95,096 99,419 -4.3%Gain (loss) on sale of real estate (864) (54) n/a 3,620 8,785 -58.8%Interest and other expense, net 18,618 18,386 1.3% 37,131 33,952 9.4%Income tax expense 87 58 50.0% 195 204 -4.4% Net income (loss) 20,283 (78,243) n/a (26,152) (81,012) 67.7%Adjusted hotel EBITDA (1) 94,814 704 n/a 130,241 64,001 103.5% Number of hotels owned at end of period 232 233 -0.4% 232 233 -0.4%ADR $ 120.56 $ 100.76 19.7% $ 111.19 $ 122.48 -9.2%Occupancy 70.7% 28.2% 150.7% 63.2% 44.5% 42.0%RevPAR $ 85.28 $ 28.44 199.9% $ 70.23 $ 54.55 28.7% (1) See reconciliation of Adjusted Hotel EBITDA to net income (loss) in “Non-GAAP Financial Measures” below.
24
Index
The following table highlights the quarterly impact of COVID-19 on the Company’s ADR, Occupancy, RevPAR, net income (loss) and adjusted hotel earningsbefore interest, income taxes, depreciation and amortization for real estate (“Adjusted Hotel EBITDA”) during the last five quarters (in thousands except statistical data):
(1) See reconciliation of Adjusted Hotel EBITDA to net income (loss) in “Non-GAAP Financial Measures” below.
Beginning in March 2020, COVID-19 caused widespread cancellations of both business and leisure travel throughout the U.S., resulting in significant decreasesin RevPAR throughout the Company’s hotel portfolio and the hospitality industry as a whole. With the overall uncertainty of the longevity of COVID-19 in the U.S. andthe resulting economic decline, it is difficult to project the depth and duration of revenue declines for the industry and Company; however, the Company currentlyexpects declines in revenue and operating results as compared to 2019 to continue throughout the remainder of 2021 and potentially into future years. While the Companyexperienced its most significant decline in operating results during the second quarter of 2020 as compared to previous quarters, occupancy and RevPAR have sinceshown improvement, with average occupancy reaching 70.7% by the second quarter of 2021, resulting in the strongest operating results since the onset of thepandemic. Although the Company expects continued recovery in rate and occupancy, future revenues and operating results could be negatively impacted by, among otherthings, historical seasonal trends, an increase in COVID-19 cases, state and local governments and businesses reverting back to tighter mitigation restrictions,deterioration of consumer sentiment or significant inflationary pressures.
Comparable Hotels Operating Results
The following table reflects certain operating statistics for the Company’s 212 hotels owned and held for use as of June 30, 2021 (“Comparable Hotels”). TheCompany defines metrics from Comparable Hotels as results generated by the 212 hotels owned and held for use as of the end of the reporting period, and excludes thehotels held for sale. For the hotels acquired during the current reporting period and prior year, the Company has included, as applicable, results of those hotels for periodsprior to the Company’s ownership using information provided by the properties’ prior owners at the time of acquisition and not adjusted by the Company. Thisinformation has not been audited, either for the periods owned or prior to ownership by the Company. For dispositions and assets held for sale, results have been excludedfor the Company’s period of ownership. Three Months Ended June 30, Six Months Ended June 30,
The following table reflects certain operating statistics for the 207 hotels owned and held for use by the Company as of January 1, 2020 and during the entirety ofthe reporting periods being compared (“Same Store Hotels”). This information has not been audited. Three Months Ended June 30, Six Months Ended June 30,
As discussed above, hotel performance is impacted by many factors, including the economic conditions in the U.S. as well as each individual locality. COVID-19has been negatively affecting the U.S. hotel industry since March 2020. The Company’s revenue and operating results improved during the three and six months endedJune 30, 2021 compared to the three and six months ended June 30, 2020, which is consistent with the overall lodging industry. However, as a result of COVID-19, theCompany’s revenue and operating results have declined as compared to 2019 and the Company expects these declines relative to 2019 levels to continue
25
Index throughout the remainder of 2021. The Company can give no assurances of the amount or period of decline due to the uncertainty regarding the duration and long-termimpact of as well as governmental and consumer response to, COVID-19.
Revenues
The Company’s principal source of revenue is hotel revenue consisting of room, food and beverage, and other related revenue. For the three months endedJune 30, 2021 and 2020, the Company had total revenue of $247.4 million and $81.1 million, respectively. For the six months ended June 30, 2021 and 2020, theCompany had total revenue of $406.1 million and $319.1 million, respectively. For the three months ended June 30, 2021 and 2020, respectively, Comparable Hotelsachieved combined average occupancy of 70.8% and 28.2%, ADR of $121.80 and $101.51 and RevPAR of $86.22 and $28.61. For the six months ended June 30, 2021and 2020, respectively, Comparable Hotels achieved combined average occupancy of 63.3% and 44.5%, ADR of $112.20 and $123.89 and RevPAR of $70.97 and$55.14. ADR is calculated as room revenue divided by the number of rooms sold, and RevPAR is calculated as occupancy multiplied by ADR.
Compared to the same period in 2020, during the three months ended June 30, 2021, the Company experienced increases in ADR and occupancy, resulting in anincrease of 201.4% in RevPAR for Comparable Hotels. As compared to the second quarter of 2019 (pre-COVID-19), Comparable Hotels RevPAR for the second quarterof 2021 decreased by 26.8% as a result of reductions in rate and occupancy. During March 2020, the hotel industry and the Company began to see a significant decreasein occupancy as both mandated and voluntary restrictions on travel were implemented throughout the U.S. For Comparable Hotels, average occupancy declined to 28.2%for the second quarter of 2020 before improving over subsequent quarters to 70.8% in the second quarter of 2021 driven predominately by increased leisure demand as aresult of improved consumer confidence in travel and the lifting of some COVID-19 mitigation restrictions, but also by increased demand from a wide variety of demandgenerators such as government, healthcare, construction, disaster recovery, insurance, athletics, education and local and regional business-related travel. Revenuerecovery in the second quarter of 2021 was led by leisure transient and group demand, with increased demand from small corporate and government business. Suburbanmarkets continued to see stronger demand than urban markets. Throughout the hospitality industry, upscale and upper mid-scale chain scales have outperformed luxuryand upper upscale and suburban locations have outperformed urban locations. Occupancy increased throughout the second quarter of 2021 and the trend continued intoJuly, with estimated occupancy of approximately 75% for the month. The Company expects this trend to gradually continue, however, future revenues could benegatively impacted by, among other things, historical seasonal trends, an increase in COVID-19 cases, state and local governments and businesses reverting back totighter mitigation restrictions or deterioration of consumer sentiment.
Hotel Operating Expense
The Company, its management companies and the brands the Company’s hotels are franchised with have all aggressively worked to mitigate the costs and uses ofcash associated with operating the hotels in a low-occupancy environment and are thoughtfully working to position the hotels to adapt to the changes that may occur toguest preferences in the future. The impact has varied and will continue to vary by market and hotel. With the support of its brands and third-party managementcompanies, the Company will continue to evaluate and implement adjustments to the hotel operating model in response to continued changes in the operatingenvironment and guest preferences.
Hotel operating expense consists of direct room operating expense, hotel administrative expense, sales and marketing expense, utilities expense, repair andmaintenance expense, franchise fees and management fees. Hotel operating expense for the three months ended June 30, 2021 and 2020 totaled $135.4 million and $61.8million, respectively, or 54.7% and 76.2% of total revenue for the respective periods. Hotel operating expense for the six months ended June 30, 2021 and 2020 totaled$239.2 million and $217.1 million, respectively, or 58.9% and 68.0% of total revenue for the respective periods. Comparatively, prior to COVID-19, hotel operatingexpense was 54.9% and 56.2%, respectively, of total revenue for the three and six months ended June 30, 2019. Included in hotel operating expense for the six monthsended June 30, 2021 are an additional $1.8 million of utility costs resulting from extraordinary rate increases and fees assessed at some of the Company’s hotels in Texasas a result of winter and ice storms in the first quarter of 2021. The Company has worked and will continue to work with its management companies to optimize staffingmodels, and adjust food and beverage offerings and other amenities, among other efficiency initiatives, to mitigate the impact of revenue declines on its results ofoperations. For example, the Company has reduced service and amenity offerings as allowed by the relaxation of certain brand standards and the Company alsosuccessfully reduced rates under various service contracts. Although certain operating costs of a hotel are more fixed in nature, such as base utility and maintenance costs,the Company has worked and will continue to work to reduce all non-essential costs including service contracts, utilities in areas not utilized and certain maintenancecosts. However, the Company may continue to see ongoing cost increases related to the supplying of personal protective equipment for employees and guests as well asincreased sanitation and other measures. Additionally, as is typical in an economic recovery, the Company has begun to experience increases in the cost of labor, andexpects continued pressure on wages as it competes with other employers for hourly labor as unemployment rates remain low.
26
Index
Property Taxes, Insurance and Other Expense
Property taxes, insurance, and other expense for the three months ended June 30, 2021 and 2020 was $17.3 million and $18.7 million, respectively, or 7.0% and23.1% of total revenue for the respective periods. For the six months ended June 30, 2021 and 2020, property taxes, insurance, and other expense totaled $37.0 millionand $38.3 million, respectively, or 9.1% and 12.0% of total revenue for the respective periods. Prior to COVID-19, property taxes, insurance and other expense for thethree and six months ended June 30, 2019 totaled $19.2 million and $38.9 million, respectively, or 5.6% and 6.0% of total revenue for the respective periods. Thedecrease from 2019 and 2020 to 2021 was primarily due to decreases in property taxes in certain localities. Although the Company will continue to aggressively appealassessments and monitor locality guidance as a result of COVID-19, it does not currently anticipate further significant decreases in property taxes in 2021 as compared to2020. Additionally, the Company has experienced increases in premiums on its property insurance coverage.
General and Administrative Expense
General and administrative expense for the three months ended June 30, 2021 and 2020 was $8.4 million and $6.0 million, respectively, or 3.4% and 7.4% of totalrevenue for the respective periods. For the six months ended June 30, 2021 and 2020, general and administrative expense was $16.6 million and $15.5 million,respectively, or 4.1% and 4.9% of total revenue for the respective periods. The principal components of general and administrative expense are payroll and related benefitcosts, legal fees, accounting fees and reporting expenses. General and administrative expense for the six months ended June 30, 2020 included the accrual ofapproximately $2.5 million in separation benefits awarded in connection with the retirements of the Company’s former Chief Operating Officer and former ChiefFinancial Officer on March 31, 2020. Excluding the separation benefit accrual, general and administrative expense increased by approximately $3.5 million for the sixmonths ended June 30, 2021 compared to the six months ended June 30, 2020 primarily due to increased accruals for incentive compensation related to anticipated highershareholder return performance in 2021 as compared to 2020.
Loss on Impairment of Depreciable Real Estate Assets
Loss on impairment of depreciable real estate assets was $10.8 million for the six months ended June 30, 2021, consisting of impairment losses of $1.3 million forthe Overland Park, Kansas SpringHill Suites and $9.4 million for four hotel properties identified by the Company in the first quarter of 2021 for potential sale. Loss onimpairment of depreciable real estate assets was $4.4 million for both the three and six months ended June 30, 2020, consisting of an impairment charge for the Memphis,Tennessee Homewood Suites in 2020. See Note 3 titled “Assets Held for Sale and Dispositions” in the Company’s Unaudited Consolidated Financial Statements andNotes thereto, appearing elsewhere in this Quarterly Report on Form 10-Q, for additional information concerning these impairment losses.
Depreciation and Amortization Expense
Depreciation and amortization expense for the three months ended June 30, 2021 and 2020 was $46.4 million and $49.9 million, respectively. For the six monthsended June 30, 2021 and 2020, depreciation and amortization expense was $95.1 million and $99.4 million, respectively. Depreciation and amortization expenseprimarily represents expense of the Company’s hotel buildings and related improvements, and associated personal property (furniture, fixtures, and equipment) for therespective periods owned. The decreases of approximately $3.5 million and $4.3 million, respectively, for the three and six months ended June 30, 2021 and 2020 wereprimarily due to the hotel dispositions completed throughout 2020 and the first six months of 2021, partially offset by acquisitions and limited renovation activity.
Interest and Other Expense, net
Interest and other expense, net for the three months ended June 30, 2021 and 2020 was $18.6 million and $18.4 million, respectively. For the six months endedJune 30, 2021 and 2020, interest and other expense, net was $37.1 million and $34.0 million, respectively. Interest and other expense, net for the six months ended June30, 2020 is net of approximately $0.8 million of interest capitalized associated with renovation projects. Additionally, interest and other expense, net for the three monthsended June 30, 2021 and 2020 includes approximately $2.9 million and $2.8 million, respectively, of interest recorded on the Company’s finance lease liabilities. For thesix months ended June 30, 2021 and 2020, interest and other expense, net includes approximately $5.8 million and $5.7 million, respectively, of interest recorded on theCompany’s finance lease liabilities.
Interest expense related to the Company’s debt instruments increased in the six months ended June 30, 2021 as compared to the six months ended June 30, 2020as a result of increased interest rates on the Company’s unsecured credit facilities associated with the amendments to obtain covenant waivers. However, the Companyanticipates interest expense to be lower for the remainder of 2021 compared to the same period of 2020 due to reduced average borrowings and lower interest rates for thesecond half of the year; the reduction in average borrowings has been and is expected to be primarily due to paydowns on the revolving credit facility resulting from thesale of hotel properties, proceeds from the sale of common shares under the ATM program and increased cash flows from improved operations, while interest rates areexpected to decrease on the Company’s unsecured credit facilities as a result of exiting the Extended Covenant Waiver Period (as discussed below under “Liquidity andCapital Resources”) for the remainder of the year.
27
Index
See Note 4 titled “Debt” in the Company’s Unaudited Consolidated Financial Statements and Notes thereto, appearing elsewhere in this Quarterly Report on Form 10-Q,for additional discussion of the Company’s amended unsecured credit facilities.
Non-GAAP Financial Measures
The Company considers the following non-GAAP financial measures useful to investors as key supplemental measures of its operating performance: Funds fromOperations (“FFO”), Modified Funds from Operations (“MFFO”), Earnings before Interest, Income Taxes, Depreciation and Amortization (“EBITDA”), Earnings BeforeInterest, Income Taxes, Depreciation and Amortization for Real Estate (“EBITDAre”), Adjusted EBITDAre and Adjusted Hotel EBITDA. These non-GAAP financialmeasures should be considered along with, but not as alternatives to, net income (loss), cash flow from operations or any other operating GAAP measure. FFO, MFFO,EBITDA, EBITDAre, Adjusted EBITDAre and Adjusted Hotel EBITDA are not necessarily indicative of funds available to fund the Company’s cash needs, including itsability to make cash distributions. Although FFO, MFFO, EBITDA, EBITDAre, Adjusted EBITDAre, and Adjusted Hotel EBITDA as calculated by the Company, maynot be comparable to FFO, MFFO, EBITDA, EBITDAre, Adjusted EBITDAre and Adjusted Hotel EBITDA as reported by other companies that do not define such termsexactly as the Company defines such terms, the Company believes these supplemental measures are useful to investors when comparing the Company’s results betweenperiods and with other REITs.
FFO and MFFO
The Company calculates and presents FFO in accordance with standards established by the National Association of Real Estate Investment Trusts (“Nareit”),which defines FFO as net income (loss) (computed in accordance with GAAP), excluding gains and losses from the sale of certain real estate assets (including gains andlosses from change in control), extraordinary items as defined by GAAP, and the cumulative effect of changes in accounting principles, plus real estate relateddepreciation, amortization and impairments, and adjustments for unconsolidated affiliates. Historical cost accounting for real estate assets implicitly assumes that thevalue of real estate assets diminishes predictably over time. Since real estate values instead have historically risen or fallen with market conditions, most real estateindustry investors consider FFO to be helpful in evaluating a real estate company’s operations. The Company further believes that by excluding the effects of these items,FFO is useful to investors in comparing its operating performance between periods and between REITs that report FFO using the Nareit definition. FFO as presented bythe Company is applicable only to its common shareholders, but does not represent an amount that accrues directly to common shareholders.
The Company calculates MFFO by further adjusting FFO for the exclusion of amortization of finance ground lease assets, amortization of favorable andunfavorable operating leases, net and non-cash straight-line operating ground lease expense, as these expenses do not reflect the underlying performance of the relatedhotels. The Company presents MFFO when evaluating its performance because it believes that it provides further useful supplemental information to investors regardingits ongoing operating performance.
The following table reconciles the Company’s GAAP net income (loss) to FFO and MFFO for the three and six months ended June 30, 2021 and 2020 (inthousands):
Three Months Ended
June 30, Six Months Ended
June 30, 2021 2020 2021 2020 Net income (loss) $ 20,283 $ (78,243) $ (26,152) $ (81,012)Depreciation of real estate owned 44,764 48,044 91,852 95,712 (Gain) loss on sale of real estate 864 54 (3,620) (8,785)Loss on impairment of depreciable real estate assets - 4,382 10,754 4,382
Funds from operations 65,911 (25,763) 72,834 10,297 Amortization of finance ground lease assets 1,618 1,602 3,235 3,204 Amortization of favorable and unfavorable operating leases, net 98 101 196 202 Non-cash straight-line operating ground lease expense 43 44 87 91
EBITDA, EBITDAre, Adjusted EBITDAre and Adjusted Hotel EBITDA
EBITDA is a commonly used measure of performance in many industries and is defined as net income (loss) excluding interest, income taxes, depreciation andamortization. The Company believes EBITDA is useful to investors because it helps the Company and its investors evaluate the ongoing operating performance of theCompany by removing the impact of its capital structure (primarily interest expense) and its asset base (primarily depreciation and amortization). In addition, certaincovenants included in the agreements governing the Company’s indebtedness use EBITDA, as defined in the specific credit agreement, as a measure of financialcompliance.
28
Index
In addition to EBITDA, the Company also calculates and presents EBITDAre in accordance with standards established by Nareit, which defines EBITDAre asEBITDA, excluding gains and losses from the sale of certain real estate assets (including gains and losses from change in control), plus real estate related impairments,and adjustments to reflect the entity’s share of EBITDAre of unconsolidated affiliates. The Company presents EBITDAre because it believes that it provides furtheruseful information to investors in comparing its operating performance between periods and between REITs that report EBITDAre using the Nareit definition.
The Company also considers the exclusion of non-cash straight-line operating ground lease expense from EBITDAre useful, as this expense does not reflect theunderlying performance of the related hotels (Adjusted EBITDAre).
The Company further excludes actual corporate-level general and administrative expense for the Company from Adjusted EBITDAre (Adjusted Hotel EBITDA)to isolate property-level operational performance over which the Company’s hotel operators have direct control. The Company believes Adjusted Hotel EBITDAprovides useful supplemental information to investors regarding operating performance and is used by management to measure the performance of the Company’s hotelsand effectiveness of the operators of the hotels.
The following table reconciles the Company’s GAAP net income (loss) to EBITDA, EBITDAre, Adjusted EBITDAre and Adjusted Hotel EBITDA for the threeand six months ended June 30, 2021 and 2020 (in thousands):
Three Months Ended
June 30, Six Months Ended
June 30, 2021 2020 2021 2020 Net income (loss) $ 20,283 $ (78,243) $ (26,152) $ (81,012)Depreciation and amortization 46,386 49,897 95,096 99,419 Amortization of favorable and unfavorable operating leases, net 98 101 196 202 Interest and other expense, net 18,618 18,386 37,131 33,952 Income tax expense 87 58 195 204
EBITDA 85,472 (9,801) 106,466 52,765 (Gain) loss on sale of real estate 864 54 (3,620) (8,785)Loss on impairment of depreciable real estate assets - 4,382 10,754 4,382
The following table reconciles the Company’s GAAP net income (loss) to EBITDA, EBITDAre, Adjusted EBITDAre and Adjusted Hotel EBITDA by quarter forthe last five quarters (in thousands): 2nd Quarter 3rd Quarter 4th Quarter 1st Quarter 2nd Quarter 2020 2020 2020 2021 2021 Net income (loss) $ (78,243) $ (40,948) $ (51,247) $ (46,435) $ 20,283 Depreciation and amortization 49,897 50,171 50,196 48,710 46,386 Amortization of favorable and unfavorable operating leases, net 101 103 137 98 98 Interest and other expense, net 18,386 18,531 18,352 18,513 18,618 Income tax expense 58 61 67 108 87
EBITDA (9,801) 27,918 17,505 20,994 85,472 (Gain) loss on sale of real estate 54 - (2,069) (4,484) 864 Loss on impairment of depreciable real estate assets 4,382 - 715 10,754 -
As of June 30, 2021, the Company owned 232 hotels with an aggregate of 29,753 rooms located in 35 states, including 20 hotels with 2,133 rooms classified asheld for sale as detailed in Note 3 titled “Assets Held for Sale and Dispositions” in the Company’s Unaudited Consolidated Financial Statements and Notes thereto,appearing elsewhere in this Quarterly Report on Form 10-Q, which were sold to an unrelated party in July 2021. The following tables summarize the number of hotelsand rooms by brand and by state:
Number of Hotels and Guest Rooms by Brand Number of Number of
The following table summarizes the location, brand, manager, date acquired or completed and number of rooms for each of the 232 hotels the Company owned asof June 30, 2021.
City State Brand Manager
DateAcquired orCompleted Rooms
Anchorage AK Embassy Suites Stonebridge 4/30/2010 169 Anchorage AK Home2 Suites Stonebridge 12/1/2017 135 Auburn AL Hilton Garden Inn LBA 3/1/2014 101 Birmingham AL Courtyard LBA 3/1/2014 84 Birmingham AL Hilton Garden Inn LBA 9/12/2017 104 Birmingham AL Home2 Suites LBA 9/12/2017 106 Birmingham AL Homewood Suites McKibbon 3/1/2014 95 Dothan AL Hilton Garden Inn LBA 6/1/2009 104 Dothan AL Residence Inn LBA 3/1/2014 84 Huntsville AL Hampton LBA 9/1/2016 98 Huntsville AL Hilton Garden Inn LBA 3/1/2014 101 Huntsville AL Home2 Suites LBA 9/1/2016 77 Huntsville AL Homewood Suites LBA 3/1/2014 107 Mobile AL Hampton McKibbon 9/1/2016 101 Montgomery AL Hilton Garden Inn LBA 3/1/2014 97 (1)Montgomery AL Homewood Suites LBA 3/1/2014 91 (1)Prattville AL Courtyard LBA 3/1/2014 84 Rogers AR Hampton Raymond 8/31/2010 122 Rogers AR Homewood Suites Raymond 4/30/2010 126 Rogers AR Residence Inn Raymond 3/1/2014 88 (1)Chandler AZ Courtyard North Central 11/2/2010 150 Chandler AZ Fairfield North Central 11/2/2010 110 Phoenix AZ Courtyard North Central 11/2/2010 164 Phoenix AZ Courtyard North Central 9/1/2016 127 (1)Phoenix AZ Hampton North Central 9/1/2016 125 Phoenix AZ Hampton North Central 5/2/2018 210 Phoenix AZ Homewood Suites North Central 9/1/2016 134 Phoenix AZ Residence Inn North Central 11/2/2010 129 Scottsdale AZ Hilton Garden Inn North Central 9/1/2016 122 Tempe AZ Hyatt House Crestline 8/13/2020 105 Tempe AZ Hyatt Place Crestline 8/13/2020 154 Tucson AZ Hilton Garden Inn Western 7/31/2008 125 Tucson AZ Residence Inn Western 3/1/2014 124 Tucson AZ TownePlace Suites Western 10/6/2011 124 Agoura Hills CA Homewood Suites Dimension 3/1/2014 125 Burbank CA Courtyard Huntington 8/11/2015 190 Burbank CA Residence Inn Marriott 3/1/2014 166 Burbank CA SpringHill Suites Marriott 7/13/2015 170 Clovis CA Hampton Dimension 7/31/2009 86 Clovis CA Homewood Suites Dimension 2/2/2010 83 Cypress CA Courtyard Dimension 3/1/2014 180 Cypress CA Hampton Dimension 6/29/2015 110 Oceanside CA Courtyard Marriott 9/1/2016 142 Oceanside CA Residence Inn Marriott 3/1/2014 125 Rancho Bernardo/San Diego CA Courtyard InnVentures 3/1/2014 210 Sacramento CA Hilton Garden Inn Dimension 3/1/2014 153 San Bernardino CA Residence Inn InnVentures 2/16/2011 95 San Diego CA Courtyard Huntington 9/1/2015 245 San Diego CA Hampton Dimension 3/1/2014 177 San Diego CA Hilton Garden Inn InnVentures 3/1/2014 200
32
Index
City State Brand Manager
DateAcquired orCompleted Rooms
San Diego CA Residence Inn Dimension 3/1/2014 121 San Jose CA Homewood Suites Dimension 3/1/2014 140 San Juan Capistrano CA Residence Inn Marriott 9/1/2016 130 Santa Ana CA Courtyard Dimension 5/23/2011 155 Santa Clarita CA Courtyard Dimension 9/24/2008 140 Santa Clarita CA Fairfield Dimension 10/29/2008 66 Santa Clarita CA Hampton Dimension 10/29/2008 128 Santa Clarita CA Residence Inn Dimension 10/29/2008 90 Tustin CA Fairfield Marriott 9/1/2016 145 Tustin CA Residence Inn Marriott 9/1/2016 149 Colorado Springs CO Hampton Chartwell 9/1/2016 101 Denver CO Hilton Garden Inn Stonebridge 9/1/2016 221 Highlands Ranch CO Hilton Garden Inn Dimension 3/1/2014 128 Highlands Ranch CO Residence Inn Dimension 3/1/2014 117 Boca Raton FL Hilton Garden Inn Dimension 9/1/2016 149 Cape Canaveral FL Hampton LBA 4/30/2020 116 Cape Canaveral FL Homewood Suites LBA 9/1/2016 153 Cape Canaveral FL Home2 Suites LBA 4/30/2020 108 Fort Lauderdale FL Hampton Dimension 6/23/2015 156 Fort Lauderdale FL Residence Inn LBA 9/1/2016 156 Gainesville FL Hilton Garden Inn McKibbon 9/1/2016 104 Gainesville FL Homewood Suites McKibbon 9/1/2016 103 Jacksonville FL Homewood Suites McKibbon 3/1/2014 119 Jacksonville FL Hyatt Place Crestline 12/7/2018 127 Lakeland FL Courtyard LBA 3/1/2014 78 (1)Miami FL Courtyard Dimension 3/1/2014 118 Miami FL Hampton White Lodging 4/9/2010 121 Miami FL Homewood Suites Dimension 3/1/2014 162 Orlando FL Fairfield Marriott 7/1/2009 200 Orlando FL Home2 Suites LBA 3/19/2019 128 Orlando FL SpringHill Suites Marriott 7/1/2009 200 Panama City FL Hampton LBA 3/12/2009 95 Panama City FL TownePlace Suites LBA 1/19/2010 103 Pensacola FL TownePlace Suites McKibbon 9/1/2016 97 Tallahassee FL Fairfield LBA 9/1/2016 97 Tallahassee FL Hilton Garden Inn LBA 3/1/2014 85 Tampa FL Embassy Suites White Lodging 11/2/2010 147 Albany GA Fairfield LBA 1/14/2010 87 (1)Atlanta/Downtown GA Hampton McKibbon 2/5/2018 119 Atlanta/Perimeter Dunwoody GA Hampton LBA 6/28/2018 132 Atlanta GA Home2 Suites McKibbon 7/1/2016 128 Macon GA Hilton Garden Inn LBA 3/1/2014 101 Savannah GA Hilton Garden Inn Newport 3/1/2014 105 Cedar Rapids IA Hampton Aimbridge 9/1/2016 103 Cedar Rapids IA Homewood Suites Aimbridge 9/1/2016 95 Davenport IA Hampton Aimbridge 9/1/2016 103 Boise ID Hampton Raymond 4/30/2010 186 Des Plaines IL Hilton Garden Inn Raymond 9/1/2016 252 Hoffman Estates IL Hilton Garden Inn White Lodging 9/1/2016 184 Mettawa IL Hilton Garden Inn White Lodging 11/2/2010 170 Mettawa IL Residence Inn White Lodging 11/2/2010 130
33
Index
City State Brand Manager
DateAcquired orCompleted Rooms
Rosemont IL Hampton Raymond 9/1/2016 158 Schaumburg IL Hilton Garden Inn White Lodging 11/2/2010 166 (1)Skokie IL Hampton Raymond 9/1/2016 225 Warrenville IL Hilton Garden Inn White Lodging 11/2/2010 135 Indianapolis IN SpringHill Suites White Lodging 11/2/2010 130 Merrillville IN Hilton Garden Inn White Lodging 9/1/2016 124 Mishawaka IN Residence Inn White Lodging 11/2/2010 106 South Bend IN Fairfield White Lodging 9/1/2016 119 Overland Park KS Fairfield Raymond 3/1/2014 110 Overland Park KS Residence Inn Raymond 3/1/2014 120 Wichita KS Courtyard Aimbridge 3/1/2014 90 Lafayette LA Hilton Garden Inn LBA 7/30/2010 153 Lafayette LA SpringHill Suites LBA 6/23/2011 103 New Orleans LA Homewood Suites Dimension 3/1/2014 166 Andover MA SpringHill Suites Marriott 11/5/2010 136 (1)Marlborough MA Residence Inn Crestline 3/1/2014 112 Westford MA Hampton Crestline 3/1/2014 110 Westford MA Residence Inn Crestline 3/1/2014 108 Annapolis MD Hilton Garden Inn Crestline 3/1/2014 126 Silver Spring MD Hilton Garden Inn Crestline 7/30/2010 107 Portland ME Residence Inn Crestline 10/13/2017 179 Novi MI Hilton Garden Inn White Lodging 11/2/2010 148 Maple Grove MN Hilton Garden Inn North Central 9/1/2016 121 Rochester MN Hampton Raymond 8/3/2009 124 St. Paul MN Hampton Raymond 3/4/2019 160 Kansas City MO Hampton Raymond 8/31/2010 122 Kansas City MO Residence Inn Raymond 3/1/2014 106 St. Louis MO Hampton Raymond 8/31/2010 190 St. Louis MO Hampton Raymond 4/30/2010 126 Hattiesburg MS Courtyard LBA 3/1/2014 84 Hattiesburg MS Residence Inn LBA 12/11/2008 84 Carolina Beach NC Courtyard Crestline 3/1/2014 144 Charlotte NC Fairfield Newport 9/1/2016 94 Durham NC Homewood Suites McKibbon 12/4/2008 122 Fayetteville NC Home2 Suites LBA 2/3/2011 118 Fayetteville NC Residence Inn LBA 3/1/2014 92 (1)Greensboro NC SpringHill Suites Newport 3/1/2014 82 Jacksonville NC Home2 Suites LBA 9/1/2016 105 Wilmington NC Fairfield Crestline 3/1/2014 122 Winston-Salem NC Hampton McKibbon 9/1/2016 94 Omaha NE Courtyard Marriott 3/1/2014 181 Omaha NE Hampton White Lodging 9/1/2016 139 Omaha NE Hilton Garden Inn White Lodging 9/1/2016 178 Omaha NE Homewood Suites White Lodging 9/1/2016 123 Cranford NJ Homewood Suites Dimension 3/1/2014 108 Mahwah NJ Homewood Suites Dimension 3/1/2014 110 Mount Laurel NJ Homewood Suites Newport 1/11/2011 118 Somerset NJ Courtyard Newport 3/1/2014 162 West Orange NJ Courtyard Newport 1/11/2011 131 Islip/Ronkonkoma NY Hilton Garden Inn Crestline 3/1/2014 166 New York NY Independent Highgate 3/1/2014 208
34
Index
City State Brand Manager
DateAcquired orCompleted Rooms
Syracuse NY Courtyard Crestline 10/16/2015 102 Syracuse NY Residence Inn Crestline 10/16/2015 78 Mason OH Hilton Garden Inn Raymond 9/1/2016 110 Twinsburg OH Hilton Garden Inn Aimbridge 10/7/2008 142 Oklahoma City OK Hampton Raymond 5/28/2010 200 Oklahoma City OK Hilton Garden Inn Raymond 9/1/2016 155 Oklahoma City OK Homewood Suites Raymond 9/1/2016 100 Oklahoma City (West) OK Homewood Suites Chartwell 9/1/2016 90 Collegeville/Philadelphia PA Courtyard Newport 11/15/2010 132 Malvern/Philadelphia PA Courtyard Newport 11/30/2010 127 Pittsburgh PA Hampton Newport 12/31/2008 132 Charleston SC Home2 Suites LBA 9/1/2016 122 Columbia SC Hilton Garden Inn Newport 3/1/2014 143 Columbia SC TownePlace Suites Newport 9/1/2016 91 Greenville SC Residence Inn McKibbon 3/1/2014 78 (1)Hilton Head SC Hilton Garden Inn McKibbon 3/1/2014 104 Chattanooga TN Homewood Suites LBA 3/1/2014 76 Franklin TN Courtyard Chartwell 9/1/2016 126 Franklin TN Residence Inn Chartwell 9/1/2016 124 Jackson TN Hampton Newport 12/30/2008 85 (1)Johnson City TN Courtyard LBA 9/25/2009 90 (1)Knoxville TN Homewood Suites McKibbon 9/1/2016 103 Knoxville TN SpringHill Suites McKibbon 9/1/2016 103 Knoxville TN TownePlace Suites McKibbon 9/1/2016 97 Memphis TN Hampton Crestline 2/5/2018 144 Nashville TN Hilton Garden Inn Dimension 9/30/2010 194 Nashville TN Home2 Suites Dimension 5/31/2012 119 Nashville TN TownePlace Suites LBA 9/1/2016 101 Addison TX SpringHill Suites Marriott 3/1/2014 159 Allen TX Hampton Aimbridge 9/26/2008 103 (1)Allen TX Hilton Garden Inn Aimbridge 10/31/2008 150 (1)Arlington TX Hampton Western 12/1/2010 98 Austin TX Courtyard White Lodging 11/2/2010 145 Austin TX Fairfield White Lodging 11/2/2010 150 Austin TX Hampton Dimension 4/14/2009 124 Austin TX Hilton Garden Inn White Lodging 11/2/2010 117 Austin TX Homewood Suites Dimension 4/14/2009 97 Austin/Round Rock TX Hampton Dimension 3/6/2009 94 Austin/Round Rock TX Homewood Suites Dimension 9/1/2016 115 Beaumont TX Residence Inn Western 10/29/2008 133 (1)Burleson/Fort Worth TX Hampton LBA 10/7/2014 88 (1)Dallas TX Homewood Suites Western 9/1/2016 130 Denton TX Homewood Suites Chartwell 9/1/2016 107 El Paso TX Hilton Garden Inn Western 12/19/2011 145 (1)El Paso TX Homewood Suites Western 3/1/2014 114 Fort Worth TX Courtyard LBA 2/2/2017 124 Fort Worth TX TownePlace Suites Western 7/19/2010 140 Frisco TX Hilton Garden Inn Western 12/31/2008 102 Grapevine TX Hilton Garden Inn Western 9/24/2010 110 Houston TX Courtyard LBA 9/1/2016 124 Houston TX Marriott Western 1/8/2010 206
35
Index
City State Brand Manager
DateAcquired orCompleted Rooms
Houston TX Residence Inn Western 3/1/2014 129 Houston TX Residence Inn Western 9/1/2016 120 Irving TX Homewood Suites Western 12/29/2010 77 (1)Lewisville TX Hilton Garden Inn Aimbridge 10/16/2008 165 San Antonio TX TownePlace Suites Western 3/1/2014 106 Shenandoah TX Courtyard LBA 9/1/2016 124 Stafford TX Homewood Suites Western 3/1/2014 78 Texarkana TX Hampton Aimbridge 1/31/2011 81 Provo UT Residence Inn Dimension 3/1/2014 114 Salt Lake City UT Residence Inn Huntington 10/20/2017 136 Salt Lake City UT SpringHill Suites White Lodging 11/2/2010 143 Alexandria VA Courtyard Marriott 3/1/2014 178 Alexandria VA SpringHill Suites Marriott 3/28/2011 155 Charlottesville VA Courtyard Crestline 3/1/2014 139 Manassas VA Residence Inn Crestline 2/16/2011 107 Richmond VA Independent Crestline 10/9/2019 55 Richmond VA Courtyard White Lodging 12/8/2014 135 Richmond VA Marriott White Lodging 3/1/2014 413 Richmond VA Residence Inn White Lodging 12/8/2014 75 Richmond VA SpringHill Suites McKibbon 9/1/2016 103 (1)Suffolk VA Courtyard Crestline 3/1/2014 92 Suffolk VA TownePlace Suites Crestline 3/1/2014 72 Virginia Beach VA Courtyard Crestline 3/1/2014 141 Virginia Beach VA Courtyard Crestline 3/1/2014 160 Kirkland WA Courtyard InnVentures 3/1/2014 150 Seattle WA Residence Inn InnVentures 3/1/2014 234 Tukwila WA Homewood Suites Dimension 3/1/2014 106 Vancouver WA SpringHill Suites InnVentures 3/1/2014 119 (1)Madison WI Hilton Garden Inn Raymond 2/18/2021 176
Total 29,753 (1) Hotel is classified as held for sale as of June 30, 2021 and was sold in July 2021. Related Parties
The Company has, and is expected to continue to engage in, transactions with related parties. These transactions cannot be construed to be at arm’s length and theresults of the Company’s operations may be different if these transactions were conducted with non-related parties. See Note 6 titled “Related Parties” in the Company’sUnaudited Consolidated Financial Statements and Notes thereto, appearing elsewhere in this Quarterly Report on Form 10-Q, for additional information concerning theCompany’s related party transactions.
Liquidity and Capital Resources
Capital Resources
The Company’s principal short term sources of liquidity are the operating cash flows generated from the Company’s properties and availability under itsrevolving credit facility. Periodically, the Company may receive proceeds from strategic additional secured and unsecured debt financing, dispositions of its hotelproperties (such as the sale of three hotels in the first half of 2021 for proceeds of approximately $24 million and the sale of 20 hotels in July 2021 for proceeds ofapproximately $211 million discussed above in “2021 Hotel Portfolio Activities”) and offerings of the Company’s common shares, including pursuant to the ATMProgram (as defined below).
As of June 30, 2021, the Company had $1.4 billion of total outstanding debt consisting of $450.7 million of mortgage debt and $952.0 million outstanding underits unsecured credit facilities, excluding unamortized debt issuance costs and fair value adjustments. As of June 30, 2021, the Company had available corporate cash onhand of approximately $2.9 million as well as unused borrowing capacity under its revolving credit facility of approximately $343 million. In the near term, the impact ofCOVID-19 on the global economy, including any sustained decline in the Company’s performance, may make it more difficult or costly for the Company to
36
Index
raise debt or equity capital to fund long-term liquidity requirements. The credit agreements governing the unsecured credit facilities contain mandatory prepaymentrequirements, customary affirmative and negative covenants and events of default. The credit agreements require that the Company comply with various covenants,which include, among others, a minimum tangible net worth, maximum debt limits, minimum interest and fixed charge coverage ratios and restrictions on certaininvestments.
As a result of COVID-19 and the associated disruption to the Company’s operating results, during the second quarter of 2020, the Company anticipated that itmay not be able to maintain compliance with certain of these covenants in future periods. On June 5, 2020, the Company entered into amendments to each of theunsecured credit facilities, which the Company again amended on March 1, 2021. The combined amendments suspended the testing for all but two of the Company’sexisting financial maintenance covenants under the unsecured credit facilities until the date the compliance certificate was required to be delivered for the fiscal quarterending June 30, 2022 (unless the Company elects an earlier date) (the “Extended Covenant Waiver Period”), suspended the testing for the Minimum Fixed ChargeCoverage Ratio and the Minimum Unsecured Interest Coverage Ratio until the compliance certificate was required to be delivered for the fiscal quarter ending March 31,2022 (unless the Company elects an earlier date) and provide for other restrictions. The amendments also modified the calculation of the existing financial covenants forthe four quarters subsequent to the end of the Extended Covenant Waiver Period to annualize calculated amounts to the extent the most recently ended fiscal quarter wasnot at least four fiscal quarters from the end of the Extended Covenant Waiver Period, and provided for a LIBOR floor under the credit agreements of 25 basis points forEurodollar Rate Loans and 1.25% for Base Rate Loans on the revolving credit facility, and any term loans under the credit agreements that were not hedged. The March2021 amendments also modified certain of the existing financial maintenance covenants to less restrictive levels upon exiting the Extended Covenant Waiver Period asfollows (capitalized terms are defined in the credit agreements):
● Maximum Consolidated Leverage Ratio of 8.50 to 1.00 for the first two fiscal quarters, 8.00 to 1.00 for two fiscal quarters, 7.50 to 1.00 for one fiscalquarter and then a ratio of 6.50 to 1.00 thereafter;
● Minimum Fixed Charge Coverage Ratio of 1.05 to 1.00 for the first fiscal quarter, 1.25 to 1.00 for one fiscal quarter and then a ratio of 1.50 to 1.00thereafter;
● Minimum Unsecured Interest Coverage Ratio of no less than 1.25 to 1.00 for one fiscal quarter, 1.50 to 1.00 for one fiscal quarter, 1.75 to 1.00 for onefiscal quarter and a ratio of 2.00 to 1.00 thereafter; and
● Maximum Unsecured Leverage Ratio of 65% for two fiscal quarters and 60% thereafter.
Except as otherwise set forth in the amendments, the terms of the credit agreements remain in effect.
The Company’s annualized results for the three months ended June 30, 2021 met the financial maintenance covenants based on the thresholds stipulated for thefirst fiscal quarter tested upon exiting the Extended Covenant Waiver Period as described in Note 4 titled “Debt” in the Company’s Unaudited Consolidated FinancialStatements and Notes thereto, appearing elsewhere in this Quarterly Report on Form 10-Q. As a result, in July 2021, the Company notified its lenders under its unsecuredcredit facilities that it had elected to exit the Extended Covenant Waiver Period effective on July 29, 2021. Upon exiting the Extended Covenant Waiver Period, theCompany is no longer subject to the restrictions described above regarding its investing and financing activities that were applicable during the Extended CovenantWaiver Period, including, but not limited to, limitations on the acquisition of property, payment of distributions to shareholders, limitations on capital expenditures anduse of proceeds from the sale of property or common shares of the Company. Those restrictions, including the restriction on payment of distributions to shareholders,were still in place throughout the second quarter of 2021. The Company anticipates continuing to meet the applicable financial maintenance covenants in future periods,although there can be no assurances it will be able to do so.
See Note 4 titled “Debt” in the Company’s Unaudited Consolidated Financial Statements and Notes thereto, appearing elsewhere in this Quarterly Report onForm 10-Q, for a description of the Company’s debt instruments as of June 30, 2021.
On August 12, 2020, the Company entered into an equity distribution agreement pursuant to which the Company may sell, from time to time, up to an aggregate
of $300 million of its common shares under an at-the-market offering program (the “ATM Program”). During the second quarter of 2021, the Company soldapproximately 4.7 million common shares under its ATM Program at a weighted-average market sales price of approximately $16.26 per common share and receivedaggregate gross proceeds of approximately $76.0 million and proceeds net of offering costs, which included $0.9 million of commissions, of approximately $75.1 million.The Company used the net proceeds from the sale of these shares to pay down borrowings on its revolving credit facility. As of June 30, 2021, approximately $224.0million remained available for issuance under the ATM program. The Company plans to use future net proceeds from the sale of these shares to continue to pay downborrowings on its revolving credit facility (if any). The Company plans to use the corresponding increased availability under the revolving credit facility for generalcorporate purposes which may include, among other things, acquisitions of additional properties, the repayment of other outstanding indebtedness, capital expenditures,improvement of properties in its portfolio and working capital. The Company may also use the net proceeds to acquire another REIT or other company that invests inincome producing properties.
37
Index
Capital Uses
The Company anticipates that cash flow from operations, availability under its credit facilities, additional borrowings and proceeds from hotel dispositions andequity offerings will be adequate to meet its anticipated liquidity requirements, including debt service, hotel acquisitions, hotel renovations, share repurchases, andrequired distributions to shareholders.
Distributions
To maintain its REIT status, the Company is required to distribute at least 90% of its ordinary income. As discussed in Note 4, titled “Debt” in the Company’sUnaudited Consolidated Financial Statements and Notes thereto, appearing elsewhere in this Quarterly Report on Form 10-Q, as a requirement under the amendments toits unsecured credit facilities, the Company was restricted in its ability to make distributions during the Extended Covenant Waiver Period, except for the payment of cashdistributions of $0.01 per common share per quarter or to the extent required to maintain REIT status. Distributions paid during the six months ended June 30, 2021totaled approximately $2.2 million or $0.01 per common share and were paid in one payment on April 15, 2021. For the same period, the Company’s net cash providedby operations was approximately $49.8 million. Additionally, in June 2021 the Company declared a distribution which totaled $2.3 million or $0.01 per common sharethat was paid on July 15, 2021. As discussed above, in July 2021, the Company notified its lenders under its unsecured credit facilities that it had elected to exit theExtended Covenant Waiver Period effective on July 29, 2021. As a result, upon exiting the Extended Covenant Waiver Period, the Company is no longer subject to therestrictions on distributions that were applicable during the Extended Covenant Waiver Period.
The Company, as it has done historically due to seasonality, may use its revolving credit facility to maintain the consistency of distributions, taking intoconsideration any acquisitions, dispositions, capital improvements and economic cycles. Any distribution will be subject to approval of the Company’s Board ofDirectors and there can be no assurance of the classification or duration of distributions at any particular distribution rate. The Board of Directors monitors theCompany’s distribution rate relative to the performance of its hotels on an ongoing basis and may make adjustments to the distribution rate as determined to be prudent inrelation to other cash requirements of the Company. If cash flow from operations and the revolving credit facility are not adequate to meet liquidity requirements, theCompany may utilize additional financing sources to make distributions. Although the Company has relatively low levels of debt, there can be no assurances it will besuccessful with this strategy and may need to reduce its distributions to minimum levels required to maintain its qualification as a real estate investment trust. If theCompany were unable to extend its maturing debt in future periods or if it were to default on its debt, it may be unable to make distributions.
Share Repurchases
In May 2021, the Company’s Board of Directors approved a one-year extension of its existing share repurchase program, authorizing share repurchases up to anaggregate of $345 million (the “Share Repurchase Program”). The Share Repurchase Program may be suspended or terminated at any time by the Company and will endin July 2022 if not terminated earlier. During the first three months of 2020, the Company purchased, under its Share Repurchase Program approximately 1.5 million ofits common shares at a weighted-average market purchase price of approximately $9.42 per common share, for an aggregate purchase price, including commissions, ofapproximately $14.3 million. The shares were repurchased under a written trading plan that provided for share repurchases in open market transactions and was intendedto comply with Rule 10b5-1 under the Securities Exchange Act of 1934, as amended. In March 2020 the Company terminated its written trading plan under the ShareRepurchase Program and has not repurchased any shares since that time. Repurchases under the Share Repurchase Program have been funded, and the Company intendsto fund any future purchases, with cash on hand or availability under its unsecured credit facilities subject to any applicable restrictions under the Company’s unsecuredcredit facilities. The timing of share repurchases and the number of common shares to be repurchased under the Share Repurchase Program will depend upon prevailingmarket conditions, regulatory requirements and other factors, including compliance with applicable credit facility covenants (if any).
Capital Improvements
The Company is committed to maintaining and enhancing each property’s competitive position in its market. The Company has invested in and plans to continueto reinvest in its hotels. Under certain loan and management agreements, the Company is required to place in escrow funds for the repair, replacement and refurbishing offurniture, fixtures, and equipment, based on a percentage of gross revenues, provided that such amount may be used for the Company’s capital expenditures with respectto the hotels. As of June 30, 2021, the Company held approximately $28.2 million in reserve related to these properties. During the six months ended June 30, 2021, theCompany invested approximately $4.9 million in capital expenditures and anticipates spending an additional $20-25 million during the remainder of 2021, whichincludes scheduled renovation projects for approximately five to ten properties. The Company does not currently have any existing or planned projects for new propertydevelopment.
Purchase Contract Commitments
As of July 31, 2021, the Company had separate outstanding contracts for the potential purchase of four hotels, consisting of two hotels in Portland, Maine, onehotel in Greenville, South Carolina and one hotel in Madison, Wisconsin for a total combined purchase price of approximately $226.5 million. Two of the hotels arealready in operation, one is in development and scheduled to open during
38
Index
the third quarter of 2021, and one is in development and scheduled to open no earlier than 2023. Closings on three of these hotels are expected to occur in the second halfof 2021, while closing on the remaining hotel is expected upon completion of development. Although the Company is working towards acquiring these hotels, there aremany conditions to closing that have not yet been satisfied and there can be no assurance that closings on these hotels will occur under the outstanding purchase contracts.The Company plans to utilize its available cash (including a portion of the proceeds from the sale of 20 hotels in July 2021) or borrowings under its unsecured creditfacilities available at closing to purchase hotels under contract if closings occur. The Company also entered into a contract during the second quarter of 2021 to purchasethe fee interest in the land at its Seattle, Washington Residence Inn, which is currently under a ground lease, for a purchase price of $80.0 million, consisting of a $24.0million cash payment (utilizing available cash or borrowings under its unsecured credit facilities) and a one-year note payable to the seller for $56.0 million. The landpurchase is expected to close in August 2021. Although the Company is working towards completing this acquisition, there are many conditions to closing that have notyet been satisfied and there can be no assurance that closing will occur.
Cash Management Activities
As part of the cost sharing arrangements discussed in Note 6 titled “Related Parties” in the Company’s Unaudited Consolidated Financial Statements and Notesthereto, appearing elsewhere in this Quarterly Report on Form 10-Q, certain day-to-day transactions may result in amounts due to or from the Company and ARG. Toefficiently manage cash disbursements, the Company or ARG may make payments for the other company. Under the cash management process, each company mayadvance or defer up to $1 million at any time. Each quarter, any outstanding amounts are settled between the companies. This process allows each company to minimizeits cash on hand and reduces the cost for each company. The amounts outstanding at any point in time are not significant to either of the companies.
Business Interruption
Being in the real estate industry, the Company is exposed to natural disasters on both a local and national scale. Although management believes there is adequateinsurance to cover this exposure, there can be no assurance that such events will not have a material adverse effect on the Company’s financial position or results ofoperations.
Seasonality
The hotel industry historically has been seasonal in nature. Seasonal variations in occupancy at the Company’s hotels may cause quarterly fluctuations in itsrevenues. Generally, occupancy rates and hotel revenues are greater in the second and third quarters than in the first and fourth quarters. However, due to the effects ofCOVID-19, these typical seasonal patterns were disrupted in 2020 and the first half of 2021 and may also be disrupted in the remainder of 2021. To the extent that cashflow from operations is insufficient during any quarter, due to temporary or seasonal fluctuations in revenue, the Company expects to utilize cash on hand or availablefinancing sources to meet cash requirements.
New Accounting Standards
See Note 1 titled “Organization and Summary of Significant Accounting Policies” in the Company’s Unaudited Consolidated Financial Statements and Notesthereto, appearing elsewhere in this Quarterly Report on Form 10-Q, for information on the adoption of the guidance in the reference rate reform accounting standardseffective in March 2020 and January 2021 as well as recent accounting standards updates to be adopted in the future.
Subsequent Events
On July 15, 2021, the Company paid approximately $2.3 million, or $0.01 per outstanding common share, in distributions to its common shareholders.
On July 22, 2021, the Company completed the sale of 20 of its hotels. A portion of the net proceeds from the sale were used to pay down borrowings on theCompany’s revolving credit facility and the remaining proceeds are available for general corporate purposes, including acquisitions of hotel properties. See Note 3 titled“Assets Held for Sale and Dispositions” in the Company’s Unaudited Consolidated Financial Statements and Notes thereto, appearing elsewhere in this Quarterly Reporton Form 10-Q, for additional information concerning this transaction.
In July 2021, the Company entered into a contract for the purchase of two hotels in Portland, Maine, one existing and one currently under development that isplanned to be completed and open for business during the third quarter of 2021, for an anticipated gross purchase price of approximately $117.9 million. The two hotelsconsist of an AC Hotel and an Aloft Hotel containing a total of 335 guest rooms. Although the Company is working towards acquiring these hotels, there are manyconditions to closing that have not yet been satisfied, and there can be no assurance that closings on these hotels will occur under the outstanding purchase contracts.
In July 2021, the Company entered into a contract for the purchase of an existing Hyatt Place hotel in Greenville, South Carolina, containing 130 guest rooms, foran anticipated gross purchase price of approximately $30.0 million. Although the Company
39
Index
is working towards acquiring this hotel, there are many conditions to closing that have not yet been satisfied, and there can be no assurance that closing on this hotel willoccur under the outstanding purchase contract.
In July 2021, the Company entered into a contract for the purchase of an Embassy Suites hotel that will be constructed in Madison, Wisconsin for an anticipatedgross purchase price of approximately $78.6 million and is expected to contain approximately 260 guest rooms. Although the Company is working towards acquiring thishotel, there are many conditions to closing that have not yet been satisfied, and there can be no assurance that closing on this hotel will occur under the outstandingpurchase contract.
In July 2021, the Company notified its lenders under its unsecured credit facilities that it had elected to exit the Extended Covenant Waiver Period effective July29, 2021 pursuant to the terms of each of its unsecured credit facilities, as amended. Upon exiting the Extended Covenant Waiver Period, the Company is no longersubject to the additional restrictions regarding its investing and financing activities that were applicable during the Extended Covenant Waiver Period, including, but notlimited to, limitations on the acquisition of property, payment of distributions to shareholders, limitations on capital expenditures and use of proceeds from the sale ofproperty or common shares of the Company. Those restrictions, including the restriction on payment of distributions to shareholders, were still in place throughout thesecond quarter of 2021. As of June 30, 2021, the Company met the financial maintenance covenants based on the annualized results of the three months ended June 30,2021 at the levels required for the first quarter tested upon exiting the Extended Covenant Waiver Period as described in Note 4, titled “Debt” in the Company’sUnaudited Consolidated Financial Statements and Notes thereto, appearing elsewhere in this Quarterly Report on Form 10-Q.
40
Index Item 3. Quantitative and Qualitative Disclosures About Market Risk
As of June 30, 2021, the Company’s financial instruments were not exposed to significant market risk due to foreign currency exchange risk, commodity pricerisk or equity price risk. However, the Company is exposed to interest rate risk due to possible changes in short term interest rates as it invests its cash or borrows on itsrevolving credit facility and due to the portion of its variable-rate debt that is not fixed by interest rate swaps. As of June 30, 2021, after giving effect to interest rateswaps, as described below, approximately $132.0 million, or approximately 9% of the Company’s total debt outstanding, was subject to variable interest rates. Based onthe Company’s variable-rate debt outstanding as of June 30, 2021, every 100 basis points change in interest rates will impact the Company’s annual net income byapproximately $1.3 million (subject to the LIBOR floor as discussed in Note 4 titled “Debt” in the Company’s Unaudited Consolidated Financial Statements and Notesthereto, appearing elsewhere in this Quarterly Report on Form 10-Q), all other factors remaining the same. With the exception of interest rate swap transactions, theCompany has not engaged in transactions in derivative financial instruments or derivative commodity instruments.
As of June 30, 2021, the Company’s variable-rate debt consisted of its unsecured credit facilities, including borrowings outstanding under its $425 millionrevolving credit facility and $820 million of term loans. Currently, the Company uses interest rate swaps to manage its interest rate risk on a portion of its variable-ratedebt. As of June 30, 2021, the Company had 13 interest rate swap agreements that effectively fix the interest payments on approximately $770.0 million of theCompany’s variable-rate debt outstanding with swap maturity dates ranging from August 2022 to December 2029. Under the terms of all of the Company’s interest rateswaps, the Company pays a fixed rate of interest and receives a floating rate of interest equal to the one-month LIBOR. See Note 5 titled “Fair Value of FinancialInstruments” in the Company’s Unaudited Consolidated Financial Statements and Notes thereto, appearing elsewhere in this Quarterly Report on Form 10-Q, for adescription of the Company’s interest rate swaps as of June 30, 2021.
In addition to its variable-rate debt and interest rate swaps discussed above, the Company has assumed or originated fixed interest rate mortgages payable tolenders under permanent financing arrangements as well as one $50 million fixed-rate senior notes facility. The following table summarizes the annual maturities andaverage interest rates of the Company’s mortgage debt and borrowings outstanding under its unsecured credit facilities at June 30, 2021. All dollar amounts are inthousands.
(1) The average interest rate gives effect to interest rate swaps, as applicable.
Item 4. Controls and Procedures
Senior management, including the Chief Executive Officer, Chief Financial Officer and Chief Accounting Officer, evaluated the effectiveness of the Company’sdisclosure controls and procedures as of the end of the period covered by this report. Based on this evaluation process, the Chief Executive Officer, Chief FinancialOfficer and Chief Accounting Officer have concluded that the Company’s disclosure controls and procedures were effective as of June 30, 2021. There have been nochanges in the Company’s internal control over financial reporting that occurred during the last fiscal quarter that have materially affected, or are reasonably likely tomaterially affect, the Company’s internal control over financial reporting.
41
Index PART II. OTHER INFORMATION
Item 1. Legal Proceedings
The Company is or may be a party to various legal proceedings that arise in the ordinary course of business. The Company is not currently involved in anylitigation nor, to management’s knowledge, is any litigation threatened against the Company where the outcome would, in management’s judgment based on informationcurrently available to the Company, have a material adverse effect on the Company’s consolidated financial position or results of operations.
Item 6. Exhibits
ExhibitNumber
Description of Documents
3.1 Amended and Restated Articles of Incorporation of the Company, as amended (Incorporated by reference to Exhibit 3.1 to the Company’s quarterlyreport on Form 10-Q (SEC File No. 001-37389) filed August 6, 2018)
3.2 Third Amended and Restated Bylaws of the Company (Incorporated by reference to Exhibit 3.2 to the Company’s quarterly report on Form 10-Q (SECFile No. 001-37389) filed May 18, 2020)
31.1 Certification of the Company’s Chief Executive Officer pursuant to Section 302 of the Sarbanes-Oxley Act of 2002 (FILED HEREWITH)
31.2 Certification of the Company’s Chief Financial Officer pursuant to Section 302 of the Sarbanes-Oxley Act of 2002 (FILED HEREWITH)
31.3 Certification of the Company’s Chief Accounting Officer pursuant to Section 302 of the Sarbanes-Oxley Act of 2002 (FILED HEREWITH)
32.1 Certification of the Company’s Chief Executive Officer, Chief Financial Officer and Chief Accounting Officer pursuant to 18 U.S.C. Section 1350 asadopted pursuant to Section 906 of the Sarbanes-Oxley Act of 2002 (FURNISHED HEREWITH)
101 The following materials from the Company’s Quarterly Report on Form 10-Q for the quarter ended June 30, 2021 formatted in iXBRL (Inline
eXtensible Business Reporting Language): (i) the Consolidated Balance Sheets, (ii) the Consolidated Statements of Operations and ComprehensiveIncome (Loss), (iii) the Consolidated Statements of Shareholders’ Equity, (iv) the Consolidated Statements of Cash Flows, and (v) related notes tothese financial statements, tagged as blocks of text and in detail (FILED HEREWITH)
104 The cover page from the Company’s Quarterly Report on Form 10-Q for the quarter ended June 30, 2021, formatted as Inline XBRL and contained inExhibit 101.
Pursuant to the requirements of the Securities Exchange Act of 1934, the registrant has duly caused this report to be signed on its behalf by the undersignedthereunto duly authorized. Apple Hospitality REIT, Inc. By: /s/ Justin G. Knight Date: Aug 5, 2021 Justin G. Knight, Chief Executive Officer
(Principal Executive Officer)
By: /s/ Elizabeth S. Perkins Date: Aug 5, 2021 Elizabeth S. Perkins, Chief Financial Officer
(Principal Financial Officer)
By: /s/ Rachel S. Labrecque Date: Aug 5, 2021 Rachel S. Labrecque, Chief Accounting Officer
(Principal Accounting Officer)
43
Exhibit 31.1
CERTIFICATION
I, Justin G. Knight, certify that:
1. I have reviewed this report on Form 10-Q of Apple Hospitality REIT, Inc.;
2. Based on my knowledge, this report does not contain any untrue statement of a material fact or omit to state a material fact necessary to make the statementsmade, in light of the circumstances under which such statements were made, not misleading with respect to the period covered by this report;
3. Based on my knowledge, the financial statements, and other financial information included in this report, fairly present in all material respects the financialcondition, results of operations and cash flows of the registrant as of, and for, the periods presented in this report;
4. The registrant’s other certifying officers and I are responsible for establishing and maintaining disclosure controls and procedures (as defined in Exchange ActRules 13a-15(e) and 15d-15(e)) and internal control over financial reporting (as defined in Exchange Act Rules 13a-15(f) and 15d-15(f)) for the registrant and have:
a) designed such disclosure controls and procedures, or caused such disclosure controls and procedures to be designed under our supervision, to ensure thatmaterial information relating to the registrant, including its consolidated subsidiaries, is made known to us by others within those entities, particularly during the period inwhich this report is being prepared;
b) designed such internal control over financial reporting, or caused such internal control over financial reporting to be designed under our supervision, toprovide reasonable assurance regarding the reliability of financial reporting and the preparation of financial statements for external purposes in accordance with generallyaccepted accounting principles;
c) evaluated the effectiveness of the registrant’s disclosure controls and procedures and presented in this report our conclusions about the effectiveness of thedisclosure controls and procedures, as of the end of the period covered by this report based on such evaluation; and
d) disclosed in this report any change in the registrant’s internal control over financial reporting that occurred during the registrant’s most recent fiscal quarter(the registrant’s fourth fiscal quarter in the case of an annual report) that has materially affected, or is reasonably likely to materially affect, the registrant’s internalcontrol over financial reporting; and
5. The registrant’s other certifying officers and I have disclosed, based on our most recent evaluation of internal control over financial reporting, to theregistrant’s auditors and the audit committee of the registrant’s Board of Directors (or persons performing the equivalent functions):
a) all significant deficiencies and material weaknesses in the design or operation of internal control over financial reporting which are reasonably likely toadversely affect the registrant’s ability to record, process, summarize and report financial information; and
b) any fraud, whether or not material, that involves management or other employees who have a significant role in the registrant’s internal control over financialreporting.
Date: Aug 5, 2021 /s/ Justin G. Knight
Justin G. Knight
Chief Executive Officer Apple Hospitality REIT, Inc.
Exhibit 31.2
CERTIFICATION
I, Elizabeth S. Perkins, certify that:
1. I have reviewed this report on Form 10-Q of Apple Hospitality REIT, Inc.;
2. Based on my knowledge, this report does not contain any untrue statement of a material fact or omit to state a material fact necessary to make the statementsmade, in light of the circumstances under which such statements were made, not misleading with respect to the period covered by this report;
3. Based on my knowledge, the financial statements, and other financial information included in this report, fairly present in all material respects the financialcondition, results of operations and cash flows of the registrant as of, and for, the periods presented in this report;
4. The registrant’s other certifying officers and I are responsible for establishing and maintaining disclosure controls and procedures (as defined in Exchange ActRules 13a-15(e) and 15d-15(e)) and internal control over financial reporting (as defined in Exchange Act Rules 13a-15(f) and 15d-15(f)) for the registrant and have:
a) designed such disclosure controls and procedures, or caused such disclosure controls and procedures to be designed under our supervision, to ensure thatmaterial information relating to the registrant, including its consolidated subsidiaries, is made known to us by others within those entities, particularly during the period inwhich this report is being prepared;
b) designed such internal control over financial reporting, or caused such internal control over financial reporting to be designed under our supervision, toprovide reasonable assurance regarding the reliability of financial reporting and the preparation of financial statements for external purposes in accordance with generallyaccepted accounting principles;
c) evaluated the effectiveness of the registrant’s disclosure controls and procedures and presented in this report our conclusions about the effectiveness of thedisclosure controls and procedures, as of the end of the period covered by this report based on such evaluation; and
d) disclosed in this report any change in the registrant’s internal control over financial reporting that occurred during the registrant’s most recent fiscal quarter(the registrant’s fourth fiscal quarter in the case of an annual report) that has materially affected, or is reasonably likely to materially affect, the registrant’s internalcontrol over financial reporting; and
5. The registrant’s other certifying officers and I have disclosed, based on our most recent evaluation of internal control over financial reporting, to theregistrant’s auditors and the audit committee of the registrant’s Board of Directors (or persons performing the equivalent functions):
a) all significant deficiencies and material weaknesses in the design or operation of internal control over financial reporting which are reasonably likely toadversely affect the registrant’s ability to record, process, summarize and report financial information; and
b) any fraud, whether or not material, that involves management or other employees who have a significant role in the registrant’s internal control over financialreporting.
Date: Aug 5, 2021 /s/ Elizabeth S. Perkins
Elizabeth S. PerkinsChief Financial Officer
Apple Hospitality REIT, Inc.
Exhibit 31.3
CERTIFICATION
I, Rachel S. Labrecque, certify that:
1. I have reviewed this report on Form 10-Q of Apple Hospitality REIT, Inc.;
2. Based on my knowledge, this report does not contain any untrue statement of a material fact or omit to state a material fact necessary to make the statementsmade, in light of the circumstances under which such statements were made, not misleading with respect to the period covered by this report;
3. Based on my knowledge, the financial statements, and other financial information included in this report, fairly present in all material respects the financialcondition, results of operations and cash flows of the registrant as of, and for, the periods presented in this report;
4. The registrant’s other certifying officers and I are responsible for establishing and maintaining disclosure controls and procedures (as defined in Exchange ActRules 13a-15(e) and 15d-15(e)) and internal control over financial reporting (as defined in Exchange Act Rules 13a-15(f) and 15d-15(f)) for the registrant and have:
a) designed such disclosure controls and procedures, or caused such disclosure controls and procedures to be designed under our supervision, to ensure thatmaterial information relating to the registrant, including its consolidated subsidiaries, is made known to us by others within those entities, particularly during the period inwhich this report is being prepared;
b) designed such internal control over financial reporting, or caused such internal control over financial reporting to be designed under our supervision, toprovide reasonable assurance regarding the reliability of financial reporting and the preparation of financial statements for external purposes in accordance with generallyaccepted accounting principles;
c) evaluated the effectiveness of the registrant’s disclosure controls and procedures and presented in this report our conclusions about the effectiveness of thedisclosure controls and procedures, as of the end of the period covered by this report based on such evaluation; and
d) disclosed in this report any change in the registrant’s internal control over financial reporting that occurred during the registrant’s most recent fiscal quarter(the registrant’s fourth fiscal quarter in the case of an annual report) that has materially affected, or is reasonably likely to materially affect, the registrant’s internalcontrol over financial reporting; and
5. The registrant’s other certifying officers and I have disclosed, based on our most recent evaluation of internal control over financial reporting, to theregistrant’s auditors and the audit committee of the registrant’s Board of Directors (or persons performing the equivalent functions):
a) all significant deficiencies and material weaknesses in the design or operation of internal control over financial reporting which are reasonably likely toadversely affect the registrant’s ability to record, process, summarize and report financial information; and
b) any fraud, whether or not material, that involves management or other employees who have a significant role in the registrant’s internal control over financialreporting.
Date: Aug 5, 2021 /s/ Rachel S. Labrecque
Rachel S. LabrecqueChief Accounting Officer
Apple Hospitality REIT, Inc.
Exhibit 32.1
CERTIFICATION PURSUANT TO 18 U.S.C. SECTION 1350 AS ADOPTED PURSUANT TO SECTION 906 OF THE SARBANES-OXLEY ACT OF 2002
In connection with the Quarterly Report of Apple Hospitality REIT, Inc., (the “Company”) on Form 10-Q for the quarter ended June 30, 2021 as filed with theSecurities and Exchange Commission on the date hereof (the “Report”), the undersigned hereby certify, pursuant to 18 U.S.C. Section 1350, as adopted pursuant toSection 906 of the Sarbanes-Oxley Act of 2002 that: (1) the Report fully complies with the requirements of Section 13(a) or 15(d) of the Securities Exchange Act of1934; and (2) the information contained in the Report fairly presents, in all material respects, the financial condition and results of operations of the Company as ofJune 30, 2021 and for the period then ended.