APPLES: CERTAIN CONDITIONS OF COMPETITION BETWEEN THE U.S. AND CANADIAN INDUSTRIES Report to the Committee on Finance, United States Senate, on Investigation No. 332-305 Under Section 332(g) of the Tariff Act of 1930 USITC PUBLICATION 2408 ----;usr 1991 States International Trade Commission hington, DC 20436
Transcript
APPLES: CERTAIN CONDITIONS OF COMPETITION BETWEEN THE U.S. AND CANADIAN INDUSTRIES
Report to the Committee on Finance, United States Senate, on Investigation No. 332-305 Under Section 332(g) of the Tariff Act of 1930
USITC PUBLICATION 2408
----;usr 1991
~d States International Trade Commission hington, DC 20436
UNITED STATES INTERNATIONAL TRADE COMMISSION
COMMISSIONERS
Anne E. Brunsdale, Acting Chairman Seeley G. Lodwick
David B. Rohr Don E. Newquist
Office of Industries Robert A. Rogowsky, Director
This report was prepared principally by,
Frederick W. Ruggles, Project leader
Joan Gallagher, Kelly Nunis, and Roger L. Corey Office of Industries
Walker A. Pollard, Office of Economics
With assistance from
Elizabeth Lee and Joan Williams Office of Industries
Under the direction of
Lowell Grant, Chief Agriculture Crops and Products Branch
David L. Ingersoll, Chief Agriculture Division
Address all communications to Kenneth R. Mason, Secretary to the Commission United States International Trade Commission
Washington, DC 20436
PREFACE
On November 19, 1990, at the request of the Committee on Finance, U.S. Senate, and in accordance with section 332(g) of the Tariff Act of 1930 (19 U.S.C. 1332(g)), the U.S. International Trade Commission instituted investigation No. 332-305, Apples: Certain Conditions of Competition Between the U.S. and Canadian Industries, for purposes of providing the following information:
(1) The purpose, nature, quantity, and use of the policies and practices of the Canadian national and Provincial governments affecting apples, including-
(a) rebates provided to retailers by Canadian marketing organii.ations;
(b) advertising allowances offered to retailers by marketing organii.ations or national or provincial agencies;
(c) payments to growers under the Agricultural Stabilization Act (ASA), the National · Tripartite Price Stabilii.ation Program, and the British Columbia Farm Income Insurance Program when average prices fall below benchmark costs, and how the benchmark prices are set; and
(d) other import, price, and supply proposals being considered by the National Farm Products Marketing Council.
(2) The volume and value of U.S. imports of fresh apples from Canada over the last 5 years, with special emphasis on how such imports have concentrated in individual regional markets throughout the United States;
(3) An analysis of the competitive factors in each industry, including a comparison, by market regions wherever obtainable, of sales prices of U.S. and Canadian apples in the U.S. and Canadian markets, and an analysis of each country's costs of production;
(4) A comparison of the quality of U.S. and Canadian apples destined for the fresh apple market;
(5) A comparison of the consumption and utilii.ation trends in Canada and the United States for apples destined for the fresh and processed market; and
(6) A comparison of total Canadian and U.S. apple production by region and provil)ce over the last 5 years.
The Senate Finance Committee's request, reproduced in appendix A, asked that the Commission provide a final report of the results of its investigation not later than August l, 1991.
Notice of the investigation was posted at the Office of the Secretary, U.S. International Trade Commission, Washington, DC, and published in the Federal Register (90 F.R. 27935) of November 28, 1990.
There was no public hearing on the investigation, although the Commission invited interested persons to submit written statements concerning the investigation.
Swdy time frame and data sources .................................................... . 1-1 The concept of competitiveness ............ : ......................................... . 1-1 Organization of this report ....................... : ..................... · ............. . 1-1 Overview ........................................................................... . 1-1
Chapter 2. The U.S. Industry and Market: The U.S. industry:
Production ....................................................................... . 2-1 Acreage planted and harvested and geographic disuibution ........................... . 2-1 Trends in varieties and utilization ................................................. . 2-2
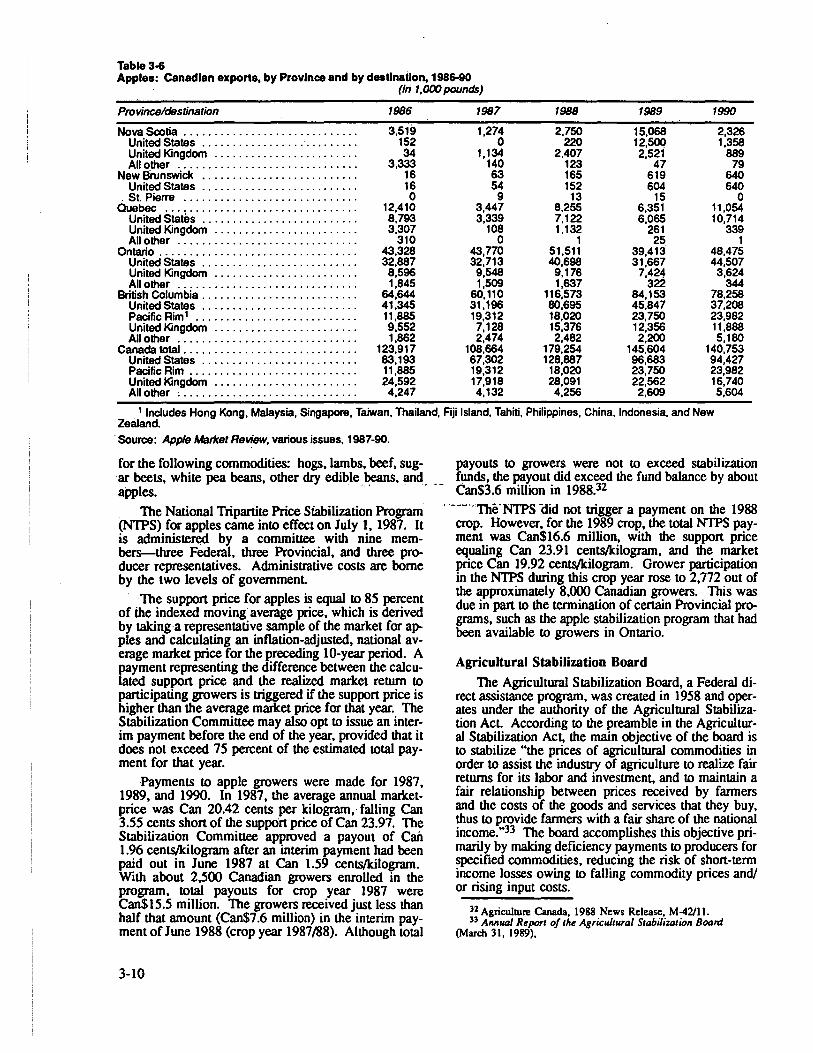
Canadian imports ................................. ; ............................. . 3-7 Trends in Canadian imports by variety .......................................... . 3-7 Supply and disposition of U.S. apples in the Canadian market ..................... . 3-7
Appendices A. Letter of request from Senate Committee on Finance ............................... . B. Commission's notice of institution of. investigation ................................... . C. Canadian request for a _Canadian Apple Marketing Agency ........................... . D. . List of U.S. H3rmonized Tariff Schedule numbers covered by the investigation ......... . E. . List of Canadian Hannonized Tariff Schedule numbers covered by the invesµgation ..... .
Figures
Page
4-1 4-1 4-1 4-2
4-3 4-3 4-6
4-6 4-7
4-10 4-12 4-13 4-13 4-14 4-14
A-1 B-1 C-1 D-1 E-1
I-la I-lb. I-2. 1-3. 2-1. 2-2. 3-1. 3-2. 4-la.
Apples: United States and Canada fresh and processed ................. : . . . . . . . . . . . . J-3 Apples: Washington and British CplUmbia fr:esh arid processed.,........ . . . . . . . . . . . . . . . 1-3 Apples: Total apple production by specifie(f' area .........•. : . . . . . . . . . . . . • . . . . . . . . . . I -4 Apples: Delicious apple production in the United States and Canada . . . . . . . . . . . . . . . . . . 1-4
4-lb.
4-Ic.
4-2. 4-3. 4-4a. 4-4b.
Apples: Major U.S. varieties .................................. ·. . . . . . . . . . . . . . . . . . . 2-1 Apple producing regions and 7 major producing States ... -_ ...... ·..................... 2"2 Major apple producing· provinces .... : .............. .-. . .. . . . . . . . . . . . . . . . . . . . . . . .. . . 3-3 Apples: Major Qmadian varieties ....................................... :: . . . . . . . . . 3-3 Fresh Red Delicious apples: season-average retail prices, nominal .
and inflation-adjusted, by region, 1980-89 .................................... ·. . . . . 4-8 .Fresh Red Delicious apples: season-average retail prices,: n<:>minal : · . . . .
and inflation-adjusted, by region._ 1980-89 : ~ .... ,_ ... ~. ~ ..... ! ; ••••••• , •. • ••••••••• ; • • • • 4-9 Red Delicious apples: U.S. monthly retail and grower prices, 1985/86-88/89 . .. .. .. .. .. 4-9 Red Delicious apples: retail-grower price margins,. 1980/81-88/89 ... ! • ., ••• , •••••••• , • • 4-10 Apples: s:eason~average grower prices Washington and British Columbia, 1970-89 . . . . . . . 4-11 Apples: season-average grower prices United States and Canada, 1970-89 ............... 4-12
Tables A. i-l. 2-2. 2-3 .. 2-4 .. 3-1. . 3-2.
3-3.
iv
. Profile of U.S. and C~adian apple industry. and markets, 1986-90 .... ·.· ....... .- ........ .
. Apples: U.S. production, by variety and by region, 1986-90 ........................ . Apple utiliution in the United States, 1986-90 .......................... -..... · ...... ; Fresh apples: U.S. imports for consumption, by principal sources, 1986-90 ............ . Fresh apples: U.S. exports, by principaJ mancets, 1986-90 ........................... . Canadian apple production, by variety and by Province, 1986:90 ..................... : Canadian acreage of bearing and nonbearing apple trees, by Province, .
1986, 1988, and 1989 ....................................................... · .. 1 ••••
· Apples: Canadian exports, sales to processing and apparent consumption · .. . of fresh-market products, 1986-90 ........................................ .' ........... .
vii 2-3 2-4 2-7 2-8 3-1
3-2
3-4
CONTENTS-Continued
Page
Tables-Continued 3-4. Apples: Canadian controlled-atmosphere and total storage, by Province,
Nov. l, 1989-June 1, 1990 ......................................... ·............. 3-5 3-5. Apples: Canadian imports, by principal sources, 1986-90 . . . . . . . . . . . . . . . . . . . . . . . . . . . . 3-8 3-6. Apples: Canadian exports, by Province and by destination, 1986-90 ................... 3-10 4-1. Apples: U.S.-Canadian selected measures of market and industry shares, 1986-90 . . . . . . . 4-2 4-2. Apple production costs: UBC comparison of British Columbia with
Washington State, 1985 . . . . . . . . . . . . . . . . . . . . . . . . . . . . . . . . . . . . . . . . . . . . . . . . . . . . . . . . . 4-4 4-3 Apple production costs: comparison of British Columbia with Washington State, 1990... 4-4 4-4 Apples: U.S. and Washington State season-average grower prices, 1970-1989 . . . . . . . . . . . 4-6 4-5 Apples: Fresh Red Delicious, season average retail and wholesale prices,
nominal and inflation-adjusted, by region, 1980-89 . . . . . . . . . . . . . . . . . . . . . . . . . . . . . .. . . 4-7 4-6. Apples: season-average grower prices, British Columbia and Canada, 1970-1989 ........ 4-11 4-7. Selected fruits: season-average prices received by growers, Washington State and
U.S. average, 1985-89 ........................................................... 4-13 4-8. Apples: U.S. and Canadian production and shares destined for the fresh market.
In 1990, U.S. apple production totaled 9.7 billion pounds, valued at over $1 billion (table A). Apples are the third most valuable fruit crop in the United States after grapes and oranges. Because of increased plantings in the late 1970s and early 1980s, U.S. apple production rose during the study period, 1986-90, and is expected to continue to increase over the next few years. Canada's apple production totaled 1.1 billion pounds, valued at about Can$121 million in 1990, and was that country's most valued fruit crop. Canadian apple production also increased during the study period, mainly because of an increase in bearing orchards in eastern Canada and an increased number of bearing apple trees per acre in British Columbia.
Nearly 60 percent of the U.S.' apple crop is consumed as fresh-market apples; a similar percentage of the Canadian crop is also consumed as fresh-market apples. The principal fresh-market apples are the Red Delicious in the United States and the Mcintosh and Red Delicious in Canada. Most Red Delicious apples are produced in one geographic area, within the State of Washington and the Province of British Columbia. U.S. and Canadian growers, packers, and brokers in this area compete head-to-head for fresh-marekt sales throughout the United States and Canada, and in off-shore markets.
The following summary highlights the questions asked by the Senate Finance Committee in their request for this investigation and information regarding these questions developed during the course of the investigation.
Table A
Profile of U.S. and Canadian apple Industry and markets, 1986·90
Source 1986 1987 1988 1989 1990
United States: Commercial apple growers 1 •.•••••.•••••••.•.. <2> 32,872 (2) (2) (2) Aaeage in trees 1 •••••••.•••.••.••..•..••••• 7,8~~ 601,021 ~) 9,9~ b) Production (million pounds) ................... 10,742 9,1 1 9,7 3 Yield (1,000 pounds per aae) ................. <2> 17.5 (2) (2) (2) Imports from Canada (million pounds) ........... 98.2 94.9 107.0 104.9 113.7 Total imports (million pounds) ................. 290.2 294.1 270.1 254.9 234.0 Exports (million pounds) ..................... 446.5 559.4 756.2 603.9 796.5 Consumption (million pounds) ................. 7,703 10,4n 8,645 9,617 9, 141 Ratio of imports to consumption /rPercent) ........ 3.8 2.8 3.1 2.7 2.6 Season-average grower pnces ( esh):
(2l United States (cents per pound) .............. 19.10 12.70 17.40 13.40 Washington State (cents per pound) .......... 18.60 10.40 16.10 11.90 (2
Canada: Commercial apple growers ................... 6,119 ~~ 81,2&6 ~ ri Aaeage in trees ............................ 85,241 80,5 2) Production (million pounds) ................... 856 1, 115 1,104 1,183 1, 115 Yield (1,000 pounds per aae) ................. 10.0 <2J 13.6 14.7 <2J Imports from the U.S. (million pounds) .......... 121.8 189. 221.6 148.2 169. Total imports (million pounds) ................. 226.3 284.1 293.9 203.6 214.6 Exports (million pounds) ..................... 123.9 108.7 179.3 145.6 140.8 Consumption (million pounds) ................. 958 1,290 1,219 1,241 1, 189 Ratio of imports to consumption (percent) ........ 23.6 22.0 22.3 16.4 18.1 Season-average grower pnces (fiesh):
(2) Canada (Can cents per pound) .............. 9.49 4.73 8.31 6.37 British Columbia (Can cents per pound) ....... 9.38 7.06 9.00 7.70 (2) 1 U.S. Department of Commerce, Bureau of the Census, 1987 Census of Agriculture. 2 Not available. ·
Source: U.S. Department of Commerce, International Apple Institute, and Agriculture Canada.
I. The purpose, nature, quantity, and use of the policies and practices of the Canadian national and provincial governments affecting apples .
(a) Rebates provided to retailers by Canadian marketing organiz.ations
Although apparently not a policy or practice of the Canadian national Government or any of the provincial governments, rebates reportedly have been offered to buyers of Canadian apples by at least one privately-owned Canadian marketing organization, B.C. Tree Fruit Ltd. These rebates are described as quantity discounts based on target amounts that are
vii
viii
set by the marketing organization offering the rebates; such .target amounts are established by variety. U.S. apple growers have expressed concern about these rebate programs, apparently fearing that payments from the government stabilization programs provide Canadian growers with a competitive advantage by allowing them to make deeper discounts than would be possible without the government programs.
The extent of this marketing practice is not known, as neither the buyers to whom the rebates have reportedly been offered nor the marketing organization would discuss this issue for the record. No other independent information has been obtained that would reveal anything more than examples of the targets and hypothetical estimates· of the rebates should these targets be met or exceeded. We do know, however, that such rebates appear to operate much like quantity discounts and that such discounts are offered by many U.S. marketing organizations.
(b) Advertising allowances offered to retailers by marketing organizations or by national or provincial agencies
Although reportedly not a policy or practice of the Canadian national Government or of any of the provincial governments, advertising allowances have also reportedly been offered to retailers who purchase apples from B.C. Tree Fruit Ltd. This program was reported to be in effect from late 1989 through early 1990. Neither the retailers nor the marketing organization would discuss this issue for the record. No other infonnation was obtained during the course of the investigation that would reveal the extent of this marketing practice or its relationship to any other program or marketing practice.
(c) Payments to growers under the Agricultural Stabilization Act (ASA), the National Tripartile Price Stabilization Program, and the British Columbia Farm Income Insurance Program when average prices fall below benchmark costs, and how benchmark prices are set
Under the Agricultural Stabilization Act, payments were made to growers in Canada in 7 years since 1975. The only payment under this program reported in the last 5 years was to growers of Red Delicious apples in 1987. The National Tripartite Price Stabilization Program (NTPS) for apples-began on July 1, 1987. The reported payments urider .. this. program have amounted to Can$15.S million and Can$16.6 million for 1987 and 1989, respectively; an interim payment was repc)itoolY made for·1990;- The payments under the NTPS are essentially deficiency payments to growers in those years in which the market price falls below the support price. Under the British Columbia Farm Income Insurance Program, payments have reportedly averaged Can$0.024 per pound during the 1980s, with payments made when prices fall below the cost of production as calculated by the provincial government. U.S. apple growers do not receive any kind of price support or deficiency payments.
(d) Other import, price, and supply proposals being considered by the National Farm Products JJarkedng Council
The Canadian National Fann Products Marketing Council has recommended a national supply management program for apples. This proposal calls for the establishment of a Canadian Apple Marketing Agency with broad powers to regulate domestic production and limit imports. Two Canadian studies have questioned the advisability of such a program, and the program has yet to be adopted.
2. The volume and value of U.S. imports of fresh apples from Canada over the last 5 years, with special emphasis on how such imports have concentrated in individual regional markets throughout the United States
Canada was the leading foreign supplier of fresh apples, by volume, into the United States during 1986-90. Canada accounted for nearly 50 percent of U.S. imports during 1990, supplying 114 million pounds. The value of these imports reached $15.6 million in 1990, the first tirile over the last 5 years that Canada was the leading source of imported apples in terms of value. The volume of U.S. imports of fresh apples for consumption has steadily declined from 294 million pounds in 1987 to 234 million pounds in 1990, and has always been less than U.S. exports.
Imports of apples by individual regions (municipal districts) are not reported by the U.S. DeparUnent of Commerce, although they are reported by U.S. Customs Districts
(ports-of-entry). Seaule, Washington; Buffalo, New York; and Detroit, Michigan were the most significant ports-of-entry, averaging 41, 26, and 14 percent of total imports, respectively, by volume for 1989 and 1990. However, most of these shipments continue on to other major metropolitan areas for sale. According to industry sources, the majority of Canadian shipments of apples are transported by truck into major U.S. metropolitan areas.
3. An analysis of the competitive factors in each industry, including a comparison, by market regions wherever obtainable, of sales prices of U.S. and Canadian apples in the U.S. and Canadian markets, and an analysis of each country's costs of production
There are no significant differences in the delivered prices of Canadian and U.S. apples of the same variety and comparable quality (e.g., Fancy or Extra Fancy grades). However, because a smaller proportion of Canadian apples meet the standards for a given grade, proportionately more apples from Canada sell for a lower price in any given market because their average quality and grade are lower. As a result, the season-average price received by Canadian growers is significantly lower than that received by U.S. growers. Tables 4-4 through 4-6 show selected U.S. and Canadian apple prices.
Costs of growing apples are believed to be lower in the United States than in Canada. Costs of pesticides and other chemicals are lower in the United States, because U.S. orchards have a higher tree density per acre, which reduces the chemical cost per harvested apple; in addition, Canadian industry sources report that Canadian regulations restrict the availability of certain chemicals that are used by U.S. growers. Interest rates and land costs (including taxes) are also lower in the United States than in Canada.
Other conditions affecting competition in the U.S. and Canadian apple industries include industry structure, technology, and exchange rates. The structure of the U.S. industry is highly competitive, with hundreds of independent buyers facing thousands of independent sellers. In contrast, the Canadian industry is characterized by provincial sales agencies that have almost exclusive control over the marketing and/or pricing of the Provinces' apple output. Although small relative to the entire U.S.-Canadian apple market, these agencies can be significant players in regional and municipal markets. Imports of Canadian apples into. the United States enter duty free, as do U.S. apples into Canada; however, imports into Canada of U.S. Delicious apples have been sub)~t-~ .a. Ca~adian antidumping order since 1988.
A significant technological difference between the two industries is in the use of controlled-atmosphere (CA) storage of fresh apples, instead of the normal cold storage. CA storage keeps apples fresh for up to a year, and enables fresh apples to be marketed yearround. The relatively low use of CA storage in Canada means that up to 70 percent of Canada's fresh-apple supply must enter the market within 5 months of harvest. U.S. CA capacity, in contrast, is sufficient to hold 75 percent of the supply, so that marketing can be more evenly distributed over the year. As a result, U.S. producers can avoid the surpluses and shortages that characterize Canadian marketing patterns and that are partly responsible for the low returns to Canadian growers.
The steady decline since 1985 in the real (inflation-adjusted) value of the U.S. dollar in terms of the Canadian dollar has improved U.S. industry competitiveness. By making U.S. apples less expensive in Canada, the U.S. dollar's depreciation has helped U.S. export performance. Conversely, the appreciation of the Canadian dollar has raised the effective price of Canadian apples in the U.S. market and thereby weakened Canadian industry competitiveness.
4. A comparison of the quality of United States and Canadian apples destined for the fresh apple market
Apples sold in the fresh market in both the United States and Canada are graded according to quality, e.g., Fancy and Extra Fancy. There is no significant difference between the United States and Canada in the standards required of apples in those grades; a U.S. Extra Fancy apple is of the same quality as a Canadian Extra Fancy apple. There is, however, a large difference in the proportion of U.S. and Canadian apples that meet those standards. In Washington State, for example, 75 percent of the industry's 1985 output of Red Delicious apples was graded Extra Fancy, compared with 58 percent of the crop in British Columbia.
5. A comparison of the consumption and utilization trends in Canada and the United States for apples destined for the fresh and processed markets
During the study period, Canada's fresh-market sales averaged 54 percent of total Canadian production, but the average fresh-market sales for the United States was 59 percent of total
ix
x
U.S. production; these trends have held fairly constant during the last IO years. Processed apple production is concentrated in eastern Canada and in the Eastern and Central regions (east of the Rocky Mountains) of the United States. However, fresh-market apple production is concentrated in the Pacific Northwest British Columbia produced nearly half of all Canadian apples for fresh-market consumption during 1986-90, compared with Washington State production which averaged 55 percent of the U.S. fresh-market apples consumed.
6. A comparison of total Canadian and U.S. apple production by region and province over the last 5 years
Annual Canadian apple production averaged 1.1 billion pounds during 1986-90, or 12 percent of the annual U.S. average of 9.5 billion pounds during the same period. Ontario and British Columbia each accounted for 35 percent of Canadian apple production during the study period; the remaining 30 percent was produced in Quebec, Nova Scotia, and New Brunswick. During the same period, the U.S. Western region accounted for 58 percent of total U.S. production, the Eastern region for 28 percent, and the Central region for the remaining 14 percent
Chapter 1 Introduction.
The major objectives of this investigation are to provide an analysis of the competitive factors in the U.S. and Canadian apple industries and to outline the policies and practices of the Canadian National and Provincial governments that affect the Canadian industry. The investigation was instituted on November 19, 1990, following receipt of a request on October 16, 1990, from the Committee on Finance, U.S. Senate.1
Study Time Frame and Data Sources In most instances, the period covered throughout
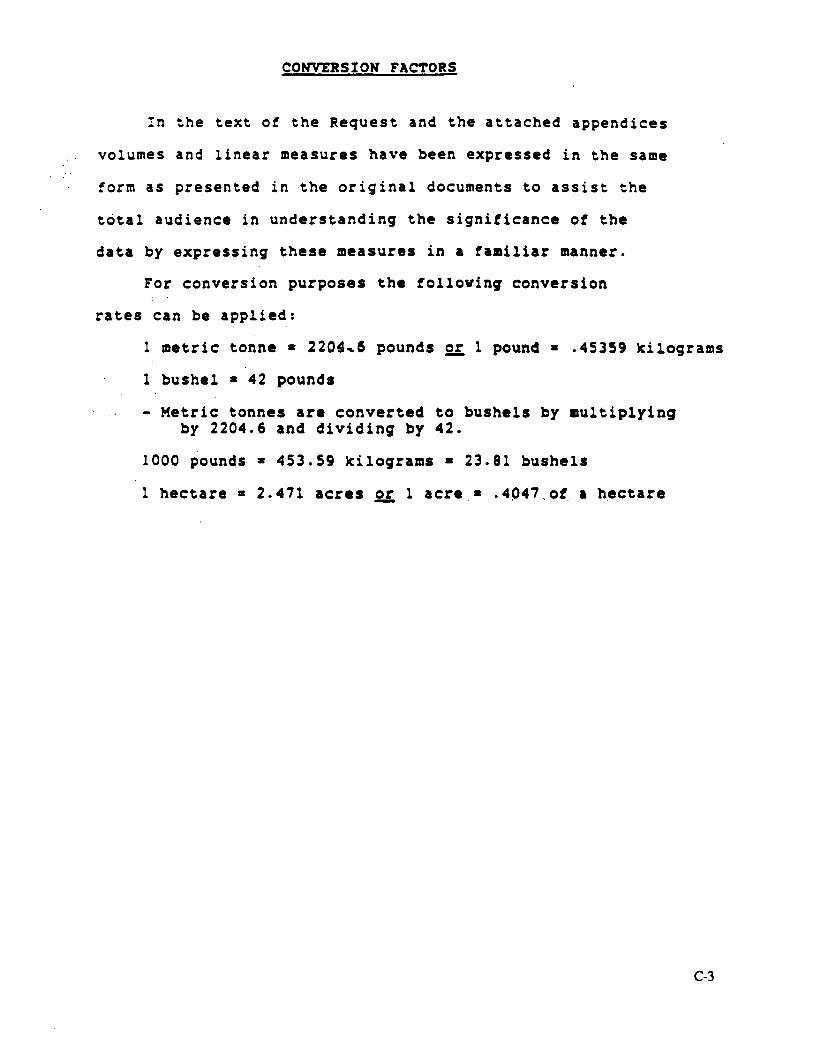
this study is 1986-90, especially with regard to trade data. For other data, the most recent data available are presented. Throughout this report, dollar values are expressed in one (U.S. or Canadian) currency only in the text; that is. equivalent U.S. values are not included when Canadian values are expressed, and vice versa. However, where appropriate, values are shown in both currencies on some tables. As a general guide for currency conversion, note that the rate of exchange be~ tween the U.S. and Canadian dollars ranged between 1.3 and 1.1 Canadian dollars per U.S. dollar during the period ( 1986-90) covered by this swdy.
The· inve·stigation consisted of a combined analysis of information obtained from published sources and from staff interviews with industry representatives, government officials, and academic researchers, both in the United St.ateS and Canada. To the extent that some . areas of interest have been the subject of previous government or academic swdies, such studies were consulted and appropriately integrated into. the present investiga~on to minimize duplication of effort.
The Concept ·of Competitivene~ The first step in assessing an industry's competi··
liveness vis-a-vis its international rivals is to define competitiveness and how it is to be measured. The competitiveness measures included in this study (see chapter 4) are market shares and profitability.
Changes in the shares held by the U.S. and Cana- . dian apple industries in both the domestic and total North American markets indicate whether the respective industry has been able to maintain the market's acceptance of its products. Market share is a better measure than total sales value (or volume) when one is interested in comparing the performance of one nation's industry with that of another's. Factors internal to firms in the industry that can influence apple market shares and are considered in this study include, among others, changing production or marketing costs (e.g., land, labor, and chemicals); varietal development and promotion; management; and product quality. External factors include technological developments; interest
1 The ~uest from the Senate Committee on Finance is reproduced in app. A.
r.ites; exchange rates; and government involvement (e.g., regulation, financial support, and trade barriers).
Organi7.ation of This Report Chapters 2 and 3 provide a detailed look at the U.S.
and Canadian apple industries and markets, respectively. The two chapters have a parallel structure: each describes in bJm the country's industry (including its production and its distribution, storage, handling, and grading); the country's market (with a focus on marketing and pricing, quality, and trade; and finally government programs that affect the industry.
Chapter 4 analyzes prices and quality of apples in the U.S. and Canadian markets and reviews the competitive conditions in the U.S. and Canadian markets. It examines the major factors affecting prices, such as variety, size, and grade, and discusses prices in selected markets of the United States and Canada.
Overview Apples are the world's single most important tree
fruit crop, accounting for some 60 percent of global tree fruit production. World apple production has increased steadily by 2 percent annually over the past 20 years; most of this increase is attributable to the United States, Turkel, Chile, Argentina, New Zealand, and South Africa. However, there are limited signs of attenuation in this growth: the acreage devoted to apple production has recently stabiliized and may even have dropped slightly. In general, efficient management techniques, improved horticultural methods, and better trees are sustaining the production increases amid dwindling prices. The bulk of world apple production and consumption ·takes place in Europe and, to a lesser extent, Asia.
The United States is consistently among the top three countries-the Soviet l,.Jnion and China being the other tw<>-in apple production. World production was about 45 billion pounds in 1990, of which the United States produced 21.6 percent (9.7 billion pounds) and Canada 2.4 percent (1.1 billion pounds). U.S. apples are. grown in all 50 States; commercial production is reported annually for 36 States by the U.S. Department of Agriculture. In 1987, according to the U.S. Census of Agriculture, nearly 37 ,000 farms in the United States had a total of 69 million apple trees on about 600,000 acres .. The number of commercial apple growers in 1987 was reported to be 32,872. Seven States account for the bulk of U.S. apple production-California, Michigan, New York, North Carolina, Pennsylvania, Virginia, and Washington.
U.S. trade in apples and apple products has been dominated by exports of fresh-market apples ($213 million in 1990) and imports of apple juice ($172 million in 1990). Exports of fresh-market apples were equivalent to about 9 percent of the total U.S. apple crop in 1990. Imports as a share of domestic consumption, of all apples, have remained steady at 2 percent.
2 Submission by 8.C. Tree Fruits Limi1ed, May 24, 1991.
1-1
Canadian apples are grown in all I 0 Provinces and both territories. However, commercial operations are found mostly in British Columbia, Ontario, Quebec, . Nova Scotia, and New Brunswick. The most recent Canadian Census data (for 1986) show that over 6,100 farms had apple trees, with about 4,500 of these considered commercial operations. The industry as a whole maintained more than 85,000 acres of farmland containing 7.2 million bearing trees and 3.4 million nonbearing trees.
During the study period, Canada consumed about 1 billion pounds of apples annually, of which approximately 600 million pounds were fresh-market apples and the rest were processed. Canada generally imports about 260 million pounds, or 26 percent of its total consumption. Exports total around 135 million pounds, mostly fresh-market apples destined for the Pacific Rim and the United States.
There are hundreds of apple varieties, but only a few are grown commercially. Ten major varieties of apples account for about 90 percent of the U.S. crop: Red Delicious, Golden Delicious, Granny Smith, Mcintosh, Rome, Jonathan, York, Newton, Stayman, and Idared; of these, the Delicious, Granny Smith, and Mcintosh are the principal varieties. Canada has six major varieties that account for 83 percent of the total apple crop: Mcintosh, Red Delicious, Golden Delicious, Northern Spy, Spartan, and Cortland; the Mcintosh and Delicious are the principal varieties produced.
Trends in apple production in the United States and Canada depend on the rate of tree plantings and removals, and the management and horticultural practices used. The density of tree plantings generally varies from 70 to more than 800 trees per acre, depending on the type of tree-planting method selected by the individual grower. The current trend favors higher density plantings of so-called "dwarf trees" to ~roduce larger fruit, beuer color, and easier harvesting. Dwarf trees differ from the larger standard apple trees in that they begin bearing fruit within 3 to 4 years, as opposed to 7 to IO years for standard trees. In addition, dwarf trees and t!teir branches are much shorter in length, so that the picker can usually reach the apples without a ladder. With the dwarf trees, the grower can actually plant over 1,200 trees per acre, as opposed to the average of only 84 standard trees per acre. Although a dwarf tree will not yield as many apples as a standard tree, an acre of dwarf trees will yield more apples than an acre of s~dard. trees. D~arf trees also yield a greater proporuon of hi~~er-quahty apples. Closer plantings of dwarf ~ fac1htate spraying, pruning, and picking operauons, and substantially increase annual yields.
Regardless of geographic location, the various functions of growing a commercial apple crop are much the same, although the decisions on which vari-
3. Ralph J. Barrie, chainnan, Report of tM Inquiry inlo the Mer"! of E.stablis/Wig a National Marketing Agency for Apples Dutuud for the Fruh Market (Ottawa: National Fann Products Marketing Council, March 1991 ); hereafter rcfened to· as the •Barrie Report."
1-2
eties to grow and how to market them vary by grower and location. Major grower activity begins in late winter with pruning of excess branches from trees before ~ew growth begins in the spring; the preferred practice 1s to prune each tree every year or at least once every 2 years. Then, starting in the spring (the date depends on the weather) and continuing throughout the summer until near harvest time, a pest management program is followed to ensure quality fruit Harvesting, which starts in July or August in southern States and extends until November for late-harvest crops, is done virtually all by hand. Most harvest laborers are seasonal, and they are often housed nearby in facilities provided by the ~~ers. The aJ?Ples are picked and placed, without sortmg, mto large bms (wooden crates) in the orchard. Each bin holds up to 25 bushels (from 800 io 900 pounds). Unsorted apples thus placed in bins are called orchard-run fruit. The bins of orchard-run fruit are then sorted for fresh-market packing, canning, juice production, or placed in storage.
· Storage of apples is necessary to ensure their availability and orderly marketing throughout the year. There are two methods of storage utilized in the United States and Canada, regular and controlled atmosphere (CA). Regular storage, in refrigerated rooms, provides U:~porary storage in which apples remain in good cond1uon for up to 120 days. CA storage rooms are refrigerated hermetically-sealed rooms in which the oxygen level is reduced from the normal 20.5 percent to around 1 percent CA rooms provide for long-term storage as the apples remain in good condition for up to I year.
The commercially most important use of apples is fresh-market fruit. The primary criterion for the fresh market is eye appeal: apples that have good color and shape and are free of surface blemishes are sold as fresh-market fruit Quality is also determined by such factors as crispness and taste; size affects price as well, although a high-quality small apple can command a higher price than a low-quality large apple. The second major use of apples is for processing or canning. The p~cipal proces~ products are applesauce, apple JWce, sweet apple cider, and apple cider vinegar. Other important products include canned, frozen, and dried apple slices. Canning apples ("peelers") must be over 2-1{2 inches in diameter; they may have surface damage since they will be peeled in the process of making apple sauce or slices, but they must be round so the peeling machines can handle them properly. The last major use of apples is for juice. The sources of juice apples traditionally are sort-outs, orchard-run fruit, weather-damaged fruit, drops, and leftovers from other grades. The share of apples destined for the fresh market and for processing in the United States and Canada in 1989 is shown in figure I-la, and their shares in Washington State and British Columbia are shown in figure 1-1 b. ·
Although apples are commercially grown in 36 States and 5 Provinces, the bulk of apple production takes place in the Pacific Northwest. Washington State apple growers produced 50 percent of the total 1990
Figure 1·1A Apples: United States and canada, fresh and processed, 1,000 pounds
Frnh market. 5,913,492
United States 1989
Procet1.,,d 4,052,100
Source: International Apple Institute and Agriculture Canada.
Figure 1·18
Fresh market• 634,230
canada 1989
Processed 549,038
Apples: Washington and British Columbia fresh and processed, 1,000 pounds
Freair market. 3,295,000
Washington 1989
Procnsed 1,304,000
Source: International Apple Institute and Agriculture Canada.
U.S. apple crop, and British Columbia accounted for 31 percent in Canada; combined, these two areas accounted for 48 percent of both countries' apple production in 1990. Figure 1-2 shows the comparison, by production, of the United States and Canada, as well as the relative importance of Washington State and British
F1'9•h market• 284,718
Procened 154,286
British Columbia 1989
Columbia. Delicious apple production dominates total apple production in this region, as well as in the North American fresh apple market overall, accounting for 51 percent of the combined apple crop in the United States and Canada in 1990 and averaging 55 percent during the study period. As shown in Figure 1-3,
1-3
Figure 1-2 Apples: total apple production by specified area
Source: lntemational Apple Institute and Agriculture Canada.
Washington State is clearly the major producer of Delicious apples in the United States, and British Columbia, while the major producer of Delicious apples in Canada, is a small producer relative to its neighbor to the south. Given the irnponance of the Pacific Northwest in terms of total production and the irnponance of
1-4
1989 1990
C:=J Other Canad•
~OtherU.S. =::; Brltl•h Columbia
.. Washington
Delicious apples in the North American market, this examination of the competitive conditions in the United States and Canadian apple markets focuses primarily on those conditions applicable in Washington State and British Columbia.
Chapter 2 The U.S. Industry and Market
The U.S. Industry
Production Apple production is the largest noncitrus tree-fruit
agribusiness in the United States. During the last two decades, apple production in the United States has been increasing. There have been increases in the acreage planted and the standard-size trees have been replaced with dwarf and semidwarf trees, principally during the late 1970s and early 1980s. Total U.S. apple production in 1990 is estimated at 9.7 billion pounds, valued at $1.29 billion. The principal varieties of apples produced in the United States (figure 2-1) are Red Delicious (44 percent of total production in 1990), Golden Delicious (16 percent}, Granny Smith (7 percent), and Mcintosh (6 percent).
Acreage Planted and Harvested and Ge0grapbic Distribution
According to the 1987 U.S. Census of Agriculture, apples were produced on 36,718 fanns, with over 69 million apple trees on 601,021 acres. During 1978-87, there was a 6-percent decrease in the number of fanns, a 48-percent increase in the number of trees planted, and an 8-percent increase in the number of acres producing apples, as reported by the last three editions of the U.S. Census of Agriculture.:-Increased -
Figure 2·1
plantings in the late 1970s and early 1980s caused an upttend in production in the late 1980s; production is expected to level off by the turn of the century. Nationally, dwarf and semidwarf trees are replacing standard-size trees as the latter are taken out of rotation.
As noted in chapter 1, apples are grown in all 50 States. However, 7 States-Washington, New York, Michigan, California, Pennsylvania, North Carolina, and Virginia-together accounted for 85 percent of total U.S. apple production in 1990; Washington alone accounted for about one-half of total U.S. production. Statistics on apple production in the continental United States is reported on the basis of Western, Eastern, and Central regions. Figure 2-2 shows these three regions and the seven major apple-producing States.
The majority of U.S. apples are produced in the Western region. Red Delicious and Golden Delicious are the major varieties produced in Washington State-in the valleys of Yakima and Wenatchee, and the Columbia River Basin-Oregon, and Idaho. In California, Granny Smith, Red Delicious, Pippin, and Golden Delicious are the major varieties grown.
The principal apple-producing States in the Eastern region are New York, Pennsylvania, Virginia, and North Carolina. The varieties of apples produced and hence the end uses of apples in this region vary widely from area to area. For example, in eastern New York, approximately 65 percent of the apples produced are for fresh-market sales, but in western New York, about 80 percent of production is processed. The leading fresh-market apples produced in the region are. Mcln·tosh, Cortland, Spartan, Idared, and Empire.
Apples: Major U.S. varieties 1987and1990 production, 1,000 pounds
1987
-
Granny Smith 443, 1'10
Al/other 3,04'1,968
Source: International Apple Institute.
1990
-
lfclnto•h • . 623,700
2-1
Figure'2-2 . _ Apple producing reglo~s a~d .. 7 major producing states
Source: International Apple Institute, Mclean, Virginia.
'nie Central region's largest producer~ Michigan, which is also the major U.S. producer of processing . apples; about two-thirds of Michigan's annual ·apple
· - crop is sold to processors. The region's major varieties · are the Jonathan, Red Delicious, and Mcintosh.
All U.S. regions produce both Red Delicious and Golden Delicious apples, although Washington State is the predominant producer of both; these varieties vary · considerably in size depending on the region in which they. are produced, with the largest being produced in the Western region. The Mcintosh apple, grown in all three regions, was the third leading variety pl'Qduced in the United States until 1989, when the Granny Smith supplanted iL The Granny Sinith is grown predominantly in the Western region, specifically California.
Trends in Varieties and Utilizati9n
All varieties of apples may be used for fresh-market sales or for processing. However, some varieties are intended primarily for the fresh market (e.g., Red Delicious, Mcl~tpsh, and Granny Smith), and others are ·noted for their U.se in processing (e.g., York and Northern Spy). Some varieties (e.g., Golden Delicious and Rome) are well suited for both uses. As indicated in table 2-1, during the study period, total U.S. production of apples increased by 23 percent. Production of the leading variety, Red Delicious, increased by 39 percent; that of Golden Delicious, by 11 percent; Granny Smith, by 165 percent; and Mcintosh, by 4 percent. The following tabulation lists the leading varieties available in the United States and their principal uses:
2-2
Fruh-marlcet
Red Delicious Mcintosh· Winesap Granny Smith Empire
Processing
York Rhode Island-Greening Gravenstein NonhemSpy
Dual-pJ1Tpose
Golden Delicious Rome Jonathan Stayman Conland Newton I dared
During 1986-90, fresh-market use of apples in the United States increased regularly, with a sharp increase in the bumper crop year of 1987 (table 2-2). The fresh-market share of apple utilization increased during the period from 57 to 59 percent Utilization of apples in processed products varied widely, depending on the size of the crop; most of the variation was in use in juice and cider. Of the apples processed during 1986-89, 53 percent were processed into juice or cider, 32 percent were canned, 7 percent were frozen, 7 per·cent we~ dri~. and the remainder were processed into other products. ·
Distribution
In the United States, apple growers may deliver their apples to a cooperative or private packinghouse, sell orchard-run fruit to a cash buyer on the spot market, or market their own fruit
Growers must belo!lg to the cooperative organization to market through a cooperative and share in the proceeds from the cooperative's sales. Some cooperatives specialize in handling apples for processing;
Table 2·1 Apples: U.S. production, by variety and by region, 1986-90
(1,000 pounds)
Variety/region 1986 1987 1988 1989 1990
Red Delicious: Eastern ................................... 537,600 659,400 676,200 441,000 495,600 Central ................................... 198,828 366,240 234,780 305,760 201,600 Western .................................. 2,301,600 3,810,240 2,800,560 3,624,600 3,532,914
Total ................................... 3,038,028 4,835,880 3,711,540 4,371,360 4,230,114 Golden Delicious:
1 Dried, vinegar, wine, and fresh slices for pie making. 2 Not available.
Source:· Compiled from official statistics of the U.S. Department of Agriculture.
others may specialize in fresh-market fruit only.1 For membership in the cooperative, growers purchase stock in the cooperative, usually on the basis of apple tonnage. This gives them the privilege of delivering fruit to the cooperative for sale or processing in its plant. The profits of the cooperative are shared among the members.
Apple growers may also sell their orchard-run fruit to cash buyers on the spot market. Producers of domestic apple juice that are noncooperatives buy juice apples for cash at the going market price.2
1 At present, some cooperatives accept no new members, as is the case with Knouse Foods, a grower-owned finn located in Pennsylvania that produces processed apple products and juice. Knouse buys only processing and juice apples, not fresh-market apples. Knouse also purchases apples from nonmembers when there is additional demand. Tree Top, also a cooperative, similarly buys only processing and juice apples and has closed its membership rolls.
l Finns such as Duffy-Mott and National are noncooperative cash buyers.
2-4
The third marketing option is a do-it-yourself method whereby the grower invests in a packinghouse, storage facilities, and fresh-market packing equipment and/or fresh-juice-pressing equipment (e.g., cider mill). These grower operations, when large enough, sell fresh apples regionally, nationally, and internationally, or when smaller, locally.
Storage As discussed earlier, storage of apples is necessary
to ensure their availability and orderly marketing. Apple storage is generally a function of packinghouses. Regular storage, in refrigerated rooms, provides temporary storage in which apples remain in good condition for up to 120 days. Controlled atmosphere (CA) storage, in large, specially-constructed, hennetically-sealed rooms in which the oxygen level is reduced from the normal 20.5 percent to 1 percent. provides storage in which apples remain in good condition for up to I year.
Controlled-atmosphere (CA) storage capacity in the United States has been increasing; in 1989, it amounted to 4.6 billion pounds,3 up from the 3.9 billion pounds reported for 1987, as compiled by the International Apple Institute (IAl).4 According to the 1988 IAI survey, 580 facilities had CA storage capacity in 1987. The 4.6 billion pound storage capacity in
· · 1989 is equivalent to roughly 40 percent of total annual U.S. apple production, or 75 percent of U.S. fresh-market apple sales. This CA capacity is located in 23 of the 36 commercial apple-producing States. Washington accounted for 3.5 billion pounds of this storage, or 75 percent of the national total; Michigan, New York, and Vuginia, together, accounted for another 15 percent, as shown in the following tabulation:
Million pounds
Washington ................................... . Michigan ..................................... . New York •....•.... : .......................... . Vuginia .......•............................... Oregon .........................•.............. Pennsylvania .................................. . All Olher .....•.•...............................
CA storage facilities are usually much larger in the Western than in other regions. In the Western region, a typical facility had an average capacity of 13.7 million pounds per facility in 1987; this compares with 2.9 million pounds per facility in the Central region and 2.3 million pounds in the Eastern region.
Eleven States, accounting for 85 percent of total U.S. CA capacity, provided informa~on for periods 5 and 10 years prior to the IAI survey. On the basis of this information, it is estimated that national CA capacity increased by 672 million pounds during the.preceding 5 years, or by 26 percent, and by 1.4 billion pounds during the preceding 10 years, or by 76 percent. In addition, the data indicate that more than 90 percent of the national growth over the preceding 10 years occurred in the State of Washington; Washington CA storage capacity rose by 86 percent in the preceding 10 years, thus providing fresh-market apples to consumers all year. Over this same 10-year period, CA capacity in the Eastern region grew by 24 percent. The historical information for the Central region was incomplete.
Handling
In the United States, there are approximately 1,215 packinghouses that handle and market fresh and processed apple products. These packinghouses are
3 Data from USDA, National Agriculwral Statistics Service; cited in T.C. Butler and C.R. Andenon, 199() Apple Crop Statistics and Market AMlysis (American Agriculwral Marketing Association, July 1990), p. 61.
4 International Apple Instiwte, /Al COlllrolled Atmosphere (CA) Storage Capaciry Survey National Summary (McLean, VA: January 1988).
(1) privately owned and pack their own products exclusively, (2) privately owned and pack their own and others' products, or (3) owned by cooperatives. In the Eastern region, there are approximately 549 packinghouses, most of which are privately owned. The Central region has about 397, also most of which are privately owned. The Western region has approximately 269 packinghouses5 that routinely handle their own production; those packinghouses in Washington are divided almost equally among the three types, but most of those in California are privately owned.
Grading Product quality in apple marketing is important be
cause poor-quality apples cannot be sold in the fresh market and must instead be processed, where they bring significantly lower prices for the grower. For apples good enough for the fresh market, product attributes have mainly to do with the demand for one type of apple over another, and not with apples in general. In addition to price, there are several quality attributes of apples that cause consumers to prefer one variety over another:
• Crispness (crisp or mealy)
• Size (small, medium, or large)
• Color (uniformly red, uniformly green, red-green combination, or yellow)
• Flavor (sweet or tart) .... ' Apples are graded according to certain of these at
tributes. The U.S. Deparunent of Agriculture (USDA) has established a system of nonmandatory grade standards for apples in the United States (46 F.R. 63203). These standards generally relate to such characteristics as product size, color, tolerances, quality, general appearance, ·and state of maturity. Apples are classified into five grades: U.S. Extra Fancy, U.S. Fancy, U.S. No. 1, U.S. Utility, and Combination. Also, the Export Apple and Pear Act (48 Stat. 123; 7 U.S.C. 581 et seq.) provides for minimum requirements for apples offered for export; in general, exported apples must be at least U.S. No. 1. Though the grade standards are not mandatory for domestically sold fresh-market apples, an estimated 30 percent of the fresh-market apples sold in the United States are sold under these Federal grades.6
Many States have their own grade standards, most of which are higher than the USDA standards.7 Washington State's grades are Washington Extra Fancy and Washington Fancy; requirements state that apples with those grades be equal to qr better than U.S. Extra Fancy
' International Apple Instiwte, Numbers of Apple Storages! Pacurs and Storage Holdings November l, 1989 and 5-year Average by Major Region.r (McLean, VA: July 1990).
6 Staff convenations with officials of the Agriculwral Market· ing Service, U.S. Department of Agriculwre, June 1991.
7 Staff convenation with Bill Bryant, vice president for International Affairs for the Nonhwest Horticultural Council, Yakima, WA.
2-5
and U.S. Fancy. New York State Seal of Quality contract specifications require apples with the seal to be of better quality than U.S. Extra Fancy.
The U.S. Market
Marketing and Pricing The U.S. apple market is typical of many agricul
tural markets in its highly competitive structure. There are hundreds of buyers and thousands of sellers dealing in fungible, largely homogeneous, and, in the fresh market, perishable products. Entry into the industry is not particularly easy, especially in the short run; growers must invest capital and several years in developing apple orchards, and processors and distributors face the fixed costs of capital and brand-name development. Exit is similarly constrained in the short run by fixed costs. However, in many regions the ready availability of alternative outlets for apples (e.g., fresh versus juice markets) means that price changes can affect the quantities supplied and demanded in any one of these markets, even in the short run.
Individual growers are too small and numerous to influence market prices significantly; as noted earlier, in 1987 there were some 37,000 orchards with apple trees. For these producers, marketing is not complex, they simply deliver their apples to buyers at prevailing market prices or deliver to cooperatives that do the marketing for them. Futures contracts, crop switching, and other management options available to producers of grains and other crops are generally not available to .. tree-crop growers. Although many apple growers have organized into cooperatives to, among other things, boost their bargaining power vis-a-vis the more concentrated processing and distribution sector, no cooperatives or growers are large enough to exert significant influence over grower-level prices. Particularly in the Eastern and Central regions, growers or their cooperatives have some ability to shift their apples between the fresh market and the various processed-apple markets as relative prices dictate.8 Another marketing option available to all growers, either individually or through their cooperatives, is to withhold supplies (at the risk of spoilage and the expense of storage) with the hope of higher prices .in the future.
In the United States, the function of marketing a commercial fresh-apple crop is much the same throughout the three regions. In areas that concentrate on the fresh market, sales normally are by the grower/ packer. These sales occur at the field, at the grower's privately owned packinghouse, or at grower-owned cooperatives. Sales may also be through a broker on a commercial basis. At the retail level, an estimated 75 to 80 percent of domestic fresh-market sales are made through supermarket chain stores. The remainder are sold through smaller retail outlets, institutional sales, roadside stands, and farmers' markets.
B In the Western n:gion, this option is not as significant, because the orchards then: an: gean:d abnost exclusively to the fn:sh markeL
2-6
Apples for processed products are sent by truck from th~ orchards or storage warehouses to the processor's facilities. Here they are washed, sorted, graded, and categorized either as peeler _apples to make sauce/ slices or as juice apples to make juice. Juice apples for processors that strictly make juice are also purchased directly from the orchard. Processors market their products through their own sales staff, through regional food brokers, or through wholesalers; they generally purchase their apples directly from growers or packinghouses.
Quality of U.S. Apples
U.S. industry sources, including the IntematiOnal Apple Institute and the Northwest Horticultural Council, indicate they believe that the quality of U.S. fresh-market apples available for sale in the U.S. and foreign markets has been high and has increased in recent years, principally as a result of the increased capacity of CA storage and the development of niche markets. These factors have resulted in the availability of high-quality domestic apples throughout the year.
Trade During the last 2 decades, the United States has
consistently been a substantial and growing net exporter of fresh apples. In 1990, exports (796 million pounds, valued at $213 million) were more than triple the volume of imports (234 million pounds, valued at $40 million). In that year, exports of fresh apples were equivalent to about 9 percent of total U.S. production, and imports, to about 2 percent. Canada is the United States' major trading partner, suppling nearly one-half of all U.S. apple imports and receiving about one-quarter of total exports. On December 22, 1988, Revenue Canada imposed antidumping duties on certain apples imported from the United States (see the section in Chapter 3 on Canadian Tariff Treatment for additional information).
U.S. trade in processed apple products has been dominated by imports of apple juice, which in 1990 were valued at $172 million. Imports of other prOducts have been small, dried apple imports were valued at $4 million in 1990, and those of prepared or preserved apples, at $2 million. U.S. exports of processed apple products also have been mostly apple juice. Apple juice exports in 1990 amounted to $39 million and went principally to Japan (58 percent) and Canada (22 percent).
U.S. imports
During 1986-90, Canada was the leading supplier of fresh apples to the United States, accounting for nearly 40 percent of total imports, by volume. In 1990, imports of apples from Canada reached 114 million pounds, valued at $15.6 million (table 2-3). New Zealand, Chile, and Argentina accounted for virtually all the remaining imports in 1990.
Table2-3 Fresh apples: U.S. Imports for consumption, by prlnclpal sources, 1986-90
.Source 1986 1987 1988 1989 1990
Canada ................................... . New Zealand ............................... . Chile ...................................... . Argentina ......... .-........................ . Grenada ............... · ...................... .
~I~.:::::::::::::::::::::::::::::::::::: United Kingdom ............................. . All other ......... : ......................... .
1 Not applicable. ·Note.-Due to rounding, data may not add to totals shown.
Source: Compiled from official statistics of the U.S. Department of Commerce.
Imports as a share of U.S: consumption have fallen steadily from a high of 3.7 percent in 1986 to 2.6 percent in 1990: Although no official U.S. statistics are collected on imports by variety, it is believed the majority of apples imported from Canada are Red Delicious and Mcintosh.
Data are not available on the consumption of imported apples by region. Data are available on the entry of imports through individual customs districts; however, it is believed that a substantial portion of the imports entering a particular customs district passes through to other areas of the country for consumption.
Analysis of imports from Canada by individual customs districts indicates that during 1986-90, the top two ports of entry together accounted for two-thirds of the total quantity of imports from Canada, and the top five, for about 94 percent, as shown in the following tabulation (in percent):
U.S. imports of fresh apples showed a downward ttend during 1986-90. This trend is a result of increased U.S. production (both total and of such newer
· varieties as Granny Smith) and expanded CA storage, which have made imports, with the exception of those from Canada, less necessary to supply U.S. consumers with a range of apple varieties throughout the year. Also, many foreign competitors have been marketing aggressively in countries with less production than the United States, where they can compete more favorably.
2-7
U.S. tariff' treatment
Imported apples and apple products are provided for under Harmonized Tariff Schedule (HTS) subheading 0808.10.00 for fresh apples, 0813.30.00 for dried, 2008.99.05 for otherwise prepared or preserved, and 2009.70.00 for juice (see app. D). Fresh apples enter "free" of duty, dried apples enter at a rate of duty of 1.1 cents/kilogram, and apples otherwise prepared or preserved enter at a rate of duty of 0.8 cents/kilogram. The current rates of duty applicable to imported apple juice are "free" for products from countries eligible for column 1 treatment and 1.3 cents/liter for products of column 2 countries. Imports of apple juice from the European Community (EC) are subject to nonrestrictive quotas of 531,240,000 liters for juices not mixed and not containing over 1.0 percent ethyl alcohol by volume. Jams and jelly, provided for under HTS sub-
Table2-4 Fresh apples: U.S. exports, by principal markets, 1986-90
Market 1986
headings 2007.99.45 and 2007.99.75, respectively, both enter at a column 1 rate of duty of 7 percent ad valorem and a column 2 rate of duty of 35 percent ad valorem; pastes and purees (HTS No. 2007.99.48) enter at 15 and 35 percent ad valorem, respectively, for column 1 and column 2 rates of duty.
U.S. exports
During 1986-90, U.S. exports of fresh apples increased steadily (with the exception of 1989, following the Alar scare of 1989) and averaged 632 million pounds, valued at $150.4 million (table 2-4). The leading export markets, by volume, were' Canada, Taiwan, Hong Kong, the United Kingdom, Saudi Arabia, Thailand, Singapore, and Mexico. Together, these 8 countries accounted for 76 percent, by volume, of U.S. exports during 1986-90.
Source: Compiled from official statistics of the U.S. Department of Commerce. except for 1986-89 exports to Canada which are from Agriculture Canada.
2-8
· The rates of duty for the principal markets for U.S. fresh apple exports are shown in the following tabulation (all duty rates are ad valorem): H~g Kong ........................ -........ .
duty-free duty-free 10 percent 20percent. 20 percent SO percent
Imports into the United Kingdom (and the rest of the European Community) are assessed a sliding rate of duty determined by the date of entry: Aug.I-Dec. 3I . . . . . I4.percent c.il., with a minimum charge of
2.4 ECU per IOO kg. Jan. I-Mai: 3 I . . . . . 8 percent c.i.f., with a minimum charge of
2.3 ECU per IOO kg. Apr. I-Jul. 3 I . . . . . . 6 percent c.i.f., with a minimum charge of '
· 1.4 ECU per IOO kg.
In addition, Mexico is currently considering implementation of a_ phytosanitary certification program; however, industry sources indicate that this would probably have little if any adverse effect on U.S. exports, which would most likely be able to meet such phytosanitary requirements. In Thailand, there is currently underway a study of the extent of the presence of the coddling moth, an insect that is common to the United States and which can be transmitted in apple shipments. The study is reportedly expected to be completed by the end of 1991.
During 1986-90, U.S. apple exports rose irregularly from 5 to 9 percent of production as a result of ·aggressive marketing by U.S. interests and successful.efforts to eliminate foreign trade barriers. These continuing . efforts are expected to increase exports to the EC, Mexico, and various Pacific Rim countries.
U.S. Government Programs In the United States, Government involvement in
the apple industry is at both the Federal and State level. Although there are no Federal programs, or any kind of price suppon or deficiency payments specifically for apples, there are a number of Federal- and State-supponed programs that affect apple producers. There are also a number of Federal and State Government operations providing related nonfinancial services, such as research and development programs. Since most of these programs are not product specific, apples are not the only commodity they affect The following is a brief review of current, recent, or proposed Government actions affecting apple producers.
Under the Food, Agriculture, Conservation, and Trade Act of 1990, the Targeted Expon Assistance (TEA) program, initiated under the Food Security Act of 1985, has been replaced by the Market Promotion Program (MPP). Under the MPP, the USDA is mandated to use Commodity Credit Corporation funds or commodities to "encourage the development, maintenance and expansion of commercial expon markets for cost share assistance to eligible trade organizations that implement a foreign market development" The TEA
program requirement limiting eligibility to coniinodities adversely affected by unfair foreign trade practices is eliminated in the MPP. However, such commodities are considered a priority for panicipation in the MPP; once their promotional needs have been satisfied, consideration may be given to assisting other commodity groups. The following tabulation shows funds allocated and approved under the TENMPP for use by the Washington State Apple Commission in international promotions (in millions of dollars):9 .
The USDA purchases fresh apples and apple products for use in various nutrition and feeding programs. Government expenditures on such purchases during fiscal years 1986-90 ranged from $2.9 million in 1987 to $33.9 million in 1988; expeditures in fiscal year 1990 amounted to $29.5 million.IO
The sale of all fresh and frozen fruit into interstate and foreign commerce is covered under the Perishable Agricultural Commodities Act of 1930 (PACA) (7 U.S.C. 499a). PACA is administered by the USDA's
· Agricultural. Maiketing SeiviCe. Its purpose· is to pro~ tect,buyers and sellers, including foreign sellers, of perishable items from unfair and fraudulent trade practices, and to enforce marketing contracts so that sellers, including foreign sellers, are paid promptly. All brokers, commission merchants, shippers, growers' agents, and dealers (including jobbers, truckers, wholesalers, and retailers) that trade in large quantities at a wholesale level must be licensed and must observe all rules of fair trade under PACA.
Domestic growers must comply with the marketing, storage, and use requirements of the pesticide materials they use, as regulated by the Environmental Protection Agency. They are required to manage carefully the application of pesticides and to keep accurate records of usage to ensure against illegal pesticide residues on fruits offered for sale.
The Food and Drug Administration (FDA) administers the Federal Food, Drug, and Cosmetic Act (FFDCA) to protect the public from food contamination, including contamination from exposure to illegal pesticide residues in imported and domestic food. Under its pesticide monitoring program, FDA collects and analyzes samples of shipments of imponed and domestic food to determine whether illegal residues are present. During 1987-91, the FDA detained 192,000 pounds of fresh apples from Canada and Chile.
Since 1912, Federal plant quarantines and regulations (7 CFR 319) have been in effect for numerous fruits, including apples, to prevent the spread of injurious plant pests. These provisions are administered by the Animal and Plant Health Inspection Service (APlilS) of the USDA. They require that imponers obtain pennission to enter fresh or frozen fruit into the United States. In addition. evel}'. shipment is subject to inspection at the port of entry.11 When a particular crop of a producer country is host to an unwanted pest, permission for entry is denied unless an acceptable treatment program has been established. APlilS administers similar programs for domestically produced fruits. With regard to fresh-apple imports from Canada. APlilS is primarily concerned with the ennine moth. The ennine moth, which is not found in the United States, can be found as a hitch hiker in shipments of fresh apples. The United States does not inspect for ermine moth if the shipment is certified by authorized regulatory officials of Canada as being pest-free.
Certain programs relate specifically to fruit processing. One such program, administered by the Occu-
11 Excluding entries from Canada.
2-10
pational Safety and Health Administration, contains safety regulations applicable to plant workers. I 2 Product quality and identity and proper filling of containers are regulated by the FDA, and processors must adhere to these regulations. The contents and placement of information on package labels must be in accordance with regulations of the Fair Packaging and Labeling Act, and additional requirements of the FFDCA must be met, ensuring that the processed fruit is produced under sanitary conditions; that all packaging and labeling is infonnative, truthful, and in no way deceptive; and that the finished products are pure, wholesome, and safe to eat.
There are State marketing orders currently in place in most of the leading apple-producing areas. Marketing orders are in place in Washington, Michigan, New York, the New England States, Pennsylvania, Virginia, West Vrrginia. North Carolina, Utah, Ohio, Idaho, and Maryland. Growers pay into the marketing program on the basis of the amount of apples they sell. These fees are then used for advertising, promotion, public relations, and merchandising. These State marketing orders cannot have quantitative controls.
ii Buckley et al., U.S. Frwil Qlld Vegetable Processing /Nbutriu.
I
Chapter 3 The Canadian Industry
and Market.
The Canadian Industry
Production. Apples are Canada's most important fruit crop in
terms of both volume and value of production. In 1989, apples accounted for 65 percent of the quantity of all fruit produced in Canada (85 percent of all tree fruit) and 35 percent of the farm value of all fruit. Apple production in Canada has increased over the past 20 years, although the past 4 years have been stable. As table 3-1 indicates, production averaged 1.1 billion
Table3-1
pounds, during 1986-90; 1986 was a down year because of severe weather. At the same time, although apple production has been increasing and apples have retained a significant share of total fruit production in Canada, their share of the farm value of all fruits has declined significantly over the last 25 years. I
Total fresh Canadian apple production for 1990 has been estimated at 1.1 billion pounds, 2 down from 1.2 billion pounds in 1989. Sales of all apples and apple-related products in Canada totaled an estimated Can$600 million,3 with the value of production at the farm level in 1990 at Can$121 million.4 The Canadian
1 Eli:zabeth Campbell, Apple Industry ProFile (Ottawa: National Fann Products Marketing Council, June 1990), p. 2.
2 Frwil and Vegetable Production, Catalog #22-003, p. 13. 3 Tiu Canadian International Trade Tribunal (February 20,
1990), p. 4. 4 Fruil and Vegetable Production, Catalog #22-003, pp. 10-13.
p
Canadian apple production, by variety and by Province, 1986-90 (1,000 pounds)
Total ................................... <2> 177,532 212,518 197,086 1 Because of changes in me,!hodology, production figures are not available for Quebec apples by variety in 1986. 2 Not available.
Source: Statistics Canada, Fruit and Vegetable Production, 1986-90.
1990
138,600 17,010
202,062 410,860 346,540
1, 115,072
50,400 8,190
123,312 181,100 102,000
465,502
9,660 83,630 J
172,000
265,290
12,180 50,244
62,424
9,544 65,244
55,700
18,900 5,040
26,040
49,980
49,054 3,430
47,818 78,332 15,278
187,912
3-1
apPle industry directly hires approximately 15,000 full~ and part-time· workers at the fann level, representi"f about 13 percent of total agricultural employment, · There are approximately 5,000 workers employed at the processing level, and an additional 10,000 to 15,000 workers in support jobs (e.g., chemical, mechanical, packaging, transportation, financing, retailing) that depend on the apple industry.6
Table 3-2 shows the acreage of bearing and nonbearing apple trees in Canada for 1986. 1988, and 1989, the only years during the study period for which data are available. The total number of acres devoted to apple production has fallen in all Provinces except British Columbia, where total acreage rose by less than 1 percent Ontario has by far the largest area planted, but its productivity per acre is substantially less than that of British Columbia.
Acreage Planted and Harvested and Geographic Distribution
Apples are grown throughout Canada on a~roximately 8,000 fanns, using about 112,000 acres. Although some production occurs in virtually all Provinces, the principal growing regions are in British Ccr lumbia, Ontario, Quebec, New Brunswick, and Nova Scotia (fig. 3-1). The average apple orchardin Canada has just under 14 acres, but the size ranges from less than 1 acre to over 128 acres (there are about 48 orchards over 128 acres). Nova Scotia has the largest orehards averaging 22 acres of apple trees; the average in other provinces ranges from 14.5 acres in Quebec,· 10 acres in New Brunswick. 9.6 acres in Ontario, to the smallest at 6.9 acres in British Columbia. ·
Trends in Varieties and Utilization
As figure 3-2 illustrates, the Mcintosh is the most widely produced apple variety in Canada, consistently
5 Apple. lndwstry Profile,. p. S. 6 Ibid. 7 The Barrie Report.
Table3-2
accounting for about 35 to 40 percent of ~tal Canadian apple production. This contrasts markedly with prcr duction in the United States, where the Mcintosh typically accounts for only 5 to 7 percent of total annual production. The Mcintosh is produced in all of the five major apple-growing Provinces, but primarily in Ontario, Quebec, and British Columbia. It is the most commonly grown variety in all of the major producing Provinces except British Columbia. In contrast with current consumer preferences in the United States, Canadians reportedly prefer Mcintosh over Delicious apples.
The Delicious apple-particularly the Red Delicious-is the second most widely grown variety in Canada. Although substantial quantitie5 of Delicious apples are grown in Ontario and Nova Scotia, British Columbia typically accounts for 65 percent of total Canadian production of this variety. Production of the original Delicious variety, which is red with yellow streaks, has been declining in the last decade in favor of the Red and Golden Delicious. 8 British Columbia is ideally· suited for growing Delicious and Spartan apples, which grow better in the hot, dry weather conditions of the Province's interior valleys. The Red Delicious is primarily a fresh-market apple; the Golden Delicious is a dual-purpose variety that can either be sent to the fresh market or used for processing.
The other principal varieties grown in Canada include the Northern Spy, Cortland, and Spartan. Tcr gether, these varieties constitute 15 to 20 percent of Canada's total apple production in a given year. The following tabulation summarizes the varieties available in Canada and their common uses.9
8 Agriculwre Canada, A Stwly of Canada's Apple lndvstry. P· 10.
9 TM EjfecJ of U.S. Deliciows Apple &ports on CtJNUJian Deliciows Apple Growers. Prepared for the Canadian Import Tribunal, p. 26.
Canadian acreage of bearing and nonbearlng apple trees,, by Province, 1986, 1988, and 1989
Province
Nova Scotia ............................. , .......... .
Source: Request for a Canadian Apple Marketing Agency, app. 11, p. 25.
3-2
1988 1989
9,980 9,660 9,740 9,485
240 175 1,580 1,550 1,220 1, 190
360 360 19,815 19,820 16,690 17,010 3,125 2,810
30,390 30,190 27, 190 27,050 3,200 3,140
19,350 19,220 18,350 18,150 1,000 1,070
81,230 80,560 73,275 74,965 7,955 5,595
Flgure3-1 Major apple producing provinces
Source: !Agriculture Canada.
Flgure3-2 Major canadlan varieties, 1987 and 1990 production, 1,000 pounds
Allom.,. 371,Gf
Source: Agriculture Canada.
1987
Allot,,.,. 384,280
1987
3-3
Fresh-marlc.et
Red Delicious Mcintosh Winesap Granny Smith F.rnpire Spartan
Processing
York Greening Gravenstein
Dwal-purpose
Jonathan Golden Delicious Rome Stayman Newton Conland I dared NonhemSpy Mutsu Lobo'
Apple processing in Canada is concentrated mainly in the manufacture of apple juice, which uses, on average, about 35 percent of Canada's total apple production in a given year. Only about 5 percent of total production enters the processing market for other apple products. Juice apples are primarily overripe or damaged, and the bulk are available for processing during the fall harvest Small quantities of Canadian apples are sent to juice processors during the winter as a result of culling in the fresh-market packing line. Processors of apple juice are located primarily in British Columbia, Ontario, Quebec, and Nova Scotia.
Although Canada produces significant volumes of apple juice, it produces only negligible amounts of apple juice concentrate. The technology for concentrating apple juice is highly sophisticated, very expensive, and constantly changing; thus, the costs of concentrating apple juice in Canada are deemed orohibitive relative to those of other WClrld suppliers.10 The leading suppliers of apple juice concentrate to the Canadian market are Germany, Austria, and Hungary, accounting for about 55 percent of such imP<?rts in 1986, the last year for which data are available. 11
Table 3-3 shows total apparent consumption of domestic fresh-market apples in Canada during 1980-89. The table suggests that a large apple crop leads to a higher percentage of Canadian apples being used in processing. Data indicate that total apple consumption in Canada has remained relatively flat at approximately 26.pounds per capita since 1960.12
10 A Study of Canada's Apple Industry, p.14. 11 Because of the changeover to the Hannonized System, tn1de
data for apple juice concentrate are not available after 1986. 12 Apple /ndwstry Profile, 1990, table 36.
Table3-3 · .
Distribution
In Canada, the distribution of fresh apples to their destination depends primarily on the Province in which they are grown. In British Columbia, the majority of the Provincial crop is sold through B.C. Tree Fruits, Lt. (BCTF), a grower-owned cooperative that markets members apples. Three other Provincial organizations-the Ontario Apple Marketing Commission, the Federation des Producteurs de Pommes du Quebec, and the New Brunswick Apple Marketing Board-have pricing committees that meet regularly throughout the marketing season to establish a recommended minimum price, free on board (f.o.b.) packinghouse, for all fresh apples grown in their respective Provinces. Because these three organizations meet frequently, Canadian industry officials believe that the prices they establish reflect the forces of supply and demand for each variety. Directors and/or members of the board of these organizations are elected and include representatives of growers, dealers and brokers, processors, retail traders, and consumers.13
Storage
On average, approximately 60 percent of Canada's total apple production enters the market as fresh-market apples. Significant improvements in controlled-atmosphere (CA) storage have increased the storage life of several fresh-market varieties, such as Mcintosh and Golden Delicious. This factor has acted to increase year-round availability of fresh-market apples in the Canadian market. However, there is sufficient CA capacity for only about 30 percent of a year's production. As a result, 70 percent of the apple crop must be sold
13 Based on ITC staff conversation with Crosby Mitchell at . the Ontario Apple Marketing Commission, January 25, 1991. He · described the basic functions of this organization, which are probably representative of the other two organizations (in Quebec and New Brunswick). According to Mitchell, the Board of the Ontario Apple Marketing Commission comprises 23 members-12 growers (9 elected directly from their area, 3 al large), 5 apple dealers, 4 processors, 1 retail trader, and 1 consumer representative.
Apples: Canadian exports, sales to processing and apparent consumption of fresh-market products, 1986-90 (1.000 pounds)
Percent Percent Apparent con-sumptionof
of pro- Sales to of pro- domestic fresh Year Production Exports duction processing duction marl<et apples
Source: Apple Market Review, Agriculture Canada, 1986-90.
3-4
within 4-5 months of harvest; this inhibits orderly marketing in Canada and puts downward pressure on apple prices during these first months.14 As shown in Table 3-4, supplies in storage are highest in late fall and the early winter months, just after harvesting, and lowest in the summer months.
Handling .As in the United States, storage of Canadian apples
is a function of the packinghouses that handle the apples from the time they are picked. Although an estimated 200 packinghouses are equipped to handle apples, approximately 95 percent of the fresh-market apple crop is handled by about 100 packinghouses. In British Columbia, most of the packing is done by cooperatives, while in the eastern Provinces, most packinghouses are privately owned.
14 The technology for CA storage clearly exisu, but the Commission was 1U1able to discover why it has not been widely adopled by the Canadian industry.
Table3-4
Grading
The grading system in Canada is based on uniformity of size and shape; minimum and maximum diameter. color; maturity; and freedom from disease, pests, or damage. Apples intended for the fresh market are graded and packaged as either Canada Extra Fancy or Canada Fancy, according to the regulations set by the Canada Agricultural Products Standards Act. Apples intended for processing are graded as Canada Commercial. Most of the Provinces have grading standards that are similar to those of the Federal Government.
The Canadian Market
Marketing and Pricing The sale of fresh and frozen fruit in Canada is cov
ered by Agriculture Canada under the Licensing and Arbitration Law. This law was established in 1934 and
Apples: Canadian controlled-atmosphere and total storage, by Province, Nov. 1, 1989-June 1, 1990
Crop British Nova New year Columbia Ontario Quebec Scotia Brunswick
is patterned after the Perishable Agricultural Commodities Act (PACA) of 1930, which is administered by the U.S. Deparunent of Agriculture (see discussion· of PACA in ch. 2). The Canadian law is designed to ensure ethical trade practices by buyers and sellers of fruits and vegetables.
The marketing channels for apples in Canada differ among Provinces. In British Columbia, over 85 percent of the Provincial crop is sold through a grower-owned, "one-desk" sales agency known as B.C. Tree Fruits, Limited. BCTF was created in 1939 by its parent organization, the B.C. Fruit Growers Association, under Provincial legislation, to "co-ordinate the sales of their product and orchestrate shipments of fruit to distant markets."lS In 1983, there were reportedly 2,000 members, but as of 1989, that number appears to have declined to 1,500. This agency has been identified as having "by far the most encompassing powers" of any ~gional apple marketing agency in Canada.16 It has the power to set the cooperative's prices, product promotion and licensing, and the flow of information on inventories in each of the six cooperative packinghouses. The apples are pooled, then graded and priced at the packinghouse according to variety. The costs of packing, storage, and marketing are deducted from grower returns, which are based on the delivered fruit price.
Advertising allowances have also reportedly been offered to retailers who purchase apples from B.C. Tree Fruit Ltd. This program was reported to be in effect from late 1989 through early 1990. Neither the retailers nor the marketing organization would discuss this issue for the record. No other information was obtained during the course of the investigation that would reveal the extent of this marketing practice or its relationship to any other program or marketing practice.
About 70 percent of the British Columbia apple crop is sold in the fresh markeL Approximately 85 percent of the crop destined for the fresh market passes through the BCIF, and about one-fourth of that amount is exported. Of the 15 percent lhat is not marketed through BCIF, about one-third is sold through local farmers' markets, and about two-lhirds is sold independently to retailers or processors through standard marketing channels.
On average, about 30 percent of the British Columbia apple crop is sold to processors. Those growers who are members of BCIF sell lheir apples for processing to another cooperative organization known as Sun-Rype Products, Ltd. Sun-Rype is reportedly the largest juice manufacturer in Canada, with annual sales estimated at Can$50 million.17 It also produces other apple products and products thal use apples as one among several ingredients (e.g., fruit cocktail).
15 The B.C. legislation referred to here is the Natural Producu Marketing Act of 1934. See A Sllltly of CONJda·s Apple lndwtry, p. 9.
16 The CalUJdUut lnUrNJlioN.il Tratk Trib11NJI, p. 4. 17 B.C. Fruit Growen' Association, Celebrating JOO Frwilfal
Years£ p. 12.
3-6
In Ontario, apples intended for the fresh market pass through the traditional marketing channels of grower-packer-wholesaler-retailer. The Ontario Apple Marlceting Commission exerts some influence through these channels by suggesting minimum f.o.b. prices for fresh-market apples sold to distributors and juice apples sold to processors. About one-half of Ontario's apple crop is sold throi.;gh supermarket chains. "U picks" (orchards that invite consumers to pick their oWn) are more important to the Ontario apple industry than they are to the British Columbia industry. Ontario sells around 40 percent of its harvest to processors and about 10 percent to export markets, primarily the U.S. market.
La Federation des Producteurs de Pommes du Quebec and the New Brunswick Apple Marketing Board have powers similar to those of their counterpart in Ontario. Both have the authority to suggest minimum prices for apples at the packinghouse level. Whereas apple processing is apparently negligible in New Brunswick, over 40 percent of the Quebec output is processed. In both Provinces, fresh-market apples travel through the traditional grower-packer-wholesaler-retailer channels.
Nova Scotia is the only apple-producing Province that does not have a grower marketing organization. Processing here uses about 50 percent of total apple production. Local farmers' markets, U-picks, and exports account for about 10 to 15 percent of annual output, with 35 to 40 percent marketed through the grower-packer-wholesaler-retailer channel.
In the market for fresh Delicious.apples, the most_ -_ -important of these agencies is BCIF. BCIF markets about 85 percent of the Provinces's production of fresh-market Delicious apples, which in tum account for nearly 75 percent of total Canadian supply. IS BCTF "was developed to provide coordinated services and reduce grower-to-grower competition."19 The increased bargaining power BCIF provides to growers appears intended to counter the market power of fresh-apple buyers, which increases as one moves down the marketing chain. About 5,000 farms sell (individually or through cooperatives) to about 100 packinghouses, which in tum sell 95 percent of their output to the 4 or 5 food-store chains that dominate each re-gion in Canada.20 These chains, which with their smaller rivals number about 45 in the country as a whole, account for 85 to 90 percent of Canada's domestic apple sales. In addition, there are only about 70 apple-processing firms in the country as a whole, so that integration between BCIF and Sun-Rype, a British Columbia manufacturer and marketer of processed ap-ple products, helps British Columbia growers compete in that segment of the apple market as well. Thus, through BCIF, British Columbia apple growers are integrated both horizontally into a near monopoly on British Columbia fresh-apple sales, and vertically "downstream" into export sales of fresh apples21 and
l8 Apple /""11.rtry Profile, p. 20. 19 Ibid. 20 The Barrie Rcpon, p. 9, 26-27.
manufacturing and marketing of processed apple products.
Although apparently not a policy or practice of the Canadian national Government or any of the provincial governments, rebates reportedly have been offered to buyers of Canadian apples by at least one privately-owned Canadian marketing organization, B.C. Tree Fruit Ltd. These rebates are described as quantity discounts based on target amounts that are set by the marketing organization offering the rebates; such target amounts are established by variety. U.S. apple growers have expressed concern about these rebate programs apparently fearing that payments from the government ~tabilizati?~ programs provide Canadian growers with a compeuuve advantage by allowing them to make deeper discounts than would be possible without the government programs.
'f!te extent of this marketing practice is not known, as neither the buyers to whom the rebates have reportedly been offered nor the marketing organization would discuss this issue for the record. No other independent information has been obtained that would reveal anything more than examples of the targets and hypothetical estimates of the rebates should these targets be met or exceeded. We do know: however, that such rebates appear to operate much like quantity discounts and that such discounts are offered by many U.S .. marketing organizations.
Quality of Canadian Apples.
•U.S. anci Canadian sources . hav.e .stated .. thaLthe quality of Canadian apples available for sale in the Canadian market has declined in recent years. At least thr~ reasons have been given to support this assertion.
First, because prices are said to be declining in Canada, J.h~re is ~eportedly a propensity to export the best ~f tit,e Can~~tan crop to _areas where m~ket prices ~ ~i~~e.r. Bnus_h Columbia, for example, ships appro.ximately 25 pe~ent of its. crop-the majority of which are extra fancy-to the Pacific Rim, where apples are considered a specialty fruit and command a higher market price.
Second, recent Canadian studies have stated that grower returns in recent years may not have been sufficient to cover production costs. Many growers reportedly hav~ ~ad to find ~ff-farm em1;>loyment to supplement theli" mcome. ·This may contnbute to a loss in the overall quality of ·the Canadian crop, as less time is spent on pruning, spraying, and overall care of the orchards.22
. .Third~ many of the large chain grocery stores in Canada haye moved toward central warehousing of thei,r products. Central warehousing allows grocery
· 21 Briti.sh. Columbia accoimted for 73 percent of Canada's apple exports in 1989 (66 percent for all of 1980-89) of which well over half were destined for the U.S. market S~ Peter A. Lusztig._ chairman, J!eport of the Commission o/ lnqwiry-Brilisla ColumbUJ Tree Frw lndJutry (Vancouver: Commission of Inquiry-British Columbia Tree Fruit Industry, May 31, 1990), table 1-9, p. 21, and table 1-15, p. 30; hereafter referred to as the "Lusztig Report."
22 The Barrie Report, p. 39.
s~ore chains. to ~oordinate purchasing, control inventones, and m!11ntam consiste~t retail prices throughout all stores. ThtS strategy also mcreases chains' bargaining power with the wholesalers so they can purchase larger v~lumes ?f ~pples at lower per-unit prices. However, ~s pracuce mcreases the amount of shipping and handling of the apples, which otherwise would be deliv~ ered direc~y. from the wholesaler/shipper to the grocery store. ThtS m turn reportedly has an adverse effect on the quality of apples~ especially the softer varieties such as the Mcintosh. 3
Trade. Canadian imports
With the exception of 1981, Canada has been a net impo~r of apples for the last 15 years; imports supplied about 34 percent of apparent Canadian consumption during the study period. The United States is by far the largest foreign supplier of fresh apples to the Canadian market, with its volume share of Canadian impo_rts increasing from 54 percent in 1986 to 79 percent m 1990 (table 3-5). These imports supplied nearly 23 percent o~ apparent Canadian consumption during the study penod. The U.S. share of Canadian imports by value rose from 38 to 69 percent during the same period. U.S. expo~ of fresh apples to Canada generally ~ve a lo~er urut value than those of other major foreign suppliers because of the geographic proximity of the two countries.
.. "f.retµls in Ct1nadk!n Imports by Variety
. L~e the Unil;OO States, Canada does not routinely mamtam data on imports of fresh apples by variety. In 1987, however, Industry, Science, and Technology Canada (lsn. a Federal organization, conducted a stud.Y and found .that about 60 percent of Canada's apple tmports consisted of Mcintosh, Red Delicious, and Golden. Delicious varieties. 24 This represents a decrease m market .share for these varieties from a 1980 study, which found that these varieties accounted for 70 percent of Canadian imports.25 Another report estimated that Granny Smith apples-which are primarily from Chile, France, and South Africa-had increased their market share from around 5 percent in 1975 to over 10 ix:rcent in 1988. 26 Canada also imports Granny S~mth .apples fro'!1 the United St;ates, primarily from California. Such imports are said to have incr~ed from ~bout 2 percent of total imports from the United States m 1980 to 23 percent in 1986, according to the IST study.
Supply and Disposition of U.S. Apples in the Canadian Market
Precise and up-to-date information is not available on the varieties of U.S. fresh-apple exports to Canada or on the intended use of those apples once they reach Canada. Fresh apples which are graded and shipped to
23 Apple Industry Profile, p. 27. 24 Ibid., June 1990, p.25. 2!I Ibid., June 1990, p. 25. 26 Ibid., table 43.
3-7
Table3·5 Apples: Canadian Imports, by prlnclpal sources, 1986-90
~-------------------------------------------Aver age ............................. "·. 37.9 36.6 - ·- -29.2. --38.3 .. 35.0 1 Negligible trade reported from this source. 2_ Not applicable.
Source: Apple Market Review, 1986-90.
the Canadian market in· tray-packed cartons or re.tail-sized bags are believed to be sold exclusively in the fresh market. Such shipments are believed to have acocunted for more than 85 percent of total Canadian imports of U.S. apples in recent years.
Apples shipped in bulk are believed to account for 12 to 15 percent of total U.S. apple exports to Canada in recent years. A 1988 study by Agriculture Canada revealed the following with respect to the end use of U.S. apples shipped in bulk to Canada in 1987 and 1988 (in thousands of pounds): Endusl! 1987 1988
Some fresh apples shipped to Canada in bulk (repack) are sorted and packaged for retail sale by the wholesaler/distributor in Canada. In 1988, for example, 25 percent of all U.S. apples received by Canada in bulk were repacked for retail sale. This percentage varies widely by Province, ranging from 5 percent in
3-8
British Columbia (where provincially grown apples account for most of the fresh market) to 48 percent in Ontario, where most of the Canadian apple processors and most of the surrounding areas (both in the United States and Canada) produce apples suitable for processing.
Canadian tariff treatment
Fresh apples imported into Canada are free of duty from all sources. Appendix E lists the Harmonized Tariff Schedule numbers and brief descriptions for apples and apple products entering Canada. In July 1988, Canada initiated an antidumping case with respect to imports of fresh whole Delicious, Red Delicious, and Golden Delicious apples from the United States. On December 22, 1988, Revenue Canada Customs and Excise (Revenue Canada) made a final determination of dumping against such imports from the United States. The Canadian International Trade Tribunal27 conducted simultaneous investigations to determine wheth-
27 The final detennination was actually made by the Canadian hnport Tribunal on Dec. 22, 1988, which was replaced by the Canadian International Trade Tribunal on Dec. 31, 1988. The lauer organization therefore continued the inquiry and issued its finding on Feb. 3, 1989.
er material injury had occurred to the Canadian industry producing the subject goods. On February 3, 1989, the Tribunal ruled in the affirmative under subsection 4~(1) of Canada's Special Import Measures Act
Revenue Canada ruled that U.S. Delicious apples sold in Canada should have a normal value, per 42-pound box, of f.o.b. US$ l l .87 for apples from regular storage and f.o.b. US$12.23 for apples from CA storage. Individual antidumping duties are equal to the amount by which U.S. f.o.b. prices fall below these normal values. As warranted, or within approximately 12 to 18 months of the final determination, Revenue Canada is to conduct a review of the case; it is due to report its findings in late summer 1991 as to whether the normal values currently in effect remain appropriate.
In 1988, Canada collected Can$19,000 in duties on shipments to Canada of Delicious apples valued at Can$196,000 that had f.o.b. prices below the normal values. In 1989, Can$9,000 in duties was collected on approximately Can$100,000 in such shipments.28 Although precise data are not available, these shipments amounted to a negligible portion of total U.S. shipments of all Delicious apples to Canada. That is, the bulk of U.S. shipments of these varieties either met or exceeded the threshold f.o.b. price.
Nontariff Requirements
Most complaints from U.S. apple shippers exporting to Canada center on the packaging and labeling requirements for fresh-market sales · iil · Canada. These complaints concern primarily the lack of lead time in the publication of these requirements, rather than the requirements themselves. According to industry officials and shippers, such labeling and packaging requirements have been issued yearly (over the last few years) with little lead time, making it difficult to purcha$e prestamped bags and boxes, since such materials become useless upon issuance of new requirements U.S. growers, packers, and brokers agree they would prefer to have packaging requirements change less often.
Also, Canada's uniform minimum-size requirements restrict imports of U.S. apple varieties not grown commercially in Canada. The Canadian Government has reportedly rejected U.S. proposals to allow certain varieties not grown in Canada to bypass Canada's minimum-size requirements. The basis for this rejection is the assumption that most apple varieties are readily · substitutable and can impact the price of other varieties. An example is the U.S. Granny Smith and the recently developed Canadian Shamrok, which are difficult to distinguish visually.29
~xports
· ·. Although Canada is a net importer of apples, its eiports have remained static at approximately 10 to 15 percent of its fresh crop every year. Major export
28 Telephone convenation with Revenue Canada. 29 Convenation with George Myles, U.S. embassy staff,
Ottawa, April, 1991.
markets in 1990 were the United States at 67 percent, the Pacific Rim at 17 percent, and. the United Kingdom at 12 percent of total Canadian exports. British Columbia generally accounts for 55 to 70 percent of Canadian exports, most of which are Red Delicious. Ontario is the second-largest exporting Province, aecounting for 15 to 25 percent of annual export volume. Exports from the remaining Provinces generally account for 5 percent of the total and are usually of the Mcintosh variety. Table 3-6 summarizes Canadian exports, byProvince and by country of destination, during 1986-90. .
Canad.ian Government Programs
Introduction. , Government involvement in the tree fruit industry in Canada occurs at both the Federal and Provincial levels. Current programs for apple growers are of three types: direct, indirect, and nonfinancial. 30 Direct programs, as the name implies, provide growers with payments that supplement their income directly. Such programs include the National Tripartite Price Stabilization Plan (NTPSP), The Agricultural Stabilization Board, Farm Income Insurance, and Crop Insurance, as well as several other programs discussed later. Indirect programs reduce growers' costs for such things as irrigation and storage; the industry as a whole, not just the grower, benefits from these programs. These programs occur mainly at the Provincial level through such programs as the Canadian Agri-Food Development Initiative. Nonfinancial programs provide services such as research and development and training, as well as social service tax exemptions and gasoline tax exemptions for farm vehicles. · These programs occur at both the Federal and the Provincial level. According to the Lusztig Report, 31 the majority of programming at both levels of government appears to be ad hoc in response to short-term needs rather than part of a long-range, coordinated plan. This section reviews the programs of these three types at both governmental levels known to be ongoing in Canada at this time.
Federal Programs.
National Tripartite Price Stabilization Plan
The purpose of the NTPSP is to mitigate losses of income due to market risks by stabilizing the price of a specified commodity. The NTPSP derives its authority from Section 13 of the Agricultural Stabilization AcL To achieve its purpose, the program requires that the Federal Government, the Provincial governments, and participating producers each contribute to a stabilization fund. In periods of low market returns, support payments from this fund are made to farmers on the basis of output: Participation in the prograin is voluntary. The costs of the program are shared by the Federal Government, ·the Provincial Governments, and those producers who elect to participate. The Government of Canada has entered into agreements with the. Provinces
30 The Lusztig Repon: p. 63. · 31 Ibid., p. 63.
3-9
Table3-6 Apples: Canadian exports, by Province and by desUnaUon, 1986-90
(lrl 1,000 pounds)
Province/destination 1986 1987 1988 1989 1990
Nova Scotia ............................ . United States ......................... . United Kingdom ....................... . All other ............................. .
New Brunswick ......................... . United States ......................... .
. St. Pierre ............................ . Quebec ............................... .
United States ......................... . United Kingdom ....................... . All other ............................. .
Ontario ................................ . United States ......................... . United Kingdom ....................... . All other ............................. .
British Columbia ......................... . . United States ......................... . Pacific Rim 1 .....•.....•.•••.•........• United Kingdom ....................... . All other ............................. .
Canada total ............................ . United States ......................... . Pacific Rim ........................... . United Kingdom ....................... . All other : ............................ .
3,519 152 34
3,333 16 16 0
12,410 8,793 3,307
310 43,328 32,887
8,596 1,845
64,644 41,345 11,885 9,552 1,862
123,917 83,193 11,885 24,592
4,247
1,274 0
1,134 140 63 54 9
3,447 3,339
108 0
43,770 32,713
9,548 1,509
60, 110 31,196 19,312 7,128 2,474
108,664 67,302 19,312 17,918 4,132
2,750 220
2,407 123 165 152 13
8,255 7,122 1,132
1 51,511 40,698
9,176 1,637
116,573 80,695 18,020 15,376 2,482
179,254 128,887
18,020 28,091 4,256
15,068 12,SOQ 2,521
47 619 604
15 6,351 6,065
261 25
39,413 31,667
7,424 322
84,153 45,847 23,750 12,356 2,200
145,604 96,683 23,750 22,562
2,609
2,326 1,358
889 79
640 640
0 11,054 10,714
339 1
48,475 44,507
3,624 344
78,258 37,208 23,982 11,888 5,180
140,753 94,427 23,982 16,740 5,604
. 1 Includes Hong Kong, Malaysia, Singapore, Taiwan, Thailand, Fiji Island, Tahiti, Philippines, China, Indonesia, and New Zealand.
·Source: Apple Market Review, various issues, 1987-90.
for the following commodities: hogs, lambs, beef, sug- payouts to growers were not to exceed stabilization ar beets, white pea beans, other dry edible beans, and funds, the payout did exceed the fund balance by about ai>J>les. ·· · · -- Can$3.6 million in 1988.32
The National Tripartite Price Stabilization Program · ·--·-··The'NTPS Clid not trigger a payment on the 1988 (NfPS) for apples came into effect on July 1, 1987. It crop. However, for the 1989 crop, the total NTPS pay-is administered by a committee with nine mem- ment was Can$16.6 million, with the support price hers-three Federal, three Provincial, and three pro- equaling Can 23.91 cents/kilogram, and the market ducer representatives. Administrative costs are borne price Can 19.92 cents/kilogram. Grower participation by the two levels of government in the NTPS during this crop year rose to 2,772 out of
The support price for apples is equal to 85 percent the approximately 8,000 Canadian growers. This was of the indexed moving average price, which is derived due in part to the termination of certain Provincial pro-by taking a representative sample of the market for ap- grams. such as the apple stabilization program that had pies and calculating an inflation-adjusted, national av- been available to growers in Ontario. erage market price for the preceding 10-year period. A payment representing the difference between the calculated support price and the realized market return to participating growers is triggered if the support price is higher than the average market price for that year. The Stabilization Committee may also opt to issue an interim payment before the end of the year, provided that it does not exceed 75 percent of the estimated total payment for that year.
·Payments to apple growers were made for 1987, 1989, and 1990. In 1987, the average annual marketprice was Can 20.42 cents per kilogram,· falling Can 3.55 cents short of the support price of Can 23.97. The Stabilization Committee approved a payout of Can 1.96 cents/kilogram after an interim payment had been paid out in June 1987 at Can 1.59 cents/kilogram. With about 2.500 Canadian growers enrolled in the program, total payouts for crop year 1987 were Can$15.5 million. The growers received just less than half that amount (Can$7.6 million) in the interim payment of June 1988 (crop year 1987/88). Although total
3-10
Agricultural Stabili7.ation Board
The Agricultural Stabilization Board, a Federal direct assistance program, was created in 1958 and operates under the authority of the Agricultural Stabilization Act. According to the preamble in the Agricultural Stabilization Act, the main objective of the board is to stabilize "the prices of agricultural commodities in order to assist the industry of agriculture to realize fair returns for its labor and invesunent, and to maintain a fair relationship between prices received by farmers and the costs of the goods and services that they buy, thus to provide farmers with a fair share of the national income."33 The board accomplishes this objective primarily by making deficiency payments to producers for specified commodities, reducing the risk of short-term income losses owing to falling commodity prices and/ or rising input costs.
32 Agriculture Canada. 1988 News Release, M-42/11. 33 AMual Report of the Agricult11Tal StabilizaJion Board
(March 31, 1989),
The Agricultural Stabilization Board34 has issued deficiency payments to apple growers a number of times since 1975. The following tabulation, from data of the Agricultral Board, summarires the payments made to the Canadian apple industry under the Agricultural Stabiliz.ation Act (in millions of Canadian dollars).
1 aueb8c only. . 2 Special assistance to Reel Delicious growers.
13.3 3.5 .
19.0 21.2 5.3 7.2 5.3
Although the creation of the NTPS for apples reduced the payments made directly to apple growers by the Agricultural Stabiliz.ation Board, one special payment was made in 1987 in the form of "special assistance" to Red Delicious apple growers throughout Canada. The Agriculture Minister stated that assistance additional to that received by growers of other types of apples was required for Red Delicious apple growers because of extraordinarily low prices that year. He added that while overall national apple prices fell from Can 30 cents in 1986 to Can 20 cents/kilogram by 1987, Red Delicious apple prices fell to as low as 4 cents/kilogram.35
Provindal Programs. ·British Columbia
Since the early 1970s, the Federal Government and the Provincial governments have supported the British Columbia fruit tree industry through a variety of programs designed to stabilize prices and grower income. According to the Lusztig Report, between 1974 and 1989, the British Columbia tree fruit industry received approximately Can$350 million in financial assistance and about Can$95 million in research and extension programs.
Orchardists having a "farm classification" obtain indirect benefits. A farm classification is conferred on a property by the B.C. Assessment Authority when the owner can show a minimal level of agricultural production and sales. The classification then continues as l~g as there is no change in ownership and certain minimum requirements are met. These minimum requirements include sales of Can$ l ,600 of primary agricultural products and production requirements according to farm size. In return for meeting these requirements, holders of a farm classification gain varying tax concessions, combined with preferential land assessment. Packinghouse facilities owned by growers on a cooperative basis do not qualify for these benefits.
34 The Agricultural Stabiliz.ation Board is a Schedule Il deparunental corporation under the Financial Administration Act within Agriculture Canada. See_Annua/ Rtport of tM Agricultiual Stabilization Board (March 31, 1989).
The Agricultural Land Development Assistance Program (ALDA) is a Provincial program providing both direct and indirect assistance designed to encourage permanent land development and the adoption of new technology. In to order participate in this program, farmers state their intention to engage in one of several eligible projects, including land clearing, fencing, well drilling, and improvements in irrigation and soil quality. Farmers approved for the project are eligible to receive a fixed-rate loan at one-half the bank prime rate for up to Can$75,000 per farm. In 1989-90, there was about Can$ l 5 million in outstanding loans, at an average rate of 6 percent 36
Another combination direct and indirect program, known as the Orchard Renovation Program, was introduced in 1986 and is designed to improve fruit quality and yields over the long term. As with the ALDA program, apple and other fruit-tree orchardists can borrow money at one-half the bank prime rate. One intention of the program is to help improve the management of higher density plantings of smaller (dwarf) trees. At the end of fiscal year 1988-89, loans under this program totaled Can$800,000.37
The Farm Income Insurance (Fii) program, a direct assistance program established in 1973, is one of British Columbia's major farm support programs. Paid for equally by farmers and the Provincial government, the Fii provides indemnity payments to growers when market returns (including monies received from other federal and Provincial support measures) fall below a calculated cost-of-production figure. In the case of ap·ple growers, industry sources indicate that this program has been somewhat controversial in Canada because payments to British Columbia apple growers have reportedly been very high. In fact, the Council of Industries reports that the average annual Fil payment to apple growers during the 1980s was Can 2.4 cents/pound. This payment usually amounted to about 25 percent of the average market return during the period. Since 1985, coverage has been restricted to apples of Grade C or better to exclude culls; however, it is generally assumed that about 80 percent of all apples qualify for Fii coverage.
The British Columbia Crop Insurance Program, another direct assistance program, was established to reduce the need for ad hoc assistance through the stabilization of income fluctuations stemming from crop reduction as the result of natural problems. The purchase of coverage by fruit growers is optional. When purchased, Crop Insurance contracts run continuously year to year unless canceled by the grower. Premiums are billed at the time the contract is written, but are payable at the end of the year after harvest Premiums do not cover operating or carrying costs on the program deficit; these expenses are met by the Federal Government and Provincial governments. Furthermore, the Federal Government and Provincial governments share equally in paying 50 percent of the growers' premiums (25 percent each). For the year ending March 1990, British
36 The Barrie Report. 37 Ibid.
3-11
Columbia's Provincial costs for the Crop Insurance Program totaled over Can$750,Q00.38
The Agri-Food Regional Development Subsidiary Agreement (ARDSA), a combination indirect and nonfinancial program, began in 1985 as an extension of the General Development Agreement (GDA) of 1974 between the governments of Canada and British Columbia. The GDA was developed to increase productive employment and balanced development in British c~ lumbia. The ARDSA portion of the GDA is divided into three main parts-the Productivity Enhancement Program, the Resource Development Program, and the Commodity De\'.elopment Program. The Productivity Enhancement Program assists the Province's commercial agriculture in becoming more competitive by supporting market and new product development, technology development, and educational programs. The Resource Development Program strives to maintain and improve soil and water resources through support of regional irrigation systems, drainage outlets, and soil and water conservation; many projects under this p~ gram are eligible for payment of up to 75 percent of total costs. The Commodity Development Program provides interest-free loans (with the applicant providing up to 25 percent of equity funding) for such things as new or expanded market facilities; the estimated t~ tal value of all approved projects under this pro~ through December 1989 was over Can$78 million. 39
Assistance to the apple industry is also provided in a less direct form through several other programs and institutions. For example, the Summerland Research Station's primary role is to provide tecllnical assistance to the British Columbia fruit industry. Jts assistance .to . · British Columbia apple growers 'indudes support for the development of new varieties of fruit, new storage methods, and improved pest and disease control. British Columbia's Ministry· of Agriculture and Fisheries provides similar extension services through training programs and advice available through various tree
· fruit specialists, horticulturists, and economists.
Ontario
Ontario reportedly had a price stabilization p~ gram in place for apples until 1987, when the NTPSP was instituted. At that point, the Provincial government became a signatory to the N1PSP, and growers were given the option of remaining in the Ontario p~ gram 1 additional year or transferring immediately to the NTPSP. In 1988, the Provincial program was terminated. One Provincial assistance program still exists for selected crops, including apples under which growers received Can$494 per hectare for their 1989 apple crop.
Proposed Programs. A perceived decline of apple prices in Canada,
lower grower returns, quality problems, and a shifting marketing structure have caused concern among Cana-
38 The Lusztig Report, p. 71. 39 The Lusztig Report, p. 73.
3-12
dian apple producers. To address these problems, a c~ alition of Canadian apple-producing organii.ations40 is currently proposing the formation of a fresh-apple national marketing agency (app. C). Such an agency would have authority to regulate apple production and prices, as well as to restrict imports. The proposed agency would restrict supply, with marketing. and import quotas determined by a committee composed of consumers, retailers, wholesalers and packers, and p~ ducers. Provincial governing boards and growers would be subject to penalties if they failed to comply with the marketing quota. Under such an agency, prices for fresh apples would be established on the basis of the cost of production, but also reflecting the market preference for grades and varieties. Under the current proposal, imports, which account fora substantial portion of Canadian retail sales of fresh apples, would have volume controls, probably based on the 5-year average for the years 1985-1989, inclusive.
The Canadian National Farm Products Marketing Council (NFPMC), a Federal agency established in 1972 to oversee Canada's national marketing agencies, held a series of required public hearings throughout the summer of 1990 to assess the amount of support for the proposed marketing agency throughout the countr}'. In August 1990, the U.S. Government, ~presenting U.S. apple exporters, who supply 73 J)ercent of Canadian apple imports, formally stated its opposition to the formation of an apple-marketing agency in Canada. 41 Following the last of the hearings on September 7, 1990, the Council delivered its report to the MiJ}ister of . Agric1,1lture.in .. March -1991. The Council concluded that the majority of apple producers support the establishment of an agency with marketing powers. Alternative policy mechanisms, according to the NFPMC Report, would not achieve the same levels of stability and returns. Consequently, the Council recommended that a national marketing agency for apples be formed under section 17 of the Farm Products Marketing Agen-cies Act (FPMAA). · · ·
The national marketing agency proposed by the NFPMC would be known as the Canadian Apple Marketing Agency, and would have the powers allowed by section 22 of the FPMAA, along with the ability to determine the quantity of fresh apples to be marketed. This power would extend to all Canadian apples going to the fresh market. The Council further specifically recommended that the apple marketing agency have a board of directors consisting of one member from each of the participating Provinces and at least two members from other interests, such as consumers.
Recent Studies Of the three recent studies examined, only the Bar
rie Report endorses a supply-controlled marketing plan as an answer to the problems of Canadian apple p~
40 Nova Scotia Fruit Growen Association, The New BNns· wick Apple Marlteting Board, La Federation des Produccun de Pornmes du Quebec, The Ontario Apple Marketing Commission, and The British Columbia Tree Fruit Marlteting Board. ·
41 Convenation with George Myles, American Embassy staff, Ottawa, Ontario, April, 1991.
ducers. The other two studies-the British Columbia Study and An Economic Analysis of Issues in Market-
. ing Canadian App/es42~onclude that a supply management policy would not correct the industry's difficulties and would not confer benefits to apple producers in proportion to the consumer cost of the program. Instead, these two studies recommend new management practices and an increase in the quality and diversity of fruit. The Barrie Report and the Guelph Study do agree that there is a world oversupply of apples. In particular, they observe that the United States, especially the State of Washington, produces a surplus of apples.
Barrie Report
The National Farm Products Marketing Council (the Council), which was established in 1972 to oversee Canadian agencies administering marketing plans, published in March 1991 its Report of Inquiry (the Barrie report) concerning the establishment of a national marketing agency for apples. The Council, which is required under the Farm Products Marketing Agencies Act (the Act) to conduct an inquiry on proposed marketing agencies, gathered data for this report from a series of hearings conducted throughout the summer of 1990.
Based upon the responses of those who testified in the hearings and from· additional data gathered, ·the· Council in its Report concluded that a majority of apple producers do support the establishment of an agency with marketing powers. Alternative policy mechanisms, according to the Council Report, would not achieve the same levels of stability and returns. Consequently, the Council recommended that a national marketing agency for apples be formed under Section 17 of the Farm Products Marketing Agencies Act (FPMAA).
The national marketing agency proposed by the Council would be known as the Canadian Apple Marketing Agency, and would have the powers allowed by Section 22 of the FPMAA along with the ability to determine the quantity of fresh apples to be marketed. This power would extend to all Canadian apples going to the fresh market. The Council further recommended that the apple marketing agency have a board of directors consisting of one member from each of the participating provinces and at least two members from other interests such as consumers.
42 L. Martin, C. Gaston, and E. Goddard._An Economic Analysis of Issues in Maruting Canadian Apples (University of Guelph, April IS, 1990); hereafter referred to as the "Guelph Study."
British Columbia Study
The British Columbia Study was conducted by a Commission of Inquiry at the request of the British Columbia government in December 1989. The goal of the Commission was to present a comprehensive report on the financial condition and future viability of the tree fruit industry in British Columbia This Study was also to include the constraints and opportunities affecting the industry, as well as policy options for improving self-reliance, growth, and development
Along with an overview of the state of the apple industry in the Province and beyond, the Study examined the effects of Federal Government and Provincial government support. It concluded that although this support has exceeded Can$350 million-adjusted for inflation in 1988 dollars and including direct and indirect support--0ver a 20-year period, the average tree grower still is in "difficult" circumstances owing to declining returns.
Concerning the possibility of benefits from supply management, the Study recommends that the Provincial government oppose such a policy for apples. It states that such a policy would burden consumers without adequately addressing the problems of the British Columbia apple industry. The Study suggests programs to improve the quality and diversity of fruit in order to improve the financial situation of British Columbia growers. Specific programs recommended are Provincial replanting programs, nursery supply programs, and programs to develop better market informa
. lion. Finally, the Study suggests greater decentralization of the British Columbia marketing structure.
The Guelph Study
The purpose of the Guelph Study, was to determine whether a supply management program would help the income problems of Canadian apple growers. Using the financial records of 12 growers in Ontario and 12 growers in British Columbia, the Guelph Study develops alternative supply management programs based on differing assumptions and using an econometric model.
The Guelph Study model suggests a reduction in production of 17 percent, with a resulting increase in revenue of 6.6 percent. In addition, it concludes that although supply management would increase returns of all growers, the major benefits would accrue to those least in need and would not make all operations profitable. Under the Guelph scenario, although consumer costs would be 5 to 10 times greater than gains to growers, import quota holders would be accruing benefits of Can$9 to $44 million per year, and grower production quotas would assume values of between Can 16 and 50 cents/pound. The Study suggests that improved management practices could have a greater effect on profitability than supply management.
3-13
Chapter 4 Competitive Conditions in .the U.S. and Canadian-Industries
Introduction
In addition to the vagaries of the weather, the apple industries of the United States and Canada are facing some common "problems." These problems include rising world production; trade in new and highly popular varieties; advances in varietal development and storage technology; and extended periods of low returns, particularly in some regions.
The effects of these problems for producers are especially strong in Canada, particularly in British Columbia, traditionally the largest apple-producing Province. As discussed in chapter 3, years of declining real prices and rising costs, together with rising imports from the United States and third-countries, recently have led to industry calls for a national apple-marketing scheme, that is, a Government marketing board empowered to reduce competition (through domestic supply management and import controls), set "fair" prices, and control other aspects of the Canadian apple market. I As noted earlier, almost all Canadian apples are already either marketed by Provincial marketing entities or are subject to minimum sales prices set by Provincial Boards and agencies. However, claims of inter-Provincial dumping and a general lack of marketing coordination among the Provinces2 led to the proposal for a national marketing agency.
The competition faced by British Columbia is strongest from the United States, not from other Provinces. The industry in Washington State is the principal U.S. competitor with British Columbia for a number of related reasons. One is geographical proximity, which means that the two industries have roughly the same soil, weather, and climate conditions, and they face similar transport costs to the urban markets of the United States and Canada. In addition, the two industries produce much the same varieties of apples, notably the Red Delicious-the most widely consumed fresh apple in the North American market Thus, not only do growers in the two locations face similar supply-side forces, but they also compete head-on in the marketplace.
Despite these similarities, there are also differences between the two industries. For example, their respective industry structures ·are different; the several thousand largely independent Washington growers compete with a Provincial sales agency that controls most of the British Coluinbia apple supply. The orchards themselves differ dramatically in size, and for the much smaller British Columbia orchards, this can increase their operating costs per unit of output.relative to those of dieir rivals to the south. Government involvement also differs between the two countries: the more exten-
1 The proposal for a Canadian marketing board is presented in 'PP.· c. .
i The Barrie Report. p. 25.
sive Canadian involvement may raise production costs (i.e., regulation of pesticides and other inputs), yet it keeps growers in business with substantial financ~l support.
This chapter examines competitive conditions affecting the U.S. and Canadian apple industries with the focus on Washington State and British Columbia The next section briefly reviews some measures of competitiveness. Succeeding subsections examine costs of production, price levels and trends, and factors affecting prices. The chapter ends with a discussion of the key determinants of competitiveness.
Measures of Competitiveness As noted in chapter 1, the measures of competitive
ness used in this study are market share and profitability. In this study, the concept of market share applies to the U.S. market, the Canadian market, and the combined U.S.-Canadian market. Market share is measured in terms of volume, not value, of apples produced by each industry and consumed in each market An industry's competitiveness is a matter not only of its ability to win a share of the market, but also a function of profitability. Public data on recent industry profitability are scarce for both the U.S. and Canadian industries. Trends in revenues and costs, changes in the selling prices of apples or the prices or productivity of inputs, and increasing or decreasing financial support from the Government, are all factors that can produce changes in profitability. To the extent the data allow, these factors and their influence on apple industry competitiveness are discussed in this chapter.
Market Share
·changes in market shares held by the U.S. and Canadian apple industries are particularly useful indicators of the competitive position of those industries. Determinants of market shares (e.g., production costs) can be used to evaluate the economic condition of the U.S. industry compare<t with that of its Canadian rival. A set of market-share measures is presented in table 4-1.
U.S. growers' share of U.S. apparent consumption of apples (all-varieties and uses) remained fairly steady in recent years, ranging from· a low of 96.2 percent in 1986 to a high of 97.4 percent in 1990. U.S. imports from Canada stayed within a similarly narrow range of -0.9 to 1.3 percent of U.S. apparent consumption during 1986-90. As a share of the Canadian apple market (apparent consumption), domestic Canadian supply grew from about 73 percent in 1986 to 82 percent in 1990, and U.S. exports rose from 12 percent in 1986 to 14 percent in 1990. Although in absolute terms production grew in both countries, the higher rate of growth in the smaller Canadian industry enabled Canada to both maintain a steady share of the U.S. market and increase its share of its own domestic market. Sharply lower Canadian imports from third countries enabled U.S. exporters to increase ·theit share of the Canadian market.
4-1
Tabie4·1 Apples: u.s . .canadlan selected meaaurea of market •.nd Industry shares, 1986-90
adian imports ~t) ................. 53.8 66.7 75.4 72.8 79.1 Fresh-market apple s ipments:
4,532 5,610 5,240 5,875 ~:~ U.S. (million pounds) ...................... Washington (million pounds ............... 2,308 2,859 2,673 3,295
Canadian (million pounds) .................. 525 644 658 634
m British COiumbia (million (pounds ........... 5,0~~ 270 255 285 Total (million pounds) .................... 6,254 5,898 6,509
U.S. share (percent) ....................... 89.6' 89.7 88.8 90.3 <'> 1 Not available. 2 Apparent consumption is defined as: all apples harvested plus all apples imported u~_ l:fT.S 0808.10 minus all:apples ex:._
ported under HTS 0808.10. . Source: Compiled from tables in chapter 2 and 3 of this repoi:r.
In the combined U.S.-Canadian market for fresh apples (excluding imports from third countries), the u;s. share has also been large, and (through 1989) stayed witltin a narrow range of 89.6 to 90.3 percent. Because of rising U.S. production, U.S. growers held their share of the U.S. fresh-apple market (apparent consumption) fairly constant during 1986-90, with only slight annual fluctuations around an average 97 percent (by volume).
In general, the data in table 4-1 suggest that pro-duction from both nations' industries has contributed to the region-wide increase in apple consumption duririg the 1980s, and that the U.S. industry continues to enjoy the dominant role in both the U.S. market and the combined U.S.-Canadian markeL Relative shares of the overall market have not changed much, but trade has expanded because production volumes are up, which have pushed out imports from third-country sources, especially in Canada.
1980 1981 1982
Output value1 ••••••••• 7.0 10.7 8.2 Input cosu1 .......... 7.8 11.0 10.6 Ratio of value
to c:osu1 .•••••.•••• 0.90 0.91 O.Tl
1 Calculated from unrounded data.
4-2
Financial Conditions An industry's profitability is a familiar indicator of
its competitive position relative to that of its foreign rivals. For example, an increase in net returns can be a sign of improved efficiency (which reduces costs) or marketing of higher quality products (which increases revenues) or of increased demand. Likewise, a decline in net returns may be attributable to a failure either to take full advantage of new technology or to produce and market products consumers want. No detailed financial information on either the U.S. or Canadian industry was made available to the Commission. However, constructed cost data and average market rewms for Canadian apple growers were available and are summarized in the following tabulation (cost and value in Canadian cents per pound):3
3 Apple lndlutry Profile, table 17. Additional financial data are contained in the Lusztig Report. See also the following discussion of costs of production for cost data for Washington State 111d British Columbia growers _(supplied by Canadian sources).
According to these cost constructed estimates and market price data. in no year since at least 1980, did the typical Canadian apple grower earn a positive return. Indeed, on average during the period, the estimated input costs exceeded output value by about 13 percenL
Costs Of Production . . .
General
Production cost is the single most imi)ortant factor influencing the competitive positions of U.S. and Canadian apple growers. Along with demand, this factor largely explains trends in output, prices, and trade. Moreover, it has been at the heart of import-injury compfuints-most notably the Canadian Government's decision in 1988 to impose an antidumping duty on Canadian imports of U.S.-produced Delicious apples; such·apples were found by Canada to be sold below the "normal" cost of production4 (See the discussion in ch. 3).
The oosts of oi)erating apple orchards, as with any tree crop, involve substantial up-front expenses and relatively low maintenance costs thereafter (through the economic life of the trees). Therefore, because of the high ratio of fixed to total annwil costs and biological constraints, domestic apple supply is highly price-inelastic in the short run (i.e., between seasons). Prices can vary within a wide range, in· the short run, without causing annual output to change significantly. In fact, prices may have to remain low for several seasons to induce a decline in the· volume of apples harvested; conversely, high prices over time may result in an increase in app~e production after a delay of several seasons (the time it takes to set up new orchards or expand existing ones).
In the apple industry, the high fixed investment in orchards and the low marginal cost of producing apples keep growers in business even when prices decline. According to one source, fixed costs are on the order of SS percent of total production costs for a mature stand.s Such costs include (in addition to buildings and machinery) orchard establishment costs, such as upgrading of the irrigation system, ground preparation, and · (re}planting, all amortized over the life of the orchard. Once the orchard is in place, annual maintenance costs (such as labor, sprays, and fertilizer) are the principal economic consideration for the grower; prices must at least cover these costs or the grower will stop harvesting the apples. Since, by one source, variable costs make up 4S percent of total costs,6 the price can fall
4 The nonnal value ii defined in lhe Canadian Special Imports Measures Act as lhe consuuc:ted (estimated) cost of production plus a reasonable profit, defined in lhe act as 8 percent Amy L. Sparks et al., Apple Import Demand: FollT Markell for U.S. Fresh Apples. (Ccmmodity Economics Division, Economic Research Service: USDA). Agriculture Economic Report No. 641, Dec. 1990, p. 3. See also, Fruh, Whole, Delicious, Red Deliciqus, and
.Goll:U11 Delicious Apples Originating 111 or Exported From the U11iled StaJu of America (Findings of lhe Canadian International Tnde Tribunal in Inquiry No. CJT-3-88 Under Section 42 of lhe S~ Import Measures Act, Feb. 3, 1989).
5 The luszlig Report, iable 7-1, p. 110. 6 Ibid.
considerably before output will cease. As a result. the apple industry Cll!1 and does susf?in extended periods_ of poor ~turns before individuill growers will exit iri large numbers. This inflexibility exacerbates the problem of low prices for growers, since a long time can elapse before growers exit, market supply declines, and prices rise again.
Cost studies
Although production costs vary from grower to grower depending on management practices, orchard siting, and climate, a general conclusion frOm several studies noted below is that, on average, apple production costs are probably higher in British Columbia than in the State of Washington.
A variety of studies report estimates of apple prodµction costs for representative orchards.7 Tables 4-2 and 4-3 summarize the comparisons in the University of British Columbia and Lusztig studies, respectively. These studies estimate that total production costs range between Can 1.2 cents and Can 2.3 cents per pound-about 10 to 20-percent higher in British Columbia than in Washington State. The Washington advantage holds for both variable and fixed costs. The Lusztig Report attributes the difference mainly to higher interest rates in British Columbia and to economies of scale in the larger orchards of Washington. The UBC Study makes a similar finding, but reports it differently, noting higher costs per acre for depreciation of machinery, which . implies economies of scale, and
··~-·higher opportunity costs, i.e., higher interest rates on invested capital.
The B.C. Fruit Growers Association (BCFGA) in testimony before the Canadian Tribunal in February 1991, cites higher costs for labor, interest on capital and operating loans, agricultural chemicals, fuel, land, and irrigation water in British Columbia. 8 According to the testimony, British Columbia apple growers "produce fruit in a high cost of production area. Farm labor is expensive and scarce ... Strong labor legislation in British Columbia wodcs to the disadvantage of our industry. "9 BCFGA's testimony went on to state that estimates ·or .labor rates in Washington State are only 60 percent of those paid by British Columbia growers .. However, the UBC Study reports lower per acre labor costs .in British Columbia and nearly the same labor costs per pound (table 4-2).
International Monetary' Fund {IMF) statistics support the contention that interest rates are higher in Canada. Nominal interest rates are higher in Canada; in
7 See, for example, lhe Luszlig Report, and George Kennedy and Mei Li Lee, "Cost of Producing Apples in B.C. Venus
. Washington Slate," Univenity of British Columbia, Department of Agriculwnl Economics, Discussion Paper No. 85-04 (August 198S); hereafter referred to as lhe "UBC Swdy."
1 B.C. Fruit Giowen' Association, Bri4f to the Call0dia11 l11ter11ational TracU Tri.bw&al Wilh Respect to the Competili'lllMSS of the CONJdiall Fresh and Processer:J Fruit and Vegetable Industry (February IS, 1991), p. 3; hereafter referred to as lhe BCFGA Brief.
9 The Barrie Report·
4-3
Table4·2 Apple producUon costs: UBC comparison of British Columbia with Washington State, 1985
1 Less than 0.0005 Canadian dollars. 2 Not available.
Source: George Kennedy and Mei Li Lee, "Cost of Producing Apples in B.C. Versus Washington State, University of British Colum-bia, Department of Agricultural Economics, Discussion Paper No. 85-04, August 1985, tables 6 and 7. .·
Table4-3 Apple production costs: Comparison of British Columbia with Washington Stste, 1990
trees per pounds Canadan dollars per pound aae per acre 202 32,000 0.067 0.059 0.080 0.075 0.147 0.134
382 35,000 .063 (88) .055
(94) (91) .081 .072 .143 .127
518 45,000 .054 (87J .04 .064 -~ .119
(89J .10
670 45,000 .054 -~ .067 .b8:J .121 (8~ .10
726 45,000 (85) (86) (86)
.054 .046 .061 .054 .115 .100
808 45,000 .052 .b8:J .062 (89J .05 .113.
can .10
(87) (92) (89)
Note: Washington costs as a percentage of B.C. costs are in parentheses.
Source: Peter A. Lusztig, commissioner, Repott of the Commission of Inquiry-British Columbia Tree Fruit Industry (Vancouver: Commission of Inquiry-British Columbia Tree Fruit Industry, May 31, 1990). table 7-9, p. 118.
4-4
recent years, short-tenn lending rates have run about 3 to 4 percentage points higher, and long-tenn bond rates have run about 1 to 3 percentage points higher. With similar inflation rates in both countries, real interest rates are higher in Canada as well.10 The Lusztig and UBC studies also assume higher interest rates in Canada.
Chemical costs have been cited as a source of ci>mpeu,tive disadvantage for Canadian growers, 11 although they are a small share of total orchard costs.12 Canadian growers appear to be disadvantaged in the two main factors that detennine chemical costs per unit of apple output: the cost of a unit of chemicals, and the orchard density (trees per acre). The prices of several chemicals are reportedly higher in Canada than in the United States as a result of Canada's Pest Control Products Act and Regulations, which restrict or ban certain chemicals Canadian growers seek to use.13 Also, even if the product is registered in Canada, the Pest Control Products Act and Regulations prohibit a British Columbia grower from purchasing it in the United States where it may cost less. For example, the pesticide Diazinon reportedly sells for CAN$5.80 per pound in British Columbia, or 22 percent more than in Washington State. The herbicide Gramoxone reportedly sells for CAN$16.70 per liter in British Columbia, or 20 percent more than in Washington State.
However, even if chemical prices were the same, the cost of applying chemicals would probably still be higher in Canada because of the lower density of the average Canadian orchard. That is, the ratio of treated trees per unit of chemicals applied is lower (and at constant chemical prices, the chemical cost per pound of harvested apples is higher) in Canada than in the United States.14
Fuel is another area BCFGA cites as a source of competitive disadvantage for Canadian growers. IS .BCFGA attributes this disadvantage to the relatively high Canadian tax rate on fuel and the tax rebate received by U.S. growers for off-road use. According to both the Lusztig and UBC studies, estimated fuel costs are higher in British Columbia than in Washington State. Another source, the Canadian Task Force on Competitiveness in the Agri-Food Industry, found that fuel prices in Canada may be 60 percent higher. Although fuel cost differences may not be substantial in tenns of production cost (table 4-2), the differences may more significant in tenns of distribution costs.
10 The real long-term rates may in fact be nearly the same. Real interest rales cannot be dmctly measured since they involve the diJference between nominal interest ra1es and expected inflation. For short-term rates, actual inflation is a good proxy for expected inflation. The relation between recent inflauon experience and thal expected over the life of a long-tenn bond is less clear. The higher Canadian rates may represent an inflation premium relative to the United States because the inflation came down slower in Canada in the 1980's, and inflation might be CXP.=;Cled to have the same pauem in the future.
account for an average of S percent of total cash costs. 13 The BCFGA Brief, p. 8. 14 The Luszlig Report, p. lll. 15 The BCFGA Brief, pp. 11-12.
Land costs are also frequently cited as a competitive disadvantage for British Columbia.16 Apparently, the Okanagan region is a popular tourist area, and land costs are being bid up for nonagricultural reasons; such pressures are small in Washington State. This is a problem mainly if new orchards are being P.lanted or growers are adding to their existing orchards. 17 Grower profitability is affected mainly in that it may be more profitable to sell orchard land for residential purposes than to stay in the apple-growing business.
The British Columbia and Canadian Governments operate a number of programs, detailed earlier in this report, that tend to keep orchards and. orchardists in business that might otherwise leave under market pressures. According to one source, these programs, which are intended to stabilize grower incomes and preserve agricultural land from urban encroachment, are largely responsible for the higher overall average costs in British Columbia.18 The Lusztig Report states that income stabili7.ation programs that attempt to cover all costs, such as British Columbia Farm Income Insurance, "fail to encourage farmers to control costs and discourage exit from the industry of those growers whose costs really have risen above market returns, thereby thwarti11g the natural process of industry renewal."19 The British Columbia Agricultural Land Reserve limits the conversion of agricultural land to other purposes.20 This helps to keep inappropriately sited land in apple production, resulting in lower yields and higher costs per pound, as well as a hij?her proportion of apples suit-able only for processing.:21 .· •.
The conclusion that costs are higher in Canada than in the United States was supported by BCFGA in testimony before the Canadian Trade Tribunal in Febru-ary 1991.22 It was suggested that- . ·
part of the reason for the. low farmgate return is that input costs tend to be high relative to some of our competitors. Another very real concern is the lack of availability of some farm inputs for B.C. horticulture which are readily avail-able to our U.S. counterparts ... Many of our problems have been a long time in the making
. and in some cases have been exacerbated by government policy.23 _
It is very likely that the higher production costs in British Columbia can be attributed in pan to British Columbia and Canadian policies that retard the incentive for growers who are less efficient or who farm less suitable land to leave the industry.
16 The BCFGA Brief, p. 13. See also the UBC Study, p. 11, and the Luszlig Report, p. 111.
17 The adverse elfects of rising land costs could be mitigated to some extent by replanting orchards with dwarf trees. Although this is a widespread practice in the U.S. industry, Canadian growen have yet to rq>lant more than a minor share of their acreage with dwarf uees.
18 Staff telephone convenation with Dr. Desmond O'Rourke, professor of Agricultural Economics, Washington State University, Apr. l, 1991.
19 The Luszlig Report, p. 67. 20 Ibid., p. 68. 2I Staff conversation wilh Dr. O'Rourke, Apr. 1, 1991. 22 The BCFGA Brief. 23 Ibid., p. 2.
4-5
·price Levels and Trends
This section describes the. trends in prices at the retail level and the grower level in both the United States and Canada. This section also examines some 'of the reasons for the trends and price differentials.
Grower returns are significantly higher in Washington State than in British Columbia. although the difference narrows when Government payments to growers are included.24. However. BCFGA asserts that "even with support from federal and/or provincial financial programs. [British Columbia] growers almost always come up short of their cost of production.•• The Lusztig Report confirms that "prevailing [British Columbia]
. producer prices during 1989. according to the evidence submiued. averaged about 9.5 cents per pound, while average costs of production was [sic] in the range of 14 to 15 cents per pound."25
The difference in market returns between British Columbia and Washington- State has exceeded 5 cents (U.S.) per pound in recent years. The Lusztig Report estimates that during 1980-88. average net returns for British Columbia growers were 50 percent of average net grower returns in Washington State.26 The difference is attributed primarily to lower returns paid by the marketing agencies, primarily B.C. Tree Fruits, Ltd. (BCfF) for fresh apples. and Sun-Rype. Ltd. for processing apples, to growers. According to the Lusztig Report. these lower returns are a result of higher marketing and packinghouse costs. TT
24 See tables 4-2 and 4-3, and lhe Lusztig Repon, P· 111 25 The BCFGA Brief. . . . . .. 26 The Lusztig Report. table 2-4, p. S3. 'E1 Ibid., ch. 2.
Table4-4
United States
Grower-Level Prices
Season-average grower prices in U.S. apple markets have generally declined in recent years; in 2 of the last 3 years of the study period, for example, prices reached their lowest levels in nearly a decade. Table 4-4 presents data illustrating trends in prices during 1970-89. Prices for both the U.S. industry as a whole and the Washington State industry are presented, and apples for the fresh market are distinguished from those destined for processing. Individual varieties are not broken out; rather, the prices are averages for all varieties combined.
The data in table 4-4 show that in most years Washington State growers receive a lower price for their apples sold in the fresh fruit market than do growers in other parts of the country. At the same time, average prices-combining both fresh and processed sales-received by producers in Washington are slightly greater than those received by other producers. Several factors appear to contribute to this. First, fresh Red Delicious apples tend to have a lower unit value than other varieties. Second, growers in Washington State must sell their apples over a larger geographic area than do other growers and therefore incur greater transportation costs. Third, a greater percentage of Wasfl!n~~~-- apples are sold in the fresh fruit market
Apples: U.S. and Washington State season-average grower prices, 197o-891
(Cents per pound)
Uailgd. Slatga W1~t1i.agt~a ~rare Year Fresh Processing All Fresh Processing All
1 Commercial crop in orchards of 100 or more bearing trees.
Source: National Agricultural Statistics Service, U.S. Department of Agriculture.
4-6
Retail Prices
Table 4-5 and figures 4-la (Northeast), 4-lb (North Central), and 4- lc (West) show comparisons of retail prices for fresh apples in three regions of the United States during 1980-89. On a nominal basis, retail prices for fresh apples rose (srimewhat irregularly) in all three regions during the decade. However, after adjusting for inflation; real prices in the Northeast and North Central regfons remained almost unchanged over the long nm, although there were wide year-to-year swing~. In the West region, prices declined by 2 percent per year on average.
From month to month within a season, retail prices follow the same trend followed by grower prices (figure 4-2). However, over the past several seasons, the spread between retail and grower-level prices haswidened (figure 4-3). This is particularly true in the Northeastern and North Central regions of the United States, where the reiail-grower price spread grew by about 6 and 4 percent per year, respectively, during the
Table4·5
1980s.28 The West region has not been immune, however; there, the price spread grew by 2 to 3 percent per year during the same period. According to one source, the increase in the West region price spread would have been ~ter but for recent consumer concerns over atar.2 Such concerns reportedly reduced apple demand, particularly for fresh Red Delicious apples; the resulting drop in retail prices closed much of the retail-grower gap in the 1988189 crop year.
Table 4-5 indicates that the rising retail-grower price spread is due mainly to a growing spread between wholesale and grower prices, as there has been no discemable trend in the spread between retail and whole
28 These growth rates were calculated on the basis of season-average retail and grower prices reported in Joan Peanow, "Washington Red Delicious Apples: Fresh Market Prices and Spreads, 1980/81-88/89," in Fruil and Tree N111s: Siluatio11 and <Jllllook Yeorbook, TPS-250, USDA, Economic Research Service (Aurs1 1989), pp. 89-93.
Boyd M. BuxlOll, "Economic Impact of Consumer Health Concerns About Alar oo Apples," in Fruil and Tree NuJs: Si1111J1io11 and 0111/ook Yearbook, TPS-250, USDA, Economic Research Service (August 1989), pp. 85-88.
Apples: Fresh Red Dellclous, season average retail and !lfholesale prices, nominal and lnflatlon-adjusted, 1 by region, 198o-89
(Cents per pound)
Nqabe11st2 Inflation-
Nqab Ceatca/3 Inflation-
WestBaz4 Inflation-
Year Nominal adjusted Nominal adjusted Nominal adjusted
1 Inflation-adjusted data are expressed in 1989 dollars. 2 Red Delicious apples in the Northeastern region, weighted by monthly arrivals of all Washington apples at New York City. 3 Red Delicious apples in the North Central region, weighted by monthly arrivals of all Washington apples at Chicago. 4 Red Delicious apples in the Western region, weighted by monthly arrivals of all Washington apples at Los Angeles.
Source: Prices from USDA, Economic Research Service (ERS), Fruit and Tree Nuts: Situation and Outlook Yearbook, TFS-250 (August 1989), pp. 90 and 93, and ERS current computer printout; Consumer Price Index used for deflating from U.S. Department of Labor, Bureau of Labor Statistics.
4-7
Figure 4-1a Fresh red dellclous apples: $eason-average retail prices, nominal and Inflation-adjusted by region, 1980-89
Cents per pound as~~~~~~~~~~~~~~~~~~~~~~~~~~~~~-'-~~
Flgure~2 Fresh red dellclous apples: U.S. monthly retail and grower prices, 1985/86·88/89 by region, 1980-89
Cents per pound 120~~~~~~~~~~~~~~~~~~~~~~~--1
1989
--iE- Grower
----- Retail
20 itMMMilttHJit"'iCM~M~ ~M~ ~.~UMMit( ~
o~~~~~~~~~~~~~~~~~~~~~~~~~~~~~~~
1985/86 19~6/87 1987/88 1988/89
Source: Economic Research Service, USDA, August 1989, and Washington States Department of Agriculture.
4-9
Figure 4-3 Fresh red delicious apples: ·retall-grower price margins, 1980/81-88/89
Dollars per bushel
27--:==================~~~~~~~~~~~~~~~~~~~~
-it- Northeast 25 ~ North Central
----- West
21
15~~~~~~~~~~~~~~~~~~~~~~~~~~~~~~~~~
80/81 81/82 82183 83/84 84/85
Source: Ecoonomic Research Service, USDA, August 1989.
sale prices. Factors that account for a wholesale-grower price spread mainly include the cost of such wholesalers' services as grading, packing, and transportation to retail markets. The 4- to 6-percent rate of increase in such costs suggests that general inflationary pressure is the most logical explanation for the growing price spread in recent years; Commission staff has not uncovered any other information that would explain this growing spread.
Canada Prices received by Canadian growers have fol
lowed trends similar to those in the U.S. market, reaching recent lows in 1987 and 1989 (table 4-6). Nationwide, prices fell to Can 9.12 cents per pound in 1989, about 11 percent below the 1981-88 average of Can 10.24 cents, and 30 percent below the record high of Can 13.03 cents in 1986. In British Columbia, the decline was even greater: 1989 prices fell to Can 7 .54 cents per pound, about 15 percent below the 1981-88 average of Can 8.89 cents, and 43 percent below the record high of Can 13.18 cents in 1986.
When expressed in U.S. dollars (table 4-6), the declines are smaller because changes in the relative value of the U.S. and Canadian dollars erased some of the trend in local currency. Converted to U.S. dollars, prices received by growers in Canada in 1989 declined by only 3 percent from the 1981-88 average, and by 18 percent from the 1986 high. The corresponding declines for British Columbia growers are 8 and 33 percent, respectively.
4-10
85/86 86187 87188 88/89
The Canadian prices expressed in U.S. dollars can be compared with the prices received by U.S. and Washington growers as shown in table 4-4 (see also fig. 4-4a and 4-4b). Prices received by British Columbia growers in every year are significantly below those received in Washington State (an average of 42 percent lower during 1981-89); in both regions, these prices are mainly for Red Delicious apples destined for the fresh market. Prices received nationwide, however, are not as directly comparable because of the different mixes of varieties (a large U.S. share of Granny Smiths, for example); for the apple-growing industry as a whole, nationwide average prices are consistently lower in Canada than in the United States (an average of 28 percent lower during 1981-89).
Two factors that help explain recent changes in apple prices are the price elasticity of demand for apples and the trends in prices of other fruits that consumers may consider substitutes for apples. The price elasticity of demand measures the proportional change in the quantity of apples demanded by consumers in response to a proportional change in apple prices; that is, it indicates the relative responsiveness of prices and quantities. Also, changes in prices of apple substitutes affect apple prices by inducing consumers to reduce their de· mand for apples if prices of substitutes fall, which puts downward pressure on apple prices (and vice versa if prices of substitutes rise).
In the case of the price elasticity of demand for apples, one source reports that it is -0.72 at the retail
Table4-6 Apples: Season-average grower prices, British Columbia and 'Canada, 197()-89
Source: Average prices for 197~7 derived from Elizabeth Campbell; Apple Industry Profile, Ottawa: National Farm Products Marketing Council (June 1990), tables 1and4; 1988-89 data derived from Statistics Canada, Fruit and Vegetable Production, #22-003 (December 1990), table 2. Exchange rates used to obtain prices in U.S. dollars are annual averages published by the Board of Gov-ernors of the Federal Reserve System. ..
Flgure4-4A Apples: Season-average, grower prices, Washington and Brltl.sh COiumbia, 1970-89
U.S. cents per pound 20~~~~~~~~~~~~~~~~~~~~~~~~~~~~~~~
Source: National Agricultural Statistics Service, USDA and Agriculture Canada.
level and -0.68 at the grower level, 30 suggesting that apple demand is price-inelastic; that is, a I-percent increase in price causes the quantity of apples demanded (at constant prices) to drop by about 0:7 percent Given that supply is perfectly inelastic, then another way to interpret this is that prices are ·highly responsive to changes in supply. That is, if the quantity of harvested apples sent to market increases by 1 percent, price will fall by more than 1 percent, and conversely, a drop in quantity supplied by a given proportion would cause a proportionally greater rise in price.
Fruits that may be considered substiwtes for apples include cherries, pears, peaches, prunes, and plums. Data on recent trends in the prices of these substiwte fruits are presented in table 4-7. Although these are grower-level prices, they probably reflect similar trends in retail prices for the fresh product. During 1985-89, prices for most of these fruits declined: the most rapid decline (as a proportion of the 1985-89 average) was for fresh Bartlett pears in Washington, the price for which fell by about 3 cents per pound annual-
30 P.S. George and G.A. King, uConswner Demand for Food Commodities in the United Stat.es with Projections for 1980." Giannini FOIDldation Monogriph 26 (March 1971); cited in William G. Tomelt and Kenneth L Robinson, Agricult11Tal ProdM.ct Pricu, 2nd ed. (Ithaca: Cornell Univenity Press, 1981), p. 69. A similar estimate (-0.83) for the Canadian market was arrived al by I.any J. Manin et al, u An Economic Analysis r:A Issues in Marketing Canadian Apples," The George Morris Centre, Univenity of Guelph (Ontario), Working Piper WP90/ 02 (June 1990), p. 32. In sharp contrast with the George and King study, D.B. Suits ("Agriculture," p. 6) suggests that U.S. apple demand i.J moderately elastic (-1.27). Without access to the methods underlying these estimates, which study is more reliable i.J noc certain.
4-12
ly, or about 23 percent of the 1985-89 average price. The price for fresh Bartlett pears in the United States as a whole also declined sharply, by an average of 2 cents
- per·pound annually, or 17. percent of the 1985-89 aver: age price. However, the prices for pears other than for the fresh market increased so much that the weighted-average price for all pears actually increased slightly during 1985-89. Prices for sweet cherries, Washington-grown peaches, and prunes and plums also declined during 1985-89. The decline in the prices of these substitutes may also have had a depressing impact on the price of apples.
Summary of Costs and Prices It appears apple growers in Canada have suffered
from low or negative returns for several years. It also appears that the causes of lower grower returns in Canada stem from both sides of the financial coin-low revenues and high costs. A recent Canadian Government investigation of issues relating to the marketing of fresh apples in Canada found that-
the major contributing factor to [the growers' poor financial situation] is deemed to be low prices for apples in recent years. Additional factors include lack of co-ordinated interprovincial marketing of apples, an imbalance beIWeen buyers and sellers of apples, decreasing quality of apples during periods of low prices and other considerations, notably, retail prices and margins and import comrols.31
31 The Barrie Report, p. 19.
Table4-7 Selected fruits: season-average prices received by grow••, Washington State and U.$. average, 1985-89
Average annual change as
"~' a percent .... "': of price
clinmodity duri'ls
1985 1986 1987 1988 1989 198 9 1
ents per pound Percent
Sweet cherries: Fresh, Washington ............... 71.5 57.0 56.5 66.0 47.45 -6.6 Fresh, U.S. average .............. 59.6 54.7 47.65 55.0 46.6 -4.9 All, Washington ................. 51.75 47.55 46.15 49.15 40.1 -4.6 All, U.S. average ................ 39.95 41.25 37.4 39.4 35.6 -2.6
Bartlett pear5: Fresh, Washington ............... 19.45 20.55 9.35 9.5 9.45 -22.7 Fresh, U.S. average .............. 14.95 17.55 8.7 9.25 9.05 -16.9 All, Washington ................. 12.4 12.0 18.8 11.1 13.1 0.4 All, U.S. average ................ 11.8 11.4 17.15 12.2 13.3 2.9
Peaches: All, Washington ................. 23.8 23.1 16.5 19.3. 25.5 -0.2 All, U.S. average ................ 15.0 14.6 13.8 15.6 16.3 2.4
Prunes and plums: All, Washington ................. 11.0 18.3 6.7 9.35 8.1 -13.8 All, U.S. average ................ 11.5 12.9 6.95 9.15 10.45 -5.7
1 Average annual change in price during 1985-89 divided by awrage price during 1985-89.
Source: National Agriailtural Statistics Service, USDA, Noncitrus Fruits and Nuts SummafY (annual).
The Barrie Report claims "ample evidence ... of apples selling below their cost of production."32 In 1989, Canadian growers received an average of Can 9.5 cents per pound for their apples, compared IO estimated production costs of Can 14 to 15 cents per pound. The Report also notes that "la Federation des producteurs de pommes du Quebec indicated that although current cost of production approximated 17 cents per ~. price received was only around 7 cents per pound."33
Finally, as noted above, the various government programs intended IO stabilize apple prices tend IO keep orchards and orchardists in business who might otherwise leave the market.34 Such production wiU add IO the total supply of apples and thereby tend to reduce the price of apples generally, and since such orchards will tend to be relatively high cost, keeping these facilities in production will increase average costs.
.'.:.,~ey Determinants of Competitiveness '·'··
·' This chapter has examined the competitive conditions in the U.S and Canadian apple industries. While the two industries have essentially maintained their respective market shares, it seems apparent that the Canadian industry has experienced lower net returns, or profitability, over the last several years. This section notes those determinants of financial condition which appear to be key to the differences between the two industries.
31 Ibid., p. 24. 33 Ibid., p. 21. 34 Sec p. 4-S.
·rechnologJ' · · At least two Important technological facaors influ
ence the relative competitiveness of the U.S. and Canadian industries, CA storage capacity and the development of dwarf trees.
The more widespread use of CA storage in the United States than in Canada enables U.S. producers IO withhold a larger share of their production from the market and distribute it more evenly over the market~ ing year. As a result, prices are stabilized, and markets are more orderly.
In addition IO creating a surplus on the market early in the marketing season, the lack of sufficient CA capacity in Canada helps create a supply shortage later in the season that must be filled ·by imports. The wide seasonal swings in domestic supply contributc to the problem of low grower returns. The early surplus depresses prices for the bulk of the Canadian crop, while the relatively high impon supply later in the year keeps prices down for that share of supply hel~ in CA storage. Most of the annual Canadian imports from the United . States (presumably held in CA storage) arc shipped later in the season when the Canadian domestic supply is depleted. This competitive disadvantage for Canada is likely to decline if CA capacity is increased, particularly in British Columbia. 35
The development of dwarf and scmidwarf trees has reduced the acreage needed to produce a given volume of apples and reduced the per-pound cost of such inpuL'\ as chemicals and labor. Dwarf trees arc closer together,
35 Apple lndus1ry Profile, p. 12.
4-13
so more apples are grown per ac,re than with the larger standard ttees; moreover, because dwarfs are shorter than standard ttees, it takes less labor to harvest them. As a result, on a per-acre basis, revenues are higher and costs are lower. The U.S. industry has taken greater advantage of this new technology than the Canadian industry, as indicated by the data in earlier chapters showing a greater number of trees per acre in the United States. However, through such Canadian Government programs as ALDA and the Orchard Renovation Program (se ch. 3), future Canadian plantings of dwarf trees are likely to increase.
Quality Although there are varietal differences, as dis
cussed in Chapters 2 and 3, between the U.S. and Canadian crops, qualitative differences are one of the more significant competetive factors. These differences affect grower returns in two ways. First, for apples destined for the fresh marlcet, the greater the proportion of apples meeting the higher grades, the greater the returns to the grower. For example, the following tabulation shows relative prices during the 1989/00 marlceting season for apples sold in north centtal Washington State (free-on-board prices per box):36 Extra Differ-VorU!ty FollC.)' FollC.)'
For Red Delicious apples in this market. the difference in quality between Extta Fancy and Fancy means a loss in wholesale price of $1.30 per box, or 13 percenL For the minor Washington Srate varieties, this. proportionate drop in price is considerably higher (as high as 42 percent for Granny Smiths). Second, since apples marketed as fresh fruit command higher prices~· those sold for processing, the greater the proportion going to the fresh market, the greater the returns to the grower.
For fresh-market apples, there are no significant .· differences between U.S. and Canadian apples that meet the .standards for, say, Fancy or Extta Fancy. However, the proportion of apples that do meet these high grades are lower in Canada than in the United States. According to the Canadian Import Tribunal Inquiry, 28 percent of Washington's Red Delicious crop was of a "large" si7.e in 1984, but only 9 percent of British Columbia's crop was considered "large." That same year, 65 percent of Washington's Red Delicious
36 Washington Growen Cearing House Auoc:ialian, Inc., JJd AM""1 App/4 Price Sl/lfl/WJry .•• 1989·90 SllUOtl, p. 2. ·
4-14
crop and 83 percent of its Golden Delicious crop made the Extta Fancy grade. Only 35 percent of British Columbia 's Red Delicious crop and only 45 percent of its Golden Delicious crop qualified as Extta Fancy. The following year, 75 percent of Washington's Red Delicious crop was graded Extra Fancy, as was 93 percent of its Golden Delicious crop. For British Columbia, these shares were 58 and 52 percent, respectively. 37 In other words, Washington State, on average, produces more, larger, higher-quality apples at a lower cost than does British Columbia
·.The larger the share of harvested apples that do not meet fresh-market standards and so must be consigned u;> the processing market, the lower the average return received for a grower's crop, because as noted, apples for processing bring a shmply lower price than those for the fresh marlceL Table 4-8 presents U.S. and Canadian Government data on total apple production and the share destined for the fresh market from 1980-1989. By this measure, it appears that the average quality of U.S.-and Canadian-produced apples are equal.
Exchange Rates Changes in the value of the U.S. dollar in terms of
·die Canadiari dollar affect U.S. industry competitiveness by changing ·the effective price of each country's apples sold in the other's market Such changes therefore affect the ability of u~s. apple marketers to bid sales away from their Canadian rivals, both in the domestic and Canadian apple markets. The rate of exchange between the U.S. and Canadian dollars is determined by several factors, ·ranging from differences in the respective current account balances to differences in real interest rates; However, in the long run, the exchange rate is expected to ·reflect the difference in the overall price levels between ·the two countries.
. · The real (inflation-adjusted) value of the U.S. dollar has declined steadily in recent years, from about Can$1.36per U.S. dollar in 1985 to about Can$1.14 in 1990, or·by approximately 17 percent, with an annual average decline of 3.6 percent (see table 4-9). Thus, it became increasingly easy to market U.S. apples in Canada during this period, because the depreciation of the U.S. dollar caused the effective price of U.S. apples to
· Canadian buyers to decline by 17 percent even if the price in U.S. dollars received by U.S. exporters had stayed the same. · Conversely, Canadian apples became increasingly uncompetitive in the U.S. market during this period, because the appreciation of the Canadian dollar raised the effective price of Canadian apples paid by U.S. buyers.
1 Quantity actually harvested plus quantities that would have been acceptable for fresh market or processing but were not har-vested because of economic or natural reasons. ·
Source: Compiled from official statistics of the U.S. Department of Agriculture and Statistics Canada.
Table4-9 U.S. and canadlan consumer price Indexes and exchange rates, 1985-90
Source: International Monetary Fund, lntemational Financial Statistics, June 1991.
Canadian-U.S. ·exchange rate
·Nominal Inflationadjusted
-Canadian dollars per U.S. dollars-
1.3655 1.3895 1.3260 1.2307
· 1.1840 1.1668
1.3655 1.3588 1.2894 1.1959 1.1491 1.1387
4-15
APPENDIX A LETTER OF REQUEST FROM SENATE COMMITTEE ON FINANCE
A-2
·90 acr t6 AJJ :r:z
Dear Madaa Chairman:
tinittd oStata ~mate CO ... I I 8 ON lltilMCI w...._,_, DC 201tG-e200
October lCS, 1990
l:·r.1-n ,,,, '~•b. ~.:-., ...
Th• comaitt•• on Pinanc• requ••t• that the u.s.
-
-
International Trad• C011111iaaion conduct an inveatigation under section l32(q) of th• Tariff Act ot 1930, aa ... nded (19 u.s.c. 1332(q)), tor the purpo••• of ••••••in9 current and propoaed practices and polici•• of th• canadian Gov•nua•nt with reapect to th• apple induatry, partic-.ilarly the propoaed national •upply mana9eaent pr09raa for apple• in canada.
In it• inveat19ati~n, -,~•-~Coaiaaion ahould, to th• extent poaaible, develop infol'llation reqardinq th• apple growing induatry in th• United Stat•• and Canada and the apple market in Canada, including, but not liaited to, th• following factor•: ·
(1) Th• purpoae, nature, quantity, and uae o( th• polici•• and practice• of th• Canadian national and proVincial qovernaenta affecting apple•, including:
(a) r9bat•• provided to retailers by canadian urutincJ orvanizationa1
(b) :advert1•1nt allowances ottered to r•tail~r• by aarJcating OE'C)anizationa or national or provinc:ial agenciea;
(G)
(d)
paymenta to qrovera under th• Agricultural Stabilisation Act (•ASA•), the National Tripartite Price Stabilization Pr09raa, and th• Briti•b Columbia Fara Incoae Inaurance Proqraa vben ·average price• fall below bencbaark coats, and hov th• bencbaark pric•• are ••t1 and
other iaport, price, and supply proposal• beinq conaidered by th• National Para Products Marketing council.
Th• Honoral:>l• Ann• B. Brunsdal• October 16, 1990 Paqe TWO
(2) Th• volume and value ot u.s. imports ot fresh apples from Canada over the last tiv• years, with special .. pha•i• on how such imports have concentrated in individual reqional markets throuqhout th• United States;
(3) A.ii analyais ot the competitive factors in each induatry, includinq a comparison, by market reqions wherever obtainable, ot sal•• prices ot U.S. and Canadian apple• in th• u.s. and Canadian markets, and an analyai• of each country's costs of production;
(4) A compariaon ot th• quality ot u.s. and Canadian appl•• deat·ined tor the fresh apple market;
(5) A compariaon ot the conswaption and utilization trend• in Canada and th• United stat•• for appl•• deatined tor th• tresh and proc••••d market; and ··
(6) A compariaon ot total Canadian and u.s. apple production by reqion and province over the last five yeara.
Th• co .. isaion •hould report the reault• of ~· inveatiqation no later than Auquat 1, 1991.
Thank you for your cooperation in this important matter.
Sincerely,
A-3
APPENDIX B COMMISSION'S NOTICE OF INSTITUTION OF INVESTIGATION
tnnn:o STATES nrn:.RNA!!ONA.L TRADE CCMH!SSION Wuhington, D.C.
Cinv•1ti1ation No. 332-305)
AIPLIS: CERTAIN CONDITIONS OF COMPETITION BE'l'WEEN THE U.S. AND CANADIAN INDUSTRIES
AGENCY: United Stat•• International Trade Conni11ion
ACTION: Institution ot inve1ti1ation
SUMKARY: Follovin1 receipt on October 16, 1990, of a request from the Connitt•• on Finance, United Stat•• Senate, the Commi11ion instituted inve1ti1ation No. 332-305, Apple•: Certain Condition• of Competition Between th• U.S. and Canadian Induatriea, under ••ction 332<1> of th• Tariff Act of 1930 ~19 U.S.C. 1332(1)). ,.. requested by th• COllllitt••· the COllD.i.11ion will, to th• extent po11ible, develop information reaardina th• apple arovina indu.tri•• and th• apple market• in the United Stat•• and Canad&. '11\• COllllitt .. requeated that the CClllli11ion 1ubmit it• report not later than AU1U9t 1, 1991.
llFICTIVI DATI: Novmber 19, 1990
FOR ruRTHlll IHJORKATIOM COV'l'ACT: For information on other than the leaal a1pect1 of th• 1tudy, cont&ct Frederick W. lu11le1 (202-252-1325) (after 1/11/91 - 202-205-3325) or David Inaeraoll (202-252-1309) (after 1/11/91 -202-205-3309), Aariculture Diviaion, Office of Induatri••· U.S. International Trade Ccaai11ion. ror information on th• leaal aapecta of, the atudy, contact Willi• Gearhart (202-252-1039) (after 1/11/91 - 202-205-3091), Office. of .. the. General Counael, u.s. Intemational Trade·comiaa'ion. liearifti:.u.Pa1r9d. per1ona can obtain information on thia atudy by contactina our TDD terminal on (202) 252-1810 (after 1/11/91 - 202-205-1810).
IACIGIOUID: In ita letter, the ec-itt .. 1t&ted that it vu requ1tina that the Comlliaaion conduct the inveatiation ~for the purpo••• of a•••••ina current and propoaed practice• and polici•• of th• Canadian Government vith reapec:t to th• appl• induatry, particularly the propo1ed national aupply manq.-nt pro1raa for appl•• in C:Wa.• Al r...-ated by the C~tt .. , the Comi.1aion rill 1eek to proria in_ita report, to the atent po••ible, the followinl information:
B-2
(1) The purpo••· natve, quantity, and ue of the polici•• an4 practice• of the Cntclian national and provincial aovermenta affec:tizll applu, iaclwlina:
(a) rebat• proyid8cl to retailer• by Canadian marketina oqatutioua
(b) adverti•iaa allowance• offered to retailer• by aarketina or1ani&1tiona or national or provincial aaenci••:
(c) payment• to 1row.ra und•r th• Aaricultural Stabilia&tion Act (ASA), the Rational Tripartite Price Stabilization Proar•. and the Britiab Col\lllbia Para Inccm11 Inauranc• Proaraa vben averaa• pricea fall below benchmark coata, and hov th• bencbllark pric•• are 1et; and
Cd) other import, price, and supply proposals b•in1 conaid•r•d by th• National Farm Product• Marketin1 Council.
(2) 'n\e volume and value o! U.S. imports o! !re1h applet from Canada over th• last 5 years, with special emphasis on hov such imports have concentrated in individual re1ional markets throu1hout the United States;
(l) An analy1i1 of th• competitive factors in each industry, includin1 a comparison, by market r•1iona wherever obtainable, of 1ale1 price• of U.S. and Canadian apple• in the U.S. and Canadian marketa, and an -aJi.lysi1 of each country's co1t1 of production;
(4) A comparison of th• quality of U.S. and Canadian appl•• de1tined !or the !r••h apple market;
(5) A compari1on of the con1umption and utilization trends in Canada and th• United Stat•• for apple• de1tined for the fre1h and proce11ed
. market: and
(6) A cQ11Pari1on of total Canadian and U.S. apple production by r•1ion and province over the la1t 5 year1.
WIITl'll SUIKISSIOIS: Intere1ted per1ona are invited to IUbllit written 1tat-nt1 conc•minl the ~veat-iaatioif:· ·Written 1ut.i.11iona to be conaidered by the CClllli.11ion 1hould be~:.received by t~e clo1e of buline11 on Kay 3, 1991. COllll9rcial or financial information which a 1ubllitter deairea the Celmi11ion to treat •• confidential muat be 1ubllitted on 1eparate 1heet1 of paper, each marked •confidential Buline11 Information• at the top. All 1ut.i11iona requeatina confidential treatment muat confor11 vith the requir...nt• of 1ection 201.6 of the CGlllli11ion'1 gu,111 gC Pr1s~is1 apd rtasldur• (19 Cll 201.6). All written 1ut.i.11iona, except for confidential buaine•• information, vill be available for inspection by intereated per1ona. All 1ulll:l11iona 1hould be addre11ed to the Secretary, U.S. International Trade CClllli.11ion, 500 I Str .. t SW, Waahinaton, DC 20436.
BJ order of the ec-i11ion.
Secretary
I1ned: Movaber 21, 1990
B-3
APPENDIX C CANADIAN REQUEST FOR A CANADIAN APPLE MARKETING.
AGENCY
C-2
REQUEST FOR A CANADIAN APPLE MARKETING AGENCY
PRESENTED BY
THE NOVA SCOTIA FRUIT GROWERS' ASSOCIATION
THE NEW BRUNSWICK APPLE MARXETING BOARD
LA FtOtRATION DES PRODUCTEURS OE POMMES DU QUtBEC
THE ONTARIO APPLE MARKETING COMMISSION
THE BRITISH COLUMBIA TREE FRUIT MARJ<ETING BOARD
PRESENTED TO
THE MINISTER OF AGRICULTURE CANADA
AND
THE CHAIRMAN OF THE NATIONAL FARM PRODUCTS MARXETING CQUMCIL
February 8, 1990
CONVERSION FACTORS
!n the text of the Request and the attached appendices
volumes and linear measures have been expressed in the same
form as presented in the original documents to assist the
tcital audience in understanding the signi~icance of the
data by expressing these measures in a familiar manner.
For conversion purposes the following conversion
rates can be applied:
l metric tonne • 2204,6 pounds 2£ l pound • .45359 kilograms
l bushel • 42 pounds
Metric tonnes are converted to bushels by multiplying by 2204.6 and dividing by 42.
1000 pounds • 453.59 kilograms • 23.81 bushels
l hectare • 2.471 acres 2£ l acre • .4P47,of a hectare
C-3
REQUEST FOR A CANADIAN APPLE MARKETING AGENCY
INTRODUCTION
This is a request pursuant to section 7 (l) (a) of the Farm Products Marketing Agencies Act by the apple. growers of Canada, through the following provincial associations in the five major commercial apple growing areas of Canada, for the establishment of a national marketing agency in respect of apples:
i) The Nova Scotia Fruit Growers' Association ii) The New Brunswick Apple Marketing Board iii) La F6d6ration des producteurs de. ·pommes du Qu6bec iv) The Ontario Apple Marketing Commission v) The British Columbia Tree Fruit Marketing Board
Apple growers in each of the five growi.ng provinces, through their Associations, have authorized their representatives on the Canadian Apple Marketing Agency Task Force to develop a proposal for an apple agency with supply management powers. These representatives have attended numerous meetings over the past two years to develop the proposal and to ~eep provincial agricultural departments aware of progress to date. All the travel, accomodations, simultaneous translation and data r.esearch costs have been met by '~he spcfosor inq orqanizations.
Polling of grower support for the Apple Agency will be undertaken at an appropriate time following public hearings.
There are approximately 4,500 Canadian families growing apples commercially across Canada. Apple production has been an important farm product in Canada for over 100 years. It was in the l880's that the world famous Mcintosh variety of apples waa developed at Dundela, Ontario, south of Ottawa. Th• Mcintosh variety became the cornerstone of the Canadian apple growing industry. In the early 1900's Canadian apple growers from Nova Scotia to British Columbia were growing, packing, shipping and exporting apples to world markets.
The commercial production of apples is a year-round businQss. It is the major crop for these 4,500 Canadian families.
Apple growers have been experiencing serious financial problems which threaten their livelihood. Many growers who were self-sufficient five years ago have been forced to take off-farm jobs to sus~ain their farming operations with resulting decline in care and atY.ention of their orchards. These problems will be discussed in detail in this Request, but for the purpose of the introduction, they can be c~tegorized as follows1
C-4
l. losa Of marketahare to imported apples Of 7 - 8• in the past five years has reached alarminq proportions; and
2. a decline in the farm gate price from above to below th• coat of production notwithetandinq increased efficiency in the industry.
Canada has ideal production conditions for apples. The climate and soil produce a better Mcintosh, Delicious, Cortland, Spartan, etc. than moat other producing areas in the world, such aa Chile, California, Australia and France. Therefore there is no reason why Canadian apple growers in Nova Scotia, New Brunswick, Quebec, Ontario and Brit;sh Columbia should be forced out of apple growinq. Canadian apple growers submit that the establishment of a national marketing agency for apples will improve the marketing arrangeme~t for apples in Canada, yet will respect all the existing trading situations of inter-provincial, export and import trade. The national agency for apples will permit Canadian growers to compete for their fair share of th• Canadian market for apples.
PRODUCTION OF APPLES IN CANADA
The production base for apples in Canada is controlled by tree plantings and tree removals. (Typically, newly planted trees begin bearing. f.ruit-in the fourth or fifth year and increase in productivity up to ten years). The denaity of tr•• planting• i• variable from 70 to 800 trees per acre, depending on the type of tr•• planting method selected by individual grower•. Current methods favour higher density plantin91 to accompli•h incr•a•ed fruit 1ize; more intense fruit colour and easier harvest procedure1. In any density of plantin9, the yield of apples in a mature orchard is reasonably conatant, depending on annual variance in yield. Tree removal occurs on a continuous basis to eliminate trees that have been damaged by insects, disease or freezing injury or are of varietie• which have limited market demand as consumer preferences change. Tr .. •9• alone aay nec•••itate replanting at 15 - 20 year• for the more denaely planted orchard.
According to .th• 1986 cen1u1, there are 85,240 .acrea of appl•• bein9 grOWlt in Canada. Attached as Appendix l i• the . statistical 1ummary •h••t prepared from the 1986 censu1 showing the number of farm• producinq apples on one acre or more, broken down by province and size of apple orchard, the number of acres in the five province• producing apples, the number of apple bearing tr••• in each province, and the number of non-bearing apple tr•••, which are young trees that will be bearing fruit W·i thin the next three to four years.
The actual Canadian apple production, according to Statistics Canada, expressed in metric tonnes (2,204.6 pounds
C-5
per met!ic tonne and in bushels (a bushel is 42 pounds) is attached a' Appendix 2. The averaqe production over the past ten year• (1979-1988) in Canada was 463,099 tonne• or 24,308,287 bushels. There is a wide ranqe in the annual production per acre due to weather, disease, and winter damaqe to trees.
MARJ<ETING OF THE FRESH MARltET APPLE CROP
The Canadian apple crop is normally harvested in September and October and placed immediately in short term or lonq term storage according to the schedule of marketinq planned for the crop. The apples are removed from storaqe, graded and packaqed as orders are tilled over th• marketinq ••••on which extend• over twelve months, dependinq on varietal characteriatica.
Canadian apples can be kept fresh year-round due to hiqh technoloqy developments in storaqe techniques. Th• technique of reducing the oxygen level in the storage to not l••• than 1.5• of the atmo•p~ere, which combined with chillinq, k .. p• the Canadian apples perfectly fresh for the whole year. It eliminates any need for imported apples to supply the off-season.
either: The normal marketinq of apples from the farm qate is to
i) the packer/sh~.PP~t:. (which in many inse·a1kes is a Cooperative owned. by the apple qrower-s-); or
ii) the shipper: or
~ii the broker
A packer/shipper, shipper or broker sell to a wholesaler or direct to a retailer. Attached as Appendix 3 is a chart showing the current marketing channels for apples in Canada.
Attached as Appendix 4 is a statistical summary of the Canadian export of apples over the past 20 years.
CROP DISPOSITION AND CONSUMPTION PATTERN (Appendix 5)
Th• averaqe production of apples in Canada over th• 1983-87 five year period wa• 458,354 tonnes (24,052,672 bushels). Imports in the same period averaged 109,142 tonnes (5,728,916 buahels). Exports over the five year period averaqed 57,640 tonne• (3,024,728 bushels).
After the removal of 198,790 tonne• (10,434,582 bu•h•l•) from the supply for proc•••inq, 311,046 tonne• (16,322,509 bu•h•l•) remain for fresh consumption.
C-6
, This represents an annual per capita consumption of fresh apple• in Canada of 26.7 pounds, well below per capita consumption level• of apple• in Europe of 45-50 pounds.
LOSS OF MAJUCETSHARE TO OTHER COUNTRIES
The Canadian marketshare of fresh eatinq apples has declined about 7' in the past five years. The averaqe marketshare for the Canadian apple qrowers between 1978 to 1982 was 66,4,, This marketshare has declined to an averaqe of 59.5\ over the five year oeriod 1983 to 1987.
The volume of imports has substantially increased from approximately 23,000 tonnes i~ 1968 to 74,000 tonnes in 1978 to 133,000 tonnes in 1987.
Attached as Appendix 6 are the statistics for the Canadian marketshare of apples for the fresh eatinq market and the import statistics for the past 10 years.
·. '
This loss of marketshare to imports has been caused by a number of factors - none attributable to the Canadian apple qrowers.
OVERPRODUCTION AROUND THE WORLD
The main factor contributinq to th• lo•• of marketshare for Canadian apple growers due ·to an increase in import• ii the overproduction of ,apple• in Chile, the us and el1evh•r• around th• world. · ·
For example, Chile has expanded its production by 417' between 1975 and 1985, and The United States has been increasinq production rapidly and their ten year average production from 1968 to 1978 was 2,989,690 tonne• and the ten tear •v•rage from 1979 to 1988 was 3,857,970 tonnes. This is a dramatic increase of 29' in the U.S.
Attached as Appendix 7 are the statistics showing the average United Stat•• apple production over the past 20 years, and the world apple production for 1975 and 1985.
Canada used to enjoy a positive trade balance for apples. In 1968, Canada'• exports of apples exceeded imports by 48,235 tonnes. By 1987 it had imported 56,087 tonne• more than it had exported. The last five years has seen an increase in th• trade deficit by 125'· The apple growing industry ii a proven industry which deserves and requires a marketing agency which will' halt the decline in marketshare and freeze th• current import penetration.
C-7
IMPORTs' AFFECT PRICES OF CANADIAN APPLES
The price for Canadian apples is low, because the price of import• affects the Canadian market price for apple•, wh•ther they are imported or whether they are grown in Canada. A good example of this is the Canadian Import Trade Tribunal anti-dumping decision on the imports of Delicious apples from the U.S.
The wholesaler knows that he can buy an apple in Canada from anywhere in the world. If apples from the US, Chile or elsewhere are available at so many dollars a bushel, then the wholesaler will only pay that amount for Canadian apples.
PRICES FOR CANADIAN APPLES ARE BELOW THE CASH COST OP PRODUCTION
In each of the years 1980 - 1986 input coats for the crops exceeded output value with an extreme differential of 7.4 cent• per kg. in 1984. Provincially, Nova Scotia costs exc .. ded value in five of those years. New Brunswick showed a marqin of value over cost each year. Quebec costs exceeded value in •ix of the years. Ontario costs exceeded value in four of the year• and British Columbia costs exceeded output value in every year since 1980. On• averaqe input co•t• exceed output value by 4.35 cent• per kq. durinq thia seven year period.
It should be noted that the input cost information is obtain•~ from Statistics Canada and it represents in a rouqh way, the cost of production. The input costs only represent the cash costs of the total cost of production~ so the cost of production in fact could be higher than the total input costs set out by Statistics Canada. Appendix 8 attached.
APPLES ARE INEXPENSIVELY PRICED
The farm gate price per pound for apple• has not increased in the past ten years. In 1_978, the averaqe price aero•• Canada at the farm gate waa 9.4¢ per pound. For simplicity purpoae•, if there are 4 apples per pound, the price per apple vould be 2.3¢ per apple. In 1987, the average price was 9.3¢ per pound. At the same time, the coat• of production have subatantially increased.
Attached a• Appendix 9 is a table showinq th• farm value tor apple• in all five producing provinces and for Canada on average between 1978 to 1987.
Using the example above of four average apple• ~r pound, and if the price per pound is 10¢, the average ~ _ price per apple is 2.5~ at the farm gate. The apple grower• need a price increase of only 1¢ per apple at the farm gate· to address the price problem facinq the industry. At J.5¢ per apple, apples are still inexpensively priced. The apple grower• .believe
C-8
that w~h the wide price spread between the farm gate and the retail selling price this 1¢ per apple increase could easily be absorbed without increasing the cost to the consumer.
In 1987, apples sold at the farm gate for 9.3¢ per ·pound, but were selling at retail for 81¢ . This is a spread of 71.7¢ per pound or $3.58 for a S pound bag. Appendix 10 attached.
While the price to the apple grower has not increased over the past five years, the retail price has increased from 68¢ to 81¢. The retail price has increased by 21.S\ over the past five years, while the price to the apple grower has remained constant. The difference between the retail price and the price to the grower, over the same five year period has increased from 59¢ to 71.7¢ - an increase of 12.7¢ . Whatever the reason for the huge price spread, and th• increase in the price spread over the past five year•, the retailer• ought to be able to •ither abaorb a 1¢ per apple or a 4¢ per pound increase in the price, or pas• it on .to th• consumer without any further markup.
HOW THE APPL& AGENCY WILL SOLVE PROBLEMS IN THE INDUSTRY
A National Marketing Agency for apples will solve the two major problems which threaten the apple growing industry, and a%e placing apple growers in an economic crisis.
The Agency will ask the Canadi.an Govern.men,t to ... freeze the level of imports at the current level of approximately 40'' of th• Canadian market for fresh apples.
The volume of imports has been steadily increasing from: 23,000 tonnes in 1968 to 74,000 tonnes in 1978, to 133,000 tonnes in 1987.
If this trend is not stopped, Canadian apple growers will soon be out of business.
The Agency will enter into price setting at the interprovincial trading level at a minimum price to return cost of production and.a fair rate of return. With imports frozen this will allow th• price to rise about l cent an apple which is enough to achieve financial stability.
C-9
THE APl'LE MAUETING AGENCY WOULD SAVE THE GOVERNMENT MONEY . .
In 1987, t·here was a· price stabilization payment of l.6¢ per pound for every pound of apples marketed in Canada. That represents a cost of over Sl6 million. Two thirds of those payments are by the Provincial and Federal Governments. The other third is paid by the producers.
Even after this payment, the apple qrower is still not making a profit. He is barely breaking even.
The proposed National Marketing Agency would ·allow the apple qrowers to increase the price at the farm gate by 1¢ per apple which would eliminate the requirement for stabilization payments and would return-the apple growers-to a position where they are enjoyinq a reasonable return. This will save the governments millions of dollars. ·
ADVANTAGES TO THI CONSUMER
The advantages of the proposed National Marketing Agency for apples to the consumer are as follows:
1. The consumer would save tax dollars paid to the Provincial and Federal Governments in the order of millions of dollars;
2. The consumer would have stability of supply, price and quality from apple growers in Canada that were real~zinq a fair price;_and
3. Apples would remain an inffxpensive fruit with possibly no price increase at the retail level if the retailers absorb this increase. · If the retailers do not absorb the le per apple increase, then the price of apples would not be significantly increased. By relative standards to other fruits and vegetables, apples will remain a good value for the consumer's food dollar.
APPLES FOR THE PROCESSING MAJUtET
Apples with specific processing uses are delivered to processor• as required. Juice apples include windfall• collected at harvest ti.JDll, apple• which do not meet minimum grade r&quirement• during pACking of fresh market apples, and any other apple• that cannot be marketed a• a result of change• in market acceptance.
C-10
Appies for juice processing represent a salvage situation for apple growers. Apple growers do not make money on apples sold for· juice to processors. These apples are windfalls and cuilouts from the gr~ding lines.
It is important to note that there is one exception with respect to processing apples grown for peeling and slicing market. These apples are not salvage apples - they are grown for the processor, and accordingly are priced at the prevailing market levels.
Apple growers do not expect or request that apples for processing be subject to price and interprovincial regulation under the marketing plan. Apple growers very genuinely do not want the apples for processing subject to any regulatory control. The processors provide them with a market for their rejects and provide the apple growers a very valuable service that this prop9sed agency ought not to interfere with.
A NEW MARXETING APPROACH FOR APPLES
The proposed National Apple Marketing Agency will undertake the promotion of apples to the consumer in the manner in which the milk producers have advertised and promoted the "goodness of milk".
COST OF PRODUCTION
The cost of production for apples will be fixed on a provincial ~asis at the fair and reasonable cost of production of an efficient producer. The proposed National Apple Marketing Agency will avoid the current problems experienced with other
.commodities where the cost of production is fixed at the average of all of the producers including the inefficient and mismanaged producers. That "common denominator approach·• of fixing the c .. o.P. at the lowest average will.not be acceptable to the National Canadian Apple Marketing Agency. The Canadian Apple Growers undertake to work with the National Farm Products Marketing Council officials to develop a cost of production formula and mechanism.which reflects the real cost of production of efficient apple growers.
MAR.lCET RESPONSIVENESS
The National Canadian Apple Marketing Agency will respond to the demands of the market in a manner not herebefore seen with supply managed commodities. The present marketing patterns for apples is now very market responsive, as it has to be since it is working in a free market environment. The Canadian Apple Growers undertake to maintain this market responsiveness in the following manner:
C-11
If there.is an increase in demand, the Supply Management Committee of the Canadian Apple Marketing Agency will respond in the next quarter by allocating more marketing quota. This will be accomplished by providing for adequate representation for distributors, wholesalers, packers and consumers, so that chanqinq market demand will be brought to the attention of the agency in a timely manner, and marketing quotas adjusted forthwith. The Canadian Apple Growers recognize that shorting of production in relation to demand has been allegedly done with other supply managed commodities, and the apple growers undertake to ensure that this does not occur with apples.
GREEN PAPER·
The Government of Canada Green Paper on Agricultural Policy recognizes that supply management must be more responsive to market demands and must be fair in the setting of costs of production. With such changes, supply management is an excellent means of marketing certain commodities. The apple growers are convinced that supply management is the best means for marketing apples, and will ensure that the changes in supply management which the Green Paper identified are implemented in the establishment of a supply management program for apples.
GATT - NO IMPORT RESTRICTIONS ON APPLE JUICE OR OTHER PROCESSED APPLE PRODUCTS
Canadian Apple Growe~s do not consider that the establishment of a supply management system, for. apples will pr.e.sent ... any problems for Canada under GATT. The problems experienced with a complaint against Canada under Article if of GATT due to the import restrictions on ice cream and yogurt will not happen because of the Canadian Apple Marketing Agency.
The Canadian Apple Growers do not propose that there be any import restrictions on any processed apple products including apple juice, apple sauce, apple pie, or dried apples. None of t~ese products will be restricted. The proposed Agency will only apply to fresh apples and th• market for fresh apples. ·
Therefore, the Government of Canada ought not be concerned that the eatablishment of this supply management agency for apples will be cause for any legitimate complaint by Canada's trading partners under GATT.
C-12
THE MA.RJ:ETING PLAN
OBJECTIVE OF THE PLAN
The objective of the proposed marketinq plan is to ensure the maintenance of a viable apple industry in Canada. This can be achieved by establishinq a more efficient and effective marketing ·system taking into consideration the interest of qrowers, consumers, processors, wholesalers, retailers export~rs and importe~s. ·
PRODUCER (grower)
Any person or organization who owns one hectare or more of apple orchard.
REGULATED PRODUCT
The regulated product is apples in their naturai state.
REGULATED AREA
The regulated area is the provinces of Nova Scotia, New Brunswick, Quebec, Ontario nd British Columbia.
APPLE MA.RJ:ETING AGENCY PROPOSAL
It is recommended that the Government of Canada approve the establishment of a Canadian Apple .I'Jar_k~1;_i~g Aqency_ to provide the regulatory authority necessary for a marketing plan with powers and. responsibilities consistent with. Sections 23 and 2-4 of the Act ·· including -
(1) The establishment of the size of national market whichwill be the target level of the total marketings of the regulated areas in intraprovincial, interprovincial and export and the marketings of the unregulated area in interprovincial trade and the adjustment of that target level from time to time.
( 2) The allotment of provincial allocations of "the total Canadian and export markets to each provincial producer Commodity Board or Association and the adjustment of the provincial allocation aa required from time to time.
(3) Th• authority to purchase apples for export or import in situations of serious market aberrations such as shortages or over supply.
(4) The licensing of 'qrowers, packers, shippers and dealers in interprovincial and expo~:t trade.
(5) The authority to obtain disclosure of information pertaining to apples in their natural state from any persons engaged in the growing, processing, transporting and marketing of such apples.
C-13
(6) The Agency will undertake to consult with the appropriate authority in matters of import of the regulated product.
(7) The establishment of a cost of production formula that will fairly reflect the cost of growing apples including an allowance for a reasonable return to growers. The grower levy will be an element of the cost of production.
(8·) The authority to acquire the regulated product for diversion from regular market channels or to arrange such diversion.
(9) Pricing in interprovincial trade will reflect intraprovincial pricing levels plus transportation costs. Product purchased for diversion will be priced at best market value. obtainable.
COORDINATION OF PROVINCIAL AND FEDERAL AUTHORITY
In addition to the Federal/Provincial Government agreement tor enabling authority the Apple Agency and the Commodity Boards will enter into agreements and contracts to administer cross delegations to dovetail federal and provincial jurisdictions.
(1) Provincial Commodity Boards & Associations
The Boards within the scope of their provincial marketing le9i•lation will:
(a) Allocate quota to each grower.
(b) Price the regulated product wi~hin their provincial boundaries.
(c) Supply market information to the Agency for purposes of price coordination in interprovincial and export marketing.
(d) License growers and others within their area required to be licensed.
(•) Collect levies for financing as an agent of the National Agency.
(f) Arrange for diversion of apples from regular market channels as an agent of the National Agency.
(g) Enforce Agency regulations at the provincial level.
(2) Apple Marketing Agency ' The Agency, when proclaimed, will:
(a) Determine the Canadian market volume for apples including the unregulated area and allocate market share to each province accordingly.
(b) Harmonize the pricing of the regulated product moving in interprovincial trade.
(c) Assist exporters in finding export markets and coordination of pricing consistent with international trading agreements.
(d) Conduct market and product research and promote the use of the regulated product in interprovincial and export trade.
, (e) Purchase product for diversion from fresh market channels in situations of unusual product deterioration or market conditions inconsistent with established Agency pricing regulations and manage disposition of the diverted product.
(f) Collect and disseminate market information for the provincial boards.
(9) Enforce agency regulations at the national level.
(h) Participate as requested by federal government authorities in matters related to import volume control.
(i) Administer the marketing plan and funding of the Agency.
MAIUCE.TING CONTROL
The Canadian Apple Marketing Agency will manage the supply of apples destined for fresh market purposes in interporvincial and export trade. Control of apples for processing or other uses will be affected only as product diversion is required.
. The supply of apples for juice processing will continue to be windfall apples and those apples which do not meet minimum grade requirements durinq packing of fresh market apples and any other apples that cannot be marketed as a result of change• in market acceptance.
C-15
(1) Management of Supply
Canadian production is grown on 85,240 acres of apple orchard as determined by Statistics Canada from Census data or special surveys. This acreage represents bearing and non-bearing trees as required to maintain production volume at the level of the market demand while taking into account tree mortality and changes in consumer preferences for specific varieties. Appendix 11 indicates the trend in acreaqe of bearinq and non-bearinq apple trees .
. The marketinq plan proposes to manaqe the supply of apples by limitinq each producinq province to the actual orr.hard measurement of trees immediately following the proclamation of the national agency.
(2) MARJCETING QUOTA ALLOCATION FOR FRESH MAJUCET APPLES
The market demand for apples is established by adding to the annual production volume in Canada, the volume of apples imported during the marketing season of the Canadian crop. Market demand includes the needs for fresh market apples to satisfy the intraprovincial, interprovincial and export requirements for fresh apples. Appendix 5 illustrates the previous 5 year averages for Canadian production, exports·, imports and processing. ·
The provincial allocation of marketing quota for fresh market apples shall be calculated on the basis of the production of fresh market apples from each province in relation to the total production in Canada of fresh market apples over the period of five years immediately precediog, the .ef.fec.t.ive .date. of ... the. marketing plan. There will be an appropriate adjustment to take into account the loss of production due to Wintei kill of trees.
(3) PRICING
The Agency and the Provincial Marketing Boards will strive to. establish prices with the underlying principle of re~~rning to growers an amount which covers cost of production and a reasonable return based on an af f icient production operation.
Cost of production will be uniformly measured_for all the regulated areas but will permit adjustments for regional· dif ferenc:•• in produc.tion costs.
The Provincial Commodity Boards will establish prices for intraprovincial trade and supply price information to the Agency for control of dumping in interprovincial and export trade.
C-16
(4) LICENSING
. The Agency and the Provincial Commodity .Board will implement a system of licensing growers and other persons engaged in the marketing of the regulated product, including market
.. information sources, for the purposes of· collecting ·fees or levies, and the enforcement of Agency responsi~ilities.
Provision will be made for the cancellation or suspension of licences for cause.
( 5) LEVIES . '
Levies and/or fees will be collected from growers and other persons by the Provinc'ial· Commodity Board to cover costs of the Agency for administration, market research,, product promotion information gathering ·and a product diversion program. Provincial pro rated shares of the proceeds of the levy will be submitted to the Agency on a timely basis to satisfy financial requirements. A levy may be collected from importers for product promotion.
(6) FINANCING
All financial requirements of the Agency will be met from fees or levies collected from licensees. Requirement for supplementary financing may include bank borrowing as necessary. . .
For init,i.al · fundinq- it-.-is- proposed. that the Agency be granted the. full allowa~ce provided' under, the Fa~ Products Marketing Agencies Act for spending in cc:>nfo.rmity with the Act.
(7) PRODUCT ANO MAUIT RESEARCH ANO PROMOTION
. The Agency will undertake'generic promotion of the regulated product and do research into existing or·new markets for increase of sales volume.
(8) DIVERSION
When the need arises the Agency is empowered to arrange diversion of the regulated product from regular market cnannels in situationa. when sales cannot otherwise be made and before the product becomes worthless for comrnerical uses. Purchase of product may be undertaken for other uses including export if necessary.
(9) ENFORCEMENT
A system of inspection and.penalties will be put in place to ensure the positive functioning of the Marketing Plan.
C-17
(10) COMMITTEES
Special committees of the Agency may be structured for specific purposes as required. e.q. Market Advisory, Pricing, Import/Export advisory.
(11) THE AGENCY BOARD OF DIRECTORS
Each participating province will be represented in the Aqency by one director and a desiqnated alternate director. In addition, the Governor in Council will appoint two persons to the Board of Directors as representatives of other interest groups.
Each Commodity Board or Association will .propose the name of their nominee for director to the Governor in Council.
The Chair and Vice Chair of the Agency will be elected from amonq their number.
(12) VOTING
(a) Each director to have one vote.
(b) A vote will be carried by simple majority of directors votinq.
(13) AT'l'!NDANCI AT MEETINGS
A quorum shall consist of not less than five {5) of the votinq directors. Per diem, travel and livinq costs for directors will be paid out of Agency funds.
---------------------------------~--------------------------------CANADIAN PRODUCTION OF APPLES BY PROVINCE FOR BOTH FRESH ANO PROCESSING -----------------------------------------~PURPOSES ____________________________ ~
Crop Nova New British "ear Scotia Bruns. Quebec Ontario Columbia Canada
(1) As indicated in appendix 9, this is a blended price. Th• cost of gradinq packinq ' transportation is added to th• price for fresh market apple• before delivery to wholesale.
(2) Whole1ale selling price includes handling co1t1 &~rl mark-up.
(3) Source of retail price information is Retail Pri~••' Price Spread1 Section -Agriculture Canada - The pric• includes transportation, handling & mark-up.
C-27
ACREAGI OF BEARING A.ND NON-BEARING APPLE TREES IN CAHAJ>A
·APPENDIX D LIST OF U.S. HARMONIZED TARIFF SCHEDULE NUMBERS
COVERED BY THE INVESTIGATION
HTS
0808.10.00
0811.90.80
0813.30.00
2007.99.45
2007.99.48
2001.99:15·
2008.99.05
2009.70.00
D-2
Short description HTS description Apples
Chapter 8: Edible Fruit and Nuts; Peel or Citrus Fruit or Melons
Fresh apples
Froi.en Apples
Dried Apples
Apples, pears and quinces, fresh: Apples
Fruit and nuts, uncooked by steaming or boiling in water, frozen, whether or not con-taining added sugar or other sweetening matter: Other: Other: Other
Fruit, dried, other than that of headings 0801 to 0806; mixture of nuts or dried fruits of this chapter: Apples
Chapter 20: Preparations or Vegetables, Fruit, Nuts or Other Parts of Plants
Apple jam
Apple paste and puree
Apple jelly
Applesauce
Apple juice
Jams, fruit jellies, mannalades, fruit or nut puree' and fruit or nut pastes, being cooked preparations, whether ornot containing added sugar or other sweetening matter: Other: Other: Jams: Other
Jams, fruit jellies, mannalades, fruit or nut puree' and fruit or nut pastes, being cooked preparations, whether or not containing added sugar or other sweetening matter: Other: Other: Pastes and purees: Apple, quince, and pear
Jams, fruit jellies, rilannalades, fruit or nut puree' and fruit or nut pastes, . . ~ being cooked preparations,_whetherornot.ccmtaining added sugar or
· other sweetening matter: Other: Other: Fruit jellies: Other ' . " '
Fruit, nuts and other edible parts of plants, otherwise prepared or preserved, whether or not containing added sugar or other sweetening matter or spirit, not elsewhere specified or included: Other, including mixtures other than those of subheading 2008.19
Fruit juices (including grape must) and vegetable juices, unfermented and not containing added spirit, whether or not containing added sugar or other sweetening matter: Apple juice
APPENDIX E LIST OF CANADIAN HARMONIZED TARIFF SCHEDULE NUMBERS
COVERED BY THE INVESTIGATION . .
' HTS--
0808.10.10
0808.10.90
0813.30.00
2007.99,90
2008.99.11
2008.99.!9
2000.70
2000.10:10
2000.70.91
2000.70.99
E-2
Short description HTS description Apples
Chapter 8: Edible Fruit and Nuts; Peel or Citrus Fruit or Melons
Fresh apples 10 20 30 40 50 60 90
Dried apples
In their natural state: Empire Golden Delicious Granny Smith IdaRed Mcintosh Red Delicious Other
Other
Fruit, dried, other than that of heading Nos. 08.01 to 08.06; mixtures of nuts or dried fruits of this Chapter: Apples
Chapter 20: Preparations or Vegetables, Fruit, Nuts, or Other Parts or Plants
Apple jam, paste,
40 50
Apple~lly
Applesauce 10 20 90
Apple juice
Apple juice
10 21 29
Apple juice
10 21 29
31 39
Apple juice
10 90
Jams, fruit jellies, marmalades, fruit or nut and puree purees and fruit or nut pastes, cooked preparations, whether or not containing added sugar or other sweetening matter: Other:
Jams, in air-tight containers Jellies, in air-tight containers
Fruit, nuts and other edible parts of plants, otherwise prepared or preserved, whether or not containing added sug~ or other sweetening matter or spirit, not elsewhere specified or included: Other: Apples: Pulp
Other Applesauce in air-tight containers Other, in air-tight containers Other
Fruit juices (including grape must) and vegetable juices, unfermented and not containing added spirit, whetherornotcontaining added sugar or other sweetening matter: Apple juice
Concentrated for use in the manufacture of apple juice
Frozen In air-tight containers Other
Concentrated or reconstituted
Frozen, concentrated In airtight containers Other: