17

APPLICABILITY OF CARBON DIOXIDE ENHANCED OIL RECOVERY TO RESERVOIRS
IN THE UINTA BASIN, UTAH
byZhiqiang Gu and Milind Deo
Cover photo:Glen Bench area, looking north towards the Uinta Mountains, Uintah County. Photo by Craig Morgan.
OPEN-FILE REPORT 538UTAH GEOLOGICAL SURVEY
a division ofUtah Department of Natural Resources
2009

STATE OF UTAHJon Huntsman, Jr., Governor
DEPARTMENT OF NATURAL RESOURCESMichael Styler, Executive Director
UTAH GEOLOGICAL SURVEYRichard G. Allis, Director
PUBLICATIONScontact
Natural Resources Map & Bookstore1594 W. North Temple
Salt Lake City, Utah 84116telephone: 801-537-3320
toll free: 1-888-UTAH MAPWeb site: mapstore.utah.govemail: [email protected]
UTAH GEOLOGICAL SURVEYcontact
1594 W. North Temple, Suite 3110Salt Lake City, Utah 84116telephone: 801-537-3300
fax: 801-537-3400Web site: geology.utah.gov
This open-file report was prepared by the authors under contract to the Utah Department of Natural Resources, Utah Geological Survey. Thereport has not undergone the full UGS review process, and may not necessarily conform to UGS technical, editorial, or policy standards. Therefore,it may be premature for an individual or group to take action based on its content.
The Utah Department of Natural Resources, Utah Geological Survey, makes no warranty, expressed or implied, regarding the suitability of thisproduct for a particular use. The Utah Department of Natural Resources, Utah Geological Survey, shall not be liable under any circumstances forany direct, indirect, special, incidental, or consequential damages with respect to claims by users of this product.
The Utah Department of Natural Resources receives federal aid and prohibits discrimination on the basis of race, color, sex, age, national ori-gin, or disability. For information or complaints regarding discrimination, contact Executive Director, Utah Department of Natural Resources, 1594West North Temple #3710, Box 145610, Salt Lake City, UT 84116-5610 or Equal Employment Opportunity Commission, 1801 L. Street, NW, Wash-ington DC 20507.

TABLE OF CONTENTS
OBJECTIVES . . . . . . . . . . . . . . . . . . . . . . . . . . . . . . . . . . . . . . . . . . . . . . . . . . . . . . . . . . . . . . . . . . . . . . . . . . . . . . . . . . . . . . . . .1BACKGROUND . . . . . . . . . . . . . . . . . . . . . . . . . . . . . . . . . . . . . . . . . . . . . . . . . . . . . . . . . . . . . . . . . . . . . . . . . . . . . . . . . . . . . . .2CRUDE OIL ANALYSIS . . . . . . . . . . . . . . . . . . . . . . . . . . . . . . . . . . . . . . . . . . . . . . . . . . . . . . . . . . . . . . . . . . . . . . . . . . . . . . . .2MINIMUM MISCIBILITY PRESSURE . . . . . . . . . . . . . . . . . . . . . . . . . . . . . . . . . . . . . . . . . . . . . . . . . . . . . . . . . . . . . . . . . . . .2SIMULATIONS . . . . . . . . . . . . . . . . . . . . . . . . . . . . . . . . . . . . . . . . . . . . . . . . . . . . . . . . . . . . . . . . . . . . . . . . . . . . . . . . . . . . . . .2THE GLEN BENCH STUDY . . . . . . . . . . . . . . . . . . . . . . . . . . . . . . . . . . . . . . . . . . . . . . . . . . . . . . . . . . . . . . . . . . . . . . . . . . . .2MONUMENT BUTTE NORTHEAST (MB-NE) . . . . . . . . . . . . . . . . . . . . . . . . . . . . . . . . . . . . . . . . . . . . . . . . . . . . . . . . . . . .12CONCLUSIONS . . . . . . . . . . . . . . . . . . . . . . . . . . . . . . . . . . . . . . . . . . . . . . . . . . . . . . . . . . . . . . . . . . . . . . . . . . . . . . . . . . . . . .12ACKNOWLEDGMENTS . . . . . . . . . . . . . . . . . . . . . . . . . . . . . . . . . . . . . . . . . . . . . . . . . . . . . . . . . . . . . . . . . . . . . . . . . . . . . . .12REFERENCES . . . . . . . . . . . . . . . . . . . . . . . . . . . . . . . . . . . . . . . . . . . . . . . . . . . . . . . . . . . . . . . . . . . . . . . . . . . . . . . . . . . . . . .13
FIGURES
Figure 1. Location of major oil and gas fields in the Uinta Basin . . . . . . . . . . . . . . . . . . . . . . . . . . . . . . . . . . . . . . . . . . . . . . . .3Figure 2. Generic water-oil and liquid-gas relative permeability curves which are used to calculate the three-phase
relative permeabilities. . . . . . . . . . . . . . . . . . . . . . . . . . . . . . . . . . . . . . . . . . . . . . . . . . . . . . . . . . . . . . . . . . . . . . . . . . .5Figure 3. Comparison of oil recoveries in an ideal 20-foot-thick reservoir with a secondary CO2 flood and the water
alternating gas process. . . . . . . . . . . . . . . . . . . . . . . . . . . . . . . . . . . . . . . . . . . . . . . . . . . . . . . . . . . . . . . . . . . . . . . . . .6Figure 4. Isopach map of the Glen Bench Sandstone. . . . . . . . . . . . . . . . . . . . . . . . . . . . . . . . . . . . . . . . . . . . . . . . . . . . . . . . . .6Figure 5. Average porosity (in percent) distribution in the Glen Bench Sandstone. . . . . . . . . . . . . . . . . . . . . . . . . . . . . . . . . . . .7Figure 6. OOIP recoveries in the Glen Bench field for a CO2 flood and for WAG. . . . . . . . . . . . . . . . . . . . . . . . . . . . . . . . . . .7Figure 7. CO2 distribution in the Glen Bench field under a CO2 flood . . . . . . . . . . . . . . . . . . . . . . . . . . . . . . . . . . . . . . . . . . . .8Figure 8. CO2 distribution in the Glen Bench field undergoing Water Alternating Gas (WAG) displacement . . . . . . . . . . . . . .8Figure 9. Primary recovery from MB-NE, with and without hydraulic fractures . . . . . . . . . . . . . . . . . . . . . . . . . . . . . . . . . . . .9Figure 10. Oil saturation in MB-NE (section 25) after the primary production . . . . . . . . . . . . . . . . . . . . . . . . . . . . . . . . . . . . . .9Figure 11. Waterflood recovery in MB-NE, with and without hydraulic fractures . . . . . . . . . . . . . . . . . . . . . . . . . . . . . . . . . .10Figure 12. Post waterflood oil saturation in MB-NE (section 25) . . . . . . . . . . . . . . . . . . . . . . . . . . . . . . . . . . . . . . . . . . . . . . .10Figure 13. CO2 flood recoveries in MB-NE (section 25) with and without hydraulic fractures . . . . . . . . . . . . . . . . . . . . . . . .11Figure 14. CO2 WAG recoveries in MB-NE(section 25) with and without hydraulic fractures. . . . . . . . . . . . . . . . . . . . . . . . .11
TABLES
Table 1. Standard carbon number (SCN) distribution of the oil sample from the 15-25 well . . . . . . . . . . . . . . . . . . . . . . . . . . .4Table 2. Mole fractions of the various carbon number fractions in the recombined oil . . . . . . . . . . . . . . . . . . . . . . . . . . . . . . . .4Table 3. Concentrations of the 12 components obtained by lumping the original oil components. . . . . . . . . . . . . . . . . . . . . . . .4Table 4. Parameters used in the fundamental process evaluation of the CO2 EOR process. . . . . . . . . . . . . . . . . . . . . . . . . . . . .5

OBJECTIVES
A report titled “Basin Oriented Strategies for CO2 Enhanced Oil Recovery,” compiled for the U.S. Department of Energy(Advanced Resources International, 2006), states that the reservoirs in Utah have 2 billion barrels of stranded oil that is amenablefor recovery through carbon dioxide (CO2) enhanced oil recovery (EOR) method. Recognizing this vast potential, two specificreservoirs in Utah were evaluated for CO2-EOR. It is well known that successful waterfloods usually lead to successful CO2-EOR projects. In this project, two of the successful water flooded reservoirs in the Uinta Basin were studied in detail for poten-tial of CO2-EOR.
Redwash field (figure 1) has produced about 80 million barrels of oil in primary and secondary production (Utah Divisionof Oil, Gas and Mining production records), and was initially considered to be a good target. However, the field was too com-plex, producing from a multitude of sands and the producing company was of the opinion that evaluation of CO2-EOR for thefield ought to be deferred. Instead a small 5 million barrel oil field, Glen Bench, which was well delineated was selected forevaluation.
Greater Monument Butte field offered a more distributed target. Primary and secondary recoveries in these reservoirs tendto be low (5% and ~10-20%, respectively (Pennington, et al., 1996)) providing a large target for CO2-EOR. Thin layered payzones and low permeabilities make designing these floods challenging.
This simulation study was an attempt to accomplish the following:
• Estimate the post waterflood incremental oil recovery for the two fields using CO2 injection and water alternatinggas (WAG).
• Determine the CO2 utilization factors. This refers to the amount of CO2 needed for every incremental barrel of oilproduced. It is well known that a utilization factor between 8-12 Mcf of CO2 per barrel will generally lead to aneconomic process.
• Establish the sequestration potential of the proposed EOR operations, in million tons of CO2 sequestered per year.
Based on the results of this project, a more targeted, project design could be undertaken in collaboration with field operators.
APPLICABILITY OF CARBON DIOXIDE ENHANCEDOIL RECOVERY TO RESERVOIRS IN THE
UINTA BASIN, UTAH
byZhiqiang Gu and Milind Deo

BACKGROUND
CO2 flooding under miscible conditions is an importantand widely used process for EOR throughout the world(Christensen, et al., 2001). CO2 is usually not miscible onfirst contact with the reservoir oil. However, at sufficientlyhigh pressures, CO2 achieves miscibility with oil for a broadspectrum of reservoirs. Under favorable conditions, the gaswill vaporize the low to medium fractions of the reservoircrude. After multiple contacts between the oil and CO2, abank of light hydrocarbons and CO2 will form, and this mix-ture promotes miscibility between the CO2 and the remain-ing crude oil. The minimum pressure at which this miscibil-ity is achieved is termed the minimum miscibility pressure(MMP). If miscibility is achieved, the flooding will promotean efficient displacement without a residual phase. In theo-ry, this could lead to the recovery of 100% of the oil in place.In practice, in laboratory experiments over 90% recovery isachieved (Yelig and Metcalf, 1980). In addition to the devel-opment of miscibility, CO2 also dissolves in the oil loweringviscosity and increasing volume (the swelling effect).Because of these effects, CO2 floods are very effective evenunder immiscible conditions. Whether a CO2 flood is first-contact miscible, multi-contact miscible, or immiscibledepends on the composition of the crude oil, the reservoirtemperature, and the pressure under which the flood is car-ried out.
CRUDE OIL ANALYSIS
Crude oil analysis was performed using the simulateddistillation procedure (SIMDIS) on a gas chromatographiccolumn on an oil sample collected at the well head of the 15-25 well (T. 8 S., R. 16 E., section 25) in the Monument ButteNortheast unit. Dead oil viscosities at temperatures of 120°Fwere in the range of 2 to 4 centipoise (cp). The carbon num-ber distribution of the sample (averaged from two runs) isgiven in table 1.
A gas-oil ratio of 400 standard cubic feet/stock tank bar-rel (scf/stb) was used to recombine the oil with dissolved gasand the mole fractions of the standard carbon number com-ponents were calculated. The data are shown in table 2.
It is not practical to model the CO2-EOR displacementwith 45 oil components. Hence a lumping study was con-ducted using the program WINPROP from the ComputerModeling Group in Calgary, Canada. This resulted in repre-senting the oil using 12 components. Lumping results areshown below in table 3. In addition, CO2 was a componentin all the studies.
MINIMUM MISCIBILITY PRESSURE
Minimum miscibility pressure of the oil calculated at120°F was about 2900 psia. For the simulations carried outat 120°F, the bottom-hole injection pressures were about4500 psia—as a result, most of the reservoir was at pressuresthat exceeded the minimum miscibility. The minimum misci-bility pressure at 160°F is about 4000 psia. At the same tem-perature, the minimum miscibility pressure in Rangely field,Colorado, was about 2100 psia (the injection gas at Rangely
contained about 5% methane (Graue and Zana, 1981). Thus,from a miscibility view point, higher pressures would berequired in Monument Butte field compared to other ongoingCO2 floods for attainment of complete miscibility.
SIMULATIONS
All the simulations were performed using the composi-tional simulator, GEM from the Computer Modeling Group,Calgary, Canada. Three different types of simulations wereperformed for the Monument Butte Northeast (MB-NE) unit.In the first, a fundamental evaluation of the CO2-EOR poten-tial was undertaken using an idealized system.
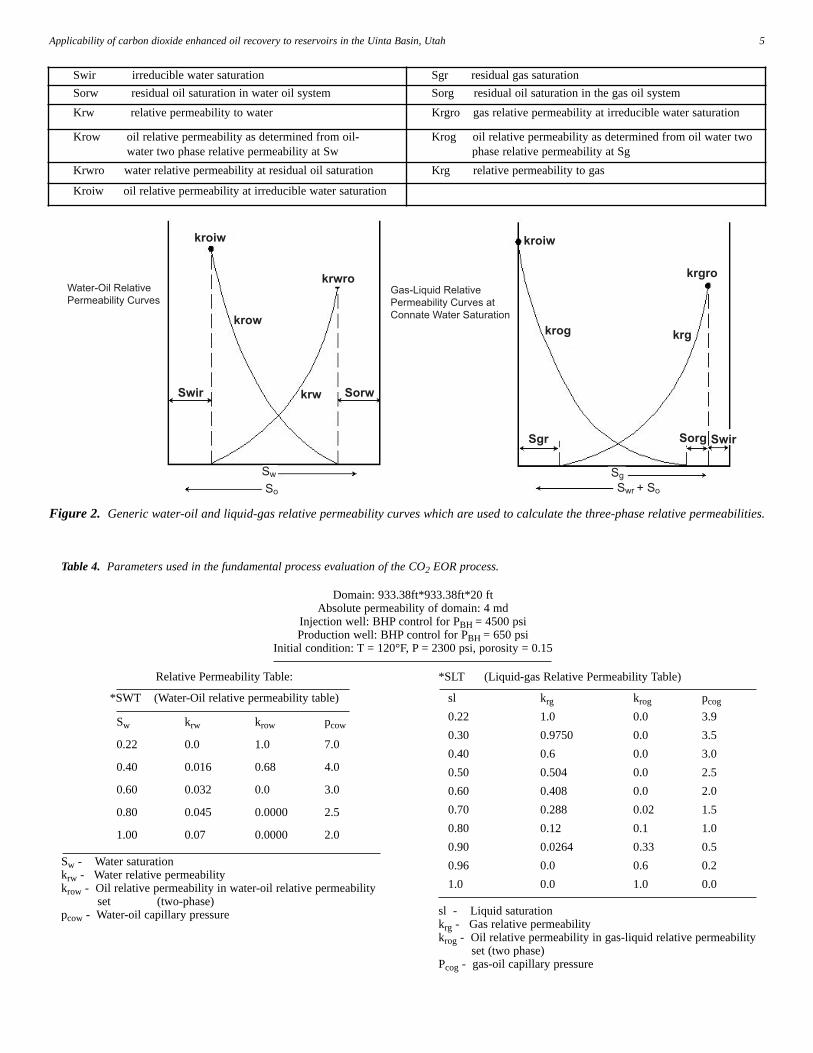
Three phase flow calculations in the reservoir requiretwo sets of relative permeabilities: the water relative perme-abilities and oil-water relative permeabilities (krw and krow),and the liquid-gas permeabilities and gas relative permeabil-ities (krog and krg). A generic set of water-oil and liquid-gasrelative permeabilities are shown in figure 2. The relativepermeability of each phase is calculated using the followingrelationships. The parameters employed in this fundamentalprocess evaluation are provided in table 4.
The fundamental study was conducted primarily toascertain the numerical parameters of the complex composi-tional simulations. Recoveries with CO2-only injection, andCO2-WAG (water alternating gas injection) are shown in fig-ure 3. In WAG, CO2 and water are injected alternatively attwo month intervals. In the Monument Butte Northeast 20-foot-thick reservoir, the recovery was determined more bythe total amount of CO2 injected (which was higher in theCO2-only injection) than by profile control aspects, whichare important in WAG applications. In both applications veryhigh recoveries are observed—well over 50% of original oilin place (OOIP). The CO2 utilization factors were alsoexceptional: about 4 mcf/stb for the CO2 flood and about 3mcf/stb for WAG. The fundamental study demonstrated thatmiscibility was obtained for the oil in question and that in anideal, homogeneous reservoir, very high recoveries are theor-etically possible.
THE GLEN BENCH STUDY
The geologic information for the Glen Bench study wasprovided by Craig Morgan of the Utah Geological Survey(UGS). Geologic properties used in constructing the GlenBench simulation input file are shown in figures 4 and 5. Oilfrom the field was analyzed using gas chromatography asexplained previously. There was no significant difference inlumped oil composition used in the compositional simulator.With the reservoir parameters employed, the OOIP calculat-ed for the Glen Bench field was about 3 million barrels.Recoveries from a CO2 flood and WAG for the field areshown in figure 6.
The study was conducted using existing wells and infra-structure. The oil recovery rate is low—in 15 years of theCO2 flood, about 9% of the oil recovered, while about 6.5%OOIP recovery is obtained after 25 years of WAG. Theshapes of the curves suggest, however, that a higher well fre-quency (more closely spaced wells) would increase the rateof recovery, and possibly the ultimate recovery in the field.
2 Utah Geological Survey

3Applicability of carbon dioxide enhanced oil recovery to reservoirs in the Uinta Basin, Utah
Figure 1. Location of major oil and gas fields in the Uinta Basin. Generalized field outlines based on Chidsey, et al. (2004).

4 Utah Geological Survey
Table 1. Standard carbon number (SCN) distribution of the oil sample from the 15-25 well (T. 8 S., R. 16 E., section 25) in Monument ButteNortheast unit.
SCN 6-9 10 11 12 13 14 15 16 17 18
Weight Percentage 4.69 2.36 2.15 1.90 2.59 2.57 2.43 1.99 2.29 2.54
SCN 19 20 21 22 23 24 25 26 27 28
Weight Percentage 2.93 2.30 2.31 2.34 2.35 2.29 2.28 2.39 2.43 2.42
SCN 29 30 31 32 33 34 35 36 37 38
Weight Percentage 2.45 2.01 2.02 1.76 1.54 1.39 1.32 1.25 1.19 1.31
SCN 39 40 41 42 43 44 44+
Weight Percentage 1.01 1.02 0.93 0.91 0.89 0.78 28.7
Table 2. Mole fractions of the various carbon number fractions in the recombined oil, Monument Butte Northeast unit.
SCN 1 2 3 4 5 6 7 8 9
Mole fraction 32.07 0.736 0.251 0.0476 0.0383 2.986 2.675 2.40 2.122
SCN 10 11 12 13 14 15 16 17 18
Mole fraction 3.854 3.213 2.590 3.246 2.963 2.589 1.962 2.118 2.217
SCN 19 20 21 22 23 24 25 26 27
Mole fraction 2.44 1.838 1.738 1.710 1.650 1.549 1.4808 1.501 1.4822
SCN 28 29 30 31 32 33 34 35 36
Mole fraction 1.427 1.4065 1.117 1.098 0.929 0.791 0.698 0.650 0.601
SCN 37 38 39 40 41 42 43 44 44+
Mole fraction 0.562 0.607 0.457 0.453 0.404 0.388 0.376 0.322 4.252
Table 3. Concentrations of the 12 components obtained by lumping the original oil components, Monument Butte Northeast unit.
Hypothetical Components C1 C2 C3 C4 C5 C6-9
0.3207 0.0074 0.0025 0.0005 0.0004 0.1018
Hypothetical Components C10-15 C16-20 C21-25 C26-32 C32-45 CO2
0.1845 0.1057 0.0813 0.0896 0.1056 0
5Applicability of carbon dioxide enhanced oil recovery to reservoirs in the Uinta Basin, Utah
Water-Oil RelativePermeability Curves
Gas-Liquid RelativePermeability Curves atConnate Water Saturation
kroiw
krgro
krog krg
Sgr Sorg Swir
kroiw
krwro
krow
Swir Sorwkrw
So
Sw SgSwr + So
Figure 2. Generic water-oil and liquid-gas relative permeability curves which are used to calculate the three-phase relative permeabilities.
Table 4. Parameters used in the fundamental process evaluation of the CO2 EOR process.
Domain: 933.38ft*933.38ft*20 ftAbsolute permeability of domain: 4 md
Injection well: BHP control for PBH = 4500 psiProduction well: BHP control for PBH = 650 psi
Initial condition: T = 120°F, P = 2300 psi, porosity = 0.15
*SLT (Liquid-gas Relative Permeability Table)
sl krg krog pcog
0.22 1.0 0.0 3.9
0.30 0.9750 0.0 3.5
0.40 0.6 0.0 3.0
0.50 0.504 0.0 2.5
0.60 0.408 0.0 2.0
0.70 0.288 0.02 1.5
0.80 0.12 0.1 1.0
0.90 0.0264 0.33 0.5
0.96 0.0 0.6 0.2
1.0 0.0 1.0 0.0
sl - Liquid saturationkrg - Gas relative permeability krog - Oil relative permeability in gas-liquid relative permeability
set (two phase)Pcog - gas-oil capillary pressure
Relative Permeability Table:
*SWT (Water-Oil relative permeability table)
Sw krw krow pcow
0.22 0.0 1.0 7.0
0.40 0.016 0.68 4.0
0.60 0.032 0.0 3.0
0.80 0.045 0.0000 2.5
1.00 0.07 0.0000 2.0
Sw - Water saturationkrw - Water relative permeabilitykrow - Oil relative permeability in water-oil relative permeability
set (two-phase)pcow - Water-oil capillary pressure
Swir irreducible water saturation Sgr residual gas saturation
Sorw residual oil saturation in water oil system Sorg residual oil saturation in the gas oil system
Krw relative permeability to water Krgro gas relative permeability at irreducible water saturation
Krow oil relative permeability as determined from oil-water two phase relative permeability at Sw
Krog oil relative permeability as determined from oil water two phase relative permeability at Sg
Krwro water relative permeability at residual oil saturation Krg relative permeability to gas
Kroiw oil relative permeability at irreducible water saturation

6 Utah Geological Survey
Injection of C02 (% PV)
0 20 40 60 80
OO
IPR
ecov
ery
(%)
70
60
50
40
30
20
10
0
Oil recovery for CO2 WAG
Oil recovery for CO2 flood
Figure 3. Comparison of oil recoveries in anideal 20-foot-thick reservoir with a secondaryCO2 flood and the water alternating gas process.%PV = percent pore volume.
Figure 4. Isopach map of the Glen Bench Sandstone.

7Applicability of carbon dioxide enhanced oil recovery to reservoirs in the Uinta Basin, Utah
Figure 5. Average porosity (in percent) distribution in the Glen Bench Sandstone.
Injection of C02 (% PV)
OO
IPR
ecov
ery
(%)
Oil recovery for CO2 flood
Oil recovery for CO2 WAG
0 2 4 6 8 11 12
10
9
8
7
6
54
3
2
1
0
Figure 6. OOIP recoveries in the Glen Bench field fora CO2 flood and for WAG.

8 Utah Geological Survey
The utilization factors of 6 mcf/stb for the CO2 flood andabout 3 mcf/stb for the WAG are still quite favorable. Thedistributions of CO2 in the reservoir for the CO2 flood, andfor WAG are shown in figures 7 and 8. The well spacingimpacts the spreading of CO2 in the reservoir. The perme-abilities employed in the field (5 md) do not allow for largeramounts of CO2 injection, and as a result, very low volume(in terms of pore volumes of CO2) is actually injected intothe reservoir.
MONUMENT BUTTE NORTHEAST (MB-NE)
We obtained cross sections and digitized log files for the16 MB-NE wells in section 25 T. 8 S., R. 16 E., Salt LakeBase Line and Meridian, from Newfield Exploration Compa-ny. The data, however, was incomplete and could not beprocessed in Petrel for direct input into the simulator. As aresult, we combined this information with some of our previ-ous results to create a reservoir simulation input file. By ourcalculations, section 25 had about 9 million barrels OOIP. Animportant aspect of the MB-NE field is the impact ofhydraulic fractures, and all of the 16 wells in section 25 arehydraulically fractured. Hence, simulations were performedwith and without hydraulic fractures to evaluate their impacton oil recovery. Primary production performance in section25 is shown for the two cases in figure 9.
The recoveries without and with hydraulic fractures areabout 7 and 8.5%, respectively, and are similar to theobserved field performance. Oil saturations after primaryrecovery are shown in figure 10. There is significant oil sat-uration in section 25 of the MB-NE unit at all locations. Oncethe primary recovery was concluded, waterflood was under-taken. Waterflood recovery with and without the presence ofhydraulic fractures is shown in figure 11. The incrementalwaterflood recovery with hydraulic fractures is less thanwithout hydraulic fractures. This is due to some channelingof fluids through the hydraulic fractures, making the floodslightly less effective. The incremental recoveries of about10% are also close to what are observed in the field. A three-dimensional depiction of oil saturation after the waterflood isshown in figure 12. Except for the areas around the injectors,the oil saturation target for CO2 flooding is high (0.5 on theaverage).
After the waterflood, CO2 flood or CO2 WAG was mod-eled in MB-NE (section 25). CO2 flood recoveries with andwithout hydraulic fractures are plotted in figure 13. Lowwaterflood recoveries provide a large target for oil recovery.As a result, recoveries as high as 50% OOIP are seen withCO2 floods. Higher initial recoveries are observed withhydraulic fractures. However, CO2 breaks through earlier
leading to lower total recoveries. It should be noted that sec-tion 25 is modeled as a no-flow segment leading to completedisplacement of the moveable oil in the model. The CO2 uti-lization numbers are similar in the cases with and withouthydraulic fractures—about 6 mcf/stb for both the cases.
The WAG recoveries for MB-NE (section 25) are shownin figure 14. Modeled recoveries of about 40% are attained.The case with hydraulic fractures yields slightly higher OOIPrecoveries than without hydraulic fractures. The CO2 utiliza-tion factors for CO2 WAG would be about 4 mcf/stb.
CONCLUSIONS
This study demonstrates the significant potential ofCO2-EOR in the Uinta Basin, Utah. The final recoveries aredependent strongly on the oil viscosity as CO2 dissolves inthe oil and on relative permeability functions employed.Sensitivity studies conducted using generic simulations showthat cutting the viscosity in half increases recovery by about10% for equivalent pore volume CO2 injected. Relative per-meability end-points determine the ultimate recoveries, andhence have significant process impact. Post waterflood in-cremental recoveries from 10–30% can be expected in bothmodeled reservoirs. The most favorable cases have been dis-cussed in this report. Since closed boundary simulationswere performed, all injected CO2 stayed within the bound-aries and contacted oil was produced. In practice, all inject-ed CO2 may not stay within the target horizons. Presence ofhydraulic fractures does not decrease the potential recoveryfrom the use of CO2-EOR. WAG recoveries were generallyless than CO2 flood recoveries, primarily because the reser-voirs are thin and recoveries are limited by the ability toinject CO2 and not by profile control. The CO2 utlizationfactors are also extremely favorable, ranging from about 3mcf/stb for WAG applications to 6 mcf/stb for straight CO2floods.
ACKNOWLEDGMENTS
This work was funded in part by the Utah GeologicalSurvey under the “Characterization of Utah’s HydrocarbonReservoirs and Potential New Reserves” program (FY 2007).The geologic interpretation and other help provided by CraigMorgan at UGS are greatly appreciated. The authors alsoappreciate the cooperation of Newfield Production Companyand Questar Exploration and Production Com-pany. Thisstudy was conducted independently and does not reflect theviews or interpretation of either Newfield Production Com-pany or Questar Exploration and Production Company.

9Applicability of carbon dioxide enhanced oil recovery to reservoirs in the Uinta Basin, Utah
1.00
0.90
0.80
0.70
0.60
0.50
0.40
0.30
0.20
0.10
0.00
Figure 7. CO2 distribution in the Glen Bench field under a CO2 flood. Arrow points eastward; The scale bar is for CO2 mole fractionin the gas phase. The grid size is 264 ft by 264 ft.
Figure 8. CO2 distribution in the Glen Bench field undergoing Water Alternating Gas(WAG) displacement. Sharp CO2 fronts areformed in WAG. Arrow points eastward; The scale bar is for CO2 mole fraction in the gas phase. The grid size is 264 ft by 264 ft.
1.00
0.90
0.80
0.70
0.60
0.50
0.40
0.30
0.20
0.10
0.00

10 Utah Geological Survey
OO
IPR
ecov
ery
(%)
Oil recovery withhydraulic fractures
Oil recovery withouthydraulic fractures
Time (years)0 1 2 3 4 5
9
8
7
6
5
4
3
2
1
0
Figure 9. Primary recovery from section 25, T. 8S., R. 16E., MB-NE, with and without hydraulic fractures (HF).
Figure 10. Oil saturation in MB-NE (section 25) after the primary production. The scale bar shows oil saturation fraction; arrowshows which way is east, while north is upward; the plot is showing D-sands; lines are wells. The grid size is 264 ft by 264 ft.
1.00
0.90
0.80
0.70
0.60
0.50
0.40
0.30
0.20
0.10
0.00

11Applicability of carbon dioxide enhanced oil recovery to reservoirs in the Uinta Basin, Utah
OO
IPR
ecov
ery
(%) Oil recovery without
hydraulic fractures
Oil recovery withhydraulic fractures
Time (years)
20
18
16
14
12
10
8
6
4
2
00 5 10 15 20
Figure 11. Waterflood recovery in MB-NE (section 25), with and without hydraulic fractures. The incremental waterflood recoverywith hydraulic fractures is less than without hydraulic fractures.
Figure 12. Post waterflood oil saturation in MB-NE (section 25). The scale bar shows oil saturation fraction; arrow shows whichway is east, while north is upward; the plot is showing D-sands; lines are wells. The grid size is 264 ft by 264 ft. Oil saturation targetsof 0.5 on the average are observed except near injectors.
1.00
0.90
0.80
0.70
0.60
0.50
0.40
0.30
0.20
0.10
0.00

12 Utah Geological Survey
Injection of C02 (% PV)
OO
IPR
ecov
ery
(%)
Oil recovery withhydraulic fractures Oil recovery without
hydraulic fractures
CO2 Flood
0 10 20 30 40 50 60 700
10
20
30
40
50
60
Figure 13. CO2 flood recoveries in MB-NE (section 25) with and without hydraulic fractures. Higher initial recoveries are observedwith hydraulic fractures, however, CO2 breaks through earlier leading to lower total recoveries.
Figure 14. CO2 WAG recoveries in MB-NE (section 25) with and without hydraulic fractures.
Oil recovery withouthydraulic fractures
Oil recovery withhydraulic fractures
CO2 WAG
Injection of C02 (% PV)
OO
IPR
ecov
ery
(%)
45
40
35
30
25
20
15
10
5
00 5 10 15 20 25

Advanced Resources International, 2006, Basin oriented strate-gies for CO2 enhanced oil recovery: Rocky MountainRegion of Colorado, Utah, and Wyoming: Prepared for theU.S. Department of Energy, 98 p.
Christensen, J.R., Stenby, E.H., and Skauge, A., 2001, Reviewof WAG field experience, SPE 71203, Society of PetroleumEngineers, Dallas, Texas.
Graue, D.J., and Zana, E.T., 1981, Study of a possible CO2 floodin the Rangely Field, Journal of Petroleum Technology,p.1312–1318.
Chidsey, T.C., Jr., Wakefield, S., Hill, B.G., and Hebertson, M.,2004, Oil and gas fields map of Utah: Utah Geological Sur-vey Map 203DM, scale 1:700,000.
Pennington, B.I., Dyer, J., Lomax, J., and Deo, M.D., 1996,Green River Formation water flood demonstration projectfinal report: U.S. Department of Energy DocumentDOE/BC14958-15 (DE96001264), 150 p.
Yeling, W.F., and Metcalf, R.S., 1980, Determination and pre-diction of CO2 minimum miscibiliy pressures, Journal ofPetroleum Technology, p.160–168.
13Applicability of carbon dioxide enhanced oil recovery to reservoirs in the Uinta Basin, Utah
REFERENCES


