132 Transportation Research Record: Journal of the Transportation Research Board, No. 2270, Transportation Research Board of the National Academies, Washington, D.C., 2012, pp. 132–141. DOI: 10.3141/2270-16 Efforts in estimating emissions by an integration of traffic simulation models and emissions models have become a fast-evolving research area. However, because of the lack of effective methods and indicators to characterize traffic behaviors, the accuracy of emissions by such an approach has not been effectively verified or evaluated. The current study is intended to examine the applicability of traffic microsimulation models in vehicle emissions estimates on the basis of the explanatory parameter of vehicle emissions—the vehicle-specific power (VSP) distribution. Ana- lyzing massive real-world and simulated vehicle activity data showed that the results from traffic simulation could not represent real-world driving behaviors for emissions estimates. The simulated vehicle-specific power distribution led to errors that were as high as 82.8%, 53.6%, and 29.6% for nitrogen oxides, hydrocarbons, and carbon monoxide emissions, respectively. Then a sensitivity analysis of 16 adjustments on eight parameters of simulation models was conducted to determine their effects on simulated VSP distributions: systematic errors existed in the use of traffic simulation models to represent second-by-second driving behaviors. The errors could not be reduced by parameter calibra- tion on the simulation model. This study concluded that the traditional approach of integrating traffic simulation models with emissions models was not applicable for vehicle emissions estimates. The primary reasons for the errors need to be investigated further from the internal mecha- nism of submodels of microsimulation. On the basis of these findings, several recommendations are proposed for future studies. Traffic microsimulation models have been widely accepted as a means of estimating changes in fuel consumption and emissions resulting from strategies that affect traffic flow. With the recent development of micro- or project-level vehicle emissions models, the integra- tion between traffic simulation models and emissions models has become a fast-evolving research area. In traditional studies linking traffic microsimulation with emissions models, second-by-second data of speed and acceleration were used for calculating vehicle emis- sions. However, traffic simulation models were generally developed to represent traffic flows and validated and calibrated by traffic flow parameters like average headway, speed, flow, queue length, and so on, rather than instantaneous speed and acceleration. Accelera- tion has been proved to be the most sensitive parameter to vehicle power demand and fuel consumption as well as emissions. Because of the lack of applicable measurement approaches, second-by- second outputs of speed and acceleration from microsimulation tools have not been validated properly, and the validity of using current microsimulation tools to estimate fuel consumption and emissions has been neglected in many applications. In recent modeling efforts for vehicle emissions, the explanatory variable of fuel consumption and emissions evolved from the aver- age speed-to-road load, known as vehicle-specific power (VSP) (1). Because of its direct physical interpretation of and strong statisti- cal relationships with vehicle emissions, VSP has become a widely accepted variable for emissions modeling (1, 2). This evolution created the new research need for characterizing traffic conditions by using VSP-based parameters so that the VSP-based emissions model can be better integrated with traffic models. As a result, the VSP distribution has been used in several studies to characterize traffic conditions. Some research has indicated that the real-world VSP distribution follows regularities that can be physically explained and mathemati- cally modeled (3, 4). In this context, the primary motivation of this study was to compare VSP distributions generated from a traffic microsimulation model with the real-world VSP distributions in order to investigate whether the microsimulation model can capture the real-world vehicle power distributions and to further investigate the validity of using the microsimulation model to evaluate vehicle fuel consumption and emissions. OVERVIEW OF EXISTING STUDIES In order to overcome the limitations of macroscopic emissions mod- els in representing the dynamic nature of traffic flows, significant efforts have been devoted since the 1990s to develop a microscopic emissions model (5) and to combine emissions models with traffic simulation models to evaluate alternative traffic strategies. Park et al. estimated roadside pollutant concentrations by link- ing a microscopic traffic simulation model (VISSIM) with the MODEM emissions model and a Gaussian dispersion model (6). In a study conducted by Stathopoulos and Noland, fuel consumption and emissions were analyzed for two scenarios for improved traffic flows by using VISSIM and the comprehensive modal emissions model (CMEM) (7). Nam et al. integrated VISSIM with CMEM and compared real-world and modeled emissions under conditions of variable driver aggressiveness, which indicated that integration of traffic simulation and the emissions model was practical for conduct- Applicability of Traffic Microsimulation Models in Vehicle Emissions Estimates Case Study of VISSIM Guohua Song, Lei Yu, and Yanhong Zhang G. Song, Ministry of Education Key Laboratory for Urban Transportation Complex Systems Theory and Technology, Beijing Jiaotong University, Haidian District, Beijing 100044, China. L. Yu, College of Science and Technology, Texas Southern Univer- sity, 3100 Cleburne Avenue, Houston, TX 77004. Y. Zhang, Hebei Provincial Trans- portation Planning and Design Institute, 70 South Jianshe Street, Shijiazhuang, Hebei 050011, China. Corresponding author: G. Song, [email protected].
Transcript
132
Transportation Research Record: Journal of the Transportation Research Board, No. 2270, Transportation Research Board of the National Academies, Washington, D.C., 2012, pp. 132–141.DOI: 10.3141/2270-16
Efforts in estimating emissions by an integration of traffic simulation models and emissions models have become a fast-evolving research area. However, because of the lack of effective methods and indicators to characterize traffic behaviors, the accuracy of emissions by such an approach has not been effectively verified or evaluated. The current study is intended to examine the applicability of traffic microsimulation models in vehicle emissions estimates on the basis of the explanatory parameter of vehicle emissions—the vehicle-specific power (VSP) distribution. Ana-lyzing massive real-world and simulated vehicle activity data showed that the results from traffic simulation could not represent real-world driving behaviors for emissions estimates. The simulated vehicle- specific power distribution led to errors that were as high as 82.8%, 53.6%, and 29.6% for nitrogen oxides, hydrocarbons, and carbon monoxide emissions, respectively. Then a sensitivity analysis of 16 adjustments on eight parameters of simulation models was conducted to determine their effects on simulated VSP distributions: systematic errors existed in the use of traffic simulation models to represent second-by-second driving behaviors. The errors could not be reduced by parameter calibra-tion on the simulation model. This study concluded that the traditional approach of integrating traffic simulation models with emissions models was not applicable for vehicle emissions estimates. The primary reasons for the errors need to be investigated further from the internal mecha-nism of submodels of microsimulation. On the basis of these findings, several recommendations are proposed for future studies.
Traffic microsimulation models have been widely accepted as a means of estimating changes in fuel consumption and emissions resulting from strategies that affect traffic flow. With the recent development of micro- or project-level vehicle emissions models, the integra-tion between traffic simulation models and emissions models has become a fast-evolving research area. In traditional studies linking traffic microsimulation with emissions models, second-by-second data of speed and acceleration were used for calculating vehicle emis-sions. However, traffic simulation models were generally developed to represent traffic flows and validated and calibrated by traffic flow
parameters like average headway, speed, flow, queue length, and so on, rather than instantaneous speed and acceleration. Accelera-tion has been proved to be the most sensitive parameter to vehicle power demand and fuel consumption as well as emissions. Because of the lack of applicable measurement approaches, second-by-second outputs of speed and acceleration from microsimulation tools have not been validated properly, and the validity of using current microsimulation tools to estimate fuel consumption and emissions has been neglected in many applications.
In recent modeling efforts for vehicle emissions, the explanatory variable of fuel consumption and emissions evolved from the aver-age speed-to-road load, known as vehicle-specific power (VSP) (1). Because of its direct physical interpretation of and strong statisti-cal relationships with vehicle emissions, VSP has become a widely accepted variable for emissions modeling (1, 2). This evolution created the new research need for characterizing traffic conditions by using VSP-based parameters so that the VSP-based emissions model can be better integrated with traffic models. As a result, the VSP distribution has been used in several studies to characterize traffic conditions.
Some research has indicated that the real-world VSP distribution follows regularities that can be physically explained and mathemati-cally modeled (3, 4). In this context, the primary motivation of this study was to compare VSP distributions generated from a traffic microsimulation model with the real-world VSP distributions in order to investigate whether the microsimulation model can capture the real-world vehicle power distributions and to further investigate the validity of using the microsimulation model to evaluate vehicle fuel consumption and emissions.
Overview Of existing studies
In order to overcome the limitations of macroscopic emissions mod-els in representing the dynamic nature of traffic flows, significant efforts have been devoted since the 1990s to develop a microscopic emissions model (5) and to combine emissions models with traffic simulation models to evaluate alternative traffic strategies.
Park et al. estimated roadside pollutant concentrations by link-ing a microscopic traffic simulation model (VISSIM) with the MODEM emissions model and a Gaussian dispersion model (6). In a study conducted by Stathopoulos and Noland, fuel consumption and emissions were analyzed for two scenarios for improved traffic flows by using VISSIM and the comprehensive modal emissions model (CMEM) (7). Nam et al. integrated VISSIM with CMEM and compared real-world and modeled emissions under conditions of variable driver aggressiveness, which indicated that integration of traffic simulation and the emissions model was practical for conduct-
Applicability of Traffic Microsimulation Models in Vehicle Emissions EstimatesCase study of vissiM
Guohua Song, Lei Yu, and Yanhong Zhang
G. Song, Ministry of Education Key Laboratory for Urban Transportation Complex Systems Theory and Technology, Beijing Jiaotong University, Haidian District, Beijing 100044, China. L. Yu, College of Science and Technology, Texas Southern Univer-sity, 3100 Cleburne Avenue, Houston, TX 77004. Y. Zhang, Hebei Provincial Trans-portation Planning and Design Institute, 70 South Jianshe Street, Shijiazhuang, Hebei 050011, China. Corresponding author: G. Song, [email protected].
Song, Yu, and Zhang 133
ing hot-spot analyses (8). Ahn et al. developed and implemented the emissions model of VT-micro in the traffic simulation model INTEGRATION (9).
A combination of PARAMICS and CMEM was applied by Servin et al.; intelligent speed adaptation strategies under varying freeway congestion conditions were examined and the corresponding fuel consumption and emissions were evaluated (10). The international vehicle emissions model was coupled with an urban microscopic traffic simulation model in Wuhan City, China, and the emissions around an intersection under different traffic control scenarios were analyzed (11). MOVES and PARAMICS were also integrated in the evaluation of the emissions impact of an intersection control change (12). In another study involving intersections, Liu et al. applied VISSIM and PERE to assess the impacts of transit priority alterna-tives (13). Other studies integrated traffic simulation and emissions models in evaluating emissions impacts by highway capacity varia-tions (14), traffic signal synchronization (15–17), electronic toll collection (18), and high-occupancy-vehicle lanes (19).
Traffic simulation models must be carefully calibrated before a real simulation is conducted to provide accurate and meaningful results. In 1991, Benekohal proposed a procedure for verification and validation of microscopic traffic simulation models (20). By using a genetic algorithm, Lee et al. developed an approach to parameter cal-ibration for PARAMICS in which target headway and mean reaction time were employed as key parameters (21). Gardes et al. performed a calibration study for PARAMICS, and the parameters were classi-fied in four major categories: network, demand, overall simulation configuration, and driver behavior factors (22). Speed and volume were selected in the objective function. A nine-step procedure was proposed by Park and Schneeberger for VISSIM in which travel time distribution was employed as the performance measure and maxi-mum queue length was used as the validation parameter (23). On the basis of the study by Lee et al. (21), Chu et al. developed a general scheme of model calibration and validation for network-level simu-lation in which traffic volume and point-to-point travel time were adopted as the validation parameters (24).
Yu et al. proposed a genetic algorithm–based approach for cali-brating driving behavior parameters in VISSIM (25). The approach defined the index of simulation accuracy as the sum of squares due to error of speeds collected by the Global Positioning System (GPS) versus the simulated speeds at the cross sections. Brockfeld et al. collected the headway time series in the real world and used them to calibrate a simulation model in which the leading car’s activities were set according to the field data (26, 27). Shaaban and Radwan calibrated the parameters of travel speed, turning speed, headway fac-tor, and lane change distance in SimTraffic (28). Park and Qi (29), Ciuffo et al. (30), and Chitturi and Benekohal (31) also developed or improved their calibration procedures and approaches.
Despite the foregoing studies, however, all of the calibrations were based on parameters of traffic volume, travel time or aver-age headway, speed, queue length, and so on, although none of these parameters can truly represent vehicle dynamics. Rakha and Crowther (32) and Rakha et al. (33) indicated that the assumptions regarding vehicle dynamics like car-following rules make a differ-ence to emissions estimates by microsimulation models, but none of the current calibration approaches can guarantee the conformity of simulated results with real-world driving behaviors in estimat-ing vehicle emissions (34). On the basis of speed and acceleration–deceleration distributions derived from field trajectories, Jie et al. identified and calibrated the important parameters in VISSIM for estimating the emission parameter of the total absolute difference in
speed per kilometer, ln(TAD) (35). The research was more appro-priate than the other previous studies in traffic-simulation-based emissions estimation; however, the relationship between ln(TAD) and emissions needed to be further examined (35).
In the recent development of vehicle emissions models, power-based approaches have been widely accepted; they are incorporated into representative models including MOVES, CMEM, and the inter-national vehicle emissions model. VSP is the most popular param-eter in power-based approaches; it can be estimated by a vehicle’s instantaneous speed and acceleration (1). In such models, both emis-sion rates and vehicle activities were derived by using a VSP bin-ning method (2), and the running emissions in a traffic network were estimated basically by multiplying the emission rates by time spent in each VSP bin (VSP distribution or operating mode distribution).
The new evolution of emissions modeling created new research needs to characterize traffic flows by using VSP-based parameters so that traffic models could be better integrated with emissions mod-els. Some productive studies have been carried out in this area. By examining 13 speed profiles on different links for the speed bin of 30 to 40 km/h, Frey et al. found a surprising consistency in the VSP distributions of different runs (36). After comparing the VSP distributions on expressways and other highways during peak and nonpeak hours in Beijing, Song et al. reported characteristics of VSP distributions for different traffic and road types (3). On the basis of massive second-by-second real-world vehicle activity data, Song and Yu investigated the quantitative relationship and found stable regularities between the VSP distribution and travel speed (4):
1. The VSP distribution approaches the normal distribution when the average travel speed is higher than 20 km/h,
2. The mean of the VSP distribution increases monotonically with travel speed, and
3. The mean of the VSP distribution equals the VSP value of a vehicle cruising at the corresponding travel speed.
These findings are meaningful because they provide a mathemat-ical way to model the VSP distribution according to a traditional traffic parameter. These findings were also physically explainable (37). For a speed trajectory with an average speed of v, the speed tra-jectory commonly consists of several speed subcurves with speeds higher and lower than v. If one assumes that w is the vehicle power per ton (i.e., VSP) to keep the vehicle cruising at speed v, the instan-taneous VSP during this speed trajectory varies around the value of w. That is why the mean of the VSP distribution equals the VSP value (w) of a vehicle cruising at speed v.
For validation or calibration of traffic simulation models used to estimate fuel consumption and emissions, the findings of the regularities of the real-world VSP distribution (4) might provide an effective approach to evaluating the accuracy of characterizing traffic dynamics in a traffic simulation model.
MethOdOlOgy
From the existing findings on real-world VSP distributions, this study attempts to answer the following questions:
1. Is the VSP distribution from a traffic simulation model consis-tent with that of real-world traffic? If yes, this finding indicates that the simulation model can be used directly for emissions estimates. If no, then Question 2 applies.
134 Transportation Research Record 2270
2. Is the error significant or how much error does the simulation introduce to the emissions estimate by producing the wrong simulated VSP distribution?
3. Is it possible to improve the accuracy of simulated VSP distri-butions by the calibration of a traffic simulation model? If yes, how could this be achieved?
data Preparation from real-world and simulation Models
Data were collected from two sources in this study: real-world traf-fic conditions and a traffic simulation model. As a representative and widely used microsimulation model, VISSIM 5.20 was selected in this study. To calculate and compare VSP distributions, a large amount of second-by-second speed and acceleration data was pre-pared. The VSP value was calculated with the typical equation for a light-duty vehicle (3):
VSP grade= + ( ) +[ ] +v a vi i i1 1 9 81 0 132 0 000302. . % . . 33 1( )
where
v = vehicle speed (m/s), a = vehicle acceleration (m/s2), and grade (%) = vehicle vertical rise divided by slope length, which
can be assumed to be zero where terrain is flat.
The data collected on the gradient ramps or bridges were eliminated manually by using a geographic information system tool in the data processing.
To use the same road and vehicle types as the ones of existing findings on VSP distributions, the road type for both data sources was set to freeways or expressways in Beijing, which corresponds to the road type of urban restricted access used in MOVES2010. The vehicle type was set to light-duty vehicle. As stated earlier, for a specific road type and vehicle type, only the average speed affects the VSP distributions. Therefore, once the road and vehicle types (in real-world conditions and the simulation model) are identical, regard-less of the data collection locations and time, VSP distributions are theoretically comparable at the same speed level.
Real-World Vehicle Activities
A total of 610,847 records of second-by-second vehicle activity data on expressways were selected from the portable emissions measurement system database (3) established in Beijing Jiaotong University. These data were collected from 2004 to 2010 by using the GPS devices Garmin GPS18 and GeoLogger V4.8. The method of calculating the VSP distribution was similar to the one used by Song and Yu in a previous study (4, 37).
First, the original GPS data were divided into thousands of pieces of 60-s speed segments. Then the speed segments were further binned by their average travel speed at an interval of 2 km/h. After the VSP for each instantaneous GPS record was calculated with Equation 1, the VSP distribution (time fraction in each VSP bin) was then calculated for each speed bin:
∀ ∈ − +[ ] =: . , . ( )VSP VSP binn n n0 5 0 5 2
where n is an integer from −30 to 30 and in which an equal VSP interval of 1 kW/metric ton was used in order to illustrate better the mathematical relationship between VSP distribution and aver-age speed. After all the VSP values were examined, it was found that more than 99% (605,973 records) of the records fell into the VSP interval between −30 kW/ton and 30 kW/ton. Therefore, the VSP bin number n was set to one from −30 to 30. As shown in Table 1, a total of 8,826 speed segments (529,560 s of con-tinuous speed data) were used for the analysis of real-world VSP distributions.
TABLE 1 Sample Sizes of Real-World and Simulated Data
Real-World Data Simulated Data
Speed Bin ID
Speed Bin (km/h)
Sample Size (s)
Sample Size (min)
Sample Size (s)
Sample Size (min)
0 [0, 2] 45,720 762 25,020 417
1 [2, 4] 16,620 277 23,400 390
2 [4, 6] 19,980 333 14,820 247
3 [6, 8] 21,180 353 15,480 258
4 [8, 10] 21,300 355 20,040 334
5 [10, 12] 20,100 335 20,820 347
6 [12, 14] 20,520 342 20,460 341
7 [14, 16] 17,460 291 22,320 372
8 [16, 18] 16,380 273 23,640 394
9 [18, 20] 17,280 288 26,700 445
10 [20, 22] 16,260 271 21,540 359
11 [22, 24] 15,420 257 16,380 273
12 [24, 26] 16,320 272 40,260 671
13 [26, 28] 14,220 237 25,440 424
14 [28, 30] 13,680 228 13,200 220
15 [30, 32] 12,180 203 13,020 217
16 [32, 34] 12,960 216 12,120 202
17 [34, 36] 11,940 199 12,480 208
18 [36, 38] 12,060 201 11,580 193
19 [38, 40] 14,460 241 11,340 189
20 [40, 42] 13,980 233 12,720 212
21 [42, 44] 14,040 234 12,060 201
22 [44, 46] 14,040 234 11,220 187
23 [46, 48] 15,360 256 16,920 282
24 [48, 50] 17,040 284 36,840 614
25 [50, 52] 16,740 279 23,280 388
26 [52, 54] 15,600 260 22,620 377
27 [54, 56] 13,560 226 24,780 413
28 [56, 58] 12,000 200 24,840 414
29 [58, 60] 7,980 133 17,940 299
30 [60, 62] 8,160 136 17,340 289
31 [62, 64] 7,320 122 8,880 148
32 [64, 66] 5,280 88 5,460 91
33 [66, 68] 3,780 63 3,060 51
34 [68, 70] 2,940 49 1,200 20
35 [70, 72] 2,400 40 1,320 22
36 [72, 74] 1,980 33 360 6
37 [74, 76] 1,320 22 120 2
Sum [0, 76] 529,560 8,826 631,020 10,517
Song, Yu, and Zhang 135
Simulated Vehicle Activities
The traffic simulation model was set up to produce the correspond-ing second-by-second samples of vehicle activities for each speed bin. The expressway of West Third Ring-Road in Beijing was used for developing the simulation scenarios. First, a microsimulation test bed was established with VISSIM based on a comprehensive field survey and data collection. Then the network configurations, fleet composition, desired speed distribution, and driving behavior parameters were carefully calibrated by using the field-collected GPS data and remote traffic microwave sensor data (25, 38), result-ing in all relative errors between the simulated time-varying speeds and the field speeds collected from the remote traffic microwave sensors less than 15% and all relative errors of traffic flow less than 10%. The validating process is based on the parameters of link average speed and flow rather than instantaneous speed and accel-eration. After calibration, the VISSIM parameters for the desired speed distribution were from 60 to 80 km/h with one intermedi-ate point of 0.72 at 70 km/h. The desired acceleration distribution applied a curve with a maximum of 3.5 m/s2 decreasing to zero at a speed of 250 km/h. The value of the desired deceleration distribu-tion was −2.8 m/s2 with upper and lower boundaries at −2.5 m/s2 and −3.0 m/s2. The maximum acceleration and deceleration were 3.5 m/s2 and −4.0 m/s2. The maximum deceleration for cooperative braking was set to −3.0 m/s2, the safety distance reduction factor was 0.6, and the maximum look-ahead distance was 220 m.
In order to obtain the vehicle activities, a total of 1,440 light-duty vehicles as floating cars were set in the VISSIM test bed, and the second-by-second speed and acceleration were selected in the vehicle record command of the database output options. Both peak-hour and non-peak-hour scenarios were simulated to generate sufficient samples for each speed bin (see Table 1). The floating cars were introduced into the test bed one by one at 60-s intervals. The test bed was run six times, and for each run, the first floating car was introduced at 1 s, 11 s, 21 s, 31 s, 41 s, and 51 s after the start of simulation. Each run lasted 2 h. After the simulation, 10,517 speed segments (631,020 s of continuous speed data) were produced for the analysis of simulated VSP distributions, as shown in Table 1. Because the speed limit on the expressway in Beijing is 80 km/h, there were few samples for speeds higher than 80 km/h.
Comparative Analysis of vsP distributions
After VSP distributions were calculated with Equations 1 and 2, histo-grams of VSP distributions were plotted as shown in Figure 1 for the real-world (left column) and simulated (right column) vehicle activi-ties; six selected speed bins (10 to 12, 20 to 22, 30 to 32, 40 to 42, 50 to 52, and 60 to 62 km/h) are shown for illustration and comparison.
Characteristics of the real-world VSP distributions were observed to be similar to those found in the previous study (4). The distri-bution approached a normal distribution in speed bins higher than 20 km/h. The height at the peak decreased monotonically with an increase in the speed bin. The position of the peak moved to the right monotonically with an increase in the speed bin. The source data in this study were totally different from those used in the previ-ous study (4). Again, the relationship between the VSP distribution and speed was shown to be stable and reliable.
In contrast to real-world VSP distributions, the simulated distri-butions showed apparently different characteristics. They appeared to be nonsymmetric and did not show a regular variation pattern
like that in the real-world VSP distributions. The height at the peak did not decrease monotonically and the position of the peak moved forward and backward between the VSP bins of 0 to 2 kW/ton. The simulated distributions always showed some small fractions in higher-power areas, for example, 10 to 15 kW/ton for the speed bin of 10 to 12 km/h and 10 to 30 kW/ton for the speed bin of 20 to 22 km/h. When the speed was higher than 40 km/h, the simulated VSP distribution showed characteristics of a bimodal distribution, and the VSP fraction always dropped in the VSP bin of 5 kW/ton. From the foregoing analysis, the simulated VSP distribution was not consistent with that of the real world, which answered the first question in this study.
emissions estimation error of simulated vsP distributions
Because the VSP distribution is a parameter representing the distri-bution of vehicle power, it directly affects the estimate of vehicle emissions (3). Therefore, how much error the simulated VSP dis-tribution would introduce to the emissions estimate was the second question to be investigated. Vehicle emissions in a traffic network equal the product of emission rates and the time spent in each VSP bin (VSP distribution or operating mode distribution). A set of emis-sion rates in MOVES was applied in the emissions estimate for both real-world and simulated vehicle activities. Emission rates were selected for a typical light-duty gasoline car in MOVES, with the model year of 2004, conventional internal combustion engine tech-nology, and vehicle age group of within 3 years. The SourceBinID in MOVES is 1010120240000000000.
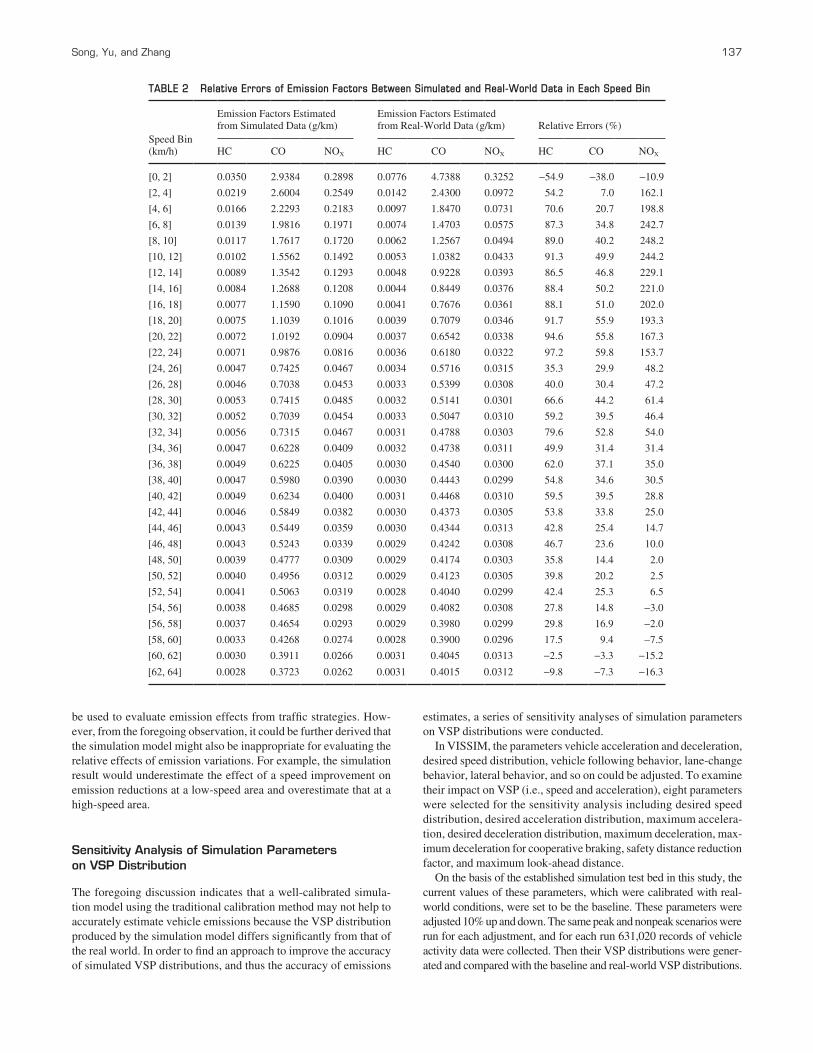
With the selected emission rates and the second-by-second vehicle activity data, emission factors of hydrocarbons (HC), carbon monox-ide (CO), and nitrogen oxides (NOx) in units of grams per kilometer were calculated for each speed bin. For a better understanding of the nature of the VSP distribution, the VSP binning method in this study was different from that of the operating mode in MOVES, which is a combination of bins of VSP and instantaneous speed (1). However, for the purpose of emissions estimation, the binning method used in MOVES (1) was applied in order to use the emission rates in MOVES. The calculated results are presented in Table 2.
Significant errors were observed in the estimated emissions based on simulated second-by-second vehicle activities. Overall, the sim-ulation model tended to overestimate emissions in low-speed condi-tions (except for the bin of 0 to 2 km/h) and underestimate emissions for high-speed conditions (Figure 2). For different pollutants, the error on the NOx estimation was the highest, with an average rela-tive error of 82.8%. The average relative errors for CO and HC were 29.6% and 53.6%, respectively.
The low errors at speeds around 60 km/h (Table 2) did not indi-cate that the simulated vehicle activities were accurate. From the histogram for 60 to 62 km/h in Figure 1, it could be observed that the simulation model overestimated the time fraction in the lower-power area (0 to 2 kW/ton), underestimated the fraction for 4 to 6 kW/ton, and also overestimated the fraction in the higher-power area (7 to 8 kW/ton). Therefore, the appearance of low error was an offset of overestimation and underestimation in different power areas.
It was also found that the relative error did not remain consistent along with the speed, which meant that the variation in simulated emissions did not follow the trend of real-world emissions. The abso-lute emissions estimated by the simulation model may not be precise, but if the relative variations are accurate, the simulation model can
136 Transportation Research Record 2270
0%
15%
30%
45%
60%
-30 -24 -18 -12 -6 0 6 12 18 32 30
VSP Bin (kW/t) -30 -24 -18 -12 -6 0 6 12 18 32 30
VSP Bin (kW/t)
-30 -24 -18 -12 -6 0 6 12 18 32 30
VSP Bin (kW/t)
-30 -24 -18 -12 -6 0 6 12 18 32 30
VSP Bin (kW/t)
-30 -24 -18 -12 -6 0 6 12 18 32 30
VSP Bin (kW/t)
-30 -24 -18 -12 -6 0 6 12 18 32 30
VSP Bin (kW/t)
-30 -24 -18 -12 -6 0 6 12 18 32 30
VSP Bin (kW/t) -30 -24 -18 -12 -6 0 6 12 18 32 30
VSP Bin (kW/t)
-30 -24 -18 -12 -6 0 6 12 18 32 30
VSP Bin (kW/t) -30 -24 -18 -12 -6 0 6 12 18 32 30
VSP Bin (kW/t)
-30 -24 -18 -12 -6 0 6 12 18 32 30
VSP Bin (kW/t)
-30 -24 -18 -12 -6 0 6 12 18 32 30
VSP Bin (kW/t)
0% 6%
12% 18% 24% 30%
0%
5%
10%
15%
20%
0%
4%
8%
12%
16%
0%
4%
8%
12%
16%
0%
3%
6%
9%
12%
0% 9%
18% 27% 36% 45%
0% 4% 8%
12% 16% 20%
0%
4% 8%
12% 16% 20%
0% 3% 6% 9%
12% 15%
0%
5%
10%
15%
20%
0%
3% 6% 9%
12% 15%
(a)
(b)
(c)
(d)
(e)
(f)
FIGURE 1 VSP distributions of real-world (left-hand column) and simulated (right-hand column) vehicle activities for (a) 10–12 km/h, (b) 20–22 km/h, (c) 30–32 km/h, (d) 40–42 km/h, (e) 50–52 km/h, and (f) 60–62 km/h (kW/t = kilowatts per ton).
Song, Yu, and Zhang 137
be used to evaluate emission effects from traffic strategies. How-ever, from the foregoing observation, it could be further derived that the simulation model might also be inappropriate for evaluating the relative effects of emission variations. For example, the simulation result would underestimate the effect of a speed improvement on emission reductions at a low-speed area and overestimate that at a high-speed area.
sensitivity Analysis of simulation Parameters on vsP distribution
The foregoing discussion indicates that a well-calibrated simula-tion model using the traditional calibration method may not help to accurately estimate vehicle emissions because the VSP distribution produced by the simulation model differs significantly from that of the real world. In order to find an approach to improve the accuracy of simulated VSP distributions, and thus the accuracy of emissions
estimates, a series of sensitivity analyses of simulation parameters on VSP distributions were conducted.
In VISSIM, the parameters vehicle acceleration and deceleration, desired speed distribution, vehicle following behavior, lane-change behavior, lateral behavior, and so on could be adjusted. To examine their impact on VSP (i.e., speed and acceleration), eight parameters were selected for the sensitivity analysis including desired speed distribution, desired acceleration distribution, maximum accelera-tion, desired deceleration distribution, maximum deceleration, max-imum deceleration for cooperative braking, safety distance reduction factor, and maximum look-ahead distance.
On the basis of the established simulation test bed in this study, the current values of these parameters, which were calibrated with real-world conditions, were set to be the baseline. These parameters were adjusted 10% up and down. The same peak and nonpeak scenarios were run for each adjustment, and for each run 631,020 records of vehicle activity data were collected. Then their VSP distributions were gener-ated and compared with the baseline and real-world VSP distributions.
TABLE 2 Relative Errors of Emission Factors Between Simulated and Real-World Data in Each Speed Bin
Speed Bin (km/h)
Emission Factors Estimated from Simulated Data (g/km)
Emission Factors Estimated from Real-World Data (g/km) Relative Errors (%)
For each speed bin, an indicator of root mean square error (RMSE) between simulated and real-world VSP distributions was calculated:
RMSEsim real
ji i
i
n
n=
−( )=∑
2
1
3( )
where
RMSEj = root mean square error for speed bin j, simi and reali = fractions in simulated and real-world VSP distri-
butions for VSP bins i and j, and n = total number of VSP bins (61 in this study).
The results of the three speed bins with the three largest sample sizes (18 to 20, 24 to 26, and 48 to 50 km/h, Table 1) in the simulation are shown in Figure 3.
The RMSEs for the VSP distribution of the baseline simulation were 2.56%, 2.15%, and 2.64%. As demonstrated in Figure 3, the values of RMSE did not change substantially with the adjustments to all param-eters. In another words, the VSP distribution in this simulation model was not observed to be sensitive to the parameters mentioned earlier.
More detailed comparisons were demonstrated between the sim-ulated VSP histograms after the parameter adjustments and those of
the real world, as shown in Figure 4. The speed bin of 24 to 26 km/h was selected for this comparison because it had the largest simu-lated sample size. The comparisons were similar to the ones before the parameter adjustments, as shown in Figure 1, in that no matter whether the parameters were adjusted 10% up or down, the simu-lated VSP distributions showed similar histograms and kept char-acteristics that were distinct from the real-world VSP distributions. For example, all the simulated VSP distributions overestimated fractions in the VSP bins of −1, 0, and 1 kW/ton and underesti-mated fractions for 2 to 7 kW/ton. The comparison of maximum acceleration and maximum deceleration was not plotted in Figures 3 and 4 because of even less difference. Maximum acceleration is the technically feasible acceleration and works only if an acceleration exceeds the desired acceleration in VISSIM.
disCussiOn Of results
Of the three questions that this study attempted to analyze, the first two have been answered. In summary, the VSP distribution from VISSIM did not follow the regularities of the real-world VSP dis-tributions, which means that the simulation model could not rep-resent real-world vehicle dynamics for emissions estimates. The emissions estimation errors were significant in both the estimation
0
0.02
0.04
0.06
0.08
2 10 14 18 22 26 30 34 38 42 46 50 54 58 62 Em
issi
on
Fac
tor
(g/k
m)
HC Emission Factors (Simulated Data)
HC Emission Factors (Real-World Data)
0 0.05
0.1 0.15
0.2 0.25
0.3 0.35
6
0
1
2
3
4
5 E
mis
sio
n F
acto
r (g
/km
)
CO Emission Factors (Simulated Data)
CO Emission Factors (Real-World Data)
2 10 14 18 22 26 30 34 38 42 46 50 54 58 62 6
2 10 14 18 22 26 30 34 38 42 46 50 54 58 62 6 Em
issi
on
Fac
tor
(g/k
m)
Speed (km/h)
NOx Emission Factors (Simulated Data)
NOx Emission Factors (Real-World Data)
(a)
(b)
(c)
FIGURE 2 Comparison of variations of simulated and real-world emission factors with speed.
0.0%
0.5%
1.0%
1.5%
2.0%
2.5%
3.0%
Speed bin 18-20 km/h Speed bin 24-26 km/h Speed bin 48-50 km/h
FIGURE 3 RMSEs of simulated and real-world VSP distributions.
-15-13-11 -9 -7 -5 -3 -1 1 3 5 7 9 11 13 15 17 19
VSP Bin (kW/t)
-15-13-11 -9 -7 -5 -3 -1 1 3 5 7 9 11 13 15 17 19
VSP Bin (kW/t)
-15-13-11 -9 -7 -5 -3 -1 1 3 5 7 9 11 13 15 17 19
VSP Bin (kW/t)
-15-13-11 -9 -7 -5 -3 -1 1 3 5 7 9 11 13 15 17 19
VSP Bin (kW/t)
-15-13-11 -9 -7 -5 -3 -1 1 3 5 7 9 11 13 15 17 19
VSP Bin (kW/t)
(a) (b)
(c) (d)
(e) (f)
0%
5%
10%
15%
20%
25%
30%
-15-13-11 -9 -7 -5 -3 -1 1 3 5 7 9 11 13 15 17 19
VSP Bin (kW/t)
Real-World
10% Up
10% Down
0%
5%
10%
15%
20%
25%
30%
Real-World
10% Up
10% Down
0%
5%
10%
15%
20%
25%
30%
Real-World
10% Up
10% Down
0%
5%
10%
15%
20%
25%
30%
Real-World
10% Up
10% Down
0%
5%
10%
15%
20%
25%
30%
Real-World
10% Up
10% Down
0%
5%
10%
15%
20%
25%
30%
Real-World
10% Up
10% Down
FIGURE 4 Comparison of simulated with real-world VSP distributions for speeds of 24 to 26 km/h for (a) adjustment of parameter of desired speed distribution, (b) adjustment of parameter of desired acceleration distribution, (c) adjustment of parameter of desired deceleration distribution, (d) adjustment of parameter of maximum deceleration for cooperative braking, (e) adjustment of parameter of safety distance reduction factor, and (f) adjustment of parameter of maximum look-ahead distance.
140 Transportation Research Record 2270
of the absolute emissions and the evaluation of the relative varia-tions of emissions. However, with regard to the third question, it was unclear why the VSP distribution was not sensitive to those parameters that are commonly used for model calibration and val-idation. It seems that it was difficult to improve the accuracy of simulated VSP distributions based on existing model calibration approaches. Therefore, how to improve the performance of VSP distributions in a traffic simulation model is an important issue that needs extensive study.
The observations described indicate that systematic errors exist in the use of traffic microsimulation models to represent second-by-second real driving behaviors for the purpose of estimating emissions. The basic logic of traffic simulation models that affects vehicle dynamics needs to be carefully examined in such models as car-following (both steady-state and non-steady-state), decel-eration, and acceleration. Particular efforts are needed to examine their effects on acceleration, because VSP is extremely sensitive to acceleration. Also, by comparing the original speed trajectories from the real-world and the simulation models in the same traf-fic conditions, it was found that VISSIM tended to produce more aggressive acceleration and deceleration, and illustrated a different acceleration pattern from that for real-world activities. Because of space limitations, more detail will be presented in a separate paper.
suMMAry And reCOMMendAtiOns
Since the VSP distribution has proved to be the best explanation of vehicle emissions and determines emissions directly for a given vehicle, this distribution was used as an indicator for evaluating the applicability of traffic microsimulation models in vehicle emis-sions estimates. A large sample of real-world and simulated vehicle activity data and VSP distributions were compared, and the main findings could be summarized as follows:
1. VSP distributions are capable of being used as an effective indicator for evaluating the validity of a microscopic simulation model in emissions estimates.
2. Regular characteristics were observed with the real-world VSP distributions. The peak fraction decreased monotonically with an increase in speed, and the position of the peak fraction moved to the right monotonically with speed. However, VISSIM-simulated VSP distributions showed distinct characteristics from those of the real world. They tended to overestimate the fraction in lower- and higher-power areas and to underestimate the fraction in the area of 4 to 6 kW/ton. This finding indicates that the simulated VSP distribution cannot represent real-world vehicle dynamics.
3. With the emission rates in MOVES, vehicle emissions were estimated and compared. It was found that the simulated VSP distri-bution led to significant errors in estimated emissions. The average relative errors were 82.8%, 29.6%, and 53.6% for NOx, CO, and HC emission factors, respectively. The highest errors of over 200% existed with NOx in the speed area of 8 to 18 km/h. The relative errors differed considerably with speed, which meant that VISSIM was also incapable of being used to evaluate the effects of traffic strategies on vehicle emissions.
4. The simulated VSP distribution was not sensitive to the param-eters that are commonly used for model calibration. Sixteen adjust-ments of eight parameters did not affect the outputs of the simulated VSP distributions. It was shown that the traditional model calibra-tion method could not improve the accuracy of simulated VSP dis-
tributions and thus the emissions estimates. It was also indicated that a systematic error exists with the VISSIM model for outputs of the VSP distribution.
The findings of this study should help to understand the deficiency of current applications of traffic simulation models in vehicle emis-sions estimates or evaluations of traffic strategies. It might also be helpful for improving simulation models for their better integration with vehicle emissions models. In a future study, the accuracy of simulated VSP distributions by models other than VISSIM and on other road types, like arterials, needs to be examined. The internal mechanism of simulation models that affects vehicle dynamics, such as car-following, deceleration, and acceleration models, needs to be investigated. The development of a method that can be integrated into simulation models so that the VSP distribution can be more accurately predicted without sacrificing the accuracy of aggregated flow and other predictions is another important research need.
ACknOwledgMents
The authors acknowledge support by the National Natural Science Foundation of China and the project of the Foundation of Beijing Jiaotong University. This research was also supported in part by the National Science Foundation. The authors thank the personnel who either provided technical support or helped on data collection and processing.
referenCes
1. Motor Vehicle Emission Simulator (MOVES) 2010 User Guide. EPA-420-B-09-041. U.S. Environmental Protection Agency, 2009.
2. Frey, H. C., A. Unal, J. Chen, S. Li, and C. Xuan. Methodology for Developing Modal Emission Rates for EPA’s Multi-Scale Motor Vehi-cle and Equipment Emission System. EPA420-R-02-027. U.S. Environ-mental Protection Agency, 2002.
3. Song, G., L. Yu, and Z. Tu. Distribution Characteristics of Vehicle-Specific Power on Urban Restricted-Access Roadways. ASCE Journal of Transportation Engineering, Vol. 138, 2012, p. 202.
4. Song, G., and L. Yu. Characteristics of Low-Speed Vehicle-Specific Power Distributions on Urban Restricted-Access Roadways in Beijing. Presented at 90th Annual Meeting of the Transportation Research Board, 2011.
5. Barth, M., F. An, T. Younglove, G. Scora, C. Levine, M. Ross, and T. Wenzel. Comprehensive Modal Emissions Model (CMEM), Version 2.0, User’s Guide. University of California, Riverside, 2000.
6. Park, J. Y., R. B. Noland, and J. W. Polak. Microscopic Model of Air Pollutant Concentrations: Comparison of Simulated Results with Mea-sured and Macroscopic Estimates. In Transportation Research Record: Journal of the Transportation Research Board, No. 1750, TRB, National Research Council, Washington, D.C., 2001, pp. 64–73.
7. Stathopoulos, F. G., and R. B. Noland. Induced Travel and Emissions from Traffic Flow Improvement Projects. In Transportation Research Record: Journal of the Transportation Research Board, No. 1842, Transportation Research Board of the National Academies, Washing-ton, D.C., 2003, pp. 57–63.
8. Nam, E. K., C. A. Gierczak, and J. W. Butler. Comparison of Real-World and Modeled Emissions Under Conditions of Variable Driver Aggres-siveness. Presented at 82nd Annual Meeting of the Transportation Research Board, Washington, D.C., 2003.
9. Ahn, K., H. Rakha, A. Trani, and M. Van Aerde. Estimating Vehicle Fuel Consumption and Emissions Based on Instantaneous Speed and Acceleration Levels. ASCE Journal of Transportation Engineering, Vol. 128, No. 2, 2002, pp. 182–190.
10. Servin, O., K. Boriboonsomsin, and M. Barth. An Energy and Emis-sions Impact Evaluation of Intelligent Speed Adaptation. Proc., IEEE Intelligent Transportation Systems Conference, Toronto, Ontario, Can-ada, Sept. 17–20, IEEE, New York, 2006, pp. 1257–1262.
Song, Yu, and Zhang 141
11. Zhang, B., L. Shang, and D. Chen. Evaluation of Urban Traffic Inter-section Vehicle Emission Based on Microscopic Traffic Simulation (in Chinese). Computers and Communications, 2008, Vol. 26, No. 4, pp. 95–98.
12. Chamberlin, R., B. Swanson, E. Talbot, J. Dumont, and S. Pesci. Analy-sis of MOVES and CMEM for Evaluating the Emissions Impact of an Intersection Control Change. Presented at 90th Annual Meeting of the Transportation Research Board, Washington, D.C., 2011.
13. Liu, H., Y. Xiong, R. Gao, J. Teng, and M. Zhu. Investigating Vehicular Energy Consumption and Emissions at Intersections with Microsimula-tion Models. Urban Transport of China, Vol. 8, No. 2, 2010, pp. 75–79.
14. Noland, R. B., and M. A. Quddus. Flow Improvements and Vehicle Emissions: Effects of Trip Generation and Emission Control Technol-ogy. Transportation Research Part D, Vol. 11, 2006, pp. 1–14.
15. Chen, K., and L. Yu. Microscopic Traffic-Emission Simulation and Case Study for Evaluation of Traffic Control Strategies. Journal of Transportation Systems Engineering and Information Technology, Vol. 7, No. 1, 2007, pp. 93–99.
16. Zhang, Y., X. Chen, X. Zhang, G. Song, Y. Hao, and L. Yu. Assessing Effect of Traffic Signal Control Strategies on Vehicle Emissions. Jour-nal of Transportation Systems Engineering and Information Technol-ogy, Vol. 9, No. 1, 2009, pp. 150–155.
17. Stevanovic, A., J. Stevanovic, K. Zhang, and S. Batterman. Optimizing Traffic Control to Reduce Fuel Consumption and Vehicular Emissions: Integrated Approach with VISSIM, CMEM, and VISGAOST. In Trans-portation Research Record: Journal of the Transportation Research Board, No. 2128, Transportation Research Board of the National Acad-emies, Washington, D.C., 2009, pp. 105–113.
18. Bartin, B., S. Mudigonda, and K. Ozbay. Estimation of the Impact of Electronic Toll Collection on Air Pollution Levels: Estimation Using Microscopic Simulation Model of Large-Scale Transportation Net-work. In Transportation Research Record: Journal of the Transporta-tion Research Board, No. 2011, Transportation Research Board of the National Academies, Washington, D.C., 2007, pp. 68–77.
19. Boriboonsomsin, K., and M. Barth. Impacts of Freeway High- Occupancy Vehicle Lane Configuration on Vehicle Emissions. Transportation Research Part D, Vol. 13, 2008, pp. 112–125.
20. Benekohal, R. F. Procedure for Validation of Microscopic Traffic Flow Simulation Models. In Transportation Research Record 1320, TRB, National Research Council, Washington, D.C., 1991, pp. 190–202.
21. Lee, D.-H., Y. Xu, and P. Chandrasekar. Parameter Calibration for PARAMICS Using Genetic Algorithm. Presented at 80th Annual Meet-ing of the Transportation Research Board, Washington, D.C., 2001.
22. Gardes, Y., A. D. May, J. Dahlgren, and A. Skabardonis. Freeway Cali-bration and Application of the PARAMICS Model. Presented at 81st Annual Meeting of the Transportation Research Board, Washington, D.C., 2002.
23. Park, B., and J. D. Schneeberger. Microscopic Simulation Model Cali-bration and Validation: A Case Study of VISSIM for a Coordinated Actuated Signal System. In Transportation Research Record: Jour-nal of the Transportation Research Board, No. 1856, Transportation Research Board of the National Academies, Washington, D. C., 2003, pp. 185–192.
24. Chu, L. Y., H. X. Liu, J. S. Oh, and W. Recker. A Calibration Procedure for Microscopic Traffic Simulation. Presented at 83rd Annual Meeting of the Transportation Research Board, Washington, D.C., 2004.
25. Yu, L., X. Li, and Z. Zhuo. A Genetic Algorithm-Based Approach to the Calibration of VISSIM Using GPS Data. Proc., Eighth International Conference on Applications of Advanced Technologies in Transporta-tion Engineering (AATT2004), Beijing, China, May 26–28, ASCE, New York, 2004, pp. 406–411.
26. Brockfeld, E., R. D. Kühne, and P. Wagner. Calibration and Valida-tion of Microscopic Traffic Flow Models. In Transportation Research Record: Journal of the Transportation Research Board, No. 1876, Transportation Research Board of the National Academies, Washing-ton, D.C., 2004, pp. 62–70.
27. Brockfeld, E., R. D. Kühne, and P. Wagner. Calibration and Validation of Microscopic Models of Traffic Flow. In Transportation Research Record: Journal of the Transportation Research Board, No. 1934, Transportation Research Board of the National Academies, Washing-ton, D.C., 2005, pp. 179–187.
28. Shaaban, K. S., and E. Radwan. Calibration and Validation Procedure for Microscopic Simulation Model: Case Study of SimTraffic for Arte-rial Streets. Presented at 84th Annual Meeting of the Transportation Research Board, Washington, D.C., 2005.
29. Park, B., and H. Qi. Development and Evaluation of a Procedure for the Calibration of Simulation Models. In Transportation Research Record: Journal of the Transportation Research Board, No. 1934, Transpor-tation Research Board of the National Academies, Washington, D.C., 2005, pp. 208–217.
30. Ciuffo, B. F., V. Punzo, and V. Torrieri. A Framework for the Calibration of Microscopic Traffic Flow Models. Presented at 86th Annual Meeting of the Transportation Research Board, Washington, D.C., 2007.
31. Chitturi, M. V., and R. F. Benekohal. Calibration of VISSIM for Free-ways. Presented at 87th Annual Meeting of the Transportation Research Board, Washington, D.C., 2008.
32. Rakha, H., and B. Crowther. Comparison of Greenshields, Pipes, and Van Aerde Car-Following and Traffic Stream Models. In Transporta-tion Research Record: Journal of the Transportation Research Board, No. 1802, Transportation Research Board of the National Academies, Washington, D.C., 2001, pp. 248–262.
33. Rakha, H., M. Snare, and F. Dion. Vehicle Dynamics Model for Esti-mating Maximum Light-Duty Vehicle Acceleration Levels. In Trans-portation Research Record: Journal of the Transportation Research Board, No. 1883, Transportation Research Board of the National Acad-emies, Washington, D.C., 2004, pp. 40–49.
34. Jackson, E., and L. Aultman-Hall. Analysis of Real-World Lead Vehi-cle Operation for Modal Emissions and Traffic Simulation Models. In Transportation Research Record: Journal of the Transportation Research Board, No. 2158, Transportation Research Board of the National Academies, Washington, D.C., 2010, pp. 44–53.
35. van Zuylen, H., L. Jie, Y. Chen, F. Viti, and I. Wilmink. Optimizing Traf-fic Control for Emissions with a Valid Simulation Program: Calibration of a Simulation Model for Emission Estimation. Presented at 90th Annual Meeting of the Transportation Research Board, Washington, D.C., 2011.
36. Frey, H. C., N. M. Rouphail, and H. Zhai. Speed- and Facility-Specific Emission Estimates for On-Road Light-Duty Vehicles on the Basis of Real-World Speed Profiles. In Transportation Research Record: Jour-nal of the Transportation Research Board, No. 1987, Transportation Research Board of the National Academies, Washington, D.C., 2006, pp. 128–137.
37. Song, G., and L. Yu. Estimation of Fuel Efficiency of Road Traffic by Characterization of Vehicle-Specific Power and Speed Based on Floating Car Data. In Transportation Research Record: Journal of the Transpor-tation Research Board, No. 2139, Transportation Research Board of the National Academies, Washington, D.C., 2009, pp. 11–20.
38. Zhu, L., L. Yu, Y. Zhang, X. Chen, J. Guo, and M. Sun. Simulation Approach to the Analysis of Exclusive Bus Lane on Western 3rd Ring-Road Expressway in Beijing. Presented at 89th Annual Meeting of the Transportation Research Board, Washington, D.C., 2010.
The Transportation and Air Quality Committee peer-reviewed this paper.