Application and Analysis of Pork-Belly Commodity Spreads Richard L. Meyer
The objective of this paper is to construct and empirically test mechanical trading rules which can reduce the investor's risk in commodity futures contracts. Frozen pork bellies are the commodities used for empirical testing because price data are readily available, pork-belly contracts are popular with investors in the commodity markets, and pork-belly prices are subject to reasonably wide fluctuations (which may scare the more risk-averse investor).
Three sets of mechanical trading rules are derived and tested; all utilize commodity spreads. The normal commodity spread involves the short sale of a distant futures contract and die purchase of a nearby futures contract when the premium of far over near is judged too great. Such judgments will be based on the ratio of the premium to transactions and carrying charges described in the following section. Strategy 1 calls for spreading all combinations of contracts when the price premium is judged too large. Strategy 2 is die same as Strategy 1 except diat only one spread is permitted per combination of contracts. Strategy 3 is like Strategy 1 except that the maximum holding period is predetermined.
Results of the empirical tests indicate diat die spreads created via die strategies used here would have been almost uniformly profitable, al-diough the degree of profitability would have varied widely from one spread to anodier. Furthermore, altiiough losses did occur in individual spreads, most applications of the three strategies showed positive returns outnumbering negative returns by at least 60 percent to 40 percent. In many cases, no negative returns were realized and when negative returns did occur, diey were always less than die predetermined permissible maximum.
Richard L. Meyer is a faculty member at the University of South Florida. This paper was written in 1971.
The theory of spreading commodities is similar to the theory of arbitrage in die securities market.
For instance, in the stock markets, A.T.&T. sells on the Midwest Stock Exchange and the New York Stock Exchange. The price difference between the two markets seldom exceeds the transaction costs involved in the purchase and sale of the security. If the price spread does exceed this amount, the alert investor will simultaneously purchase A.T.&T. on the exchange where it is cheapest and sell short a comparable number of shares on the other. On receiving the shares he has purchased, he can cover his short sale and pocket the profit, dius successfully engaging in a risk-free arbitrage operation.
Prices of commodity futures contracts are bound by a similar constraint. For example, in the pork-belly market, a March contract cannot exceed die price of a February contract by more than trading commissions and one month's carrying charges. If such an imbalance were to exist, investors could buy a February contract and simultaneously sell a March contract.
In February an investor could take delivery of die bellies, store them for a month, and then deliver them in March to cover his sale. His profit would be the difference between the sale price of the March contract and the sum of carrying costs, transaction costs, and the purchase price of the February contract. Again, a risk-free arbitrage operation would be accomplished and because investors will fully exploit all such risk-free opportunities, the maximum price differential of March bellies over February, or August over May, is a known quantity.
Note that no such constraint prohibits the March contract from selling substantially above the May contract, or the March contract above July, and in fact, such a phenomenon is not unusual. On November 30, 1971, July, 1972 contracts were selling at about 33 cents per pound while the August contract for die same year traded at slightly less than 32 cents per pound. Reverse arbitrage is impossible simply because one cannot use the proceeds from an August delivery to meet the obligations of a contract which must be satisfied in July.
While reverse arbitrage is an impossibility, some commodity investors do engage in reverse spreads — shorting a near contract and purchasing the distant contract on the theory that the premium of the near over the far has become too large. Such a transaction cannot, however, be considered risk-free. If the investor's assumption is based on a faulty analysis of market conditions, he may find that the premium of the near over the distant contract increases. Reverse spread cannot be used to precisely determine die maximum loss which may occur, and will not be considered further in this paper.
When considering the ordinary commodity spread, few cases will arise where the price of the distant contract exceeds that of the near contract by more than transaction and carrying costs, precisely because such a situation gives investors the opportunity to achieve risk-free returns and their actions in the marketplace will rapidly eliminate the large price difference. On the other hand, new contracts often sell for more than distant contracts by less than the full amount of the transaction and carrying costs. In these cases, the investor may spread two contracts and know at the outset the maximum loss, which he may be forced to endure, or he may choose to engage in only those spreads where the possible loss cannot exceed some predetermined maximum amount.
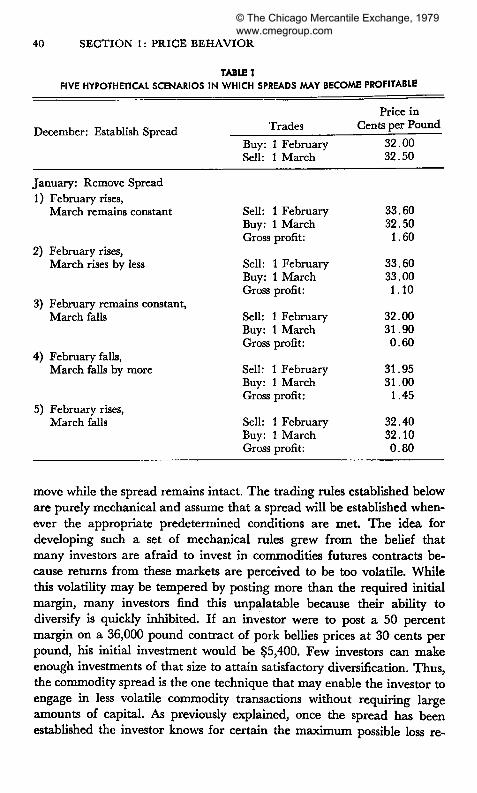
For example, assume diat a February pork-belly contract is currently trading at 32 cents per pound, that the March contract is 32.50 cents, and that transaction and storage costs are 0.80 cent per pound. If an investor were to buy one February contract and simultaneously sell one March contract his maximum loss would not exceed 0.30 cent per pound or $108 total (0.30 cent per pound times the standard 36,000-pound contract) . Regardless of what happens to prices of these contracts, die spread between them will not exceed 0.80 cent and, because it is already 0.50 cent, the maximum loss is thus set at 0.30 cent per pound.
If the maximum loss is predetermined, what profit potential may exist in such an investment strategy? Again referring to the example above: the February contract may rise while the March contract remains constant, or rises by a smaller amount; the March contract may fall while the February contract remains constant or falls by a smaller amount; or, the February contract may increase while the March contract falls. Suppose that February advances 36 cents per pound and March to 36.15 cents. The investor will have gained 4 cents on die long side and lost 3.65 cents on the short side for a gross gain of 0.35 cent per pound, or $126 on a 36,000-pound contract. After subtracting commissions of $45 his net gain is $81. In other words, diere are a variety of ways in which prices may change so that the investor realizes positive returns. (See Table 1).
Having explored the use of a commodity spread to predetermine maximum losses and still offer the potential for positive returns, we may now develop a set of investment techniques and empirically test dieir viability using historical pork-belly prices.
These tiieories make no assumptions about the "correctness" of die level of pork-belly prices at the time when the spread is established, nor do diey make any assumptions about die direction in which tliese prices may
FIVE HYPOTHETICAL SCENARIOS I N WHICH SPREADS MAY BECOME PROFITABLE
December: Establish Spread
January: Remove Spread 1) February rises,
March remains constant
2) February rises, March rises by less
3) February remains constant, March falls
4) February falls, March falls by more
5) February rises, March falls
Trades
Buy: 1 February Sell: 1 March
Sell: 1 February Buy: 1 March Gross profit:
Sell: 1 February Buy: 1 March Gross profit:
Sell: 1 February Buy: 1 March Gross profit:
Sell: 1 February Buy: 1 March Gross profit:
Sell: 1 February Buy: 1 March Gross profit:
Price in Cents per Pound
32.00 32.50
33.60 32.50
1.60
33.60 33.00 1.10
32.00 31.90 0.60
31.95 31.00
1.45
32.40 32.10 0.80
move while the spread remains intact. The trading rules established below are purely mechanical and assume diat a spread will be established whenever die appropriate predetermined conditions are met. The idea for developing such a set of mechanical rules grew from die belief that many investors are afraid to invest in commodities futures contracts because returns from diese markets are perceived to be too volatile. While this volatility may be tempered by posting more man the required initial margin, many investors find this unpalatable because their ability to diversify is quickly inhibited. If an investor were to post a 50 percent margin on a 36,000 pound contract of pork bellies prices at 30 cents per pound, his initial investment would be $5,400. Few investors can make enough investments of diat size to attain satisfactory diversification. Thus, the commodity spread is the one technique diat may enable the investor to engage in less volatile commodity transactions witiiout requiring large amounts of capital. As previously explained, once die spread has been established the investor knows for certain the maximum possible loss re-
gardless of what happens to the price of the commodity during the period tliat the spread is maintained.
The procedure in this study dien is to hypothetically establish a spread whenever a particular loss-minimizing trading rule is met, compute the holding period of the spread, and its net profitability. The spread is established by purchasing the nearby contract and simultaneously selling a more distant contract at the closing price in any week that die proper trading rule is met. The spread is assumed to be lifted by simultaneously selling the near contract and buying die more distant contract at the closing prices on Friday of the last week in the month just prior to die expiration month of the near contract. While the investor would not have to repurchase the distant contract at that time, if only half the spread were closed out, he would be exposing himself to precisely those risks that we are trying to eliminate. Investors can only predetermine their maximum possible loss as long as they maintain both sides of the spread.
For example, assume today is the first Friday in October and die price of March pork bellies exceeds the price of February pork bellies by enough to justify establishing a spread. The February contract is purchased at 32 cents per pound and die March contract is sold at 32.50 cents. Then on the last Friday in January (the month just prior to the expiration month of the near contract) the investor lifts the spread by selling February at 34 cents and purchasing March at 34.05 cents.
The holding period of the investment is measured in weeks and extends from the end of die first week in October to the end of die last week in January, a holding period of 16 weeks in this case. The gross return is computed by measuring die gain or loss on die long contract, die gain or loss on the short contract, netting die two, and multiplying by 30,000 (36,000 for 1971 contracts). The net profit is computed by subtracting commissions. From the above example, two cents were made on the long side and 1.55 cents lost on die short side for a combined return of 0.45 cent. On a 30,000-pound contract, this amounts to a gross return of $135. After subtracting die commission of $45, the net return is $90.
Now we must look at die variety of rules which were used to determine the appropriate time for establishing the spread. The previous section pointed out diat an investor would not expect to find a distant contract trading at a premium over a near contract by more tiian carrying and transaction costs, but that it was not uncommon to observe the distant over die near by some portion of those costs. The first step, then, is the development of a model which approximates the total of these costs. Included here are storage, interest, insurance, and transaction costs.
From figures supplied by the Chicago Mercantile Exchange, die fixed portions of the costs were determined to be 0.20 cent for 1965 and earlier,
0.21 cent from 1966 through 1969, and 0.24 cent beginning in 1970. These change because commissions were raised from $34, to $36, to $45, respectively. Insurance and storage costs are approximately 0.28 cent times the number of months between the two contracts, (t). Interest charges are approximated by multiplying die current price of the near contract by 10 percent, dividing by 12 months and multiplying by t. The appropriate equation for spreads undertaken during 1967 may be expressed as:
Total Cost = .0021 + .0028* + [(Price/lb.) (.10*)j/12 (1)
Strategy 1
The first set of trading rules requires that a spread be established whenever a distant contract sells over a near contract by more than some amount (alpha) where alpha is a percentage of the total cost. The data have been tested against alpha levels ranging from 10 percent of total costs to 90 percent of total costs in increments of 10 percent. Suppose an investor is looking at closing prices in the third week of November and sees diat the standard five pork-belly contracts are being traded (February, March, May, July, and August) and that alpha has been set at 40 percent of total costs. Alpha is computed for all possible combinations of contract spreads (February-March,..., February-July, February-August, March-May,. . . , March-August, etc.). The actual price premiums are compared for each combination and if the price premium exceeds alpha the spread is established and the holding period and gross and net returns are computed. Advancing to the fourdi week in November, an investor repeats die above process and continues until all weeky data have been investigated. The alpha level is then changed to 50 percent of total costs and the entire computation process is repeated on all weekly data. This continues until all data have been investigated at an alpha level equal to 90 percent of total costs.
Note that this first set of mechanical trading rules may find an investor holding multiple positions in die same spread. Returning to the above example, he may find that a February-March spread is in order during the third week in November and diat diis spread also meets requirements in the fourth week. This first set of rules assumes that the investor would then hold two February-March spreads and perhaps a good many more if this combination continued to meet die requirements in later weeks.
As will be shown in die next section, such a situation arose frequently and investors would often have been put in a position where a high proportion of the spreads which were established would have been over the same two futures months.
The second trading technique seeks to eliminate the above problem by prohibiting more than one spread position in any given combination of contracts. In the above example, if a February-March spread were initially established in the third week of November, even though that same combination may again qualify in the fourth week, it is not permitted. Other than this exception, the second trading strategy follows exactly the same process outlined for the first.
Strategy 3
Another potential problem arises in both the first and second applications of mechanical trading rules in that die holding periods vary substantially. Some are as short as one week while others may extend to 39 weeks. Since some investors may not want to consider commodity investments whose holding period exceeds a certain number of weeks, a third set of trading rules was established. In Strategy 3 all combinations of contracts, which meet the requirements as laid out in Strategy 1 above and whose holding periods do not exceed some predetermined number of weeks, are included as spreads. Note that multiple spreads in die same combination of contracts are again possible under Strategy 3. The holding period restrictions range from 2 weeks or less, to 40 weeks or less with 2-week increments.
THE DATA
Data for diis paper were gathered from the commodities section of the Wall Street Journal. Weekly observations were taken from each Monday's Journal so that figures used represent die last trades which took place on Friday of the previous week. Data cover die period from March, 1964, when pork-belly trading was first reported in the Journal through August of 1971.
When no data were published referring to die Friday closing prices or when no Monday Wall Street Journal was published, die Monday closing prices were used or the next closest set of closing prices if Monday prices were not available. These occurrences were relatively unusual. For die most part, readings were taken at seven-day intervals so that deviations from this pattern should not create any serious biases.
Data include die trading date on which observations were taken, such as die diird week in March, 1964, or die first week in February, 1969. Then, die expiration date of each futures contract, which was currently being traded, and its closing price were recorded. For instance, data available at die end of die second week of September, 1970, shows all
five futures months of 1971 were then being traded (February, March, May, July, and August).
Recording the closing prices presents somewhat of a problem because sales may have been occurring in a range of prices at the close. In approximately three-fourths of die observations, more dian one price was reported at the close. In such cases, the closing price was assumed to be die average of the high and low prices of tiiis range. While no trades may have actually occurred at the computed average price, its use should not seriously affect the average returns shown in this study for three reasons: 1) in about 25 percent of the cases, only a single closing price was reported; 2) the range of prices reported at die close was often five-hun-dredths of a cent or less, and in the majority of cases was a tenth of a cent or less, so that any bias which occurs is reasonably small; 3) even if a significant bias existed, the effect should average out if a large number of observations exist (there are approximately 1,700 observations of futures prices in tiiis paper).
Use of average data may, however, exert a downward bias on the standard deviation of returns and while the average return would not be biased, real trades in the spreads studied here may have resulted in a wider range of gains and losses. This also means diat die number of spreads showing negative returns may be downward biased. Although losses could have been more frequent and larger than these results indicate, they would still not exceed the investor's predetermined maximum.
During some years, sporadic trading was reported in futures months other than die five standard contracts listed above. These price observations were omitted from diis study.
ANALYSIS OF RESULTS
In analyzing die data, a radier extraordinary fact emerges. All variations of Strategies 1 and 2 yield profits and from die 180 variations of Strategy 3 tested here, on the average, all but seven showed positive returns. Fur-diermore, for almost all variations of each of the tiiree strategies, gains outnumbered losses and no negative returns occurred when an alpha level of 60 percent or greater was used.
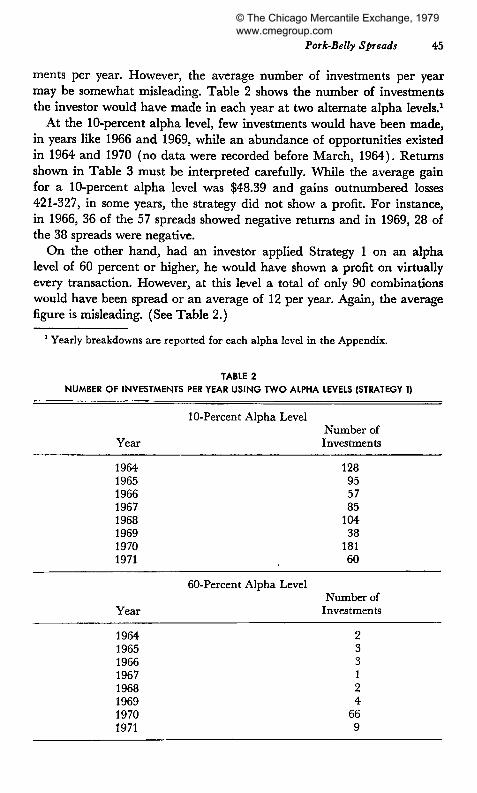
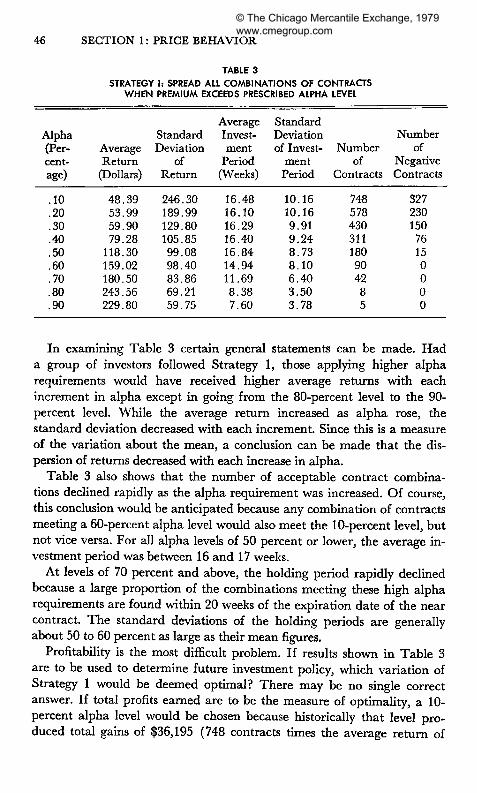
Strategy 1 requires that a spread be established whenever a distant contract mondi is priced over a near contract by at least a certain percent of the carrying and transaction costs (the alpha level). If an investor had followed this trading rule using a 10-percent alpha level, he would have received an average return of $48.39 over an average investment period of 16.48 weeks. (See Table 3.) Between March, 1964 and August, 1971, he would have invested in 748 spreads witii 327 giving negative results. On die average, the investor would have made almost 100 such invest-
ments per year. However, the average number of investments per year may be somewhat misleading. Table 2 shows die number of investments the investor would have made in each year at two alternate alpha levels.1
At the 10-percent alpha level, few investments would have been made, in years like 1966 and 1969, while an abundance of opportunities existed in 1964 and 1970 (no data were recorded before March, 1964). Returns shown in Table 3 must be interpreted carefully. While the average gain for a 10-percent alpha level was $48.39 and gains outnumbered losses 421-327, in some years, the strategy did not show a profit. For instance, in 1966, 36 of the 57 spreads showed negative returns and in 1969, 28 of die 38 spreads were negative.
On the other hand, had an investor applied Strategy 1 on an alpha level of 60 percent or higher, he would have shown a profit on virtually every transaction. However, at this level a total of only 90 combinations would have been spread or an average of 12 per year. Again, die average figure is misleading. (See Table 2.)
1 Yearly breakdowns are reported for each alpha level in the Appendix.
TABLE 2
NUMBER OF INVESTMENTS PER YEAR USING T W O ALPHA LEVELS (STRATEGY 1)
In examining Table 3 certain general statements can be made. Had a group of investors followed Strategy 1, diose applying higher alpha requirements would have received higher average returns with each increment in alpha except in going from the 80-percent level to the 90-percent level. While the average return increased as alpha rose, the standard deviation decreased witii each increment. Since this is a measure of die variation about the mean, a conclusion can be made that the dispersion of returns decreased with each increase in alpha.
Table 3 also shows diat die number of acceptable contract combinations declined rapidly as die alpha requirement was increased. Of course, this conclusion would be anticipated because any combination of contracts meeting a 60-percent alpha level would also meet the 10-percent level, but not vice versa. For all alpha levels of 50 percent or lower, the average investment period was between 16 and 17 weeks.
At levels of 70 percent and above, the holding period rapidly declined because a large proportion of the combinations meeting these high alpha requirements are found within 20 weeks of the expiration date of the near contract. The standard deviations of the holding periods are generally about 50 to 60 percent as large as dieir mean figures.
Profitability is the most difficult problem. If results shown in Table 3 are to be used to determine future investment policy, which variation of Strategy 1 would be deemed optimal? There may be no single correct answer. If total profits earned are to be the measure of optimality, a 10-percent alpha level would be chosen because historically that level produced total gains of $36,195 (748 contracts times the average return of
$48.39). Each succeeding higher alpha level is inferior to the previous one. However, this is probably not the best measure for two reasons: 1) the number of spreads would be prohibitively large for most investors; and 2) any investor with enough funds to use an alpha level of 10 percent could have used these same funds to purchase four spreads of each combination of acceptable contracts at the 50-percent level. This approach would then have yielded $85,200 total profits (180 contracts times $118.30 average returns times 4) which is clearly superior to diose achieved at die 10-percent level. If average returns per spread (or nonannualized rates of return) are perceived as die best measure of profitability, die optimal alpha level would be 80 percent where the average historical gain was $243.56. However, investors would probably not select this strategy because it yields a total of only 8 separate investments in 7V& years (2 in 1966, 4 in 1970, and 2 in 1971). While investors could have taken a large number of positions in each of die 8 combinations to produce greater total returns, many investors would no doubt prefer to invest tiieir funds in a wider range of spreads.
This variation of Strategy 1 may predict a less than acceptable level of diversification. Assuming margin deposits of $1,000 per spread, die alpha level yielding die highest annualized rate of return occurs when alpha equals 90 percent (312 percent return). Selection of this alpha level suffers from the same problems described immediately above for the 80-percent level. Annualizing the rates of return is also misleading in this case. Purporting that an investor who follows Strategy 1 at an alpha level of 90 percent would have earned a 312-percent compound rate of return on his investment from 1964 to 1971 is simply not accurate. The investor would have made no investments until 1966, and then he would have had to make two spreads over roughly the same period. The same thing occurred in 1971, and the investor would have invested in one spread in 1970. An investor who had been prepared to begin investing in 1964, and had a minimum of $2,000 available (enough to margin two spreads simultaneously), would have earned a compound rate of return considerably smaller dian 312 percent (die approximate internal rate of return would have been 8 percent).
An investor who uses the results in Table 3 to formulate his future investment strategy may find alpha levels of 40 to 60 percent to be the most attractive requirements because observed returns were reasonably large, negative returns were small in proportion to total spreads, and die total number of spreads meeting die investment criteria was reasonably
large. We can now turn to an evaluation of Strategy 2, which would have in
vestors spread all combinations of contracts in which the premium of the
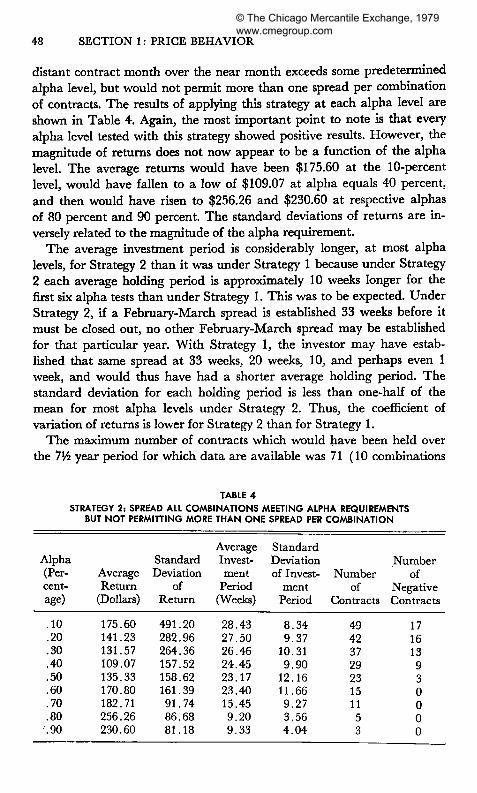
distant contract mondi over the near month exceeds some predetermined alpha level, but would not permit more than one spread per combination of contracts. The results of applying this strategy at each alpha level are shown in Table 4. Again, the most important point to note is that every alpha level tested with tiiis strategy showed positive results. However, the magnitude of returns does not now appear to be a function of die alpha level. The average returns would have been $175.60 at the 10-percent level, would have fallen to a low of $109.07 at alpha equals 40 percent, and then would have risen to $256.26 and $230.60 at respective alphas of 80 percent and 90 percent. The standard deviations of returns are inversely related to the magnitude of the alpha requirement.
The average investment period is considerably longer, at most alpha levels, for Strategy 2 than it was under Strategy 1 because under Strategy 2 each average holding period is approximately 10 weeks longer for the first six alpha tests tiian under Strategy 1. This was to be expected. Under Strategy 2, if a February-March spread is established 33 weeks before it must be closed out, no other February-March spread may be established for that particular year. With Strategy 1, the investor may have established that same spread at 33 weeks, 20 weeks, 10, and perhaps even 1 week, and would thus have had a shorter average holding period. The standard deviation for each holding period is less than one-half of the mean for most alpha levels under Strategy 2. Thus, die coefficient of variation of returns is lower for Strategy 2 than for Strategy 1.
The maximum number of contracts which would have been held over die 7lA year period for which data are available was 71 (10 combinations
TABLE 4 STRATEGY 2: SPREAD ALL COMBINATIONS MEETING ALPHA REQUIREMENTS
BUT NOT PERMITTING MORE THAN ONE SPREAD PER COMBINATION
of each of the 5 standard contracts in 1965-1971 and 1 combination in 1964). In fact, the largest number of contracts which would have qualified was 49 at the 10-percent alpha level and this number declined until only 3 contracts were included over tiiis time span when alpha was set at 90 percent. The last column in Table 4 shows the number of spreads producing negative returns at each test level. The negative returns declined rapidly until none existed at die 60-percent level and above. Negative contracts as a percentage of total contracts reached a maximum of 38 percent when alpha was 20 percent.
An interesting variation of Strategy 2, as opposed to Strategy 1, is that investment opportunities are more evenly spread from one year to the next. For example, the 10-percent requirement shows that the 49 total contracts purchased were fairly evenly distributed from 1964 through 1971. (See Table 5.)
Again, average figures may be somewhat misleading. The investors' yearly average returns at die 10-percent alpha level can also be seen in Table 5. While the average return per contract over the entire period would have been $175.60, Table 5 shows that the average returns were "reasonable" in only three of the seven years, and diat losses were realized in one. These numbers seem to indicate that although profits were attainable, on the average, investors would have had to be patient to achieve them.
In conducting this same analysis, when alpha was set at 40 percent the yearly results that would have been obtained are seen in Table 6. The yearly results are still fairly well dispersed .witii an average loss occurring again in 1968, and an average return of $265.50 in 1966. These results
TABLE 5
NUMBER OF INVESTMENTS AND YEARLY AVERAGE RETURNS USING A 10-PERCENT ALPHA LEVEL (STRATEGY 2)
also confirm the fact that the investor would have needed patience to achieve the average results for the whole period as shown in Table 4.
Finally, some interpretation is needed as to the real rate of return an investor may have been able to realize. A conservative approach assumes the investor had, at die beginning of 1964, enough funds available to margin 10 spreads simultaneously and that he received no interest on idle funds. Furthermore, assume each spread is margined at $1,000. Using yearly data for alpha equals 10 percent, the internal rate of return is slightly less than 3 percent and about 1 percent at the 20-percent alpha level. This probably cannot be interpreted as die investor's perceived return because he surely would not have permitted his unused cash to remain idle. On die other hand, if die returns per investment are annualized for the 10-percent alpha level, again assuming $1,000 margin, the rate of return is about 34 percent. This approach has certain deficiencies which were discussed above. Realistically, the investor seldom would have had the opportunity to invest in more than one spread per $1,000 investment per year even though the average holding period was roughly half a year at the 10-percent alpha level. If he could have earned $20 from savings for half a year (approximately 4 percent interest per $1,000) and $175.60 on his spread positions, his rate of return would have been between 19 and 20 percent, on funds actually invested. The main point is that, under Strategy 2, reasonably large positive returns have been earned on the average spread by the patient investor.
The final set of trading rules would have investors spread all combinations of contracts that meet the predetermined alpha requirements and would tie up tiieir funds for fewer than a predetermined number of weeks. Strategy 3 was tested for 20 holding periods ranging from maximum
TABLE 6 NUMBER OF INVESTMENTS AND YEARLY AVERAGE RETURNS
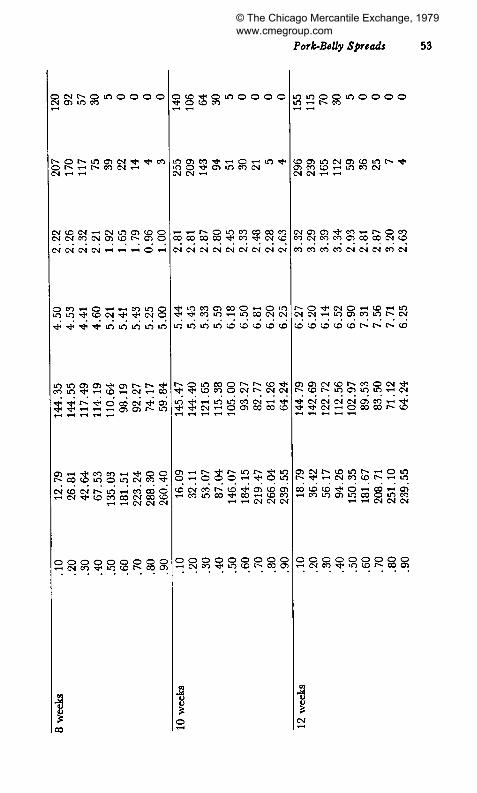
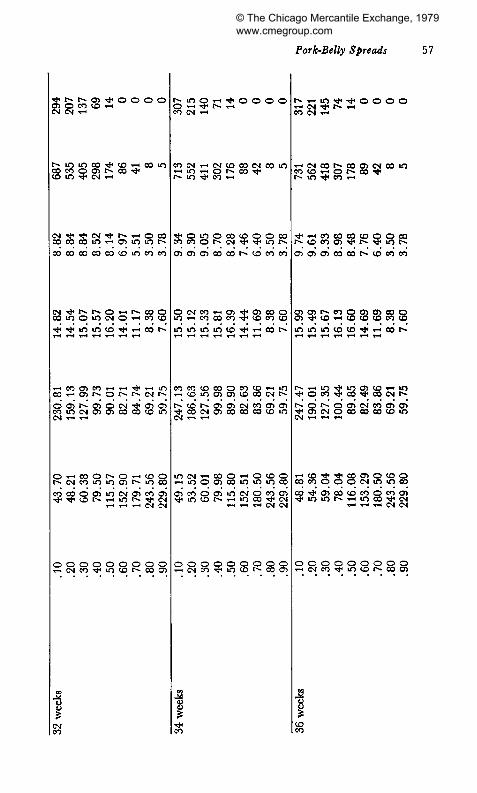
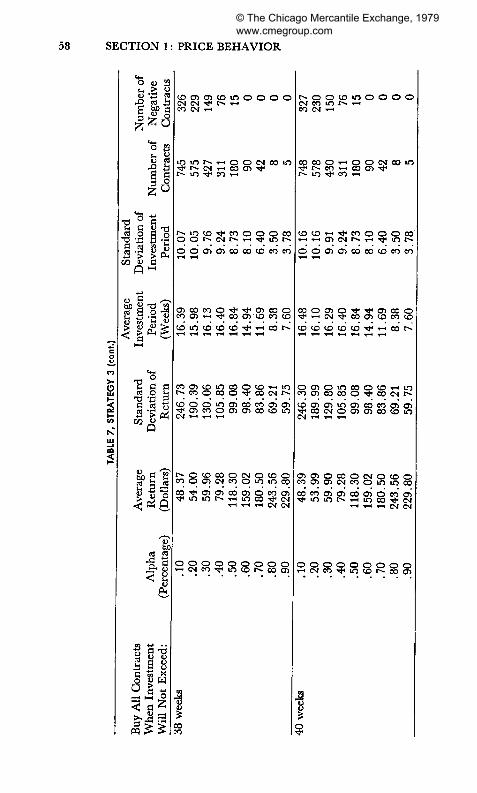
holding periods of 2 to 40 weeks. Results of applying Strategy 3 are shown in Table 7.
Table 7 shows that extremely short holding periods (2 and 4 weeks) resulted in negative or small returns for all those alpha levels that generated a substantial number of spreads. However, when the holding period tested was 6 weeks or more, the average returns were always positive (although admittedly small in some instances).
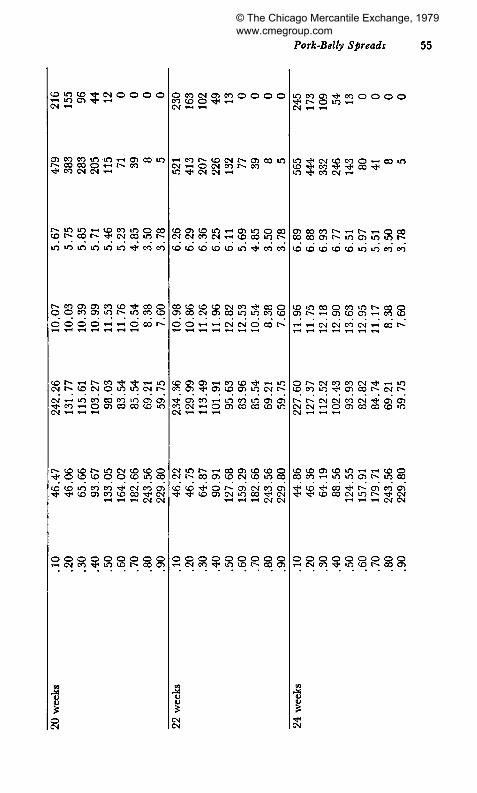
As a general rule, returns increased as alpha increased, but there is an inverse relationship between the standard deviations of returns and alpha. These trends in results strongly resemble the trends observed widi Strategy 1. The holding periods tend to be relatively stable from one alpha level to another except when the holding periods are at a high end of the range. The average holding periods decline at very high alpha levels. The size of the average holding period is usually only about one-half as large as the maximum permissible holding period because Strategy 3 has two requirements. Strategy 3 permits spreading when: 1) a particular alpha is met, and 2) the holding period is equal to or less than the designated maximum. As a rule, the standard deviations of the holding periods are 40 to 60 percent as large as the average holding periods. Again, die number of combinations qualifying for spreads is inversely related to the alpha level. However, the interpretation of the results of Strategy 3 is mainly to be found by intercomparisons of Table 7.
At an alpha level of 10 percent, die average returns increased to a high of $46.47 as the permitted holding period was lengthened to 20 weeks; then, as the holding period was lengthened still further, the average returns dropped back to $39.48 at 40 weeks. A similar pattern is repeated for the 20-percent alpha level. The 30-percent alpha requirement shows diat the greatest average returns would have been generated when the holding period was 22 weeks or less. For alpha levels of 40 to 70 percent, the greatest average returns occur when the holding period is restricted to about one-quarter of a year. At alpha levels of 80 to 90 percent, little trend in returns can be observed because so few contracts are involved.
A disproportionately large number of negative combinations are found in the short holding periods. For instance, at die 10-percent alpha level in the six-week holding period, 158 combinations would have been spread and 100 of tiiese would have produced negative returns. At die 10-percent alpha level in the 40-week holding period, 748 would have been selected with 327 giving negative returns. Thus in the 6-week holding period, losses occurred in 63 percent of the spreads, while in die 40-week holding period losses occurred in only 44 percent of the spreads. At an alpha of 40 percent in the 10-week period, losses occurred in 32 percent of the
TABLE 8 NUMBER OF INVESTMENTS AND AVERAGE RETURNS BY YEAR, 14-WEEK HOLDING PERIOD,
50-PERCENT ALPHA LEVEL (STRATEGY 3)
Year
1964 1965 1966 1967 1968 1969 1970 1971
Number of Investments
10 7 2 0 0 3
37 15
Returns
$ 59.60 144.43 288.00
0.00 0.00
65.00 186.97 99.24
spreads while at the 40-percent alpha level in die 40-week holding period losses were in only 24 percent of total spreads.
Again, these averages may be misleading. For example, in Table 7 we see that widi a maximum holding period of 14 weeks, at alpha equal 50 percent, average returns would have been $150.75 and a total of 74 spreads undertaken (an average of almost 10 per year). The actual distribution of returns and spreads is seen in Table 8.
Although the investor would have earned positive returns in each year when spreads were possible, average returns were higher than $150.75 only in 1966 and 1970. Also, die spreads are not evenly distributed over the years as none were possible in 1967 and 1968, while half of die total would have been undertaken in 1970.
Strategy Selection
Investors differ as to risk aversion and acceptable investment horizons. Thus, selecting which variation of the final set of trading rules is the optimal guide for investors is impossible. As risk aversion increases, investors opt for higher and higher levels of alpha until finally at alpha equal 1.0, an investor would be operating in a risk-free environment. Also, his perceived investment horizon would affect the maximum number of weeks over which an investment could be held.
Some general comments can be made as to which variation would be most appealing to die "average" investor of modest means whose potential investment horizon reaches to at least 40 weeks. The 2- and 4-week holding periods should probably have been ignored because returns were negative in most cases and where positive, few investment opportunities existed. For holding periods ranging from 6 to 40 weeks, alpha levels of 10 or 20 percent should have been avoided because when die number of opportunities was of the size an investor could manage, returns (though
positive) were low. Then when the average returns were relatively large, die number of investment opportunities became so large as to be beyond the grasp of all but the wealthy investor. At alpha levels of 70 percent and above, returns were large but investment opportunities over the 754-year period would have been strictly limited. This leaves us widi the spectrum of alpha from 40 dirough 60 percent and holding periods of 6 to 40 weeks. Many investors may also consider the 40-percent variation inferior to the remaining two. For instance, at 40 percent the greatest average returns, $99.68, occurred when die holding period was restricted to 14 weeks or less. These criteria have selected 137 spreads. However, when an alpha of 50 percent and 22-week maximum is selected, average returns reach $127.68 over 132 spreads. For this latter strategy, the number of opportunities would have been nearly the same as in the former while substantially higher returns would have been realized. Alpha levels of 50 to 60 percent and maximum holding periods of 16 to 40 weeks would seem to be most acceptable for the average investor.
The beauty of Strategy 3 may lie not in selecting die optimal strategy for die average investor but rather in showing that positive returns could have been earned by investors with widely differing investment criteria. The three strategies show that investors could have specified a variety of investment constraints over a relatively long period of time and earned positive returns, on the average, diat would have been risk-free. While tiiese spreads would not have been risk-free, die investor could have predetermined his maximum loss at some satisfactory level and prevented die chance of a catastrophic loss. The individual investor must decide whedier die rate earned in excess of die risk-free rate would have been enough to compensate for the level of risk accepted.
Results of Selective-Spread Combinations
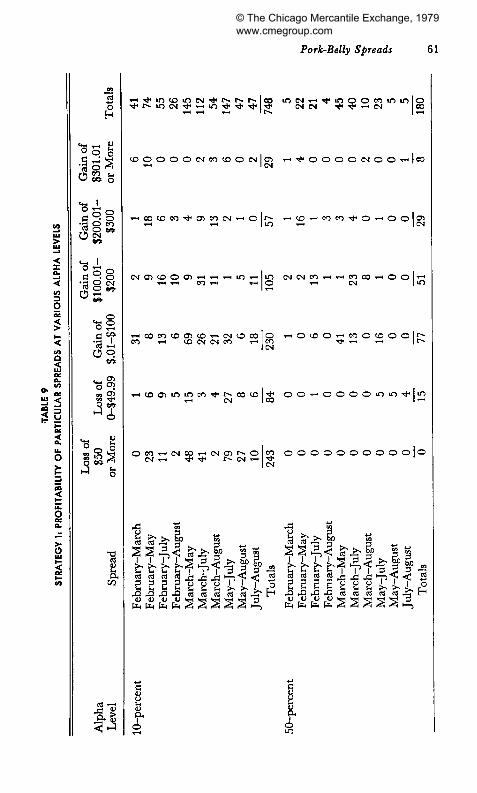
Results of an investigation of the popularity and profitability of the individual combinations of contracts are shown in Tables 9 and 10 for Strategies 1 and 2 at the 10- and 50-percent alpha levels.
In all except the 50-percent alpha level of Strategy 2, the combinations selected most often were May-July and March-May. For Strategy 1, at die 10-percent alpha level these two spreads account for 39 percent of the total spreads. For Strategy 2 at the 10-percent and 50-percent alpha levels, these two spreads account respectively for 30 percent and 43 percent of die total. Strategy 1 at the 50-percent level has the March-May and March-July spreads making up 47 percent of all contracts spread.
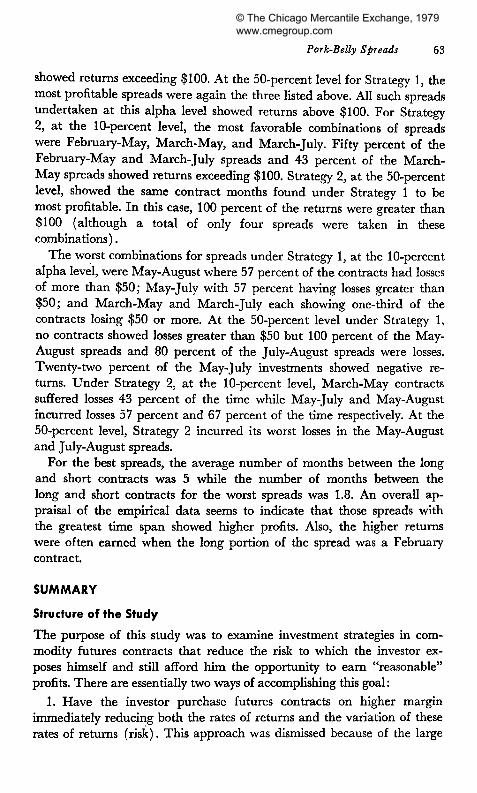
Combinations widi die highest percent of returns above $100 for Strategy 1 at an alpha of 10 percent were February-May, February-August, and March-August. Fifty percent (77/154) of these spreads
showed returns exceeding $100. At the 50-percent level for Strategy 1, the most profitable spreads were again the three listed above. All such spreads undertaken at this alpha level showed returns above $100. For Strategy 2, at the 10-percent level, die most favorable combinations of spreads were February-May, March-May, and March-July. Fifty percent of the February-May and March-July spreads and 43 percent of the March-May spreads showed returns exceeding $100. Strategy 2, at the 50-percent level, showed the same contract months found under Strategy 1 to be most profitable. In this case, 100 percent of the returns were greater than $100 (although a total of only four spreads were taken in these combinations).
The worst combinations for spreads under Strategy 1, at the 10-percent alpha level, were May-August where 57 percent of the contracts had losses of more than $50; May-July with 57 percent having losses greater than $50; and March-May and March-July each showing one-third of the contracts losing $50 or more. At the 50-percent level under Strategy 1, no contracts showed losses greater than $50 but 100 percent of the May-August spreads and 80 percent of the July-August spreads were losses. Twenty-two percent of the May-July investments showed negative returns. Under Strategy 2, at the 10-percent level, March-May contracts suffered losses 43 percent of the time while May-July and May-August incurred losses 57 percent and 67 percent of the time respectively. At the 50-percent level, Strategy 2 incurred its worst losses in the May-August and July-August spreads.
For the best spreads, the average number of mondis between die long and short contracts was 5 while the number of months between die long and short contracts for the worst spreads was 1.8. An overall appraisal of die empirical data seems to indicate that those spreads widi the greatest time span showed higher profits. Also, die higher returns were often earned when the long portion of die spread was a February contract.
SUMMARY
Structure of the Study
The purpose of this study was to examine investment strategies in commodity futures contracts that reduce die risk to which the investor exposes himself and still afford him the opportunity to earn "reasonable" profits. There are essentially two ways of accomplishing this goal:
1. Have the investor purchase futures contracts on higher margin immediately reducing both the rates of returns and the variation of diese rates of returns (risk). This approach was dismissed because of the large
dollar investment required and the belief tiiat few investors have the means to diversify widi tiiis strategy.
2. Utilize the commodity spread. Spreading essentially involves purchase of a near-term contract and the simultaneous sale of a more distant contract. This is typically undertaken when the distant is priced over the near by some amount that approaches the transaction and storage costs which must be covered to run a risk-free arbitrage operation. This was the approach examined in tiiis paper.
The commodity-spread approach has two features which allow for a satisfactory method of reducing risk:
1. Investors can predetermine tiieir maximum loss or, conversely, have the ability to prevent catastrophic loss. A distant contract will rarely sell over a near contract by more than die total of transaction and storage costs, so the investor knows the maximum premium that may exist.
2. Spreads can be undertaken on reasonably small margins providing most investors with the ability to diversify witii more than one spread at any point in time (or at least the ability to have a small percentage of their funds invested in any one commodity spread at any point in time).
Three strategies involving spreads were tested here: Strategy 1 involved investing in every combination of spreads in which
the distant contract sold at some percent, alpha, or more, of transaction and carrying charges. This strategy permits taking multiple spreads in the same combination of contracts.
Strategy 2 utilized the same rules as Strategy 1 but did not permit more than one spread in the same combination of contracts. Once a particular combination of contract montiis had been spread, no other similar investments were permitted.
Strategy 3 involved retesting Strategy 1 subject to maximum holding periods. In other words, all combinations of contracts were spread, as long as the price premium exceeded the alpha requirement, and as long as the investment would not be held for more dian some predetermined number of weeks. Multiple holdings of the same spread were again permitted under Strategy 3.
All three strategies are purely mechanical in nature. No assumption is made about die "fairness" of current price levels of the commodity contracts nor about the direction of prices in the future.
Results and Biases of the Study
The results indicate that spreading in frozen pork bellies would have resulted in positive returns under almost every variation of all diree strategies. A total of 198 different variations were tested and negative results
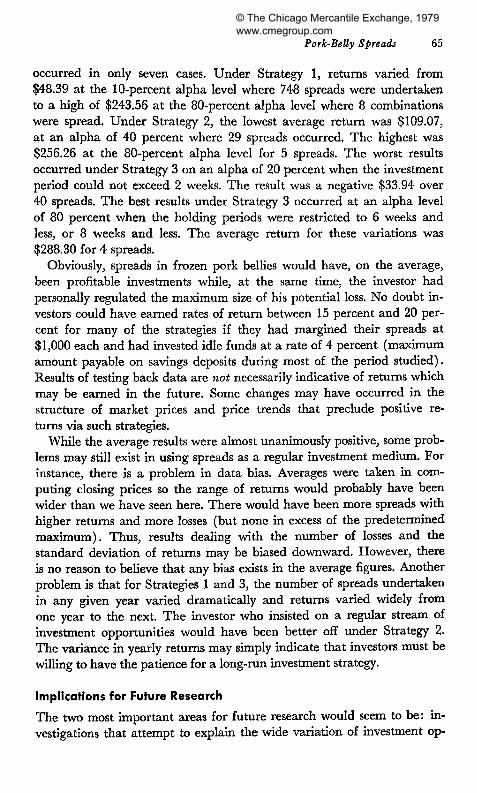
occurred in only seven cases. Under Strategy 1, returns varied from $48.39 at the 10-percent alpha level where 748 spreads were undertaken to a high of $243.56 at die 80-percent alpha level where 8 combinations were spread. Under Strategy 2, the lowest average return was $109.07, at an alpha of 40 percent where 29 spreads occurred. The highest was $256.26 at the 80-percent alpha level for 5 spreads. The worst results occurred under Strategy 3 on an alpha of 20 percent when die investment period could not exceed 2 weeks. The result was a negative $33.94 over 40 spreads. The best results under Strategy 3 occurred at an alpha level of 80 percent when die holding periods were restricted to 6 weeks and less, or 8 weeks and less. The average return for these variations was $288.30 for 4 spreads.
Obviously, spreads in frozen pork bellies would have, on the average, been profitable investments while, at the same time, the investor had personally regulated the maximum size of his potential loss. No doubt investors could have earned rates of return between 15 percent and 20 percent for many of the strategies if they had margined their spreads at $1,000 each and had invested idle funds at a rate of 4 percent (maximum amount payable on savings deposits during most of the period studied). Results of testing back data are not necessarily indicative of returns which may be earned in the future. Some changes may have occurred in die structure of market prices and price trends diat preclude positive returns via such strategies.
While the average results were almost unanimously positive, some problems may still exist in using spreads as a regular investment medium. For instance, there is a problem in data bias. Averages were taken in computing closing prices so the range of returns would probably have been wider than we have seen here. There would have been more spreads witii higher returns and more losses (but none in excess of the predetermined maximum). Thus, results dealing with the number of losses and die standard deviation of returns may be biased downward. However, there is no reason to believe that any bias exists in the average figures. Anodier problem is that for Strategies 1 and 3, die number of spreads undertaken in any given year varied dramatically and returns varied widely from one year to the next. The investor who insisted on a regular stream of investment opportunities would have been better off under Strategy 2. The variance in yearly returns may simply indicate that investors must be willing to have the patience for a long-run investment strategy.
Implications for Future Research
The two most important areas for future research would seem to be: investigations that attempt to explain the wide variation of investment op-
portunities over the 7V4 year period and diose diat can explain the variance in profitability from one year to the next. Also, it would be interesting to see if general results found here for frozen pork bellies are indicative of opportunities for profitable investment in spreads in other commodities or across other commodities such as spreads between frozen pork bellies and contracts in hogs. Finally, a study of the historical returns on reverse spreads could prove interesting.
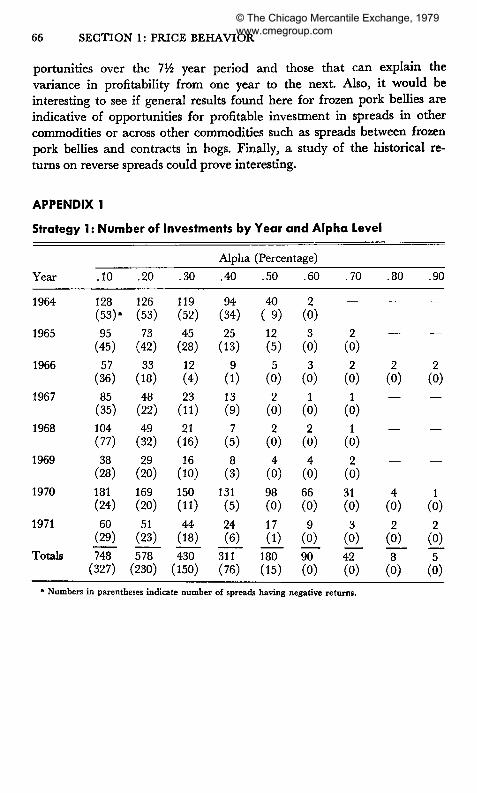
APPENDIX 1
Strategy 1: Number of Investments by Year and Alpha Level
Year
1964
1965
1966
1967
1968
1969
1970
1971
Totals
.10
128 (53)'
95 (45)
57 (36)
85 (35)
104 (77)
CO
C
O
CO
C
M
181 (24)
60 (29)
748 (327)
.20
126 (53)
73 (42)
33 (18)
CO
C
M
•*
C
M
49 (32)
29 (20)
169 (20)
51 (23)
578 (230)
.30
119 (52)
45 (28)
12 (4)
23
(ID 21 (16)
16 (10)
150 (11)
44 (18)
430 (150)
Alpha
.40
94 (34)
25 (13)
9 (1)
13 (9) 7 (5)
8 (3)
131 (5)
24 (6)
311 (76)
(Percentage)
.50
40 (9) 12 (5)
5 (0)
2 (0)
2 (0)
4 (0)
98 (0)
17 (1)
180 (15)
.60
2 (0)
3 (0)
3 (0)
1 (0)
2 (0)
4 (0)
66 (0)
9 (0)
90 (0)
.70
—
2 (0)
2 (0)
1 (0)
1 (0)
2 (0)
31 (0)
3 (0)
42 (0)
.80
—
—
2 (0)
—
—
—
4 (0)
2 (0)
8 (0)
.90
—
—
2 (0)
—
—
—
1 (0)
2 (0)
5 (0)
* Numbers in parentheses indicate number of spreads Having negative returns.