+ All Categories
Home > Documents > APPLICATION FOR CEQA STREAMLINING GHG EMISSIONS ...€¦ · 20/3/2019  · Attendance estimates for...

APPLICATION FOR CEQA STREAMLINING GHG EMISSIONS ...€¦ · 20/3/2019  · Attendance estimates for...

Date post: 22-Jul-2020
Category:
Upload: others
View: 1 times
Download: 0 times
Share this document with a friend
217
Prepared for California Air Resources Board Sacramento, California Prepared by Ramboll US Corporation San Francisco, California Date March 15, 2019 APPLICATION FOR CEQA STREAMLINING GHG EMISSIONS METHODOLOGY AND DOCUMENTATION OAKLAND ATHLETICS OAKLAND SPORTS AND MIXED-USE PROJECT HOWARD TERMINAL OAKLAND, CALIFORNIA
Transcript

Prepared for California Air Resources Board Sacramento, California

Prepared by Ramboll US Corporation San Francisco, California

Date March 15, 2019

APPLICATION FOR CEQA STREAMLINING GHG EMISSIONS METHODOLOGY AND DOCUMENTATION OAKLAND ATHLETICS OAKLAND SPORTS AND MIXED-USE PROJECT HOWARD TERMINAL OAKLAND, CALIFORNIA

Application for CEQA Streamlining GHG Emissions Methodology and Documentation

Oakland Sports and Mixed-Use Project

Contents i Ramboll

CONTENTS

1. INTRODUCTION 1 1.1 Project Description 1 1.1.1 Existing Conditions 1 1.1.2 Proposed Project 2 1.1.3 Proposed Project Variants 5 1.1.4 Project Phasing and Emissions Sources 5

2. ONE-TIME CONSTRUCTION GHG EMISSIONS 8 2.1 Construction Phasing 8 2.2 Construction-Related GHG Emissions 10 2.2.1 Emissions from Diesel-Fueled Construction Equipment 10 2.2.2 Emissions from On-Road Construction Trips 10 2.3 Summary of Construction GHG Emissions 11

3. OPERATIONAL GHG EMISSIONS FROM BASELINE CONDITIONS 13 3.1 Mobile 14 3.1.1 Spectators and Event Staff 14 3.1.2 Employees 14 3.2 Energy 15 3.3 Water and Wastewater 15 3.4 Solid Waste Disposal 16 3.5 Area Sources 16 3.6 Back-Up Generators 16

4. OPERATIONAL GHG EMISSIONS FROM PROPOSED PROJECT CONDITIONS 17 4.1 Mobile 20 4.1.1 Ballpark and Performance Venue 20 4.1.1.1 Spectators and Event Staff 20 4.1.1.2 Employees 21

4.1.2 Ancillary Development Visitors 21 4.2 Energy 21 4.3 Water and Wastewater 22 4.4 Solid Waste Disposal 22 4.5 Area Sources 23 4.6 Back-Up Generators 23

5. MEASURES FOR OFFSETTING NET INCREASE GHG EMISSIONS 24 5.1 Project Year-by-Year Emissions 24 5.2 Net New Project Emissions and AB734 Requirements 27 5.3 Phased Calculation of No Net Additional GHG Emissions 29

Application for CEQA Streamlining GHG Emissions Methodology and Documentation

Oakland Sports and Mixed-Use Project

Contents ii Ramboll

TABLES

Table 1: Existing and Proposed Land Uses

Table 2: Proposed Project Phasing Plan

Table 3: Construction and Operational Timeline

Table 4: Emissions Sources

Table 5: Construction GHG Emissions

Table 6: Existing Conditions Emissions Summary (2020)

Table 7: Project 1.0 Operational Emissions for Full Built-Out Year (2028)

Table 8: Project 2.0 Operational Emissions for Full Built-Out Year (2028)

Table 9: Emissions Reductions and Offsets Summary

Table 10: Year-by-Year Comparison of GHG Emissions

APPENDICES

Appendix 1: Construction and Operations Supporting Tables

Appendix 2: CalEEMod® Output Files

Appendix 3: Fehr & Peers VMT Tables

Appendix 4: Additional Supporting Information

Proposed AB734 GHG Emissions Methodology Oakland Sports and Mixed-Use Project

Operational GHG Emissions from Proposed Project Conditions 1 Ramboll

1. INTRODUCTION

The proposed Oakland Sports and Mixed-Use Project at Howard Terminal (herein referred to as the “Project”) is planning to apply for California Environmental Quality Act (CEQA) judicial streamlining under Public Resources Code (PRC) Section 21168.6.7 et seq. In support of the Application, Ramboll quantified direct and indirect greenhouse gas emissions associated with the Project’s construction and operation, to show that the Project meets the requirement for no “net additional emission of greenhouse gases [GHG], including greenhouse gas emissions from employee transportation,” where 50 percent of the GHG emissions reductions for nonresidential uses are from local, direct GHG emissions reductions that give consideration to criteria air pollutant and toxic air contaminant emissions reductions, including, but not limited to, any of the following:

(I) Project design features or onsite reduction measures, or both design features and onsite reduction measures.

(II) Off-site reduction measures in the neighboring communities.

This document summarizes the assumptions and calculation methodologies Ramboll used to estimate GHG emissions. Ramboll quantified potential operational GHG emissions for the Project as well as the Project’s one-time emissions due to construction. Additionally, Ramboll quantified the GHG emissions associated with displaced activity at the Oakland Coliseum, noting that these represent avoided GHG emissions due to redevelopment of the Howard Terminal Site and the existing Coliseum stadium. Finally, a comparison between the Project GHG emissions (disaggregated between residential and nonresidential land uses, and projected year-by-year out to 30 years following a net increase in GHG emissions) and avoided GHG emissions is presented to demonstrate that the Project meets the GHG emissions requirements for AB734 CEQA streamlining.

Throughout this report, GHG emissions are reported in units of metric tons of carbon dioxide equivalents (MT CO2e). Carbon dioxide equivalents are emissions of carbon dioxide, methane (CH4), and nitrous oxide (N2O), weighted by the global warming potentials (GWP) from Title 40 of the Code of Federal Regulations (CFR), Part 98, Table A-1, as referenced by the California Mandatory Reporting Rule for GHG (Title 17 of the California Code of Regulations, §§95100-95158).

1.1 Project Description 1.1.1 Existing Conditions

The Athletics, a Major League Baseball (MLB) team, currently play at the Oakland-Alameda County Coliseum, which is located in the Coliseum Area Specific Plan area between East Oakland and the Oakland International Airport. The facility also currently hosts non-A’s events, including National Football League (NFL) football games and other special events (e.g. Motocross and Monster Jam exhibitions). Upon the Athletics’ departure from the Coliseum, the existing facilities will lose the anchor tenant and likely be demolished. Thus, a permanent reduction in emissions potential from all events is anticipated. The Athletics team headquarters is located at Jack London Square, adjacent to the proposed Project site.

The Howard Terminal 55-acre site is currently the Port of Oakland’s Charles P. Howard Terminal and adjacent parcels, located along the Inner Harbor of the Oakland-Alameda Estuary. The site is bound by the Oakland Estuary Middle Harbor on the south, Jack London Square on the east, Union Pacific railroad tracks and the Embarcadero on the

Proposed AB734 GHG Emissions Methodology Oakland Sports and Mixed-Use Project

Operational GHG Emissions from Proposed Project Conditions 2 Ramboll

north, and a metal recycling company (Schnitzer Steel) on the west. The site was used by the Port of Oakland as a shipping container terminal until 2014 and is currently used for truck parking, loaded and empty container storage and staging, and longshore training facilities. The Port of Oakland and Athletics are gathering information on Port functions and projected growth, however, for the purposes of this analysis, it is conservatively assumed that prior to commencing Project construction all Port uses would be relocated to other parts of the Port’s property or to other off-Port locations in the region. Thus, no operational GHG emissions credit is assumed from the existing Howard Terminal conditions associated with the Port of Oakland. This assumption may be revisited if additional information is gathered on this point.

Existing land uses are shown in Table 1 below.

1.1.2 Proposed Project The Proposed Project is a mixed-use Waterfront Ballpark District development with the following project elements:

• Demolish existing buildings on the Project Site, except the existing power plant and the existing container cranes, which may be retained;

• Address any hazardous materials that may be present on the Project Site; • Construct:

o A new privately funded, open-air, approximately 35,000-person capacity Major League Baseball park;

o Up to 3,000 residential units of varying affordability and types o Approximately 1.77 million square feet of adjacent mixed use development,

including retail, commercial, office, cultural, entertainment, flex light industrial/manufacturing, and recreational uses;

o A performance venue with a capacity of up to 3,500 individuals; o A 400-room hotel; o New and expanded utility infrastructure; and o New signage and lighting;

• Construct/provide improved access from the surrounding neighborhood and regional transportation networks, which could include, but may not be limited to:

o an expanded shuttle and/or bus service (“rubber-tire trams”); and o a new network of public streets and sidewalks that provide connectivity to

and through the Project Site, and pathways that lead directly to the waterfront and related amenities.

• Construct/provide new waterfront public access, enhanced water views, and on-site open space;

• Comply with Assembly Bill (AB) 734 regarding implementation of sustainability measures, development of a LEED Gold ballpark, and no net increase of greenhouse gas (GHG) emissions; and

• Phase development of the proposed Project, with a target completion date of Spring 2023 for construction of Phase 1, including the ballpark, hotel, up to 540 residential units, up to 250,000 square feet of office, up to 30,000 square feet of retail, an approximately 400 room hotel and associated infrastructure.

Attendance estimates for MLB games, NFL games, and other events were provided by the Project Sponsor. For MLB games, an attendance of 35,000 attendees per game was used for both the Baseline and Project scenarios. The proposed ballpark at Howard Terminal will have a capacity of 35,000 attendees. It is conservative to assume full-

Proposed AB734 GHG Emissions Methodology Oakland Sports and Mixed-Use Project

Operational GHG Emissions from Proposed Project Conditions 3 Ramboll

capacity usage of 35,000 seats at Howard Terminal. If the Athletics do not proceed with building a new ballpark at Howard Terminal, they will either refurbish the existing 47,170 seat ballpark or construct a new replacement ballpark of 35,000-39,000 seats (as set forth in the approved Coliseum City Specific Plan and certified Environmental Impact Report).1 It is assumed that with similarly attractive facilities the determining factors for attendance will be team performance and fan loyalty, which suggests that attendance will be the same at both facilities.

It was assumed that the Athletics game schedule would not shift substantially from current Coliseum activity, which typically includes 41 weekday evening, 14 weekday day, and 27 weekend games. For other events, it was assumed that the ballpark would host nine concerts with a maximum of 28,000 attendees, 100 corporate or community events with a maximum of 2,000 attendees, 16 plaza events with a maximum of 4,000 attendees, and 35 other events with a maximum of 7,500 attendees per year (for a total of approximately 778,500 attendees annually).

Detailed GHG emissions estimation methodologies for the Proposed Project are described in greater detail in Section 3. Baseline and Proposed land uses are shown in Table 1.

1 City of Oakland. 2015. Coliseum Area Specific Plan. Available online:

http://www.oaklandnet.com/coliseumcity/.

Proposed AB734 GHG Emissions Methodology Oakland Sports and Mixed-Use Project

Operational GHG Emissions from Proposed Project Conditions 4 Ramboll

Table 1: Baseline and Proposed Land Uses

Land Use Type

Baseline Project

Coliseum Jack London Square

Howard Terminal1

Ballpark Uses

MLB Uses

square feet 1,400,000 - 1,200,000

capacity 47,170 - 35,000

attendees 2,870,000 - 2,870,000

NFL Uses attendees 490,000 - -

Other Events attendees 95,000 - 779,000

A's Headquarters2 square feet - 40,000 -

Parking spaces 10,000 - 2,000

Non-Ballpark Uses

Office square feet - - 1,500,000

Retail3 square feet - - 270,000

Residential units - - 3,000

square feet - - 3,300,000

Performance Venue

square feet - - 50,000

seats 3,500

Hotel square feet - - 280,000

rooms - - 400

Parking Garages spaces - - 6,900

Notes 1. The land use program at Howard Terminal will also include interim surface parking. As

interim parking will be replaced during phased development, it is not included in this analysis.

2. The Athletics headquarters is anticipated to move from its present location in Jack London Square to the new Howard Terminal ballpark land use and is therefore not separately listed under the Project scenario.

3. Proposed retail uses are approximately 90,000 GSF food and beverage, 90,000 GSF entertainment (theater, bowling alley, gaming, etc.), and 90,000 GSF soft goods retail including food retail.

Abbreviations: GSF - gross square footage MLB - Major League Baseball NFL - National Football League

Proposed AB734 GHG Emissions Methodology Oakland Sports and Mixed-Use Project

Operational GHG Emissions from Proposed Project Conditions 5 Ramboll

1.1.3 Proposed Project Variants The Proposed Project may also consider one or more variants or options, potentially including but not limited to:

• New elevated pedestrian connections over the railroad tracks and improvements to existing at-grade crossings;

• An aerial tram or gondola above Washington Street extending from downtown Oakland near 12th Street BART to Jack London Square;

• Development of a portion of an existing power plant and removal of adjacent tanks;

• Altered edge configuration of the existing wharf to enhance public views and provide additional boat access/active water uses; and/or

• Extension of Embarcadero West to Middle Harbor Road and a new ramp from the existing Adeline Street overpass for new direct access to the Project Site.

• Removal of the existing shipping container cranes on the Project Site.

• Development of the lot located at Embarcadero and Clay Street.

GHG emissions from these variants are conservatively not included in the overall emissions estimates, as any differences from the Proposed Project are anticipated to be negligible or a net reduction. If implemented, all Project Variants will potentially result in increased one-time construction emissions. However, these increases are anticipated to be minimal relative to the overall lifetime GHG emissions. If variants are ultimately implemented as part of the Project, the Project Sponsor will calculate emissions to take into consideration those implemented elements either as part of the Project emissions profile or as offsets to emissions, as described in Section 5 below.

1.1.4 Project Phasing and Emissions Sources For the purpose of this assessment, GHG emissions are estimated for the Project’s construction and operational lifetime. Ramboll proposes to estimate emissions for each year of construction, beginning in 2020, and operations, beginning in 2023. Phased emissions are estimated assuming build-out of Phase 1 development (the MLB ballpark and some ancillary development) in 2023 and build-out of Phase 2 development (remaining ancillary development) in 2027.

As the phasing of Project and variant implementation is subject to changes based on market conditions and other unanticipated factors, construction and operations could be extended beyond the anticipated buildout schedule. However, for the purposes of the AB734 analysis, it is assumed that the phasing schedule provided here represents an accelerated phasing schedule for the Project for the purposes of conservatively assessing impacts, and that construction would most likely not occur at a more rapid pace than is analyzed. As described further below, GHG emission factors are lower in later years with improved vehicle efficiency and higher renewable electricity generation; therefore, emissions would be lower if the schedule was extended.

Table 2 show the preliminary phasing plan.

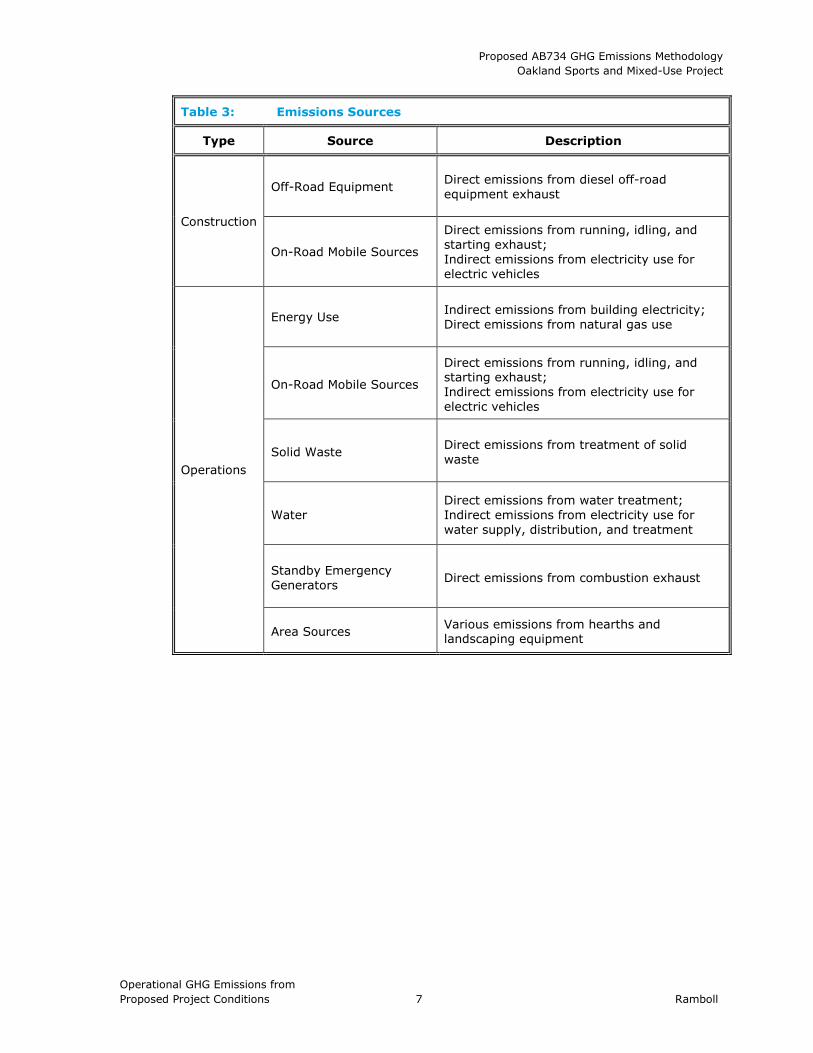
Table 3 lists the sources for which GHG emissions from the Project are quantified as well as the methodologies that were used. Detailed calculations of one-time construction emissions and annual operational emissions will be further explained in Sections 2 and 3.

Proposed AB734 GHG Emissions Methodology Oakland Sports and Mixed-Use Project

Operational GHG Emissions from Proposed Project Conditions 6 Ramboll

Table 2: Proposed Project Phasing Plan

Land Use Type

Phase 1 Ballpark and Initial

Ancillary Development

Phase 2 Additional Ancillary

Development

Construction from 2020-2023 Operations begin in 2023

Construction from 2023-2027 Operations begin in 2027

Ballpark square feet 1,200,000 -

Ballpark Parking spaces - 2,000

Office square feet 250,000 1,250,000

Retail square feet 30,000 240,000

Residential units 540 2,460

Performance Venue square feet - 50,400

Hotel square feet 280,000 -

Other Parking Garages

spaces 1,240 5,660

Notes 1. Phasing plan provided by Project sponsor and represents a reasonable and accelerated phasing

schedule for the purposes of conservatively assessing impacts. 2. Interim parking associated with the Phase 1 Ballpark development is not quantified in this

analysis, as it is replaced by other land uses in later phases of development.

Proposed AB734 GHG Emissions Methodology Oakland Sports and Mixed-Use Project

Operational GHG Emissions from Proposed Project Conditions 7 Ramboll

Table 3: Emissions Sources

Type Source Description

Construction

Off-Road Equipment Direct emissions from diesel off-road equipment exhaust

On-Road Mobile Sources

Direct emissions from running, idling, and starting exhaust; Indirect emissions from electricity use for electric vehicles

Operations

Energy Use Indirect emissions from building electricity; Direct emissions from natural gas use

On-Road Mobile Sources

Direct emissions from running, idling, and starting exhaust; Indirect emissions from electricity use for electric vehicles

Solid Waste Direct emissions from treatment of solid waste

Water Direct emissions from water treatment; Indirect emissions from electricity use for water supply, distribution, and treatment

Standby Emergency Generators Direct emissions from combustion exhaust

Area Sources Various emissions from hearths and landscaping equipment

Proposed AB734 GHG Emissions Methodology Oakland Sports and Mixed-Use Project

Operational GHG Emissions from Proposed Project Conditions 8 Ramboll

2. ONE-TIME CONSTRUCTION GHG EMISSIONS

Construction of the Proposed Project will generate “one-time” emissions, that is, discrete emissions that are not associated with ongoing Project operations. These emissions are quantified and disclosed for the Proposed Project. Methodologies for quantifying construction GHG emissions are detailed in the following sections.

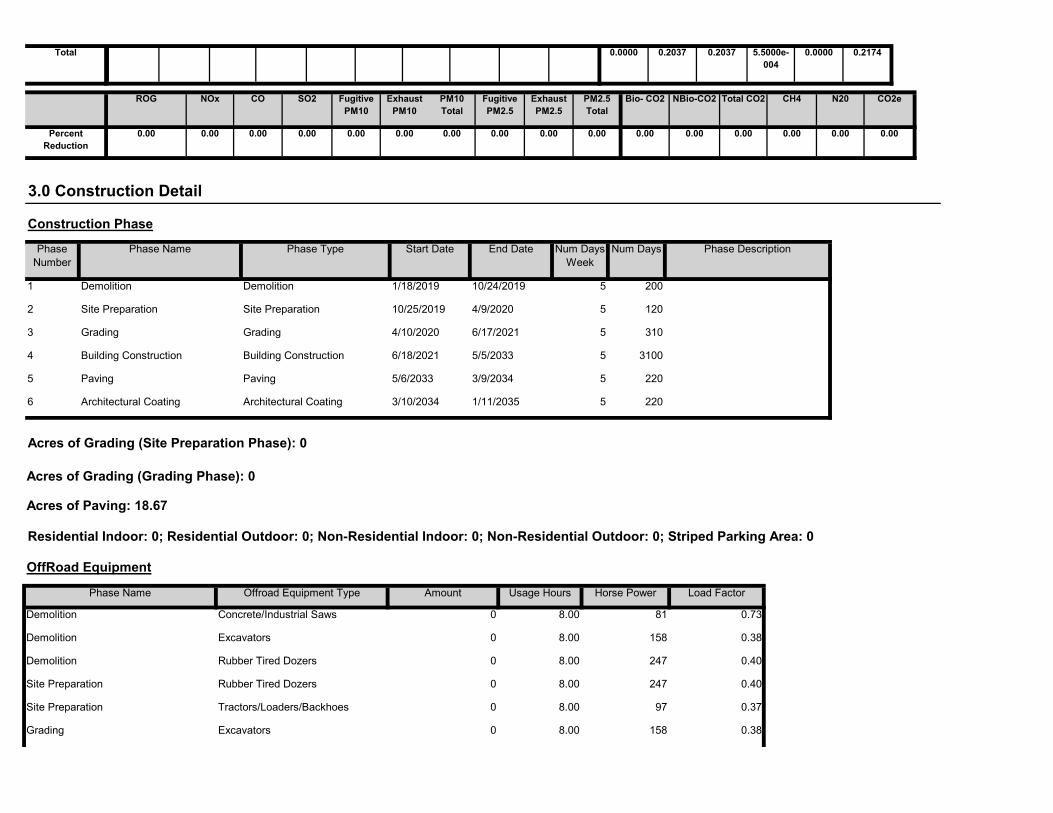
2.1 Construction Phasing The Proposed Project will be constructed in two or more development phases or subphases with full buildout expected to occur approximately seven or more years after project entitlements.

This analysis conservatively assumes that there will be as few as two phases, that the complete build out would occur in as few as seven years and that the buildings constructed in each phase of the construction program (i.e., Phase 1 or Phase 2) would be occupied and fully operational as soon as construction of each phase is completed. This is conservative because occupancy and operation of each phase would likely ramp up over time, rather than upon completion of construction. The analysis also assumes that operational emissions from a phase can overlap with construction emissions from subsequent phases and is conservative because it assumes only two phases, rather than several phases or subphases, all of which are conservatively estimated to be completed in approximately 7 years.

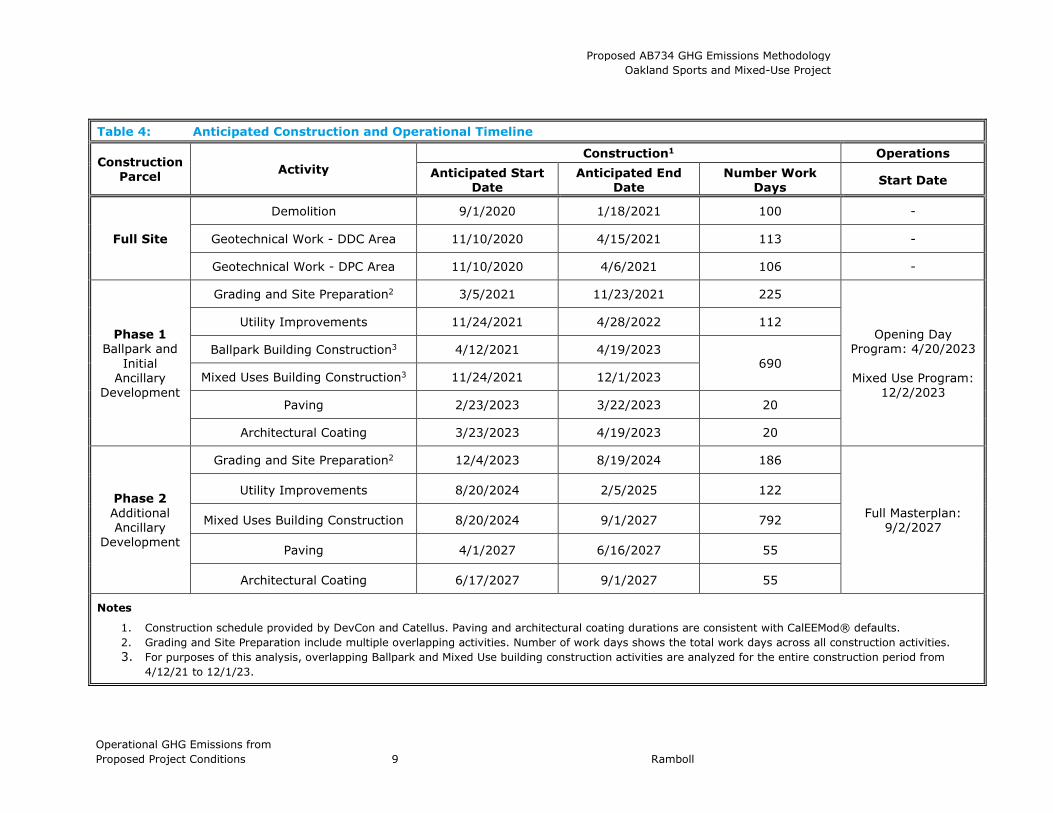
The first phase of the construction program would commence after all existing uses have vacated. The preliminary construction schedule assumes that construction would start in 2020, that it would last approximately seven years or longer, and that it would take place for five days per week with different equipment operating for different hours. See Table 4 for a summary of the expected construction phasing timeline, provided by the Project sponsor.

Initial construction activities affecting the full site area include demolition of the existing Howard Terminal buildings and parking lots, followed by geotechnical work. Construction activities related to Phase 1 land uses (the ballpark and initial ancillary development) include grading, site preparation, and site utility upgrades, followed by building construction. Construction activities related to Phase 2 land uses (the remaining ancillary development) would include the same activities for the remaining mixed-use development.

Proposed AB734 GHG Emissions Methodology Oakland Sports and Mixed-Use Project

Operational GHG Emissions from Proposed Project Conditions 9 Ramboll

Table 4: Anticipated Construction and Operational Timeline

Construction Parcel Activity

Construction1 Operations Anticipated Start

Date Anticipated End

Date Number Work

Days Start Date

Full Site

Demolition 9/1/2020 1/18/2021 100 -

Geotechnical Work - DDC Area 11/10/2020 4/15/2021 113 -

Geotechnical Work - DPC Area 11/10/2020 4/6/2021 106 -

Phase 1 Ballpark and

Initial Ancillary

Development

Grading and Site Preparation2 3/5/2021 11/23/2021 225

Opening Day Program: 4/20/2023

Mixed Use Program:

12/2/2023

Utility Improvements 11/24/2021 4/28/2022 112

Ballpark Building Construction3 4/12/2021 4/19/2023 690

Mixed Uses Building Construction3 11/24/2021 12/1/2023

Paving 2/23/2023 3/22/2023 20

Architectural Coating 3/23/2023 4/19/2023 20

Phase 2 Additional Ancillary

Development

Grading and Site Preparation2 12/4/2023 8/19/2024 186

Full Masterplan: 9/2/2027

Utility Improvements 8/20/2024 2/5/2025 122

Mixed Uses Building Construction 8/20/2024 9/1/2027 792

Paving 4/1/2027 6/16/2027 55

Architectural Coating 6/17/2027 9/1/2027 55

Notes

1. Construction schedule provided by DevCon and Catellus. Paving and architectural coating durations are consistent with CalEEMod® defaults. 2. Grading and Site Preparation include multiple overlapping activities. Number of work days shows the total work days across all construction activities. 3. For purposes of this analysis, overlapping Ballpark and Mixed Use building construction activities are analyzed for the entire construction period from

4/12/21 to 12/1/23.

Proposed AB734 GHG Emissions Methodology Oakland Sports and Mixed-Use Project

Operational GHG Emissions from Proposed Project Conditions 10 Ramboll

2.2 Construction-Related GHG Emissions Construction emissions include emissions from both off-road construction equipment and on-road construction vehicles, including haul trucks, vendor, and worker trips.

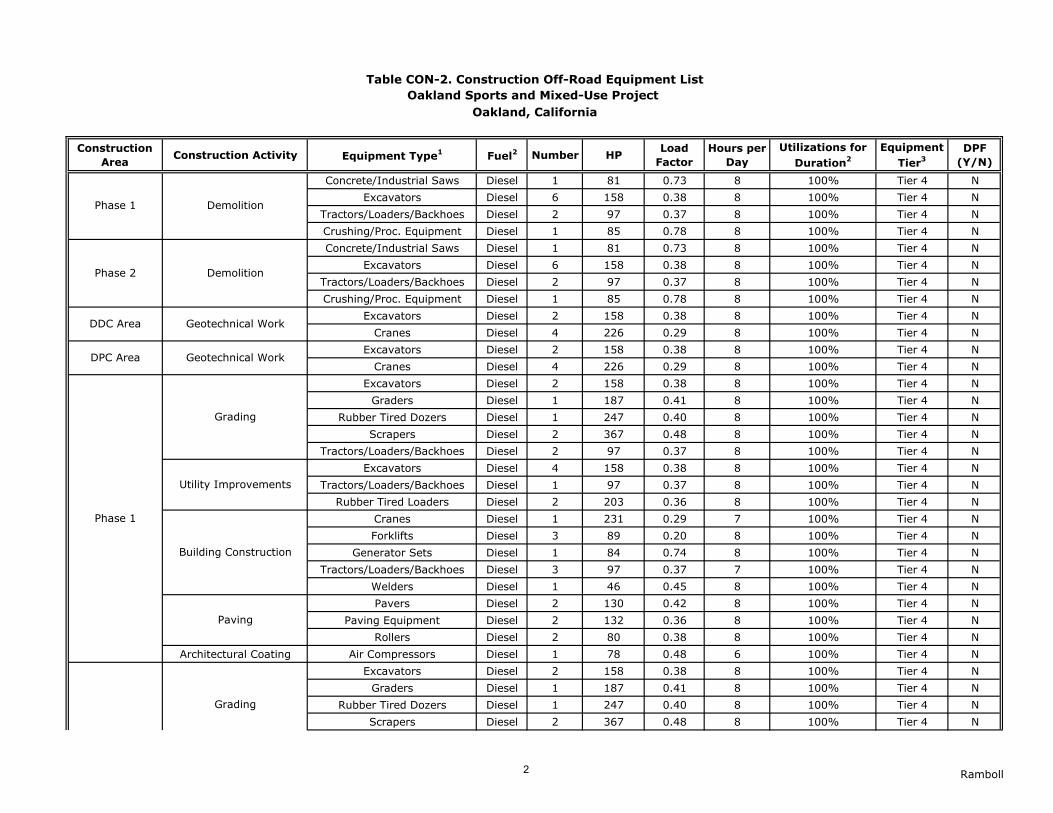
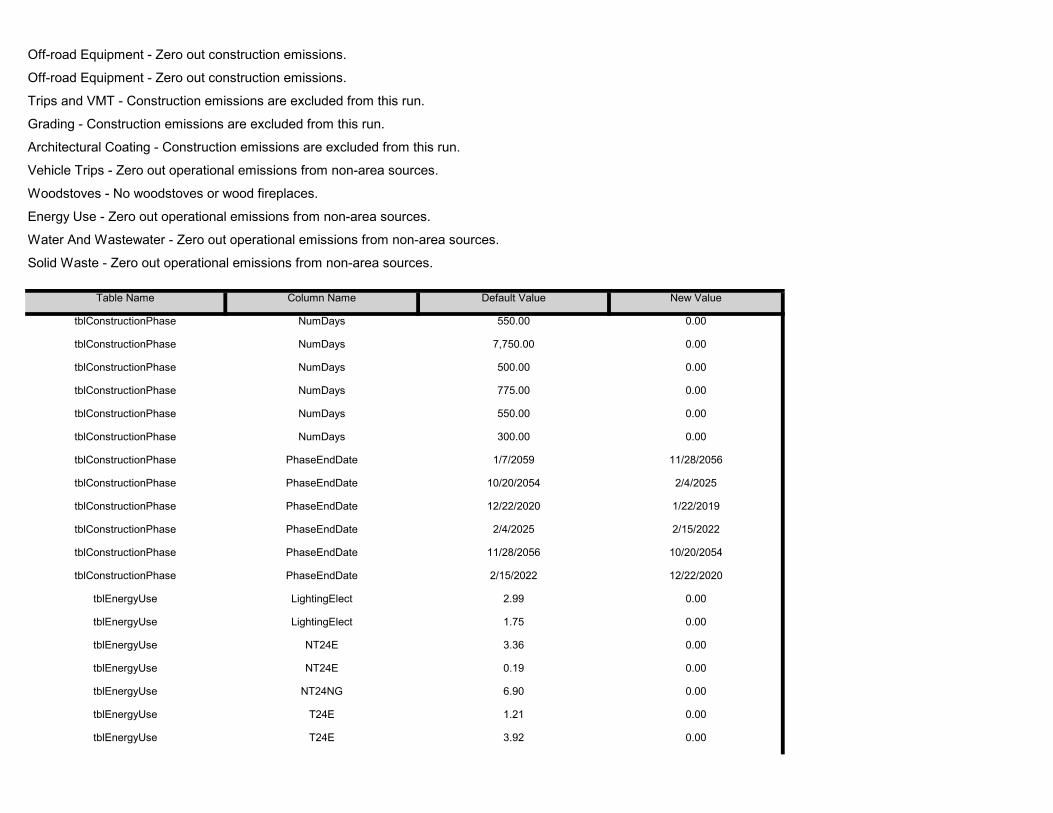
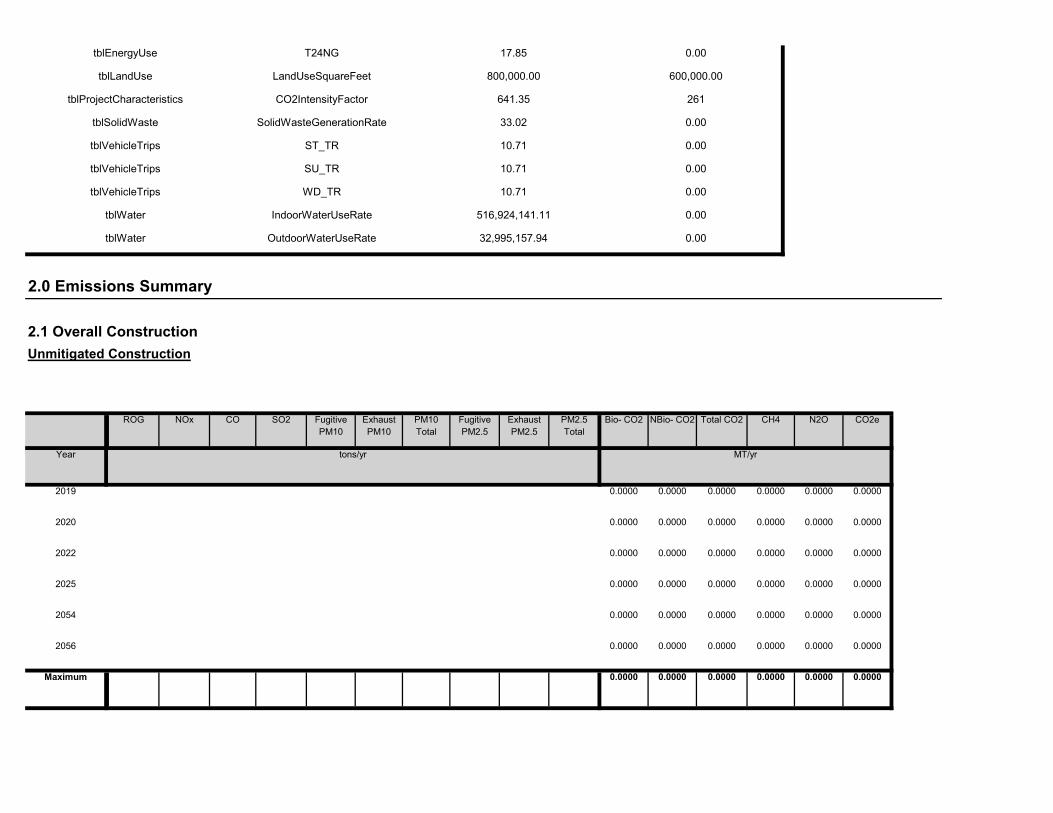
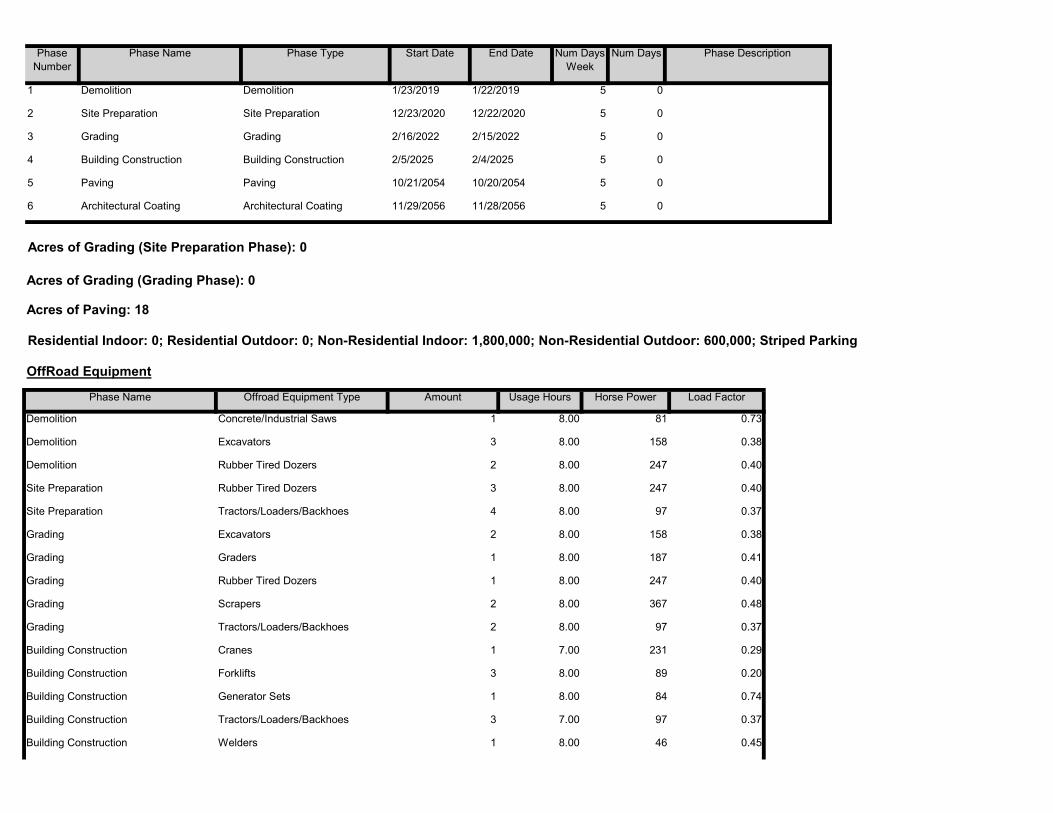
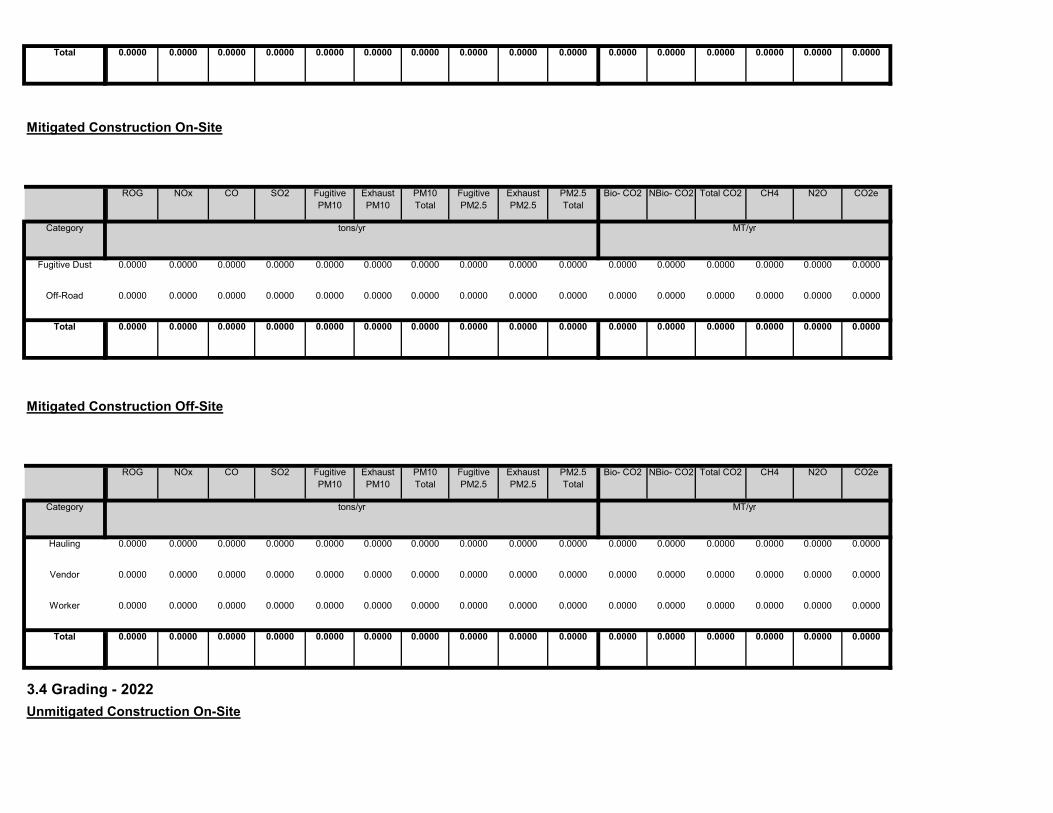
2.2.1 Emissions from Diesel-Fueled Construction Equipment Emissions calculations associated with off-road construction equipment are based on the construction schedule, type and quantity of equipment and hours of operation for each piece of equipment based on Project-specific information provided by the project sponsor for demolition, geotechnical work, grading and site preparation, and utility upgrade installation and CalEEMod® defaults for building construction, architectural coating, and paving.2 GHG emissions from off-road construction equipment are estimated using methodologies consistent with the California Emissions Estimator Model (CalEEMod®) version 2016.3.2. All off-road equipment is to be diesel-fueled and have Tier 4 engines, consistent with the requirements in the City of Oakland’s Standard Conditions of Approval.3 Emissions associated with diesel fuel include only running exhaust emissions since starting emissions are assumed to be minimal for diesel-fueled equipment. Exhaust emissions calculations are based on California Air Resources Board’s (CARB’s) OFFROAD 2011 methodology as below:

𝐸𝐸𝐶𝐶 = �(𝐸𝐸𝐸𝐸𝐶𝐶 ∗ 𝐻𝐻𝐻𝐻 ∗ 𝐿𝐿𝐸𝐸 ∗ 𝐻𝐻𝐻𝐻 ∗ 𝐶𝐶)

Where:

EC: off-road equipment exhaust emissions in pounds (lbs.)

EFC: emission factor (g/bhp-hr). Emission factors for diesel equipment are

default CalEEMod emission factors

HP: equipment horsepower. Project-specific or CalEEMod defaults

LF: equipment load factor. Project-specific or CalEEMod defaults

Hr: equipment operating hours. Project-specific

C: unit conversion factor

GHG emissions for each year of construction will be calculated based on the overall construction duration for each activity in a given year. For the Phase 1, the default CalEEMod equipment list for building construction is applied for the duration of ballpark and mixed-use building construction (for a total of 690 days).

2.2.2 Emissions from On-Road Construction Trips On-road construction vehicles such as passenger vehicles for workers and vendors, and trucks for demolition material, soil, and other material hauling generate GHG emissions. These emissions are calculated based on the number of trips and vehicle miles traveled (VMT) along with emissions factors from Emission Factors Model (EMFAC2017). Trip counts are provided by the project sponsor for haul trips and CalEEMod® defaults are used for worker and vendor trip counts, as well as trip lengths for worker, vendors and

2 Bell, Joe, Webcor Builders, e-mail correspondence with Peter Mye at SWCA regarding construction data,

September 14, 2017. 3 City of Oakland. 2018. Standard Conditions of Approval.

Proposed AB734 GHG Emissions Methodology Oakland Sports and Mixed-Use Project

Operational GHG Emissions from Proposed Project Conditions 11 Ramboll

haul trips. Running emission factors include running exhaust and running losses estimated for the years 2020-2027. Running emissions are calculated as,

𝐸𝐸𝑅𝑅 = �(𝐸𝐸𝐸𝐸𝑅𝑅 ∗ 𝑉𝑉𝑉𝑉𝑉𝑉 ∗ 𝐶𝐶)

Where:

VMT or Vehicle Miles Traveled: Trip Length*Trip Number

EFR: running emission factor (g/mile) from EMFAC2014

C: unit conversion factor

On-road emissions also include exhaust emissions from vehicle idling. Idling emissions from EMFAC2017 are estimated only for heavy duty trucks since idling emissions occur during extended idling events for these trucks, and EMFAC2017 takes account of idling emissions from light duty vehicles and other vehicle types in running emissions estimates. Idling emissions are estimated as,

𝐸𝐸𝐼𝐼 = �(𝐸𝐸𝐸𝐸𝐼𝐼 ∗ 𝑉𝑉𝐻𝐻𝑇𝑇𝑇𝑇 𝑁𝑁𝑁𝑁𝑁𝑁𝑁𝑁𝑁𝑁𝐻𝐻)

Where:

EFI = vehicle idling emissions factor (g/trip) from EMFAC2017.

Trip Number = heavy duty truck trips provided by project sponsor

GHG emissions for each year of construction will be estimated based on the overall construction duration for each activity in a year.

2.3 Summary of Construction GHG Emissions The total emissions from construction are summarized in Table 5. Total GHG emissions from diesel off-road equipment and on-road trucks are approximately 3,860 and 24,120 MT CO2e, respectively. Total GHG emissions from construction activities are approximately 28,000 MT CO2e.

Proposed AB734 GHG Emissions Methodology Oakland Sports and Mixed-Use Project

Operational GHG Emissions from Proposed Project Conditions 12 Ramboll

Table 5: Construction GHG Emissions

Year Diesel Off-Road Equipment On-Road Trips Total CO2e Emissions (MT/year)

2020 301 14 315

2021 1,093 3,346 4,439

2022 467 3,016 3,483

2023 359 2,747 3,107

2024 720 2,375 3,095

2025 346 4,769 5,115

2026 303 4,653 4,956

2027 268 3,199 3,467

Total GHG Emissions from Construction (MT) 27,977

Notes 1. It is conservatively assumed for the purpose of this analysis that all construction off-road equipment will be diesel-fueled and is utilized for 100%

of the construction period. 2. Construction equipment list for the demolition, geotechnical work, and site utilities activities were provided by the Project sponsor. All other

activities utilize CalEEMod® default equipment types. 3. Worker and vendor trips for each activity are based on CalEEMod® defaults. Hauling trips for each activity were provided by the Project Sponsor. 4. CalEEMod® default trip lengths and fleet mix were used for each trip type.

Proposed AB734 GHG Emissions Methodology Oakland Sports and Mixed-Use Project

Operational GHG Emissions from Proposed Project Conditions 13 Ramboll

3. OPERATIONAL GHG EMISSIONS FROM BASELINE CONDITIONS

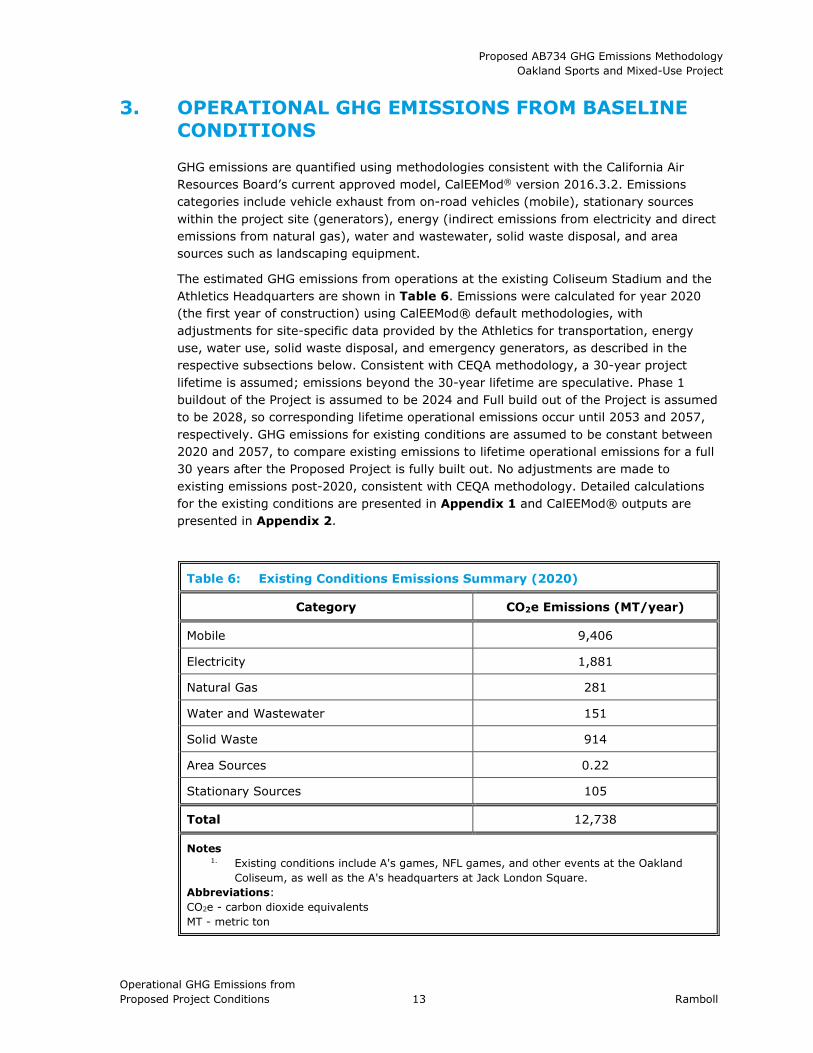
GHG emissions are quantified using methodologies consistent with the California Air Resources Board’s current approved model, CalEEMod® version 2016.3.2. Emissions categories include vehicle exhaust from on-road vehicles (mobile), stationary sources within the project site (generators), energy (indirect emissions from electricity and direct emissions from natural gas), water and wastewater, solid waste disposal, and area sources such as landscaping equipment.

The estimated GHG emissions from operations at the existing Coliseum Stadium and the Athletics Headquarters are shown in Table 6. Emissions were calculated for year 2020 (the first year of construction) using CalEEMod® default methodologies, with adjustments for site-specific data provided by the Athletics for transportation, energy use, water use, solid waste disposal, and emergency generators, as described in the respective subsections below. Consistent with CEQA methodology, a 30-year project lifetime is assumed; emissions beyond the 30-year lifetime are speculative. Phase 1 buildout of the Project is assumed to be 2024 and Full build out of the Project is assumed to be 2028, so corresponding lifetime operational emissions occur until 2053 and 2057, respectively. GHG emissions for existing conditions are assumed to be constant between 2020 and 2057, to compare existing emissions to lifetime operational emissions for a full 30 years after the Proposed Project is fully built out. No adjustments are made to existing emissions post-2020, consistent with CEQA methodology. Detailed calculations for the existing conditions are presented in Appendix 1 and CalEEMod® outputs are presented in Appendix 2.

Table 6: Existing Conditions Emissions Summary (2020)

Category CO2e Emissions (MT/year)

Mobile 9,406

Electricity 1,881

Natural Gas 281

Water and Wastewater 151

Solid Waste 914

Area Sources 0.22

Stationary Sources 105

Total 12,738

Notes 1. Existing conditions include A's games, NFL games, and other events at the Oakland

Coliseum, as well as the A's headquarters at Jack London Square. Abbreviations: CO2e - carbon dioxide equivalents MT - metric ton

Proposed AB734 GHG Emissions Methodology Oakland Sports and Mixed-Use Project

Operational GHG Emissions from Proposed Project Conditions 14 Ramboll

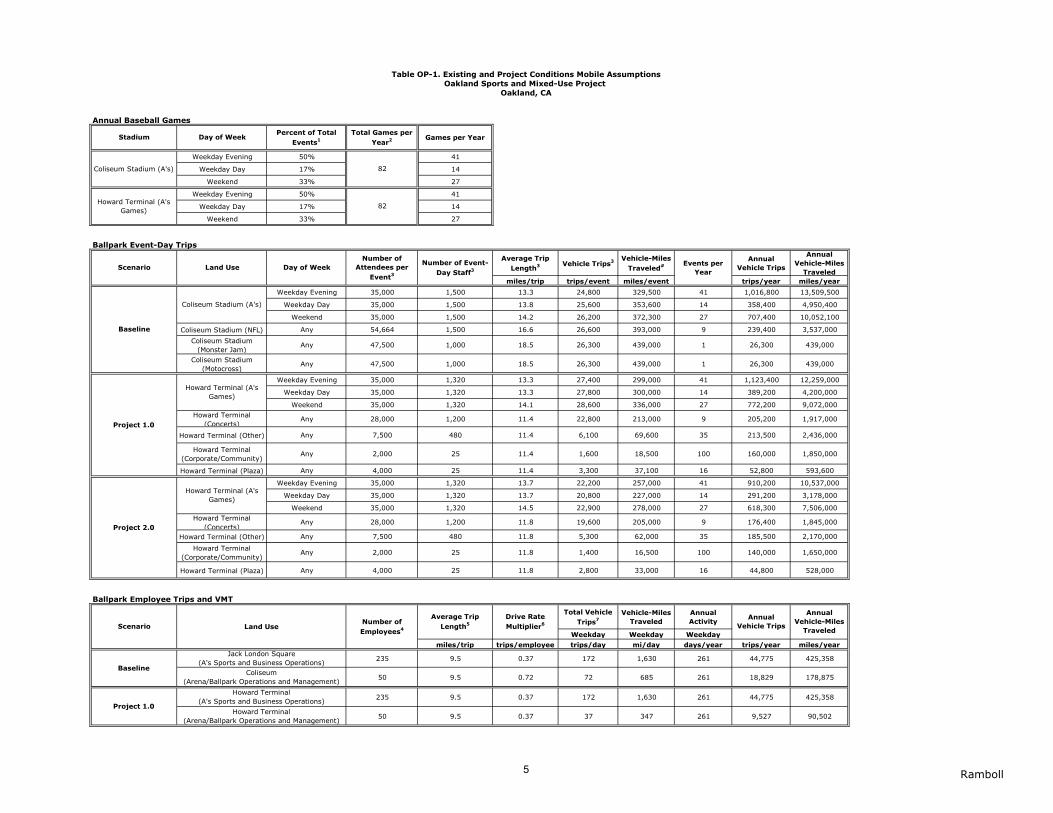
3.1 Mobile Mobile source emissions for the existing conditions include event-day trips related to MLB games, NFL games, and other events at the Coliseum, as well as commute trips by arena employees to the Coliseum and Athletics sports team management to the team headquarters in Jack London Square.

CalEEMod® methodology estimates mobile GHG emissions from running, idling, and starting exhaust for the aggregated projected vehicle fleet in a given calendar year and county. Emission factors for CO2, CH4, and N2O were obtained from ARB’s EMission FACtor model (EMFAC2017) for Alameda County.4 As on-road vehicle trips to the existing land uses are primarily passenger vehicles, the default Alameda County fleet mix was adjusted for a passenger fleet mix of light-duty autos, motorcycles, light-duty trucks, and medium-duty vehicles.

Calculation assumptions for mobile emissions are provided in Table OP-1 of Appendix 1.

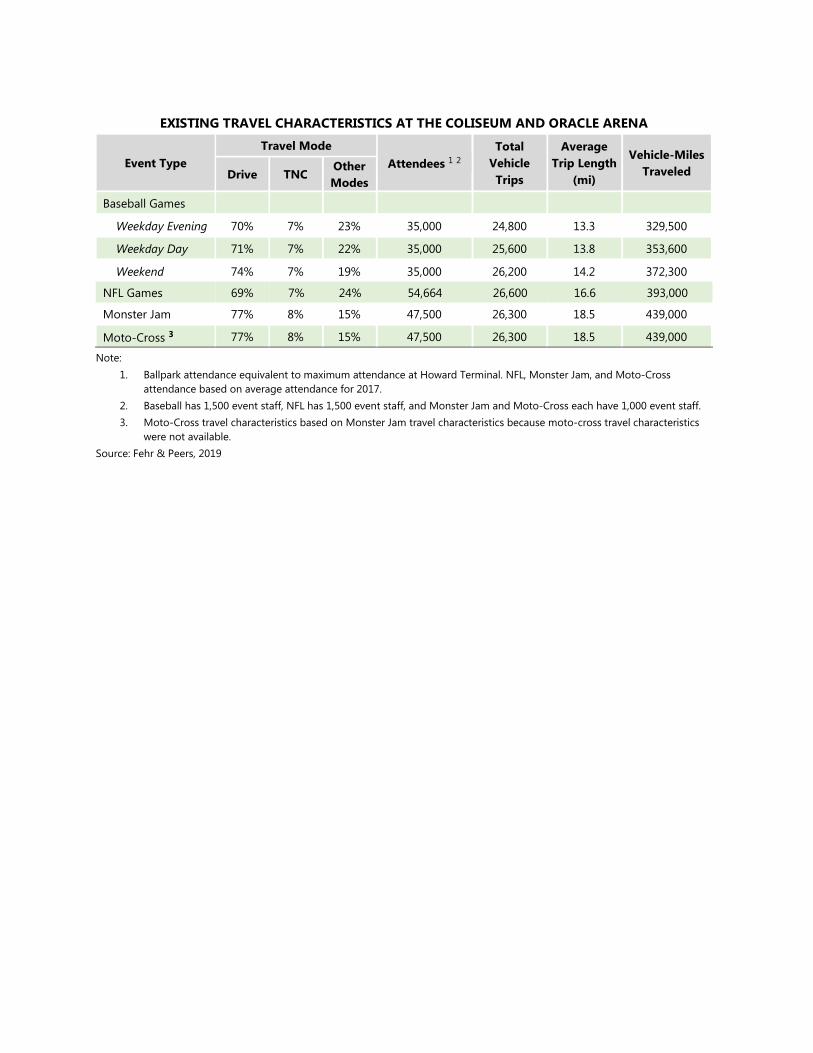
3.1.1 Spectators and Event Staff Mobile emissions associated with Coliseum spectators and event staff are estimated based on trip rates, mode split, trip lengths, and average vehicle occupancy provided in the site-specific vehicle trip reduction analysis and supplemental tables from Fehr & Peers, which are provided in Exhibit B of this application for AB734 streamlining and in Appendix 3, respectively.5,6 Ramboll assumed that trip characteristics for all spectator trips at the Coliseum are comparable to those associated with Athletics games.

The emissions for event spectator trips are the product of spectator trips per year, trip length, and passenger fleet average CO2e emission factors for Alameda County.

3.1.2 Employees Mobile source emissions associated with Coliseum event center management employees and Athletics sports team operation employees are based on site-specific employee estimates. Employee trips associated with NFL and other special event uses are conservatively excluded.

Bay Area Census data from 2013-2017 for the census tract containing the Oakland Coliseum show that 83.2% of commuters drive to work, and of those 63.7% commute alone and 19.5% commute in carpools of two, three, and four or more occupants. In the same dataset, for the census tract containing Jack London Square, census data shows that 40.2% of commuters drive to work, and of those 33.4% commute alone and 6.8% commute in carpools of two, three, and four or more occupants.7 Ramboll assumed that Coliseum employees and A’s HQ employees follow the drive rates specific to the relevant census tracts.

Employees were assumed to take one round-trip commute trip per day. The CalEEMod® default trip length of 9.5 miles was used for the employee commute trips. The emissions

4 CalEEMod® incorporates on-road vehicle emission factors from the prior release of this model, EMFAC2014.

Ramboll incorporated updated EMFAC2017 emission factors as it is the best available data. 5 Fehr & Peers. 2019. Howard Terminal Project AB 734 Analysis. February 8, 2019. 6 Fehr & Peers. 2019. Howard Terminal Project AB 734 VMT Tables. February 13, 2019. 7 American Community Survey. 2017. Selected Census Data for the San Jose-San Francisco-Oakland, CA

Combined Statistical Area. Available online at https://factfinder.census.gov/faces/nav/jsf/pages/index.xhtml

Proposed AB734 GHG Emissions Methodology Oakland Sports and Mixed-Use Project

Operational GHG Emissions from Proposed Project Conditions 15 Ramboll

for employee trips are the product of employee trips per year, length per trip, and passenger fleet average CO2e emission factors for Alameda County.

3.2 Energy GHGs are emitted from buildings as a result of activities for which electricity and natural gas are typically used as energy sources. Combustion of any type of fuel emits CO2 and other GHGs directly into the atmosphere; these emissions are considered direct emissions associated with a building. GHGs are also emitted during the generation of electricity from fossil fuels; these emissions are considered to be indirect emissions.

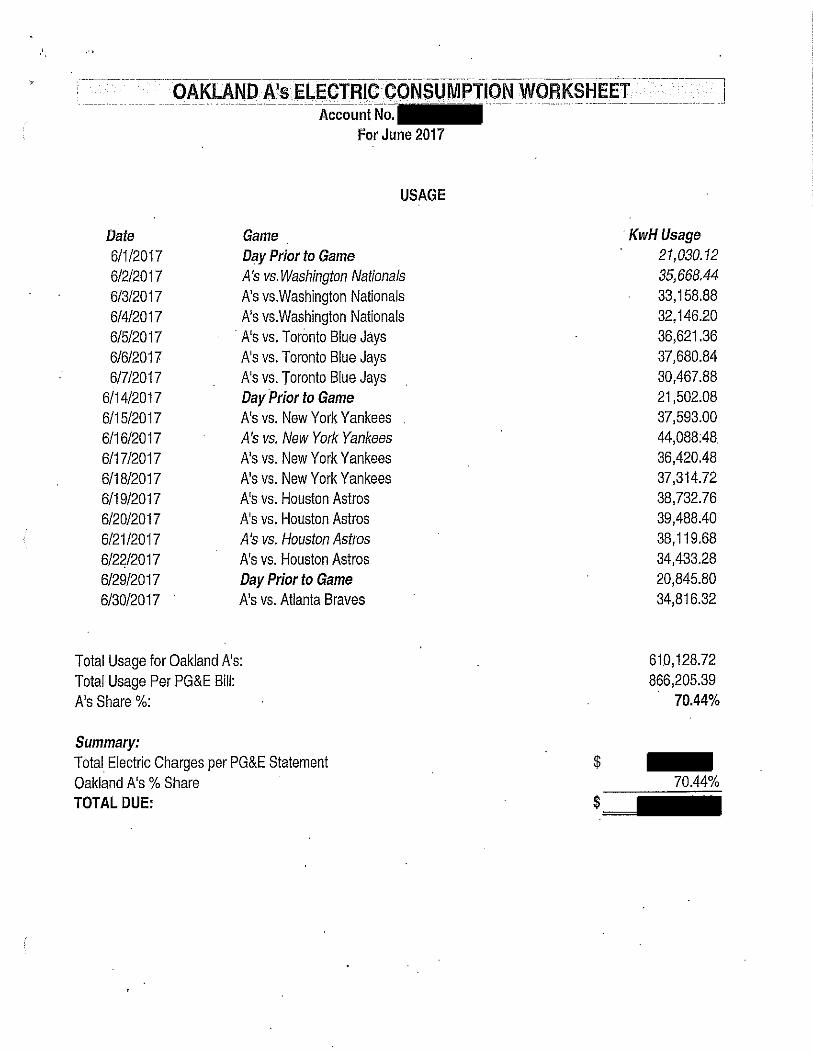
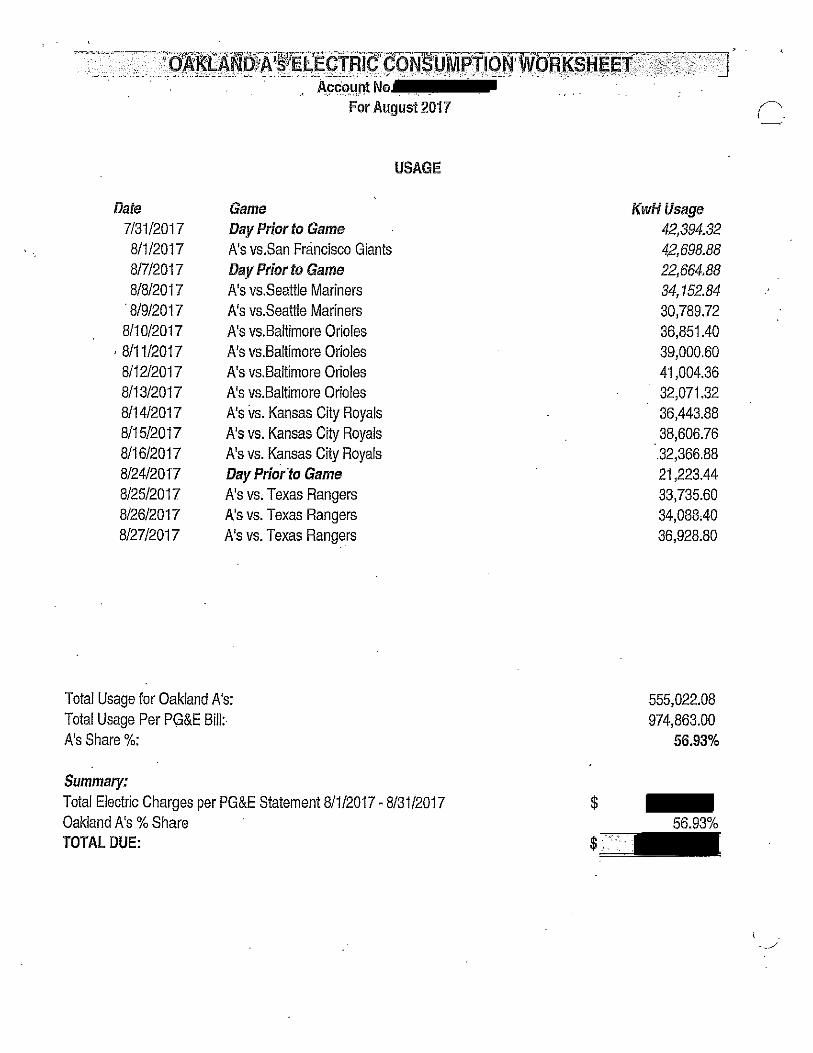
For the Coliseum stadium, per-attendee electricity and natural gas use rates were estimated for the 2017 MLB season using Pacific Gas & Electric (PG&E) electricity billing data, facility natural gas metering data, and 2017 MLB attendance. The per-attendee energy use rates were used to estimate total energy usage associated with events at the Coliseum in units of kilowatt-hours of electricity and kBTU (thousand British thermal units) of natural gas. Ramboll assumes that energy use characteristics for NFL games and other special events uses at the Coliseum are comparable to those associated with the Athletics uses on a per-attendee basis. For the A’s headquarters at Jack London Square, electricity and natural gas use rates are calculated using the CalEEMod® default energy consumption profile for a General Office Building (in climate zone 5). As the headquarters building was constructed prior to 2010, it is conservative for the Baseline scenario to assume CalEEMod® default energy use rates for 2016 Title 24 Building Energy Efficiency Standards.

To estimate indirect GHG emissions from electricity use, the Baseline electricity usage is multiplied by the emission intensity factors for PG&E-delivered electricity. The PG&E intensity factor for the Baseline scenario assumes that California achieves the State's Senate Bill (SB) 100 requirement to acquire 33% of energy from renewable sources by 2020.8 Ramboll used emission factors and renewables percentages for 2014 through 2016 from PG&E to project future electricity intensity based on the State achieving the 2020 target. The default electricity intensity for methane (CH4) and nitrous oxide (N2O) were obtained from CalEEMod® Appendix D (using PG&E values) and were conservatively not adjusted for future inventory years. To estimate direct GHG emissions from natural gas combustion, the Baseline natural gas usage is multiplied by CalEEMod® default emission factors.

Calculation assumptions for Baseline energy use emissions in 2020 are provided in Table OP-2 of Appendix 1.

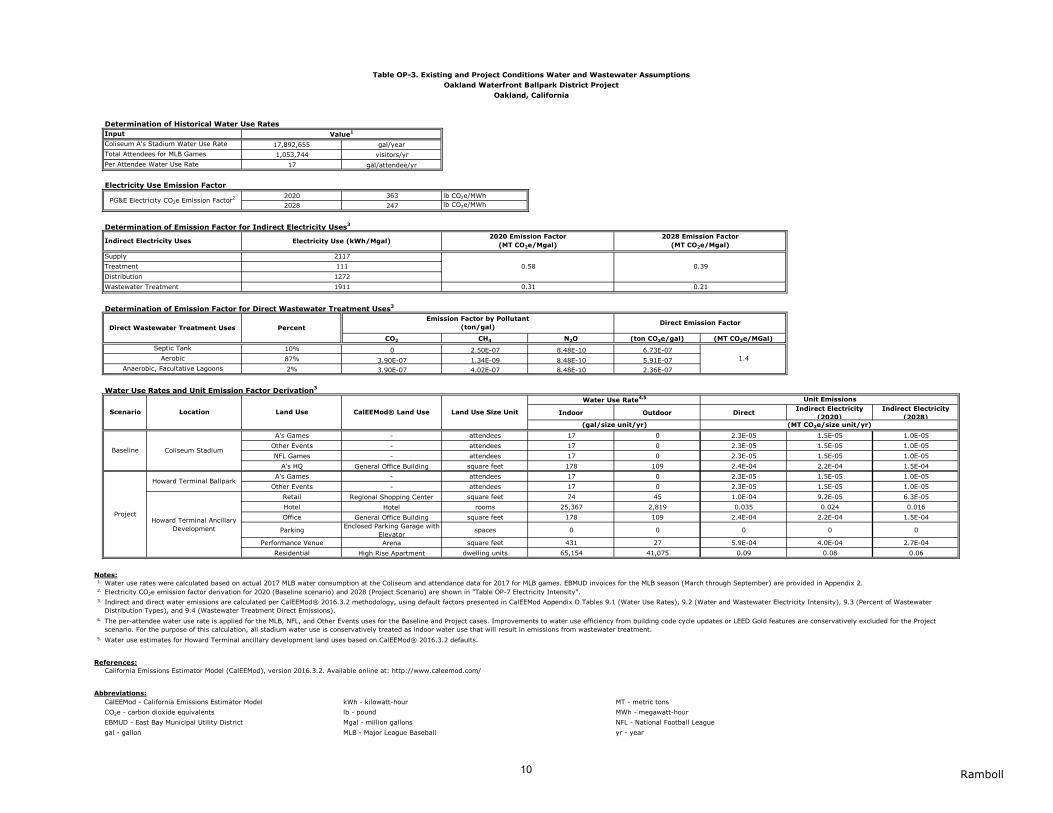
3.3 Water and Wastewater Indirect GHG emissions result from the production of electricity used to convey, treat, and distribute the Project’s water and wastewater. The amount of electricity required to convey, treat, and distribute water depends on the volume of water, as well as the source(s) of the water. Additionally, direct CH4 and N2O emissions result from the treatment of wastewater.

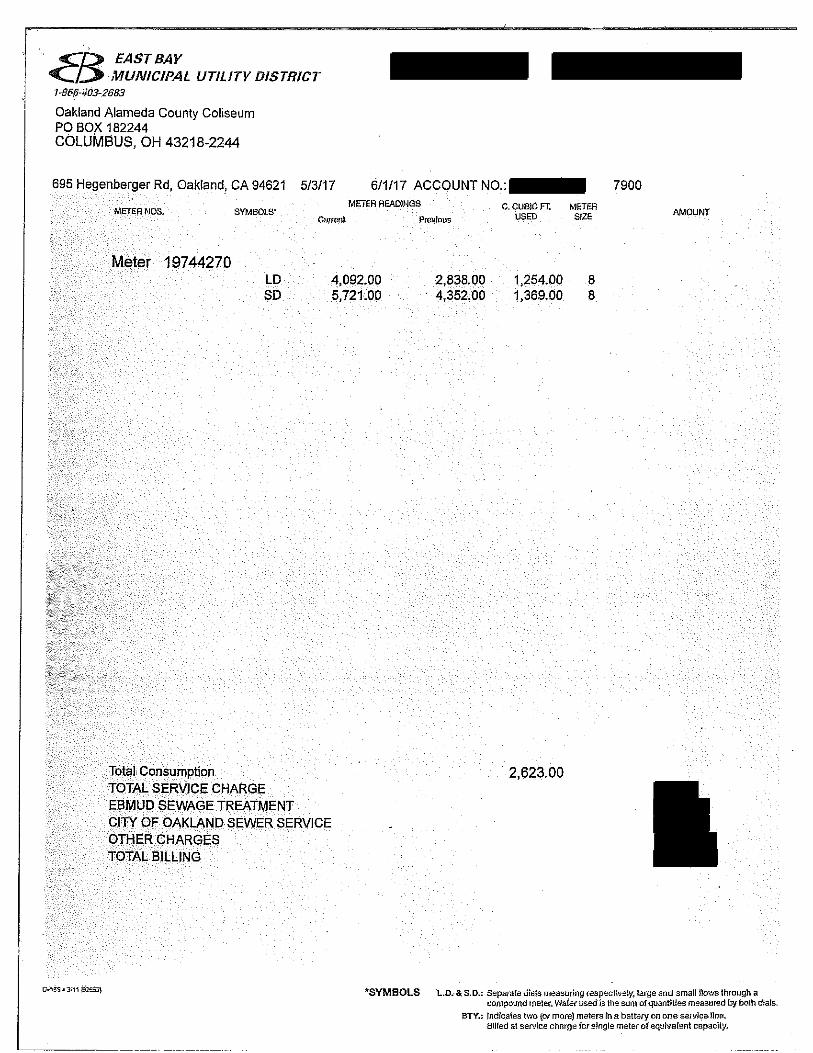
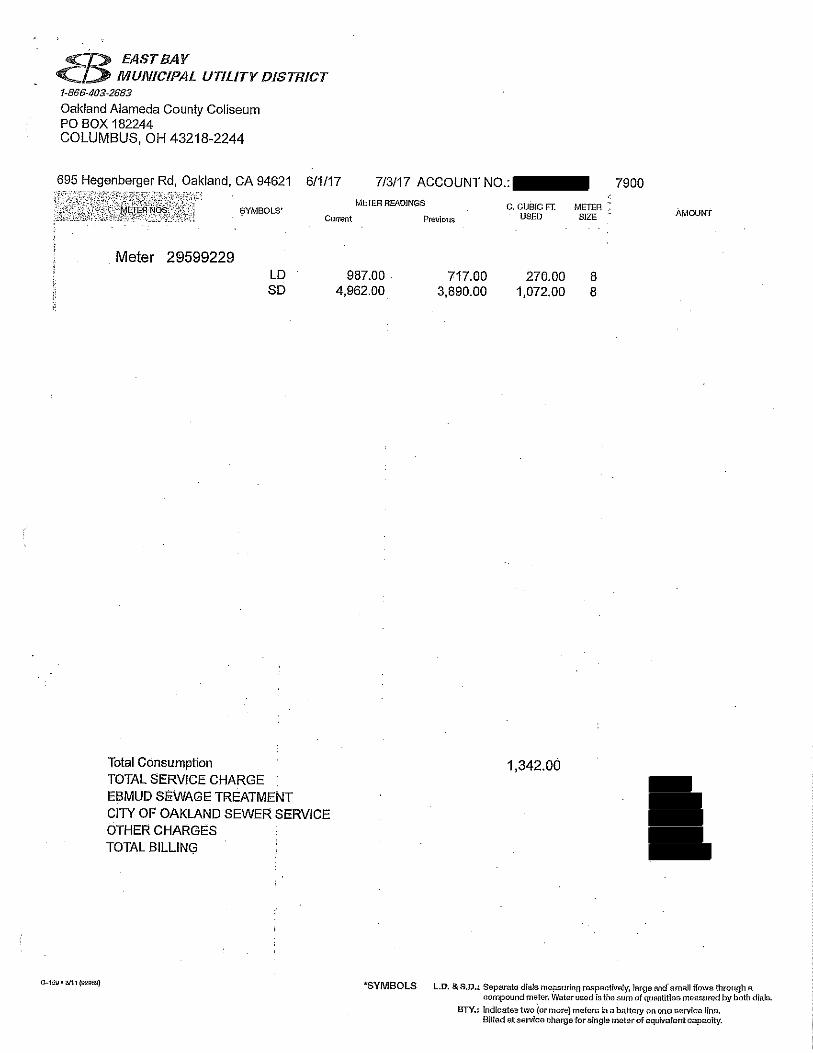
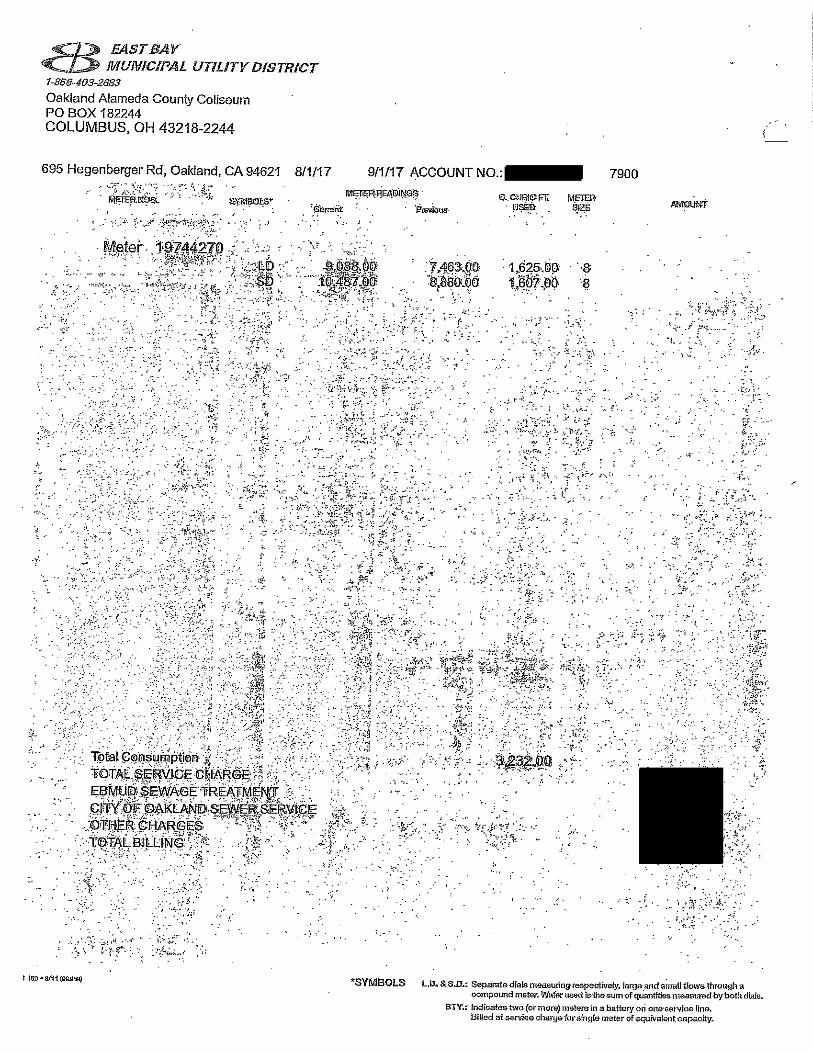
For the Coliseum stadium, a per-attendee water use rate was estimated based on East Bay Municipal Utility District (EBMUD) water supply billing data for the 2017 MLB season and 2017 MLB attendance. The per-attendee water use rate was used to estimate total

8 De Leon. SB 100. 2018. California Renewables Portfolio Standard Program: emissions of greenhouse gases.

Available at: https://leginfo.legislature.ca.gov/faces/billNavClient.xhtml?bill_id=201720180SB100.

Proposed AB734 GHG Emissions Methodology Oakland Sports and Mixed-Use Project

Operational GHG Emissions from Proposed Project Conditions 16 Ramboll

water usage associated with events at the Coliseum in units of gallons per year. Ramboll assumes that water consumption characteristics for NFL games and other special events uses at the Coliseum are comparable to those associated with the Athletics uses on a per-attendee basis. For the A’s headquarters at Jack London Square, water use is calculated using the CalEEMod® default water consumption profile for a General Office Building.

Emission factors are based on CalEEMod® defaults for Alameda County. The electricity intensity factor is the same as used for electricity emissions, as described in Section 3.2.

Calculation assumptions for Baseline water use emissions in 2020 are provided in Table OP-3 of Appendix 1.

3.4 Solid Waste Disposal Solid waste treatment releases CH4 emissions from the decomposition of waste and the CO2 emissions associated with the combustion of CH4, if applicable. Emissions from solid waste treatment are estimated using CalEEMod® default emission factors for Alameda County.

A per-attendee solid waste disposal rate for Coliseum land uses was estimated based on 2017 Coliseum waste disposal data provided by the Athletics. The solid waste disposal rate was multiplied by the attendees for all events at the Coliseum to derive waste disposal in tons per year. Ramboll assumes that solid waste disposal characteristics for NFL and other special events uses at the Coliseum are comparable to those associated with the Athletics uses on a per-attendee basis. For the A’s headquarters at Jack London Square, solid waste disposal is calculated using the CalEEMod® default profile for a General Office Building.

GHG emissions associated with non-landfill diverted waste streams are not considered, because it is generally assumed that these diversions do not result in any appreciable amounts of GHG emissions when operated effectively. These waste diversion alternatives may result in differences in life-cycle emissions of GHGs, but it is not appropriate to combine life-cycle emissions for only one category of emissions. Additionally, biogenic CO2 emissions were not included when CARB analyzed the GHG emissions inventory under Assembly Bill (AB) 32. Therefore, they are not included in the emissions inventory.

Calculation assumptions for Baseline solid waste emissions are provided in Table OP-4 of Appendix 1.

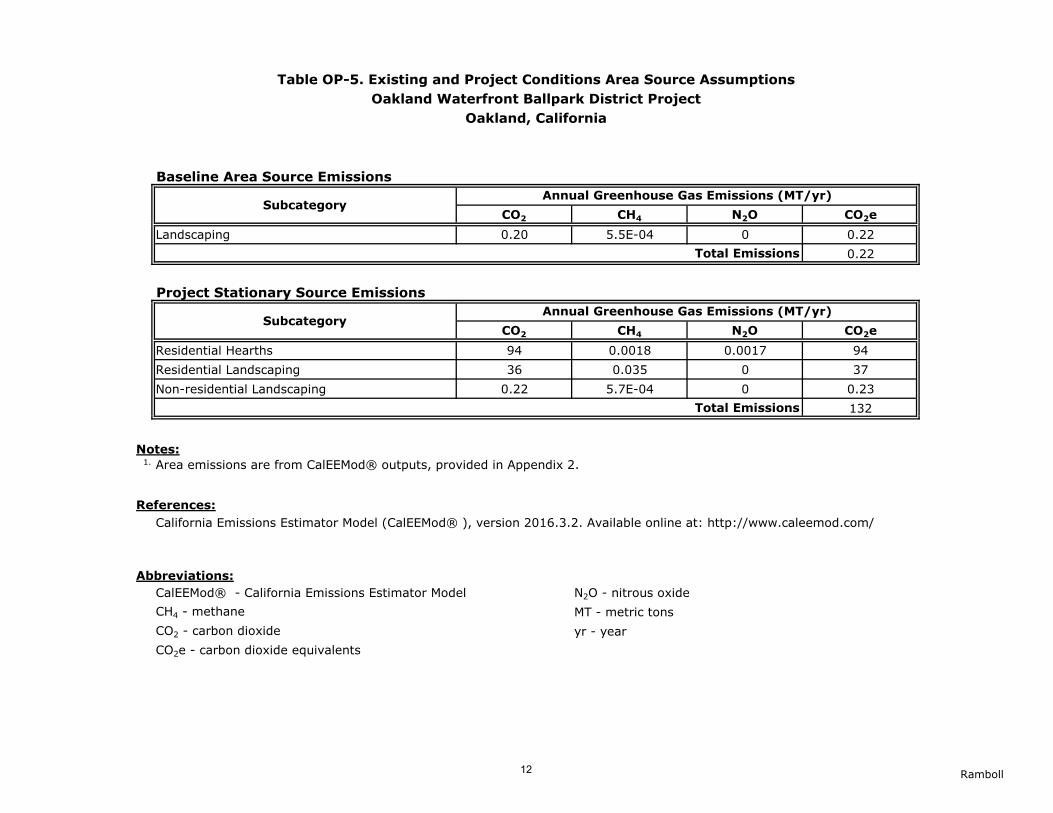
3.5 Area Sources GHG emissions from area sources, such as landscaping equipment, are estimated using CalEEMod®. Emissions associated with Baseline area sources are provided in Table OP-5 of Appendix 1 and in the CalEEMod® output files in Appendix 2.

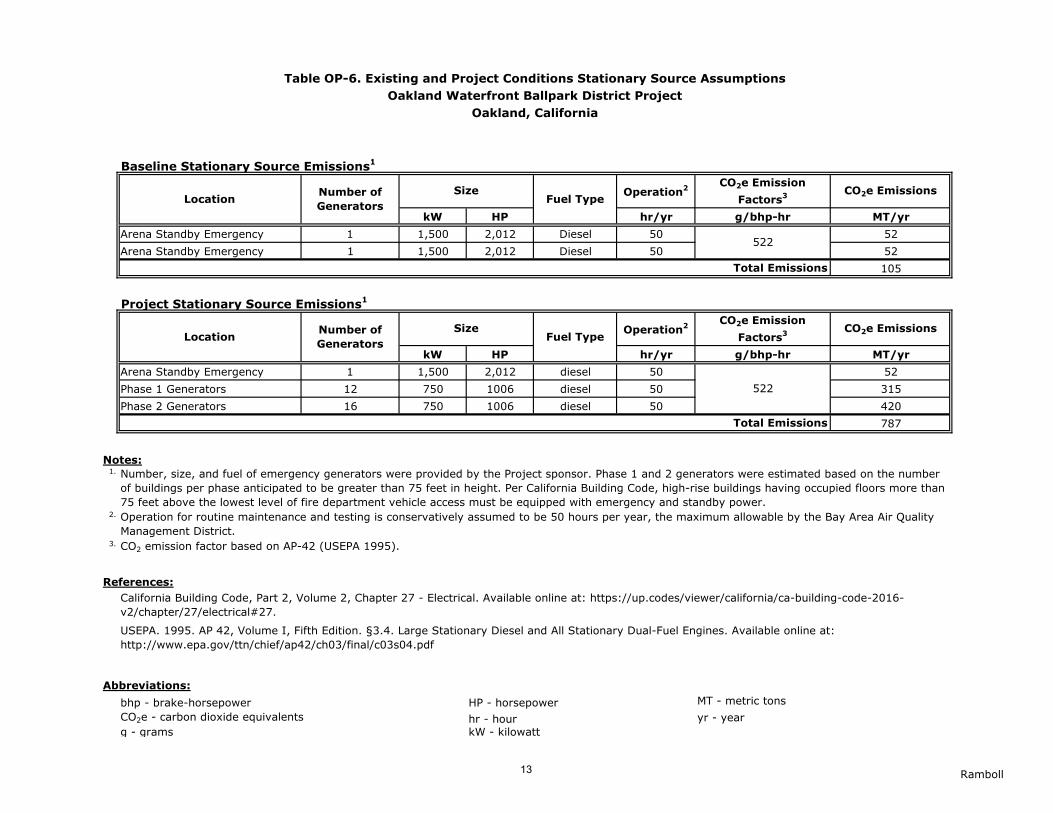
3.6 Back-Up Generators Operation of standby emergency engines result in direct emissions of GHGs.

The Coliseum stadium contains two existing 2,000 horsepower (HP) diesel generators that directly emit GHGs. Emissions are calculated as a product of engine horsepower, a CO2 emission factor of 523.5 grams per horsepower hour (g/hp-hr) based on the CalEEMod® default factor, and 50 hours of annual operation for routine maintenance and testing. The hours of operation estimate is consistent with the maximum allowed testing time from the Airborne Toxics Control Measure (ATCM) for Stationary Compression Ignition Engines (17 CCR 93115).

Proposed AB734 GHG Emissions Methodology Oakland Sports and Mixed-Use Project

Operational GHG Emissions from Proposed Project Conditions 17 Ramboll

Emissions associated with Baseline stationary sources are provided in Table OP-6 of Appendix 1.

4. OPERATIONAL GHG EMISSIONS FROM PROPOSED PROJECT CONDITIONS

For the Proposed Project, CalEEMod® or equivalent methodologies were used to estimate phased emissions for the anticipated buildout schedule. Adjustments from CalEEMod® defaults were made for site-specific data provided by the Athletics for transportation, energy use, water use, solid waste disposal, and emergency generators, as described in the respective subsections below.

Emissions associated with the Proposed Project were estimated based on two operational scenarios:

1. Project 1.0: The Proposed Project without GHG Reduction Measures, representing the proposed project absent implementation of any GHG emission reduction measures beyond current building code requirements (e.g., 2019 Title 24 standards) and

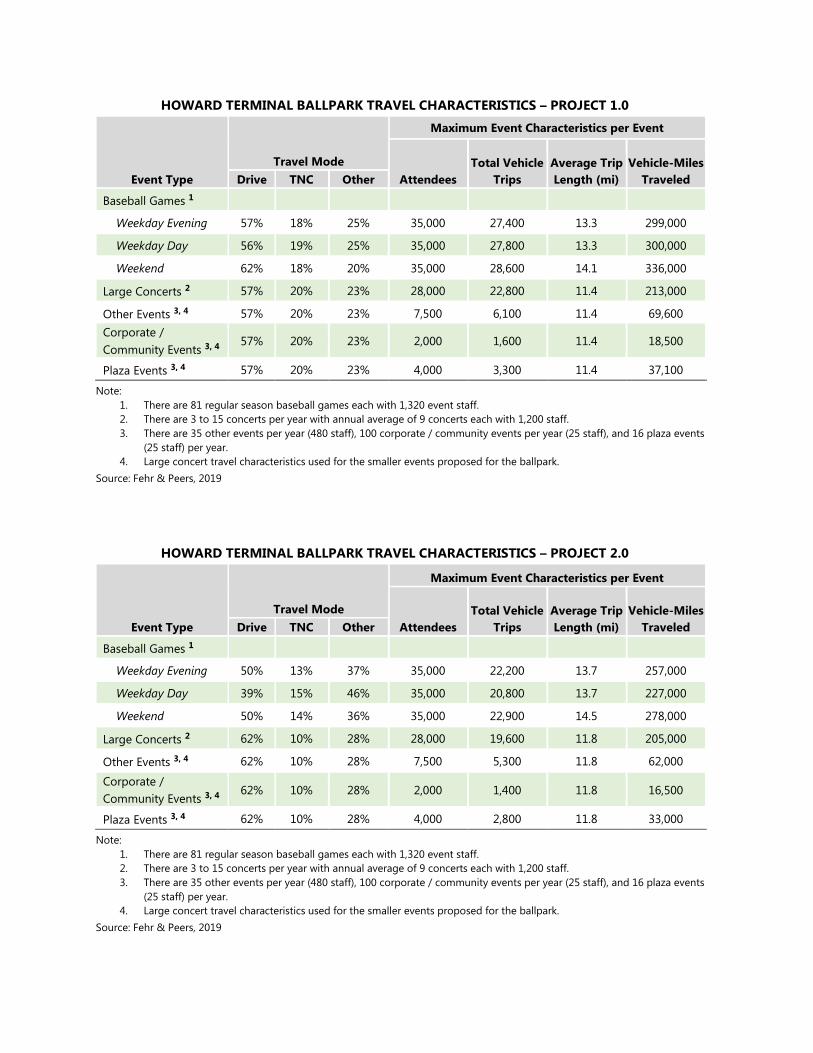
2. Project 2.0: The Proposed Project with local GHG Reduction Measures, including the implementation of the Transportation Management Plan (TMP) and the Transportation Demand Management (TDM) Plan (see Exhibit B) that achieve a combined 20% reduction in vehicle trips.

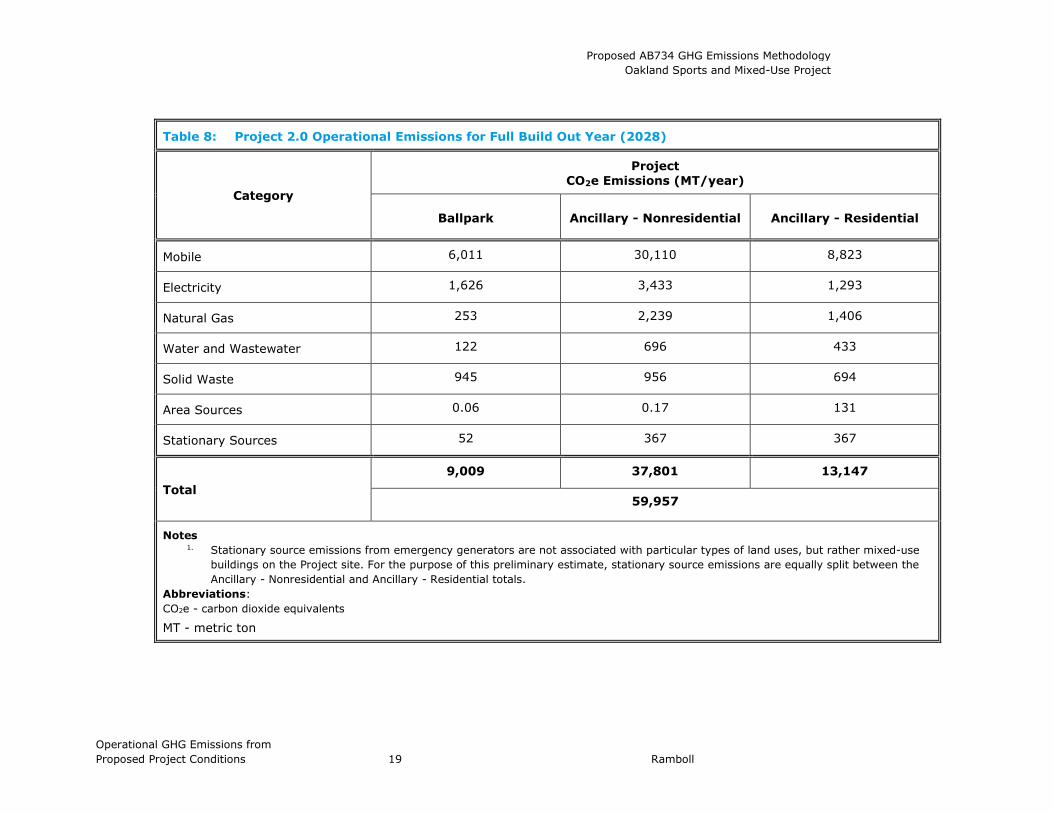
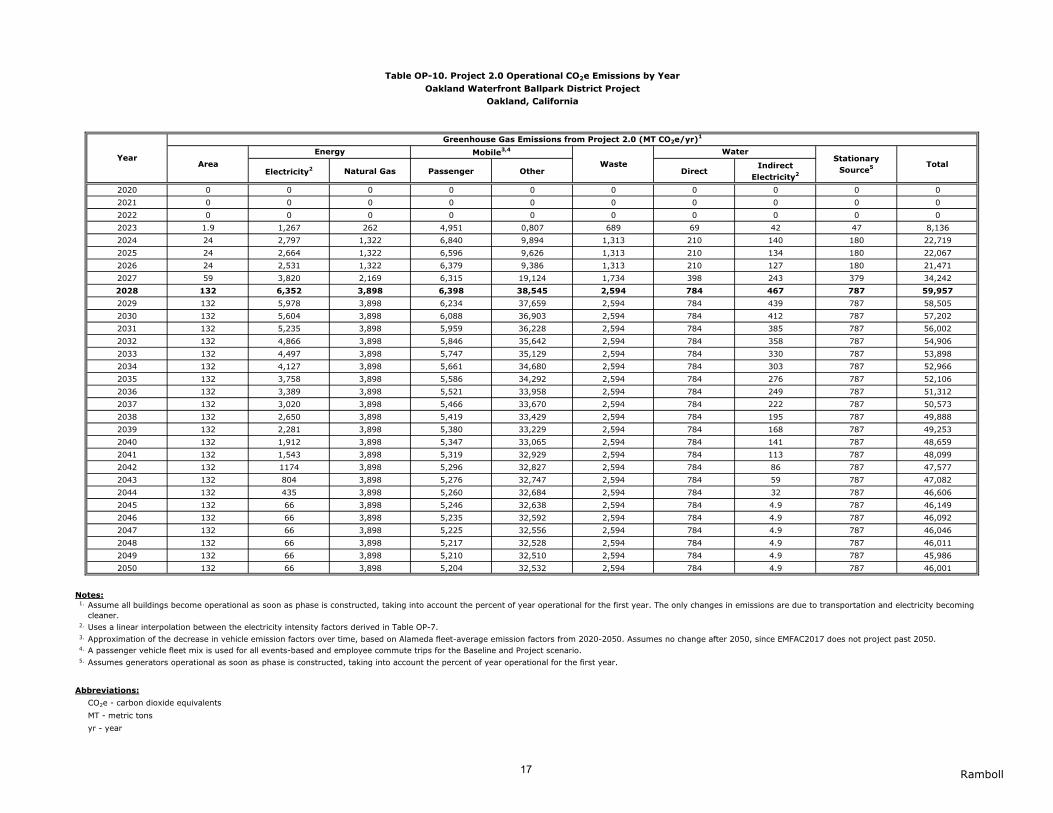
Operational GHG emissions for the first full year of buildout (2028) are shown for the Project 1.0 scenario in Table 7 and are estimated to be approximately 71,600 MT CO2e/year. Operational GHG emissions for the first full year of buildout (2028) are shown for the Project 2.0 scenario in Table 8 and are estimated to be approximately 60,000 MT CO2e. For both scenarios, mobile sources are the largest contributor to GHG emissions, followed by electricity and natural gas.

Detailed calculation assumptions for the Proposed Project emissions in 2028 are presented in Tables OP-1 through OPS-7 of Appendix 1 and CalEEMod® outputs are presented in Appendix 2.

Proposed AB734 GHG Emissions Methodology Oakland Sports and Mixed-Use Project

Operational GHG Emissions from Proposed Project Conditions 18 Ramboll

Table 7: Project 1.0 Operational Emissions for Full Build Out Year (2028)

Category

Project CO2e Emissions (MT/year)

Ballpark Ancillary - Nonresidential Ancillary - Residential

Mobile 7,069 37,084 12,442

Electricity 1,626 3,433 1,293

Natural Gas 253 2,239 1,406

Water and Wastewater 122 696 433

Solid Waste 945 956 694

Area Sources 0.06 0.17 131

Stationary Sources 52 367 367

Total 10,066 44,775 16,767

71,608

Notes 1. Stationary source emissions from emergency generators are not associated with particular types of land uses, but rather mixed-use

buildings on the Project site. For the purpose of this preliminary estimate, stationary source emissions are equally split between the Ancillary - Nonresidential and Ancillary - Residential totals.

Abbreviations: CO2e - carbon dioxide equivalents MT - metric ton

Proposed AB734 GHG Emissions Methodology Oakland Sports and Mixed-Use Project

Operational GHG Emissions from Proposed Project Conditions 19 Ramboll

Table 8: Project 2.0 Operational Emissions for Full Build Out Year (2028)

Category

Project CO2e Emissions (MT/year)

Ballpark Ancillary - Nonresidential Ancillary - Residential

Mobile 6,011 30,110 8,823

Electricity 1,626 3,433 1,293

Natural Gas 253 2,239 1,406

Water and Wastewater 122 696 433

Solid Waste 945 956 694

Area Sources 0.06 0.17 131

Stationary Sources 52 367 367

Total 9,009 37,801 13,147

59,957

Notes 1. Stationary source emissions from emergency generators are not associated with particular types of land uses, but rather mixed-use

buildings on the Project site. For the purpose of this preliminary estimate, stationary source emissions are equally split between the Ancillary - Nonresidential and Ancillary - Residential totals.

Abbreviations: CO2e - carbon dioxide equivalents

MT - metric ton

Proposed AB734 GHG Emissions Methodology Oakland Sports and Mixed-Use Project

Operational GHG Emissions from Proposed Project Conditions 20 Ramboll

4.1 Mobile Mobile source emissions for the Proposed Project include event-day trips related to MLB games and other events at the Howard Terminal ballpark, commute trips by arena and sports team management employees, and visitor trips associated with the ancillary development land uses.

CalEEMod® methodology estimates mobile GHG emissions from running, idling, and starting exhaust for the aggregated projected vehicle fleet in a given calendar year and county. Emission factors for CO2, CH4, and N2O were obtained from ARB’s EMission FACtor model (EMFAC2017) for Alameda County.9 CO2e emission factors from mobile sources are assumed to decrease over time to reflect fleet turnover and more efficient vehicle standards. Emission factors through 2050 were calculated and mobile emissions were adjusted to reflect the decreasing factors each year.10 Mobile emission factors decrease over time due to fleet turnover and regulations such as Advanced Clean Cars (ACC). As on-road vehicle trip associated with spectators, event-day staff, and employees are expected to be primarily passenger vehicles, the default Alameda County fleet mix was adjusted for a passenger fleet mix of light-duty autos, motorcycles, light-duty trucks, and medium-duty vehicles to estimate passenger fleet-average emission factors. For ancillary land uses, the default Alameda County fleet mix was used to estimate fleet-average emission factors.

For the Project 2.0 scenario, trip rates incorporate vehicle trip reduction (VTR) measures from Transportation Demand Management and Transportation Management Plan measures (see Exhibit B). The VTR measures apply to all spectator and ancillary development visitor trips. VTR reductions are conservatively excluded from employee mobile activity.

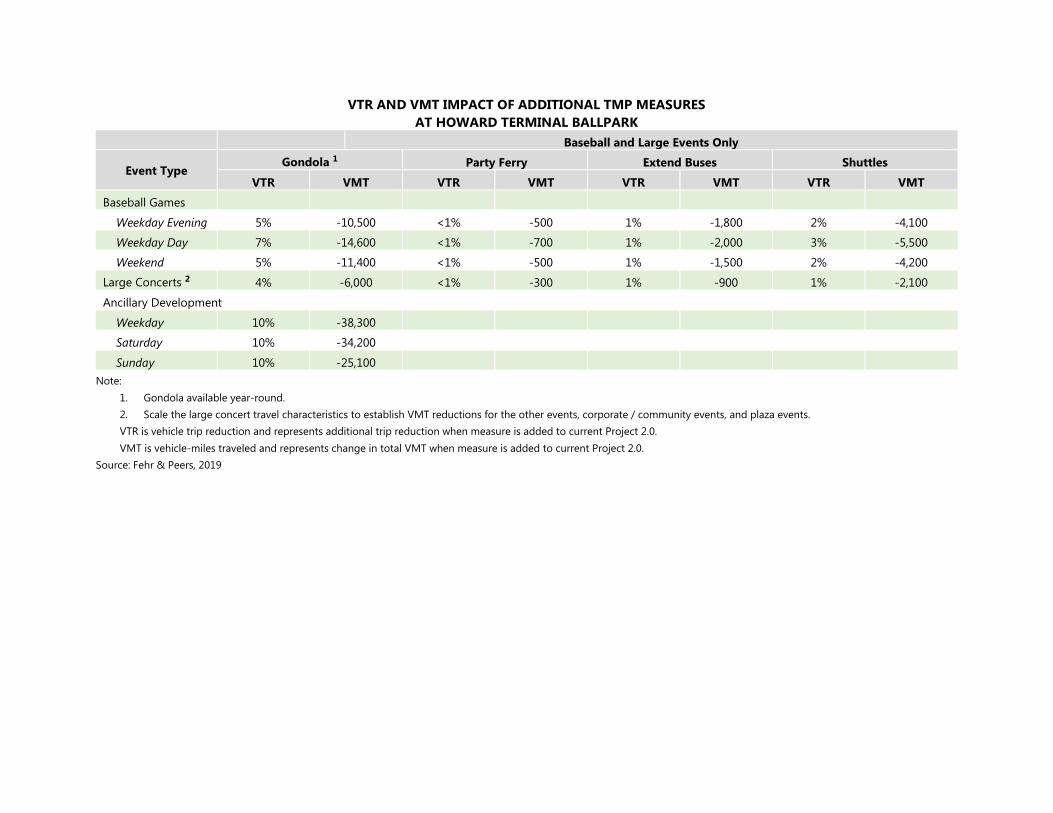
Most of the Project Variants are not anticipated to affect mobile trips, including improvements to pedestrian connections and crossing, potential wharf alterations, Adeline Street and Embarcadero connectivity improvements, crane removal and development of the Oakland Power Plant and Embarcadero and Clay lot. Of the variants, only the gondola service variant is anticipated to substantially affect mobile trips. If implemented, the gondola would reduce mobile emissions for the Project 2.0 scenario by an additional 4,185 MT CO2e in 2028. However, as implementation of the gondola and other variants are uncertain at this time, the estimated reductions are conservatively not included in the overall emissions inventory.

Calculation assumptions for Project mobile source emissions in 2028 are provided in Table OP-1 of Appendix 1.

4.1.1 Ballpark and Performance Venue 4.1.1.1 Spectators and Event Staff

Mobile emissions associated with Proposed Project spectators and event staff are estimated based on trip rates, mode split, trip lengths, and average vehicle occupancy provided in the site-specific vehicle trip analysis and supplemental tables from Fehr & Peers (see Exhibit B and Appendix 3).

9 CalEEMod® incorporates on-road vehicle emission factors from the prior release of this model, EMFAC2014.

Ramboll incorporated updated EMFAC2017 emission factors as it is the best available data. 10 Since these fleet-average emission factors were calculated outside of CalEEMod®, the newest version of the

EMFAC model (EMFAC2017) was used to estimate percent change over time.

Proposed AB734 GHG Emissions Methodology Oakland Sports and Mixed-Use Project

Operational GHG Emissions from Proposed Project Conditions 21 Ramboll

The emissions for event spectator and event staff trips are the product of spectator and event staff trips per year, trip length, and passenger fleet average CO2e emission factors for Alameda County.

4.1.1.2 Employees Mobile source emissions associated with Howard Terminal event center management employees and Athletics sports team operation employees are based on employee estimates from the Project sponsor.

Bay Area Census data from 2013-2017 for the census tract containing Jack London Square, census data shows that 40.2% of commuters drive to work, and of those 33.4% commute alone and 6.8% commute in carpools of two, three, and four or more occupants. Ramboll assumed that Howard Terminal event center management employees and Athletics sports team operation employees follow the drive rates specific to the Jack London Square census tract (which is assumed to be more representative of anticipated land uses than the current industrial census tract containing Howard Terminal).

Employees were assumed to take one round-trip commute trip per day. The CalEEMod® default trip length of 9.5 miles was used for the employee commute trips. The emissions for employee trips are the product of employee trips per year, length per trip, and passenger fleet average CO2e emission factors for Alameda County.

4.1.2 Ancillary Development Visitors Mobile emissions for trips associated with visitors to the retail, hotel, office, restaurant, performance venue, and residential uses are estimated based on the site-specific vehicle trip analysis and supplemental tables from Fehr & Peers (see Exhibit B and Appendix 3).

The emissions for retail, hotel, office, restaurant, and residential visitor trips are the product of trips per year, length per trip, and fleet average CO2e emission factors for Alameda County. The performance venue mobile emissions are similarly estimated but use the passenger fleet average CO2e emission factors for Alameda County.

4.2 Energy As described in Section 3.2, energy emissions include indirect emissions from electricity used by buildings and direct natural gas combustion emissions.

Energy consumption for the Proposed Project’s ballpark and performance venue were quantified using the same methodology as described for the existing conditions in Section 3.2. For the purpose of this assessment, Ramboll assumes that energy use characteristics for Proposed Project are comparable to the Coliseum on a per-attendee basis. This is conservative as the new events uses are likely far more efficient for overall energy use than the existing Coliseum Stadium. Energy emissions for the Proposed Project’s retail, hotel, office, restaurant, performance venue, residential, and parking uses are calculated using CalEEMod® default energy consumption profiles, updated to reflect buildings constructed to 2019 Title 24 Building Energy Efficiency Standards. The Project will likely include additional energy conservation measures, which could include improved lighting, cooling, and water heating efficiencies, solar photovoltaic (PV) electricity generation, and solar hot water heating. These details are not known at this time and are conservatively excluded from the GHG emissions estimates.

Proposed AB734 GHG Emissions Methodology Oakland Sports and Mixed-Use Project

Operational GHG Emissions from Proposed Project Conditions 22 Ramboll

To estimate indirect GHG emissions from electricity use, Project electricity usage is multiplied by the emission intensity factors for PG&E-delivered electricity. The intensity factors assume that California achieves the State's Senate Bill (SB) 100 requirement to acquire 60% of energy from renewable sources by 2030 and 100% by 2045, which supersedes the RPS assumptions in the CARB 2017 Climate Change Scoping Plan.11 Ramboll plans to use emission factors and renewables percentages for 2014 through 2016 from PG&E to project future electricity intensity based on the State achieving the 2030 and 2045 targets. The default electricity intensity for methane (CH4) and nitrous oxide (N2O) were obtained from CalEEMod® Appendix D (using PG&E values) and were conservatively not adjusted for future inventory years. To estimate direct GHG emissions from natural gas combustion, the Project’s natural gas usage is multiplied by CalEEMod® default emission factors.

Calculation assumptions for Project energy use emissions in 2028 are provided in Table OP-2 of Appendix 1.

4.3 Water and Wastewater As described in Section 3.3, water emissions include indirect emissions from electricity used to convey, treat, and distribute water and wastewater and direct CH4 and N2O emissions from wastewater treatment.

Water use for the Proposed Project’s ballpark and performance venue were quantified using the same methodology as described for the existing conditions in Section 2.3. For the purpose of this assessment, Ramboll assumes that water use characteristics for Proposed Project are comparable to the Coliseum on a per-attendee basis. This is conservative as the new events uses are likely far more efficient for overall water use than the Coliseum Stadium. The Proposed Project will likely include additional water efficiency and conservation measures. These details are not known at this time and are conservatively excluded from the GHG emissions estimates.

Water use rates for the Proposed Project’s retail, hotel, office, restaurant, performance venue, residential, and parking uses are calculated using CalEEMod® defaults for Alameda County. The electricity intensity factor is the same as used for electricity emissions, as described in Section 4.2.

Calculation assumptions for Project water use emissions in 2028 are provided in Table OP-3 of Appendix 1.

4.4 Solid Waste Disposal As described in Section 3.4, solid waste treatment releases CH4 emissions from the decomposition of waste and the CO2 emissions associated with the combustion of CH4, if applicable.

Solid waste disposal for the Proposed Project’s ballpark and performance venue were quantified using the same methodology as described for the existing conditions in Section 2.4. Solid waste generation rates for the Proposed Project’s retail, hotel, office, restaurant, performance venue, residential, and parking uses are calculated using CalEEMod® defaults for Alameda County.

11 CARB. 2017. 2017 Scoping Plan, Appendix D: PATHWAYS, pg. 12 (November). Available at:

https://www.arb.ca.gov/cc/scopingplan/2030sp_appd_pathways_final.pdf

Proposed AB734 GHG Emissions Methodology Oakland Sports and Mixed-Use Project

Operational GHG Emissions from Proposed Project Conditions 23 Ramboll

Calculation assumptions for Project solid waste emissions are provided in Table OP-4 of Appendix 1.

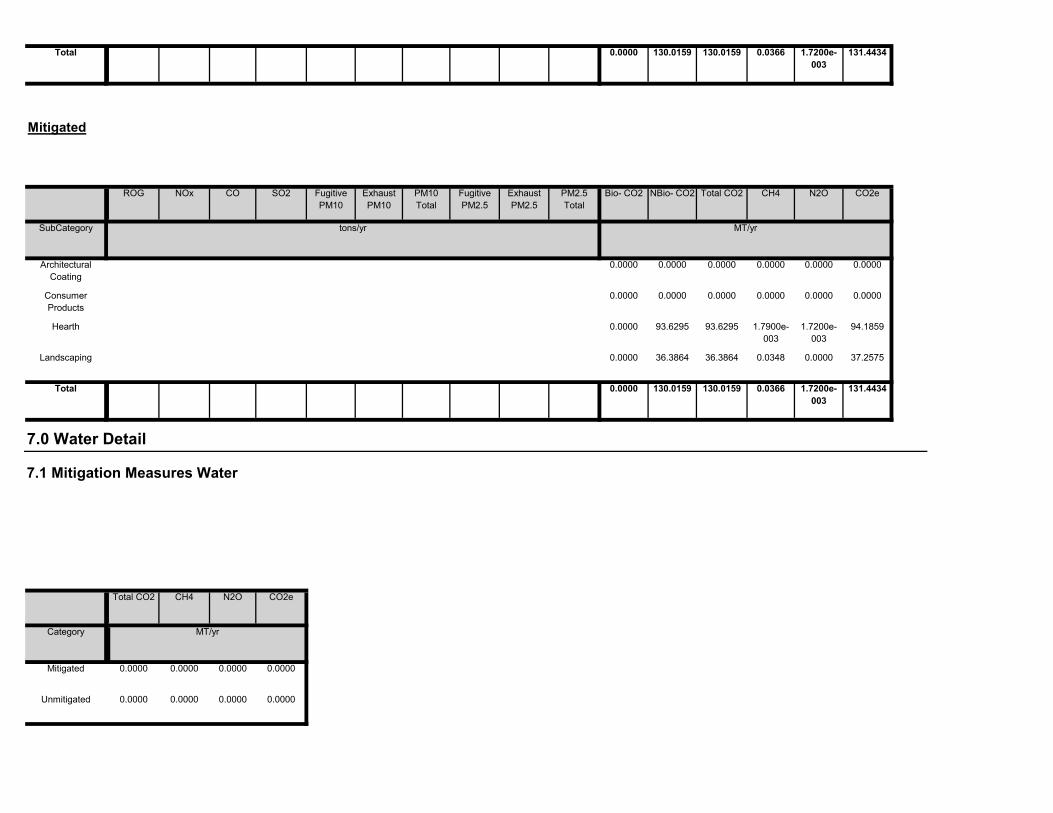
4.5 Area Sources GHG emissions from area sources, such as residential fireplaces and landscaping equipment, for the Proposed Project are calculated using the same methodology as described in Section 2.5. Emissions are based on the type and size of land uses associated with the Proposed Project.

Emissions associated with Project area sources are provided in Table OP-5 of Appendix 1 and in the CalEEMod® output files in Appendix 2.

4.6 Back-Up Generators As stated in Section 3.6, operation of standby emergency engines will result in direct emissions of GHGs.

The Proposed Project is assumed to include 29 diesel generators that directly emit GHGs. Ramboll assumes that one 2,000 horsepower (HP) diesel generator will be located at the ballpark, and that 28 1,000 HP generators will be associated with ancillary development high-rise towers that are anticipated to contain occupied floors above 75 feet from floor level (in line with California Building Code).12

Emissions are calculated as a product of engine horsepower, a CO2 emission factor of 523.5 grams per horsepower hour (g/hp-hr) based on the CalEEMod® default factor, and 50 hours of annual operation for routine maintenance and testing. This is consistent with the maximum allowed testing time from the Airborne Toxics Control Measure (ATCM) for Stationary Compression Ignition Engines (17 CCR 93115). The final BAAQMD permits for the generators may have a condition for fewer hours of operation for routine maintenance and testing; however, for this analysis we conservatively assumed the highest limit allowed by the ATCM.

Emissions associated with Project stationary sources are provided in Table OP-6 of Appendix 1.

12 California Building Code, Part 2, Volume 2, Chapter 27 - Electrical. Available online at:

https://up.codes/viewer/california/ca-building-code-2016-v2/chapter/27/electrical#27.

Proposed AB734 GHG Emissions Methodology Oakland Sports and Mixed-Use Project

Measures For Offsetting Net Increase GHG Emissions 24 Ramboll

5. MEASURES FOR OFFSETTING NET INCREASE GHG EMISSIONS

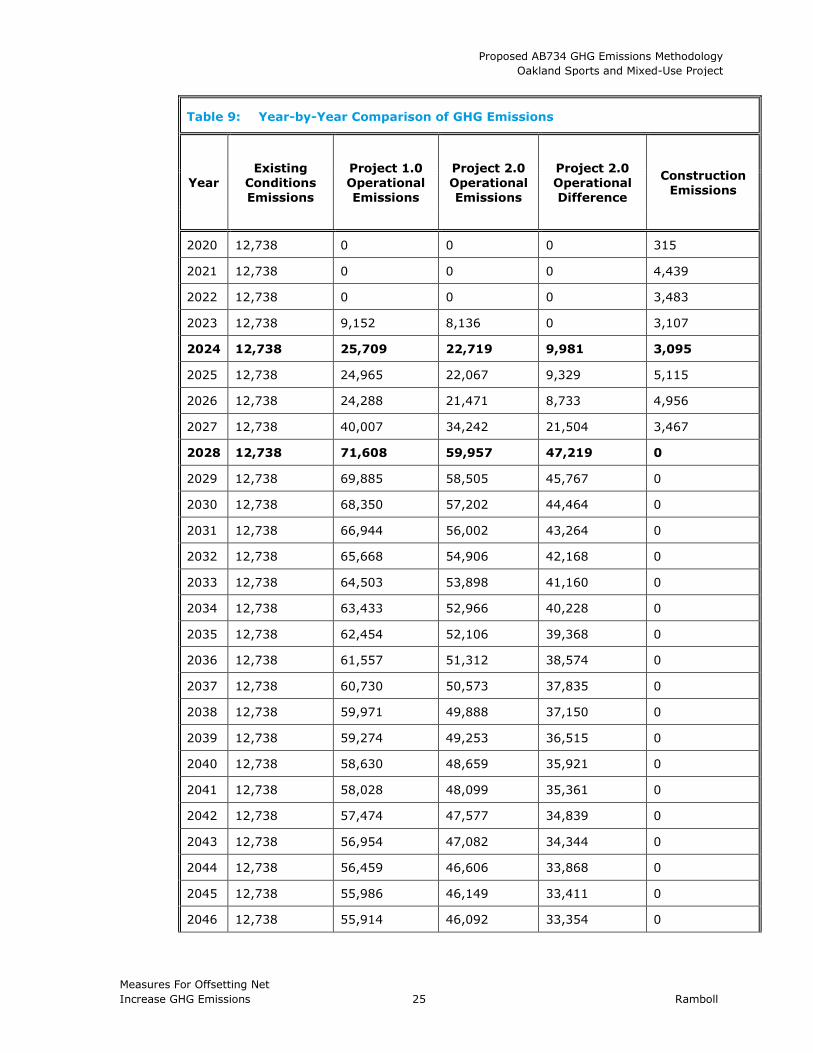
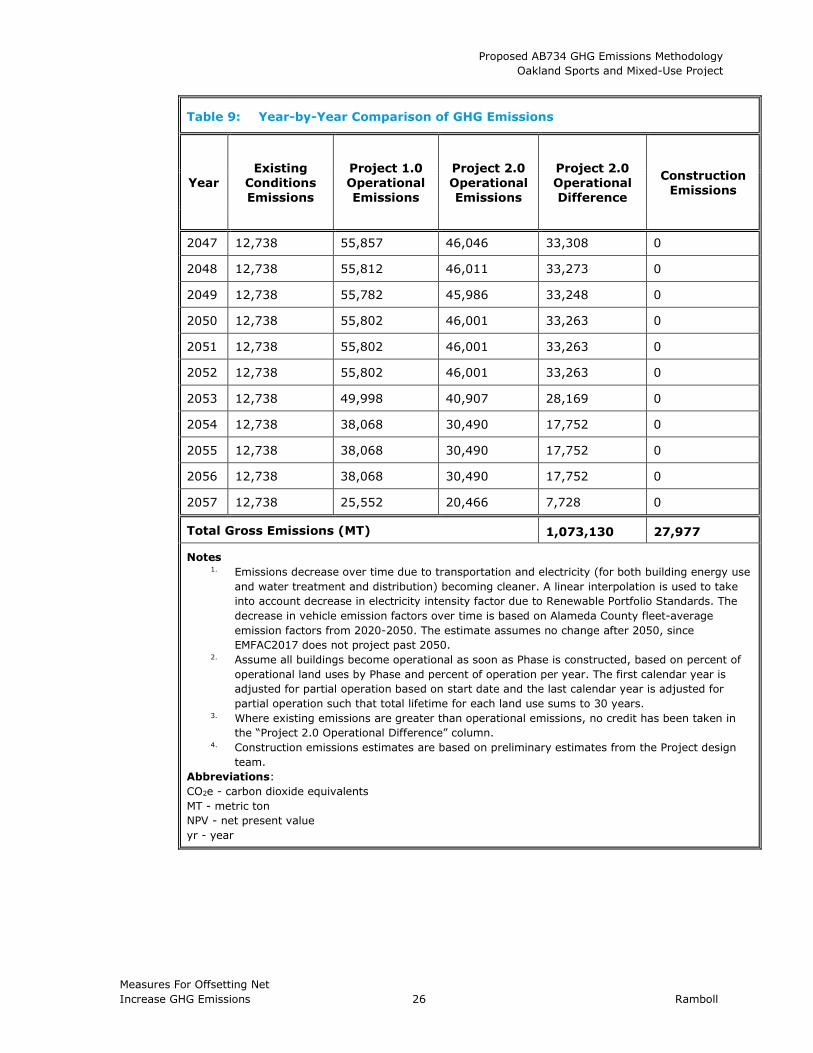
5.1 Project Year-by-Year Emissions Project 1.0 and Project 2.0 emissions were estimated for each year of operations, accounting for the phased buildout schedule, with adjustments from defaults and for future years as described below. The year-by-year summary comparison of the existing condition to the Proposed Project is shown in Table 9. Detailed calculation assumptions and yearly GHG emissions for operations for the Project are presented in Tables OP-8 through OP-10 of Appendix 1. Project emissions would exceed existing condition emissions from 2024 onwards.

Total construction emissions are estimated to be 27,977 MT CO2e. Total gross operational emissions would be 1,073,130 MT CO2e for the Proposed Project. Total gross operational emissions for the lifetime of the Project do not include any benefits or credits from any years where the existing conditions are higher than Project emissions.

Proposed AB734 GHG Emissions Methodology Oakland Sports and Mixed-Use Project

Measures For Offsetting Net Increase GHG Emissions 25 Ramboll

Table 9: Year-by-Year Comparison of GHG Emissions

Year Existing

Conditions Emissions

Project 1.0 Operational Emissions

Project 2.0 Operational Emissions

Project 2.0 Operational Difference

Construction Emissions

2020 12,738 0 0 0 315

2021 12,738 0 0 0 4,439

2022 12,738 0 0 0 3,483

2023 12,738 9,152 8,136 0 3,107

2024 12,738 25,709 22,719 9,981 3,095

2025 12,738 24,965 22,067 9,329 5,115

2026 12,738 24,288 21,471 8,733 4,956

2027 12,738 40,007 34,242 21,504 3,467

2028 12,738 71,608 59,957 47,219 0

2029 12,738 69,885 58,505 45,767 0

2030 12,738 68,350 57,202 44,464 0

2031 12,738 66,944 56,002 43,264 0

2032 12,738 65,668 54,906 42,168 0

2033 12,738 64,503 53,898 41,160 0

2034 12,738 63,433 52,966 40,228 0

2035 12,738 62,454 52,106 39,368 0

2036 12,738 61,557 51,312 38,574 0

2037 12,738 60,730 50,573 37,835 0

2038 12,738 59,971 49,888 37,150 0

2039 12,738 59,274 49,253 36,515 0

2040 12,738 58,630 48,659 35,921 0

2041 12,738 58,028 48,099 35,361 0

2042 12,738 57,474 47,577 34,839 0

2043 12,738 56,954 47,082 34,344 0

2044 12,738 56,459 46,606 33,868 0

2045 12,738 55,986 46,149 33,411 0

2046 12,738 55,914 46,092 33,354 0

Proposed AB734 GHG Emissions Methodology Oakland Sports and Mixed-Use Project

Measures For Offsetting Net Increase GHG Emissions 26 Ramboll

Table 9: Year-by-Year Comparison of GHG Emissions

Year Existing

Conditions Emissions

Project 1.0 Operational Emissions

Project 2.0 Operational Emissions

Project 2.0 Operational Difference

Construction Emissions

2047 12,738 55,857 46,046 33,308 0

2048 12,738 55,812 46,011 33,273 0

2049 12,738 55,782 45,986 33,248 0

2050 12,738 55,802 46,001 33,263 0

2051 12,738 55,802 46,001 33,263 0

2052 12,738 55,802 46,001 33,263 0

2053 12,738 49,998 40,907 28,169 0

2054 12,738 38,068 30,490 17,752 0

2055 12,738 38,068 30,490 17,752 0

2056 12,738 38,068 30,490 17,752 0

2057 12,738 25,552 20,466 7,728 0

Total Gross Emissions (MT) 1,073,130 27,977

Notes 1. Emissions decrease over time due to transportation and electricity (for both building energy use

and water treatment and distribution) becoming cleaner. A linear interpolation is used to take into account decrease in electricity intensity factor due to Renewable Portfolio Standards. The decrease in vehicle emission factors over time is based on Alameda County fleet-average emission factors from 2020-2050. The estimate assumes no change after 2050, since EMFAC2017 does not project past 2050.

2. Assume all buildings become operational as soon as Phase is constructed, based on percent of operational land uses by Phase and percent of operation per year. The first calendar year is adjusted for partial operation based on start date and the last calendar year is adjusted for partial operation such that total lifetime for each land use sums to 30 years.

3. Where existing emissions are greater than operational emissions, no credit has been taken in the “Project 2.0 Operational Difference” column.

4. Construction emissions estimates are based on preliminary estimates from the Project design team.

Abbreviations: CO2e - carbon dioxide equivalents MT - metric ton NPV - net present value yr - year

Proposed AB734 GHG Emissions Methodology Oakland Sports and Mixed-Use Project

Measures For Offsetting Net Increase GHG Emissions 27 Ramboll

5.2 Net New Project Emissions and AB734 Requirements Per the requirements of AB734, the Project must not result in any net new GHG emissions. To offset the increase in GHG emissions from construction in 2020 through 2027 and from any potential increase in GHG emissions from operations beginning in 2024, the Project Sponsor may implement measures including on-site or local off-site mitigation measures or the purchase of qualified GHG credits. Additionally, AB734 requires that at least 50% of the net new Project nonresidential emissions are reduced by local measures. Under this requirement, the reductions from the Project’s TDM and TMP measures described in Exhibit B can be considered local measures (referred to here as “Local GHG Reductions”).

When accounting for Project Features and GHG reduction measures that are currently known and quantifiable, the Project at Full Buildout would result in net new GHG emissions of approximately 34,000 MT CO2e/year from nonresidential sources and approximately 13,150 MT CO2e/year from residential sources. In total, the Local GHG Reductions that are quantifiable at this time equal 28% of the net new nonresidential emissions. The summary comparison of the Proposed Project with Local GHG Reductions for the full buildout year (2028) is shown in Table 10.

The analysis presented here does not include anticipated additional reductions from Project Features associated with LEED Gold design or from local air quality mitigation measures with GHG co-benefits. Additionally, certain components of the Project with anticipated local GHG emissions benefits are uncertain at this time, such as the proposed gondola variant. These Project components are thus excluded from the AB734 emissions inventory at this time.

Proposed AB734 GHG Emissions Methodology Oakland Sports and Mixed-Use Project

Measures For Offsetting Net Increase GHG Emissions 28 Ramboll

Table 10: Emissions Reductions and Offsets Summary

Category CO2e Emissions (MT/year)

Nonresidential Residential

Existing Conditions Emissions (2020) -12,738 -

Project 1.0 Emissions (2028) 54,841 16,767

Net New Project Emissions without GHG Reductions (2028) (Project 1.0 - Existing) 42,104 16,767

Reductions Needed from Local Measures (50% of Net New Nonresidential Emissions)1 -21,052 -

Reductions Achieved through Local Measures (28% of Net New Nonresidential Emissions)2 -11,651

Additional Reductions Needed from Local Measures3 -9,401 -

Additional Reductions Achieved through Offset Credits -37,818

Notes 1. Per AB 734, at least 50% of the nonresidential emissions must be offset by local measures. 2. Local measures include TDM and TMP measures. The percent of net new nonresidential emissions is calculated as shown below.

11,651 MT per year/42,104 MT per year = 28% 3. Reductions achieved through local measures are applied to the nonresidential portion of Project emissions.

Abbreviations: CO2e - carbon dioxide equivalents MT - metric ton

Proposed AB734 GHG Emissions Methodology Oakland Sports and Mixed-Use Project

Measures For Offsetting Net Increase GHG Emissions 29 Ramboll

5.3 Phased Calculation of No Net Additional GHG Emissions The Project will be constructed in phases or subphases as market conditions dictate and certain Project components are uncertain at this time. As such, the Project Sponsor intends to ensure that the no net additional GHG requirement and Local GHG Reduction commitment under AB734 are met through a phased calculation approach. These GHG requirements, among other Project obligations, would be enforced by the City of Oakland through the Project development agreement.

Construction emissions would be calculated and require contracts for purchase of credits entered into no later than the issuance of a grading permit for each construction phase or subphase for horizontal and at the issuance of each building permit for vertical buildings. Operational Emissions would be calculated and require off-site reduction measures in the neighboring communities (if any) identified and/or contracts for purchase of credits entered into no later than the issuance of a temporary certificate of occupancy for each building in that phase or subphase, based on a projected 30-year useful life for that building.

In calculating the emissions, the Applicant shall provide to the City of Oakland calculations and related evidence demonstrating compliance with AB 734, including project design features, onsite reduction measures and/or offsite reduction measures in the neighboring communities, as well as contracts (if any are required to comply with AB 734) for offset credits from projects located within the United States and verified by a third party accredited by the State Air Resources Board (the “Offset Credits”). In considering off-site reduction measures in the neighboring communities, the City of Oakland shall allow Applicant to fund measures that also reduce criteria air pollutants and toxic air contaminants provided Applicant provides evidence that the funds directed to such off-site reduction measures are in an amount at least equal to the amount the Applicant would otherwise pay in the then-current market for Offset Credits for the amount of credits otherwise required to comply with the provisions of AB 734.

Proposed AB734 GHG Emissions Methodology Oakland Sports and Mixed-Use Project

Ramboll

APPENDICES

Proposed AB734 GHG Emissions Methodology Oakland Sports and Mixed-Use Project

Ramboll

APPENDICES

APPENDIX 1 CONSTRUCTION AND OPERATIONS

SUPPORTING TABLES

Phase 1A Phase 1B Phase 2 All Phases

Ballpark Initial Ancillary Development

Additional Ancillary Development --

Ballpark square feet 1,200,000 1,200,000Ballpark Parking spaces 2,000 2,000

Office square feet 250,000 1,250,000 1,500,000Retail square feet 30,000 240,000 270,000

Residential units 540 2,460 3,000Performance Venue square feet 50,400 50,400

Hotel square feet 280,000 280,000Parking Garages spaces 1,240 5,660 6,900

4/20/2023 12/2/2023 9/2/2027 9/2/2027

Notes1

Operational Date

There will an additional 3,500 interim surface parking spaces associated with Phase 1A (Ballpark). However, interim surface lots are not permanent features of the Project and are anticipated to have minimal operational GHG emissions, they are excluded from this phasing plan and the operational GHG inventory. Interim parking is considered for the construction inventory.

Phase

Table CON-1. Project Land Use by Construction PhaseOakland Sports and Mixed-Use Project

Oakland, California

Land Use Type

Ramboll1

Construction Area Construction Activity Equipment Type1 Fuel2 Number HP Load

FactorHours per

DayUtilizations for

Duration2Equipment

Tier3DPF

(Y/N)

Concrete/Industrial Saws Diesel 1 81 0.73 8 100% Tier 4 NExcavators Diesel 6 158 0.38 8 100% Tier 4 N

Tractors/Loaders/Backhoes Diesel 2 97 0.37 8 100% Tier 4 NCrushing/Proc. Equipment Diesel 1 85 0.78 8 100% Tier 4 NConcrete/Industrial Saws Diesel 1 81 0.73 8 100% Tier 4 N

Excavators Diesel 6 158 0.38 8 100% Tier 4 NTractors/Loaders/Backhoes Diesel 2 97 0.37 8 100% Tier 4 NCrushing/Proc. Equipment Diesel 1 85 0.78 8 100% Tier 4 N

Excavators Diesel 2 158 0.38 8 100% Tier 4 NCranes Diesel 4 226 0.29 8 100% Tier 4 N

Excavators Diesel 2 158 0.38 8 100% Tier 4 NCranes Diesel 4 226 0.29 8 100% Tier 4 N

Excavators Diesel 2 158 0.38 8 100% Tier 4 NGraders Diesel 1 187 0.41 8 100% Tier 4 N

Rubber Tired Dozers Diesel 1 247 0.40 8 100% Tier 4 NScrapers Diesel 2 367 0.48 8 100% Tier 4 N

Tractors/Loaders/Backhoes Diesel 2 97 0.37 8 100% Tier 4 NExcavators Diesel 4 158 0.38 8 100% Tier 4 N

Tractors/Loaders/Backhoes Diesel 1 97 0.37 8 100% Tier 4 NRubber Tired Loaders Diesel 2 203 0.36 8 100% Tier 4 N

Cranes Diesel 1 231 0.29 7 100% Tier 4 NForklifts Diesel 3 89 0.20 8 100% Tier 4 N

Generator Sets Diesel 1 84 0.74 8 100% Tier 4 NTractors/Loaders/Backhoes Diesel 3 97 0.37 7 100% Tier 4 N

Welders Diesel 1 46 0.45 8 100% Tier 4 NPavers Diesel 2 130 0.42 8 100% Tier 4 N

Paving Equipment Diesel 2 132 0.36 8 100% Tier 4 NRollers Diesel 2 80 0.38 8 100% Tier 4 N

Architectural Coating Air Compressors Diesel 1 78 0.48 6 100% Tier 4 NExcavators Diesel 2 158 0.38 8 100% Tier 4 N

Graders Diesel 1 187 0.41 8 100% Tier 4 NRubber Tired Dozers Diesel 1 247 0.40 8 100% Tier 4 N

Scrapers Diesel 2 367 0.48 8 100% Tier 4 N

Table CON-2. Construction Off-Road Equipment List

Oakland, CaliforniaOakland Sports and Mixed-Use Project

Grading

Phase 1

Grading

Utility Improvements

Building Construction

Paving

Phase 1 Demolition

Demolition

Geotechnical Work

Geotechnical WorkDPC Area

DDC Area

Phase 2

Ramboll2

Construction Area Construction Activity Equipment Type1 Fuel2 Number HP Load

FactorHours per

DayUtilizations for

Duration2Equipment

Tier3DPF

(Y/N)

Table CON-2. Construction Off-Road Equipment List

Oakland, CaliforniaOakland Sports and Mixed-Use Project

Tractors/Loaders/Backhoes Diesel 2 97 0.37 8 100% Tier 4 NExcavators Diesel 4 158 0.38 8 100% Tier 4 N

Tractors/Loaders/Backhoes Diesel 1 97 0.37 8 100% Tier 4 NRubber Tired Loaders Diesel 2 203 0.36 8 100% Tier 4 N

Cranes Diesel 1 231 0.29 7 100% Tier 4 NForklifts Diesel 3 89 0.20 8 100% Tier 4 N

Generator Sets Diesel 1 84 0.74 8 100% Tier 4 NTractors/Loaders/Backhoes Diesel 3 97 0.37 7 100% Tier 4 N

Welders Diesel 1 46 0.45 8 100% Tier 4 NPavers Diesel 2 130 0.42 8 100% Tier 4 N

Paving Equipment Diesel 2 132 0.36 8 100% Tier 4 NRollers Diesel 2 80 0.38 8 100% Tier 4 N

Architectural Coating Air Compressors Diesel 1 78 0.48 6 100% Tier 4 N

Notes1

2

3

AbbreviationsDDCDPCHP - horsepower

Construction equipment list for the ground improvements phases were provided by the Project sponsor. All other phases utilize CalEEMod® default equipment types.

It is conservatively assumed for the purpose of this analysis that all construction off-road equipment will be diesel-fueled and is utilized for 100% of the construction phase.

All construction equipment will be Tier 4, as required by the Oakland Standard Conditions of Approval.

Phase 2

Utility Improvements

Building Construction

Paving

Ramboll3

Worker Vendor HaulingDDC Area Geotechnical Work 1,695 -- --DPC Area Geotechnical Work 1,590 -- --Phase 1 Demolition 1,250 -- 54Phase 1 Grading 4,500 -- 36,300Phase 1 Utility Improvements 2,016 -- --Phase 1 Building Construction 1,169,550 400,200 --Phase 1 Paving 300 -- --Phase 1 Architectural Coating 6,780 -- --Phase 2 Demolition 1,250 -- 54Phase 2 Grading 3,720 -- 21,700Phase 2 Utility Improvements 2,196 -- --Phase 2 Building Construction 2,661,120 707,256 --Phase 2 Paving 825 -- --Phase 2 Architectural Coating 36,960 -- --

3,893,752 1,107,456 58,108

10.8 7.3 20

Notes1

2

3

CalEEMod® default trip lengths were used for each trip type. CalEEMod® default fleet mix assumptions were used for each trip type.

Total Trips5,059,316

Table CON-3. Construction On-Road TripsOakland Sports and Mixed-Use Project

Oakland, California

Construction Trips per Phase1

Construction ActivityConstruction Area

CalEEMod® Default Trip Length (miles)2

Worker and vendor trips for each phase are based on CalEEMod® defaults. Hauling trips for each phase were provided by the Project Sponsor.

Ramboll4

Annual Baseball Games

Weekday Evening 50% 41

Weekday Day 17% 14

Weekend 33% 27

Weekday Evening 50% 41

Weekday Day 17% 14

Weekend 33% 27

Ballpark Event-Day Trips

Average Trip Length3 Vehicle Trips3 Vehicle-Miles

Traveled#Annual

Vehicle Trips

Annual Vehicle-Miles

Traveledmiles/trip trips/event miles/event trips/year miles/year

Weekday Evening 35,000 1,500 13.3 24,800 329,500 41 1,016,800 13,509,500

Weekday Day 35,000 1,500 13.8 25,600 353,600 14 358,400 4,950,400

Weekend 35,000 1,500 14.2 26,200 372,300 27 707,400 10,052,100

Coliseum Stadium (NFL) Any 54,664 1,500 16.6 26,600 393,000 9 239,400 3,537,000Coliseum Stadium

(Monster Jam)Any 47,500 1,000 18.5 26,300 439,000 1 26,300 439,000

Coliseum Stadium (Motocross)

Any 47,500 1,000 18.5 26,300 439,000 1 26,300 439,000

Weekday Evening 35,000 1,320 13.3 27,400 299,000 41 1,123,400 12,259,000

Weekday Day 35,000 1,320 13.3 27,800 300,000 14 389,200 4,200,000

Weekend 35,000 1,320 14.1 28,600 336,000 27 772,200 9,072,000Howard Terminal

(Concerts)Any 28,000 1,200 11.4 22,800 213,000 9 205,200 1,917,000

Howard Terminal (Other) Any 7,500 480 11.4 6,100 69,600 35 213,500 2,436,000

Howard Terminal (Corporate/Community)

Any 2,000 25 11.4 1,600 18,500 100 160,000 1,850,000

Howard Terminal (Plaza) Any 4,000 25 11.4 3,300 37,100 16 52,800 593,600

Weekday Evening 35,000 1,320 13.7 22,200 257,000 41 910,200 10,537,000

Weekday Day 35,000 1,320 13.7 20,800 227,000 14 291,200 3,178,000

Weekend 35,000 1,320 14.5 22,900 278,000 27 618,300 7,506,000Howard Terminal

(Concerts)Any 28,000 1,200 11.8 19,600 205,000 9 176,400 1,845,000

Howard Terminal (Other) Any 7,500 480 11.8 5,300 62,000 35 185,500 2,170,000

Howard Terminal (Corporate/Community)

Any 2,000 25 11.8 1,400 16,500 100 140,000 1,650,000

Howard Terminal (Plaza) Any 4,000 25 11.8 2,800 33,000 16 44,800 528,000

Ballpark Employee Trips and VMTTotal Vehicle

Trips7Vehicle-Miles

TraveledAnnual Activity

Weekday Weekday Weekdaymiles/trip trips/employee trips/day mi/day days/year trips/year miles/year

235 9.5 0.37 172 1,630 261 44,775 425,358

50 9.5 0.72 72 685 261 18,829 178,875

235 9.5 0.37 172 1,630 261 44,775 425,358

50 9.5 0.37 37 347 261 9,527 90,502

Oakland, CAOakland Sports and Mixed-Use Project

Table OP-1. Existing and Project Conditions Mobile Assumptions

Baseline

Jack London Square (A's Sports and Business Operations)

Coliseum (Arena/Ballpark Operations and Management)

Project 1.0

Howard Terminal (A's Sports and Business Operations)

Howard Terminal (Arena/Ballpark Operations and Management)

Annual Vehicle Trips

Annual Vehicle-Miles

Traveled

Baseline

Coliseum Stadium (A's)

Project 1.0

Howard Terminal (A's Games)

Project 2.0

Howard Terminal (A's Games)

Scenario Land UseNumber of Employees4

Average Trip Length5

Drive Rate Multiplier6

Events per Year

Coliseum Stadium (A's) 82

Howard Terminal (A's Games)

82

Scenario Land Use Day of WeekNumber of

Attendees per Event3

Number of Event-Day Staff3

Stadium Day of WeekPercent of Total

Events1Total Games per

Year2 Games per Year

Ramboll5

235 9.5 0.37 172 1,630 261 44,775 425,358

50 9.5 0.37 37 347 261 9,527 90,502

Ancillary Land Use Trips and VMT

Weekday Weekend Weekday Weekend Weekday Weekendmiles/trip trips/day trips/day mi/day mi/day days/year days/year trips/year miles/year

Residential 3,000 DU 12 8,900 8,000 106,800 96,000 261 104 3,154,900 37,858,800Office 1,500,000 sqft 12 10,900 1,600 130,800 19,200 261 104 3,011,300 36,135,600Retail 180,000 sqft 12 6,600 6,800 79,200 81,600 261 104 2,429,800 29,157,600

Restaurant 90,000 sqft 12 7,500 8,500 90,000 102,000 261 104 2,841,500 34,098,000Hotel 400 rooms 12 3,000 2,300 36,000 27,600 261 104 1,022,200 12,266,400

Performance Venue 3,500 seats 12 3,000 3,000 36,000 36,000 50 0 150,000 1,800,000Residential 3,000 DU 12 6,300 5,700 75,600 68,400 261 104 2,237,100 26,845,200

Office 1,500,000 sqft 12 7,800 1,100 93,600 13,200 261 104 2,150,200 25,802,400Retail 180,000 sqft 12 5,500 5,600 66,000 67,200 261 104 2,017,900 24,214,800

Restaurant 90,000 sqft 12 6,200 7,000 74,400 84,000 261 104 2,346,200 28,154,400Hotel 400 rooms 12 3,000 2,300 36,000 27,600 261 104 1,022,200 12,266,400

Performance Venue 3,500 seats 12 3,000 3,000 36,000 36,000 50 0 150,000 1,800,000

Notes:1.

2.

3.

4.

5.

6.

7.

8.

9. Activity assumptions provided by the Athletics management staff.

Carpool size and drive rate assumptions are based on US Census data for the Coliseum and Jack London Square census tracts. Ramboll assumes that Ballpark operations staff are based at the ballpark land use, whereas all other employee types (sportsoperations, business operations, business operations support) are based at the A's HQ. US Census data from: https://factfinder.census.gov/bkmk/table/1.0/en/ACS/17_5YR/S0801/1400000US06001409000|1400000US06001983200. Accessed in February 2019.

Average breakdown of weekday evening, weekday day, and weekend MLB games were calculated based on game day schedule provided by the Athletics management staff.

Per Athletics management staff, the Athletics play on average one preseason game, 81 regular season games, and typically no post-season games. These conditions are assumed as the average scenario for both the Baseline and Project scenarios.

Event day trips, trip length, and VMT provided by Fehr and Peers and account for attendees and event-day staff.

Employee estimates provided by Athletics management staff.

Vehicle trip length assumed to be 9.5 miles one-way, consistent with the CalEEMod® default for commercial-work trip length for Alameda County.

It is estimated that each employee makes two daily commute trips. Ancillary land use trips, trip length, and VMT provided by Fehr and Peers.

Annual Vehicle Trips

Annual Vehicle-Miles Traveled

Project 1.0

Project 2.0

Total Vehicle Trips8 Vehicle-Miles Traveled8 Annual Activity9

Project 2.0

Howard Terminal (A's Sports and Business Operations)

Howard Terminal (Arena/Ballpark Operations and Management)

Scenario Land Use Size Size UnitAverage Trip

Length8

Ramboll6

Emissions Factors1

Fleet Type Year CO2e Emission Factor Units

Passenger 2020 281 g/mi

Passenger 2028 215 g/mi

All 2020 406 g/mi

All 2028 329 g/mi

Mobile Source EmissionsMobile

Emissions (2020)

Mobile Emissions

(2028)

2020 2028 MT CO2e/yr MT CO2e/yr

Weekday Evening 1,016,800 13,509,500 Passenger 281 215 3,790 2,908

Weekday Day 358,400 4,950,400 Passenger 281 215 1,389 1,065

Weekend 707,400 10,052,100 Passenger 281 215 2,820 2,163

52,600 878,000 Passenger 281 215 246 189

239,400 3,537,000 Passenger 281 215 992 761

18,829 178,875 Passenger 281 215 50 38

Jack London Square HQ 44,775 425,358 Passenger 281 215 119 92

Weekday Evening 1,123,400 12,259,000 Passenger 281 215 3,439 2,638

Weekday Day 389,200 4,200,000 Passenger 281 215 1,178 904

Weekend 772,200 9,072,000 Passenger 281 215 2,545 1,952

631,500 6,796,600 Passenger 281 215 1,907 1,463

9,527 90,502 Passenger 281 215 25 19

44,775 425,358 Passenger 281 215 119 92

2,429,800 29,157,600 All 406 329 11,829 9,583

1,022,200 12,266,400 All 406 329 4,977 4,031

3,011,300 36,135,600 All 406 329 14,661 11,876

2,841,500 34,098,000 All 406 329 13,834 11,206

150,000 1,800,000 Passenger 281 215 505 387

3,154,900 37,858,800 All 406 329 15,360 12,442

Weekday Evening 910,200 10,537,000 Passenger 281 215 2,956 2,268

Weekday Day 291,200 3,178,000 Passenger 281 215 891 684

Weekend 618,300 7,506,000 Passenger 281 215 2,106 1,615

546,700 6,193,000 Passenger 281 215 1,737 1,333

9,527 90,502 Passenger 281 215 25 19

44,775 425,358 Passenger 281 215 119 92

2,017,900 24,214,800 All 406 329 9,824 7,958

1,022,200 12,266,400 All 406 329 4,977 4,031

2,150,200 25,802,400 All 406 329 10,468 8,480

2,346,200 28,154,400 All 406 329 11,422 9,253

150,000 1,800,000 Passenger 281 215 505 387

2,237,100 26,845,200 All 406 329 10,891 8,823

Oakland, CAOakland Sports and Mixed-Use Project

Table OP-1. Existing and Project Conditions Mobile Emissions

Emission Factor (g/mi)Fleet MixScenario Trip Type Location Land Use

Project 2.0

Spectator & Event StaffHoward Terminal

Ballpark

A's Games

Other Events

Employee CommuteArena Management

Sports Team Management

Mixed-Use Visitors Howard Terminal Ancillary Development

Retail

Hotel

Office

Restaurant

Performance Venue

Residential

Project 1.0

Spectator & Event StaffHoward Terminal

Ballpark

A's Games

Other Events

Employee CommuteArena Management

Sports Team Management

Mixed-Use Visitors Howard Terminal Ancillary Development

Retail

Hotel

Office

Restaurant

Performance Venue

Residential

Baseline

Spectator & Event StaffColiseum Stadium

A's Games

Other Events

NFL Games

Employee CommuteArena Management

Sports Team Management

VMT (mi/yr)Trips (trip/yr)

Ramboll7

Oakland, CAOakland Sports and Mixed-Use Project

Table OP-1. Existing and Project Conditions Mobile Emissions

Gondola Reductions2

Mobile Emissions

(2020)

Mobile Emissions

(2028)/size or

/weekday /weekend /yr 2020 2028 MT CO2e/yr MT CO2e/yr

Weekday Evening -10,500 -- -430,500 Passenger 281 215 -121 -93

Weekday Day -14,600 -- -204,400 Passenger 281 215 -57 -44

Weekend -11,500 -- -310,500 Passenger 281 215 -87 -67

-6,000 -- -181,259 Passenger 281 215 -51 -39

-7,560 -6,840 -2,684,520 All 406 329 -1,089 -882

-9,360 -1,320 -2,580,240 All 406 329 -1,047 -848

-6,600 -6,720 -2,421,480 All 406 329 -982 -796

-7,440 -8,400 -2,815,440 All 406 329 -1,142 -925

-3,600 -2,760 -1,226,640 Passenger 281 215 -344 -264

-3,600 -3,600 -180,000 All 406 329 -73 -59

-4,994 -4,017

Notes:

1.

2.

Abbreviations:CO2e - carbon dioxide equivalentsg - gramsmi - milesNFL - National Football Leagueyr - year

References:Fehr & Peers, VMT Tables, February 13, 2019.

Gondola VMT reductions were provided by Fehr and Peers.

Running emission factors for CO2e were estimated using EMFAC2017 for Alameda County. The default Alameda County fleet mix was adjusted for a passenger fleet mix of light-duty autos, motorcycles, light-duty trucks, and medium-duty vehicles to estimate passenger fleet-average emission factors.

VMT Reduction (mi)Fleet Mix

Total Reduction

Emission Factor (g/mi)

Gondola Reductions

Spectator & Event Staff Howard Terminal Ballpark

A's Games

Other Events

Mixed-Use Visitors Howard Terminal Ancillary Development

Residential

Office

Retail

Restaurant

Hotel

Performance Venue

Scenario Trip Type Location Land Use

Ramboll8

Determination of Historical Energy Use Rates

3,331,357 kWh/yr1,361,000 kBtu/yr1,053,744 visitors/yr

3.2 kWh/attendee/yr1.3 kBtu/attendee/yr

Electricity and Natural Gas Use Emission Factor2020 363 lb CO2e/MWh2028 247 lb CO2e/MWh

- 118.3 lb CO2e/MMBtu

Energy Use Rates and Unit Emission Factor Derivation

Usage3,4 Unit Emissions (2020)

Unit Emissions (2028) Usage3,4 Unit Emissions

size unit kWh/size unit-yr kBTU/size unit-yr MT CO2e/size unit/yrA's Games - attendees 3.2 5.2E-04 - 1.3 6.9E-05

Other Events - attendees 3.2 5.2E-04 - 1.3 6.9E-05NFL Games - attendees 3.2 5.2E-04 - 1.3 6.9E-05

A's HQ General Office Building square feet 12 2.1E-03 - 19 1.0E-03A's Games - attendees 3.2 5.2E-04 3.5E-04 1.3 6.9E-05

Other Events - attendees 3.2 5.2E-04 3.5E-04 1.3 6.9E-05Retail Regional Shopping Center square feet 8.0 1.3E-03 9.0E-04 4.6 2.5E-04Hotel Hotel square feet 6.6 1.1E-03 7.4E-04 37 0.0020Office General Office Building square feet 11 1.8E-03 1.2E-03 19 0.0010

Parking Enclosed Parking Garage with Elevator

square feet 5.0 8.2E-04 5.6E-04 0 0

Performance Venue Arena square feet 6.1 1.0E-03 6.8E-04 25 0.0013Residential High Rise Apartment dwelling units 3,851 6.3E-01 4.3E-01 8,730 0.47

Notes:1.

2.

3.

4.

References:

Abbreviations:CalEEMod® - California Emissions Estimator Model lb - pound NFL - National Football LeagueCO2e - carbon dioxide equivalents MLB - Major League Baseball PG&E - Pacific Gas & ElectrickWh - kilowatt-hour MT - metric tons yr - yearkBTU - thousand British Thermal Units MWh - megawatt-hour

California Energy Commission. 2019. Building Energy Efficiency Standards for Residential and Nonresidential Buildings. Available online at: https://www.energy.ca.gov/2018publications/CEC-400-2018-020/CEC-400-2018-020-CMF.pdf

Oakland, CaliforniaOakland Waterfront Ballpark District Project

Table OP-2. Existing and Project Conditions Energy Assumptions

Electricity and natural gas use rates were calculated based on actual 2017 MLB energy use at the Coliseum and attendance data for 2017 for MLB games. PG&E invoices for the MLB season (March through September) are provided in Appendix 2.Electricity CO2e emission factor derivation for 2020 (Baseline scenario) and 2028 (Project Scenario) are shown in "Table OP-7 Electricity Intensity". The per-attendee energy use rate is applied for the MLB, NFL, and Other Events uses for the Baseline and Project scenarios. Improvements to energy efficiency from building energy code cycle updates or LEED Gold features are conservatively excluded for the Project scenario. Electricity and natural gas estimates for Howard Terminal ancillary development land uses based on CalEEMod® 2016.3.2 default energy intensities for climate zone 5. CalEEMod® defaults account for 2016 Title 24. For the Project scenario, lighting electricity use rates were adjusted by 50% for 2019 Title 24 performance improvements.

California Emissions Estimator Model (CalEEMod® ), version 2016.3.2. Available online at: http://www.caleemod.com/

Howard Terminal Ballpark

Howard Terminal Ancillary Development

PG&E Electricity CO2e Emission Factor2

Value1Input

Project

Coliseum A's Electricity UseColiseum A's Natural Gas UseTotal Attendees for MLB GamesPer Attendee Electricity Use RatePer Attendee Natural Gas Use Rate

CalEEMod® Natural Gas CO2e Emission Factor

LocationScenario

Baseline Coliseum Stadium

Natural GasElectricityLand Use Unit

CalEEMod® Land UseLand Use

MT CO2e/size unit/yr

Ramboll9

Determination of Historical Water Use Rates

17,892,655 gal/year1,053,744 visitors/yr

17 gal/attendee/yr

Electricity Use Emission Factor2020 363 lb CO2e/MWh2028 247 lb CO2e/MWh

Determination of Emission Factor for Indirect Electricity Uses3

Determination of Emission Factor for Direct Wastewater Treatment Uses3

CO2 CH4 N2O (ton CO2e/gal) (MT CO2e/MGal)10% 0 2.50E-07 8.48E-10 6.73E-0787% 3.90E-07 1.34E-09 8.48E-10 5.91E-072% 3.90E-07 4.02E-07 8.48E-10 2.36E-07

Water Use Rates and Unit Emission Factor Derivation3

Indoor Outdoor Direct Indirect Electricity (2020)

Indirect Electricity (2028)

A's Games - attendees 17 0 2.3E-05 1.5E-05 1.0E-05Other Events - attendees 17 0 2.3E-05 1.5E-05 1.0E-05NFL Games - attendees 17 0 2.3E-05 1.5E-05 1.0E-05

A's HQ General Office Building square feet 178 109 2.4E-04 2.2E-04 1.5E-04A's Games - attendees 17 0 2.3E-05 1.5E-05 1.0E-05

Other Events - attendees 17 0 2.3E-05 1.5E-05 1.0E-05Retail Regional Shopping Center square feet 74 45 1.0E-04 9.2E-05 6.3E-05Hotel Hotel rooms 25,367 2,819 0.035 0.024 0.016Office General Office Building square feet 178 109 2.4E-04 2.2E-04 1.5E-04

Parking Enclosed Parking Garage with Elevator

spaces 0 0 0 0 0

Performance Venue Arena square feet 431 27 5.9E-04 4.0E-04 2.7E-04Residential High Rise Apartment dwelling units 65,154 41,075 0.09 0.08 0.06

Notes:1.

2.

3.

4.

5.

References:

Abbreviations:CalEEMod - California Emissions Estimator Model kWh - kilowatt-hour MT - metric tonsCO2e - carbon dioxide equivalents lb - pound MWh - megawatt-hourEBMUD - East Bay Municipal Utility District Mgal - million gallons NFL - National Football Leaguegal - gallon MLB - Major League Baseball yr - year

Oakland, CaliforniaOakland Waterfront Ballpark District Project

Table OP-3. Existing and Project Conditions Water and Wastewater Assumptions

191112721112117

Electricity Use (kWh/Mgal)Indirect Electricity Uses

PG&E Electricity CO2e Emission Factor2

InputColiseum A's Stadium Water Use RateTotal Attendees for MLB GamesPer Attendee Water Use Rate

Value1

California Emissions Estimator Model (CalEEMod), version 2016.3.2. Available online at: http://www.caleemod.com/

Howard Terminal Ballpark

Howard Terminal Ancillary Development

Water use rates were calculated based on actual 2017 MLB water consumption at the Coliseum and attendance data for 2017 for MLB games. EBMUD invoices for the MLB season (March through September) are provided in Appendix 2.

Indirect and direct water emissions are calculated per CalEEMod® 2016.3.2 methodology, using default factors presented in CalEEMod Appendix D Tables 9.1 (Water Use Rates), 9.2 (Water and Wastewater Electricity Intensity), 9.3 (Percent of Wastewater Distribution Types), and 9.4 (Wastewater Treatment Direct Emissions).

Electricity CO2e emission factor derivation for 2020 (Baseline scenario) and 2028 (Project Scenario) are shown in "Table OP-7 Electricity Intensity".

The per-attendee water use rate is applied for the MLB, NFL, and Other Events uses for the Baseline and Project cases. Improvements to water use efficiency from building code cycle updates or LEED Gold features are conservatively excluded for the Project scenario. For the purpose of this calculation, all stadium water use is conservatively treated as indoor water use that will result in emissions from wastewater treatment.Water use estimates for Howard Terminal ancillary development land uses based on CalEEMod® 2016.3.2 defaults.

Project

Coliseum StadiumBaseline

Percent

2028 Emission Factor(MT CO2e/Mgal)

0.21

0.39

2020 Emission Factor(MT CO2e/Mgal)

0.31

0.58

Direct Emission FactorEmission Factor by Pollutant(ton/gal)

CalEEMod® Land UseLand UseLocationScenario

1.4

(gal/size unit/yr) (MT CO2e/size unit/yr)

Anaerobic, Facultative LagoonsAerobic

Septic Tank

Unit EmissionsWater Use Rate4,5

Land Use Size Unit

Direct Wastewater Treatment Uses

SupplyTreatmentDistributionWastewater Treatment

Ramboll10

Determination of Historical Waste Disposal Rates

973 tons/yr44% %

1,053,744 visitors/yr5.1E-04 tons/attendee/yr

Determination of Emission Factor for Solid Waste Disposal2

Landfill, No Gas Capture 6.0 %Landfill, Capture Gas Flare 94 %

CO2, No Gas Capture 0.14 ton/ton wasteCH4, No Gas Capture 0.043 ton/ton waste

CO2, Capture Gas Flare 0.23 ton/ton wasteCH4, Capture Gas Flare 0.011 ton/ton waste

25 ton CO2e/ton CH4

0.50 MT CO2e/ton waste

Solid Waste Rates and Unit Emission Factor Derivation

Land Use Unit Solid Waste Generation Rate3,4 Solid Waste Emission Rate

size unit tons/size unit/year MT CO2e/size unit/yrA's Games - attendees 5.1E-04 2.6E-04

Other Events - attendees 5.1E-04 2.6E-04NFL Games - attendees 5.1E-04 2.6E-04

A's HQ General Office Building square feet 9.3E-04 4.7E-04A's Games - attendees 5.1E-04 2.6E-04

Other Events - attendees 5.1E-04 2.6E-04Retail Regional Shopping Center square feet 0.0011 5.3E-04Hotel Hotel rooms 0.55 0.28Office General Office Building square feet 9.3E-04 4.7E-04

Parking Enclosed Parking Garage with Elevator spaces 0 0Performance Venue Arena square feet 3.0E-05 1.5E-05

Residential High Rise Apartment dwelling units 0.46 0.23

Notes:1.

2.

3.

4.

References:

Abbreviations:CalEEMod® - California Emissions Estimator Model CO2e - carbon dioxide equivalents NFL - National Football LeagueCH4 - methane MLB - Major League BaseballCO2 - carbon dioxide MT - metric tons

Coliseum StadiumBaseline

Oakland Waterfront Ballpark District ProjectTable OP-4. Existing and Project Conditions Solid Waste Assumptions

California Emissions Estimator Model (CalEEMod® ), version 2016.3.2. Available online at: http://www.caleemod.com/

Solid waste generation estimates for Howard Terminal ancillary development land uses based on CalEEMod® 2016.3.2 defaults.

100-year Global Warming Potential of CH4

CO2e Emission Factor

Project

Location

Howard Terminal Ballpark

Howard Terminal Ancillary Development

CalEEMod® Land Use

Waste generation rates were calculated based on actual 2017 MLB waste rates at the Coliseum and attendance data for 2017 for MLB games. Coliseum Stadium Waste Management and Recycling Report for the MLB season (March through September) are provided in Appendix 2.Solid waste emissions are calculated per CalEEMod® 2016.3.2 methodology, using default factors presented in CalEEMod Appendix D Tables 10.1 (Solid Waste Disposal Rates) and 10.2 (Support for Solid Waste Emission Factors).The per-attendee waste rate is applied for the MLB, NFL, and Other Events uses for the Baseline and Project cases.

Input

Scenario Land Use

Total Attendees for MLB GamesPer Attendee Solid Waste Disposal Rate

Solid Waste Landfill Gas Treatment Types1

Solid Waste Landfill Gas Emission Factors2

Value

Oakland, California

InputColiseum A's Stadium Waste RateDiversion Rate

Value1

Ramboll11

Baseline Area Source Emissions

CO2 CH4 N2O CO2eLandscaping 0.20 5.5E-04 0 0.22

0.22

Project Stationary Source Emissions

CO2 CH4 N2O CO2eResidential Hearths 94 0.0018 0.0017 94Residential Landscaping 36 0.035 0 37Non-residential Landscaping 0.22 5.7E-04 0 0.23

132

Notes:1.

References:

Abbreviations:CalEEMod® - California Emissions Estimator Model N2O - nitrous oxideCH4 - methane MT - metric tonsCO2 - carbon dioxide yr - yearCO2e - carbon dioxide equivalents

Table OP-5. Existing and Project Conditions Area Source AssumptionsOakland Waterfront Ballpark District Project

Oakland, California

SubcategoryAnnual Greenhouse Gas Emissions (MT/yr)

Total Emissions

Area emissions are from CalEEMod® outputs, provided in Appendix 2.

California Emissions Estimator Model (CalEEMod® ), version 2016.3.2. Available online at: http://www.caleemod.com/

Total Emissions

SubcategoryAnnual Greenhouse Gas Emissions (MT/yr)

Ramboll12

Baseline Stationary Source Emissions1

Operation2 CO2e Emission Factors3 CO2e Emissions

kW HP hr/yr g/bhp-hr MT/yrArena Standby Emergency 1 1,500 2,012 Diesel 50 52Arena Standby Emergency 1 1,500 2,012 Diesel 50 52

105

Project Stationary Source Emissions1

Operation2 CO2e Emission Factors3 CO2e Emissions

kW HP hr/yr g/bhp-hr MT/yrArena Standby Emergency 1 1,500 2,012 diesel 50 52Phase 1 Generators 12 750 1006 diesel 50 315Phase 2 Generators 16 750 1006 diesel 50 420

787

Notes:1.

2.

3.

References:

Abbreviations:bhp - brake-horsepower HP - horsepower MT - metric tonsCO2e - carbon dioxide equivalents hr - hour yr - yearg - grams kW - kilowatt

522

Fuel Type

Fuel Type

Number, size, and fuel of emergency generators were provided by the Project sponsor. Phase 1 and 2 generators were estimated based on the number of buildings per phase anticipated to be greater than 75 feet in height. Per California Building Code, high-rise buildings having occupied floors more than 75 feet above the lowest level of fire department vehicle access must be equipped with emergency and standby power.

USEPA. 1995. AP 42, Volume I, Fifth Edition. §3.4. Large Stationary Diesel and All Stationary Dual-Fuel Engines. Available online at: http://www.epa.gov/ttn/chief/ap42/ch03/final/c03s04.pdf

Operation for routine maintenance and testing is conservatively assumed to be 50 hours per year, the maximum allowable by the Bay Area Air Quality Management District.

522

Location Number of Generators

Size

Total Emissions

CO2 emission factor based on AP-42 (USEPA 1995).

Total Emissions

California Building Code, Part 2, Volume 2, Chapter 27 - Electrical. Available online at: https://up.codes/viewer/california/ca-building-code-2016-v2/chapter/27/electrical#27.

Table OP-6. Existing and Project Conditions Stationary Source AssumptionsOakland Waterfront Ballpark District Project

Oakland, California

SizeLocation Number of

Generators

Ramboll13

Historic Electricty IntensityAnnual Electricity Data 20141,2 20151,3 20161,4 Average5 UnitsCO2 Intensity Factor per Total Energy Delivered 435 405 294 378 lbs CO2/MWh delivered% of Total Energy From Renewables 27% 29.5% 32.8% 29.8% [-]CO2 Intensity Factor per Total Non-Renewable Energy6 596 574 437 538 lbs CO2/MWh delivered

Estimated Intensity Factor for Total Energy Delivered7,8

Model Year 20141,2 20151,3 20161,4 Average5 Units399 384 293 360 lbs CO2/MWh delivered402 387 295 363 lbs CO2e/MWh delivered238 230 175 215 lbs CO2/MWh delivered241 232 177 218 lbs CO2e/MWh delivered0 0 0 0 lbs CO2/MWh delivered

2.6 2.6 2.6 2.6 lbs CO2e/MWh delivered

Notes:1

2

3

4

5

6

7

8

9

Abbreviations:CARB - California Air Resources Board lbs - pounds PGE - Pacific Gas & ElectricCO2 - carbon dioxide MWh - megawatt-hour SB - Senate BillGHG - greenhouse gases RPS - Renewable Portfolio Standards USEPA - US Environmental Protection Agency

Emission factor presented here is 60% projected RPS for 2030 and 100% carbon-free electricity for 2045 consistent with SB 100. Available at: https://leginfo.legislature.ca.gov/faces/billNavClient.xhtml?bill_id=201720180SB100.

2045 RPS (100%)9

Percent of total energy from eligible renewables is from the PGE 2016 Corporate Responsibility Report. Available at: http://www.pgecorp.com/corp_responsibility/reports/2016/PGE_CRSR_Environment.pdf. Percent of total energy from eligible renewables is from the PGE 2017 Corporate Responsibility Report. Available at: http://www.pgecorp.com/corp_responsibility/reports/2017/assets/PGE_CRSR_2017_Environment.pdf.This average uses the most recent three years of data. The emissions metric presented here is calculated based on the total CO2 intensity factor divided by the percent of energy delivered from non-renewable sources. The intensity factor for total energy delivered is estimated by multiplying the percentage of energy delivered from non-renewable energy by the CO2 emissions per total non-renewable energy metric calculated above. The estimate provided here and the energy reports issued by PGE assume that renewable energy sources do not result in any CO2

Global Warming Potentials (GWP) are based on the IPCC Fourth Assessment Report. CH4 and N2O emission factors are from the CalEEMod® version 2016.3.2 defaults for PGE, and are conservatively assumed not to change from these estimates. As more renewable energy is integrated into the electricity grid, these intensity factors will also decrease.

Percent of total energy from eligible renewables is from the PGE 2015 Corporate Responsibility Report. Available at: http://www.pgecorp.com/corp_responsibility/reports/2015/PGE_CRSR_2015.pdf.

2020 RPS (33%)

2030 RPS (60%)9

Total CO2 emission factor from The Climate Registry. Available at: https://www.theclimateregistry.org/our-members/cris-public-reports/. Accessed: April 2018.

Table OP-7. Electricity Intensity Factor DerivationOakland Sports and Mixed-Use Project

Oakland, CA

Ramboll14

All Vehicleslb CO2e/MWh MT CO2e/mi MT CO2e/mi

2020 363 281 4062021 348 272 3962022 334 263 3852023 319 254 3732024 305 245 3642025 290 236 3542026 276 228 3452027 261 221 3372028 247 215 3292029 232 210 3212030 218 205 3152031 203 200 3092032 189 197 3042033 175 193 3002034 160 190 2962035 146 188 2922036 132 186 2902037 117 184 2872038 103 182 2852039 89 181 2832040 74 180 2822041 60 179 2812042 46 178 2802043 31 177 2792044 17 177 2792045 2.6 176 2782046 2.6 176 2782047 2.6 176 2782048 2.6 175 2772049 2.6 175 2772050 2.6 175 277

Notes:1.

2.

3.

Abbreviations:CO2e - carbon dioxide equivalents MWh - megawatt-hourlb - pound MT - metric tons

mi - mile

Year

Table OP-8. Electricity and Mobile Emission FactorsOakland Sports and Mixed-Use Project

Oakland, CA

Mobile Emission Factors1,2,3

Uses a linear interpolation between the electricity intensity factors derived in Table OP-7.Approximation of the decrease in vehicle emission factors over time, based on Alameda fleet-average emission factors from 2020-2050. Assumes no change after 2050, since EMFAC2017 does not project past A passenger vehicle fleet mix is used for all events-based and employee commute trips for the Baseline and Project scenario. Thus, the vehicle emission factor scaling is done separately for the passenger fleet emissions and the overall fleet emissions.

Passenger Vehicles OnlyElectricity Emission

Factors1

Ramboll15

Electricity2 Natural Gas Passenger Other DirectIndirect

Electricity2

2020 0 0 0 0 0 0 0 0 0 02021 0 0 0 0 0 0 0 0 0 02022 0 0 0 0 0 0 0 0 0 02023 1.9 1,267 262 5,823 0,952 689 69 42 47 9,1522024 24 2,797 1,322 8,043 11,680 1,313 210 140 180 25,7092025 24 2,664 1,322 7,756 11,364 1,313 210 134 180 24,9652026 24 2,531 1,322 7,501 11,081 1,313 210 127 180 24,2882027 59 3,820 2,169 7,403 23,800 1,734 398 243 379 40,0072028 132 6,352 3,898 7,456 49,139 2,594 784 467 787 71,6082029 132 5,978 3,898 7,264 48,009 2,594 784 439 787 69,8852030 132 5,604 3,898 7,094 47,046 2,594 784 412 787 68,3502031 132 5,235 3,898 6,944 46,185 2,594 784 385 787 66,9442032 132 4,866 3,898 6,813 45,437 2,594 784 358 787 65,6682033 132 4,497 3,898 6,697 44,784 2,594 784 330 787 64,5032034 132 4,127 3,898 6,596 44,211 2,594 784 303 787 63,4332035 132 3,758 3,898 6,509 43,716 2,594 784 276 787 62,4542036 132 3,389 3,898 6,434 43,291 2,594 784 249 787 61,5572037 132 3,020 3,898 6,369 42,924 2,594 784 222 787 60,7302038 132 2,650 3,898 6,315 42,617 2,594 784 195 787 59,9712039 132 2,281 3,898 6,269 42,362 2,594 784 168 787 59,2742040 132 1,912 3,898 6,230 42,153 2,594 784 141 787 58,6302041 132 1,543 3,898 6,198 41,979 2,594 784 113 787 58,0282042 132 1174 3,898 6,171 41,848 2,594 784 86 787 57,4742043 132 804 3,898 6,148 41,747 2,594 784 59 787 56,9542044 132 435 3,898 6,130 41,667 2,594 784 32 787 56,4592045 132 66 3,898 6,113 41,607 2,594 784 4.9 787 55,9862046 132 66 3,898 6,100 41,549 2,594 784 4.9 787 55,9142047 132 66 3,898 6,089 41,503 2,594 784 4.9 787 55,8572048 132 66 3,898 6,080 41,467 2,594 784 4.9 787 55,8122049 132 66 3,898 6,071 41,445 2,594 784 4.9 787 55,7822050 132 66 3,898 6,064 41,472 2,594 784 4.9 787 55,802

1,241,718Notes:

1.

2.

3.

4.

5.

Abbreviations:CO2e - carbon dioxide equivalentsMT - metric tonsyr - year

Table OP-9. Project 1.0 Operational CO2e Emissions by YearOakland Waterfront Ballpark District Project

Oakland, California

AreaEnergy

WasteWater

Year

Greenhouse Gas Emissions from Project 1.0 (MT CO2e/yr)1

Stationary Source5 Total

Mobile3,4

A passenger vehicle fleet mix is used for all events-based and employee commute trips for the Baseline and Project scenario.Assumes generators operational as soon as phase is constructed, taking into account the percent of year operational for the first year.

Uses a linear interpolation between the electricity intensity factors derived in Table OP-7.Approximation of the decrease in vehicle emission factors over time, based on Alameda fleet-average emission factors from 2020-2050. Assumes no change after 2050, since EMFAC2017 does not project past 2050.

Assumes all buildings become operational as soon as phase is constructed, taking into account the percent of year operational for the first year. The only changes in emissions are due to transportation and electricity becoming cleaner.

Ramboll16

Electricity2 Natural Gas Passenger Other DirectIndirect

Electricity2

2020 0 0 0 0 0 0 0 0 0 02021 0 0 0 0 0 0 0 0 0 02022 0 0 0 0 0 0 0 0 0 02023 1.9 1,267 262 4,951 0,807 689 69 42 47 8,1362024 24 2,797 1,322 6,840 9,894 1,313 210 140 180 22,7192025 24 2,664 1,322 6,596 9,626 1,313 210 134 180 22,0672026 24 2,531 1,322 6,379 9,386 1,313 210 127 180 21,4712027 59 3,820 2,169 6,315 19,124 1,734 398 243 379 34,2422028 132 6,352 3,898 6,398 38,545 2,594 784 467 787 59,9572029 132 5,978 3,898 6,234 37,659 2,594 784 439 787 58,5052030 132 5,604 3,898 6,088 36,903 2,594 784 412 787 57,2022031 132 5,235 3,898 5,959 36,228 2,594 784 385 787 56,0022032 132 4,866 3,898 5,846 35,642 2,594 784 358 787 54,9062033 132 4,497 3,898 5,747 35,129 2,594 784 330 787 53,8982034 132 4,127 3,898 5,661 34,680 2,594 784 303 787 52,9662035 132 3,758 3,898 5,586 34,292 2,594 784 276 787 52,1062036 132 3,389 3,898 5,521 33,958 2,594 784 249 787 51,3122037 132 3,020 3,898 5,466 33,670 2,594 784 222 787 50,5732038 132 2,650 3,898 5,419 33,429 2,594 784 195 787 49,8882039 132 2,281 3,898 5,380 33,229 2,594 784 168 787 49,2532040 132 1,912 3,898 5,347 33,065 2,594 784 141 787 48,6592041 132 1,543 3,898 5,319 32,929 2,594 784 113 787 48,0992042 132 1174 3,898 5,296 32,827 2,594 784 86 787 47,5772043 132 804 3,898 5,276 32,747 2,594 784 59 787 47,0822044 132 435 3,898 5,260 32,684 2,594 784 32 787 46,6062045 132 66 3,898 5,246 32,638 2,594 784 4.9 787 46,1492046 132 66 3,898 5,235 32,592 2,594 784 4.9 787 46,0922047 132 66 3,898 5,225 32,556 2,594 784 4.9 787 46,0462048 132 66 3,898 5,217 32,528 2,594 784 4.9 787 46,0112049 132 66 3,898 5,210 32,510 2,594 784 4.9 787 45,9862050 132 66 3,898 5,204 32,532 2,594 784 4.9 787 46,001

Notes:1.

2.

3.

4.

5.

Abbreviations:CO2e - carbon dioxide equivalentsMT - metric tonsyr - year

A passenger vehicle fleet mix is used for all events-based and employee commute trips for the Baseline and Project scenario.Assumes generators operational as soon as phase is constructed, taking into account the percent of year operational for the first year.

Assume all buildings become operational as soon as phase is constructed, taking into account the percent of year operational for the first year. The only changes in emissions are due to transportation and electricity becoming cleaner.Uses a linear interpolation between the electricity intensity factors derived in Table OP-7.Approximation of the decrease in vehicle emission factors over time, based on Alameda fleet-average emission factors from 2020-2050. Assumes no change after 2050, since EMFAC2017 does not project past 2050.

Table OP-10. Project 2.0 Operational CO2e Emissions by YearOakland Waterfront Ballpark District Project

Oakland, California

Year

Greenhouse Gas Emissions from Project 2.0 (MT CO2e/yr)1

AreaEnergy Mobile3,4

WasteWater

Stationary Source5 Total

Ramboll17

APPENDIX 2 CALEEMOD® OUTPUT FILES

BASELINE CALEEMOD® OUTPUT AREA SOURCE EMISSIONS

Off-road Equipment - Zero out construction emissions.

Off-road Equipment - Zero out construction emissions.

Off-road Equipment - Zero out construction emissions.

1.3 User Entered Comments & Non-Default Data

Project Characteristics - Area source GHG emissions only. Updated to estimated CO2 intensity factor for PGE in 2020 with RPS.

Land Use - Acreage scaled to match site area of 112 acres.

Construction Phase - Zero out construction emissions

Off-road Equipment - Zero out construction emissions.

Off-road Equipment - Zero out construction emissions.

CO2 Intensity (lb/MWhr)

363 CH4 Intensity (lb/MWhr)

0.029 N2O Intensity (lb/MWhr)

0.006

63

Climate Zone 5 Operational Year 2020

Utility Company Pacific Gas & Electric Company

1.2 Other Project Characteristics

Urbanization Urban Wind Speed (m/s) 2.2 Precipitation Freq (Days)

Arena 1,400.00 1000sqft 93.33 1,400,000.00 0

Floor Surface Area Population

Parking Lot 10,000.00 Space 18.67 4,000,000.00 0

1.0 Project Characteristics

1.1 Land Usage

Land Uses Size Metric Lot Acreage

CalEEMod Version: CalEEMod.2016.3.2Page 1 of 1 Date: 1/18/2019 12:27 PM

Oakland Waterfront Ballpark District - Baseline - Area Source GHG Emissions - Alameda County, Annual

Oakland Waterfront Ballpark District - Baseline - Area Source GHG EmissionsAlameda County, Annual

tblOffRoadEquipment OffRoadEquipmentUnitAmount 2.00 0.00

tblOffRoadEquipment OffRoadEquipmentUnitAmount 1.00 0.00

tblOffRoadEquipment OffRoadEquipmentUnitAmount 2.00 0.00

tblOffRoadEquipment OffRoadEquipmentUnitAmount 3.00 0.00

tblOffRoadEquipment OffRoadEquipmentUnitAmount 1.00 0.00

tblOffRoadEquipment OffRoadEquipmentUnitAmount 3.00 0.00

tblOffRoadEquipment OffRoadEquipmentUnitAmount 2.00 0.00

tblOffRoadEquipment OffRoadEquipmentUnitAmount 1.00 0.00

tblOffRoadEquipment OffRoadEquipmentUnitAmount 1.00 0.00

tblLandUse LotAcreage 450.00 93.33

tblOffRoadEquipment OffRoadEquipmentUnitAmount 1.00 0.00

tblEnergyUse T24NG 17.85 0.00

tblLandUse LotAcreage 90.00 18.67

tblEnergyUse NT24NG 6.90 0.00

tblEnergyUse T24E 1.21 0.00

tblEnergyUse LightingElect 0.35 0.00

tblEnergyUse NT24E 3.36 0.00

tblArchitecturalCoating ConstArea_Parking 240,000.00 0.00

tblEnergyUse LightingElect 2.99 0.00

tblArchitecturalCoating ConstArea_Nonresidential_Exterior 700,000.00 0.00

tblArchitecturalCoating ConstArea_Nonresidential_Interior 2,100,000.00 0.00

Architectural Coating - Zero out construction emissions.

Vehicle Trips - Zero out operational emissions from non-area sources.

Energy Use - Zero out operational emissions from non-area sources.

Water And Wastewater - Zero out operational emissions from non-area sources.

Solid Waste - Zero out operational emissions from non-area sources.

Table Name Column Name Default Value New Value

Off-road Equipment - Zero out construction emissions.

Trips and VMT - Zero out construction emissions

Grading -

0.0000 0.0000 0.0000 0.0000 0.0000 0.00002019

NBio- CO2 Total CO2 CH4 N2O CO2e

Year tons/yr MT/yr

Exhaust PM10

PM10 Total

Fugitive PM2.5

Exhaust PM2.5

PM2.5 Total

Bio- CO2

2.0 Emissions Summary

2.1 Overall ConstructionUnmitigated Construction

ROG NOx CO SO2 Fugitive PM10

tblWater IndoorWaterUseRate 603,078,164.63 0.00

tblWater OutdoorWaterUseRate 38,494,350.93 0.00

tblVehicleTrips SU_TR 10.71 0.00

tblVehicleTrips WD_TR 10.71 0.00

tblTripsAndVMT WorkerTripNumber 454.00 0.00

tblVehicleTrips ST_TR 10.71 0.00

tblTripsAndVMT VendorTripNumber 885.00 0.00

tblTripsAndVMT WorkerTripNumber 2,268.00 0.00

tblProjectCharacteristics CO2IntensityFactor 641.35 363

tblSolidWaste SolidWasteGenerationRate 38.53 0.00

tblOffRoadEquipment OffRoadEquipmentUnitAmount 4.00 0.00

tblOffRoadEquipment OffRoadEquipmentUnitAmount 1.00 0.00

tblOffRoadEquipment OffRoadEquipmentUnitAmount 3.00 0.00

tblOffRoadEquipment OffRoadEquipmentUnitAmount 2.00 0.00

tblOffRoadEquipment OffRoadEquipmentUnitAmount 3.00 0.00

tblOffRoadEquipment OffRoadEquipmentUnitAmount 2.00 0.00

tblOffRoadEquipment OffRoadEquipmentUnitAmount 2.00 0.00

tblOffRoadEquipment OffRoadEquipmentUnitAmount 1.00 0.00

tblOffRoadEquipment OffRoadEquipmentUnitAmount 2.00 0.00

Total CO2 CH4 N2O CO2e

Year tons/yr MT/yr

PM10 Total

Fugitive PM2.5

Exhaust PM2.5

PM2.5 Total

Bio- CO2 NBio- CO2

Mitigated Construction

ROG NOx CO SO2 Fugitive PM10

Exhaust PM10

0.0000 0.0000 0.0000 0.0000 0.0000 0.0000Maximum

0.0000 0.0000 0.0000 0.0000 0.0000 0.00002035

0.0000 0.0000 0.0000 0.0000 0.0000 0.00002034

0.0000 0.0000 0.0000 0.0000 0.0000 0.00002033

0.0000 0.0000 0.0000 0.0000 0.0000 0.00002032

0.0000 0.0000 0.0000 0.0000 0.0000 0.00002031

0.0000 0.0000 0.0000 0.0000 0.0000 0.00002030

0.0000 0.0000 0.0000 0.0000 0.0000 0.00002029

0.0000 0.0000 0.0000 0.0000 0.0000 0.00002028

0.0000 0.0000 0.0000 0.0000 0.0000 0.00002027

0.0000 0.0000 0.0000 0.0000 0.0000 0.00002026

0.0000 0.0000 0.0000 0.0000 0.0000 0.00002025

0.0000 0.0000 0.0000 0.0000 0.0000 0.00002024

0.0000 0.0000 0.0000 0.0000 0.0000 0.00002023

0.0000 0.0000 0.0000 0.0000 0.0000 0.00002022

0.0000 0.0000 0.0000 0.0000 0.0000 0.00002021

0.0000 0.0000 0.0000 0.0000 0.0000 0.00002020

Quarter Start Date End Date Maximum Unmitigated ROG + NOX (tons/quarter) Maximum Mitigated ROG + NOX (tons/quarter)

Highest

0.00 0.00 0.00 0.00 0.00 0.000.00 0.00 0.00 0.00 0.00 0.00

NBio-CO2 Total CO2 CH4 N20 CO2e

Percent Reduction

0.00 0.00 0.00 0.00

Exhaust PM10

PM10 Total

Fugitive PM2.5

Exhaust PM2.5

PM2.5 Total

Bio- CO2ROG NOx CO SO2 Fugitive PM10

0.0000 0.0000 0.0000 0.0000 0.0000 0.0000Maximum

0.0000 0.0000 0.0000 0.0000 0.0000 0.00002035

0.0000 0.0000 0.0000 0.0000 0.0000 0.00002034

0.0000 0.0000 0.0000 0.0000 0.0000 0.00002033

0.0000 0.0000 0.0000 0.0000 0.0000 0.00002032

0.0000 0.0000 0.0000 0.0000 0.0000 0.00002031

0.0000 0.0000 0.0000 0.0000 0.0000 0.00002030

0.0000 0.0000 0.0000 0.0000 0.0000 0.00002029

0.0000 0.0000 0.0000 0.0000 0.0000 0.00002028

0.0000 0.0000 0.0000 0.0000 0.0000 0.00002027

0.0000 0.0000 0.0000 0.0000 0.0000 0.00002026

0.0000 0.0000 0.0000 0.0000 0.0000 0.00002025

0.0000 0.0000 0.0000 0.0000 0.0000 0.00002024

0.0000 0.0000 0.0000 0.0000 0.0000 0.00002023

0.0000 0.0000 0.0000 0.0000 0.0000 0.00002022

0.0000 0.0000 0.0000 0.0000 0.0000 0.00002021

0.0000 0.0000 0.0000 0.0000 0.0000 0.00002020

0.0000 0.0000 0.0000 0.0000 0.0000 0.00002019

0.0000 0.0000 0.0000 0.0000 0.0000 0.0000Water

0.0000 0.0000 0.0000 0.0000 0.0000 0.0000Waste

0.0000 0.0000 0.0000 0.0000 0.0000 0.0000Mobile

0.0000 0.0000 0.0000 0.0000 0.0000 0.0000Energy

0.0000 0.2037 0.2037 5.5000e-004

0.0000 0.2174Area

Total CO2 CH4 N2O CO2e

Category tons/yr MT/yr

PM10 Total

Fugitive PM2.5

Exhaust PM2.5

PM2.5 Total

Bio- CO2 NBio- CO2

Mitigated Operational

ROG NOx CO SO2 Fugitive PM10

Exhaust PM10

0.0000 0.2037 0.2037 5.5000e-004

0.0000 0.2174Total

0.0000 0.0000 0.0000 0.0000 0.0000 0.0000Water

0.0000 0.0000 0.0000 0.0000 0.0000 0.0000Waste

0.0000 0.0000 0.0000 0.0000 0.0000 0.0000Mobile

0.0000 0.0000 0.0000 0.0000 0.0000 0.0000Energy

0.0000 0.2037 0.2037 5.5000e-004

0.0000 0.2174Area

Total CO2 CH4 N2O CO2e

Category tons/yr MT/yr

PM10 Total

Fugitive PM2.5

Exhaust PM2.5

PM2.5 Total

Bio- CO2 NBio- CO2

2.2 Overall OperationalUnmitigated Operational

ROG NOx CO SO2 Fugitive PM10

Exhaust PM10

Grading Excavators 0 8.00 158 0.38

Site Preparation Tractors/Loaders/Backhoes 0 8.00 97 0.37

Site Preparation Rubber Tired Dozers 0 8.00 247 0.40

Demolition Rubber Tired Dozers 0 8.00 247 0.40

Demolition Excavators 0 8.00 158 0.38

Load Factor

Demolition Concrete/Industrial Saws 0 8.00 81 0.73

Acres of Grading (Site Preparation Phase): 0

Acres of Grading (Grading Phase): 0

Acres of Paving: 18.67

Residential Indoor: 0; Residential Outdoor: 0; Non-Residential Indoor: 0; Non-Residential Outdoor: 0; Striped Parking Area: 0

OffRoad Equipment

Phase Name Offroad Equipment Type Amount Usage Hours Horse Power

220

6 Architectural Coating Architectural Coating 3/10/2034 1/11/2035 5 220

5 Paving Paving 5/6/2033 3/9/2034 5

310

4 Building Construction Building Construction 6/18/2021 5/5/2033 5 3100

3 Grading Grading 4/10/2020 6/17/2021 5

200

2 Site Preparation Site Preparation 10/25/2019 4/9/2020 5 120

End Date Num Days Week

Num Days Phase Description

1 Demolition Demolition 1/18/2019 10/24/2019 5

3.0 Construction Detail

Construction Phase

Phase Number

Phase Name Phase Type Start Date

0.00 0.00 0.00 0.00 0.00 0.000.00 0.00 0.00 0.00 0.00 0.00

NBio-CO2 Total CO2 CH4 N20 CO2e

Percent Reduction

0.00 0.00 0.00 0.00

Exhaust PM10

PM10 Total

Fugitive PM2.5

Exhaust PM2.5

PM2.5 Total

Bio- CO2ROG NOx CO SO2 Fugitive PM10

0.0000 0.2037 0.2037 5.5000e-004

0.0000 0.2174Total

3.1 Mitigation Measures Construction

3.2 Demolition - 2019Unmitigated Construction On-Site

10.80 7.30 20.00 LD_Mix HDT_Mix HHDT

7.30 20.00 LD_Mix HDT_Mix HHDT

Architectural Coating 0 0.00 0.00 0.00

Paving 0 0.00 0.00 0.00 10.80

10.80 7.30 20.00 LD_Mix HDT_Mix HHDT

7.30 20.00 LD_Mix HDT_Mix HHDT

Building Construction 0 0.00 0.00 0.00

Grading 0 0.00 0.00 0.00 10.80

10.80 7.30 20.00 LD_Mix HDT_Mix HHDT

7.30 20.00 LD_Mix HDT_Mix HHDT

Site Preparation 0 0.00 0.00 0.00

Demolition 0 0.00 0.00 0.00 10.80

Worker Trip Length

Vendor Trip Length

Hauling Trip Length

Worker Vehicle Class

Vendor Vehicle Class

Hauling Vehicle Class

Trips and VMT

Phase Name Offroad Equipment Count

Worker Trip Number

Vendor Trip Number

Hauling Trip Number

Architectural Coating Air Compressors 0 6.00 78 0.48

Paving Rollers 0 8.00 80 0.38

Paving Paving Equipment 0 8.00 132 0.36

Paving Pavers 0 8.00 130 0.42

Building Construction Welders 0 8.00 46 0.45

Building Construction Tractors/Loaders/Backhoes 0 7.00 97 0.37

Building Construction Generator Sets 0 8.00 84 0.74

Building Construction Forklifts 0 8.00 89 0.20

Building Construction Cranes 0 7.00 231 0.29

Grading Tractors/Loaders/Backhoes 0 8.00 97 0.37

Grading Scrapers 0 8.00 367 0.48

Grading Rubber Tired Dozers 0 8.00 247 0.40

Grading Graders 0 8.00 187 0.41

0.0000 0.0000 0.0000 0.0000 0.0000 0.0000Off-Road

Total CO2 CH4 N2O CO2e

Category tons/yr MT/yr

PM10 Total

Fugitive PM2.5

Exhaust PM2.5

PM2.5 Total

Bio- CO2 NBio- CO2

Mitigated Construction On-Site

ROG NOx CO SO2 Fugitive PM10

Exhaust PM10

0.0000 0.0000 0.0000 0.0000 0.0000 0.0000Total

0.0000 0.0000 0.0000 0.0000 0.0000 0.0000Worker

0.0000 0.0000 0.0000 0.0000 0.0000 0.0000Vendor

0.0000 0.0000 0.0000 0.0000 0.0000 0.0000Hauling

Total CO2 CH4 N2O CO2e

Category tons/yr MT/yr

PM10 Total

Fugitive PM2.5

Exhaust PM2.5

PM2.5 Total

Bio- CO2 NBio- CO2

Unmitigated Construction Off-Site

ROG NOx CO SO2 Fugitive PM10

Exhaust PM10

0.0000 0.0000 0.0000 0.0000 0.0000 0.0000Total

0.0000 0.0000 0.0000 0.0000 0.0000 0.0000Off-Road

NBio- CO2 Total CO2 CH4 N2O CO2e

Category tons/yr MT/yr

Exhaust PM10

PM10 Total

Fugitive PM2.5

Exhaust PM2.5

PM2.5 Total

Bio- CO2ROG NOx CO SO2 Fugitive PM10

Unmitigated Construction Off-Site

0.0000 0.0000 0.0000 0.0000 0.0000 0.0000Total

0.0000 0.0000 0.0000 0.0000 0.0000 0.0000Off-Road

0.0000 0.0000 0.0000 0.0000 0.0000 0.0000Fugitive Dust

Total CO2 CH4 N2O CO2e

Category tons/yr MT/yr

PM10 Total

Fugitive PM2.5

Exhaust PM2.5

PM2.5 Total

Bio- CO2 NBio- CO2

3.3 Site Preparation - 2019Unmitigated Construction On-Site

ROG NOx CO SO2 Fugitive PM10

Exhaust PM10

0.0000 0.0000 0.0000 0.0000 0.0000 0.0000Total

0.0000 0.0000 0.0000 0.0000 0.0000 0.0000Worker

0.0000 0.0000 0.0000 0.0000 0.0000 0.0000Vendor

0.0000 0.0000 0.0000 0.0000 0.0000 0.0000Hauling

Total CO2 CH4 N2O CO2e

Category tons/yr MT/yr

PM10 Total

Fugitive PM2.5

Exhaust PM2.5

PM2.5 Total

Bio- CO2 NBio- CO2

Mitigated Construction Off-Site

ROG NOx CO SO2 Fugitive PM10

Exhaust PM10

0.0000 0.0000 0.0000 0.0000 0.0000 0.0000Total

Total CO2 CH4 N2O CO2e

Category tons/yr MT/yr

PM10 Total

Fugitive PM2.5

Exhaust PM2.5

PM2.5 Total

Bio- CO2 NBio- CO2

Mitigated Construction Off-Site

ROG NOx CO SO2 Fugitive PM10

Exhaust PM10

0.0000 0.0000 0.0000 0.0000 0.0000 0.0000Total

0.0000 0.0000 0.0000 0.0000 0.0000 0.0000Off-Road

0.0000 0.0000 0.0000 0.0000 0.0000 0.0000Fugitive Dust

Total CO2 CH4 N2O CO2e

Category tons/yr MT/yr

PM10 Total

Fugitive PM2.5

Exhaust PM2.5

PM2.5 Total

Bio- CO2 NBio- CO2

Mitigated Construction On-Site

ROG NOx CO SO2 Fugitive PM10

Exhaust PM10

0.0000 0.0000 0.0000 0.0000 0.0000 0.0000Total

0.0000 0.0000 0.0000 0.0000 0.0000 0.0000Worker

0.0000 0.0000 0.0000 0.0000 0.0000 0.0000Vendor

0.0000 0.0000 0.0000 0.0000 0.0000 0.0000Hauling

Total CO2 CH4 N2O CO2e

Category tons/yr MT/yr

PM10 Total

Fugitive PM2.5

Exhaust PM2.5

PM2.5 Total

Bio- CO2 NBio- CO2ROG NOx CO SO2 Fugitive PM10

Exhaust PM10

0.0000 0.0000 0.0000 0.0000 0.0000 0.0000Total

0.0000 0.0000 0.0000 0.0000 0.0000 0.0000Worker

0.0000 0.0000 0.0000 0.0000 0.0000 0.0000Vendor

0.0000 0.0000 0.0000 0.0000 0.0000 0.0000Hauling

Total CO2 CH4 N2O CO2e

Category tons/yr MT/yr

PM10 Total

Fugitive PM2.5

Exhaust PM2.5

PM2.5 Total

Bio- CO2 NBio- CO2

Unmitigated Construction Off-Site

ROG NOx CO SO2 Fugitive PM10

Exhaust PM10

0.0000 0.0000 0.0000 0.0000 0.0000 0.0000Total

0.0000 0.0000 0.0000 0.0000 0.0000 0.0000Off-Road

0.0000 0.0000 0.0000 0.0000 0.0000 0.0000Fugitive Dust

Total CO2 CH4 N2O CO2e

Category tons/yr MT/yr

PM10 Total

Fugitive PM2.5

Exhaust PM2.5

PM2.5 Total

Bio- CO2 NBio- CO2

3.3 Site Preparation - 2020Unmitigated Construction On-Site

ROG NOx CO SO2 Fugitive PM10

Exhaust PM10

0.0000 0.0000 0.0000 0.0000 0.0000 0.0000Total

0.0000 0.0000 0.0000 0.0000 0.0000 0.0000Worker

0.0000 0.0000 0.0000 0.0000 0.0000 0.0000Vendor

0.0000 0.0000 0.0000 0.0000 0.0000 0.0000Hauling

3.4 Grading - 2020Unmitigated Construction On-Site

0.0000 0.0000 0.0000 0.0000 0.0000 0.0000Total

0.0000 0.0000 0.0000 0.0000 0.0000 0.0000Worker

0.0000 0.0000 0.0000 0.0000 0.0000 0.0000Vendor

0.0000 0.0000 0.0000 0.0000 0.0000 0.0000Hauling

Total CO2 CH4 N2O CO2e

Category tons/yr MT/yr

PM10 Total

Fugitive PM2.5

Exhaust PM2.5

PM2.5 Total

Bio- CO2 NBio- CO2

Mitigated Construction Off-Site

ROG NOx CO SO2 Fugitive PM10

Exhaust PM10

0.0000 0.0000 0.0000 0.0000 0.0000 0.0000Total

0.0000 0.0000 0.0000 0.0000 0.0000 0.0000Off-Road

0.0000 0.0000 0.0000 0.0000 0.0000 0.0000Fugitive Dust

Total CO2 CH4 N2O CO2e

Category tons/yr MT/yr

PM10 Total

Fugitive PM2.5

Exhaust PM2.5

PM2.5 Total

Bio- CO2 NBio- CO2

Mitigated Construction On-Site

ROG NOx CO SO2 Fugitive PM10

Exhaust PM10

0.0000 0.0000 0.0000 0.0000 0.0000 0.0000Fugitive Dust

Total CO2 CH4 N2O CO2e

Category tons/yr MT/yr

PM10 Total

Fugitive PM2.5

Exhaust PM2.5

PM2.5 Total

Bio- CO2 NBio- CO2

Mitigated Construction On-Site

ROG NOx CO SO2 Fugitive PM10

Exhaust PM10

0.0000 0.0000 0.0000 0.0000 0.0000 0.0000Total

0.0000 0.0000 0.0000 0.0000 0.0000 0.0000Worker

0.0000 0.0000 0.0000 0.0000 0.0000 0.0000Vendor

0.0000 0.0000 0.0000 0.0000 0.0000 0.0000Hauling

Total CO2 CH4 N2O CO2e

Category tons/yr MT/yr

PM10 Total

Fugitive PM2.5

Exhaust PM2.5

PM2.5 Total

Bio- CO2 NBio- CO2

Unmitigated Construction Off-Site

ROG NOx CO SO2 Fugitive PM10

Exhaust PM10

0.0000 0.0000 0.0000 0.0000 0.0000 0.0000Total

0.0000 0.0000 0.0000 0.0000 0.0000 0.0000Off-Road

0.0000 0.0000 0.0000 0.0000 0.0000 0.0000Fugitive Dust

Total CO2 CH4 N2O CO2e

Category tons/yr MT/yr

PM10 Total

Fugitive PM2.5

Exhaust PM2.5

PM2.5 Total

Bio- CO2 NBio- CO2ROG NOx CO SO2 Fugitive PM10

Exhaust PM10

Unmitigated Construction Off-Site

0.0000 0.0000 0.0000 0.0000 0.0000 0.0000Total

0.0000 0.0000 0.0000 0.0000 0.0000 0.0000Off-Road

0.0000 0.0000 0.0000 0.0000 0.0000 0.0000Fugitive Dust

Total CO2 CH4 N2O CO2e

Category tons/yr MT/yr

PM10 Total

Fugitive PM2.5

Exhaust PM2.5

PM2.5 Total

Bio- CO2 NBio- CO2

3.4 Grading - 2021Unmitigated Construction On-Site

ROG NOx CO SO2 Fugitive PM10

Exhaust PM10

0.0000 0.0000 0.0000 0.0000 0.0000 0.0000Total

0.0000 0.0000 0.0000 0.0000 0.0000 0.0000Worker

0.0000 0.0000 0.0000 0.0000 0.0000 0.0000Vendor

0.0000 0.0000 0.0000 0.0000 0.0000 0.0000Hauling

Total CO2 CH4 N2O CO2e

Category tons/yr MT/yr

PM10 Total

Fugitive PM2.5

Exhaust PM2.5

PM2.5 Total

Bio- CO2 NBio- CO2

Mitigated Construction Off-Site

ROG NOx CO SO2 Fugitive PM10

Exhaust PM10

0.0000 0.0000 0.0000 0.0000 0.0000 0.0000Total

0.0000 0.0000 0.0000 0.0000 0.0000 0.0000Off-Road

Total CO2 CH4 N2O CO2e

Category tons/yr MT/yr

PM10 Total

Fugitive PM2.5

Exhaust PM2.5

PM2.5 Total

Bio- CO2 NBio- CO2

Mitigated Construction Off-Site

ROG NOx CO SO2 Fugitive PM10

Exhaust PM10

0.0000 0.0000 0.0000 0.0000 0.0000 0.0000Total

0.0000 0.0000 0.0000 0.0000 0.0000 0.0000Off-Road

0.0000 0.0000 0.0000 0.0000 0.0000 0.0000Fugitive Dust

Total CO2 CH4 N2O CO2e

Category tons/yr MT/yr

PM10 Total

Fugitive PM2.5

Exhaust PM2.5

PM2.5 Total

Bio- CO2 NBio- CO2

Mitigated Construction On-Site

ROG NOx CO SO2 Fugitive PM10

Exhaust PM10

0.0000 0.0000 0.0000 0.0000 0.0000 0.0000Total

0.0000 0.0000 0.0000 0.0000 0.0000 0.0000Worker

0.0000 0.0000 0.0000 0.0000 0.0000 0.0000Vendor

0.0000 0.0000 0.0000 0.0000 0.0000 0.0000Hauling

Total CO2 CH4 N2O CO2e

Category tons/yr MT/yr

PM10 Total

Fugitive PM2.5

Exhaust PM2.5

PM2.5 Total

Bio- CO2 NBio- CO2ROG NOx CO SO2 Fugitive PM10

Exhaust PM10

0.0000 0.0000 0.0000 0.0000 0.0000 0.0000Total

0.0000 0.0000 0.0000 0.0000 0.0000 0.0000Worker

0.0000 0.0000 0.0000 0.0000 0.0000 0.0000Vendor

0.0000 0.0000 0.0000 0.0000 0.0000 0.0000Hauling

Total CO2 CH4 N2O CO2e

Category tons/yr MT/yr

PM10 Total

Fugitive PM2.5

Exhaust PM2.5

PM2.5 Total

Bio- CO2 NBio- CO2

Unmitigated Construction Off-Site

ROG NOx CO SO2 Fugitive PM10

Exhaust PM10

0.0000 0.0000 0.0000 0.0000 0.0000 0.0000Total

0.0000 0.0000 0.0000 0.0000 0.0000 0.0000Off-Road

Total CO2 CH4 N2O CO2e

Category tons/yr MT/yr

PM10 Total

Fugitive PM2.5

Exhaust PM2.5

PM2.5 Total

Bio- CO2 NBio- CO2

3.5 Building Construction - 2021Unmitigated Construction On-Site

ROG NOx CO SO2 Fugitive PM10

Exhaust PM10

0.0000 0.0000 0.0000 0.0000 0.0000 0.0000Total

0.0000 0.0000 0.0000 0.0000 0.0000 0.0000Worker

0.0000 0.0000 0.0000 0.0000 0.0000 0.0000Vendor

0.0000 0.0000 0.0000 0.0000 0.0000 0.0000Hauling

3.5 Building Construction - 2022Unmitigated Construction On-Site

0.0000 0.0000 0.0000 0.0000 0.0000 0.0000Total

0.0000 0.0000 0.0000 0.0000 0.0000 0.0000Worker

0.0000 0.0000 0.0000 0.0000 0.0000 0.0000Vendor

0.0000 0.0000 0.0000 0.0000 0.0000 0.0000Hauling

Total CO2 CH4 N2O CO2e

Category tons/yr MT/yr

PM10 Total

Fugitive PM2.5

Exhaust PM2.5

PM2.5 Total

Bio- CO2 NBio- CO2

Mitigated Construction Off-Site

ROG NOx CO SO2 Fugitive PM10

Exhaust PM10

0.0000 0.0000 0.0000 0.0000 0.0000 0.0000Total

0.0000 0.0000 0.0000 0.0000 0.0000 0.0000Off-Road

Total CO2 CH4 N2O CO2e

Category tons/yr MT/yr

PM10 Total

Fugitive PM2.5

Exhaust PM2.5

PM2.5 Total

Bio- CO2 NBio- CO2

Mitigated Construction On-Site

ROG NOx CO SO2 Fugitive PM10

Exhaust PM10

0.0000 0.0000 0.0000 0.0000 0.0000 0.0000Off-Road

Total CO2 CH4 N2O CO2e

Category tons/yr MT/yr

PM10 Total

Fugitive PM2.5

Exhaust PM2.5

PM2.5 Total

Bio- CO2 NBio- CO2

Mitigated Construction On-Site

ROG NOx CO SO2 Fugitive PM10

Exhaust PM10

0.0000 0.0000 0.0000 0.0000 0.0000 0.0000Total

0.0000 0.0000 0.0000 0.0000 0.0000 0.0000Worker

0.0000 0.0000 0.0000 0.0000 0.0000 0.0000Vendor

0.0000 0.0000 0.0000 0.0000 0.0000 0.0000Hauling

Total CO2 CH4 N2O CO2e

Category tons/yr MT/yr

PM10 Total

Fugitive PM2.5

Exhaust PM2.5

PM2.5 Total

Bio- CO2 NBio- CO2

Unmitigated Construction Off-Site

ROG NOx CO SO2 Fugitive PM10

Exhaust PM10

0.0000 0.0000 0.0000 0.0000 0.0000 0.0000Total

0.0000 0.0000 0.0000 0.0000 0.0000 0.0000Off-Road

Total CO2 CH4 N2O CO2e

Category tons/yr MT/yr

PM10 Total

Fugitive PM2.5

Exhaust PM2.5

PM2.5 Total

Bio- CO2 NBio- CO2ROG NOx CO SO2 Fugitive PM10

Exhaust PM10

Unmitigated Construction Off-Site

0.0000 0.0000 0.0000 0.0000 0.0000 0.0000Total

0.0000 0.0000 0.0000 0.0000 0.0000 0.0000Off-Road

Total CO2 CH4 N2O CO2e

Category tons/yr MT/yr

PM10 Total

Fugitive PM2.5

Exhaust PM2.5

PM2.5 Total

Bio- CO2 NBio- CO2

3.5 Building Construction - 2023Unmitigated Construction On-Site

ROG NOx CO SO2 Fugitive PM10

Exhaust PM10

0.0000 0.0000 0.0000 0.0000 0.0000 0.0000Total

0.0000 0.0000 0.0000 0.0000 0.0000 0.0000Worker

0.0000 0.0000 0.0000 0.0000 0.0000 0.0000Vendor

0.0000 0.0000 0.0000 0.0000 0.0000 0.0000Hauling

Total CO2 CH4 N2O CO2e

Category tons/yr MT/yr

PM10 Total

Fugitive PM2.5

Exhaust PM2.5

PM2.5 Total

Bio- CO2 NBio- CO2

Mitigated Construction Off-Site

ROG NOx CO SO2 Fugitive PM10

Exhaust PM10

0.0000 0.0000 0.0000 0.0000 0.0000 0.0000Total

Total CO2 CH4 N2O CO2e

Category tons/yr MT/yr

PM10 Total

Fugitive PM2.5

Exhaust PM2.5

PM2.5 Total

Bio- CO2 NBio- CO2

Mitigated Construction Off-Site

ROG NOx CO SO2 Fugitive PM10

Exhaust PM10

0.0000 0.0000 0.0000 0.0000 0.0000 0.0000Total

0.0000 0.0000 0.0000 0.0000 0.0000 0.0000Off-Road

Total CO2 CH4 N2O CO2e

Category tons/yr MT/yr

PM10 Total

Fugitive PM2.5

Exhaust PM2.5

PM2.5 Total

Bio- CO2 NBio- CO2

Mitigated Construction On-Site

ROG NOx CO SO2 Fugitive PM10

Exhaust PM10

0.0000 0.0000 0.0000 0.0000 0.0000 0.0000Total

0.0000 0.0000 0.0000 0.0000 0.0000 0.0000Worker

0.0000 0.0000 0.0000 0.0000 0.0000 0.0000Vendor

0.0000 0.0000 0.0000 0.0000 0.0000 0.0000Hauling

Total CO2 CH4 N2O CO2e

Category tons/yr MT/yr

PM10 Total

Fugitive PM2.5

Exhaust PM2.5

PM2.5 Total

Bio- CO2 NBio- CO2ROG NOx CO SO2 Fugitive PM10

Exhaust PM10

0.0000 0.0000 0.0000 0.0000 0.0000 0.0000Total

0.0000 0.0000 0.0000 0.0000 0.0000 0.0000Worker

0.0000 0.0000 0.0000 0.0000 0.0000 0.0000Vendor

0.0000 0.0000 0.0000 0.0000 0.0000 0.0000Hauling

Total CO2 CH4 N2O CO2e

Category tons/yr MT/yr

PM10 Total

Fugitive PM2.5

Exhaust PM2.5

PM2.5 Total

Bio- CO2 NBio- CO2

Unmitigated Construction Off-Site

ROG NOx CO SO2 Fugitive PM10

Exhaust PM10

0.0000 0.0000 0.0000 0.0000 0.0000 0.0000Total

0.0000 0.0000 0.0000 0.0000 0.0000 0.0000Off-Road

Total CO2 CH4 N2O CO2e

Category tons/yr MT/yr

PM10 Total

Fugitive PM2.5

Exhaust PM2.5

PM2.5 Total

Bio- CO2 NBio- CO2

3.5 Building Construction - 2024Unmitigated Construction On-Site

ROG NOx CO SO2 Fugitive PM10

Exhaust PM10

0.0000 0.0000 0.0000 0.0000 0.0000 0.0000Total

0.0000 0.0000 0.0000 0.0000 0.0000 0.0000Worker

0.0000 0.0000 0.0000 0.0000 0.0000 0.0000Vendor

0.0000 0.0000 0.0000 0.0000 0.0000 0.0000Hauling

3.5 Building Construction - 2025Unmitigated Construction On-Site

0.0000 0.0000 0.0000 0.0000 0.0000 0.0000Total

0.0000 0.0000 0.0000 0.0000 0.0000 0.0000Worker

0.0000 0.0000 0.0000 0.0000 0.0000 0.0000Vendor

0.0000 0.0000 0.0000 0.0000 0.0000 0.0000Hauling

Total CO2 CH4 N2O CO2e

Category tons/yr MT/yr

PM10 Total

Fugitive PM2.5

Exhaust PM2.5

PM2.5 Total

Bio- CO2 NBio- CO2

Mitigated Construction Off-Site

ROG NOx CO SO2 Fugitive PM10

Exhaust PM10

0.0000 0.0000 0.0000 0.0000 0.0000 0.0000Total

0.0000 0.0000 0.0000 0.0000 0.0000 0.0000Off-Road

Total CO2 CH4 N2O CO2e

Category tons/yr MT/yr

PM10 Total

Fugitive PM2.5

Exhaust PM2.5

PM2.5 Total

Bio- CO2 NBio- CO2

Mitigated Construction On-Site

ROG NOx CO SO2 Fugitive PM10

Exhaust PM10

0.0000 0.0000 0.0000 0.0000 0.0000 0.0000Off-Road

Total CO2 CH4 N2O CO2e

Category tons/yr MT/yr

PM10 Total

Fugitive PM2.5

Exhaust PM2.5

PM2.5 Total

Bio- CO2 NBio- CO2

Mitigated Construction On-Site

ROG NOx CO SO2 Fugitive PM10

Exhaust PM10

0.0000 0.0000 0.0000 0.0000 0.0000 0.0000Total

0.0000 0.0000 0.0000 0.0000 0.0000 0.0000Worker

0.0000 0.0000 0.0000 0.0000 0.0000 0.0000Vendor

0.0000 0.0000 0.0000 0.0000 0.0000 0.0000Hauling

Total CO2 CH4 N2O CO2e

Category tons/yr MT/yr

PM10 Total

Fugitive PM2.5

Exhaust PM2.5

PM2.5 Total

Bio- CO2 NBio- CO2

Unmitigated Construction Off-Site

ROG NOx CO SO2 Fugitive PM10

Exhaust PM10

0.0000 0.0000 0.0000 0.0000 0.0000 0.0000Total

0.0000 0.0000 0.0000 0.0000 0.0000 0.0000Off-Road

Total CO2 CH4 N2O CO2e

Category tons/yr MT/yr

PM10 Total

Fugitive PM2.5

Exhaust PM2.5

PM2.5 Total

Bio- CO2 NBio- CO2ROG NOx CO SO2 Fugitive PM10

Exhaust PM10

Unmitigated Construction Off-Site

0.0000 0.0000 0.0000 0.0000 0.0000 0.0000Total

0.0000 0.0000 0.0000 0.0000 0.0000 0.0000Off-Road

Total CO2 CH4 N2O CO2e

Category tons/yr MT/yr

PM10 Total

Fugitive PM2.5

Exhaust PM2.5

PM2.5 Total

Bio- CO2 NBio- CO2

3.5 Building Construction - 2026Unmitigated Construction On-Site

ROG NOx CO SO2 Fugitive PM10

Exhaust PM10

0.0000 0.0000 0.0000 0.0000 0.0000 0.0000Total

0.0000 0.0000 0.0000 0.0000 0.0000 0.0000Worker

0.0000 0.0000 0.0000 0.0000 0.0000 0.0000Vendor

0.0000 0.0000 0.0000 0.0000 0.0000 0.0000Hauling

Total CO2 CH4 N2O CO2e

Category tons/yr MT/yr

PM10 Total

Fugitive PM2.5

Exhaust PM2.5

PM2.5 Total

Bio- CO2 NBio- CO2

Mitigated Construction Off-Site

ROG NOx CO SO2 Fugitive PM10

Exhaust PM10

0.0000 0.0000 0.0000 0.0000 0.0000 0.0000Total

Total CO2 CH4 N2O CO2e

Category tons/yr MT/yr

PM10 Total

Fugitive PM2.5

Exhaust PM2.5

PM2.5 Total

Bio- CO2 NBio- CO2

Mitigated Construction Off-Site

ROG NOx CO SO2 Fugitive PM10

Exhaust PM10

0.0000 0.0000 0.0000 0.0000 0.0000 0.0000Total

0.0000 0.0000 0.0000 0.0000 0.0000 0.0000Off-Road

Total CO2 CH4 N2O CO2e

Category tons/yr MT/yr

PM10 Total

Fugitive PM2.5

Exhaust PM2.5

PM2.5 Total

Bio- CO2 NBio- CO2

Mitigated Construction On-Site

ROG NOx CO SO2 Fugitive PM10

Exhaust PM10

0.0000 0.0000 0.0000 0.0000 0.0000 0.0000Total

0.0000 0.0000 0.0000 0.0000 0.0000 0.0000Worker

0.0000 0.0000 0.0000 0.0000 0.0000 0.0000Vendor

0.0000 0.0000 0.0000 0.0000 0.0000 0.0000Hauling

Total CO2 CH4 N2O CO2e

Category tons/yr MT/yr

PM10 Total

Fugitive PM2.5

Exhaust PM2.5

PM2.5 Total

Bio- CO2 NBio- CO2ROG NOx CO SO2 Fugitive PM10

Exhaust PM10

0.0000 0.0000 0.0000 0.0000 0.0000 0.0000Total

0.0000 0.0000 0.0000 0.0000 0.0000 0.0000Worker

0.0000 0.0000 0.0000 0.0000 0.0000 0.0000Vendor

0.0000 0.0000 0.0000 0.0000 0.0000 0.0000Hauling

Total CO2 CH4 N2O CO2e

Category tons/yr MT/yr

PM10 Total

Fugitive PM2.5

Exhaust PM2.5

PM2.5 Total

Bio- CO2 NBio- CO2

Unmitigated Construction Off-Site

ROG NOx CO SO2 Fugitive PM10

Exhaust PM10

0.0000 0.0000 0.0000 0.0000 0.0000 0.0000Total

0.0000 0.0000 0.0000 0.0000 0.0000 0.0000Off-Road

Total CO2 CH4 N2O CO2e

Category tons/yr MT/yr

PM10 Total

Fugitive PM2.5

Exhaust PM2.5

PM2.5 Total

Bio- CO2 NBio- CO2

3.5 Building Construction - 2027Unmitigated Construction On-Site

ROG NOx CO SO2 Fugitive PM10

Exhaust PM10

0.0000 0.0000 0.0000 0.0000 0.0000 0.0000Total

0.0000 0.0000 0.0000 0.0000 0.0000 0.0000Worker

0.0000 0.0000 0.0000 0.0000 0.0000 0.0000Vendor

0.0000 0.0000 0.0000 0.0000 0.0000 0.0000Hauling

3.5 Building Construction - 2028Unmitigated Construction On-Site

0.0000 0.0000 0.0000 0.0000 0.0000 0.0000Total

0.0000 0.0000 0.0000 0.0000 0.0000 0.0000Worker

0.0000 0.0000 0.0000 0.0000 0.0000 0.0000Vendor

0.0000 0.0000 0.0000 0.0000 0.0000 0.0000Hauling

Total CO2 CH4 N2O CO2e

Category tons/yr MT/yr

PM10 Total

Fugitive PM2.5

Exhaust PM2.5

PM2.5 Total

Bio- CO2 NBio- CO2

Mitigated Construction Off-Site

ROG NOx CO SO2 Fugitive PM10

Exhaust PM10

0.0000 0.0000 0.0000 0.0000 0.0000 0.0000Total

0.0000 0.0000 0.0000 0.0000 0.0000 0.0000Off-Road

Total CO2 CH4 N2O CO2e

Category tons/yr MT/yr

PM10 Total

Fugitive PM2.5

Exhaust PM2.5

PM2.5 Total

Bio- CO2 NBio- CO2

Mitigated Construction On-Site

ROG NOx CO SO2 Fugitive PM10

Exhaust PM10

0.0000 0.0000 0.0000 0.0000 0.0000 0.0000Off-Road

Total CO2 CH4 N2O CO2e

Category tons/yr MT/yr

PM10 Total

Fugitive PM2.5

Exhaust PM2.5

PM2.5 Total

Bio- CO2 NBio- CO2

Mitigated Construction On-Site

ROG NOx CO SO2 Fugitive PM10

Exhaust PM10

0.0000 0.0000 0.0000 0.0000 0.0000 0.0000Total

0.0000 0.0000 0.0000 0.0000 0.0000 0.0000Worker

0.0000 0.0000 0.0000 0.0000 0.0000 0.0000Vendor

0.0000 0.0000 0.0000 0.0000 0.0000 0.0000Hauling

Total CO2 CH4 N2O CO2e

Category tons/yr MT/yr

PM10 Total

Fugitive PM2.5

Exhaust PM2.5

PM2.5 Total

Bio- CO2 NBio- CO2

Unmitigated Construction Off-Site

ROG NOx CO SO2 Fugitive PM10

Exhaust PM10

0.0000 0.0000 0.0000 0.0000 0.0000 0.0000Total

0.0000 0.0000 0.0000 0.0000 0.0000 0.0000Off-Road

Total CO2 CH4 N2O CO2e

Category tons/yr MT/yr

PM10 Total

Fugitive PM2.5

Exhaust PM2.5

PM2.5 Total

Bio- CO2 NBio- CO2ROG NOx CO SO2 Fugitive PM10

Exhaust PM10

Unmitigated Construction Off-Site

0.0000 0.0000 0.0000 0.0000 0.0000 0.0000Total

0.0000 0.0000 0.0000 0.0000 0.0000 0.0000Off-Road

Total CO2 CH4 N2O CO2e

Category tons/yr MT/yr

PM10 Total

Fugitive PM2.5

Exhaust PM2.5

PM2.5 Total

Bio- CO2 NBio- CO2

3.5 Building Construction - 2029Unmitigated Construction On-Site

ROG NOx CO SO2 Fugitive PM10

Exhaust PM10

0.0000 0.0000 0.0000 0.0000 0.0000 0.0000Total

0.0000 0.0000 0.0000 0.0000 0.0000 0.0000Worker

0.0000 0.0000 0.0000 0.0000 0.0000 0.0000Vendor

0.0000 0.0000 0.0000 0.0000 0.0000 0.0000Hauling

Total CO2 CH4 N2O CO2e

Category tons/yr MT/yr

PM10 Total

Fugitive PM2.5

Exhaust PM2.5

PM2.5 Total

Bio- CO2 NBio- CO2

Mitigated Construction Off-Site

ROG NOx CO SO2 Fugitive PM10

Exhaust PM10

0.0000 0.0000 0.0000 0.0000 0.0000 0.0000Total

Total CO2 CH4 N2O CO2e

Category tons/yr MT/yr

PM10 Total

Fugitive PM2.5

Exhaust PM2.5

PM2.5 Total

Bio- CO2 NBio- CO2

Mitigated Construction Off-Site

ROG NOx CO SO2 Fugitive PM10

Exhaust PM10

0.0000 0.0000 0.0000 0.0000 0.0000 0.0000Total

0.0000 0.0000 0.0000 0.0000 0.0000 0.0000Off-Road

Total CO2 CH4 N2O CO2e

Category tons/yr MT/yr

PM10 Total

Fugitive PM2.5

Exhaust PM2.5

PM2.5 Total

Bio- CO2 NBio- CO2

Mitigated Construction On-Site

ROG NOx CO SO2 Fugitive PM10

Exhaust PM10

0.0000 0.0000 0.0000 0.0000 0.0000 0.0000Total

0.0000 0.0000 0.0000 0.0000 0.0000 0.0000Worker

0.0000 0.0000 0.0000 0.0000 0.0000 0.0000Vendor

0.0000 0.0000 0.0000 0.0000 0.0000 0.0000Hauling

Total CO2 CH4 N2O CO2e

Category tons/yr MT/yr

PM10 Total

Fugitive PM2.5

Exhaust PM2.5

PM2.5 Total

Bio- CO2 NBio- CO2ROG NOx CO SO2 Fugitive PM10

Exhaust PM10

0.0000 0.0000 0.0000 0.0000 0.0000 0.0000Total

0.0000 0.0000 0.0000 0.0000 0.0000 0.0000Worker

0.0000 0.0000 0.0000 0.0000 0.0000 0.0000Vendor

0.0000 0.0000 0.0000 0.0000 0.0000 0.0000Hauling

Total CO2 CH4 N2O CO2e

Category tons/yr MT/yr

PM10 Total

Fugitive PM2.5

Exhaust PM2.5

PM2.5 Total

Bio- CO2 NBio- CO2

Unmitigated Construction Off-Site

ROG NOx CO SO2 Fugitive PM10

Exhaust PM10

0.0000 0.0000 0.0000 0.0000 0.0000 0.0000Total

0.0000 0.0000 0.0000 0.0000 0.0000 0.0000Off-Road

Total CO2 CH4 N2O CO2e

Category tons/yr MT/yr

PM10 Total

Fugitive PM2.5

Exhaust PM2.5

PM2.5 Total

Bio- CO2 NBio- CO2

3.5 Building Construction - 2030Unmitigated Construction On-Site

ROG NOx CO SO2 Fugitive PM10

Exhaust PM10

0.0000 0.0000 0.0000 0.0000 0.0000 0.0000Total

0.0000 0.0000 0.0000 0.0000 0.0000 0.0000Worker

0.0000 0.0000 0.0000 0.0000 0.0000 0.0000Vendor

0.0000 0.0000 0.0000 0.0000 0.0000 0.0000Hauling

3.5 Building Construction - 2031Unmitigated Construction On-Site

0.0000 0.0000 0.0000 0.0000 0.0000 0.0000Total

0.0000 0.0000 0.0000 0.0000 0.0000 0.0000Worker

0.0000 0.0000 0.0000 0.0000 0.0000 0.0000Vendor

0.0000 0.0000 0.0000 0.0000 0.0000 0.0000Hauling

Total CO2 CH4 N2O CO2e

Category tons/yr MT/yr

PM10 Total

Fugitive PM2.5

Exhaust PM2.5

PM2.5 Total

Bio- CO2 NBio- CO2

Mitigated Construction Off-Site

ROG NOx CO SO2 Fugitive PM10

Exhaust PM10

0.0000 0.0000 0.0000 0.0000 0.0000 0.0000Total

0.0000 0.0000 0.0000 0.0000 0.0000 0.0000Off-Road

Total CO2 CH4 N2O CO2e

Category tons/yr MT/yr

PM10 Total

Fugitive PM2.5

Exhaust PM2.5

PM2.5 Total

Bio- CO2 NBio- CO2

Mitigated Construction On-Site

ROG NOx CO SO2 Fugitive PM10

Exhaust PM10

0.0000 0.0000 0.0000 0.0000 0.0000 0.0000Off-Road

Total CO2 CH4 N2O CO2e

Category tons/yr MT/yr

PM10 Total

Fugitive PM2.5

Exhaust PM2.5

PM2.5 Total

Bio- CO2 NBio- CO2

Mitigated Construction On-Site

ROG NOx CO SO2 Fugitive PM10

Exhaust PM10

0.0000 0.0000 0.0000 0.0000 0.0000 0.0000Total

0.0000 0.0000 0.0000 0.0000 0.0000 0.0000Worker

0.0000 0.0000 0.0000 0.0000 0.0000 0.0000Vendor

0.0000 0.0000 0.0000 0.0000 0.0000 0.0000Hauling

Total CO2 CH4 N2O CO2e

Category tons/yr MT/yr

PM10 Total

Fugitive PM2.5

Exhaust PM2.5

PM2.5 Total

Bio- CO2 NBio- CO2

Unmitigated Construction Off-Site

ROG NOx CO SO2 Fugitive PM10

Exhaust PM10

0.0000 0.0000 0.0000 0.0000 0.0000 0.0000Total

0.0000 0.0000 0.0000 0.0000 0.0000 0.0000Off-Road

Total CO2 CH4 N2O CO2e

Category tons/yr MT/yr

PM10 Total

Fugitive PM2.5

Exhaust PM2.5

PM2.5 Total

Bio- CO2 NBio- CO2ROG NOx CO SO2 Fugitive PM10

Exhaust PM10

Unmitigated Construction Off-Site

0.0000 0.0000 0.0000 0.0000 0.0000 0.0000Total

0.0000 0.0000 0.0000 0.0000 0.0000 0.0000Off-Road

Total CO2 CH4 N2O CO2e

Category tons/yr MT/yr

PM10 Total

Fugitive PM2.5

Exhaust PM2.5

PM2.5 Total

Bio- CO2 NBio- CO2

3.5 Building Construction - 2032Unmitigated Construction On-Site

ROG NOx CO SO2 Fugitive PM10

Exhaust PM10

0.0000 0.0000 0.0000 0.0000 0.0000 0.0000Total

0.0000 0.0000 0.0000 0.0000 0.0000 0.0000Worker

0.0000 0.0000 0.0000 0.0000 0.0000 0.0000Vendor

0.0000 0.0000 0.0000 0.0000 0.0000 0.0000Hauling

Total CO2 CH4 N2O CO2e

Category tons/yr MT/yr

PM10 Total

Fugitive PM2.5

Exhaust PM2.5

PM2.5 Total

Bio- CO2 NBio- CO2

Mitigated Construction Off-Site

ROG NOx CO SO2 Fugitive PM10

Exhaust PM10

0.0000 0.0000 0.0000 0.0000 0.0000 0.0000Total

Total CO2 CH4 N2O CO2e

Category tons/yr MT/yr

PM10 Total

Fugitive PM2.5

Exhaust PM2.5

PM2.5 Total

Bio- CO2 NBio- CO2

Mitigated Construction Off-Site

ROG NOx CO SO2 Fugitive PM10

Exhaust PM10

0.0000 0.0000 0.0000 0.0000 0.0000 0.0000Total

0.0000 0.0000 0.0000 0.0000 0.0000 0.0000Off-Road

Total CO2 CH4 N2O CO2e

Category tons/yr MT/yr

PM10 Total

Fugitive PM2.5

Exhaust PM2.5

PM2.5 Total

Bio- CO2 NBio- CO2

Mitigated Construction On-Site

ROG NOx CO SO2 Fugitive PM10

Exhaust PM10

0.0000 0.0000 0.0000 0.0000 0.0000 0.0000Total

0.0000 0.0000 0.0000 0.0000 0.0000 0.0000Worker

0.0000 0.0000 0.0000 0.0000 0.0000 0.0000Vendor

0.0000 0.0000 0.0000 0.0000 0.0000 0.0000Hauling

Total CO2 CH4 N2O CO2e

Category tons/yr MT/yr

PM10 Total

Fugitive PM2.5

Exhaust PM2.5

PM2.5 Total

Bio- CO2 NBio- CO2ROG NOx CO SO2 Fugitive PM10

Exhaust PM10

0.0000 0.0000 0.0000 0.0000 0.0000 0.0000Total

0.0000 0.0000 0.0000 0.0000 0.0000 0.0000Worker

0.0000 0.0000 0.0000 0.0000 0.0000 0.0000Vendor

0.0000 0.0000 0.0000 0.0000 0.0000 0.0000Hauling

Total CO2 CH4 N2O CO2e

Category tons/yr MT/yr

PM10 Total

Fugitive PM2.5

Exhaust PM2.5

PM2.5 Total

Bio- CO2 NBio- CO2

Unmitigated Construction Off-Site

ROG NOx CO SO2 Fugitive PM10

Exhaust PM10

0.0000 0.0000 0.0000 0.0000 0.0000 0.0000Total

0.0000 0.0000 0.0000 0.0000 0.0000 0.0000Off-Road

Total CO2 CH4 N2O CO2e

Category tons/yr MT/yr

PM10 Total

Fugitive PM2.5

Exhaust PM2.5

PM2.5 Total

Bio- CO2 NBio- CO2

3.5 Building Construction - 2033Unmitigated Construction On-Site

ROG NOx CO SO2 Fugitive PM10

Exhaust PM10

0.0000 0.0000 0.0000 0.0000 0.0000 0.0000Total

0.0000 0.0000 0.0000 0.0000 0.0000 0.0000Worker

0.0000 0.0000 0.0000 0.0000 0.0000 0.0000Vendor

0.0000 0.0000 0.0000 0.0000 0.0000 0.0000Hauling

3.6 Paving - 2033Unmitigated Construction On-Site

0.0000 0.0000 0.0000 0.0000 0.0000 0.0000Total

0.0000 0.0000 0.0000 0.0000 0.0000 0.0000Worker

0.0000 0.0000 0.0000 0.0000 0.0000 0.0000Vendor

0.0000 0.0000 0.0000 0.0000 0.0000 0.0000Hauling

Total CO2 CH4 N2O CO2e

Category tons/yr MT/yr

PM10 Total

Fugitive PM2.5

Exhaust PM2.5

PM2.5 Total

Bio- CO2 NBio- CO2

Mitigated Construction Off-Site

ROG NOx CO SO2 Fugitive PM10

Exhaust PM10

0.0000 0.0000 0.0000 0.0000 0.0000 0.0000Total

0.0000 0.0000 0.0000 0.0000 0.0000 0.0000Off-Road

Total CO2 CH4 N2O CO2e

Category tons/yr MT/yr

PM10 Total

Fugitive PM2.5

Exhaust PM2.5

PM2.5 Total

Bio- CO2 NBio- CO2

Mitigated Construction On-Site

ROG NOx CO SO2 Fugitive PM10

Exhaust PM10

0.0000 0.0000 0.0000 0.0000 0.0000 0.0000Off-Road

Total CO2 CH4 N2O CO2e

Category tons/yr MT/yr

PM10 Total

Fugitive PM2.5

Exhaust PM2.5

PM2.5 Total

Bio- CO2 NBio- CO2

Mitigated Construction On-Site

ROG NOx CO SO2 Fugitive PM10

Exhaust PM10

0.0000 0.0000 0.0000 0.0000 0.0000 0.0000Total

0.0000 0.0000 0.0000 0.0000 0.0000 0.0000Worker

0.0000 0.0000 0.0000 0.0000 0.0000 0.0000Vendor

0.0000 0.0000 0.0000 0.0000 0.0000 0.0000Hauling

Total CO2 CH4 N2O CO2e

Category tons/yr MT/yr

PM10 Total

Fugitive PM2.5

Exhaust PM2.5

PM2.5 Total

Bio- CO2 NBio- CO2

Unmitigated Construction Off-Site

ROG NOx CO SO2 Fugitive PM10

Exhaust PM10

0.0000 0.0000 0.0000 0.0000 0.0000 0.0000Total

0.0000 0.0000 0.0000 0.0000 0.0000 0.0000Paving

0.0000 0.0000 0.0000 0.0000 0.0000 0.0000Off-Road

Total CO2 CH4 N2O CO2e

Category tons/yr MT/yr

PM10 Total

Fugitive PM2.5

Exhaust PM2.5

PM2.5 Total

Bio- CO2 NBio- CO2ROG NOx CO SO2 Fugitive PM10

Exhaust PM10

Unmitigated Construction Off-Site

0.0000 0.0000 0.0000 0.0000 0.0000 0.0000Total

0.0000 0.0000 0.0000 0.0000 0.0000 0.0000Paving

0.0000 0.0000 0.0000 0.0000 0.0000 0.0000Off-Road

Total CO2 CH4 N2O CO2e

Category tons/yr MT/yr

PM10 Total

Fugitive PM2.5

Exhaust PM2.5

PM2.5 Total

Bio- CO2 NBio- CO2

3.6 Paving - 2034Unmitigated Construction On-Site

ROG NOx CO SO2 Fugitive PM10

Exhaust PM10

0.0000 0.0000 0.0000 0.0000 0.0000 0.0000Total

0.0000 0.0000 0.0000 0.0000 0.0000 0.0000Worker

0.0000 0.0000 0.0000 0.0000 0.0000 0.0000Vendor

0.0000 0.0000 0.0000 0.0000 0.0000 0.0000Hauling

Total CO2 CH4 N2O CO2e

Category tons/yr MT/yr

PM10 Total

Fugitive PM2.5

Exhaust PM2.5

PM2.5 Total

Bio- CO2 NBio- CO2

Mitigated Construction Off-Site

ROG NOx CO SO2 Fugitive PM10

Exhaust PM10

0.0000 0.0000 0.0000 0.0000 0.0000 0.0000Total

0.0000 0.0000 0.0000 0.0000 0.0000 0.0000Paving

Total CO2 CH4 N2O CO2e

Category tons/yr MT/yr

PM10 Total

Fugitive PM2.5

Exhaust PM2.5

PM2.5 Total

Bio- CO2 NBio- CO2

Mitigated Construction Off-Site

ROG NOx CO SO2 Fugitive PM10

Exhaust PM10

0.0000 0.0000 0.0000 0.0000 0.0000 0.0000Total

0.0000 0.0000 0.0000 0.0000 0.0000 0.0000Paving

0.0000 0.0000 0.0000 0.0000 0.0000 0.0000Off-Road

Total CO2 CH4 N2O CO2e

Category tons/yr MT/yr

PM10 Total

Fugitive PM2.5

Exhaust PM2.5

PM2.5 Total

Bio- CO2 NBio- CO2

Mitigated Construction On-Site

ROG NOx CO SO2 Fugitive PM10

Exhaust PM10

0.0000 0.0000 0.0000 0.0000 0.0000 0.0000Total

0.0000 0.0000 0.0000 0.0000 0.0000 0.0000Worker

0.0000 0.0000 0.0000 0.0000 0.0000 0.0000Vendor

0.0000 0.0000 0.0000 0.0000 0.0000 0.0000Hauling

Total CO2 CH4 N2O CO2e

Category tons/yr MT/yr

PM10 Total

Fugitive PM2.5

Exhaust PM2.5

PM2.5 Total

Bio- CO2 NBio- CO2ROG NOx CO SO2 Fugitive PM10

Exhaust PM10

0.0000 0.0000 0.0000 0.0000 0.0000 0.0000Total

0.0000 0.0000 0.0000 0.0000 0.0000 0.0000Worker

0.0000 0.0000 0.0000 0.0000 0.0000 0.0000Vendor

0.0000 0.0000 0.0000 0.0000 0.0000 0.0000Hauling

Total CO2 CH4 N2O CO2e

Category tons/yr MT/yr

PM10 Total

Fugitive PM2.5

Exhaust PM2.5

PM2.5 Total

Bio- CO2 NBio- CO2

Unmitigated Construction Off-Site

ROG NOx CO SO2 Fugitive PM10

Exhaust PM10

0.0000 0.0000 0.0000 0.0000 0.0000 0.0000Total

0.0000 0.0000 0.0000 0.0000 0.0000 0.0000Off-Road

0.0000 0.0000 0.0000 0.0000 0.0000 0.0000Archit. Coating

Total CO2 CH4 N2O CO2e

Category tons/yr MT/yr

PM10 Total

Fugitive PM2.5

Exhaust PM2.5

PM2.5 Total

Bio- CO2 NBio- CO2

3.7 Architectural Coating - 2034Unmitigated Construction On-Site

ROG NOx CO SO2 Fugitive PM10

Exhaust PM10

0.0000 0.0000 0.0000 0.0000 0.0000 0.0000Total

0.0000 0.0000 0.0000 0.0000 0.0000 0.0000Worker

0.0000 0.0000 0.0000 0.0000 0.0000 0.0000Vendor

0.0000 0.0000 0.0000 0.0000 0.0000 0.0000Hauling

3.7 Architectural Coating - 2035Unmitigated Construction On-Site

0.0000 0.0000 0.0000 0.0000 0.0000 0.0000Total

0.0000 0.0000 0.0000 0.0000 0.0000 0.0000Worker

0.0000 0.0000 0.0000 0.0000 0.0000 0.0000Vendor

0.0000 0.0000 0.0000 0.0000 0.0000 0.0000Hauling

Total CO2 CH4 N2O CO2e

Category tons/yr MT/yr

PM10 Total

Fugitive PM2.5

Exhaust PM2.5

PM2.5 Total

Bio- CO2 NBio- CO2

Mitigated Construction Off-Site

ROG NOx CO SO2 Fugitive PM10

Exhaust PM10

0.0000 0.0000 0.0000 0.0000 0.0000 0.0000Total

0.0000 0.0000 0.0000 0.0000 0.0000 0.0000Off-Road

0.0000 0.0000 0.0000 0.0000 0.0000 0.0000Archit. Coating

Total CO2 CH4 N2O CO2e

Category tons/yr MT/yr

PM10 Total

Fugitive PM2.5

Exhaust PM2.5

PM2.5 Total

Bio- CO2 NBio- CO2

Mitigated Construction On-Site

ROG NOx CO SO2 Fugitive PM10

Exhaust PM10

0.0000 0.0000 0.0000 0.0000 0.0000 0.0000Archit. Coating

Total CO2 CH4 N2O CO2e

Category tons/yr MT/yr

PM10 Total

Fugitive PM2.5

Exhaust PM2.5

PM2.5 Total

Bio- CO2 NBio- CO2

Mitigated Construction On-Site

ROG NOx CO SO2 Fugitive PM10

Exhaust PM10

0.0000 0.0000 0.0000 0.0000 0.0000 0.0000Total

0.0000 0.0000 0.0000 0.0000 0.0000 0.0000Worker

0.0000 0.0000 0.0000 0.0000 0.0000 0.0000Vendor

0.0000 0.0000 0.0000 0.0000 0.0000 0.0000Hauling

Total CO2 CH4 N2O CO2e

Category tons/yr MT/yr

PM10 Total

Fugitive PM2.5

Exhaust PM2.5

PM2.5 Total

Bio- CO2 NBio- CO2

Unmitigated Construction Off-Site

ROG NOx CO SO2 Fugitive PM10

Exhaust PM10

0.0000 0.0000 0.0000 0.0000 0.0000 0.0000Total

0.0000 0.0000 0.0000 0.0000 0.0000 0.0000Off-Road

0.0000 0.0000 0.0000 0.0000 0.0000 0.0000Archit. Coating

Total CO2 CH4 N2O CO2e

Category tons/yr MT/yr

PM10 Total

Fugitive PM2.5

Exhaust PM2.5

PM2.5 Total

Bio- CO2 NBio- CO2ROG NOx CO SO2 Fugitive PM10

Exhaust PM10

0.0000 0.0000 0.0000 0.0000 0.0000 0.0000Unmitigated

0.0000 0.0000 0.0000 0.0000 0.0000 0.0000Mitigated

NBio- CO2 Total CO2 CH4 N2O CO2e

Category tons/yr MT/yr

Exhaust PM10

PM10 Total

Fugitive PM2.5

Exhaust PM2.5

PM2.5 Total

Bio- CO2

4.0 Operational Detail - Mobile

4.1 Mitigation Measures Mobile

ROG NOx CO SO2 Fugitive PM10

0.0000 0.0000 0.0000 0.0000 0.0000 0.0000Total

0.0000 0.0000 0.0000 0.0000 0.0000 0.0000Worker

0.0000 0.0000 0.0000 0.0000 0.0000 0.0000Vendor

0.0000 0.0000 0.0000 0.0000 0.0000 0.0000Hauling

Total CO2 CH4 N2O CO2e

Category tons/yr MT/yr

PM10 Total

Fugitive PM2.5

Exhaust PM2.5

PM2.5 Total

Bio- CO2 NBio- CO2

Mitigated Construction Off-Site

ROG NOx CO SO2 Fugitive PM10

Exhaust PM10

0.0000 0.0000 0.0000 0.0000 0.0000 0.0000Total

0.0000 0.0000 0.0000 0.0000 0.0000 0.0000Off-Road

CO2e

Category tons/yr MT/yr

PM2.5 Total

Bio- CO2 NBio- CO2 Total CO2 CH4 N2OSO2 Fugitive PM10

Exhaust PM10

PM10 Total

Fugitive PM2.5

Exhaust PM2.5

0.000308 0.000759

5.0 Energy Detail

Historical Energy Use: N

5.1 Mitigation Measures Energy

ROG NOx CO

0.005228 0.022658 0.042795 0.002118 0.002805 0.005569Parking Lot 0.558186 0.040947 0.190770 0.110456 0.017401

0.042795 0.002118 0.002805 0.005569 0.000308 0.000759

SBUS MH

Arena 0.558186 0.040947 0.190770 0.110456 0.017401 0.005228 0.022658

LHD2 MHD HHD OBUS UBUS MCYLand Use LDA LDT1 LDT2 MDV LHD1

0.00 0.00 0 0 0

4.4 Fleet Mix

81.00 19.00 66 28 6

Parking Lot 9.50 7.30 7.30 0.00

H-S or C-C H-O or C-NW Primary Diverted Pass-by

Arena 9.50 7.30 7.30 0.00

4.3 Trip Type Information

Miles Trip % Trip Purpose %

Land Use H-W or C-W H-S or C-C H-O or C-NW H-W or C-W

Total 0.00 0.00 0.00Parking Lot 0.00 0.00 0.00

Annual VMT

Arena 0.00 0.00 0.00

4.2 Trip Summary Information

Average Daily Trip Rate Unmitigated MitigatedLand Use Weekday Saturday Sunday Annual VMT

0.0000

5.3 Energy by Land Use - Electricity

0.0000 0.0000 0.0000 0.0000 0.0000

0.0000 0.0000 0.0000 0.0000

Total

0.0000 0.0000

0.0000

Parking Lot 0

0.0000 0.0000 0.0000 0.0000 0.0000

Land Use kBTU/yr tons/yr MT/yr

Arena 0

Bio- CO2 NBio- CO2 Total CO2 CH4 N2O CO2eFugitive PM10

Exhaust PM10

PM10 Total

Fugitive PM2.5

Exhaust PM2.5

PM2.5 Total

0.0000

Mitigated

NaturalGas Use

ROG NOx CO SO2

0.0000 0.0000 0.0000 0.0000 0.0000

0.0000 0.0000 0.0000 0.0000

Total

0.0000 0.0000

0.0000

Parking Lot 0

0.0000 0.0000 0.0000 0.0000 0.0000Arena 0

NBio- CO2 Total CO2 CH4 N2O CO2e

Land Use kBTU/yr tons/yr MT/yr

Exhaust PM10

PM10 Total

Fugitive PM2.5

Exhaust PM2.5

PM2.5 Total

Bio- CO2

5.2 Energy by Land Use - NaturalGasUnmitigated

NaturalGas Use

ROG NOx CO SO2 Fugitive PM10

0.0000 0.0000 0.0000 0.0000 0.0000 0.0000NaturalGas Unmitigated

0.0000 0.0000 0.0000 0.0000 0.0000 0.0000NaturalGas Mitigated

0.0000 0.0000 0.0000 0.0000 0.0000 0.0000Electricity Unmitigated

0.0000 0.0000 0.0000 0.0000 0.0000 0.0000Electricity Mitigated

0.0000

6.0 Area Detail

6.1 Mitigation Measures Area

Total 0.0000 0.0000 0.0000

0.0000

Parking Lot 0 0.0000 0.0000 0.0000 0.0000

Land Use kWh/yr ton

MT/yr

Arena 0 0.0000 0.0000 0.0000

0.0000

Mitigated

Electricity Use

Total CO2 CH4 N2O CO2e

Total 0.0000 0.0000 0.0000

0.0000

Parking Lot 0 0.0000 0.0000 0.0000 0.0000

Land Use kWh/yr ton

MT/yr

Arena 0 0.0000 0.0000 0.0000

Unmitigated

Electricity Use

Total CO2 CH4 N2O CO2e

0.0000 0.0000 0.0000 0.0000 0.0000 0.0000Consumer Products

0.0000 0.0000 0.0000 0.0000 0.0000 0.0000Architectural Coating

Total CO2 CH4 N2O CO2e

SubCategory tons/yr MT/yr

PM10 Total

Fugitive PM2.5

Exhaust PM2.5

PM2.5 Total

Bio- CO2 NBio- CO2

Mitigated

ROG NOx CO SO2 Fugitive PM10

Exhaust PM10

0.0000 0.2037 0.2037 5.5000e-004

0.0000 0.2174Total

0.0000 0.2037 0.2037 5.5000e-004

0.0000 0.2174Landscaping

0.0000 0.0000 0.0000 0.0000 0.0000 0.0000Consumer Products

0.0000 0.0000 0.0000 0.0000 0.0000 0.0000Architectural Coating

Total CO2 CH4 N2O CO2e

SubCategory tons/yr MT/yr

PM10 Total

Fugitive PM2.5

Exhaust PM2.5

PM2.5 Total

Bio- CO2 NBio- CO2

6.2 Area by SubCategoryUnmitigated

ROG NOx CO SO2 Fugitive PM10

Exhaust PM10

0.0000 0.2037 0.2037 5.5000e-004

0.0000 0.2174Unmitigated

0.0000 0.2037 0.2037 5.5000e-004

0.0000 0.2174Mitigated

NBio- CO2 Total CO2 CH4 N2O CO2e

Category tons/yr MT/yr

Exhaust PM10

PM10 Total

Fugitive PM2.5

Exhaust PM2.5

PM2.5 Total

Bio- CO2ROG NOx CO SO2 Fugitive PM10

0.0000Total 0.0000 0.0000 0.0000

0.0000

Parking Lot 0 / 0 0.0000 0.0000 0.0000 0.0000

Land Use Mgal ton

MT/yr

Arena 0 / 0 0.0000 0.0000 0.0000

7.2 Water by Land UseUnmitigated

Indoor/Outdoor Use

Total CO2 CH4 N2O CO2e

Unmitigated 0.0000 0.0000 0.0000 0.0000

Category ton

MT/yr

Mitigated 0.0000 0.0000 0.0000 0.0000

7.0 Water Detail

7.1 Mitigation Measures Water

Total CO2 CH4 N2O CO2e

0.0000 0.2037 0.2037 5.5000e-004

0.0000 0.2174Total

0.0000 0.2037 0.2037 5.5000e-004

0.0000 0.2174Landscaping

8.2 Waste by Land UseUnmitigated

Unmitigated 0.0000 0.0000 0.0000 0.0000

ton

MT/yr

Mitigated 0.0000 0.0000 0.0000 0.0000

0.0000

8.0 Waste Detail

8.1 Mitigation Measures Waste

Category/Year

Total CO2 CH4 N2O CO2e

Total 0.0000 0.0000 0.0000

0.0000

Parking Lot 0 / 0 0.0000 0.0000 0.0000 0.0000

Land Use Mgal ton

MT/yr

Arena 0 / 0 0.0000 0.0000 0.0000

Mitigated

Indoor/Outdoor Use

Total CO2 CH4 N2O CO2e

Load Factor Fuel Type

Horse Power Load Factor Fuel Type

10.0 Stationary Equipment

Fire Pumps and Emergency Generators

Equipment Type Number Hours/Day Hours/Year Horse Power

0.0000

9.0 Operational Offroad

Equipment Type Number Hours/Day Days/Year

Total 0.0000 0.0000 0.0000

0.0000

Parking Lot 0 0.0000 0.0000 0.0000 0.0000

Land Use tons ton

MT/yr

Arena 0 0.0000 0.0000 0.0000

0.0000

Mitigated

Waste Disposed

Total CO2 CH4 N2O CO2e

Total 0.0000 0.0000 0.0000

0.0000

Parking Lot 0 0.0000 0.0000 0.0000 0.0000

Land Use tons ton

MT/yr

Arena 0 0.0000 0.0000 0.0000

Waste Disposed

Total CO2 CH4 N2O CO2e

User Defined Equipment

Equipment Type Number

11.0 Vegetation

Boilers

Equipment Type Number Heat Input/Day Heat Input/Year Boiler Rating Fuel Type

PROJECT BALLPARK CALEEMOD® OUTPUT AREA SOURCE EMISSIONS

CalEEMod Version: CalEEMod.2016.3.2Page 1 of 1 Date: 1/28/2019 3:45 PM

Oakland Waterfront Ballpark District - Project - Ballpark - Area Source GHG Emissions - Alameda County, Annual

Oakland Waterfront Ballpark District - Project - Ballpark - Area Source GHG EmissionsAlameda County, Annual

1.0 Project Characteristics

1.1 Land Usage

Land Uses Size Metric Lot Acreage Floor Surface Area Population

Enclosed Parking with Elevator 2,000.00 Space 18.00 600,000.00 0

Arena 1,200.00 1000sqft 385.71 1,200,000.00 0

1.2 Other Project Characteristics

Urbanization Urban Wind Speed (m/s) 2.2 Precipitation Freq (Days) 63

Climate Zone 5 Operational Year 2027

Utility Company Pacific Gas & Electric Company

CO2 Intensity (lb/MWhr)

261 CH4 Intensity (lb/MWhr)

0.029 N2O Intensity (lb/MWhr)

0.006

1.3 User Entered Comments & Non-Default Data

Project Characteristics - Area source GHG emissions only for the Ballpark land use. Updated to estimated CO2 intensity factor for PGE in 2027 with RPS.Land Use - Land use square footage provided by project sponsor. Default acreage was not updated because it does not impact area source emissions. This run estimates the Area source emissions from the ballpark sources.Construction Phase - Construction emissions are excluded from this run.

Off-road Equipment - Zero out construction emissions.

Off-road Equipment - Zero out construction emissions.

Off-road Equipment - Construction emissions are excluded from this run.

Off-road Equipment - Zero out construction emissions.

Off-road Equipment - Zero out construction emissions.

Off-road Equipment - Zero out construction emissions.

Trips and VMT - Construction emissions are excluded from this run.

Grading - Construction emissions are excluded from this run.

Architectural Coating - Construction emissions are excluded from this run.

Vehicle Trips - Zero out operational emissions from non-area sources.

Woodstoves - No woodstoves or wood fireplaces.

Energy Use - Zero out operational emissions from non-area sources.

Water And Wastewater - Zero out operational emissions from non-area sources.

Solid Waste - Zero out operational emissions from non-area sources.

Table Name Column Name Default Value New Value

tblConstructionPhase NumDays 550.00 0.00

tblConstructionPhase NumDays 7,750.00 0.00

tblConstructionPhase NumDays 500.00 0.00

tblConstructionPhase NumDays 775.00 0.00

tblConstructionPhase NumDays 550.00 0.00

tblConstructionPhase NumDays 300.00 0.00

tblConstructionPhase PhaseEndDate 1/7/2059 11/28/2056

tblConstructionPhase PhaseEndDate 10/20/2054 2/4/2025

tblConstructionPhase PhaseEndDate 12/22/2020 1/22/2019

tblConstructionPhase PhaseEndDate 2/4/2025 2/15/2022

tblConstructionPhase PhaseEndDate 11/28/2056 10/20/2054

tblConstructionPhase PhaseEndDate 2/15/2022 12/22/2020

tblEnergyUse LightingElect 2.99 0.00

tblEnergyUse LightingElect 1.75 0.00

tblEnergyUse NT24E 3.36 0.00

tblEnergyUse NT24E 0.19 0.00

tblEnergyUse NT24NG 6.90 0.00

tblEnergyUse T24E 1.21 0.00

tblEnergyUse T24E 3.92 0.00

tblEnergyUse T24NG 17.85 0.00

tblLandUse LandUseSquareFeet 800,000.00 600,000.00

tblProjectCharacteristics CO2IntensityFactor 641.35 261

tblSolidWaste SolidWasteGenerationRate 33.02 0.00

tblVehicleTrips ST_TR 10.71 0.00

tblVehicleTrips SU_TR 10.71 0.00

tblVehicleTrips WD_TR 10.71 0.00

tblWater IndoorWaterUseRate 516,924,141.11 0.00

Exhaust PM10

PM10 Total

tblWater OutdoorWaterUseRate 32,995,157.94 0.00

2.0 Emissions Summary

2.1 Overall Construction

NBio- CO2 Total CO2

Unmitigated Construction

ROG NOx CO SO2 Fugitive PM10

CH4 N2O CO2e

Year tons/yr MT/yr

Fugitive PM2.5

Exhaust PM2.5

PM2.5 Total

Bio- CO2

2019 0.0000 0.0000 0.0000 0.0000 0.0000 0.0000

2020 0.0000 0.0000 0.0000 0.0000 0.0000 0.0000

2022 0.0000 0.0000 0.0000 0.0000 0.0000 0.0000

2025 0.0000 0.0000 0.0000 0.0000 0.0000 0.0000

2054 0.0000 0.0000 0.0000 0.0000 0.0000 0.0000

2056 0.0000 0.0000 0.0000 0.0000 0.0000 0.0000

Maximum 0.0000 0.0000 0.00000.0000 0.0000 0.0000

SO2 Fugitive PM10

Exhaust PM10

PM2.5 Total

Bio- CO2 NBio- CO2

Mitigated Construction

ROG NOx CO Total CO2 CH4 N2O CO2e

Year tons/yr MT/yr

PM10 Total

Fugitive PM2.5

Exhaust PM2.5

2019 0.0000 0.0000 0.0000 0.0000 0.0000 0.0000

2020 0.0000 0.0000 0.0000 0.0000 0.0000 0.0000

2022 0.0000 0.0000 0.0000 0.0000 0.0000 0.0000

2025 0.0000 0.0000 0.0000 0.0000 0.0000 0.0000

2054 0.0000 0.0000 0.0000 0.0000 0.0000 0.0000

2056 0.0000 0.0000 0.0000 0.0000 0.0000 0.0000

Maximum 0.0000 0.0000 0.0000 0.0000 0.0000 0.0000

ROG NOx CO SO2 Fugitive PM10

Exhaust PM10

PM10 Total

Fugitive PM2.5

Exhaust PM2.5

PM2.5 Total

Bio- CO2 NBio-CO2 Total CO2 CH4 N20 CO2e

Percent Reduction

0.00 0.00 0.00 0.00 0.00 0.00 0.00 0.00 0.00 0.00 0.00 0.00 0.00 0.00 0.00 0.00

Maximum Mitigated ROG + NOX (tons/quarter)

Highest

SO2 Fugitive PM10

Exhaust PM10

Quarter Start Date End Date Maximum Unmitigated ROG + NOX (tons/quarter)

PM2.5 Total

Bio- CO2 NBio- CO2

2.2 Overall OperationalUnmitigated Operational

ROG NOx CO Total CO2 CH4 N2O CO2e

Category tons/yr MT/yr

PM10 Total

Fugitive PM2.5

Exhaust PM2.5

Area 0.0000 0.0572 0.0572 1.5000e-004

0.0000 0.0609

Energy 0.0000 0.0000 0.0000 0.0000 0.0000 0.0000

Mobile 0.0000 0.0000 0.0000 0.0000 0.0000 0.0000

Waste 0.0000 0.0000 0.0000 0.0000 0.0000 0.0000

Water 0.0000 0.0000 0.0000 0.0000 0.0000 0.0000

Total 1.5000e-004

0.0000 0.0609

SO2 Fugitive PM10

Exhaust PM10

0.0000 0.0572 0.0572

PM2.5 Total

Bio- CO2 NBio- CO2

Mitigated Operational

ROG NOx CO Total CO2 CH4 N2O CO2e

Category tons/yr MT/yr

PM10 Total

Fugitive PM2.5

Exhaust PM2.5

Area 0.0000 0.0572 0.0572 1.5000e-004

0.0000 0.0609

Energy 0.0000 0.0000 0.0000 0.0000 0.0000 0.0000

Mobile 0.0000 0.0000 0.0000 0.0000 0.0000 0.0000

Waste 0.0000 0.0000 0.0000 0.0000 0.0000 0.0000

Water 0.0000 0.0000 0.0000 0.0000 0.0000 0.0000

Total 0.0000 0.0572 0.0572 1.5000e-004

0.0000 0.0609

ROG NOx CO SO2 Fugitive PM10

Exhaust PM10

PM10 Total

Fugitive PM2.5

Exhaust PM2.5

PM2.5 Total

Bio- CO2 NBio-CO2 Total CO2 CH4 N20 CO2e

Percent Reduction

0.00 0.00 0.00 0.00 0.00 0.00 0.00 0.00 0.00 0.00 0.00 0.00 0.00 0.00 0.00 0.00

3.0 Construction Detail

Construction Phase

Phase Number

Phase Name Phase Type Start Date End Date Num Days Week

Num Days Phase Description

1 Demolition Demolition 1/23/2019 1/22/2019 5 0

2 Site Preparation Site Preparation 12/23/2020 12/22/2020 5 0

3 Grading Grading 2/16/2022 2/15/2022 5 0

4 Building Construction Building Construction 2/5/2025 2/4/2025 5 0

5 Paving Paving 10/21/2054 10/20/2054 5 0

6 Architectural Coating Architectural Coating 11/29/2056 11/28/2056 5 0

Acres of Grading (Site Preparation Phase): 0

Acres of Grading (Grading Phase): 0

Acres of Paving: 18

Residential Indoor: 0; Residential Outdoor: 0; Non-Residential Indoor: 1,800,000; Non-Residential Outdoor: 600,000; Striped Parking

OffRoad Equipment

Phase Name Offroad Equipment Type Amount Usage Hours Horse Power Load Factor

Demolition Concrete/Industrial Saws 1 8.00 81 0.73

Demolition Excavators 3 8.00 158 0.38

Demolition Rubber Tired Dozers 2 8.00 247 0.40

Site Preparation Rubber Tired Dozers 3 8.00 247 0.40

Site Preparation Tractors/Loaders/Backhoes 4 8.00 97 0.37

Grading Excavators 2 8.00 158 0.38

Grading Graders 1 8.00 187 0.41

Grading Rubber Tired Dozers 1 8.00 247 0.40

Grading Scrapers 2 8.00 367 0.48

Grading Tractors/Loaders/Backhoes 2 8.00 97 0.37

Building Construction Cranes 1 7.00 231 0.29

Building Construction Forklifts 3 8.00 89 0.20

Building Construction Generator Sets 1 8.00 84 0.74

Building Construction Tractors/Loaders/Backhoes 3 7.00 97 0.37

Building Construction Welders 1 8.00 46 0.45

Paving Pavers 2 8.00 130 0.42

Paving Paving Equipment 2 8.00 132 0.36

Paving Rollers 2 8.00 80 0.38

Architectural Coating Air Compressors 1 6.00 78 0.48

Hauling Vehicle Class

Trips and VMT

Phase Name Offroad Equipment Count

Worker Trip Number

Vendor Trip Number

Hauling Trip Number

10.80

Worker Trip Length

Vendor Trip Length

Hauling Trip Length

Worker Vehicle Class

Vendor Vehicle Class

Site Preparation 7 18.00 0.00 0.00

Demolition 6 15.00 0.00 0.00

HHDT

7.30 20.00 LD_Mix HDT_Mix HHDT

10.80

10.80 7.30 20.00 LD_Mix HDT_Mix

Building Construction 9 756.00 295.00 0.00

Grading 8 20.00 0.00 0.00

HHDT

7.30 20.00 LD_Mix HDT_Mix HHDT

10.80

10.80 7.30 20.00 LD_Mix HDT_Mix

Architectural Coating 1 151.00 0.00 0.00

Paving 6 15.00 0.00 0.00

20.00 LD_Mix HDT_Mix HHDT

7.30 20.00 LD_Mix HDT_Mix HHDT

NOx CO SO2 Fugitive PM10

10.80 7.30

Fugitive PM2.5

Exhaust PM2.5

PM2.5 Total

Bio- CO2

3.1 Mitigation Measures Construction

3.2 Demolition - 2019Unmitigated Construction On-Site

ROG NBio- CO2 Total CO2 CH4 N2O CO2e

Category tons/yr MT/yr

Exhaust PM10

PM10 Total

Off-Road 0.0000 0.0000 0.0000 0.0000 0.0000 0.0000 0.0000 0.0000 0.0000 0.0000 0.0000 0.0000 0.0000 0.0000 0.0000 0.0000

Total 0.0000 0.0000 0.0000 0.0000 0.0000 0.0000 0.00000.0000 0.0000 0.0000 0.0000 0.0000 0.0000 0.0000 0.0000 0.0000

SO2 Fugitive PM10

Exhaust PM10

PM2.5 Total

Bio- CO2 NBio- CO2

Unmitigated Construction Off-Site

ROG NOx CO Total CO2 CH4 N2O CO2e

Category tons/yr MT/yr

PM10 Total

Fugitive PM2.5

Exhaust PM2.5

Hauling 0.0000 0.0000 0.0000 0.0000 0.0000 0.0000 0.0000 0.0000 0.0000 0.0000 0.0000 0.0000 0.0000 0.0000 0.0000 0.0000

Vendor 0.0000 0.0000 0.0000 0.0000 0.0000 0.0000 0.0000 0.0000 0.0000 0.0000 0.0000 0.0000 0.0000 0.0000 0.0000 0.0000

Worker 0.0000 0.0000 0.0000 0.0000 0.0000 0.0000 0.0000 0.0000 0.0000 0.0000 0.0000 0.0000 0.0000 0.0000 0.0000 0.0000

Total 0.0000 0.0000 0.0000 0.0000 0.0000 0.0000 0.00000.0000 0.0000 0.0000 0.0000 0.0000 0.0000

SO2 Fugitive PM10

Exhaust PM10

0.0000 0.0000 0.0000

PM2.5 Total

Bio- CO2 NBio- CO2

Mitigated Construction On-Site

ROG NOx CO Total CO2 CH4 N2O CO2e

Category tons/yr MT/yr

PM10 Total

Fugitive PM2.5

Exhaust PM2.5

Off-Road 0.0000 0.0000 0.0000 0.0000 0.0000 0.0000 0.0000 0.0000 0.0000 0.0000 0.0000 0.0000 0.0000 0.0000 0.0000 0.0000

Total 0.0000 0.0000 0.0000 0.0000 0.0000 0.0000 0.00000.0000 0.0000 0.0000 0.0000 0.0000 0.0000

SO2 Fugitive PM10

Exhaust PM10

0.0000 0.0000 0.0000

PM2.5 Total

Bio- CO2 NBio- CO2

Mitigated Construction Off-Site

ROG NOx CO Total CO2 CH4 N2O CO2ePM10 Total

Fugitive PM2.5

Exhaust PM2.5

Category tons/yr MT/yr

Hauling 0.0000 0.0000 0.0000 0.0000 0.0000 0.0000 0.0000 0.0000 0.0000 0.0000 0.0000 0.0000 0.0000 0.0000 0.0000 0.0000

Vendor 0.0000 0.0000 0.0000 0.0000 0.0000 0.0000 0.0000 0.0000 0.0000 0.0000 0.0000 0.0000 0.0000 0.0000 0.0000 0.0000

Worker 0.0000 0.0000 0.0000 0.0000 0.0000 0.0000 0.0000 0.0000 0.0000 0.0000 0.0000 0.0000 0.0000 0.0000 0.0000 0.0000

Total 0.0000 0.0000 0.0000 0.0000 0.0000 0.0000 0.00000.0000 0.0000 0.0000 0.0000 0.0000 0.0000

SO2 Fugitive PM10

Exhaust PM10

0.0000 0.0000 0.0000

PM2.5 Total

Bio- CO2 NBio- CO2

3.3 Site Preparation - 2020Unmitigated Construction On-Site

ROG NOx CO Total CO2 CH4 N2O CO2e

Category tons/yr MT/yr

PM10 Total

Fugitive PM2.5

Exhaust PM2.5

Fugitive Dust 0.0000 0.0000 0.0000 0.0000 0.0000 0.0000 0.0000 0.0000 0.0000 0.0000 0.0000 0.0000 0.0000 0.0000 0.0000 0.0000

Off-Road 0.0000 0.0000 0.0000 0.0000 0.0000 0.0000 0.0000 0.0000 0.0000 0.0000 0.0000 0.0000 0.0000 0.0000 0.0000 0.0000

Total 0.0000 0.0000 0.0000 0.0000 0.0000 0.0000 0.00000.0000 0.0000 0.0000 0.0000 0.0000 0.0000

SO2 Fugitive PM10

Exhaust PM10

0.0000 0.0000 0.0000

PM2.5 Total

Bio- CO2 NBio- CO2

Unmitigated Construction Off-Site

ROG NOx CO Total CO2 CH4 N2O CO2e

Category tons/yr MT/yr

PM10 Total

Fugitive PM2.5

Exhaust PM2.5

Hauling 0.0000 0.0000 0.0000 0.0000 0.0000 0.0000 0.0000 0.0000 0.0000 0.0000 0.0000 0.0000 0.0000 0.0000 0.0000 0.0000

Vendor 0.0000 0.0000 0.0000 0.0000 0.0000 0.0000 0.0000 0.0000 0.0000 0.0000 0.0000 0.0000 0.0000 0.0000 0.0000 0.0000

Worker 0.0000 0.0000 0.0000 0.0000 0.0000 0.0000 0.0000 0.0000 0.0000 0.0000 0.0000 0.0000 0.0000 0.0000 0.0000 0.0000

Total 0.0000 0.0000 0.0000 0.0000 0.0000 0.0000 0.00000.0000 0.0000 0.0000 0.0000 0.0000 0.0000

SO2 Fugitive PM10

Exhaust PM10

0.0000 0.0000 0.0000

PM2.5 Total

Bio- CO2 NBio- CO2

Mitigated Construction On-Site

ROG NOx CO Total CO2 CH4 N2O CO2e

Category tons/yr MT/yr

PM10 Total

Fugitive PM2.5

Exhaust PM2.5

Fugitive Dust 0.0000 0.0000 0.0000 0.0000 0.0000 0.0000 0.0000 0.0000 0.0000 0.0000 0.0000 0.0000 0.0000 0.0000 0.0000 0.0000

Off-Road 0.0000 0.0000 0.0000 0.0000 0.0000 0.0000 0.0000 0.0000 0.0000 0.0000 0.0000 0.0000 0.0000 0.0000 0.0000 0.0000

Total 0.0000 0.0000 0.0000 0.0000 0.0000 0.0000 0.00000.0000 0.0000 0.0000 0.0000 0.0000 0.0000

SO2 Fugitive PM10

Exhaust PM10

0.0000 0.0000 0.0000

PM2.5 Total

Bio- CO2 NBio- CO2

Mitigated Construction Off-Site

ROG NOx CO Total CO2 CH4 N2O CO2e

Category tons/yr MT/yr

PM10 Total

Fugitive PM2.5

Exhaust PM2.5

Hauling 0.0000 0.0000 0.0000 0.0000 0.0000 0.0000 0.0000 0.0000 0.0000 0.0000 0.0000 0.0000 0.0000 0.0000 0.0000 0.0000

Vendor 0.0000 0.0000 0.0000 0.0000 0.0000 0.0000 0.0000 0.0000 0.0000 0.0000 0.0000 0.0000 0.0000 0.0000 0.0000 0.0000

Worker 0.0000 0.0000 0.0000 0.0000 0.0000 0.0000 0.0000 0.0000 0.0000 0.0000 0.0000 0.0000 0.0000 0.0000 0.0000 0.0000

Total 0.0000 0.0000 0.0000 0.0000 0.0000 0.0000 0.00000.0000 0.0000 0.0000 0.0000 0.0000 0.0000 0.0000 0.0000 0.0000

3.4 Grading - 2022Unmitigated Construction On-Site

SO2 Fugitive PM10

Exhaust PM10

PM2.5 Total

Bio- CO2 NBio- CO2ROG NOx CO Total CO2 CH4 N2O CO2e

Category tons/yr MT/yr

PM10 Total

Fugitive PM2.5

Exhaust PM2.5

Fugitive Dust 0.0000 0.0000 0.0000 0.0000 0.0000 0.0000 0.0000 0.0000 0.0000 0.0000 0.0000 0.0000 0.0000 0.0000 0.0000 0.0000

Off-Road 0.0000 0.0000 0.0000 0.0000 0.0000 0.0000 0.0000 0.0000 0.0000 0.0000 0.0000 0.0000 0.0000 0.0000 0.0000 0.0000

Total 0.0000 0.0000 0.0000 0.0000 0.0000 0.0000 0.00000.0000 0.0000 0.0000 0.0000 0.0000 0.0000

SO2 Fugitive PM10

Exhaust PM10

0.0000 0.0000 0.0000

PM2.5 Total

Bio- CO2 NBio- CO2

Unmitigated Construction Off-Site

ROG NOx CO Total CO2 CH4 N2O CO2e

Category tons/yr MT/yr

PM10 Total

Fugitive PM2.5

Exhaust PM2.5

Hauling 0.0000 0.0000 0.0000 0.0000 0.0000 0.0000 0.0000 0.0000 0.0000 0.0000 0.0000 0.0000 0.0000 0.0000 0.0000 0.0000

Vendor 0.0000 0.0000 0.0000 0.0000 0.0000 0.0000 0.0000 0.0000 0.0000 0.0000 0.0000 0.0000 0.0000 0.0000 0.0000 0.0000

Worker 0.0000 0.0000 0.0000 0.0000 0.0000 0.0000 0.0000 0.0000 0.0000 0.0000 0.0000 0.0000 0.0000 0.0000 0.0000 0.0000

Total 0.0000 0.0000 0.0000 0.0000 0.0000 0.0000 0.00000.0000 0.0000 0.0000 0.0000 0.0000 0.0000

SO2 Fugitive PM10

Exhaust PM10

0.0000 0.0000 0.0000

PM2.5 Total

Bio- CO2 NBio- CO2

Mitigated Construction On-Site

ROG NOx CO Total CO2 CH4 N2O CO2e

Category tons/yr MT/yr

PM10 Total

Fugitive PM2.5

Exhaust PM2.5

Fugitive Dust 0.0000 0.0000 0.0000 0.0000 0.0000 0.0000 0.0000 0.0000 0.0000 0.0000 0.0000 0.0000 0.0000 0.0000 0.0000 0.0000

Off-Road 0.0000 0.0000 0.0000 0.0000 0.0000 0.0000 0.0000 0.0000 0.0000 0.0000 0.0000 0.0000 0.0000 0.0000 0.0000 0.0000

Total 0.0000 0.0000 0.0000 0.0000 0.0000 0.0000 0.00000.0000 0.0000 0.0000 0.0000 0.0000 0.0000

SO2 Fugitive PM10

Exhaust PM10

0.0000 0.0000 0.0000

PM2.5 Total

Bio- CO2 NBio- CO2

Mitigated Construction Off-Site

ROG NOx CO Total CO2 CH4 N2O CO2e

Category tons/yr MT/yr

PM10 Total

Fugitive PM2.5

Exhaust PM2.5

Hauling 0.0000 0.0000 0.0000 0.0000 0.0000 0.0000 0.0000 0.0000 0.0000 0.0000 0.0000 0.0000 0.0000 0.0000 0.0000 0.0000

Vendor 0.0000 0.0000 0.0000 0.0000 0.0000 0.0000 0.0000 0.0000 0.0000 0.0000 0.0000 0.0000 0.0000 0.0000 0.0000 0.0000

Worker 0.0000 0.0000 0.0000 0.0000 0.0000 0.0000 0.0000 0.0000 0.0000 0.0000 0.0000 0.0000 0.0000 0.0000 0.0000 0.0000

Total 0.0000 0.0000 0.0000 0.0000 0.0000 0.0000 0.00000.0000 0.0000 0.0000 0.0000 0.0000 0.0000

SO2 Fugitive PM10

Exhaust PM10

0.0000 0.0000 0.0000

PM2.5 Total

Bio- CO2 NBio- CO2

3.5 Building Construction - 2025Unmitigated Construction On-Site

ROG NOx CO Total CO2 CH4 N2O CO2e

Category tons/yr MT/yr

PM10 Total

Fugitive PM2.5

Exhaust PM2.5

Off-Road 0.0000 0.0000 0.0000 0.0000 0.0000 0.0000 0.0000 0.0000 0.0000 0.0000 0.0000 0.0000 0.0000 0.0000 0.0000 0.0000

Total 0.0000 0.0000 0.0000 0.0000 0.0000 0.0000 0.00000.0000 0.0000 0.0000 0.0000 0.0000 0.0000 0.0000 0.0000 0.0000

SO2 Fugitive PM10

Exhaust PM10

PM2.5 Total

Bio- CO2 NBio- CO2

Unmitigated Construction Off-Site

ROG NOx CO Total CO2 CH4 N2O CO2e

Category tons/yr MT/yr

PM10 Total

Fugitive PM2.5

Exhaust PM2.5

Hauling 0.0000 0.0000 0.0000 0.0000 0.0000 0.0000 0.0000 0.0000 0.0000 0.0000 0.0000 0.0000 0.0000 0.0000 0.0000 0.0000

Vendor 0.0000 0.0000 0.0000 0.0000 0.0000 0.0000 0.0000 0.0000 0.0000 0.0000 0.0000 0.0000 0.0000 0.0000 0.0000 0.0000

Worker 0.0000 0.0000 0.0000 0.0000 0.0000 0.0000 0.0000 0.0000 0.0000 0.0000 0.0000 0.0000 0.0000 0.0000 0.0000 0.0000

Total 0.0000 0.0000 0.0000 0.0000 0.0000 0.0000 0.00000.0000 0.0000 0.0000 0.0000 0.0000 0.0000

SO2 Fugitive PM10

Exhaust PM10

0.0000 0.0000 0.0000

PM2.5 Total

Bio- CO2 NBio- CO2

Mitigated Construction On-Site

ROG NOx CO Total CO2 CH4 N2O CO2e

Category tons/yr MT/yr

PM10 Total

Fugitive PM2.5

Exhaust PM2.5

Off-Road 0.0000 0.0000 0.0000 0.0000 0.0000 0.0000 0.0000 0.0000 0.0000 0.0000 0.0000 0.0000 0.0000 0.0000 0.0000 0.0000

Total 0.0000 0.0000 0.0000 0.0000 0.0000 0.0000 0.00000.0000 0.0000 0.0000 0.0000 0.0000 0.0000

SO2 Fugitive PM10

Exhaust PM10

0.0000 0.0000 0.0000

PM2.5 Total

Bio- CO2 NBio- CO2

Mitigated Construction Off-Site

ROG NOx CO Total CO2 CH4 N2O CO2ePM10 Total

Fugitive PM2.5

Exhaust PM2.5

Category tons/yr MT/yr

Hauling 0.0000 0.0000 0.0000 0.0000 0.0000 0.0000 0.0000 0.0000 0.0000 0.0000 0.0000 0.0000 0.0000 0.0000 0.0000 0.0000

Vendor 0.0000 0.0000 0.0000 0.0000 0.0000 0.0000 0.0000 0.0000 0.0000 0.0000 0.0000 0.0000 0.0000 0.0000 0.0000 0.0000

Worker 0.0000 0.0000 0.0000 0.0000 0.0000 0.0000 0.0000 0.0000 0.0000 0.0000 0.0000 0.0000 0.0000 0.0000 0.0000 0.0000

Total 0.0000 0.0000 0.0000 0.0000 0.0000 0.0000 0.00000.0000 0.0000 0.0000 0.0000 0.0000 0.0000

SO2 Fugitive PM10

Exhaust PM10

0.0000 0.0000 0.0000

PM2.5 Total

Bio- CO2 NBio- CO2

3.6 Paving - 2054Unmitigated Construction On-Site

ROG NOx CO Total CO2 CH4 N2O CO2e

Category tons/yr MT/yr

PM10 Total

Fugitive PM2.5

Exhaust PM2.5

Off-Road 0.0000 0.0000 0.0000 0.0000 0.0000 0.0000 0.0000 0.0000 0.0000 0.0000 0.0000 0.0000 0.0000 0.0000 0.0000 0.0000

Paving 0.0000 0.0000 0.0000 0.0000 0.0000 0.0000 0.0000 0.0000 0.0000 0.0000 0.0000 0.0000 0.0000 0.0000 0.0000 0.0000

Total 0.0000 0.0000 0.0000 0.0000 0.0000 0.0000 0.00000.0000 0.0000 0.0000 0.0000 0.0000 0.0000

SO2 Fugitive PM10

Exhaust PM10

0.0000 0.0000 0.0000

PM2.5 Total

Bio- CO2 NBio- CO2

Unmitigated Construction Off-Site

ROG NOx CO Total CO2 CH4 N2O CO2e

Category tons/yr MT/yr

PM10 Total

Fugitive PM2.5

Exhaust PM2.5

Hauling 0.0000 0.0000 0.0000 0.0000 0.0000 0.0000 0.0000 0.0000 0.0000 0.0000 0.0000 0.0000 0.0000 0.0000 0.0000 0.0000

Vendor 0.0000 0.0000 0.0000 0.0000 0.0000 0.0000 0.0000 0.0000 0.0000 0.0000 0.0000 0.0000 0.0000 0.0000 0.0000 0.0000

Worker 0.0000 0.0000 0.0000 0.0000 0.0000 0.0000 0.0000 0.0000 0.0000 0.0000 0.0000 0.0000 0.0000 0.0000 0.0000 0.0000

Total 0.0000 0.0000 0.0000 0.0000 0.0000 0.0000 0.00000.0000 0.0000 0.0000 0.0000 0.0000 0.0000

SO2 Fugitive PM10

Exhaust PM10

0.0000 0.0000 0.0000

PM2.5 Total

Bio- CO2 NBio- CO2

Mitigated Construction On-Site

ROG NOx CO Total CO2 CH4 N2O CO2e

Category tons/yr MT/yr

PM10 Total

Fugitive PM2.5

Exhaust PM2.5

Off-Road 0.0000 0.0000 0.0000 0.0000 0.0000 0.0000 0.0000 0.0000 0.0000 0.0000 0.0000 0.0000 0.0000 0.0000 0.0000 0.0000

Paving 0.0000 0.0000 0.0000 0.0000 0.0000 0.0000 0.0000 0.0000 0.0000 0.0000 0.0000 0.0000 0.0000 0.0000 0.0000 0.0000

Total 0.0000 0.0000 0.0000 0.0000 0.0000 0.0000 0.00000.0000 0.0000 0.0000 0.0000 0.0000 0.0000

SO2 Fugitive PM10

Exhaust PM10

0.0000 0.0000 0.0000

PM2.5 Total

Bio- CO2 NBio- CO2

Mitigated Construction Off-Site

ROG NOx CO Total CO2 CH4 N2O CO2e

Category tons/yr MT/yr

PM10 Total

Fugitive PM2.5

Exhaust PM2.5

Hauling 0.0000 0.0000 0.0000 0.0000 0.0000 0.0000 0.0000 0.0000 0.0000 0.0000 0.0000 0.0000 0.0000 0.0000 0.0000 0.0000

Vendor 0.0000 0.0000 0.0000 0.0000 0.0000 0.0000 0.0000 0.0000 0.0000 0.0000 0.0000 0.0000 0.0000 0.0000 0.0000 0.0000

Worker 0.0000 0.0000 0.0000 0.0000 0.0000 0.0000 0.0000 0.0000 0.0000 0.0000 0.0000 0.0000 0.0000 0.0000 0.0000 0.0000

Total 0.0000 0.0000 0.0000 0.0000 0.0000 0.0000 0.00000.0000 0.0000 0.0000 0.0000 0.0000 0.0000 0.0000 0.0000 0.0000

3.7 Architectural Coating - 2056Unmitigated Construction On-Site

SO2 Fugitive PM10

Exhaust PM10

PM2.5 Total

Bio- CO2 NBio- CO2ROG NOx CO Total CO2 CH4 N2O CO2e

Category tons/yr MT/yr

PM10 Total

Fugitive PM2.5

Exhaust PM2.5

Archit. Coating 0.0000 0.0000 0.0000 0.0000 0.0000 0.0000 0.0000 0.0000 0.0000 0.0000 0.0000 0.0000 0.0000 0.0000 0.0000 0.0000

Off-Road 0.0000 0.0000 0.0000 0.0000 0.0000 0.0000 0.0000 0.0000 0.0000 0.0000 0.0000 0.0000 0.0000 0.0000 0.0000 0.0000

Total 0.0000 0.0000 0.0000 0.0000 0.0000 0.0000 0.00000.0000 0.0000 0.0000 0.0000 0.0000 0.0000

SO2 Fugitive PM10

Exhaust PM10

0.0000 0.0000 0.0000

PM2.5 Total

Bio- CO2 NBio- CO2

Unmitigated Construction Off-Site

ROG NOx CO Total CO2 CH4 N2O CO2e

Category tons/yr MT/yr

PM10 Total

Fugitive PM2.5

Exhaust PM2.5

Hauling 0.0000 0.0000 0.0000 0.0000 0.0000 0.0000 0.0000 0.0000 0.0000 0.0000 0.0000 0.0000 0.0000 0.0000 0.0000 0.0000

Vendor 0.0000 0.0000 0.0000 0.0000 0.0000 0.0000 0.0000 0.0000 0.0000 0.0000 0.0000 0.0000 0.0000 0.0000 0.0000 0.0000

Worker 0.0000 0.0000 0.0000 0.0000 0.0000 0.0000 0.0000 0.0000 0.0000 0.0000 0.0000 0.0000 0.0000 0.0000 0.0000 0.0000

Total 0.0000 0.0000 0.0000 0.0000 0.0000 0.0000 0.00000.0000 0.0000 0.0000 0.0000 0.0000 0.0000

SO2 Fugitive PM10

Exhaust PM10

0.0000 0.0000 0.0000

PM2.5 Total

Bio- CO2 NBio- CO2

Mitigated Construction On-Site

ROG NOx CO Total CO2 CH4 N2O CO2e

Category tons/yr MT/yr

PM10 Total

Fugitive PM2.5

Exhaust PM2.5

Archit. Coating 0.0000 0.0000 0.0000 0.0000 0.0000 0.0000 0.0000 0.0000 0.0000 0.0000 0.0000 0.0000 0.0000 0.0000 0.0000 0.0000

Off-Road 0.0000 0.0000 0.0000 0.0000 0.0000 0.0000 0.0000 0.0000 0.0000 0.0000 0.0000 0.0000 0.0000 0.0000 0.0000 0.0000

Total 0.0000 0.0000 0.0000 0.0000 0.0000 0.0000 0.00000.0000 0.0000 0.0000 0.0000 0.0000 0.0000

SO2 Fugitive PM10

Exhaust PM10

0.0000 0.0000 0.0000

PM2.5 Total

Bio- CO2 NBio- CO2

Mitigated Construction Off-Site

ROG NOx CO Total CO2 CH4 N2O CO2e

Category tons/yr MT/yr

PM10 Total

Fugitive PM2.5

Exhaust PM2.5

Hauling 0.0000 0.0000 0.0000 0.0000 0.0000 0.0000 0.0000 0.0000 0.0000 0.0000 0.0000 0.0000 0.0000 0.0000 0.0000 0.0000

Vendor 0.0000 0.0000 0.0000 0.0000 0.0000 0.0000 0.0000 0.0000 0.0000 0.0000 0.0000 0.0000 0.0000 0.0000 0.0000 0.0000

Worker 0.0000 0.0000 0.0000 0.0000 0.0000 0.0000 0.0000 0.0000 0.0000 0.0000 0.0000 0.0000 0.0000 0.0000 0.0000 0.0000

Total 0.0000 0.0000 0.0000 0.0000 0.0000 0.0000 0.00000.0000 0.0000 0.0000 0.0000 0.0000 0.0000

CO SO2 Fugitive PM10

0.0000 0.0000 0.0000

Fugitive PM2.5

Exhaust PM2.5

PM2.5 Total

Bio- CO2

4.0 Operational Detail - Mobile

4.1 Mitigation Measures Mobile

ROG NOx NBio- CO2 Total CO2 CH4 N2O CO2e

Category tons/yr MT/yr

Exhaust PM10

PM10 Total

Mitigated 0.0000 0.0000 0.0000 0.0000 0.0000 0.0000

Unmitigated 0.0000 0.0000 0.0000 0.0000 0.0000 0.0000

4.2 Trip Summary Information

Average Daily Trip Rate Unmitigated MitigatedLand Use Weekday Saturday Sunday Annual VMT Annual VMT

Arena 0.00 0.00 0.00Enclosed Parking with Elevator 0.00 0.00 0.00

Total 0.00 0.00 0.00

4.3 Trip Type Information

Miles Trip % Trip Purpose %

Land Use H-W or C-W H-S or C-C H-O or C-NW H-W or C-W

H-S or C-C H-O or C-NW Primary Diverted Pass-by

Arena 9.50 7.30 7.30 0.00 81.00 19.00 66 28 6

Enclosed Parking with Elevator 9.50 7.30 7.30 0.00 0.00 0.00 0 0 0

4.4 Fleet MixLand Use LDA LDT1 LDT2 MDV LHD1 LHD2 MHD HHD OBUS UBUS MCY SBUS MH

Arena 0.565129 0.036801 0.190239 0.104144 0.013417 0.005103 0.025765 0.048748 0.002254 0.001991 0.005378 0.000368 0.000663

Enclosed Parking with Elevator 0.565129 0.036801 0.190239 0.104144 0.013417 0.005103 0.025765 0.048748 0.002254 0.001991 0.005378 0.000368 0.000663

5.0 Energy Detail

Historical Energy Use: N

5.1 Mitigation Measures Energy

ROG NOx CO SO2 Fugitive PM10

Exhaust PM10

PM10 Total

Fugitive PM2.5

Exhaust PM2.5

PM2.5 Total

Bio- CO2 NBio- CO2 Total CO2 CH4 N2O CO2e

Category tons/yr MT/yr

Electricity Mitigated

0.0000 0.0000 0.0000 0.0000 0.0000 0.0000

Electricity Unmitigated

0.0000 0.0000 0.0000 0.0000 0.0000 0.0000

NaturalGas Mitigated

0.0000 0.0000 0.0000 0.0000 0.0000 0.0000

NaturalGas Unmitigated

0.0000 0.0000 0.0000 0.0000 0.0000

ROG NOx CO SO2 Fugitive PM10

0.0000

PM10 Total

Fugitive PM2.5

Exhaust PM2.5

PM2.5 Total

Bio- CO2

5.2 Energy by Land Use - NaturalGasUnmitigated

NaturalGas Use

NBio- CO2 Total CO2 CH4 N2O CO2e

Land Use kBTU/yr tons/yr MT/yr

Exhaust PM10

Arena 0 0.0000 0.0000 0.0000 0.0000 0.0000 0.0000

Enclosed Parking with Elevator

0 0.0000 0.0000 0.0000 0.0000 0.0000 0.0000

Total 0.0000 0.0000 0.0000 0.0000 0.0000 0.0000

Mitigated

NaturalGas Use

ROG NOx CO SO2 Fugitive PM10

Exhaust PM10

PM10 Total

Fugitive PM2.5

Exhaust PM2.5

PM2.5 Total

Bio- CO2 NBio- CO2 Total CO2 CH4 N2O CO2e

Land Use kBTU/yr tons/yr MT/yr

Arena 0 0.0000 0.0000 0.0000 0.0000 0.0000 0.0000

Enclosed Parking with Elevator

0 0.0000 0.0000 0.0000 0.0000 0.0000 0.0000

Total 0.0000 0.0000 0.0000 0.0000 0.0000 0.0000

5.3 Energy by Land Use - ElectricityUnmitigated

Electricity Use

Total CO2 CH4 N2O CO2e

Land Use kWh/yr ton

MT/yr

Arena 0 0.0000 0.0000 0.0000 0.0000

Enclosed Parking with Elevator

0 0.0000 0.0000 0.0000 0.0000

Total 0.0000 0.0000 0.0000 0.0000

Mitigated

Electricity Use

Total CO2 CH4 N2O CO2e

Land Use kWh/yr ton

MT/yr

Arena 0 0.0000 0.0000 0.0000 0.0000

Enclosed Parking with Elevator

0 0.0000 0.0000 0.0000 0.0000

Total 0.0000 0.0000 0.0000 0.0000

6.0 Area Detail

6.1 Mitigation Measures Area

NOx CO SO2 Fugitive PM10

Fugitive PM2.5

Exhaust PM2.5

PM2.5 Total

Bio- CO2ROG NBio- CO2 Total CO2 CH4 N2O CO2e

Category tons/yr MT/yr

Exhaust PM10

PM10 Total

Mitigated 0.0000 0.0572 0.0572 1.5000e-004

0.0000 0.0609

Unmitigated 1.5000e-004

0.0000 0.0609

SO2 Fugitive PM10

Exhaust PM10

0.0000 0.0572 0.0572

PM2.5 Total

Bio- CO2 NBio- CO2

6.2 Area by SubCategoryUnmitigated

ROG NOx CO Total CO2 CH4 N2O CO2e

SubCategory tons/yr MT/yr

PM10 Total

Fugitive PM2.5

Exhaust PM2.5

Architectural Coating

0.0000 0.0000 0.0000 0.0000 0.0000 0.0000

Consumer Products

0.0000 0.0000 0.0000 0.0000 0.0000 0.0000

Landscaping 0.0000 0.0572 0.0572 1.5000e-004

0.0000 0.0609

Total 1.5000e-004

0.0000 0.0609

SO2 Fugitive PM10

Exhaust PM10

0.0000 0.0572 0.0572

PM2.5 Total

Bio- CO2 NBio- CO2

Mitigated

ROG NOx CO Total CO2 CH4 N2O CO2ePM10 Total

Fugitive PM2.5

Exhaust PM2.5

SubCategory tons/yr MT/yr

Architectural Coating

0.0000 0.0000 0.0000 0.0000 0.0000 0.0000

Consumer Products

0.0000 0.0000 0.0000 0.0000 0.0000 0.0000

Landscaping 0.0000 0.0572 0.0572 1.5000e-004

0.0000 0.0609

Total 0.0000 0.0572 0.0572 1.5000e-004

0.0000 0.0609

7.0 Water Detail

7.1 Mitigation Measures Water

Total CO2 CH4 N2O CO2e

Category ton

MT/yr

Mitigated 0.0000 0.0000 0.0000 0.0000

Unmitigated 0.0000 0.0000 0.0000 0.0000

7.2 Water by Land UseUnmitigated

Indoor/Outdoor Use

Total CO2 CH4 N2O CO2e

Land Use Mgal ton

MT/yr

Arena 0 / 0 0.0000 0.0000 0.0000 0.0000

Enclosed Parking with Elevator

0 / 0 0.0000 0.0000 0.0000 0.0000

Total 0.0000 0.0000 0.0000 0.0000

Mitigated

Indoor/Outdoor Use

Total CO2 CH4 N2O CO2e

Land Use Mgal ton

MT/yr

Arena 0 / 0 0.0000 0.0000 0.0000 0.0000

Enclosed Parking with Elevator

0 / 0 0.0000 0.0000 0.0000 0.0000

Total 0.0000 0.0000 0.0000 0.0000

8.0 Waste Detail

8.1 Mitigation Measures Waste

Category/Year

Total CO2 CH4 N2O CO2e

ton

MT/yr

Mitigated 0.0000 0.0000 0.0000 0.0000

Unmitigated 0.0000 0.0000 0.0000 0.0000

8.2 Waste by Land UseUnmitigated

Waste Disposed

Total CO2 CH4 N2O CO2e

Land Use tons ton

MT/yr

Arena 0 0.0000 0.0000 0.0000 0.0000

Enclosed Parking with Elevator

0 0.0000 0.0000 0.0000 0.0000

Total 0.0000 0.0000 0.0000 0.0000

Mitigated

Waste Disposed

Total CO2 CH4 N2O CO2e

Land Use tons ton

MT/yr

Arena 0 0.0000 0.0000 0.0000

0.0000 0.0000

0.0000

Enclosed Parking with Elevator

0 0.0000 0.0000 0.0000 0.0000

0.0000

9.0 Operational Offroad

Equipment Type Number Hours/Day Days/Year

Total 0.0000

10.0 Stationary Equipment

Fire Pumps and Emergency Generators

Horse Power Load Factor Fuel Type

Equipment Type Number Hours/Day Hours/Year

Heat Input/Year Boiler Rating Fuel Type

Horse Power

User Defined Equipment

Equipment Type Number

11.0 Vegetation

Load Factor Fuel Type

Boilers

Equipment Type Number Heat Input/Day

PROJECT NONRESIDENTIAL CALEEMOD® OUTPUT AREA SOURCE EMISSIONS

CalEEMod Version: CalEEMod.2016.3.2Page 1 of 1 Date: 1/25/2019 3:32 PM

Oakland Waterfront Ballpark District - Project - Nonresidential - Area Source GHG Emissions - Alameda County, Annual

Oakland Waterfront Ballpark District - Project - Nonresidential - Area Source GHG EmissionsAlameda County, Annual

1.0 Project Characteristics

1.1 Land Usage

Land Uses Size Metric Lot Acreage Floor Surface Area Population

General Office Building 1,500.00 1000sqft 34.44 1,500,000.00 0

Enclosed Parking with Elevator 6,900.00 Space 62.10 2,070,000.00 0

Arena 50.40 1000sqft 16.20 50,400.00 0

Hotel 400.00 Room 13.33 280,000.00 0

Regional Shopping Center 270.00 1000sqft 6.20 270,000.00 0

1.2 Other Project Characteristics

Urbanization Urban Wind Speed (m/s) 2.2 Precipitation Freq (Days) 63

Climate Zone 5 Operational Year 2027

Utility Company Pacific Gas & Electric Company

CO2 Intensity (lb/MWhr)

261 CH4 Intensity (lb/MWhr)

0.029 N2O Intensity (lb/MWhr)

0.006

1.3 User Entered Comments & Non-Default Data

Project Characteristics - Area source GHG emissions only for Phase 2 (Full Masterplan).Updated to estimated CO2 intensity factor for PGE in 2027 with RPS.

Land Use - Land use square footage provided by project sponsor. Default acreage was not updated because it does not imapct area source emissions. This run estimates the Area source emissions from the Full Masterplan (2027) for non-residential sources.Construction Phase - Zero out construction emissions

Off-road Equipment - Zero out construction emissions.

Off-road Equipment - Zero out construction emissions.

Off-road Equipment - Zero out construction emissions.

Off-road Equipment - Zero out construction emissions.

Off-road Equipment - Zero out construction emissions.

Off-road Equipment - Zero out construction emissions.

Trips and VMT - Zero out construction emissions

Grading - Zero out construction emissions.

Architectural Coating - Zero out construction emissions.

Vehicle Trips - Zero out operational emissions from non-area sources.

Woodstoves - No woodstoves or wood fireplaces.

Energy Use - Zero out operational emissions from non-area sources.

Water And Wastewater - Zero out operational emissions from non-area sources.

Solid Waste - Zero out operational emissions from non-area sources.

Table Name Column Name Default Value New Value

tblConstructionPhase NumDays 200.00 0.00

tblConstructionPhase NumDays 120.00 0.00

tblConstructionPhase NumDays 310.00 0.00

tblConstructionPhase NumDays 3,100.00 0.00

tblConstructionPhase NumDays 220.00 0.00

tblConstructionPhase NumDays 220.00 0.00

tblConstructionPhase PhaseEndDate 10/29/2019 1/22/2019

tblConstructionPhase PhaseEndDate 4/14/2020 10/29/2019

tblConstructionPhase PhaseEndDate 6/22/2021 4/14/2020

tblConstructionPhase PhaseEndDate 5/10/2033 6/22/2021

tblConstructionPhase PhaseEndDate 3/14/2034 5/10/2033

tblConstructionPhase PhaseEndDate 1/16/2035 3/14/2034

tblEnergyUse LightingElect 2.99 0.00

tblEnergyUse LightingElect 1.75 0.00

tblEnergyUse LightingElect 3.58 0.00

tblEnergyUse LightingElect 3.13 0.00

tblEnergyUse LightingElect 4.88 0.00

tblEnergyUse NT24E 3.36 0.00

tblEnergyUse NT24E 0.19 0.00

tblEnergyUse NT24E 4.80 0.00

tblEnergyUse NT24E 2.85 0.00

tblEnergyUse NT24E 3.36 0.00

tblEnergyUse NT24NG 6.90 0.00

tblEnergyUse NT24NG 1.01 0.00

tblEnergyUse NT24NG 7.13 0.00

tblEnergyUse NT24NG 0.70 0.00

tblEnergyUse T24E 1.21 0.00

tblEnergyUse T24E 3.92 0.00

tblEnergyUse T24E 4.10 0.00

tblEnergyUse T24E 2.19 0.00

tblEnergyUse T24E 2.24 0.00

tblEnergyUse T24NG 17.85 0.00

tblEnergyUse T24NG 18.32 0.00

tblEnergyUse T24NG 29.38 0.00

tblEnergyUse T24NG 3.90 0.00

tblGrading AcresOfGrading 0.00 775.00

tblLandUse LandUseSquareFeet 2,760,000.00 2,070,000.00

tblLandUse LandUseSquareFeet 580,800.00 280,000.00

tblProjectCharacteristics CO2IntensityFactor 641.35 261

tblSolidWaste SolidWasteGenerationRate 1.39 0.00

tblSolidWaste SolidWasteGenerationRate 1,395.00 0.00

tblSolidWaste SolidWasteGenerationRate 219.00 0.00

tblSolidWaste SolidWasteGenerationRate 283.50 0.00

tblVehicleTrips ST_TR 10.71 0.00

tblVehicleTrips ST_TR 2.46 0.00

tblVehicleTrips ST_TR 8.19 0.00

tblVehicleTrips ST_TR 49.97 0.00

tblVehicleTrips SU_TR 10.71 0.00

tblVehicleTrips SU_TR 1.05 0.00

tblVehicleTrips SU_TR 5.95 0.00

tblVehicleTrips SU_TR 25.24 0.00

tblVehicleTrips WD_TR 10.71 0.00

tblVehicleTrips WD_TR 11.03 0.00

tblVehicleTrips WD_TR 8.17 0.00

tblVehicleTrips WD_TR 42.70 0.00

tblWater IndoorWaterUseRate 21,710,813.93 0.00

tblWater IndoorWaterUseRate 266,600,621.99 0.00

tblWater IndoorWaterUseRate 10,146,708.00 0.00

tblWater IndoorWaterUseRate 19,999,580.80 0.00

tblWater OutdoorWaterUseRate 1,385,796.63 0.00

tblWater OutdoorWaterUseRate 163,400,381.22 0.00

1,127,412.00 0.00

tblWater OutdoorWaterUseRate 12,257,807.59 0.00

NOx CO SO2 Fugitive PM10

tblWater OutdoorWaterUseRate

Fugitive PM2.5

Exhaust PM2.5

PM2.5 Total

Bio- CO2

2.0 Emissions Summary

2.1 Overall ConstructionUnmitigated Construction

ROG NBio- CO2 Total CO2 CH4 N2O CO2e

Year tons/yr MT/yr

Exhaust PM10

PM10 Total

2019 0.0000 0.0000 0.0000 0.0000 0.0000 0.0000

2020 0.0000 0.0000 0.0000 0.0000 0.0000 0.0000

2021 0.0000 0.0000 0.0000 0.0000 0.0000 0.0000

2033 0.0000 0.0000 0.0000 0.0000 0.0000 0.0000

2034 0.0000 0.0000 0.0000 0.0000 0.0000 0.0000

Maximum 0.0000 0.0000 0.0000

SO2 Fugitive PM10

Exhaust PM10

0.0000 0.0000 0.0000

PM2.5 Total

Bio- CO2 NBio- CO2

Mitigated Construction

ROG NOx CO Total CO2 CH4 N2O CO2e

Year tons/yr MT/yr

PM10 Total

Fugitive PM2.5

Exhaust PM2.5

2019 0.0000 0.0000 0.0000 0.0000 0.0000 0.0000

2020 0.0000 0.0000 0.0000 0.0000 0.0000 0.0000

2021 0.0000 0.0000 0.0000 0.0000 0.0000 0.0000

2033 0.0000 0.0000 0.0000 0.0000 0.0000 0.0000

2034 0.0000 0.0000 0.0000 0.0000 0.0000 0.0000

Maximum 0.0000 0.0000 0.0000 0.0000 0.0000 0.0000

ROG NOx CO SO2 Fugitive PM10

Exhaust PM10

PM10 Total

Fugitive PM2.5

Exhaust PM2.5

PM2.5 Total

Bio- CO2 NBio-CO2 Total CO2 CH4 N20 CO2e

Percent Reduction

0.00 0.00 0.00 0.00 0.00 0.00 0.00 0.00 0.00 0.00 0.00 0.00 0.00 0.00 0.00 0.00

Maximum Mitigated ROG + NOX (tons/quarter)

Highest

Quarter Start Date End Date Maximum Unmitigated ROG + NOX (tons/quarter)

2.2 Overall OperationalUnmitigated Operational

SO2 Fugitive PM10

Exhaust PM10

PM2.5 Total

Bio- CO2 NBio- CO2ROG NOx CO Total CO2 CH4 N2O CO2e

Category tons/yr MT/yr

PM10 Total

Fugitive PM2.5

Exhaust PM2.5

Area 0.0000 0.1630 0.1630 4.2000e-004

0.0000 0.1736

Energy 0.0000 0.0000 0.0000 0.0000 0.0000 0.0000

Mobile 0.0000 0.0000 0.0000 0.0000 0.0000 0.0000

Waste 0.0000 0.0000 0.0000 0.0000 0.0000 0.0000

Water 0.0000 0.0000 0.0000 0.0000 0.0000 0.0000

Total 4.2000e-004

0.0000 0.1736

SO2 Fugitive PM10

Exhaust PM10

0.0000 0.1630 0.1630

PM2.5 Total

Bio- CO2 NBio- CO2

Mitigated Operational

ROG NOx CO Total CO2 CH4 N2O CO2e

Category tons/yr MT/yr

PM10 Total

Fugitive PM2.5

Exhaust PM2.5

Area 0.0000 0.1630 0.1630 4.2000e-004

0.0000 0.1736

Energy 0.0000 0.0000 0.0000 0.0000 0.0000 0.0000

Mobile 0.0000 0.0000 0.0000 0.0000 0.0000 0.0000

Waste 0.0000 0.0000 0.0000 0.0000 0.0000 0.0000

Water 0.0000 0.0000 0.0000 0.0000 0.0000 0.0000

Total 0.0000 0.1630 0.1630 4.2000e-004

0.0000 0.1736

ROG NOx CO SO2 Fugitive PM10

Exhaust PM10

PM10 Total

Fugitive PM2.5

Exhaust PM2.5

PM2.5 Total

Bio- CO2 NBio-CO2 Total CO2 CH4 N20 CO2e

Percent Reduction

0.00 0.00 0.00 0.00 0.00 0.00 0.00 0.00 0.00 0.00 0.00 0.00 0.00 0.00 0.00 0.00

3.0 Construction Detail

Construction Phase

Phase Number

Phase Name Phase Type Start Date End Date Num Days Week

Num Days Phase Description

1 Demolition Demolition 1/23/2019 1/22/2019 5 0

2 Site Preparation Site Preparation 10/30/2019 10/29/2019 5 0

3 Grading Grading 4/15/2020 4/14/2020 5 0

4 Building Construction Building Construction 6/23/2021 6/22/2021 5 0

5 Paving Paving 5/11/2033 5/10/2033 5 0

6 Architectural Coating Architectural Coating 3/15/2034 3/14/2034 5 0

Acres of Grading (Site Preparation Phase): 0

Acres of Grading (Grading Phase): 775

Acres of Paving: 62.1

Residential Indoor: 0; Residential Outdoor: 0; Non-Residential Indoor: 3,150,600; Non-Residential Outdoor: 1,050,200; Striped Parking

OffRoad Equipment

Phase Name Offroad Equipment Type Amount Usage Hours Horse Power Load Factor

Demolition Concrete/Industrial Saws 1 8.00 81 0.73

Demolition Excavators 3 8.00 158 0.38

Demolition Rubber Tired Dozers 2 8.00 247 0.40

Site Preparation Rubber Tired Dozers 3 8.00 247 0.40

Site Preparation Tractors/Loaders/Backhoes 4 8.00 97 0.37

Grading Excavators 2 8.00 158 0.38

Grading Graders 1 8.00 187 0.41

Grading Rubber Tired Dozers 1 8.00 247 0.40

Grading Scrapers 2 8.00 367 0.48

Grading Tractors/Loaders/Backhoes 2 8.00 97 0.37

Building Construction Cranes 1 7.00 231 0.29

Building Construction Forklifts 3 8.00 89 0.20

Building Construction Generator Sets 1 8.00 84 0.74

Building Construction Tractors/Loaders/Backhoes 3 7.00 97 0.37

Building Construction Welders 1 8.00 46 0.45

Paving Pavers 2 8.00 130 0.42

Paving Paving Equipment 2 8.00 132 0.36

Paving Rollers 2 8.00 80 0.38

Architectural Coating Air Compressors 1 6.00 78 0.48

Hauling Vehicle Class

Trips and VMT

Phase Name Offroad Equipment Count

Worker Trip Number

Vendor Trip Number

Hauling Trip Number

10.80

Worker Trip Length

Vendor Trip Length

Hauling Trip Length

Worker Vehicle Class

Vendor Vehicle Class

Site Preparation 7 18.00 0.00 0.00

Demolition 6 15.00 0.00 0.00

HHDT

7.30 20.00 LD_Mix HDT_Mix HHDT

10.80

10.80 7.30 20.00 LD_Mix HDT_Mix

Building Construction 9 1,575.00 684.00 0.00

Grading 8 20.00 0.00 0.00

HHDT

7.30 20.00 LD_Mix HDT_Mix HHDT

10.80

10.80 7.30 20.00 LD_Mix HDT_Mix

Architectural Coating 1 315.00 0.00 0.00

Paving 6 15.00 0.00 0.00

20.00 LD_Mix HDT_Mix HHDT

7.30 20.00 LD_Mix HDT_Mix HHDT

NOx CO SO2 Fugitive PM10

10.80 7.30

Fugitive PM2.5

Exhaust PM2.5

PM2.5 Total

Bio- CO2

3.1 Mitigation Measures Construction

3.2 Demolition - 2019Unmitigated Construction On-Site

ROG NBio- CO2 Total CO2 CH4 N2O CO2e

Category tons/yr MT/yr

Exhaust PM10

PM10 Total

Off-Road 0.0000 0.0000 0.0000 0.0000 0.0000 0.0000 0.0000 0.0000 0.0000 0.0000 0.0000 0.0000 0.0000 0.0000 0.0000 0.0000

Total 0.0000 0.0000 0.0000 0.0000 0.0000 0.0000 0.00000.0000 0.0000 0.0000 0.0000 0.0000 0.0000

SO2 Fugitive PM10

Exhaust PM10

0.0000 0.0000 0.0000

PM2.5 Total

Bio- CO2 NBio- CO2

Unmitigated Construction Off-Site

ROG NOx CO Total CO2 CH4 N2O CO2e

Category tons/yr MT/yr

PM10 Total

Fugitive PM2.5

Exhaust PM2.5

Hauling 0.0000 0.0000 0.0000 0.0000 0.0000 0.0000 0.0000 0.0000 0.0000 0.0000 0.0000 0.0000 0.0000 0.0000 0.0000 0.0000

Vendor 0.0000 0.0000 0.0000 0.0000 0.0000 0.0000 0.0000 0.0000 0.0000 0.0000 0.0000 0.0000 0.0000 0.0000 0.0000 0.0000

Worker 0.0000 0.0000 0.0000 0.0000 0.0000 0.0000 0.0000 0.0000 0.0000 0.0000 0.0000 0.0000 0.0000 0.0000 0.0000 0.0000

Total 0.0000 0.0000 0.0000 0.0000 0.0000 0.0000 0.00000.0000 0.0000 0.0000 0.0000 0.0000 0.0000

SO2 Fugitive PM10

Exhaust PM10

0.0000 0.0000 0.0000

PM2.5 Total

Bio- CO2 NBio- CO2

Mitigated Construction On-Site

ROG NOx CO Total CO2 CH4 N2O CO2e

Category tons/yr MT/yr

PM10 Total

Fugitive PM2.5

Exhaust PM2.5

Off-Road 0.0000 0.0000 0.0000 0.0000 0.0000 0.0000 0.0000 0.0000 0.0000 0.0000 0.0000 0.0000 0.0000 0.0000 0.0000 0.0000

Total 0.0000 0.0000 0.0000 0.0000 0.0000 0.0000 0.00000.0000 0.0000 0.0000 0.0000 0.0000 0.0000 0.0000 0.0000 0.0000

Mitigated Construction Off-Site

SO2 Fugitive PM10

Exhaust PM10

PM2.5 Total

Bio- CO2 NBio- CO2ROG NOx CO Total CO2 CH4 N2O CO2e

Category tons/yr MT/yr

PM10 Total

Fugitive PM2.5

Exhaust PM2.5

Hauling 0.0000 0.0000 0.0000 0.0000 0.0000 0.0000 0.0000 0.0000 0.0000 0.0000 0.0000 0.0000 0.0000 0.0000 0.0000 0.0000

Vendor 0.0000 0.0000 0.0000 0.0000 0.0000 0.0000 0.0000 0.0000 0.0000 0.0000 0.0000 0.0000 0.0000 0.0000 0.0000 0.0000

Worker 0.0000 0.0000 0.0000 0.0000 0.0000 0.0000 0.0000 0.0000 0.0000 0.0000 0.0000 0.0000 0.0000 0.0000 0.0000 0.0000

Total 0.0000 0.0000 0.0000 0.0000 0.0000 0.0000 0.00000.0000 0.0000 0.0000 0.0000 0.0000 0.0000

SO2 Fugitive PM10

Exhaust PM10

0.0000 0.0000 0.0000

PM2.5 Total

Bio- CO2 NBio- CO2

3.3 Site Preparation - 2019Unmitigated Construction On-Site

ROG NOx CO Total CO2 CH4 N2O CO2e

Category tons/yr MT/yr

PM10 Total

Fugitive PM2.5

Exhaust PM2.5

Fugitive Dust 0.0000 0.0000 0.0000 0.0000 0.0000 0.0000 0.0000 0.0000 0.0000 0.0000 0.0000 0.0000 0.0000 0.0000 0.0000 0.0000

Off-Road 0.0000 0.0000 0.0000 0.0000 0.0000 0.0000 0.0000 0.0000 0.0000 0.0000 0.0000 0.0000 0.0000 0.0000 0.0000 0.0000

Total 0.0000 0.0000 0.0000 0.0000 0.0000 0.0000 0.00000.0000 0.0000 0.0000 0.0000 0.0000 0.0000

SO2 Fugitive PM10

Exhaust PM10

0.0000 0.0000 0.0000

PM2.5 Total

Bio- CO2 NBio- CO2

Unmitigated Construction Off-Site

ROG NOx CO Total CO2 CH4 N2O CO2e

Category tons/yr MT/yr

PM10 Total

Fugitive PM2.5

Exhaust PM2.5

Hauling 0.0000 0.0000 0.0000 0.0000 0.0000 0.0000 0.0000 0.0000 0.0000 0.0000 0.0000 0.0000 0.0000 0.0000 0.0000 0.0000

Vendor 0.0000 0.0000 0.0000 0.0000 0.0000 0.0000 0.0000 0.0000 0.0000 0.0000 0.0000 0.0000 0.0000 0.0000 0.0000 0.0000

Worker 0.0000 0.0000 0.0000 0.0000 0.0000 0.0000 0.0000 0.0000 0.0000 0.0000 0.0000 0.0000 0.0000 0.0000 0.0000 0.0000

Total 0.0000 0.0000 0.0000 0.0000 0.0000 0.0000 0.00000.0000 0.0000 0.0000 0.0000 0.0000 0.0000

SO2 Fugitive PM10

Exhaust PM10

0.0000 0.0000 0.0000

PM2.5 Total

Bio- CO2 NBio- CO2

Mitigated Construction On-Site

ROG NOx CO Total CO2 CH4 N2O CO2e

Category tons/yr MT/yr

PM10 Total

Fugitive PM2.5

Exhaust PM2.5

Fugitive Dust 0.0000 0.0000 0.0000 0.0000 0.0000 0.0000 0.0000 0.0000 0.0000 0.0000 0.0000 0.0000 0.0000 0.0000 0.0000 0.0000

Off-Road 0.0000 0.0000 0.0000 0.0000 0.0000 0.0000 0.0000 0.0000 0.0000 0.0000 0.0000 0.0000 0.0000 0.0000 0.0000 0.0000

Total 0.0000 0.0000 0.0000 0.0000 0.0000 0.0000 0.00000.0000 0.0000 0.0000 0.0000 0.0000 0.0000

SO2 Fugitive PM10

Exhaust PM10

0.0000 0.0000 0.0000

PM2.5 Total

Bio- CO2 NBio- CO2

Mitigated Construction Off-Site

ROG NOx CO Total CO2 CH4 N2O CO2e

Category tons/yr MT/yr

PM10 Total

Fugitive PM2.5

Exhaust PM2.5

Hauling 0.0000 0.0000 0.0000 0.0000 0.0000 0.0000 0.0000 0.0000 0.0000 0.0000 0.0000 0.0000 0.0000 0.0000 0.0000 0.0000

Vendor 0.0000 0.0000 0.0000 0.0000 0.0000 0.0000 0.0000 0.0000 0.0000 0.0000 0.0000 0.0000 0.0000 0.0000 0.0000 0.0000

Worker 0.0000 0.0000 0.0000 0.0000 0.0000 0.0000 0.0000 0.0000 0.0000 0.0000 0.0000 0.0000 0.0000 0.0000 0.0000 0.0000

Total 0.0000 0.0000 0.0000 0.0000 0.0000 0.0000 0.00000.0000 0.0000 0.0000 0.0000 0.0000 0.0000 0.0000 0.0000 0.0000

SO2 Fugitive PM10

Exhaust PM10

PM2.5 Total

Bio- CO2 NBio- CO2

3.4 Grading - 2020Unmitigated Construction On-Site

ROG NOx CO Total CO2 CH4 N2O CO2e

Category tons/yr MT/yr

PM10 Total

Fugitive PM2.5

Exhaust PM2.5

Fugitive Dust 0.0000 0.0000 0.0000 0.0000 0.0000 0.0000 0.0000 0.0000 0.0000 0.0000 0.0000 0.0000 0.0000 0.0000 0.0000 0.0000

Off-Road 0.0000 0.0000 0.0000 0.0000 0.0000 0.0000 0.0000 0.0000 0.0000 0.0000 0.0000 0.0000 0.0000 0.0000 0.0000 0.0000

Total 0.0000 0.0000 0.0000 0.0000 0.0000 0.0000 0.00000.0000 0.0000 0.0000 0.0000 0.0000 0.0000

SO2 Fugitive PM10

Exhaust PM10

0.0000 0.0000 0.0000

PM2.5 Total

Bio- CO2 NBio- CO2

Unmitigated Construction Off-Site

ROG NOx CO Total CO2 CH4 N2O CO2e

Category tons/yr MT/yr

PM10 Total

Fugitive PM2.5

Exhaust PM2.5

Hauling 0.0000 0.0000 0.0000 0.0000 0.0000 0.0000 0.0000 0.0000 0.0000 0.0000 0.0000 0.0000 0.0000 0.0000 0.0000 0.0000

Vendor 0.0000 0.0000 0.0000 0.0000 0.0000 0.0000 0.0000 0.0000 0.0000 0.0000 0.0000 0.0000 0.0000 0.0000 0.0000 0.0000

Worker 0.0000 0.0000 0.0000 0.0000 0.0000 0.0000 0.0000 0.0000 0.0000 0.0000 0.0000 0.0000 0.0000 0.0000 0.0000 0.0000

Total 0.0000 0.0000 0.0000 0.0000 0.0000 0.0000 0.00000.0000 0.0000 0.0000 0.0000 0.0000 0.0000 0.0000 0.0000 0.0000

Mitigated Construction On-Site

SO2 Fugitive PM10

Exhaust PM10

PM2.5 Total

Bio- CO2 NBio- CO2ROG NOx CO Total CO2 CH4 N2O CO2e

Category tons/yr MT/yr

PM10 Total

Fugitive PM2.5

Exhaust PM2.5

Fugitive Dust 0.0000 0.0000 0.0000 0.0000 0.0000 0.0000 0.0000 0.0000 0.0000 0.0000 0.0000 0.0000 0.0000 0.0000 0.0000 0.0000

Off-Road 0.0000 0.0000 0.0000 0.0000 0.0000 0.0000 0.0000 0.0000 0.0000 0.0000 0.0000 0.0000 0.0000 0.0000 0.0000 0.0000

Total 0.0000 0.0000 0.0000 0.0000 0.0000 0.0000 0.00000.0000 0.0000 0.0000 0.0000 0.0000 0.0000

SO2 Fugitive PM10

Exhaust PM10

0.0000 0.0000 0.0000

PM2.5 Total

Bio- CO2 NBio- CO2

Mitigated Construction Off-Site

ROG NOx CO Total CO2 CH4 N2O CO2e

Category tons/yr MT/yr

PM10 Total

Fugitive PM2.5

Exhaust PM2.5

Hauling 0.0000 0.0000 0.0000 0.0000 0.0000 0.0000 0.0000 0.0000 0.0000 0.0000 0.0000 0.0000 0.0000 0.0000 0.0000 0.0000

Vendor 0.0000 0.0000 0.0000 0.0000 0.0000 0.0000 0.0000 0.0000 0.0000 0.0000 0.0000 0.0000 0.0000 0.0000 0.0000 0.0000

Worker 0.0000 0.0000 0.0000 0.0000 0.0000 0.0000 0.0000 0.0000 0.0000 0.0000 0.0000 0.0000 0.0000 0.0000 0.0000 0.0000

Total 0.0000 0.0000 0.0000 0.0000 0.0000 0.0000 0.00000.0000 0.0000 0.0000 0.0000 0.0000 0.0000

SO2 Fugitive PM10

Exhaust PM10

0.0000 0.0000 0.0000

PM2.5 Total

Bio- CO2 NBio- CO2

3.5 Building Construction - 2021Unmitigated Construction On-Site

ROG NOx CO Total CO2 CH4 N2O CO2e

Category tons/yr MT/yr

PM10 Total

Fugitive PM2.5

Exhaust PM2.5

Off-Road 0.0000 0.0000 0.0000 0.0000 0.0000 0.0000 0.0000 0.0000 0.0000 0.0000 0.0000 0.0000 0.0000 0.0000 0.0000 0.0000

Total 0.0000 0.0000 0.0000 0.0000 0.0000 0.0000 0.00000.0000 0.0000 0.0000 0.0000 0.0000 0.0000

SO2 Fugitive PM10

Exhaust PM10

0.0000 0.0000 0.0000

PM2.5 Total

Bio- CO2 NBio- CO2

Unmitigated Construction Off-Site

ROG NOx CO Total CO2 CH4 N2O CO2e

Category tons/yr MT/yr

PM10 Total

Fugitive PM2.5

Exhaust PM2.5

Hauling 0.0000 0.0000 0.0000 0.0000 0.0000 0.0000 0.0000 0.0000 0.0000 0.0000 0.0000 0.0000 0.0000 0.0000 0.0000 0.0000

Vendor 0.0000 0.0000 0.0000 0.0000 0.0000 0.0000 0.0000 0.0000 0.0000 0.0000 0.0000 0.0000 0.0000 0.0000 0.0000 0.0000

Worker 0.0000 0.0000 0.0000 0.0000 0.0000 0.0000 0.0000 0.0000 0.0000 0.0000 0.0000 0.0000 0.0000 0.0000 0.0000 0.0000

Total 0.0000 0.0000 0.0000 0.0000 0.0000 0.0000 0.00000.0000 0.0000 0.0000 0.0000 0.0000 0.0000

SO2 Fugitive PM10

Exhaust PM10

0.0000 0.0000 0.0000

PM2.5 Total

Bio- CO2 NBio- CO2

Mitigated Construction On-Site

ROG NOx CO Total CO2 CH4 N2O CO2e

Category tons/yr MT/yr

PM10 Total

Fugitive PM2.5

Exhaust PM2.5

Off-Road 0.0000 0.0000 0.0000 0.0000 0.0000 0.0000 0.0000 0.0000 0.0000 0.0000 0.0000 0.0000 0.0000 0.0000 0.0000 0.0000

Total 0.0000 0.0000 0.0000 0.0000 0.0000 0.0000 0.00000.0000 0.0000 0.0000 0.0000 0.0000 0.0000 0.0000 0.0000 0.0000

Mitigated Construction Off-Site

SO2 Fugitive PM10

Exhaust PM10

PM2.5 Total

Bio- CO2 NBio- CO2ROG NOx CO Total CO2 CH4 N2O CO2e

Category tons/yr MT/yr

PM10 Total

Fugitive PM2.5

Exhaust PM2.5

Hauling 0.0000 0.0000 0.0000 0.0000 0.0000 0.0000 0.0000 0.0000 0.0000 0.0000 0.0000 0.0000 0.0000 0.0000 0.0000 0.0000

Vendor 0.0000 0.0000 0.0000 0.0000 0.0000 0.0000 0.0000 0.0000 0.0000 0.0000 0.0000 0.0000 0.0000 0.0000 0.0000 0.0000

Worker 0.0000 0.0000 0.0000 0.0000 0.0000 0.0000 0.0000 0.0000 0.0000 0.0000 0.0000 0.0000 0.0000 0.0000 0.0000 0.0000

Total 0.0000 0.0000 0.0000 0.0000 0.0000 0.0000 0.00000.0000 0.0000 0.0000 0.0000 0.0000 0.0000

SO2 Fugitive PM10

Exhaust PM10

0.0000 0.0000 0.0000

PM2.5 Total

Bio- CO2 NBio- CO2

3.6 Paving - 2033Unmitigated Construction On-Site

ROG NOx CO Total CO2 CH4 N2O CO2e

Category tons/yr MT/yr

PM10 Total

Fugitive PM2.5

Exhaust PM2.5

Off-Road 0.0000 0.0000 0.0000 0.0000 0.0000 0.0000 0.0000 0.0000 0.0000 0.0000 0.0000 0.0000 0.0000 0.0000 0.0000 0.0000

Paving 0.0000 0.0000 0.0000 0.0000 0.0000 0.0000 0.0000 0.0000 0.0000 0.0000 0.0000 0.0000 0.0000 0.0000 0.0000 0.0000

Total 0.0000 0.0000 0.0000 0.0000 0.0000 0.0000 0.00000.0000 0.0000 0.0000 0.0000 0.0000 0.0000

SO2 Fugitive PM10

Exhaust PM10

0.0000 0.0000 0.0000

PM2.5 Total

Bio- CO2 NBio- CO2

Unmitigated Construction Off-Site

ROG NOx CO Total CO2 CH4 N2O CO2e

Category tons/yr MT/yr

PM10 Total

Fugitive PM2.5

Exhaust PM2.5

Hauling 0.0000 0.0000 0.0000 0.0000 0.0000 0.0000 0.0000 0.0000 0.0000 0.0000 0.0000 0.0000 0.0000 0.0000 0.0000 0.0000

Vendor 0.0000 0.0000 0.0000 0.0000 0.0000 0.0000 0.0000 0.0000 0.0000 0.0000 0.0000 0.0000 0.0000 0.0000 0.0000 0.0000

Worker 0.0000 0.0000 0.0000 0.0000 0.0000 0.0000 0.0000 0.0000 0.0000 0.0000 0.0000 0.0000 0.0000 0.0000 0.0000 0.0000

Total 0.0000 0.0000 0.0000 0.0000 0.0000 0.0000 0.00000.0000 0.0000 0.0000 0.0000 0.0000 0.0000

SO2 Fugitive PM10

Exhaust PM10

0.0000 0.0000 0.0000

PM2.5 Total

Bio- CO2 NBio- CO2

Mitigated Construction On-Site

ROG NOx CO Total CO2 CH4 N2O CO2e

Category tons/yr MT/yr

PM10 Total

Fugitive PM2.5

Exhaust PM2.5

Off-Road 0.0000 0.0000 0.0000 0.0000 0.0000 0.0000 0.0000 0.0000 0.0000 0.0000 0.0000 0.0000 0.0000 0.0000 0.0000 0.0000

Paving 0.0000 0.0000 0.0000 0.0000 0.0000 0.0000 0.0000 0.0000 0.0000 0.0000 0.0000 0.0000 0.0000 0.0000 0.0000 0.0000

Total 0.0000 0.0000 0.0000 0.0000 0.0000 0.0000 0.00000.0000 0.0000 0.0000 0.0000 0.0000 0.0000

SO2 Fugitive PM10

Exhaust PM10

0.0000 0.0000 0.0000

PM2.5 Total

Bio- CO2 NBio- CO2

Mitigated Construction Off-Site

ROG NOx CO Total CO2 CH4 N2O CO2e

Category tons/yr MT/yr

PM10 Total

Fugitive PM2.5

Exhaust PM2.5

Hauling 0.0000 0.0000 0.0000 0.0000 0.0000 0.0000 0.0000 0.0000 0.0000 0.0000 0.0000 0.0000 0.0000 0.0000 0.0000 0.0000

Vendor 0.0000 0.0000 0.0000 0.0000 0.0000 0.0000 0.0000 0.0000 0.0000 0.0000 0.0000 0.0000 0.0000 0.0000 0.0000 0.0000

Worker 0.0000 0.0000 0.0000 0.0000 0.0000 0.0000 0.0000 0.0000 0.0000 0.0000 0.0000 0.0000 0.0000 0.0000 0.0000 0.0000

Total 0.0000 0.0000 0.0000 0.0000 0.0000 0.0000 0.00000.0000 0.0000 0.0000 0.0000 0.0000 0.0000 0.0000 0.0000 0.0000

SO2 Fugitive PM10

Exhaust PM10

PM2.5 Total

Bio- CO2 NBio- CO2

3.7 Architectural Coating - 2034Unmitigated Construction On-Site

ROG NOx CO Total CO2 CH4 N2O CO2e

Category tons/yr MT/yr

PM10 Total

Fugitive PM2.5

Exhaust PM2.5

Archit. Coating 0.0000 0.0000 0.0000 0.0000 0.0000 0.0000 0.0000 0.0000 0.0000 0.0000 0.0000 0.0000 0.0000 0.0000 0.0000 0.0000

Off-Road 0.0000 0.0000 0.0000 0.0000 0.0000 0.0000 0.0000 0.0000 0.0000 0.0000 0.0000 0.0000 0.0000 0.0000 0.0000 0.0000

Total 0.0000 0.0000 0.0000 0.0000 0.0000 0.0000 0.00000.0000 0.0000 0.0000 0.0000 0.0000 0.0000

SO2 Fugitive PM10

Exhaust PM10

0.0000 0.0000 0.0000

PM2.5 Total

Bio- CO2 NBio- CO2

Unmitigated Construction Off-Site

ROG NOx CO Total CO2 CH4 N2O CO2e

Category tons/yr MT/yr

PM10 Total

Fugitive PM2.5

Exhaust PM2.5

Hauling 0.0000 0.0000 0.0000 0.0000 0.0000 0.0000 0.0000 0.0000 0.0000 0.0000 0.0000 0.0000 0.0000 0.0000 0.0000 0.0000

Vendor 0.0000 0.0000 0.0000 0.0000 0.0000 0.0000 0.0000 0.0000 0.0000 0.0000 0.0000 0.0000 0.0000 0.0000 0.0000 0.0000

Worker 0.0000 0.0000 0.0000 0.0000 0.0000 0.0000 0.0000 0.0000 0.0000 0.0000 0.0000 0.0000 0.0000 0.0000 0.0000 0.0000

Total 0.0000 0.0000 0.0000 0.0000 0.0000 0.0000 0.00000.0000 0.0000 0.0000 0.0000 0.0000 0.0000 0.0000 0.0000 0.0000

Mitigated Construction On-Site

SO2 Fugitive PM10

Exhaust PM10

PM2.5 Total

Bio- CO2 NBio- CO2ROG NOx CO Total CO2 CH4 N2O CO2e

Category tons/yr MT/yr

PM10 Total

Fugitive PM2.5

Exhaust PM2.5

Archit. Coating 0.0000 0.0000 0.0000 0.0000 0.0000 0.0000 0.0000 0.0000 0.0000 0.0000 0.0000 0.0000 0.0000 0.0000 0.0000 0.0000

Off-Road 0.0000 0.0000 0.0000 0.0000 0.0000 0.0000 0.0000 0.0000 0.0000 0.0000 0.0000 0.0000 0.0000 0.0000 0.0000 0.0000

Total 0.0000 0.0000 0.0000 0.0000 0.0000 0.0000 0.00000.0000 0.0000 0.0000 0.0000 0.0000 0.0000

SO2 Fugitive PM10

Exhaust PM10

0.0000 0.0000 0.0000

PM2.5 Total

Bio- CO2 NBio- CO2

Mitigated Construction Off-Site

ROG NOx CO Total CO2 CH4 N2O CO2e

Category tons/yr MT/yr

PM10 Total

Fugitive PM2.5

Exhaust PM2.5

Hauling 0.0000 0.0000 0.0000 0.0000 0.0000 0.0000 0.0000 0.0000 0.0000 0.0000 0.0000 0.0000 0.0000 0.0000 0.0000 0.0000

Vendor 0.0000 0.0000 0.0000 0.0000 0.0000 0.0000 0.0000 0.0000 0.0000 0.0000 0.0000 0.0000 0.0000 0.0000 0.0000 0.0000

Worker 0.0000 0.0000 0.0000 0.0000 0.0000 0.0000 0.0000 0.0000 0.0000 0.0000 0.0000 0.0000 0.0000 0.0000 0.0000 0.0000

Total 0.0000 0.0000 0.0000 0.0000 0.0000 0.0000 0.00000.0000 0.0000 0.0000 0.0000 0.0000 0.0000

CO SO2 Fugitive PM10

0.0000 0.0000 0.0000

Fugitive PM2.5

Exhaust PM2.5

PM2.5 Total

Bio- CO2

4.0 Operational Detail - Mobile

4.1 Mitigation Measures Mobile

ROG NOx NBio- CO2 Total CO2 CH4 N2O CO2eExhaust PM10

PM10 Total

Category tons/yr MT/yr

Mitigated 0.0000 0.0000 0.0000 0.0000 0.0000 0.0000

Unmitigated 0.0000 0.0000 0.0000 0.0000 0.0000 0.0000

4.2 Trip Summary Information

Average Daily Trip Rate Unmitigated MitigatedLand Use Weekday Saturday Sunday Annual VMT Annual VMT

Arena 0.00 0.00 0.00Enclosed Parking with Elevator 0.00 0.00 0.00

General Office Building 0.00 0.00 0.00Hotel 0.00 0.00 0.00

Regional Shopping Center 0.00 0.00 0.00Total 0.00 0.00 0.00

4.3 Trip Type Information

Miles Trip % Trip Purpose %

Land Use H-W or C-W H-S or C-C H-O or C-NW H-W or C-W

H-S or C-C H-O or C-NW Primary Diverted Pass-by

Arena 9.50 7.30 7.30 0.00 81.00 19.00 66 28 6

Enclosed Parking with Elevator 9.50 7.30 7.30 0.00 0.00 0.00 0 0 0

General Office Building 9.50 7.30 7.30 33.00 48.00 19.00 77 19 4

Hotel 9.50 7.30 7.30 19.40 61.60 19.00 58 38 4

Regional Shopping Center 9.50 7.30 7.30 16.30 64.70 19.00 54 35 11

4.4 Fleet MixLand Use LDA LDT1 LDT2 MDV LHD1 LHD2 MHD HHD OBUS UBUS MCY SBUS MH

Arena 0.565129 0.036801 0.190239 0.104144 0.013417 0.005103 0.025765 0.048748 0.002254 0.001991 0.005378 0.000368 0.000663

Enclosed Parking with Elevator 0.565129 0.036801 0.190239 0.104144 0.013417 0.005103 0.025765 0.048748 0.002254 0.001991 0.005378 0.000368 0.000663

General Office Building 0.565129 0.036801 0.190239 0.104144 0.013417 0.005103 0.025765 0.048748 0.002254 0.001991 0.005378 0.000368 0.000663

0.048748 0.002254 0.001991 0.005378Hotel 0.565129 0.036801 0.190239 0.104144 0.013417

0.104144 0.013417 0.005103 0.025765

0.005103 0.025765

0.001991 0.005378 0.000368 0.000663

0.000368 0.000663

0.048748 0.002254Regional Shopping Center 0.565129 0.036801 0.190239

5.0 Energy Detail

NOx CO SO2 Fugitive PM10

Fugitive PM2.5

Exhaust PM2.5

PM2.5 Total

Bio- CO2

Historical Energy Use: N

5.1 Mitigation Measures Energy

ROG NBio- CO2 Total CO2 CH4 N2O CO2e

Category tons/yr MT/yr

Exhaust PM10

PM10 Total

Electricity Mitigated

0.0000 0.0000 0.0000 0.0000 0.0000 0.0000

Electricity Unmitigated

0.0000 0.0000 0.0000 0.0000 0.0000 0.0000

NaturalGas Mitigated

0.0000 0.0000 0.0000 0.0000 0.0000 0.0000

NaturalGas Unmitigated

0.0000 0.0000 0.0000 0.0000 0.0000

ROG NOx CO SO2 Fugitive PM10

0.0000

PM10 Total

Fugitive PM2.5

Exhaust PM2.5

PM2.5 Total

Bio- CO2

5.2 Energy by Land Use - NaturalGasUnmitigated

NaturalGas Use

NBio- CO2 Total CO2 CH4 N2O CO2e

Land Use kBTU/yr tons/yr MT/yr

Exhaust PM10

Arena 0 0.0000 0.0000 0.0000 0.0000 0.0000 0.0000

Enclosed Parking with Elevator

0 0.0000 0.0000 0.0000 0.0000 0.0000 0.0000

General Office Building

0 0.0000 0.0000 0.0000 0.0000 0.0000 0.0000

Hotel 0 0.0000 0.0000 0.0000 0.0000 0.0000 0.0000

Regional Shopping Center

0 0.0000 0.00000.0000 0.0000 0.0000 0.0000

0.0000 0.0000Total 0.0000 0.0000 0.0000 0.0000

Mitigated

NaturalGas Use

ROG NOx CO SO2 Fugitive PM10

Exhaust PM10

PM10 Total

Fugitive PM2.5

Exhaust PM2.5

PM2.5 Total

Bio- CO2 NBio- CO2 Total CO2 CH4 N2O CO2e

Land Use kBTU/yr tons/yr MT/yr

Arena 0 0.0000 0.0000 0.0000 0.0000 0.0000 0.0000

Enclosed Parking with Elevator

0 0.0000 0.0000 0.0000 0.0000 0.0000 0.0000

General Office Building

0 0.0000 0.0000 0.0000 0.0000 0.0000 0.0000

Hotel 0 0.0000 0.0000 0.0000 0.0000 0.0000 0.0000

Regional Shopping Center

0 0.0000 0.00000.0000 0.0000

0.0000

0.0000 0.0000

Total 0.0000 0.0000 0.0000 0.0000 0.0000

5.3 Energy by Land Use - ElectricityUnmitigated

Electricity Use

Total CO2 CH4 N2O CO2e

Land Use kWh/yr ton

MT/yr

Arena 0 0.0000 0.0000 0.0000 0.0000

Enclosed Parking with Elevator

0 0.0000 0.0000 0.0000 0.0000

General Office Building

0 0.0000 0.0000 0.0000

Hotel 0 0.0000 0.0000 0.0000

0.0000

0.0000

0 0.0000 0.0000 0.0000

CO2e

0.0000

Total 0.0000 0.0000 0.0000 0.0000

Regional Shopping Center

0.0000 0.0000

Mitigated

Electricity Use

Total CO2 CH4 N2O

0.0000 0.0000

Land Use kWh/yr ton

MT/yr

Arena 0 0.0000

0.0000 0.0000 0.0000

0.0000

Enclosed Parking with Elevator

0 0.0000 0.0000

0.0000

Hotel 0 0.0000 0.0000 0.0000 0.0000

General Office Building

0

0.0000

Regional Shopping Center

0 0.0000 0.0000 0.0000

CO SO2 Fugitive PM10

0.0000

Total 0.0000 0.0000 0.0000

Fugitive PM2.5

Exhaust PM2.5

PM2.5 Total

Bio- CO2

6.0 Area Detail

6.1 Mitigation Measures Area

ROG NOx NBio- CO2 Total CO2 CH4 N2O CO2e

Category tons/yr MT/yr

Exhaust PM10

PM10 Total

Mitigated 0.0000 0.1630 0.1630 4.2000e-004

0.0000 0.1736

Unmitigated 4.2000e-004

0.0000 0.1736

SO2 Fugitive PM10

Exhaust PM10

0.0000 0.1630 0.1630

PM2.5 Total

Bio- CO2 NBio- CO2

6.2 Area by SubCategoryUnmitigated

ROG NOx CO Total CO2 CH4 N2O CO2e

SubCategory tons/yr MT/yr

PM10 Total

Fugitive PM2.5

Exhaust PM2.5

Architectural Coating

0.0000 0.0000 0.0000 0.0000 0.0000 0.0000

Consumer Products

0.0000 0.0000 0.0000 0.0000 0.0000 0.0000

Landscaping 0.0000 0.1630 0.1630 4.2000e-004

0.0000 0.1736

Total 4.2000e-004

0.0000 0.1736

SO2 Fugitive PM10

Exhaust PM10

0.0000 0.1630 0.1630

PM2.5 Total

Bio- CO2 NBio- CO2

Mitigated

ROG NOx CO Total CO2 CH4 N2O CO2e

SubCategory tons/yr MT/yr

PM10 Total

Fugitive PM2.5

Exhaust PM2.5

Architectural Coating

0.0000 0.0000 0.0000 0.0000 0.0000 0.0000

Consumer Products

0.0000 0.0000 0.0000 0.0000 0.0000 0.0000

Landscaping 0.0000 0.1630 0.1630 4.2000e-004

0.0000 0.1736

Total 0.0000 0.1630 0.1630 4.2000e-004

0.0000 0.1736

7.0 Water Detail

7.1 Mitigation Measures Water

Total CO2 CH4 N2O CO2e

Category ton

MT/yr

Mitigated 0.0000 0.0000 0.0000 0.0000

Unmitigated 0.0000 0.0000 0.0000 0.0000

7.2 Water by Land UseUnmitigated

Indoor/Outdoor Use

Total CO2 CH4 N2O CO2e

Land Use Mgal ton

MT/yr

Arena 0 / 0 0.0000 0.0000 0.0000 0.0000

Enclosed Parking with Elevator

0 / 0 0.0000 0.0000 0.0000 0.0000

0.0000 0.0000

General Office Building

0 / 0 0.0000 0.0000 0.0000

0.0000 0.0000 0.0000

0.0000

Hotel 0 / 0 0.0000 0.0000

0.0000

Total 0.0000 0.0000 0.0000 0.0000

Regional Shopping Center

0 / 0

Mitigated

Indoor/Outdoor Use

Total CO2 CH4 N2O CO2e

Land Use Mgal ton

MT/yr

Arena 0 / 0 0.0000 0.0000 0.0000 0.0000

Enclosed Parking with Elevator

0 / 0 0.0000 0.0000 0.0000 0.0000

0.0000 0.0000

General Office Building

0 / 0 0.0000 0.0000 0.0000

0.0000 0.0000 0.0000

0.0000

Hotel 0 / 0 0.0000 0.0000

0.0000

Total 0.0000 0.0000 0.0000 0.0000

Regional Shopping Center

0 / 0

8.0 Waste Detail

8.1 Mitigation Measures Waste

Category/Year

Total CO2 CH4 N2O CO2e

ton

MT/yr

Mitigated 0.0000 0.0000 0.0000 0.0000

Unmitigated 0.0000 0.0000 0.0000 0.0000

8.2 Waste by Land UseUnmitigated

Waste Disposed

Total CO2 CH4 N2O CO2e

Land Use tons ton

MT/yr

Arena 0 0.0000 0.0000 0.0000 0.0000

Enclosed Parking with Elevator

0 0.0000 0.0000 0.0000 0.0000

0.0000 0.0000

General Office Building

0 0.0000 0.0000 0.0000

0.0000 0.0000 0.0000

0.0000

Hotel 0 0.0000 0.0000

0.0000

Total 0.0000 0.0000 0.0000 0.0000

Regional Shopping Center

0

Mitigated

Waste Disposed

Total CO2 CH4 N2O CO2e

Land Use tons ton

MT/yr

Arena 0 0.0000 0.0000 0.0000 0.0000

Enclosed Parking with Elevator

0 0.0000 0.0000 0.0000 0.0000

0.0000 0.0000

General Office Building

0 0.0000 0.0000 0.0000

0.0000 0.0000 0.0000

0.0000

Hotel 0 0.0000 0.0000

0.0000Regional Shopping Center

0

Total 0.0000 0.0000 0.0000 0.0000

Horse Power Load Factor

9.0 Operational Offroad

Equipment Type Number Hours/Day Days/Year Horse Power

Boiler Rating Fuel Type

Load Factor Fuel Type

10.0 Stationary Equipment

Fire Pumps and Emergency Generators

Equipment Type Number Hours/Day Hours/Year

User Defined Equipment

Equipment Type Number

11.0 Vegetation

Fuel Type

Boilers

Equipment Type Number Heat Input/Day Heat Input/Year

PROJECT RESIDENTIAL CALEEMOD® OUTPUT AREA SOURCE EMISSIONS

CalEEMod Version: CalEEMod.2016.3.2Page 1 of 1 Date: 1/25/2019 3:45 PM

Oakland Waterfront Ballpark District - Project - Residential - Area Source GHG Emissions - Alameda County, Annual

Oakland Waterfront Ballpark District - Project - Residential - Area Source GHG EmissionsAlameda County, Annual

1.0 Project Characteristics

1.1 Land Usage

Land Uses Size Metric Lot Acreage Floor Surface Area Population

Apartments High Rise 3,000.00 Dwelling Unit 48.39 3,300,000.00 8580

1.2 Other Project Characteristics

Urbanization Urban Wind Speed (m/s) 2.2 Precipitation Freq (Days) 63

Climate Zone 5 Operational Year 2027

Utility Company Pacific Gas & Electric Company

CO2 Intensity (lb/MWhr)

261 CH4 Intensity (lb/MWhr)

0.029 N2O Intensity (lb/MWhr)

0.006

1.3 User Entered Comments & Non-Default Data

Project Characteristics - Area source GHG emissions only for Residential Land Uses (Full Masterplan).Land Use - Land use square footage provided by project sponsor. Default acreage was not updates because it does not impact area source emissions. This run estimates the Area source emissions from the residential sources in Full Masterplan (2027).Construction Phase - Zero out construction emissionsOff-road Equipment - Zero out construction emissions.

Off-road Equipment - Zero out construction emissions.

Off-road Equipment - Zero out construction emissions.

Off-road Equipment - Zero out construction emissions.

Off-road Equipment - Zero out construction emissions.

Off-road Equipment - Zero out construction emissions.

Trips and VMT - Zero out construction emissions

Grading - Zero out construction emissions.

Architectural Coating - Zero out construction emissions.

Vehicle Trips - Zero out operational emissions from non-area sources.

Woodstoves - No woodstoves or wood fireplaces.

Energy Use - Zero out operational emissions from non-area sources.

Water And Wastewater - Zero out operational emissions from non-area sources.

Solid Waste - Zero out operational emissions from non-area sources.

Table Name Column Name Default Value New Value

tblArchitecturalCoating ConstArea_Residential_Exterior 2,227,500.00 0.00

tblArchitecturalCoating ConstArea_Residential_Interior 6,682,500.00 0.00

tblConstructionPhase NumDays 55.00 0.00

tblConstructionPhase NumDays 740.00 0.00

tblConstructionPhase NumDays 50.00 0.00

tblConstructionPhase NumDays 75.00 0.00

tblConstructionPhase NumDays 55.00 0.00

tblConstructionPhase NumDays 30.00 0.00

tblEnergyUse LightingElect 741.44 0.00

tblEnergyUse NT24E 3,054.10 0.00

tblEnergyUse NT24NG 2,615.00 0.00

tblEnergyUse T24E 426.45 0.00

tblEnergyUse T24NG 6,115.43 0.00

tblFireplaces NumberGas 450.00 750.00

tblFireplaces NumberNoFireplace 120.00 0.00

tblFireplaces NumberWood 510.00 0.00

tblLandUse LandUseSquareFeet 3,000,000.00 3,300,000.00

tblOffRoadEquipment OffRoadEquipmentUnitAmount 1.00 0.00

tblOffRoadEquipment OffRoadEquipmentUnitAmount 1.00 0.00

tblOffRoadEquipment OffRoadEquipmentUnitAmount 1.00 0.00

tblOffRoadEquipment OffRoadEquipmentUnitAmount 3.00 0.00

tblOffRoadEquipment OffRoadEquipmentUnitAmount 2.00 0.00

tblOffRoadEquipment OffRoadEquipmentUnitAmount 3.00 0.00

tblOffRoadEquipment OffRoadEquipmentUnitAmount 1.00 0.00

tblOffRoadEquipment OffRoadEquipmentUnitAmount 1.00 0.00

tblOffRoadEquipment OffRoadEquipmentUnitAmount 2.00 0.00

tblOffRoadEquipment OffRoadEquipmentUnitAmount 2.00 0.00

tblOffRoadEquipment OffRoadEquipmentUnitAmount 2.00 0.00

tblOffRoadEquipment OffRoadEquipmentUnitAmount 2.00 0.00

tblOffRoadEquipment OffRoadEquipmentUnitAmount 1.00 0.00

tblOffRoadEquipment OffRoadEquipmentUnitAmount 3.00 0.00

tblOffRoadEquipment OffRoadEquipmentUnitAmount 2.00 0.00

tblOffRoadEquipment OffRoadEquipmentUnitAmount 3.00 0.00

tblOffRoadEquipment OffRoadEquipmentUnitAmount 2.00 0.00

tblOffRoadEquipment OffRoadEquipmentUnitAmount 4.00 0.00

tblOffRoadEquipment OffRoadEquipmentUnitAmount 1.00 0.00

tblProjectCharacteristics CO2IntensityFactor 641.35 261

tblSolidWaste SolidWasteGenerationRate 1,380.00 0.00

tblTripsAndVMT VendorTripNumber 321.00 0.00

tblTripsAndVMT WorkerTripNumber 2,160.00 0.00

tblTripsAndVMT WorkerTripNumber 432.00 0.00

tblVehicleTrips ST_TR 4.98 0.00

tblVehicleTrips SU_TR 3.65 0.00

tblVehicleTrips WD_TR 4.20 0.00

tblWater ElectricityIntensityFactorForWastewaterTreatment

1,911.00 0.00

tblWater ElectricityIntensityFactorToDistribute 1,272.00 0.00

tblWater ElectricityIntensityFactorToSupply 2,117.00 0.00

tblWater ElectricityIntensityFactorToTreat 111.00 0.00

tblWater IndoorWaterUseRate 195,462,076.86 0.00

tblWater OutdoorWaterUseRate 123,226,091.94 0.00

tblWoodstoves NumberCatalytic 60.00 0.00

Exhaust PM10

PM10 Total

tblWoodstoves NumberNoncatalytic 60.00 0.00

2.0 Emissions Summary

2.1 Overall Construction

NBio- CO2 Total CO2

Unmitigated Construction

ROG NOx CO SO2 Fugitive PM10

CH4 N2O CO2e

Year tons/yr MT/yr

Fugitive PM2.5

Exhaust PM2.5

PM2.5 Total

Bio- CO2

2019 0.0000 0.0000 0.0000 0.0000 0.0000 0.0000

2022 0.0000 0.0000 0.0000 0.0000 0.0000 0.0000

Maximum 0.0000 0.0000 0.0000

SO2 Fugitive PM10

Exhaust PM10

0.0000 0.0000 0.0000

PM2.5 Total

Bio- CO2 NBio- CO2

Mitigated Construction

ROG NOx CO Total CO2 CH4 N2O CO2e

Year tons/yr MT/yr

PM10 Total

Fugitive PM2.5

Exhaust PM2.5

2019 0.0000 0.0000 0.0000 0.0000 0.0000 0.0000

2022 0.0000 0.0000 0.0000 0.0000 0.0000 0.0000

Maximum 0.0000 0.0000 0.0000 0.0000 0.0000 0.0000

ROG NOx CO SO2 Fugitive PM10

Exhaust PM10

PM10 Total

Fugitive PM2.5

Exhaust PM2.5

PM2.5 Total

Bio- CO2 NBio-CO2 Total CO2 CH4 N20 CO2e

Percent Reduction

0.00 0.00 0.00 0.00 0.00 0.00 0.00 0.00 0.00 0.00 0.00 0.00 0.00 0.00 0.00 0.00

Maximum Mitigated ROG + NOX (tons/quarter)

Highest

SO2 Fugitive PM10

Exhaust PM10

Quarter Start Date End Date Maximum Unmitigated ROG + NOX (tons/quarter)

PM2.5 Total

Bio- CO2 NBio- CO2

2.2 Overall OperationalUnmitigated Operational

ROG NOx CO Total CO2 CH4 N2O CO2e

Category tons/yr MT/yr

PM10 Total

Fugitive PM2.5

Exhaust PM2.5

Area 0.0000 130.0159 130.0159 0.0366 1.7200e-003

131.4434

Energy 0.0000 0.0000 0.0000 0.0000 0.0000 0.0000

Mobile 0.0000 0.0000 0.0000 0.0000 0.0000 0.0000

Waste 0.0000 0.0000 0.0000 0.0000 0.0000 0.0000

Water 0.0000 0.0000 0.0000 0.0000 0.0000 0.0000

Total 0.0366 1.7200e-003

131.4434

SO2 Fugitive PM10

Exhaust PM10

0.0000 130.0159 130.0159

PM2.5 Total

Bio- CO2 NBio- CO2

Mitigated Operational

ROG NOx CO Total CO2 CH4 N2O CO2e

Category tons/yr MT/yr

PM10 Total

Fugitive PM2.5

Exhaust PM2.5

Area 0.0000 130.0159 130.0159 0.0366 1.7200e-003

131.4434

Energy 0.0000 0.0000 0.0000 0.0000 0.0000 0.0000

Mobile 0.0000 0.0000 0.0000 0.0000 0.0000 0.0000

Waste 0.0000 0.0000 0.0000 0.0000 0.0000 0.0000

Water 0.0000 0.0000 0.0000 0.0000 0.0000 0.0000

Total 0.0000 130.0159 130.0159 0.0366 1.7200e-003

131.4434

ROG NOx CO SO2 Fugitive PM10

Exhaust PM10

PM10 Total

Fugitive PM2.5

Exhaust PM2.5

PM2.5 Total

Bio- CO2 NBio-CO2 Total CO2 CH4 N20 CO2e

Percent Reduction

0.00 0.00 0.00 0.00 0.00 0.00 0.00 0.00 0.00 0.00 0.00 0.00 0.00 0.00 0.00 0.00

3.0 Construction Detail

Construction Phase

Phase Number

Phase Name Phase Type Start Date End Date Num Days Week

Num Days Phase Description

1 Demolition Demolition 1/18/2019 1/17/2019 5 0

2 Site Preparation Site Preparation 3/29/2019 3/28/2019 5 0

3 Grading Grading 5/10/2019 5/9/2019 5 0

4 Building Construction Building Construction 8/23/2019 8/22/2019 5 0

5 Paving Paving 6/24/2022 6/23/2022 5 0

6 Architectural Coating Architectural Coating 9/9/2022 9/8/2022 5 0

Acres of Grading (Site Preparation Phase): 0

Acres of Grading (Grading Phase): 0

Acres of Paving: 0

Residential Indoor: 0; Residential Outdoor: 0; Non-Residential Indoor: 0; Non-Residential Outdoor: 0; Striped Parking Area: 0

OffRoad Equipment

Phase Name Offroad Equipment Type Amount Usage Hours Horse Power Load Factor

Demolition Concrete/Industrial Saws 0 8.00 81 0.73

Demolition Excavators 0 8.00 158 0.38

Demolition Rubber Tired Dozers 0 8.00 247 0.40

Site Preparation Rubber Tired Dozers 0 8.00 247 0.40

Site Preparation Tractors/Loaders/Backhoes 0 8.00 97 0.37

Grading Excavators 0 8.00 158 0.38

Grading Graders 0 8.00 187 0.41

Grading Rubber Tired Dozers 0 8.00 247 0.40

Grading Scrapers 0 8.00 367 0.48

Grading Tractors/Loaders/Backhoes 0 8.00 97 0.37

Building Construction Cranes 0 7.00 231 0.29

Building Construction Forklifts 0 8.00 89 0.20

Building Construction Generator Sets 0 8.00 84 0.74

Building Construction Tractors/Loaders/Backhoes 0 7.00 97 0.37

Building Construction Welders 0 8.00 46 0.45

Paving Pavers 0 8.00 130 0.42

Paving Paving Equipment 0 8.00 132 0.36

Paving Rollers 0 8.00 80 0.38

Architectural Coating Air Compressors 0 6.00 78 0.48

Hauling Vehicle Class

Trips and VMT

Phase Name Offroad Equipment Count

Worker Trip Number

Vendor Trip Number

Hauling Trip Number

10.80

Worker Trip Length

Vendor Trip Length

Hauling Trip Length

Worker Vehicle Class

Vendor Vehicle Class

Site Preparation 0 0.00 0.00 0.00

Demolition 0 0.00 0.00 0.00

HHDT

7.30 20.00 LD_Mix HDT_Mix HHDT

10.80

10.80 7.30 20.00 LD_Mix HDT_Mix

Building Construction 0 0.00 0.00 0.00

Grading 0 0.00 0.00 0.00

HHDT

7.30 20.00 LD_Mix HDT_Mix HHDT

10.80

10.80 7.30 20.00 LD_Mix HDT_Mix

Architectural Coating 0 0.00 0.00 0.00

Paving 0 0.00 0.00 0.00

20.00 LD_Mix HDT_Mix HHDT

7.30 20.00 LD_Mix HDT_Mix HHDT

10.80 7.30

3.1 Mitigation Measures Construction

3.2 Demolition - 2019Unmitigated Construction On-Site

NOx CO SO2 Fugitive PM10

Fugitive PM2.5

Exhaust PM2.5

PM2.5 Total

Bio- CO2ROG NBio- CO2 Total CO2 CH4 N2O CO2e

Category tons/yr MT/yr

Exhaust PM10

PM10 Total

Off-Road 0.0000 0.0000 0.0000 0.0000 0.0000 0.0000 0.0000 0.0000 0.0000 0.0000 0.0000 0.0000 0.0000 0.0000 0.0000 0.0000

Total 0.0000 0.0000 0.0000 0.0000 0.0000 0.0000 0.00000.0000 0.0000 0.0000 0.0000 0.0000 0.0000

SO2 Fugitive PM10

Exhaust PM10

0.0000 0.0000 0.0000

PM2.5 Total

Bio- CO2 NBio- CO2

Unmitigated Construction Off-Site

ROG NOx CO Total CO2 CH4 N2O CO2e

Category tons/yr MT/yr

PM10 Total

Fugitive PM2.5

Exhaust PM2.5

Hauling 0.0000 0.0000 0.0000 0.0000 0.0000 0.0000 0.0000 0.0000 0.0000 0.0000 0.0000 0.0000 0.0000 0.0000 0.0000 0.0000

Vendor 0.0000 0.0000 0.0000 0.0000 0.0000 0.0000 0.0000 0.0000 0.0000 0.0000 0.0000 0.0000 0.0000 0.0000 0.0000 0.0000

Worker 0.0000 0.0000 0.0000 0.0000 0.0000 0.0000 0.0000 0.0000 0.0000 0.0000 0.0000 0.0000 0.0000 0.0000 0.0000 0.0000

Total 0.0000 0.0000 0.0000 0.0000 0.0000 0.0000 0.00000.0000 0.0000 0.0000 0.0000 0.0000 0.0000

SO2 Fugitive PM10

Exhaust PM10

0.0000 0.0000 0.0000

PM2.5 Total

Bio- CO2 NBio- CO2

Mitigated Construction On-Site

ROG NOx CO Total CO2 CH4 N2O CO2e

Category tons/yr MT/yr

PM10 Total

Fugitive PM2.5

Exhaust PM2.5

Off-Road 0.0000 0.0000 0.0000 0.0000 0.0000 0.0000 0.0000 0.0000 0.0000 0.0000 0.0000 0.0000 0.0000 0.0000 0.0000 0.0000

Total 0.0000 0.0000 0.0000 0.0000 0.0000 0.0000 0.00000.0000 0.0000 0.0000 0.0000 0.0000 0.0000

SO2 Fugitive PM10

Exhaust PM10

0.0000 0.0000 0.0000

PM2.5 Total

Bio- CO2 NBio- CO2

Mitigated Construction Off-Site

ROG NOx CO Total CO2 CH4 N2O CO2e

Category tons/yr MT/yr

PM10 Total

Fugitive PM2.5

Exhaust PM2.5

Hauling 0.0000 0.0000 0.0000 0.0000 0.0000 0.0000 0.0000 0.0000 0.0000 0.0000 0.0000 0.0000 0.0000 0.0000 0.0000 0.0000

Vendor 0.0000 0.0000 0.0000 0.0000 0.0000 0.0000 0.0000 0.0000 0.0000 0.0000 0.0000 0.0000 0.0000 0.0000 0.0000 0.0000

Worker 0.0000 0.0000 0.0000 0.0000 0.0000 0.0000 0.0000 0.0000 0.0000 0.0000 0.0000 0.0000 0.0000 0.0000 0.0000 0.0000

Total 0.0000 0.0000 0.0000 0.0000 0.0000 0.0000 0.00000.0000 0.0000 0.0000 0.0000 0.0000 0.0000

SO2 Fugitive PM10

Exhaust PM10

0.0000 0.0000 0.0000

PM2.5 Total

Bio- CO2 NBio- CO2

3.3 Site Preparation - 2019Unmitigated Construction On-Site

ROG NOx CO Total CO2 CH4 N2O CO2e

Category tons/yr MT/yr

PM10 Total

Fugitive PM2.5

Exhaust PM2.5

Fugitive Dust 0.0000 0.0000 0.0000 0.0000 0.0000 0.0000 0.0000 0.0000 0.0000 0.0000 0.0000 0.0000 0.0000 0.0000 0.0000 0.0000

Off-Road 0.0000 0.0000 0.0000 0.0000 0.0000 0.0000 0.0000 0.0000 0.0000 0.0000 0.0000 0.0000 0.0000 0.0000 0.0000 0.0000

Total 0.0000 0.0000 0.0000 0.0000 0.0000 0.0000 0.00000.0000 0.0000 0.0000 0.0000 0.0000 0.0000 0.0000 0.0000 0.0000

SO2 Fugitive PM10

Exhaust PM10

PM2.5 Total

Bio- CO2 NBio- CO2

Unmitigated Construction Off-Site

ROG NOx CO Total CO2 CH4 N2O CO2e

Category tons/yr MT/yr

PM10 Total

Fugitive PM2.5

Exhaust PM2.5

Hauling 0.0000 0.0000 0.0000 0.0000 0.0000 0.0000 0.0000 0.0000 0.0000 0.0000 0.0000 0.0000 0.0000 0.0000 0.0000 0.0000

Vendor 0.0000 0.0000 0.0000 0.0000 0.0000 0.0000 0.0000 0.0000 0.0000 0.0000 0.0000 0.0000 0.0000 0.0000 0.0000 0.0000

Worker 0.0000 0.0000 0.0000 0.0000 0.0000 0.0000 0.0000 0.0000 0.0000 0.0000 0.0000 0.0000 0.0000 0.0000 0.0000 0.0000

Total 0.0000 0.0000 0.0000 0.0000 0.0000 0.0000 0.00000.0000 0.0000 0.0000 0.0000 0.0000 0.0000

SO2 Fugitive PM10

Exhaust PM10

0.0000 0.0000 0.0000

PM2.5 Total

Bio- CO2 NBio- CO2

Mitigated Construction On-Site

ROG NOx CO Total CO2 CH4 N2O CO2e

Category tons/yr MT/yr

PM10 Total

Fugitive PM2.5

Exhaust PM2.5

Fugitive Dust 0.0000 0.0000 0.0000 0.0000 0.0000 0.0000 0.0000 0.0000 0.0000 0.0000 0.0000 0.0000 0.0000 0.0000 0.0000 0.0000

Off-Road 0.0000 0.0000 0.0000 0.0000 0.0000 0.0000 0.0000 0.0000 0.0000 0.0000 0.0000 0.0000 0.0000 0.0000 0.0000 0.0000

Total 0.0000 0.0000 0.0000 0.0000 0.0000 0.0000 0.00000.0000 0.0000 0.0000 0.0000 0.0000 0.0000

SO2 Fugitive PM10

Exhaust PM10

0.0000 0.0000 0.0000

PM2.5 Total

Bio- CO2 NBio- CO2

Mitigated Construction Off-Site

ROG NOx CO Total CO2 CH4 N2O CO2ePM10 Total

Fugitive PM2.5

Exhaust PM2.5

Category tons/yr MT/yr

Hauling 0.0000 0.0000 0.0000 0.0000 0.0000 0.0000 0.0000 0.0000 0.0000 0.0000 0.0000 0.0000 0.0000 0.0000 0.0000 0.0000

Vendor 0.0000 0.0000 0.0000 0.0000 0.0000 0.0000 0.0000 0.0000 0.0000 0.0000 0.0000 0.0000 0.0000 0.0000 0.0000 0.0000

Worker 0.0000 0.0000 0.0000 0.0000 0.0000 0.0000 0.0000 0.0000 0.0000 0.0000 0.0000 0.0000 0.0000 0.0000 0.0000 0.0000

Total 0.0000 0.0000 0.0000 0.0000 0.0000 0.0000 0.00000.0000 0.0000 0.0000 0.0000 0.0000 0.0000

SO2 Fugitive PM10

Exhaust PM10

0.0000 0.0000 0.0000

PM2.5 Total

Bio- CO2 NBio- CO2

3.4 Grading - 2019Unmitigated Construction On-Site

ROG NOx CO Total CO2 CH4 N2O CO2e

Category tons/yr MT/yr

PM10 Total

Fugitive PM2.5

Exhaust PM2.5

Fugitive Dust 0.0000 0.0000 0.0000 0.0000 0.0000 0.0000 0.0000 0.0000 0.0000 0.0000 0.0000 0.0000 0.0000 0.0000 0.0000 0.0000

Off-Road 0.0000 0.0000 0.0000 0.0000 0.0000 0.0000 0.0000 0.0000 0.0000 0.0000 0.0000 0.0000 0.0000 0.0000 0.0000 0.0000

Total 0.0000 0.0000 0.0000 0.0000 0.0000 0.0000 0.00000.0000 0.0000 0.0000 0.0000 0.0000 0.0000

SO2 Fugitive PM10

Exhaust PM10

0.0000 0.0000 0.0000

PM2.5 Total

Bio- CO2 NBio- CO2

Unmitigated Construction Off-Site

ROG NOx CO Total CO2 CH4 N2O CO2e

Category tons/yr MT/yr

PM10 Total

Fugitive PM2.5

Exhaust PM2.5

Hauling 0.0000 0.0000 0.0000 0.0000 0.0000 0.0000 0.0000 0.0000 0.0000 0.0000 0.0000 0.0000 0.0000 0.0000 0.0000 0.0000

Vendor 0.0000 0.0000 0.0000 0.0000 0.0000 0.0000 0.0000 0.0000 0.0000 0.0000 0.0000 0.0000 0.0000 0.0000 0.0000 0.0000

Worker 0.0000 0.0000 0.0000 0.0000 0.0000 0.0000 0.0000 0.0000 0.0000 0.0000 0.0000 0.0000 0.0000 0.0000 0.0000 0.0000

Total 0.0000 0.0000 0.0000 0.0000 0.0000 0.0000 0.00000.0000 0.0000 0.0000 0.0000 0.0000 0.0000

SO2 Fugitive PM10

Exhaust PM10

0.0000 0.0000 0.0000

PM2.5 Total

Bio- CO2 NBio- CO2

Mitigated Construction On-Site

ROG NOx CO Total CO2 CH4 N2O CO2e

Category tons/yr MT/yr

PM10 Total

Fugitive PM2.5

Exhaust PM2.5

Fugitive Dust 0.0000 0.0000 0.0000 0.0000 0.0000 0.0000 0.0000 0.0000 0.0000 0.0000 0.0000 0.0000 0.0000 0.0000 0.0000 0.0000

Off-Road 0.0000 0.0000 0.0000 0.0000 0.0000 0.0000 0.0000 0.0000 0.0000 0.0000 0.0000 0.0000 0.0000 0.0000 0.0000 0.0000

Total 0.0000 0.0000 0.0000 0.0000 0.0000 0.0000 0.00000.0000 0.0000 0.0000 0.0000 0.0000 0.0000

SO2 Fugitive PM10

Exhaust PM10

0.0000 0.0000 0.0000

PM2.5 Total

Bio- CO2 NBio- CO2

Mitigated Construction Off-Site

ROG NOx CO Total CO2 CH4 N2O CO2e

Category tons/yr MT/yr

PM10 Total

Fugitive PM2.5

Exhaust PM2.5

Hauling 0.0000 0.0000 0.0000 0.0000 0.0000 0.0000 0.0000 0.0000 0.0000 0.0000 0.0000 0.0000 0.0000 0.0000 0.0000 0.0000

Vendor 0.0000 0.0000 0.0000 0.0000 0.0000 0.0000 0.0000 0.0000 0.0000 0.0000 0.0000 0.0000 0.0000 0.0000 0.0000 0.0000

Worker 0.0000 0.0000 0.0000 0.0000 0.0000 0.0000 0.0000 0.0000 0.0000 0.0000 0.0000 0.0000 0.0000 0.0000 0.0000 0.0000

Total 0.0000 0.0000 0.0000 0.0000 0.0000 0.0000 0.00000.0000 0.0000 0.0000 0.0000 0.0000 0.0000 0.0000 0.0000 0.0000

3.5 Building Construction - 2019Unmitigated Construction On-Site

SO2 Fugitive PM10

Exhaust PM10

PM2.5 Total

Bio- CO2 NBio- CO2ROG NOx CO Total CO2 CH4 N2O CO2e

Category tons/yr MT/yr

PM10 Total

Fugitive PM2.5

Exhaust PM2.5

Off-Road 0.0000 0.0000 0.0000 0.0000 0.0000 0.0000 0.0000 0.0000 0.0000 0.0000 0.0000 0.0000 0.0000 0.0000 0.0000 0.0000

Total 0.0000 0.0000 0.0000 0.0000 0.0000 0.0000 0.00000.0000 0.0000 0.0000 0.0000 0.0000 0.0000

SO2 Fugitive PM10

Exhaust PM10

0.0000 0.0000 0.0000

PM2.5 Total

Bio- CO2 NBio- CO2

Unmitigated Construction Off-Site

ROG NOx CO Total CO2 CH4 N2O CO2e

Category tons/yr MT/yr

PM10 Total

Fugitive PM2.5

Exhaust PM2.5

Hauling 0.0000 0.0000 0.0000 0.0000 0.0000 0.0000 0.0000 0.0000 0.0000 0.0000 0.0000 0.0000 0.0000 0.0000 0.0000 0.0000

Vendor 0.0000 0.0000 0.0000 0.0000 0.0000 0.0000 0.0000 0.0000 0.0000 0.0000 0.0000 0.0000 0.0000 0.0000 0.0000 0.0000

Worker 0.0000 0.0000 0.0000 0.0000 0.0000 0.0000 0.0000 0.0000 0.0000 0.0000 0.0000 0.0000 0.0000 0.0000 0.0000 0.0000

Total 0.0000 0.0000 0.0000 0.0000 0.0000 0.0000 0.00000.0000 0.0000 0.0000 0.0000 0.0000 0.0000

SO2 Fugitive PM10

Exhaust PM10

0.0000 0.0000 0.0000

PM2.5 Total

Bio- CO2 NBio- CO2

Mitigated Construction On-Site

ROG NOx CO Total CO2 CH4 N2O CO2e

Category tons/yr MT/yr

PM10 Total

Fugitive PM2.5

Exhaust PM2.5

Off-Road 0.0000 0.0000 0.0000 0.0000 0.0000 0.0000 0.0000 0.0000 0.0000 0.0000 0.0000 0.0000 0.0000 0.0000 0.0000 0.0000

Total 0.0000 0.0000 0.0000 0.0000 0.0000 0.0000 0.00000.0000 0.0000 0.0000 0.0000 0.0000 0.0000

SO2 Fugitive PM10

Exhaust PM10

0.0000 0.0000 0.0000

PM2.5 Total

Bio- CO2 NBio- CO2

Mitigated Construction Off-Site

ROG NOx CO Total CO2 CH4 N2O CO2e

Category tons/yr MT/yr

PM10 Total

Fugitive PM2.5

Exhaust PM2.5

Hauling 0.0000 0.0000 0.0000 0.0000 0.0000 0.0000 0.0000 0.0000 0.0000 0.0000 0.0000 0.0000 0.0000 0.0000 0.0000 0.0000

Vendor 0.0000 0.0000 0.0000 0.0000 0.0000 0.0000 0.0000 0.0000 0.0000 0.0000 0.0000 0.0000 0.0000 0.0000 0.0000 0.0000

Worker 0.0000 0.0000 0.0000 0.0000 0.0000 0.0000 0.0000 0.0000 0.0000 0.0000 0.0000 0.0000 0.0000 0.0000 0.0000 0.0000

Total 0.0000 0.0000 0.0000 0.0000 0.0000 0.0000 0.00000.0000 0.0000 0.0000 0.0000 0.0000 0.0000

SO2 Fugitive PM10

Exhaust PM10

0.0000 0.0000 0.0000

PM2.5 Total

Bio- CO2 NBio- CO2

3.6 Paving - 2022Unmitigated Construction On-Site

ROG NOx CO Total CO2 CH4 N2O CO2e

Category tons/yr MT/yr

PM10 Total

Fugitive PM2.5

Exhaust PM2.5

Off-Road 0.0000 0.0000 0.0000 0.0000 0.0000 0.0000 0.0000 0.0000 0.0000 0.0000 0.0000 0.0000 0.0000 0.0000 0.0000 0.0000

Paving 0.0000 0.0000 0.0000 0.0000 0.0000 0.0000 0.0000 0.0000 0.0000 0.0000 0.0000 0.0000 0.0000 0.0000 0.0000 0.0000

Total 0.0000 0.0000 0.0000 0.0000 0.0000 0.0000 0.00000.0000 0.0000 0.0000 0.0000 0.0000 0.0000 0.0000 0.0000 0.0000

SO2 Fugitive PM10

Exhaust PM10

PM2.5 Total

Bio- CO2 NBio- CO2

Unmitigated Construction Off-Site

ROG NOx CO Total CO2 CH4 N2O CO2e

Category tons/yr MT/yr

PM10 Total

Fugitive PM2.5

Exhaust PM2.5

Hauling 0.0000 0.0000 0.0000 0.0000 0.0000 0.0000 0.0000 0.0000 0.0000 0.0000 0.0000 0.0000 0.0000 0.0000 0.0000 0.0000

Vendor 0.0000 0.0000 0.0000 0.0000 0.0000 0.0000 0.0000 0.0000 0.0000 0.0000 0.0000 0.0000 0.0000 0.0000 0.0000 0.0000

Worker 0.0000 0.0000 0.0000 0.0000 0.0000 0.0000 0.0000 0.0000 0.0000 0.0000 0.0000 0.0000 0.0000 0.0000 0.0000 0.0000

Total 0.0000 0.0000 0.0000 0.0000 0.0000 0.0000 0.00000.0000 0.0000 0.0000 0.0000 0.0000 0.0000

SO2 Fugitive PM10

Exhaust PM10

0.0000 0.0000 0.0000

PM2.5 Total

Bio- CO2 NBio- CO2

Mitigated Construction On-Site

ROG NOx CO Total CO2 CH4 N2O CO2e

Category tons/yr MT/yr

PM10 Total

Fugitive PM2.5

Exhaust PM2.5

Off-Road 0.0000 0.0000 0.0000 0.0000 0.0000 0.0000 0.0000 0.0000 0.0000 0.0000 0.0000 0.0000 0.0000 0.0000 0.0000 0.0000

Paving 0.0000 0.0000 0.0000 0.0000 0.0000 0.0000 0.0000 0.0000 0.0000 0.0000 0.0000 0.0000 0.0000 0.0000 0.0000 0.0000

Total 0.0000 0.0000 0.0000 0.0000 0.0000 0.0000 0.00000.0000 0.0000 0.0000 0.0000 0.0000 0.0000

SO2 Fugitive PM10

Exhaust PM10

0.0000 0.0000 0.0000

PM2.5 Total

Bio- CO2 NBio- CO2

Mitigated Construction Off-Site

ROG NOx CO Total CO2 CH4 N2O CO2ePM10 Total

Fugitive PM2.5

Exhaust PM2.5

Category tons/yr MT/yr

Hauling 0.0000 0.0000 0.0000 0.0000 0.0000 0.0000 0.0000 0.0000 0.0000 0.0000 0.0000 0.0000 0.0000 0.0000 0.0000 0.0000

Vendor 0.0000 0.0000 0.0000 0.0000 0.0000 0.0000 0.0000 0.0000 0.0000 0.0000 0.0000 0.0000 0.0000 0.0000 0.0000 0.0000

Worker 0.0000 0.0000 0.0000 0.0000 0.0000 0.0000 0.0000 0.0000 0.0000 0.0000 0.0000 0.0000 0.0000 0.0000 0.0000 0.0000

Total 0.0000 0.0000 0.0000 0.0000 0.0000 0.0000 0.00000.0000 0.0000 0.0000 0.0000 0.0000 0.0000

SO2 Fugitive PM10

Exhaust PM10

0.0000 0.0000 0.0000

PM2.5 Total

Bio- CO2 NBio- CO2

3.7 Architectural Coating - 2022Unmitigated Construction On-Site

ROG NOx CO Total CO2 CH4 N2O CO2e

Category tons/yr MT/yr

PM10 Total

Fugitive PM2.5

Exhaust PM2.5

Archit. Coating 0.0000 0.0000 0.0000 0.0000 0.0000 0.0000 0.0000 0.0000 0.0000 0.0000 0.0000 0.0000 0.0000 0.0000 0.0000 0.0000

Off-Road 0.0000 0.0000 0.0000 0.0000 0.0000 0.0000 0.0000 0.0000 0.0000 0.0000 0.0000 0.0000 0.0000 0.0000 0.0000 0.0000

Total 0.0000 0.0000 0.0000 0.0000 0.0000 0.0000 0.00000.0000 0.0000 0.0000 0.0000 0.0000 0.0000

SO2 Fugitive PM10

Exhaust PM10

0.0000 0.0000 0.0000

PM2.5 Total

Bio- CO2 NBio- CO2

Unmitigated Construction Off-Site

ROG NOx CO Total CO2 CH4 N2O CO2e

Category tons/yr MT/yr

PM10 Total

Fugitive PM2.5

Exhaust PM2.5

Hauling 0.0000 0.0000 0.0000 0.0000 0.0000 0.0000 0.0000 0.0000 0.0000 0.0000 0.0000 0.0000 0.0000 0.0000 0.0000 0.0000

Vendor 0.0000 0.0000 0.0000 0.0000 0.0000 0.0000 0.0000 0.0000 0.0000 0.0000 0.0000 0.0000 0.0000 0.0000 0.0000 0.0000

Worker 0.0000 0.0000 0.0000 0.0000 0.0000 0.0000 0.0000 0.0000 0.0000 0.0000 0.0000 0.0000 0.0000 0.0000 0.0000 0.0000

Total 0.0000 0.0000 0.0000 0.0000 0.0000 0.0000 0.00000.0000 0.0000 0.0000 0.0000 0.0000 0.0000

SO2 Fugitive PM10

Exhaust PM10

0.0000 0.0000 0.0000

PM2.5 Total

Bio- CO2 NBio- CO2

Mitigated Construction On-Site

ROG NOx CO Total CO2 CH4 N2O CO2e

Category tons/yr MT/yr

PM10 Total

Fugitive PM2.5

Exhaust PM2.5

Archit. Coating 0.0000 0.0000 0.0000 0.0000 0.0000 0.0000 0.0000 0.0000 0.0000 0.0000 0.0000 0.0000 0.0000 0.0000 0.0000 0.0000

Off-Road 0.0000 0.0000 0.0000 0.0000 0.0000 0.0000 0.0000 0.0000 0.0000 0.0000 0.0000 0.0000 0.0000 0.0000 0.0000 0.0000

Total 0.0000 0.0000 0.0000 0.0000 0.0000 0.0000 0.00000.0000 0.0000 0.0000 0.0000 0.0000 0.0000

SO2 Fugitive PM10

Exhaust PM10

0.0000 0.0000 0.0000

PM2.5 Total

Bio- CO2 NBio- CO2

Mitigated Construction Off-Site

ROG NOx CO Total CO2 CH4 N2O CO2e

Category tons/yr MT/yr

PM10 Total

Fugitive PM2.5

Exhaust PM2.5

Hauling 0.0000 0.0000 0.0000 0.0000 0.0000 0.0000 0.0000 0.0000 0.0000 0.0000 0.0000 0.0000 0.0000 0.0000 0.0000 0.0000

Vendor 0.0000 0.0000 0.0000 0.0000 0.0000 0.0000 0.0000 0.0000 0.0000 0.0000 0.0000 0.0000 0.0000 0.0000 0.0000 0.0000

Worker 0.0000 0.0000 0.0000 0.0000 0.0000 0.0000 0.0000 0.0000 0.0000 0.0000 0.0000 0.0000 0.0000 0.0000 0.0000 0.0000

Total 0.0000 0.0000 0.0000 0.0000 0.0000 0.0000 0.00000.0000 0.0000 0.0000 0.0000 0.0000 0.0000 0.0000 0.0000 0.0000

4.0 Operational Detail - Mobile

4.1 Mitigation Measures Mobile

CO SO2 Fugitive PM10

Fugitive PM2.5

Exhaust PM2.5

PM2.5 Total

Bio- CO2ROG NOx NBio- CO2 Total CO2 CH4 N2O CO2e

Category tons/yr MT/yr

Exhaust PM10

PM10 Total

Mitigated 0.0000 0.0000 0.0000 0.0000 0.0000 0.0000

Unmitigated 0.0000 0.0000 0.0000 0.0000 0.0000 0.0000

4.2 Trip Summary Information

Average Daily Trip Rate Unmitigated MitigatedLand Use Weekday Saturday Sunday Annual VMT Annual VMT

Apartments High Rise 0.00 0.00 0.00Total 0.00 0.00 0.00

4.3 Trip Type Information

Miles Trip % Trip Purpose %

Land Use H-W or C-W H-S or C-C H-O or C-NW H-W or C-W

H-S or C-C H-O or C-NW Primary Diverted Pass-by

Apartments High Rise 10.80 4.80 5.70 31.00 15.00 54.00 86 11 3

4.4 Fleet MixHHD OBUS UBUS MCYLand Use LDA LDT1 LDT2 MDV LHD1

0.104144 0.013417 0.005103 0.025765

LHD2 MHD

0.001991 0.005378 0.000368 0.000663

SBUS MH

0.048748 0.002254Apartments High Rise 0.565129 0.036801 0.190239

5.0 Energy Detail

Historical Energy Use: N

5.1 Mitigation Measures Energy

NOx CO SO2 Fugitive PM10

Fugitive PM2.5

Exhaust PM2.5

PM2.5 Total

Bio- CO2ROG NBio- CO2 Total CO2 CH4 N2O CO2e

Category tons/yr MT/yr

Exhaust PM10

PM10 Total

Electricity Mitigated

0.0000 0.0000 0.0000 0.0000 0.0000 0.0000

Electricity Unmitigated

0.0000 0.0000 0.0000 0.0000 0.0000 0.0000

NaturalGas Mitigated

0.0000 0.0000 0.0000 0.0000 0.0000 0.0000

NaturalGas Unmitigated

0.0000 0.0000 0.0000 0.0000 0.0000

ROG NOx CO SO2 Fugitive PM10

0.0000

PM10 Total

Fugitive PM2.5

Exhaust PM2.5

PM2.5 Total

Bio- CO2

5.2 Energy by Land Use - NaturalGasUnmitigated

NaturalGas Use

NBio- CO2 Total CO2 CH4 N2O CO2e

Land Use kBTU/yr tons/yr MT/yr

Exhaust PM10

Apartments High Rise

0 0.0000 0.00000.0000 0.0000 0.0000

0.0000 0.0000

0.0000

Total 0.0000 0.0000 0.0000 0.0000

Mitigated

NaturalGas Use

ROG NOx CO SO2 Fugitive PM10

Exhaust PM10

PM10 Total

Fugitive PM2.5

Exhaust PM2.5

PM2.5 Total

Bio- CO2 NBio- CO2 Total CO2 CH4 N2O CO2e

Land Use kBTU/yr tons/yr MT/yr

Apartments High Rise

0 0.0000 0.00000.0000 0.0000

0.0000

0.0000 0.0000

Total 0.0000 0.0000 0.0000 0.0000 0.0000

5.3 Energy by Land Use - ElectricityUnmitigated

Electricity Use

Total CO2 CH4 N2O CO2e

Land Use kWh/yr ton

MT/yr

Apartments High Rise

0 0.0000 0.0000 0.0000 0.0000

Total 0.0000 0.0000 0.0000 0.0000

0.0000

Mitigated

Electricity Use

Total CO2 CH4 N2O CO2e

0.0000

Land Use kWh/yr ton

MT/yr

Apartments High Rise

0 0.0000 0.0000 0.0000

Total 0.0000 0.0000 0.0000

CO SO2 Fugitive PM10

Fugitive PM2.5

Exhaust PM2.5

PM2.5 Total

Bio- CO2

6.0 Area Detail

6.1 Mitigation Measures Area

ROG NOx NBio- CO2 Total CO2 CH4 N2O CO2e

Category tons/yr MT/yr

Exhaust PM10

PM10 Total

Mitigated 0.0000 130.0159 130.0159 0.0366 1.7200e-003

131.4434

Unmitigated 0.0366 1.7200e-003

131.4434

SO2 Fugitive PM10

Exhaust PM10

0.0000 130.0159 130.0159

PM2.5 Total

Bio- CO2 NBio- CO2

6.2 Area by SubCategoryUnmitigated

ROG NOx CO Total CO2 CH4 N2O CO2e

SubCategory tons/yr MT/yr

PM10 Total

Fugitive PM2.5

Exhaust PM2.5

Architectural Coating

0.0000 0.0000 0.0000 0.0000 0.0000 0.0000

Consumer Products

0.0000 0.0000 0.0000 0.0000 0.0000 0.0000

Hearth 0.0000 93.6295 93.6295 1.7900e-003

1.7200e-003

94.1859

Landscaping 0.0000 36.3864 36.3864 0.0348 0.0000 37.2575

Total 0.0366 1.7200e-003

131.4434

SO2 Fugitive PM10

Exhaust PM10

0.0000 130.0159 130.0159

PM2.5 Total

Bio- CO2 NBio- CO2

Mitigated

ROG NOx CO Total CO2 CH4 N2O CO2e

SubCategory tons/yr MT/yr

PM10 Total

Fugitive PM2.5

Exhaust PM2.5

Architectural Coating

0.0000 0.0000 0.0000 0.0000 0.0000 0.0000

Consumer Products

0.0000 0.0000 0.0000 0.0000 0.0000 0.0000

Hearth 0.0000 93.6295 93.6295 1.7900e-003

1.7200e-003

94.1859

Landscaping 0.0000 36.3864 36.3864 0.0348 0.0000 37.2575

Total 0.0000 130.0159 130.0159 0.0366 1.7200e-003

131.4434

7.0 Water Detail

7.1 Mitigation Measures Water

Total CO2 CH4 N2O CO2e

Category ton

MT/yr

Mitigated 0.0000 0.0000 0.0000 0.0000

Unmitigated 0.0000 0.0000 0.0000 0.0000

7.2 Water by Land UseUnmitigated

Indoor/Outdoor Use

Total CO2 CH4 N2O CO2e

Land Use Mgal ton

MT/yr

Apartments High Rise

0 / 0 0.0000 0.0000 0.0000 0.0000

Total 0.0000 0.0000 0.0000 0.0000

Mitigated

Indoor/Outdoor Use

Total CO2 CH4 N2O CO2e

Land Use Mgal ton

MT/yr

Apartments High Rise

0 / 0 0.0000 0.0000 0.0000 0.0000

Total 0.0000 0.0000 0.0000 0.0000

8.0 Waste Detail

8.1 Mitigation Measures Waste

Category/Year

Total CO2 CH4 N2O CO2e

ton

MT/yr

Mitigated 0.0000 0.0000 0.0000 0.0000

Unmitigated 0.0000 0.0000 0.0000 0.0000

8.2 Waste by Land UseUnmitigated

Waste Disposed

Total CO2 CH4 N2O CO2e

Land Use tons ton

MT/yr

Apartments High Rise

0 0.0000 0.0000 0.0000 0.0000

Total 0.0000 0.0000 0.0000 0.0000

Mitigated

Waste Disposed

Total CO2 CH4 N2O CO2e

Land Use tons ton

MT/yr

Apartments High Rise

0 0.0000 0.0000 0.0000 0.0000

Total 0.0000 0.0000 0.0000 0.0000

Horse Power Load Factor

9.0 Operational Offroad

Equipment Type Number Hours/Day Days/Year Horse Power

Boiler Rating Fuel Type

Load Factor Fuel Type

10.0 Stationary Equipment

Fire Pumps and Emergency Generators

Equipment Type Number Hours/Day Hours/Year

User Defined Equipment

Equipment Type Number

11.0 Vegetation

Fuel Type

Boilers

Equipment Type Number Heat Input/Day Heat Input/Year

APPENDIX 3 FEHR AND PEERS VMT TABLES

EXISTING TRAVEL CHARACTERISTICS AT THE COLISEUM AND ORACLE ARENA

Event Type

Travel Mode Attendees 1 2

Total Vehicle Trips

Average Trip Length

(mi)

Vehicle-Miles Traveled Drive TNC

Other Modes

Baseball Games

Weekday Evening 70% 7% 23% 35,000 24,800 13.3 329,500

Weekday Day 71% 7% 22% 35,000 25,600 13.8 353,600

Weekend 74% 7% 19% 35,000 26,200 14.2 372,300

NFL Games 69% 7% 24% 54,664 26,600 16.6 393,000

Monster Jam 77% 8% 15% 47,500 26,300 18.5 439,000

Moto-Cross 3 77% 8% 15% 47,500 26,300 18.5 439,000

Note: 1. Ballpark attendance equivalent to maximum attendance at Howard Terminal. NFL, Monster Jam, and Moto-Cross

attendance based on average attendance for 2017. 2. Baseball has 1,500 event staff, NFL has 1,500 event staff, and Monster Jam and Moto-Cross each have 1,000 event staff. 3. Moto-Cross travel characteristics based on Monster Jam travel characteristics because moto-cross travel characteristics

were not available. Source: Fehr & Peers, 2019

HOWARD TERMINAL BALLPARK TRAVEL CHARACTERISTICS – PROJECT 1.0

Event Type Travel Mode

Maximum Event Characteristics per Event

Attendees Total Vehicle

Trips Average Trip Length (mi)

Vehicle-Miles Traveled Drive TNC Other

Baseball Games 1

Weekday Evening 57% 18% 25% 35,000 27,400 13.3 299,000

Weekday Day 56% 19% 25% 35,000 27,800 13.3 300,000

Weekend 62% 18% 20% 35,000 28,600 14.1 336,000

Large Concerts 2 57% 20% 23% 28,000 22,800 11.4 213,000

Other Events 3, 4 57% 20% 23% 7,500 6,100 11.4 69,600 Corporate / Community Events 3, 4

57% 20% 23% 2,000 1,600 11.4 18,500

Plaza Events 3, 4 57% 20% 23% 4,000 3,300 11.4 37,100

Note: 1. There are 81 regular season baseball games each with 1,320 event staff. 2. There are 3 to 15 concerts per year with annual average of 9 concerts each with 1,200 staff. 3. There are 35 other events per year (480 staff), 100 corporate / community events per year (25 staff), and 16 plaza events

(25 staff) per year. 4. Large concert travel characteristics used for the smaller events proposed for the ballpark.

Source: Fehr & Peers, 2019

HOWARD TERMINAL BALLPARK TRAVEL CHARACTERISTICS – PROJECT 2.0

Event Type Travel Mode

Maximum Event Characteristics per Event

Attendees Total Vehicle

Trips Average Trip Length (mi)

Vehicle-Miles Traveled Drive TNC Other

Baseball Games 1

Weekday Evening 50% 13% 37% 35,000 22,200 13.7 257,000

Weekday Day 39% 15% 46% 35,000 20,800 13.7 227,000

Weekend 50% 14% 36% 35,000 22,900 14.5 278,000

Large Concerts 2 62% 10% 28% 28,000 19,600 11.8 205,000

Other Events 3, 4 62% 10% 28% 7,500 5,300 11.8 62,000

Corporate / Community Events 3, 4

62% 10% 28% 2,000 1,400 11.8 16,500

Plaza Events 3, 4 62% 10% 28% 4,000 2,800 11.8 33,000

Note: 1. There are 81 regular season baseball games each with 1,320 event staff. 2. There are 3 to 15 concerts per year with annual average of 9 concerts each with 1,200 staff. 3. There are 35 other events per year (480 staff), 100 corporate / community events per year (25 staff), and 16 plaza events

(25 staff) per year. 4. Large concert travel characteristics used for the smaller events proposed for the ballpark.

Source: Fehr & Peers, 2019

DAILY TRIPS AND VMT FOR HOWARD TERMINAL ANCILLARY DEVELOPMENT

Land Use Weekday Weekend

Project 1.0 Project 2.0 Project 1.0 Project 2.0

Trips VMT Trips VMT Trips VMT Trips VMT

Residential 8,900 106,800 6,300 75,600 8,000 96,000 5,700 68,400

Office 10,900 130,800 7,800 93,600 1,600 19,200 1,100 13,200

Retail 6,600 79,200 5,500 66,000 6,800 81,600 5,600 67,200

Restaurant 7,500 90,000 6,200 74,400 8,500 102,000 7,000 84,000

Hotel 3,000 36,000 3,000 36,000 2,300 27,600 2,300 27,600

Performance Venue 3,000 36,000 3,000 36,000 3,000 36,000 3,000 36,000

Total With Venue 39,900 478,800 31,800 381,600 30,200 362,400 24,700 296,400

Total Without Venue 36,900 442,800 28,800 345,600 27,200 326,400 21,700 260,400

Source: Fehr & Peers, 2019.

VTR AND VMT IMPACT OF ADDITIONAL TMP MEASURES AT HOWARD TERMINAL BALLPARK

Baseball and Large Events Only

Event Type Gondola 1 Party Ferry Extend Buses Shuttles

VTR VMT VTR VMT VTR VMT VTR VMT

Baseball Games

Weekday Evening 5% -10,500 <1% -500 1% -1,800 2% -4,100

Weekday Day 7% -14,600 <1% -700 1% -2,000 3% -5,500

Weekend 5% -11,400 <1% -500 1% -1,500 2% -4,200

Large Concerts 2 4% -6,000 <1% -300 1% -900 1% -2,100

Ancillary Development

Weekday 10% -38,300

Saturday 10% -34,200

Sunday 10% -25,100 Note:

1. Gondola available year-round. 2. Scale the large concert travel characteristics to establish VMT reductions for the other events, corporate / community events, and plaza events. VTR is vehicle trip reduction and represents additional trip reduction when measure is added to current Project 2.0. VMT is vehicle-miles traveled and represents change in total VMT when measure is added to current Project 2.0.

Source: Fehr & Peers, 2019

APPENDIX 4 ADDITIONAL SUPPORTING INFORMATION

2017 ATHLETICS ELECTRICITY USE

Date

3/31/2017 Day Prior to Game

Total Usage for Oaklan<;i A's:

Total Usage Per PG&E Bill:

A's Share%:

Summary:

Total Electric Charges per PG&E Statement

Oakland A's % Share

TOTAL DUE:

For March 2017

USAGE

Game

$

$

KwHUsage

23,442.40

23,442.40

617,688.28

3.80%

-3.80%

-

~-~,v-.~;~~: ~~~.~A\N~J~·~Jl=l§§~ffi~I~I@filcy§9J~.TJ£aNt'f'i~~.~~~.~tl:zf':t.§.s✓<0J

Date

3/31/2017

4/1/2017

4/2/2017

4/3/2017

4/4/2017

4/5/2017

4/6/2017

4/13/2017

4/14/2017

4/15/2017

4/16/2017

4/17/2017

4/18/2017

4/19/2017

4/20/2017

4/21/2017

4/22/2017

4/23/2017

Account No.

For April 2017

USAGE

Game

Day Prior to Game

vs. SF Giants (Exhibition Game)

Day Prior to Game

vs. Los Angeles Angels

vs. Los Angeles Angels

vs. Los Angeles Angels

vs. Los Angeles Angels

Day Prior to Game

vs. Houston Astros

vs. Houston Astros

vs. Houston Astros (Postponed)

vs. Texas Rangers

vs. Texas Rangers

vs. Texas Rangers

vs. Seattle Mariners

vs. Seattle Mariners

vs. Seattle Mariners

vs. Seattle Mariners

Total Usage for Oakland A's:

Total Usage Per PG&E Bill:

A's Share%:

Summary:

Total Electric Charges per PG&E Statement

Oakland A's % Share

TOTAL DUE:

$

$

KwHUsage

31,821.48

24,614.64

40,612.68

38,942.64

38,773.44

34,111.08

20,566.44

34,266.60

31,209.12

35,497.08

37,465.20

30,493.08

37,788.12

38,496.24

31,263.84

31,058.28

536,979.96

826,998.15

64.93%

64.93%

Date

5/4/2017

5/5/2017

5/6/2017

5/7/2017

5/8/2017

5/9/2017

5/10/2017

5/17/2017

5/18/2017

5/19/2017.

5/20/2017

5/21/2017

5/22/2017

5/23/2017

5/24/2017

Account No.

For May 2017

USAGE

Game

Day Prior to Game

vs. Detroit Tigers

vs. Detroit Tigers

vs. Detroit Tigers

vs. Los Angeles Angels

vs. Los Angeles Angels

vs. Los Angeles Angels

Day Prior to Game

vs. Boston Red Sox

vs. Boston Red Sox

vs. Boston Red Sox

vs. Boston Red Sox

Day Prior to Game

vs. Florida Marlins

vs. Florida Marlins

Total Usage for Oakland A's:

Total Usage Per PG&E: Bill:

A's Share%:

Summary:

Total Electric Charges per PG&E Statement

Oakland A's % Share

TOTAL DUE:

$

$

KwHUsage

22,542.84

33,714.00

39,383.28

31,113.36

36,086.76

37,181.88

30,207.96

23,016.96

33,997.68

40,485.24

34,389.36

33,354.72

23,395.32

35,041.32

30,642.84

484,553.52

809,527.35

59.86%

59.86%

OAKLAND A's ELECTRIC CONSUMPTION WORKSHEET _J

Account No. For June 2017

USAGE

Date Game 6/1/2017 Day Prior to Game 6/2/2017 A's vs. Washington Nationals 6/3/2017 A's vs. Washington Nationals 6/4/2017 A's vs.Washington Nationals 6/5/2017 . A's vs. Toronto Blue Jays 6/6/2017 A's vs. Toronto Blue Jays 6/7/2017 A's vs. Toronto Blue Jays

6/14/2017 Day Prior to Game 6/15/2017 A's vs. New York Yankees 6/16/2017 A's vs. New York Yankees 6/17/2017 A's vs. New York Yankees 6/18/2017 A's vs. New York Yankees 6/19/2017 A's vs. Houston Astros 6/20/2017 A's vs. Houston Astros 6/21/2017 A's vs. Houston Astros 6/22/2017 A's vs. Houston Astros 6/29/2017 Day Prior to Game 6/30/2017 A's vs. Atlanta Braves

Total Usage for Oakland A's: Total Usage Per PG&E Bill: A's Share%:

Summary: Total Electric Charges per PG&E Statement Oakland A's % Share TOTAL DUE:

- -·--·-·······- --------··---

· KwHUsage 21,030.12 35,668.44 33,158.88 32,146.20 36,621.36 37,680.84 30,467.88 21,502.08 37,593.00 44,088:48 36,420:48 37,314.72 38,732.76 39,488:40 38,119.68 34,433.28 20,845.80 34,816.32

610,128.72 866,205.39

70.44%

$ 70.44%

$==1=7,

OAKLAND A's ELECTRIC CONSUMPTION WORKSHEET

Date 7/1/2017 7/2/2017 7/3/2017 7/4/2017 7/5/2017

7/13/2017 7/14/2017 7/15/2017

. 7/16/2017 7/17/2017 7/18/2017 7/19/2017 7/27/2017 7/28/2017 7/29/2017 7/30/2017 7/31/2017

Account No. For July 2017

USAGE

Game A's vs.Atlanta Braves

A's vs.Atlanta Braves

A's vs.Chicago White Sox

. A's vs.Chicago White Sox.

A's vs.Chicago White Sox

Day Prior to Game A's vs. Cleveland Indians

A's vs. Cleveland Indians

A's vs. Cleveland Indians

A's vs. Tarnpa Bay Rays

A's vs. Tarnpa Bay Rays

A's vs. Tarnpa Bay Rays

Day Prior to Game A's vs. Mmnesotta Twins

A's vs. Mmnesotta Twins·

A's vs. Mmnesotta Twins

A's vs. San Francisco Giants

Total Usage for Oakland A's: Total Usage Per PG&E Bill: . A's Share%:

Summary: Total Electric Charges per PG&E Statement 7/1/2017 - 7/31/2017 Oakland A's % Share TOTAL DUE:

$

KwHUsage 31,892.76 31,550.76 41,329.08 30,841.20 30,194.28 27,595.80 36,952.20 41,954.76 37,063.08 38,046.60 38,290.68 32,329.08 21,382.92 35,894.88 42,212.88 32,258.88 42,394.32

592,184.16 889,235.68

66.59%

66.59%

$==1=6=

USAGE

Date Game 7/31/2017 Day Prior to Game 8/1/2017 A's vs.San Francisco Giants 8/7/2017 Day Prior to Game 8/8/2017 A's vs.Seattle Mariners

. 8/9/2017 A's vs.Seattle Mariners 8/10/2017 A's vs.Baltimore Orioles

· 8/11/2017 A's vs.Baltimore Orioles 8/12/2017 A's vs.Baltimore Orioles 8/13/2017 A's vs.Baltimore Orioles 8/14/2017 A's vs. Kansas City Royals 8/15/2017 A's vs. Kansas City Royals 8/16/2017 A's vs. Kansas City Royals 8/24/2017 Day Prior·to Game 8/25/2017 A's vs. Texas Rangers 8/26/2017 A's vs. Texas Rangers 8/27/2017 A's vs. Texas Rangers

Total Usage for Oakland A's: Total Usage Per PG&E Bill: A's Share%:

Summary: Total Electric Charges per PG&E Statement 8/1/2017 • 8/31/2017 Oakland A's % Share TOTAL DUE:

KwHUsage 42,394.32 4.2,698.88 22,664.88 34,152.84 30,789.72 36,851.40 39,000.60 41,004.36 32,071.32 36,443.88 38,606.76 .32,366.88 21,223.44 33,735.60 34,088.40 36,928.80

555,022.08 974,863.00

56.93%

$ 56.93%

$ ·•·. ·•· .. · .·

•j'

------------·- •-· -··-- - ·-·----------~·----··-·---·-----··---- --~~- ----·--·· ------~-·~-

OAKLAND A's ELECTRIC CONSUMPTION WORKSHEET

Date 9/3/2017 9/4/2017 9/5/2017 9/6/2017 9/7/2017 9/8/2017 9/9/2017

9/10/2017 9/21/2017 9/22/2017 9/23/2017 9/24/2017 9/25/2017 9/26/2017 9/27/2017

Account No. For September 2017

Game Day Prior to Game A's vs. LA Angels A's vs. LA Angels A's vs. LA Angels Day Prior to Game A's vs. Houston Astros A's vs. Houston Astros A's vs. Houston Astros Day Prior to Game A's vs. Texas Rangers A's vs. Texas Rangers A's vs. Texas Rangers A's vs. Seattle Mariners A's vs. Seattle Mariners A's vs. Seattle Mariners

USAGE

Total Usage for Oakland A's: Total Usage Per PG&E Bill: A's Share%:

Summary: Total Electric Charges per PG&E Statement 8/1/2017 - 8/31/2017 Oakland A's % Share TOTAL DUE:

$

$

KwHUsage 23,020.92 31,701.60 43,027.20 40,827.60 26,328.96 37,627.20 45,173.16 38,584.80 22,469.76 35,382.60 41,429.88 32,556.96 37,378.44 40,275.36 33,261.48

529,045.92 924,989.00

57.19%

57.19%

2017 ATHLETICS NATURAL GAS USE

2017 ATHLETICS WATER USE

<l!t:D EAST BAY <.._/...> MUNICIPAL UTILITY lJJSTR!CT

1-866-403-2683

Oakland Alameda County Coliseum PO BOX 182244 COLUMBUS, OH 43218-2244

695 Hegenberger Rd, Oakland, CA 94621 4/4/17

METER NOS, s~rnOLS' Current

Meter 29599229

5/3/17 ACCOUNT NO_: 7900 METER READINGS C. CUBIC FT. METER

USED SIZE ,!;11.·lOUNT

Previous

LO 558.00 385.00· 173.00 8 SD

Total Consumption TOTAL SERVICE CHARGE EBMUD SEWAGE TREATMENT Cl1Y OF OAKLAND SEWER SERVICE OTHER CHARGES TOTAL BILLING

3,017.00 2,242.00 775.00

948.00

8

~SYMBOLS L, D, B. S.D.: Sep_arate dials measuring respectively, Jarga and small ilows through a compound meter. Water used is llle sum of quanlities measured b}' both dials.

BTY.: Indicates two (or more) meters in a battery on one servic:e line. Billed at service charge iqr single meter of equivalent capacity.

~D EASTBAY <._!,..::> MUtVICJPAL UTILITY DISTRICT

1-866-403-2683

Oakland Alameda County Coliseum PO BOX 182244 COLUMBUS, OH 43218-2244

695 Hegenberger Rd, Oakland, CA 94621 4/4/17

METER NOS. -SYMBOLS' Currnnl

Meter 19744270

5/3/17 ACCOUNT NO.: 7900 METER READINGS C. CUBIC FT. METER

USED SIZE AMOUNT

Pro,'!O;.;s

LD 2,838.00 1,877.00 961.00 8 SD

Total Consumption TOTAL SERVICE CHARGE EBMUD SEWAGE TREATMENT

4,352.00

CITY OF OAKLAND SEWER SERVICE OTHER CHARGES TOTAL BILLING

3,245.00 1,107.00

2,068.00

8

*SYMBOLS· L.D. & S.D.: Sepm.i.ltB dials measuring respectively, large and small flows through a compound meler. Water used is the sum of quantities measured by both dials.

BTY.: lndical£s lwo {or morel meters fn a batiery on one service line. BHied at service charge for single meter ,;if equl1iaJ1mt capacity,

'<f> EASTBAY <:_/..> MUNICIPAL UTILITY DISTRICT

1-866-403-2683

Oakland Alameda County Coliseum PO BOX 182244 COLUMBUS, OH 43218-2244

695 Hegenberger Rd, Oakland, CA 94621 5/3/17

METfANOS, SYMBOLS" Current

Meter 29599229

6/1/17 ACCOUNT NO.: 7900 METER REilDINGS G.CUBICFJ: METER

USED SIZE AMOUNT Previous

LD 717.00 558.00 159.00 8 SD 3,890.00

Total Consumption TOTAL SERVICE CHARGE EBMUD SEWAGE TREATMENT CITY OF OAKLAND SEWER SERVICE OTHER CHARGES TOTAL BILLING

3,017.00 873.00

1,032.00

8

"SYMBOLS L.D. & S.D.: Separate dials measuring respectively, large and smaU flows throtJgh a compound meter. Wal~r used is th~ sum of .qu_anfilies measured by both dials.

BTV.: lndic8.!es two (or more) meters in a bqHery on one service llne. BUJed at service charge for single meter Of E!qulv:arent capa_city.

. "!CD EASTBAY <._/_>·,VJUNICIPAL UTILITY DISTRICT

1v8r,FJ-iJ03-2683

Oakland Alameda County Coliseum PO BOX 182244 COLUMBUS, OH 43218-2244

695 Hegenberger Rd, Oakland, CA 94621 5/3/17

METEANOS. SYMBOLS' Cmrenl

Meter 19744270

6/1/17 ACCOUNT NO.: 7900 METER READINGS C. CUBICFT. METER

USED SIZE AMOUNT PreYlous

LO 4,092.00 2,838.00 1,254.00 8 SD

Total Consumption TOTAL SERVICE CHARGE EBMUD SEWAGE TREATMENT CITY OF OAKLAND SEWER SERVICE OTHER CHARGES TOTAL BILLING

5,721.00 4,352.00 1,369.00

2,623.00

8

*SYMBOLS L.D.- & S.D.: Separate tiia!s measuring respectively, large and small Jlows lhrough a compound rneler. Water used i_s !hs sum of quantities measured by both dials,

BTY.: Indicates two (of more) meters in a battery on one sen1l9e Une. B1Jled at service chnrge Tr:r Single me let oi equivalent capacity.

~D EASTBAY <._/;> MUN/Cf PAL UTILITY DISTRICT 1-866-403-2683

Oakland Alameda County Coliseum PO BOX 182244 COLUMBUS, OH 43218-2244

7/3/17 ACCOUNT NO.: 7900

METER READJNGS C. CUBIC FI METER :: $YMBOLS' Current Previous USED SJZE - AMOUNT

C-159 • aftl (9295:1)

Meter 29599229

Total Consumption

LO SD

TOTAL SERVICE CHARGE EBMUD SEWAGE TREATMENT CITY OF OAKLAND SEWER SERVICE OTHER CHARGES TOTAL BILLING

987.00. 4,962.00

717.00 3,890.00

270.00 1,072.00

1,342.00

8 8

*SYMBOLS L.0-, & S.D.: Separate dials me~suring respectively, large ood' small flows through a oompound meter, Water used is the.sum of quantities measured by both dials.

BTY.: Indicates two (or more) meters in a battery on one service line. Billed at service charge for single meter of equivalent capacity.

~D EASTBAY <:_/,;:> MUNICIPAL UTILITY DISTRICT

1-866-403-2683

Oakland Alameda Couniy Coliseum PO BOX 182244 COLUMBUS, OH 43218-2244

695 Hegenberger Rd, Oakland, CA 94621 6/1/17 7/3/17 ACCOUNT NO.: 7900

0---1t;!l • 3/1i (92959)

SYMBOLS' METER READINGS C. CUBIC FT. METER

. AMOUNT METER NOS. Current Previous USED SIZE

Meter 19744270

Total Consumption

LO SD

TOTAL SERVICE CHARGE EBMUD SEWAGE TREATMENT CITY OF OAKLAND SEWER SERVICE OTHER CHARGES TOTAL BILLING

5,872.00 7,375.00

4,092.00 5,721.00

1,78G.OO 1,654.00

3,434.GO

8 8

"'SYMBOLS L,D, & S,D,: Separate dials measuring respectively, large and small flows through a compound meter. Water used is the sum of quantities measured by both dials.

BTY.: Indicates two (or mom) meters in a battery on one service line. Billed at service charge for single meter of equivalent capacity.

~B ::;i;;L ur1urvD1srnicr 1-866-403-2/$!J3

Oakland Alameda County Coliseum PO BOX 182244 COLUMBUS, OH 43218·2244

695 Hegenberger Rd, Oakland, CA 94621 7/3/17 8/1/17 ACCOUNT NO.: 7900

METERREADJNGS Q., GUBl.C fr, METER "c:Urrent Previous us~ · SJ~E·. .A;~OUNT

Meter 29599229

Total Consumption

LD SD

TOTAL SERVICE CHARGE WATER FLOW CHARGE EBMUD SEWAGE TREATMENT CITY OF OAKLAND SEWER SERVICE OTHER CHARGES TOTAL BILLING

1,225.00 5,926.00

987.00 4,962.00

238.00 964.00

1,202.00

8 8

*SYMB"O•Ls LD, &.S;D;: Separate-.dia!s._measuring respecfiveiy, !8.rge and·smalutows·throug!,-a coi-npound meter. Water·UseCHs-the suin o't"quantities measured by both d!El!s.

sw.-~- !ridiqates-i'.yo·{<?r riiore}.ineters jfra biittel'Y on-or:ie·1;mryic_e.11ne-. 1;3illed-at servfoe·Cha"rij&-forsingl~ me-i:er- of equivalent capS.city.

' iltf::D EAST BAY <...J..:> Ml/NICIPAL UTILITY DISTRICT ·1'/!66-403-2683

Oakland Alameda County Coliseum PO BOX 182244 COLUMBUS, OH 43218-2244

695 Hegenberger Rd, Oakland, CA 94621 6/30/17 B/1/17 ACCOUNT NO.: 7900

METER READ)/1,/GS

"i::"urren·t Previous

Meter 19744270

Total Consumption

LD SD

TOTAL SERVICE CHARGE WATER FLOW CHARGE EBMUD SEWAGE TREATMENT.

7,463.00 8,880.00

CITY OF 0AKLAND SEWER SERVICE

OTHER CHARGES TOTAL BILLING

5,872.00 7,375.00

1,591.00 1,505.00

3,096.00

8 8

wsy'MBOLS L.D, &s.n.: ·Separate.d[Bis.measu~in_g:respeoiiveiy, large and-.smaltf!owsthrous.h-a-cofnpound mlitar~ Water Used-fs'ihe suin ofquantities measured by Doth dials.

BTY. :. ·1n~i9ate.s- two'10i'. iriOre).IT\eterBJn e.-ba~ry -~n.onB·.sel:ViCe · l[ti.e. J:3illetf.at Seryfoe_i::hai"g~ f6isirigle mE!teiOf equ:iviilent:Capaoity.

_.,.,_

EAST BAY MUNICIPAL UTILITY DISTRICT

1-368-403-2683

Oakland Alameda Count>; Coliseum PO BOX 182244 COLUMBUS, OH 43218-2244

695 Hegenberger Rd, Oakland, CA 94621 8/1/17 9/1/17 ACCOUNT NO.: 7900

M~:~B\miNG~. o .. ewme-rr ~~h~rit: '!?re\!~ ¥1~~

·. ,·{·'' ··<-· ., • ·-., •i'

;:,.~."

:7f~.;,,.,·

ff

-.~'f

'; '!-'· f ... : :, ~t-

:'f •.

:·.'r

<-!,

'"lif_L~ :·. ,/f. .,, -so-. ··'

,. ,,,...,

:.:.;..;:·:,.,

. ·.;.;~.:-..

'SYMBOLS

,-•... ,t ;.-,:-

,._..' .. ·-'·I'..,}::

._'.:Ji_.·:,_~-_-_:::_:~ .• ·.•- .)' ~: ~I: .,_ : - i;_'t--i, : ..

..,, ").,. ... ·--.•-.-.r,:.r

. . .. : i. :~-- ts-,.~_ -

·'-i:'-' .,

·-,,;_

£ •' •r '•-S

~ .-c;~ ,_

.,.:,.,

·,;.

.;?-':.:. ,::· _,,~ .,,_ -· ",;,,

.. i f •

i,; :;,-, ·. l'

.•. ({-:• -., . .;,-: ~- .

: • J

.,

.:;_' .' ,,.

__ _, .

. '\if~ ·--~);.! ':'<.?

;:'}It: . .. ~;:~--

.".\;,' -rJ,· .... ..;.

LO. & S.D.: Separate dials measuring·respeotively, large-and .s~all ffows thr-0ugf1 a compound meter. Wafer used is-the sum of qUElntities measured bybolh dials.

BTY;;: Indicates-two {or more) meters in a batmry ori one·Getvice line. Billed at servfoe charge fur single- met-er of equivalent capacity.

. ~{> EASTBAY <._/_:> MUNICIPAL UTILITY DISTRICT

1-866-403-2683

Oakland Alameda County Coliseum PO BOX 182244 COLUMBUS, OH 43218-2244

695 Hegenberger Rd, Oakland, CA 94621 9/1/17 9/28/17 ACCOUNT NO.: 7900

METER REAQINGS q. QUB!C FT. METER Atv)OUNT METER NOS, SXMBOLS.~ Current Previous US!,:D SI~·

C-1511 • 3111 (02900)

Meter 29599229

Total Consumption

LD SD

1,675.00 7,912.00

TOTAL SERVICE CHARGE EBMUD SEWAGE TREATMENT CITY OF OAKLAND SEWER SERVICE OTHER CHARGES TOTAL BILLING

1,485.00 6,976.00

190.00 936.00

1,126.00

8 8

*SYMBOLS L.D, & S,D,: Separate dials measurln.g respeotively, large and small flows thr,ough a compound meter. Water used is the sum of quantities measured by both d!a!s.

BTY;: lndfcates two (or m_ore) meters in a battery-on one service fine, Billed at service charge- for single· m_eter of equivalent capacity.

,c;;:o EAST BAY · <_j_:> MUNICIPAL UTILITY DISTRICT

1-866-403-2683

Oakland Alameda County Coliseum PO BOX 182244 COLUMBUS, OH 43218-2244

695 Hegenberger Rd, Oakland, CA 94621 8/30/17 9/29/17 ACCOUNT NO.: 7900

METER READJNGS C. GUB1C Ff. METER METER NOS. SYMBOLS*

· Currant Previous usEo SIZE .AMOl,INT

C-1611 • 3/11 (0211Sl)

Meter 19744270

Total Consumption

LD SD

TOTAL SERVICE CHARGE EBMUD SEWAGE TREATMENT

10,182.00 11,899.00

CITY OF OAKLAND SEWER SERVICE OTHER CHARGES TOTAL BILLING

9,088.00 10,487.00

1,094.00 1,412.00

2,506.00

8 8

*SYMB.OLS LO, & S.D.: Separate dials measuring respeotively, large and small flows through a compound meter. Water used is the sum of quantities measured by both dials.

STY.: Indicates two (or more} metel'S in a battery on one·service line, Billed at service charge fors!ngle meter of equivalent capacity.

2017 ATHLETICS SOLID WASTE DISPOSAL

LOCATIONOAKLAND A's

Units

MLB 2017 - Stadium Waste Management & Recycling Report

2016 Diversion Rate Goal 2015 Diversion Rate YTD

SEPT OCT

40.0% 44%

JAN FEB MAR APR MAY JUN JUL AUG YTDCategory

DEC NOV

24.50

123.6420.11 14.09 17.94 8.52

28.09 20.59 100.256.12 10.69 10.26

CRV - (Glass / Plastic / Aluminum)Tons 12.70 11.84 64.42

Total RecyclablesTons 0.00 0.00 0.00

RE

CYC

LAB

LES

Paper / CardboardTons 43.62 19.36

Compost & Yard WasteTons

15.26 7.00 12.70 4.92

430.0574.25 81.00 67.25 72.55 0.00 0.00

67.82 92.50 76.25

49.50 85.50 0.00

520.82

Total WasteTons 0.00 0.00 0.00 156.90 160.00 0.00 0.00

107.40 74.50 102.35Trash Disposed to Landfill (MSW)

Tons

Diversion Rate% #### ####

0.00 972.68176.60 148.82 181.15 149.21

#### #### 44%54% 37% 49% ######## 32% 53% 42%


Recommended