A substantial amount of information is available on signalconditioning for common transducers. Fortunately, most ofthese devices, which are used to sense common physicalparameters, are relatively easy to signal condition. Further,most transducer-based measurement requirements are wellserved by standard transducers and signal conditioningtechniques.
Some situations, however, require sophisticated transduc-tion techniques with their attendant special signal condition-ing requirements. This application note details signal condi-tioning and applications information for a diverse group ofsophisticated and unusual tranducers. Because these de-vices are unusual or somewhat difficult to signal condition,relatively little material has appeared on how to design cir-cuitry for them. Many of these devices permit measurementswhich cannot be accomplished in any other way. For thisreason it is worthwhile to have a basic familiarity with theircapabilities and what is required to signal condition them.The circuits shown are intended as instructive examplesonly, although each one has been constructed and tested.Every individual transducer application has a set of specifi-cations and constraints which will require modification orrevision of the circuits presented. Sources of additional in-formation which feature more vigorous treatment are pre-sented in a reference section at the end of the applicationnote.
Photomultiplier Tube (PMT)Perhaps the most versatile light detector available is thephotomultiplier tube (PMT). These sensors allow single pho-ton detection, sub-nanosecond rise time, bandwidths ap-proaching 1 GHz and linearity of response over a range of107. In addition, they feature extremely low noise, stablecharacteristics and very long life. Figure 1 details a typicalPMT along with a signal conditioning circuit. The tube iscomposed of a photosensitive cathode, an anode, a focusingelectrode and ten dynode stages. In operation, the photo-cathode, which is high voltage biased with respect to thedynodes, emits photoelectrons when it is struck by light.These are focused into a beam and directed to the firstdynode stage by the focus electrode. These arriving elec-trons impinge on the dynode, causing secondary emission tooccur. As a result, a greater number of electrons leave thedynode and are then directed to the second dynode. In thisfashion, a number (e.g.,10) of dynode stages are used toachieve overall gains of 106 to 108. The electrons from thefinal dynode are collected by the anode, which provides theoutput current of the tube. In contrast to other vacuum tubes,the PMT does not use a filament to thermionically generateelectrons. Instead, the photocathode, in combination withincident light, initiates the electrons. The absence of a fila-ment means there are no degradation, heat or outgassingproblems and the life of a PMT is very long.
Signal conditioning involves generating a stable high voltagesupply and accomplishing a low noise current-to-voltageconversion at the anode. In this example, a DC-DC con-verter is used to supply the dynode potentials to the tube.
The supply is stabilized by the LF412 amplifier which drivesthe Q3-Q5 combination to complete a feedback loop aroundthe Q1-Q2 driven transformer. The LM329 provides a stableservo reference. In general, the regulation of a PMT supplyshould be at least ten times greater than the required mea-surement gain stability because of the relationship betweena PMT’s gain slope and the high voltage applied. The cath-ode and dynodes are biased from the high voltage supply viadivider resistors. The resistors distribute the dynode poten-tials in proportion to a ratio which is specified for each tubetype. To prevent non-linear response, the current through thedivider string should be at least ten times the maximumexpected current out of the tube. Some high speed pulseapplications can generate transient high tube currents whichmay require the small capacitors shown in dashed lines. Theanode is the tube output and appears as an almost idealcurrent source. The LF412 amplifier performs acurrent-to-voltage conversion with the 1 MΩ resistor settingthe output scale factor.
The PMT’s combination of high speed and extreme sensitiv-ity suits it to a variety of difficult light measurement chores.The remarkable photograph of Figure 2 shows the actualrise and fall time characteristics (inverted) of a fast pulse oflight produced by an LED. This photo was taken with a highspeed PMT which was terminated directly into a 1 GHzbandwidth, 50Ω sampling oscilloscope.
Another PMT application exchanges speed for sensitivity ina nuclear medical instrument, the Gamma camera.
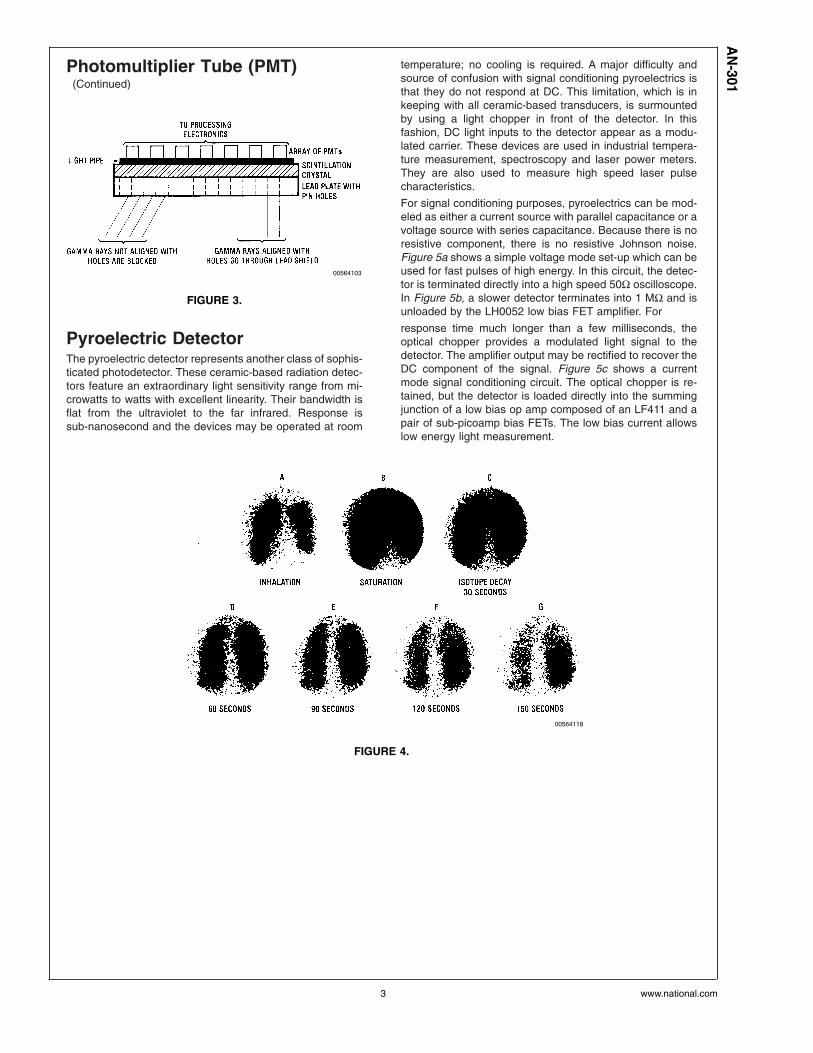
The Gamma camera operates by using the scintillation prop-erties of special crystals which are placed in front of an arrayof PMTs. Small quantities of radioactive isotopes are intro-duced into the patient either by oral ingestion or injection.Specific isotopes collect at certain organs within the body. Asthe radioactive isotopes decay, gamma rays are emittedfrom the isotope concentration area. These rays are colli-mated by a lead plate containing many small holes whichforms the front of the camera (Figure 3). This collimatorallows only those rays which are at right angles to passthrough the plate. The rest are absorbed in the lead. In thisfashion the geometric shape of the gamma source is pre-served and is presented to the scintillation crystal. The arrayof PMTs is located behind the crystal. The individual tubesrespond to any given scintillation anywhere in the crystalwith a distribution of signal strengths. This distribution isused by a processor to determine the precise point of scin-tillation in the crystal. Each of these scantillation locations isrecorded on a CRT. After a length of time, thiscounting-integration process produces a picture of the organon the CRT. Figure 4 shows 7 such pictures of a pair ofhuman lungs, taken 30 seconds apart over a 150 secondperiod. In photo A, the administered radioactive isotope be-gins to collect in the lungs. In photo B, the lungs are satu-rated. During photos C, D, E, F and G, the isotope progres-sively decays. Normally, human lungs will clear after 120seconds. This particular sequence shows evidence of anobstructive pulmonary disease which is most pronounced inthe lower right lung.
National SemiconductorApplication Note 301January 1982
Pyroelectric DetectorThe pyroelectric detector represents another class of sophis-ticated photodetector. These ceramic-based radiation detec-tors feature an extraordinary light sensitivity range from mi-crowatts to watts with excellent linearity. Their bandwidth isflat from the ultraviolet to the far infrared. Response issub-nanosecond and the devices may be operated at room
temperature; no cooling is required. A major difficulty andsource of confusion with signal conditioning pyroelectrics isthat they do not respond at DC. This limitation, which is inkeeping with all ceramic-based transducers, is surmountedby using a light chopper in front of the detector. In thisfashion, DC light inputs to the detector appear as a modu-lated carrier. These devices are used in industrial tempera-ture measurement, spectroscopy and laser power meters.They are also used to measure high speed laser pulsecharacteristics.
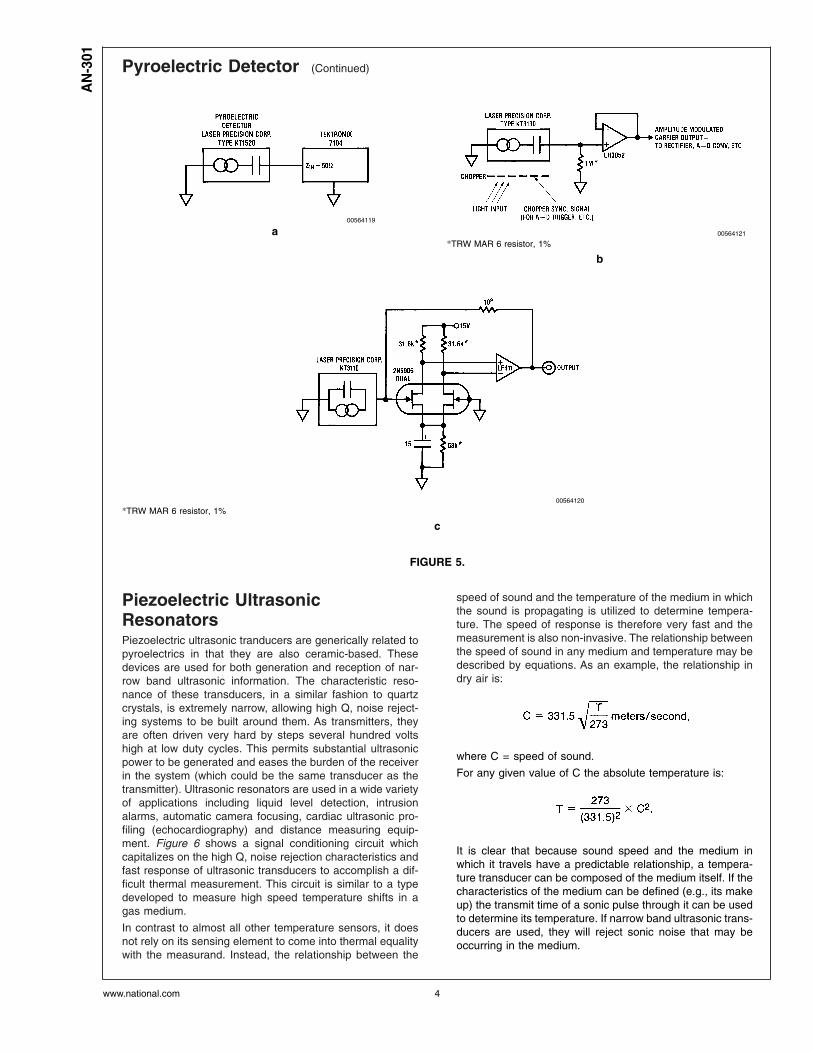
For signal conditioning purposes, pyroelectrics can be mod-eled as either a current source with parallel capacitance or avoltage source with series capacitance. Because there is noresistive component, there is no resistive Johnson noise.Figure 5a shows a simple voltage mode set-up which can beused for fast pulses of high energy. In this circuit, the detec-tor is terminated directly into a high speed 50Ω oscilloscope.In Figure 5b, a slower detector terminates into 1 MΩ and isunloaded by the LH0052 low bias FET amplifier. For
response time much longer than a few milliseconds, theoptical chopper provides a modulated light signal to thedetector. The amplifier output may be rectified to recover theDC component of the signal. Figure 5c shows a currentmode signal conditioning circuit. The optical chopper is re-tained, but the detector is loaded directly into the summingjunction of a low bias op amp composed of an LF411 and apair of sub-picoamp bias FETs. The low bias current allowslow energy light measurement.
00564103
FIGURE 3.
00564118
FIGURE 4.
AN
-301
www.national.com3
Pyroelectric Detector (Continued)
Piezoelectric UltrasonicResonatorsPiezoelectric ultrasonic tranducers are generically related topyroelectrics in that they are also ceramic-based. Thesedevices are used for both generation and reception of nar-row band ultrasonic information. The characteristic reso-nance of these transducers, in a similar fashion to quartzcrystals, is extremely narrow, allowing high Q, noise reject-ing systems to be built around them. As transmitters, theyare often driven very hard by steps several hundred voltshigh at low duty cycles. This permits substantial ultrasonicpower to be generated and eases the burden of the receiverin the system (which could be the same transducer as thetransmitter). Ultrasonic resonators are used in a wide varietyof applications including liquid level detection, intrusionalarms, automatic camera focusing, cardiac ultrasonic pro-filing (echocardiography) and distance measuring equip-ment. Figure 6 shows a signal conditioning circuit whichcapitalizes on the high Q, noise rejection characteristics andfast response of ultrasonic transducers to accomplish a dif-ficult thermal measurement. This circuit is similar to a typedeveloped to measure high speed temperature shifts in agas medium.
In contrast to almost all other temperature sensors, it doesnot rely on its sensing element to come into thermal equalitywith the measurand. Instead, the relationship between the
speed of sound and the temperature of the medium in whichthe sound is propagating is utilized to determine tempera-ture. The speed of response is therefore very fast and themeasurement is also non-invasive. The relationship betweenthe speed of sound in any medium and temperature may bedescribed by equations. As an example, the relationship indry air is:
where C = speed of sound.
For any given value of C the absolute temperature is:
It is clear that because sound speed and the medium inwhich it travels have a predictable relationship, a tempera-ture transducer can be composed of the medium itself. If thecharacteristics of the medium can be defined (e.g., its makeup) the transmit time of a sonic pulse through it can be usedto determine its temperature. If narrow band ultrasonic trans-ducers are used, they will reject sonic noise that may beoccurring in the medium.
00564119
a 00564121
*TRW MAR 6 resistor, 1%
b
00564120
*TRW MAR 6 resistor, 1%
c
FIGURE 5.
AN
-301
www.national.com 4
Piezoelectric UltrasonicResonators (Continued)
A1 periodically generates a short pulse (waveform A, Figure7) that drives the 2N3440 into conduction, forcing the ultra-sonic 40 kHz transducer to emit a short burst at its resonantfrequency. The 150V pulse amplitude allows substantial ul-trasonic energy to be coupled into the medium. As this pulseis generated, the DM7474 flip-flop is set low (waveform C,Figure 7). After a length of time, determined by the distancebetween the ultrasonic transducers and the temperature ofthe gas, the sonic pulse arrives at the receiving transducerand is amplified by A3 and A4 (A4’s output is waveform B,Figure 7). This amplified output triggers A6, which resets theflip-flop high. During the time the flip-flop was low, the2N3810 current source was allowed to charge the 0.01 µFcapacitor (waveform D, Figure 7). When the flip-flop is resethigh, Q2 comes on and the charging ceases. The A2 followeroutput sits at the capacitor’s DC potential, which is related tothe sonic transit time in the gas stream. The LF398
sample-hold is triggered by the “B” DM74121 one shot andsamples A2’s output. The LF398’s output feeds two LH0094multi-function non-linear converters which are arranged tolinearize the speed of sound versus temperature relation-ship. The output of this configuration is the gas temperaturewhich is displayed on the meter. Gain and zero trims areprovided via the A7 and A8 networks. When A1 issuesanother pulse, the DM74121 “A” one shot resets the 0.01 µFcapacitor to 0V and the entire process repeats.
It is worth noting that no bandwidth limiting of any kind isemployed at the A3-A4 receiver despite their compound gainof 1000. This would seem to invite noise sensitivity problemsin a sonic system, but the high Q ultrasonic transducerprovides almost ideal noise rejection. Figure 8 shows theamplified output of the received pulse superimposed on theoutput of a boardband microphone placed in the sonic path.Boardband noise 100 dB greater than the 40 kHz pulse ispumped into the sonic path. Virtually complete noise rejec-tion occurs and signal integrity is maintained.
00564105
Ultrasonic transducers = Massa MK-109
FIGURE 6.
AN
-301
www.national.com5
Piezoelectric UltrasonicResonators (Continued)
Piezoelectric AccelerometerAnother piezoelectric-based transducer is the piezoelectricaccelerometer. These devices utilize the property of certainceramic materials to produce charge when subject to me-chanical excitation. These accelerometers use a masscoupled to the piezoelectric element to generate a force onthe element in response to an acceleration’s frequency andamplitude. Calibration and sensitivity can be varied by se-lecting the piezoelectric materal and altering the configura-tion and amount of the mass. The best way to signal condi-tion these devices is to employ an amplifier configurationthat is directly sensitive to their charge-type output. Chargeamplifiers use low bias current op amps with capacitivefeedback. Output voltage will depend upon the charge out ofthe accelerometer which is related to the applied accelera-tion.
In Figure 9, the transducer looks directly into the groundpotential summing junction of an op amp. Because of this,there is no voltage difference between the interconnectingcable center conductor and its shield. This eliminates cablecapacitance effects on the transducer output and allows longcable runs. It is advisable to use cable specified for low
triboelectric charge effects for best performance, althoughthis is usually only a factor with relatively low output devices.The 1011Ω resistor provides a DC feedback path, while thevariable capacitor sets the sensitivity of thecharge-to-voltage conversion. When the accelerometershown is mounted on a hand-held voltmeter and dropped onthe floor, the instantaneous acceleration to which the volt-meter is subjected can be determined. In Figure 10, thestored trace display shows an instantaneous force of almost1000G with smaller forces generated as the voltmeterbounces 3 times over 60 ms. (It is recommended that thisexperiment be performed with a borrowed voltmeter.)
Linear Variable DifferentialTransformer (LVDT)The linear variable differential transformer (LVDT) offerszero-friction position sensing with good precision. Althoughpotentiometers are easy to signal condition and allow highprecision they cannot match the nearly infinite life andzero-friction of the LVDT approach. LVDTs are available inboth rotary and stroke mechanical configurations. The LVDTis basically a transformer (Figure 11) with a movable core.The primary is driven with a sine wave which is usuallyamplitude stabilized. The two matched secondaries are con-nected in series-opposed fashion. When the movable core ispositioned in the magnetic (and usually geometric) center ofthe transformer, the secondaries’ outputs cancel and no netsecondary voltage appears. This is called the null position.
00564106
FIGURE 7.
00564107
FIGURE 8.
00564108
FIGURE 9.
00564109
FIGURE 10.
AN
-301
www.national.com 6
Linear Variable DifferentialTransformer (LVDT) (Continued)
As the core is moved from null, the differential in flux coupledto the two secondaries produces a net voltage differenceacross them.
This is the output of transducer. Good transducer perfor-mance (e.g., null cancellation characteristics, linearity, etc.)requires manufacturer attention to winding techniques, mag-netic shielding, material choices and other issues. Rectifyingand filtering the output signal will yield only amplitude infor-mation. Optimum signal conditioning requires a phase sen-sitive demodulation scheme. This gives the amplitude andalso polarity information necessary to determine on whichside of null the LVDT core is.
Figure 12 shows a circuit which does this. Waveforms ofoperation are given in Figure 13. In this circuit, Q1 and itsassociated components from a phase shift oscillator whichruns at 2.5 kHz, the manufacturer’s specified transduceroperating frequency. A1A amplifies and buffers Q1’s outputand drives the LVDT (waveform A, Figure 13). Since thetransducer’s output will vary with drive level, feedback isused to stabilize the 2.5 kHz amplitude. A1C and A1D fullwave rectify a sample of the drive waveform. A1C’s filteredoutput is applied to A1D, a servo amplifier. A1D comparesA1C’s output to the LM329 reference and drives the Q1oscillator to complete an amplitude stabilization loop. TheLVDT’s output is amplified by A2C and fed to A2A. A2A is aunity gain ampilifer whose sign alternates between “+” and“−”. Synchronous switching for A2A comes from C1 (wave-form B, Figure 13), which is driven by the modulation sinewave output via a phase shift network. The phase trimnetwork compensates phase shift in the LVDT and ensuresthat C1 switches at the zero crossings relative to A2A’soutput. When C1’s output is low, the 2N4393 FET is off andA2A’s positive input (waveform C, Figure 13) receives signal.When the sine wave reverses polarity, C1’s output goeshigh, turning on the FET, which grounds A2A’s “+” input.Under these conditions A2A is always switching its amplifi-
cation’s sign from “+” to “−” in synchronism with the sinewave output from the LVDT. A2A’s phase sensitive output, inthis case positive, appears in trace D, Figure 13. A2B pro-vides a scaled and filtered DC output. To trim the circuit, setthe LVDT to at least 1⁄2 physical displacement and adjust thephase trim for maximum output indication. Next, adjust thegain trim for the desired circuit output at full-scale LVDTdisplacement.
Force-Balanced PendulousAccelerometerThe operating principles of the LVDT are applied in theforce-balanced pendulous accelerometer. Transducers ofthis type feature wide dynamic range, high linearity and veryhigh accuracy. Figure 14 shows one form of a conceptualforce-balanced pendulous accelerometer. The device oper-ates by using an LVDT-type pick-off to determine the positionof the pendulum. The DC output of the LVDT is fed to a servoamplifier which drives the torque coil. The magnetic output ofthe torque coil completes a servo loop around the pendulum,forcing it to become immobile. Because the torque coil’s fieldcan attract only the pendulum, a second bias coil provides asteady force for the torque coil to work against. When aninput acceleration occurs along the sensitive axis, the servoapplies the necessary current to the torque coil to keep thependulum from moving. The amount of current required isdirectly proportional to the value of the input acceleration.Because the pendulum never moves, transducer linearityand accuracy can be very high. In addition, wide dynamicrange is possible. Force-balanced accelerometers arewidely applied in aircraft inertial guidance systems, aero-space applications, seismic monitoring, shock and vibrationstudies, oil drilling platform stabilization and similar applica-tions. In recent years these accelerometers have becomeavailable in complete signal conditioned packages, althoughthere are a number of applications where it is desirable toindependently signal condition the transducer. Figure 15shows a detailed schematic of such signal conditioning. Thepick-off circuitry is similar to the LVDT shown in Figure 12and does not require further comment. The bias coil is drivenby the LH0002 boosted LF347 (A1A) which is in a currentsensing feedback configuration. For the accelerometershown, the manufacturer specifies
60 mA of bias coil current. Torque pulses are applied byservo amplifier A3B, which is biased from the LVDT demodu-lator output. The output of the circuit is taken across the100Ω resistor in series with the torque coil. Servo gain is setat A3B while damping for the loop is provided by the 1 µFunit in A3B’s feedback loop. In addition, accelerometerdamping is controlled by stabilizing the temperature of themechanical assembly. This is accomplished by A3C, which isset up as a simple on-off temperature controller. The interiorof the accelerometer is filled at manufacture with a liquidwhose viscosity provides appropriate damping characteris-tics at a specified temperature, in this case 180˚F. Acceler-ometers of this type routinely yield 100ppm accuracy fromranges of 20 mG to 100G.
Rate GyroThe rate gyro is another form of high performance inertialmeasuring transducer. It consists of an electrically drivengyroscope with a captive spin axis. Normal gyros are free ofrestraint and maintain position when moved. The rate gyro isheld captive and forced to move with the physical input. Bymeasuring the force generated as the gyro opposes itsrestraining mechanism, rate-of-angle change informationcan be deduced. Figure 16 shows signal conditioning for atypical rate gyro. An LVDT-type pick-off is used and synchro-nous demodulation-type circuitry very similar to Figure 15 isemployed. Note the high voltage drive to the gyro motor (26Vrms) supplied by the boosted LM143. Because of their longlife and high precision rate, gyros are frequently employed ininertial guidance systems, drilling platform stabilization sys-tems and other critical applications.
Flux GateA flux gate transducer converts an external magnetic field(such as that of the earth’s) into an electric output. A varietyof flux gate configurations exist, the simplest being a piece ofeasily saturable ferrous material wrapped around a cylinder(Figure 17). An alternating current is passed along the axis ofthe cylinder which periodically saturates the material, firstclockwise and then counter-clockwise.
A pick-up winding is wrapped around the cylinder. While theferrous material is between saturation extremes, it maintainsa certain average permeability. While in saturation, this per-meability (µ = dB/dH) becomes one (an increase in drivingfield H produces the same increase in flux B). If there is nocomponent of magnetic field along the axis of the cylinder,the flux change seen by the pick-up winding is zero since theexcitation flux is normal to the axis of the winding. If, on theother hand, a field component is present along the cylindricalaxis, then each time the ferrous material goes from onesaturation extreme to the other it produces a pulse output onthe signal pick-up winding that is proportional to the external
magnetic field and the average permeability of the material.Since this saturation-to-saturation transition occurs twiceeach excitation period (fundamental), the frequency of signalout of the pick-up windings is twice the excitation frequency.
These transducers find use in metal detectors, submarinelocating gear, electronic compasses, oil surveys, and otherareas where measurement of the strength or locally causeddisturbance of the earth’s magnetic field is of interest. Fluxgate transducers are capable of measuring variations in theearth’s magnetic field within one gamma (10−5 oersteds).Two axis flux gates can be used to construct an electroniccompass. More recent flux gate design employs acore-shaped transducer, which is essentially two cylindertypes bent together at the ends to form a closed magneticpath. This permits lower driving power and allows the use ofcommercially available tape-wound cores to be used to con-struct the transducer. A simple flux gate and its signal con-ditioning appears in Figure 18. Excitation to the flux gate isprovided by the complementary signal output from theCD4047s. The transistor drives a transformer which is tunedfor resonance. This converts the square wave output of theCMOS oscillator into a sinusoidal waveform. This sinusoidalexcitation voltage is then converted by the transformer into ahigh level AC drive current at the excitation frequency whichis used to drive the sensor.
The output of the sensor signal winding is an AC signal attwice the excitation frequency and is directly proportional inamplitude to the external axial magnetic field. Thissecond-harmonic of the excitation frequency is then phasedetected with a circuit similar to the demodulators shown inFigures 12, 15. A portion of the DC output signal may be fedback (shown in dashed lines) to the signal winding to providea closed loop negative feedback system. This feedbacksignal produces a field in the sensor which opposes thesignal being measured. The high forward gain of the signalchannel along with the closed loop negative feedback sys-tem ensure good stability and linearity of the output signal.
00564114
*Adjust for 26 Vrms output
FIGURE 16.
AN
-301
www.national.com 10
Flux Gate (Continued)
Low Power Strain Gauge BridgeSignal ConditioningIn most cases, strain gauge bridges do not require unusualsignal conditioning techniques. When low power consump-tion is necessary, special circuitry must be employed toeliminate the high current consumption of straingauge-based transducers. Normally, the 350Ω input imped-ance of these devices requires substantial drive to achieve a
usable output. For a typical 10V drive level, 35 mA arerequired; hardly compatible with low power or battery opera-tion. The circuit shown in Figure 19 provides complete signalconditioning for strain gauge transducers while using only1.8 mA average current out of a 9V transistor radio battery.The output of the circuit is an 8-bit word produced by an A-Dconverter. The key to achieving low power operation is topulse power at low duty cycles to the transducer and itssignal conditioning circuitry. In Figure 20, A1A oscillates at
00564127
FIGURE 17.
00564128
FIGURE 18.
AN
-301
www.national.com11
Low Power Strain Gauge BridgeSignal Conditioning (Continued)
about 1 Hz. Each time A1A’s output goes high (waveform A,Figure 20), Q1 comes on, turning on the LM330 5V regulator.This places 5V at Q2’s collector. Concurrently, A1B amplifiesthe output of the pulse-edge shaping network at its input andprovides voltage overdrive to emitter-follower Q2, forcing itinto saturation. This causes an edge shaped pulse to beapplied to the strain gauge bridge (waveform B, Figure 20).This pulse is also used to power A2 and the ADC0804 A-Dconverter. The slow edge shaping limits the DV/DT seen bythe transducer as it is pulsed. This eliminates possible del-eterious effects on transducer performance over time, due to
the continuous abrupt step functions being applied. Thetransducer bridge output is monitored by the A2 quad, whichserves as a differential input (A2A and A2B), single-endedoutput (A2C and A2D) amplifier. A2D’s output (waveform C,Figure 20) feeds the ADC0804 A-D converter. The A-D istriggered by a delayed pulse generated by the A1C and A1Dpair (waveform D, Figure 20). This pulse is positioned so thatit occurs after A2D’s output has settled to final value. Tocalibrate the circuit, apply zero physical load to the trans-ducer shown and adjust the zero trim so the A-D converter isjust below indicating 1 LSB output. Next, apply (or electri-cally simulate) 10,000 lbs. and adjust the gain trim for a fulloutput code at the A-D converter.
00564116
FIGURE 19.
AN
-301
www.national.com 12
Low Power Strain Gauge BridgeSignal Conditioning (Continued)
ReferencesRCA Photomultiplier Handbook; RCA Electro-Optics Divi-sion; Lancaster, PA
The Pyroelectric Thermometer: A Sensor for Measuring Ex-tremely Small Temperature Changes; S.B. Lang, McGill Uni-versity; 1971 International Symposium on Temperature;Washington D.C.
A User’s Guide to Pyroelectric Detection; Electro-OpticalSystems Design; November 1978
Pyroelectric Detectors and Detection Systems; Laser Preci-sion Corp.; Utica, NY
Multiplier Application Guide; Analog Devices Inc.; Norwood,MA; (pages 11–13)
Ultra-Sonic Thermometry using Pulse Techniques; Lyn-nworth and Carnevale; Panametrics Corporation; Waltham,MA
Handbook of Measurement and Control; Schaevitz Engi-neering; Pennsauken, NJ
Self-Balancing Flux Gate Magnetometers; William Geyger;AIEE Transactions, Vol. 77, May 1958; Communication andElectronics
A Low Cost Precision Inertial Grade Accelerometer; H.D.Morris; Systron-Donner Corp.; DGON Symposium on GyroTechnology, 1976
Short Form Catalog; ENDEVCO Corporation; San JuanCapistrano, CA
Bulletin 31, MK109 Ultrasonic Transducer; Massa Corpora-tion; Hungham, MA
AcknowledgementsThe author gratefully acknowledges the cooperation of thefollowing parties who provided transducers, literature and/oradvice.
Hewlett Packard Co., Optoelectronics Division
Honeywell Inc., Avionics Division
Laser Precision Corporation
Schonstedt Instrument Company
Schaevitz Engineering Company
Northrop Corporation, Precision Products Division
RCA Electro-Optics Division
Lancaster Radiology Associates
LIFE SUPPORT POLICY
NATIONAL’S PRODUCTS ARE NOT AUTHORIZED FOR USE AS CRITICAL COMPONENTS IN LIFE SUPPORTDEVICES OR SYSTEMS WITHOUT THE EXPRESS WRITTEN APPROVAL OF THE PRESIDENT AND GENERALCOUNSEL OF NATIONAL SEMICONDUCTOR CORPORATION. As used herein:
1. Life support devices or systems are devices orsystems which, (a) are intended for surgical implantinto the body, or (b) support or sustain life, andwhose failure to perform when properly used inaccordance with instructions for use provided in thelabeling, can be reasonably expected to result in asignificant injury to the user.
2. A critical component is any component of a lifesupport device or system whose failure to performcan be reasonably expected to cause the failure ofthe life support device or system, or to affect itssafety or effectiveness.
National SemiconductorAsia Pacific CustomerResponse GroupTel: 65-2544466Fax: 65-2504466Email: [email protected]
National SemiconductorJapan Ltd.Tel: 81-3-5639-7560Fax: 81-3-5639-7507
www.national.com
00564117
FIGURE 20.
SignalC
onditioningfor
Sophisticated
TransducersA
N-301
National does not assume any responsibility for use of any circuitry described, no circuit patent licenses are implied and National reserves the right at any time without notice to change said circuitry and specifications.