General rights Copyright and moral rights for the publications made accessible in the public portal are retained by the authors and/or other copyright owners and it is a condition of accessing publications that users recognise and abide by the legal requirements associated with these rights. Users may download and print one copy of any publication from the public portal for the purpose of private study or research. You may not further distribute the material or use it for any profit-making activity or commercial gain You may freely distribute the URL identifying the publication in the public portal If you believe that this document breaches copyright please contact us providing details, and we will remove access to the work immediately and investigate your claim. Downloaded from orbit.dtu.dk on: Jan 29, 2022 Application of a curated genome-scale metabolic model of CHO DG44 to an industrial fed-batch process Calmels, Cyrielle; McCann, Andréa; Malphettes, Laetitia; Andersen, Mikael Rørdam Published in: Metabolic Engineering Link to article, DOI: 10.1016/j.ymben.2018.09.009 Publication date: 2018 Document Version Peer reviewed version Link back to DTU Orbit Citation (APA): Calmels, C., McCann, A., Malphettes, L., & Andersen, M. R. (2018). Application of a curated genome-scale metabolic model of CHO DG44 to an industrial fed-batch process. Metabolic Engineering, 51, 9-19. https://doi.org/10.1016/j.ymben.2018.09.009
Transcript
General rights Copyright and moral rights for the publications made accessible in the public portal are retained by the authors and/or other copyright owners and it is a condition of accessing publications that users recognise and abide by the legal requirements associated with these rights.
Users may download and print one copy of any publication from the public portal for the purpose of private study or research.
You may not further distribute the material or use it for any profit-making activity or commercial gain
You may freely distribute the URL identifying the publication in the public portal If you believe that this document breaches copyright please contact us providing details, and we will remove access to the work immediately and investigate your claim.
Downloaded from orbit.dtu.dk on: Jan 29, 2022
Application of a curated genome-scale metabolic model of CHO DG44 to an industrialfed-batch process
Calmels, Cyrielle; McCann, Andréa; Malphettes, Laetitia; Andersen, Mikael Rørdam
Published in:Metabolic Engineering
Link to article, DOI:10.1016/j.ymben.2018.09.009
Publication date:2018
Document VersionPeer reviewed version
Link back to DTU Orbit
Citation (APA):Calmels, C., McCann, A., Malphettes, L., & Andersen, M. R. (2018). Application of a curated genome-scalemetabolic model of CHO DG44 to an industrial fed-batch process. Metabolic Engineering, 51, 9-19.https://doi.org/10.1016/j.ymben.2018.09.009
Received date: 29 June 2018Revised date: 17 August 2018Accepted date: 14 September 2018
Cite this article as: Cyrielle Calmels, Andréa McCann, Laetitia Malphettes andMikael Rørdam Andersen, Application of a curated genome-scale metabolicmodel of CHO DG44 to an industrial fed-batch process, Metabolic Engineering,https://doi.org/10.1016/j.ymben.2018.09.009
This is a PDF file of an unedited manuscript that has been accepted forpublication. As a service to our customers we are providing this early version ofthe manuscript. The manuscript will undergo copyediting, typesetting, andreview of the resulting galley proof before it is published in its final citable form.Please note that during the production process errors may be discovered whichcould affect the content, and all legal disclaimers that apply to the journal pertain.
Genome-scale metabolic model; Chinese Hamster Ovary; Flux distribution; Model curation; Metabolic engineering
1. Introduction
Chinese Hamster Ovary (CHO) cells are the preferred hosts for the production of recombinant therapeutics proteins, especially as they are able to
perform post-translational modifications similar to those carried by endogenous human proteins, which reduces the risk of immunogenicity or low
efficacy of therapeutic proteins (Jefferis, 2016). Productivity achieved with mammalian cell culture processes has increased in the last years with
vector engineering, cell line development, process conditions and media optimization (Cacciatore et al., 2010; De Jesus and Wurm, 2011).
However, the time spent to adapt the best process conditions and feeding strategy to a new industrial recombinant cell line still remains
significant, as time-consuming empirical trials are the main reliable strategy for achieving high-yielding processes As production of GMP material
is on the critical path to first-in-man, accelerating the development and optimization of biopharmaceutical production has a direct impact on the
availability of the active pharmaceutical ingredient for patients. Furthermore, the industry needs to increase process yields while keeping high
quality standards to make the drug affordable for the health systems and ensuring access for patients (Li et al., 2014).
Moreover, to avoid any misincorporation in proteins due to depletion of amino acids (Khetan et al., 2010; Wen et al., 2009), medium optimization
studies often lead to fed-batch culture conditions where essential amino acids are not depleted during the process, and most of non-essential
amino acids are provided in sufficient quantities so that the cells can consume amino acids at maximal rates without exhaustion in the medium
(Reinhart et al., 2015). Exception has to be made for amino acids whose catabolism generates toxic by-products, such as glutamine catabolized
into glutamate and ammonium (Chen and Harcum, 2005). Thus, a detailed analysis of CHO cell metabolism is required to adapt feeding strategies
C. Calmels et al. / Metabolic Engineering
3
and cell culture media. It will efficiently identify bottlenecks that could explain suboptimal amino acid catabolism experimentally observed during
the process, thus resulting in improved cell growth, viability and process yields.
In order to enable such a fast and detailed metabolic analysis of production CHO cells, a consensus genome scale model (GSM) and cell line-
specific stoichiometric models have been recently reconstructed by a community of researchers (Hefzi et al., 2016). These models describe the
reaction network, accounting for all the known CHO-specific conversions of substrates into metabolic products and biomass components. CHO-
specific genome-scale metabolic models are built based on genomic and physiological information in a specific organism (Calmels et al.,
accepted). With the integration of a linear based programming framework, GSM can be used to compute enzymatic rates under defined
environmental conditions. CHO GSM enables in silico prediction of the effect of gene deletions, gene over-/under-expression, the possibility for
identification of metabolic targets to reduce toxic by-product formation, and the combination of other omics-data types in a single computational
framework (Kaas et al., 2014).
In this study, a cell line-specific model for CHO DG44 was developed as a support tool for interpretation of experimental data, in order to
understand better the pathways underlying cell growth and protein production in an industrially relevant cell culture process. The predicted
power of the initial model was improved by manual curation of the model. The curated model was tested with an industrial fed batch process of a
cell line producing a monoclonal antibody, by computing the daily flux distribution of the cells throughout the bioreactor production step.
2. Material and methods
2.1. Cell culture and extracellular metabolite analysis
2.1.1. Cell culture conditions
4 fed batch cell culture experiments were run independently, for which cell phenotype, variation of extracellular metabolite concentrations, and
process parameters were monitored. A CHO DG44 cell line producing mAb1 was cultivated in 2L stirred tank glass bioreactors, controlled by
supply towers (C-DCUII, Sartorius Stedim Biotech) and monitored by a multi-fermenter control system (MFCS, Sartorius). The cells were growing
under serum free conditions in a proprietary and chemically defined media. Precultures were cultivated in increased volume capacity of
Erlenmeyer flasks (Corning Inc, Germany) on a shaking device at 37°C and 5% O2 in a humid atmosphere. The starting culture volume was
C. Calmels et al. / Metabolic Engineering
4
identical for the different production run and the bioreactors were inoculated at similar target seeding density. The cultivation temperature was
kept constant at 36.8°C and the impeller used was a 3-segment blade impeller. During the cultivation, the pH was fixed at 7.0, with an allowable
variation of 0.2, and controlled by gassing CO2 and a sodium carbonate solution. Dissolved oxygen was maintained at 40% of the saturation
concentration. Continuous nutrient feeding was started 72 hours after inoculation, with predetermined rate using a proprietary, chemically
defined concentrated feed. The feed rate was adapted every day, following a predefined feeding profile. In addition to this continuous feed, a
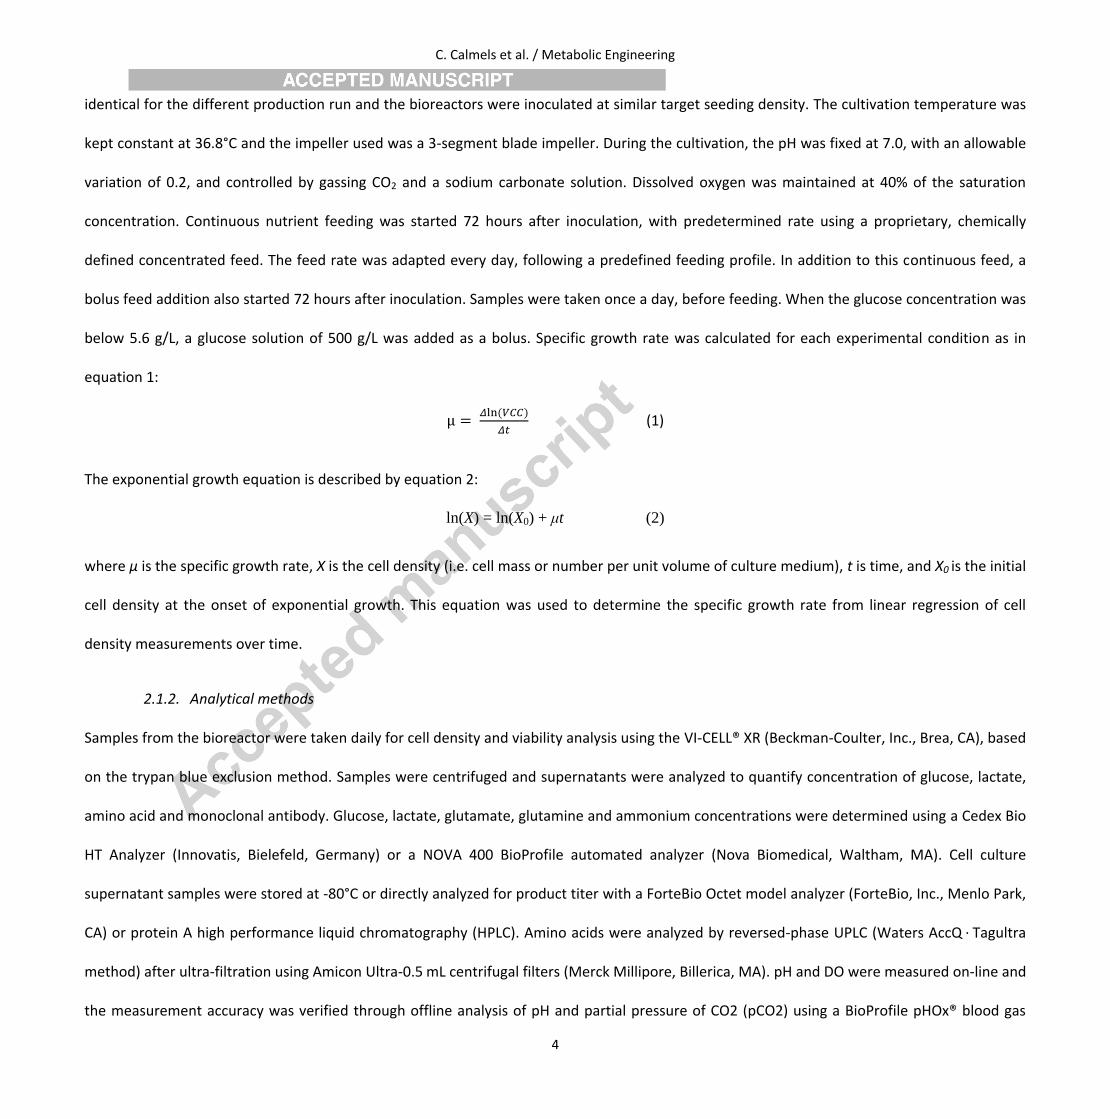
bolus feed addition also started 72 hours after inoculation. Samples were taken once a day, before feeding. When the glucose concentration was
below 5.6 g/L, a glucose solution of 500 g/L was added as a bolus. Specific growth rate was calculated for each experimental condition as in
equation 1:
(1)
The exponential growth equation is described by equation 2:
ln(X) = ln(X0) + μt (2)
where μ is the specific growth rate, X is the cell density (i.e. cell mass or number per unit volume of culture medium), t is time, and X0 is the initial
cell density at the onset of exponential growth. This equation was used to determine the specific growth rate from linear regression of cell
density measurements over time.
2.1.2. Analytical methods
Samples from the bioreactor were taken daily for cell density and viability analysis using the VI-CELL® XR (Beckman-Coulter, Inc., Brea, CA), based
on the trypan blue exclusion method. Samples were centrifuged and supernatants were analyzed to quantify concentration of glucose, lactate,
amino acid and monoclonal antibody. Glucose, lactate, glutamate, glutamine and ammonium concentrations were determined using a Cedex Bio
HT Analyzer (Innovatis, Bielefeld, Germany) or a NOVA 400 BioProfile automated analyzer (Nova Biomedical, Waltham, MA). Cell culture
supernatant samples were stored at -80°C or directly analyzed for product titer with a ForteBio Octet model analyzer (ForteBio, Inc., Menlo Park,
CA) or protein A high performance liquid chromatography (HPLC). Amino acids were analyzed by reversed-phase UPLC (Waters AccQ · Tagultra
method) after ultra-filtration using Amicon Ultra-0.5 mL centrifugal filters (Merck Millipore, Billerica, MA). pH and DO were measured on-line and
the measurement accuracy was verified through offline analysis of pH and partial pressure of CO2 (pCO2) using a BioProfile pHOx® blood gas
C. Calmels et al. / Metabolic Engineering
5
analyzer (Nova Biomedical Corporation, Waltham, MA). Cellular lipids were extracted based on Matyash method (Matyash et al., 2008),
separated by hydrophilic interaction liquid chromatography (HILIC) and detected by triple quadrupole mass spectrometry (Waters, Millford, MA).
Internal 13C labelled lipids standards provided by Avanti Polar Lipids (Alabaster, AL) were added prior to extraction to ensure an accurate
quantification.
2.2. Modeling procedure
2.2.1. Genome scale model used
A community genome scale metabolic network was recently reconstructed by different research groups (Hefzi et al., 2016), first by combining
two established genome scale reconstructions for Homo Sapiens (Recon 1 (Duarte et al., 2007) and Recon 2 (Quek et al., 2014)) and then by
manual curation to find CHO homologs to human genes (Hefzi et al., 2016). Genes that are specifically expressed in CHO DG44 cell lines were
identified and selected to generate a cell line specific model for CHO DG44, based on existing data used as input information in the Gene
Inactivity Moderated by Metabolism and Expression (GIMME) algorithm (Becker and Palsson, 2008).
For each cell line modeled, the reaction responsible for antibody production in the model was tailored to the antibody produced by the cell line
chosen. The stoichiometric coefficients of the amino acids required to produce the IgG were changed to the one corresponding to the specific
amino acid sequence of the antibody produced, thus generating a genome scale model for the cell line producing mAb1.
2.2.2. Theoretical approach for modeling
The modeling framework can be represented by a stoichiometric matrix (S) and a vector of reaction fluxes (v) indicating the reaction rates. The
basic steady state mass balance constraint can be enforced by the linear equation 5. Additional constraints can be introduced by restricting
fluxes with upper or lower bounds through inequality 6. To find the flux distribution, parsimonious enzyme usage Flux Balance Analysis (pFBA)
(Lewis et al., 2010) was employed. This optimization method is based on the assumption that the cell is using a minimum amount of enzymes to
reach a maximized objective, under the hypothesis of steady state. The mathematical formulation of the objective function is given by equation
3, and the requirement for the minimum absolute values among all the alternatives optima is described by equation 4. To find the flux
C. Calmels et al. / Metabolic Engineering
6
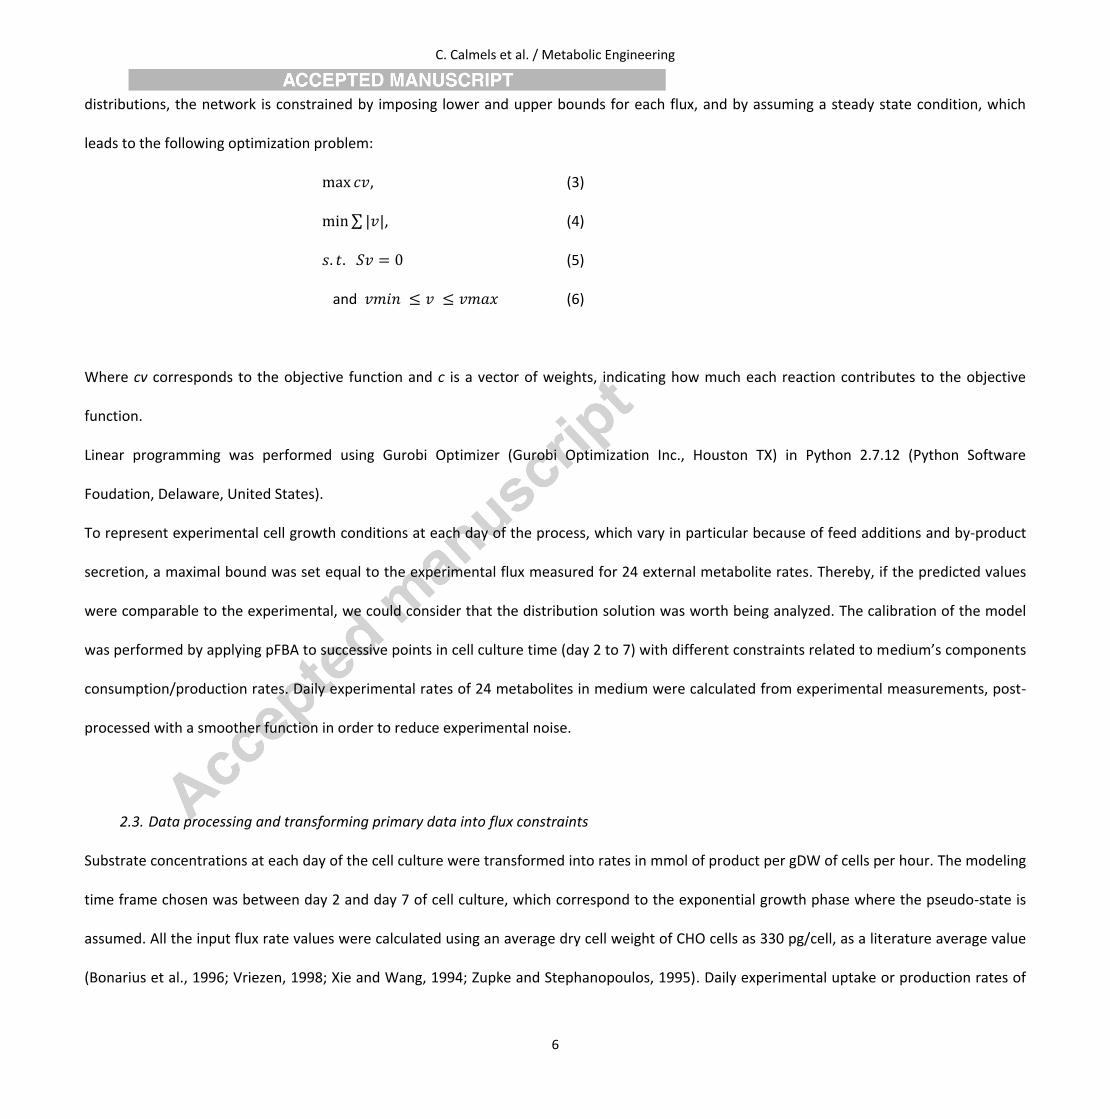
distributions, the network is constrained by imposing lower and upper bounds for each flux, and by assuming a steady state condition, which
leads to the following optimization problem:
, (3)
∑ , (4)
(5)
and (6)
Where cv corresponds to the objective function and c is a vector of weights, indicating how much each reaction contributes to the objective
function.
Linear programming was performed using Gurobi Optimizer (Gurobi Optimization Inc., Houston TX) in Python 2.7.12 (Python Software
Foudation, Delaware, United States).
To represent experimental cell growth conditions at each day of the process, which vary in particular because of feed additions and by-product
secretion, a maximal bound was set equal to the experimental flux measured for 24 external metabolite rates. Thereby, if the predicted values
were comparable to the experimental, we could consider that the distribution solution was worth being analyzed. The calibration of the model
was performed by applying pFBA to successive points in cell culture time (day 2 to 7) with different constraints related to medium’s components
consumption/production rates. Daily experimental rates of 24 metabolites in medium were calculated from experimental measurements, post-
processed with a smoother function in order to reduce experimental noise.
2.3. Data processing and transforming primary data into flux constraints
Substrate concentrations at each day of the cell culture were transformed into rates in mmol of product per gDW of cells per hour. The modeling
time frame chosen was between day 2 and day 7 of cell culture, which correspond to the exponential growth phase where the pseudo-state is
assumed. All the input flux rate values were calculated using an average dry cell weight of CHO cells as 330 pg/cell, as a literature average value
(Bonarius et al., 1996; Vriezen, 1998; Xie and Wang, 1994; Zupke and Stephanopoulos, 1995). Daily experimental uptake or production rates of
C. Calmels et al. / Metabolic Engineering
7
24 metabolites in medium were calculated from experimental measurements, post-processed with a smoother function in order to reduce
experimental noise and normalized with one value corresponding to a specific growth rate of the mAb 1 producing cell line. The experimental
variation can be explained by several factors, including the sensibility and technical variability of the analytical quantification method, but also
the degree of biological reproducibility inter-process.
Experimental production and consumption rates calculated were smoothed using a kernel smoother statistical function, in order to avoid
irregular data points and noisy observations obtained from experimental results.
Given a random sample (xi , yi) ∈ R2, i = 1,…n, with a continuous, univariate density f, the kernel function or weighting function Kλ(x) assigns a
weight to xi based on its distance from each query point x. The kernels Kλ are typically indexed by a parameter λ that dictates the width of the
neighborhood. For a given scale parameter λ, the weight sequence is defined by the equation below (Hastie et al., 2009) :
∑
∑
(7)
The Kernel smoother method was applied on calculated experimental flux rates with the support of the statistical software JMP. Suppl. Fig. 1
displays the example of arginine which exhibits relatively good correlation coefficients after smoothing. Smoothed experimental values were
considered as the more accurate approximation to model cell metabolism due to experimental noise.
The calculated and smoothed experimental values were then used to set the upper or lower limit of the consumption or production rate of the
metabolites measured daily in the extracellular environment. Exception was made for ammonium, alanine, and lactate that were set strictly
equal to the experimental value in order to constrain the model with the metabolic switch between consumption and production.
The final set of constrained metabolite exchanges comprised the uptake and secretion of 24 metabolites. The limitations for uptake and
production rates were set for each day of the time frame chosen for modeling the cell culture process. The objective function chosen was
maximization of growth. Estimation of metabolic fluxes was performed using CobraPy (Ebrahim et al., 2013).
2.4. Statistical analysis
C. Calmels et al. / Metabolic Engineering
8
For evaluating significant differences between means of datasets with replicates in different conditions, a one-way ANOVA was performed.
When significant, post hoc analysis was performed using Tukey’s honestly significant difference (HSD) to group data by means. All tests were
performed using JMP Software (SAS Institute Japan Ltd., Japan) and GraphPad Prism software (Version 7.02, Graphpad Software, San Diego, CA).
3. Results and discussion
3.1. Manual curation
The recent publication of the most complete genome scale model for CHO cells (Hefzi et al., 2016) has offered the industrial world a chance to
examine metabolic fluxes of production cell lines in different pathways and under distinct culture conditions. In bioprocess development cell
cultures, CHO cells exhibit a specific metabolic profile characterized in particular by elevated stress (Templeton et al., 2013). Thus to improve
quality of predictions, the initial model was adapted to a specific recombinant production cell line. Three types of modifications were required to
tailor the generic model to UCB’s recombinant production cell line: (i) removal of metabolic reactions from the network structure, as their
activation relied on unknown parameters based on thermodynamic and chemical constraints, or more general scientific knowledge, (ii) addition
of metabolic reactions either to complete the central carbon metabolism as described in Cricetulus griseus, or to adapt the genome scale model
to the metabolism of high yielding production cells, and (iii) change of reaction parameters in order to constrain the network as much as possible
according to literature, to obtain more biologically meaningful results. A total number of 601 reactions were modified to produce the tailored
genome scale model as detailed in the supplementary excel file. A first technical section describes modifications which aim at curating the model
to make it generally more functional with the available constraints, a second section gathers modifications that were observed as being
specifically related to the metabolism of high producers.
C. Calmels et al. / Metabolic Engineering
9
3.1.1. General modifications of the metabolic network made to increase prediction performances
3.1.1.1. Deletion of extracellular amino acid co-transporters
Initial modeling trials with Flux Balance Analysis on the generic DG44 model described infeasible solutions composed of isolated activated fluxes,
predicted to occur at the maximum upper limit of the supposedly unconstrained reactions, as it is common to choose an arbitrarily elevated
number to represent unconstrained fluxes (1000 mmol/gDW/h). Several actions were undertaken in order to increase the predictive power of
the initial model. The first action was to change directionality of reactions that import nutrients to lock them in one direction, in order to
uniquely allow consumption from the medium into the cell. The second action was the choice of a most suitable mathematical approach, namely
Parsimonious FBA, as this method has been shown in previous studies to avoid degeneracy of FBA solutions (Machado and Herrgard, 2014;
Toroghi et al., 2016). pFBA relies on the same principles as FBA, with an additional constraint on minimizing the sum of total fluxes across the
entire network (Lewis et al., 2010). The third action was taken after the main source of highly activated fluxes remaining in all the computed
solutions was identified at the level of amino acid transportation.
Indeed, as the model accurately represents mammalian cell composition, it contains all known types of amino acid transporters which are
assigned to a large number of different families. However in vivo the activation of one type over the other will mainly depend on dynamic
parameters that are not known and/or not included in the model. The constraints that are not considered in the model fall into the following
categories: substrate concentration gradient; maintenance of the electrochemical gradient, that may vary with movements of charged co-
transporters across membranes; charge, size and hydrophobicity of the molecules; flow regulation in response to binding of signaling molecule;
balance of osmotic pressure; regulation of intracellular pH; degree of saturation of the transporters; preferential substrates; interdependence of
secondary and tertiary active transporters, or inhibition/stimulation mechanisms which are not even well understood for all the transporters
(2002; GM., 2000). The complexity of the model was thus dramatically reduced by silencing 537 transporters (Supplementary excel file of all
reactions modified). No more inconsistencies of solutions containing loops characterized by high fluxes feeding each other were observed
(Thiele and Palsson, 2010). This removal of the transporters led to disappearance of infeasible cycles linked to amino acid uptake fluxes.
3.1.1.2. Manual curation to simplify mathematical modeling
C. Calmels et al. / Metabolic Engineering
10
The initial metabolic network contains identical reactions allocated to different cellular compartments, which is the case e.g. for the reaction
catalyzed by fumarase as illustrated in Suppl. Fig. 2. A literature research was conducted and the reaction has been shown to be mainly localized
in mitochondria (Bowes et al., 2007), so the cytosolic version of the reaction was removed from the model.
We observed that in some cases identical reactions allocated to different compartments could be activated together at high rates. This can be
visually identified in predictive flux distributions with the presence of internal cycles, defined by their capacity of revolving independently of the
rest of the network. The substrates of one reaction correspond to the products of the other across compartments, while using metabolites that
the cell is typically producing in excess (such as water, protons, sodium, present in numerous reactions in the model) or other metabolites which
synthesis would require valuable co-factors such as NADPH or ATP. Consequently, these internal cycles do not only involve the identified couple
of reactions but have an impact on the entire set of solution, leading to errors in the estimation of the objective function and redox balancing
(Zomorrodi et al., 2012).
Similarly, we identified reactions using either NADPH or NADH as cofactor that are systematically activated together at high rate in flux
distributions. The flux solution computed activation in high rates of these paired reactions containing similar substrates and products, using
NADPH as coenzyme in one direction and NADH in the opposite direction. As a matter of fact, a few enzymes can use both NADPH/NADH and
most show a strong preference for one over the other, for each internal cycle of this type identified, one of the reactions was removed based on
a literature and database research to select the true biological reaction to be activated. The removal was thus based on information from
BRENDA (Placzek et al., 2017) and KEGG databases, as well as literature (see Supplementary excel file of all reactions modified). If no information
could be found it was decided to remove the reaction using NADPH, using the rationale that an NADH-driven reaction is more likely as the total
concentration of NAD+/NADH in most tissues is about 10-5 M, whereas that of NADP+/NADPH is about 10-6 M (Blacker and Duchen, 2016; Boyle,
2005). The entire modifications resulting from the manual curation are listed in the supplementary excel file.
3.1.1.3. Addition of reactions
The initial genome scale model specific for CHO DG44 cells was extracted from a general consensus model with an algorithm based on gene
expression thresholds. As demonstrated recently (Opdam et al., 2017), the algorithm used for extraction and the gene expression threshold are
key decision parameters to build a cell line specific model and can significantly impact model content and accuracy.
C. Calmels et al. / Metabolic Engineering
11
In total, seven reactions were manually added (Table 1) to complete glycolysis, oxidative phosphorylation and TCA pathways as compared to the
pathways found in the KEGG database (Kanehisa et al., 2017; Kanehisa and Goto, 2000; Kanehisa et al., 2016) for Cricetulus griseus.
A new compartment named mitochondrial membrane (mm) was added in the model. As the reaction catalyzed by succinate dehydrogenase
(SDH) is inherent to the activity of complex II of respiratory chain (Cecchini, 2003; Lenaz and Genova, 2010), the reducing power FADH2
produced by SDH and used by complex II was assigned to this new compartment in order to make sure that the FADH2 produced by the
mitochondrial SDH is directly fueled in the electron transport chain. A directly measurable result can be visualized in Suppl. Fig. 3. The predicted
activity in complex II was increased in the curated model and the progression over time seems to follow the physiological conditions, if we
consider oxygen uptake rate experimentally measured during cell cultures as a marker of energy metabolism (Deshpande and Heinzle, 2004).
3.1.2. Modifications of the metabolic network directly related to high yielding production cells metabolism
C. Calmels et al. / Metabolic Engineering
12
3.1.2.1. Correction for activation of the oxidative stress pathway
Industrial production cell lines are subjected to elevated oxygen levels, and this highly activated aerobic cell metabolism generates continuously
free radical species that can impact cell performances and product quality (Ha et al., 2018; Selvarasu et al., 2012; Templeton et al., 2013). To
tailor the network to this specific metabolic trait related to high yielding production cells, the following modifications were applied: (i) deletion
of the reaction for H2O2 secretion; hydrogen peroxide being an unstable molecule, it quickly reacts with any present metabolite, so any
significant secretion cannot be representative of the biological reality, (ii) conservation of the cytochrome C oxidase reaction producing 2% of
superoxide to have a constant production of reactive oxygen species associated to cellular respiration (Turrens, 2003), (iii) a simplified version of
the antioxidant defense system was included by fusing the catalase and glutathione peroxidase reactions, as illustrated in Fig. 1, in order to have
them activated simultaneously when computing the solution. This global detoxifying reaction called “GTHP_CAT” was created as a balanced
equation of the two main antioxidant enzymes catalase and glutathione peroxidase (Weydert and Cullen, 2010), localized both in mitochondria
and cytosol (Table 2).
These modifications represent a major improvement in the model, as it allows activation of glutathione peroxidase reaction, and can be used to
have a more representative use of the substrates and products involved in regulation of oxidative stress. However, the global rate of the reaction
is only comparable to in vivo detoxification rates if there is a fixed ratio between catalase and glutathione peroxidase. At high H2O2 levels,
catalase has been shown to have a prominent role in mammalian cells (Ho et al., 2004) with an activity almost 100 times higher than glutathione
peroxidase quantified in CHO cells (Keizer et al., 1988). However in our knowledge this ratio has been shown as constant during cell culture, and
may be subject to variations. Overall, the modifications made allow a more precise prediction of the redox and antioxidant status of the cell at
different days of the cell culture. A more realistic NADPH/NADP+ requirement can be computed, so the model could also be used to define a
strategy for minimization of biological damages caused by oxygen-derived radicals.
C. Calmels et al. / Metabolic Engineering
13
Fig. 1. Pathways for generation of ROS by mitochondrial electron transport chain, included in the model. The balanced equations given by the addition of the reactions catalyzed by the enzymes catalase and GHS peroxidase were added in the model, named GTHP_CAT_m and GTHP_CAT_c, both in the mitochondrial and cytosolic compartment. Plain line : oxidative phosphorylation included in the initial model ; Dash lines : oxidative stress included in the initial model ; GSH and gthrd : reduced glutathione; GSSG and gthox : oxidized glutathione.
3.1.2.2. Mathematical compensation for lipid accumulation
Lipidomics data we generated (Suppl. Fig. 4) and recently published studies (Ali et al., 2018) have demonstrated the importance of lipid
metabolism for the phenotype of CHO cells cultivated in fed-batch production, which could also explain a large cell diameter observed with high
producers (Pan et al., 2017). There is experimental evidence that lipids accumulate in the cells towards the end of the process, especially
glycerophosphatidylinositol and triacylglycerol. For mammalian cells, this storage mechanism gives a competitive evolutionary advantage in case
of fluctuations in the composition of the extracellular medium, since they are able to accumulate lipid droplets to form a source of energy
C. Calmels et al. / Metabolic Engineering
14
storage (Farese and Walther, 2009). These lipid droplets are made of a phospholipid monolayer surrounding sterol esters and triacylglycerols,
and their growth seems to be associated to triacylglycerol synthesis. This information was included in the model with the addition of a constraint
on minimum production rate of triglyceride, and no strict constraints was fixed for lactate secretion. ANOVA found significant difference
between the 2 modeling conditions – considering and excluding triacylglycerol accumulation – from day 3 to day 0 included (p < 0.0003). In Fig.
2, pairwise comparisons were performed using Tukey’s HSD test with a family-wise confidence level of 95%. Flux rates extracting statistically
similar values were grouped and labeled accordingly. In the model, adding a constraint to consider a storage of triglycerides had a direct impact
on predictive lactate production rate, which was quantitatively comparable to measured rates without subverting the flux rate distribution
solution. In this regard, the tailored genome scale model is accurately representative of the metabolism of high producing cells and can even be
considered to be used as a complementary tool for the cell line selection process.
Fig. 2. Impact on the addition of predicted lipid accumulation on predicted lactate flux rate. The experimental data correspond to control processes of cell line CHO DG44_mAb 1 (n=3) and was computed independently to obtain the mean and standard deviation given when modeling using the genome scale model. The same upper and lower bounds were set each day in the two predictions. Label a is for experimental condition, b is predicted values. The prediction value corresponding to predicted lactate secretion rate (+ TG) has an additional constraint of a minimal daily triglyceride “accumulation” rate (lower bound set for “EX_tag_cho_e_” reaction). Values are normalized according to growth rate across all datasets. Conditions showing a statistical similar lactate flux rate were grouped together (group a or b) based on Tukey’s HSD (P < 0.05).
E x p e r im e n ta l la c ta te s e c re t io n ra te
2 3 4 5 6 7 8 9
-1 0
0
1 0
2 0
3 0
D a y
No
rm
ali
ze
d l
ac
tate
ra
te
P re d ic te d la c ta te s e c re t io n ra te
P re d ic te d la c ta te s e c re t io n ra te (+ T G )
aa
a
a
b
a
a
a
b
a
b
b
a
b
b
a
aa
b
b
b
b
a ,b
b
C. Calmels et al. / Metabolic Engineering
15
3.1.3. Summary of the curation process
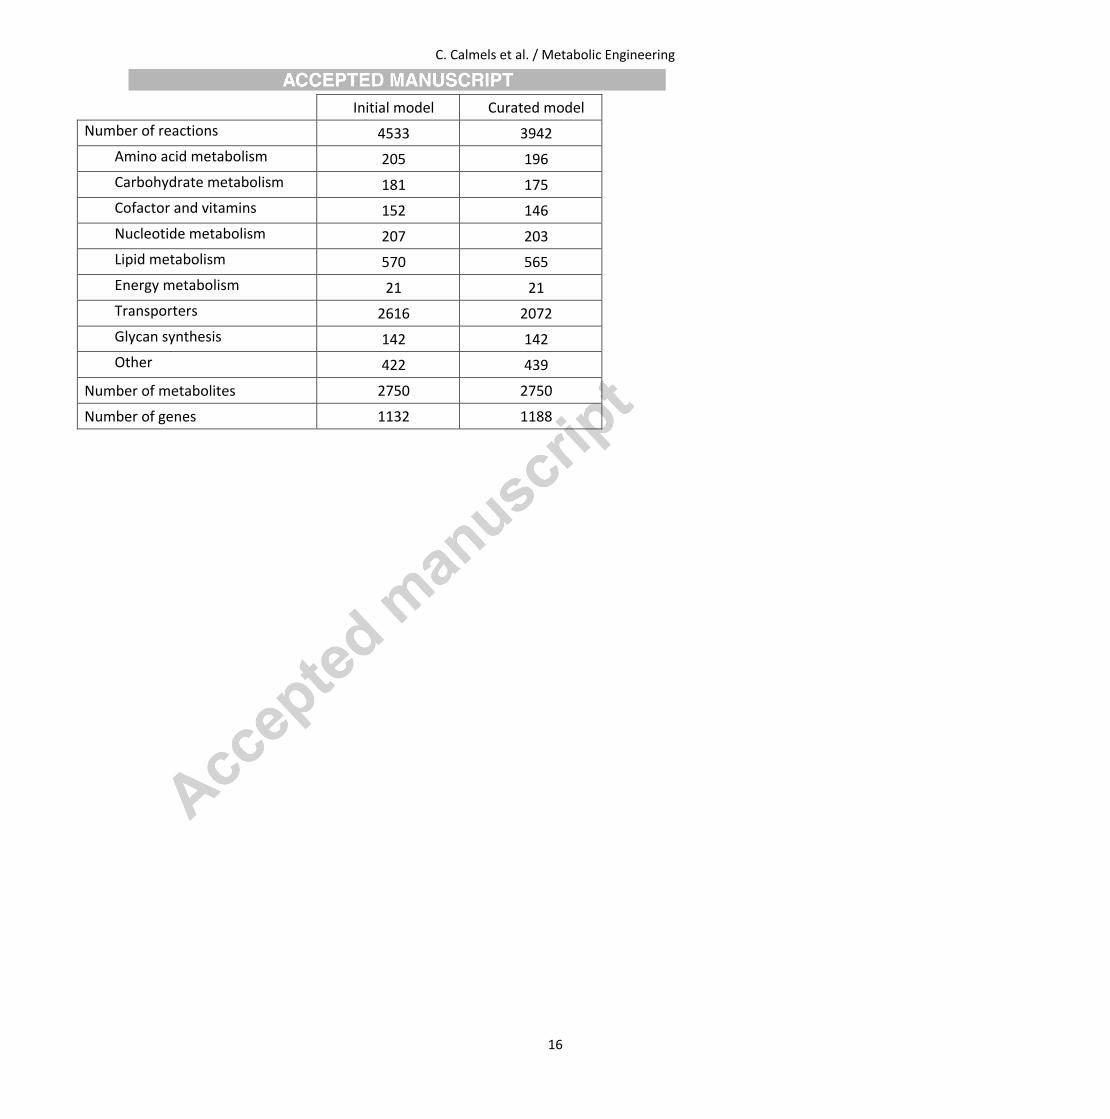
The final model consists of 3942 reactions, 2750 metabolites and 1188 genes as described in Table 2. The initial model was simplified in order
to match with the mathematical approach used and the available set of constraints applied. Moreover, the model was adapted to high yielding
cell metabolism and can be used to infer more knowledge about industrial processes. A pathway for oxidative stress was specifically designed
so that the impact of high oxygen concentration in cell culture process is more accurately represented. This addition in the model makes
possible to simulate cell adaptation to oxidative stress, by increasing levels of antioxidant defenses and by metabolizing larger amount of
glucose via the pentose phosphate pathway (Ahn and Antoniewicz, 2011). The role of lipid storage during cell culture was also included, which
makes a difference in the predictions in terms of flux distribution and correlates with in vivo observations. Considering lipid metabolism in cell
culture with the help of a genome scale model is one of the most adequate way of doing so, as lipid metabolism needs to be put in perspective
of the entire metabolic network: Lipids can have an impact at different metabolic levels on energy storage, nutrient intake, cell growth, and
regulation of cellular processes. Physiological features characterizing specifically high producing cell lines, such as those added in the curated
genome scale model, are important to capture accurate phenotypic predictions. Other important features can be considered in future work for
enhancing predictive power, such as the incorporation of a more complex amino acid import processes. In a recent study, 16 amino acid
transporters have been identified in abundance in high-producing recombinant cell lines, with a regulated coordinated antiport system to
supply amino acids, and variations in relative expression levels of transporters depending both on the metabolism of the engineered CHO cell
line and on amino acid concentration in cell culture medium (Geoghegan et al., 2018). Prediction of energy utilization and specific productivity
could also be improved by considering the level of difficulty associated to the folding step of a specific antibody (Le Fourn et al., 2014), as well
as the protein secretory pathway which has been identified as a bottleneck in some cases (Pieper et al., 2017; Rahimpour et al., 2013).
The resulting model is tailored to industrial cell lines and can be used with simple information as input, by adding constraints available from
daily metabolite concentration measurements in the culture medium.
Table 2 Comparison of the original and curated model.
C. Calmels et al. / Metabolic Engineering
16
Initial model Curated model
Number of reactions 4533 3942
Amino acid metabolism 205 196
Carbohydrate metabolism 181 175
Cofactor and vitamins 152 146
Nucleotide metabolism 207 203
Lipid metabolism 570 565
Energy metabolism 21 21
Transporters 2616 2072
Glycan synthesis 142 142
Other 422 439
Number of metabolites 2750 2750
Number of genes 1132 1188
C. Calmels et al. / Metabolic Engineering
17
3.2. Application of the curated model to one industrial cell line during fed batch production
In order to validate the manual curation performed, the model was tested for simulation of 4 independent 2L cell culture bioreactor run from a
known production process. The evaluation of the curated tailored model was based on the comparison of cell performances and
exometabolomics data with experimental data, and with knowledge available in literature.
3.2.1. The predicted phenotype of the industrial recombinant producing cell line is comparable with experimental observations
The cell count over time for the culture of a CHO DG44 cell line producing mAb1 grown in supplemented medium is presented in Suppl. Fig. 5.
This plot distinguishes a first period, from inoculation to day 7, where cell growth dominates the exponential phase. This time frame was
selected for modeling, as it was considered to be a key phase in cell culture. During this period, cell counts and antibody titer increase
respectively approximately 13- and 11-fold. Experimental specific growth rate decreases and specific productivity increases linearly from day 2 to
day 7. Therefore, during this time frame, most of the amino acid demands can be attributed to both cell proliferation and maintenance, as well
as product assembly for antibody production.
As daily sampling was performed before media additions, it was assumed that perturbations of metabolic steady state due to media additions
were negligible in a time frame of 20-24 hours (Segre et al., 2002). This time frame can be considered to be sufficient to achieve equilibration of
extra and intracellular equilibration of metabolites, thus to attain stationary values of macroscopic properties of the bioreactor (cell density and
metabolite concentrations). pFBA was applied from day 2 to day 7 of cell culture processes, when experimental specific growth rate shows a
linear evolution over time and cell death is negligible. After day 7, cell death becomes more important than cell growth, which currently cannot
be predicted well by the model.
3.2.2. The majority of metabolite secretion and production rates are predicted accurately by the tailored model
The model was semi-constrained with exometabolomics data and the four predictions were computed for each independent 2L run. By doing so
the goal was to verify that the biosynthetic growth requirements were comparable to the in vivo metabolic needs, and to some extend this semi
loose constraints were applied to calibrate the model with the available nutrients in the experimental growth environment.
C. Calmels et al. / Metabolic Engineering
18
3.2.2.1. Prediction of amino acid utilization
As amino acids are one of the most important set of metabolites for growth of mammalian cells and production of proteins, we wanted to see
how the model predicts their uptake and production.
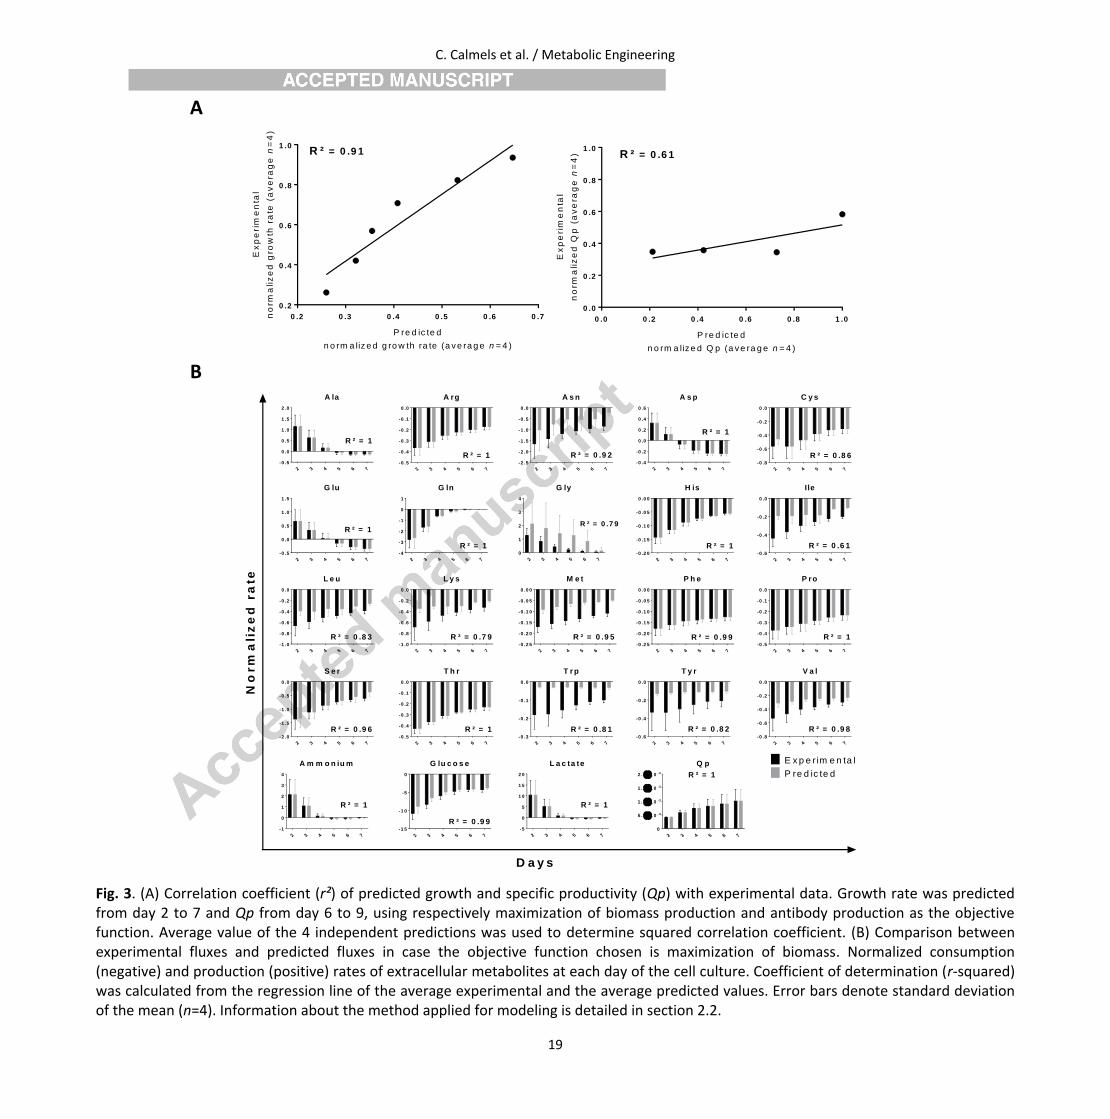
Fig. 3 shows the comparison between the predicted and the experimental value of the measured metabolites. Correlation coefficient is 0.91 for
predicted growth rate, which indicates a very reliable prediction when applying the tailored model to high yielding cells. Simulations were also
performed with changing the objective function to maximization of antibody production from day 6 to 9, and in this case correlation coefficient
of 0.61 indicates inaccurate predictions compared to experimental specific productivity. This inaccuracy can be explained by the fact that cells
keep growing by biomass during exponential phase and also during the stationary phase (Pan et al., 2017), thus the most appropriate objective
function to be applied during the chosen time frame is maximization of biomass production.
Among various amino acids, the highest consumption rates were observed for asparagine and serine both in vivo and in silico. High asparagine
consumption is linked to increased alanine, glycine and ammonia concentration during the process (Hansen and Emborg, 1994; Selvarasu et al.,
2012). Predicted consumption rates of the primary carbon sources, glucose and glutamine (Burgess, 2011), are strictly equal to the experimental
rate. At the early stage of the exponential phase, cells exhibit a high glucose consumption rate and a high lactate production resulting from a
high glycolytic rate. This is consistent with the Warburg effect, which is observed in culture of continuous cell lines under aerobic conditions and
describes a phenotype characteristic of tumor cell metabolism (Deberardinis et al., 2008). Ammonia secretion rate resulting from glutamine
consumption in the initial exponential phase significantly decreased after day 3, both for the predicted and experimental values. As shown in Fig.
3. B., 96% of the considered metabolites showed a correlation coefficient higher or equal to 0.8 with experimental value. In this regard, the
methodology applied for modeling reflects accurately the cellular metabolism in early exponential phase, at the level of nutrient source
utilization and cell performances.
C. Calmels et al. / Metabolic Engineering
19
A
B
Fig. 3. (A) Correlation coefficient (r²) of predicted growth and specific productivity (Qp) with experimental data. Growth rate was predicted from day 2 to 7 and Qp from day 6 to 9, using respectively maximization of biomass production and antibody production as the objective function. Average value of the 4 independent predictions was used to determine squared correlation coefficient. (B) Comparison between experimental fluxes and predicted fluxes in case the objective function chosen is maximization of biomass. Normalized consumption (negative) and production (positive) rates of extracellular metabolites at each day of the cell culture. Coefficient of determination (r-squared) was calculated from the regression line of the average experimental and the average predicted values. Error bars denote standard deviation of the mean (n=4). Information about the method applied for modeling is detailed in section 2.2.
0 .2 0 .3 0 .4 0 .5 0 .6 0 .7
0 .2
0 .4
0 .6
0 .8
1 .0
P re d ic te d
n o rm a liz e d g ro w th ra te (a v e ra g e n = 4 )
Ex
pe
rim
en
tal
no
rma
liz
ed
gro
wth
ra
te (
av
era
ge
n=
4)
R ² = 0 .9 1
0 .0 0 .2 0 .4 0 .6 0 .8 1 .0
0 .0
0 .2
0 .4
0 .6
0 .8
1 .0
P re d ic te d
n o rm a liz e d Q p (a v e ra g e n = 4 )
Ex
pe
rim
en
tal
no
rma
liz
ed
Qp
(a
ve
rag
en
=4
) R ² = 0 .6 1
2 3 4 5 6 7
-0 .5
0 .0
0 .5
1 .0
1 .5
2 .0
A la
R ² = 1
2 3 4 5 6 7
-0 .5
-0 .4
-0 .3
-0 .2
-0 .1
0 .0
A rg
R ² = 1
2 3 4 5 6 7
-2 .5
-2 .0
-1 .5
-1 .0
-0 .5
0 .0
A s n
R ² = 0 .9 2
2 3 4 5 6 7
-0 .4
-0 .2
0 .0
0 .2
0 .4
0 .6
A s p
R ² = 1
2 3 4 5 6 7
-0 .8
-0 .6
-0 .4
-0 .2
0 .0
C y s
R ² = 0 .8 6
2 3 4 5 6 7
-0 .5
0 .0
0 .5
1 .0
1 .5
G lu
R ² = 1
2 3 4 5 6 7
-4
-3
-2
-1
0
1
G ln
R ² = 1
2 3 4 5 6 7
0
1
2
3
4
G ly
R ² = 0 .7 9
2 3 4 5 6 7
-0 .2 0
-0 .1 5
-0 .1 0
-0 .0 5
0 .0 0
H is
R ² = 1
2 3 4 5 6 7
-0 .6
-0 .4
-0 .2
0 .0
I le
R ² = 0 .6 1
2 3 4 5 6 7
-1 .0
-0 .8
-0 .6
-0 .4
-0 .2
0 .0
L e u
R ² = 0 .8 3
2 3 4 5 6 7
-1 .0
-0 .8
-0 .6
-0 .4
-0 .2
0 .0
L y s
R ² = 0 .7 9
2 3 4 5 6 7
-0 .2 5
-0 .2 0
-0 .1 5
-0 .1 0
-0 .0 5
0 .0 0
M e t
R ² = 0 .9 5
2 3 4 5 6 7
-0 .2 5
-0 .2 0
-0 .1 5
-0 .1 0
-0 .0 5
0 .0 0
P h e
R ² = 0 .9 9
2 3 4 5 6 7
-0 .5
-0 .4
-0 .3
-0 .2
-0 .1
0 .0
P ro
R ² = 1
2 3 4 5 6 7
-2 .0
-1 .5
-1 .0
-0 .5
0 .0
S e r
R ² = 0 .9 6
2 3 4 5 6 7
-0 .5
-0 .4
-0 .3
-0 .2
-0 .1
0 .0
T h r
R ² = 1
2 3 4 5 6 7
-0 .3
-0 .2
-0 .1
0 .0
T r p
R ² = 0 .8 1
2 3 4 5 6 7
-0 .6
-0 .4
-0 .2
0 .0
T y r
R ² = 0 .8 2
2 3 4 5 6 7
-0 .8
-0 .6
-0 .4
-0 .2
0 .0
V a l
R ² = 0 .9 8
2 3 4 5 6 7
-1
0
1
2
3
4
A m m o n iu m
R ² = 1
2 3 4 5 6 7
-1 5
-1 0
-5
0
G lu c o s e
R ² = 0 .9 9
2 3 4 5 6 7
-5
0
5
1 0
1 5
2 0
L a c ta te
R ² = 1
2 3 4 5 6 7
0
5 .01 0 -4
1 .01 0 -3
1 .51 0 -3
2 .01 0 -3
Q p
R ² = 1
No
rm
ali
ze
d r
ate
D a y s
2 3 4 5 6 7
-0 .5
0 .0
0 .5
1 .0
1 .5
2 .0
A la
D a y s
No
rm
ali
ze
d r
ate
R ² = 1
P re d ic te d
E x p e r im e n ta l
C. Calmels et al. / Metabolic Engineering
20
3.2.2.2. Analysis of fluxes that drive metabolic switch from production to net consumption gives better understanding for medium
optimization
Metabolites such as alanine, aspartate, lactate and glutamate are produced in the early stage of the culture and a switch from production to
consumption is observed at day 4 (Fig. 3). The accumulation of some of the produced metabolites are responsible for a decreased cell growth
and antibody productivity (Duarte et al., 2014; Lao and Toth, 1997; Ozturk et al., 1992). As the mechanisms that trigger this metabolic shift are
unknown (Hartley et al., 2018), the model was used to analyze the rewiring of metabolic pathway and what can be done at the level of medium
composition to avoid any negative impact on cell growth.
3.2.2.2.1. Flux predictions describe alanine and lactate switch from production to consumption throughout the culture
Based on the predictions, alanine is entirely produced by alanine transaminase from day 2 to 5 and imported from the medium towards the end
of the culture. The shift from production to consumption at day 4 can be correlated to lactate shift, as lactate is no longer available for
conversion to pyruvate, cell metabolism redirects pyruvate fluxes to maintain flow to mitochondrial citric acid cycle. In silico, alanine is
consumed to form proteins for biomass formation as well as the low and heavy chain of the antibody, thus predicted alanine metabolism is in
agreement with literature (Suppl. Fig. 6) (Pereira et al., 2018; Sellick et al., 2015). As pyruvate resulting from intense early glycolytic activity is
converted to both lactate and alanine, pyruvate and glucose concentration in culture medium should be controlled at a low level at the
beginning of the process.
3.2.2.2.2. Genome scale model highlights important role of asparaginase in ammonium production
Accumulation of ammonium in the production medium has been shown to be inhibitory for cell growth and antibody productivity (Chen and
Harcum, 2005; McQueen and Bailey, 1990; Yang and Butler, 2000), thus the model was used to identify the different source of ammonium
production during the process. From day 2 to 5, ammonium is mainly produced by glutaminase, which catalyzes the hydrolysis of glutamine to
glutamate and ammonia (Suppl. Fig. 7). This initially high secretion of ammonium adds up to an overall constant ammonium production from
C. Calmels et al. / Metabolic Engineering
21
asparaginase and cysteine desulfhydrase. Ammonium is highly secreted at the early exponential phase, and a switch is observed after exhaustion
of glutamine in the medium. As glutamine requirement increases, glutamine synthetase is responsible for the minor NH4 uptake observed day 5,
6 and 7.
What is interesting to notice in these predictions, is the relatively high and steady production of ammonium due to asparaginase activity. This
observation seems to be confirmed by different studies (Pereira et al., 2018; Selvarasu et al., 2012). In order to assess the impact of ammonium
production from asparagine, we performed an experiment with higher amount of asparagine in the production medium and/or in the feed. As
shown in Suppl. Fig. 8, higher asparagine concentration in the medium leads to a consistently higher ammonium production rate towards the
end of the process. This elevated ammonium release is more likely to be the product degradation of asparaginase, as no ammonium
accumulation was measured in the medium alone supplemented with asparagine, kept under similar culture condition, thus excluding a natural
degradation of asparagine in the medium (data not shown). A possible way to reduce ammonium secretion would be to decrease asparagine
concentration, or to increase the concentration of the product of asparaginase, aspartate, to avoid generation of additional by-product in the
medium.
3.2.2.2.3. Extracellular glutamine depletion triggers redirection of fluxes to maintain glutamate requirements
Predicted glutamate catabolism is represented in Suppl. Fig. 9. Reactions catabolizing glutamate to replenish TCA cycle were grouped together
(phosphoserine transaminase, glutamate dehydrogenase and aspartate transaminase). The predicted consumption rate of glutamate for global
replenishment TCA cycle intermediates is higher than for protein synthesis at all days.
As glutamate is required for synthesis of glutamine from day 5, glutamine synthetase flux is activated to synthesize glutamine for glutamate and
thus its biosynthetic requirement increases to maintain elevated TCA activity and protein synthesis rate. Experimental glutamate uptake rate
increases from day 5 until day 7 to maintain energy and growth requirements. In the model glutamate contribution for protein synthesis remains
the same (about 10% of the net consuming fluxes).
C. Calmels et al. / Metabolic Engineering
22
Among the amino acids imported from the medium, arginine, phenylalanine, proline, tryptophan, tyrosine, and valine are predicted to be
entirely utilized for synthesis of biomass and antibody from day 2 to 7. However at day 5 and 6, isoleucine, leucine, lysine and proline are
catabolized to produce glutamate respectively by isoleucine transaminase, leucine transaminase and saccharopine dehydrogenase. The
predictions indicate that these metabolites are partially compensating increased glutamate requirement from day 5.
3.2.3. Conclusion of the analysis of predicted phenotype and exometabolomics rates
Amino acid metabolism consists of a complex network of reactions, and their catabolism during cell culture can vary according to the
environmental conditions. The predictions obtained for this process regarding catabolism of 96% of the amino acids are in correlation with the
general use of the nutrients in CHO cell culture (Grohmann and Bronte, 2010). As demonstrated, genome scale models are the most suitable tool
to analyze nutrient catabolism and sub consequent activation of reactions responsible for higher by-product secretions.
As a conclusion to this assessment study of the tailored genome scale model, the improvements and manual modifications performed have led
to a functional model that can be successfully applied to predict metabolic capabilities of industrial CHO cell producers in a robust manner. Both
the curated model and the methodology for simulation of the environmental conditions are validated, and further analysis is performed to gain
additional biological insights.
3.2.4. In silico analysis of intracellular flux distribution
The activity of 18 reactions covering important metabolic branch points are shown in Fig. 4.
C. Calmels et al. / Metabolic Engineering
23
Fig. 4. Major pathways of central carbon metabolism and predicted distribution of normalized intracellular fluxes from day 2 to 7 for independent 2L bioproduction processes (n=4 biological replicates).
C. Calmels et al. / Metabolic Engineering
24
A first metabolic phase can be identified from day 2 to 4, characterized by a high glycolytic and glutaminolytic metabolism. On day 2 and 3
respectively, 76% and 60% of pyruvate produced via glycolysis is secreted as lactate, which generates 2 moles of ATP per mole of glucose
consumed instead of 36 through oxidative phosphorylation. Although the energetic yield is lower compared to oxidative phosphorylation, the
high flux through aerobic glycolysis can produce ATP in large quantities and at a fast rate, as NAD+ recovered from lactate dehydrogenase can be
used to maintain glycolysis. On the other hand, glutamine is largely used to fuel the TCA cycle with 2-oxoglutarate, which complete oxidation
contributes to ATP production by the TCA cycle and electron transport chain.
High predicted flux through pentose phosphate pathway (PPP) in the first days allows generation of key intermediates for nucleotide metabolism
(ribose-5-phosphate), for fatty acid synthesis and for reduction of oxidative stress with reducing NADPH, which provides the cell with
bioenergetic resources that are essential for proliferation. PPP flux, characterized by a linear decrease towards the stationary phase, can be
compared with experimental results obtained with a 13C-based MFA study conducted on a fed batch cell culture process with CHO-K1 cells (Ahn
and Antoniewicz, 2011). By day 6, a significant decrease of NADH and NADPH production at different branches of the metabolism can be linked
to a drop of activity for complex I and antioxidant enzymes. The decreased enzymatic activity of the following reactions could worsen the
metabolic burden towards the end of cell proliferation: glucose 6-phosphate dehydrogenase, malate dehydrogenase, complex I of oxidative
phosphorylation and activity of antioxidant enzymes.
A second phase can be observed after day 4, with the exhaustion of glutamine possibly linked to an increased activity of IDH in order to
compensate a decreasing supply of oxoglutarate, and to a decreased activity of malate dehydrogenase, as pyruvate supply from glycolysis
decreases and its consumption rate through TCA cycle remains constant. Supplementing glutamine in the medium would not be an interesting
strategy as glutamine metabolism releases ammonia, which accumulation in the medium has been reported to be inhibitory or toxic to cells. A
different feeding strategy could be considered here with controlled additions of glutamine to maintain it at a low concentration from day 4.
Flow through glycolysis decreases with decreased growth rate towards day 7, similarly to the oxidative branch of the PPP and to acetyl-CoA
carboxylase, thus associated to a decreased production of fatty acids synthesis required for cell growth. However flow through TCA cycle is more
or less constant, except for malic enzyme and malate dehydrogenase which are balancing each other and are compensating a decreased income
of pyruvate through glycolysis (pyruvate kinase) from day 4, by re-directing malate to synthesis of pyruvate instead of oxaloacetate. Although
C. Calmels et al. / Metabolic Engineering
25
predicted oxygen uptake rate remains almost constant with a low variation between the run, ATP synthase activity significantly decreases in the
last days following the same trend as the complex I. According to these predictions, cell death seems to be preceded by an overall lower rate of
NADH production, possibly a triggering signal for apoptosis.
4. Conclusion
The initial CHO cell line specific GSM was modified in order to cope with constraints that are either not available or not applied in the chosen
mathematical representation of the metabolic network. The improved model was also modified by considering specific metabolic traits
observed in high producing cell lines. Thus this network was carefully and manually curated, firstly by identifying reactions that could not be
modeled accurately and by determining a rationale for simplification, and secondly by incorporating in the model information specific to
industrial cells used for recombinant protein production, regarding the adaptation of cells to oxidative stress under elevated oxygen conditions
and lipid storage. The results presented here showed that the flux distributions of the curated CHO DG44 specific line GSM was biologically
meaningful and yielded insights into cell metabolism. Predicted growth rate shows a very good correlation coefficient of 0.91 with experimental
growth, and 96% of the extracellular metabolites measured showed a coefficient higher than 0.8. Based on this high correlation the analysis of
the metabolic network was considered valid from day 2 to 7, and the predictions allowed to identify potential ways for medium optimization,
such as reducing the amount of asparagine. With the current knowledge integrated in the metabolic network, observations that can be drawn
from in silico analysis of cell metabolism at different days for the 4 independent 2L batches open up the opportunity for biological discovery and
understanding of cell machinery. During cell culture process, amino acid required for protein and biomass synthesis are predicted to be
increasingly redirected in anaplerotic reactions to support energy requirements. Intracellular analysis of cell metabolism can help to identify
bottlenecks and breaking point preceding death phase. The predicted evolution of energy metabolism is highly impacted by the activity of
pathways that produce and consume NAD+ and by the maintenance of a cellular NAD+/NADH balance. This ratio could be changed by over-
expressing specific enzymes to augment internal cellular energy metabolism towards the end of the exponential phase, as it has already been
C. Calmels et al. / Metabolic Engineering
26
performed with CHO cells (Gupta et al., 2017). If successful, we can imagine achieving extended culture time and delaying cell death, which
feeds high expectations for an increased cell productivity (Lee et al., 1998).
Funding
This work was supported by an H2020 Marie Sklodowska-Curie Actions ITN, grant number 642663.
References
2002. Molecular Biology of the Cell (4th Ed). Journal of Biological Education. 37, 45-47. Ahn, W. S., Antoniewicz, M. R., 2011. Metabolic flux analysis of CHO cells at growth and non-growth phases using isotopic tracers and mass spectrometry.
Metab Eng. 13, 598-609. Ali, A. S., Raju, R., Ray, S., Kshirsagar, R., Gilbert, A., Zang, L., Karger, B. L., 2018. Lipidomics of CHO Cell Bioprocessing: Relation to Cell Growth and Specific
Productivity of a Monoclonal Antibody. Biotechnol J. e1700745. Becker, S. A., Palsson, B. O., 2008. Context-specific metabolic networks are consistent with experiments. PLoS Comput Biol. 4, e1000082. Blacker, T. S., Duchen, M. R., 2016. Investigating mitochondrial redox state using NADH and NADPH autofluorescence. Free Radic Biol Med. 100, 53-65. Bonarius, H. P. J., Hatzimanikatis, V., Meesters, K. P. H., de Gooijer, C. D., Schmid, G., Tramper, J., 1996. Metabolic flux analysis of hybridoma cells in
different culture media using mass balances. Biotechnology and Bioengineering. 50, 299-318. Bowes, T., Singh, B., Gupta, R. S., 2007. Subcellular localization of fumarase in mammalian cells and tissues. Histochem Cell Biol. 127, 335-46. Boyle, J., 2005. Lehninger principles of biochemistry (4th ed.): Nelson, D., and Cox, M. Biochemistry and Molecular Biology Education. 33, 74-75. Burgess, D. J., 2011. Metabolism: Choose your carbon source. Nature Reviews Cancer. 11, 80-81. Calmels, C., Chintan, J., Nathan, E. L., Malphettes, Andersen, M. R., 2018. Adaption of Generic Metabolic Models to Specific Cell Lines for Improved
Modeling of Biopharmaceutical Production and Prediction of Processes. Advanced Biotechnology Book Series. (accepted) Cacciatore, J. J., Chasin, L. A., Leonard, E. F., 2010. Gene amplification and vector engineering to achieve rapid and high-level therapeutic protein
production using the Dhfr-based CHO cell selection system. Biotechnol Adv. 28, 673-81. Cecchini, G., 2003. Function and structure of complex II of the respiratory chain. Annu Rev Biochem. 72, 77-109. Chen, P., Harcum, S. W., 2005. Effects of amino acid additions on ammonium stressed CHO cells. J Biotechnol. 117, 277-86. De Jesus, M., Wurm, F. M., 2011. Manufacturing recombinant proteins in kg-ton quantities using animal cells in bioreactors. Eur J Pharm Biopharm. 78,
184-8. Deberardinis, R. J., Sayed, N., Ditsworth, D., Thompson, C. B., 2008. Brick by brick: metabolism and tumor cell growth. Curr Opin Genet Dev. 18, 54-61. Deshpande, R. R., Heinzle, E., 2004. On-line oxygen uptake rate and culture viability measurement of animal cell culture using microplates with integrated
oxygen sensors. Biotechnology Letters. 26, 763-767. Duarte, N. C., Becker, S. A., Jamshidi, N., Thiele, I., Mo, M. L., Vo, T. D., Srivas, R., Palsson, B. O., 2007. Global reconstruction of the human metabolic
network based on genomic and bibliomic data. Proc Natl Acad Sci U S A. 104, 1777-82. Duarte, T. M., Carinhas, N., Barreiro, L. C., Carrondo, M. J., Alves, P. M., Teixeira, A. P., 2014. Metabolic responses of CHO cells to limitation of key amino
acids. Biotechnol Bioeng. 111, 2095-106. Ebrahim, A., Lerman, J. A., Palsson, B. O., Hyduke, D. R., 2013. COBRApy: COnstraints-Based Reconstruction and Analysis for Python. BMC Syst Biol. 7, 74. Farese, R. V., Jr., Walther, T. C., 2009. Lipid droplets finally get a little R-E-S-P-E-C-T. Cell. 139, 855-60. Geoghegan, D., Arnall, C., Hatton, D., Noble-Longster, J., Sellick, C., Senussi, T., James, D. C., 2018. Control of Amino Acid Transport into CHO Cells.
Biotechnol Bioeng. GM., C., 2000. Transport of Small Molecules. . The Cell: A Molecular Approach. 2nd edition. . Sunderland (MA): Sinauer Associates. Grohmann, U., Bronte, V., 2010. Control of immune response by amino acid metabolism. Immunol Rev. 236, 243-64. Gupta, S. K., Srivastava, S. K., Sharma, A., Nalage, V. H. H., Salvi, D., Kushwaha, H., Chitnis, N. B., Shukla, P., 2017. Metabolic engineering of CHO cells for
the development of a robust protein production platform. PLoS One. 12, e0181455. Ha, T. K., Hansen, A. H., Kol, S., Kildegaard, H. F., Lee, G. M., 2018. Baicalein Reduces Oxidative Stress in CHO Cell Cultures and Improves Recombinant
Antibody Productivity. Biotechnol J. 13, e1700425.
C. Calmels et al. / Metabolic Engineering
27
Hansen, H. A., Emborg, C., 1994. Extra- and intracellular amino acid concentrations in continuous Chinese hamster ovary cell culture. Appl Microbiol Biotechnol. 41, 560-4.
Hartley, F., Walker, T., Chung, V., Morten, K., 2018. Mechanisms driving the lactate switch in Chinese hamster ovary cells. Biotechnol Bioeng. Hastie, T., Tibshirani, R., Friedman, J., 2009. The Elements of Statistical Learning. Springer-Verlag New York. Hefzi, H., Ang, K. S., Hanscho, M., Bordbar, A., Ruckerbauer, D., Lakshmanan, M., Orellana, C. A., Baycin-Hizal, D., Huang, Y., Ley, D., Martinez, V. S.,
Kyriakopoulos, S., Jimenez, N. E., Zielinski, D. C., Quek, L. E., Wulff, T., Arnsdorf, J., Li, S., Lee, J. S., Paglia, G., Loira, N., Spahn, P. N., Pedersen, L. E., Gutierrez, J. M., King, Z. A., Lund, A. M., Nagarajan, H., Thomas, A., Abdel-Haleem, A. M., Zanghellini, J., Kildegaard, H. F., Voldborg, B. G., Gerdtzen, Z. P., Betenbaugh, M. J., Palsson, B. O., Andersen, M. R., Nielsen, L. K., Borth, N., Lee, D. Y., Lewis, N. E., 2016. A Consensus Genome-scale Reconstruction of Chinese Hamster Ovary Cell Metabolism. Cell Syst. 3, 434-443 e8.
Ho, Y. S., Xiong, Y., Ma, W., Spector, A., Ho, D. S., 2004. Mice lacking catalase develop normally but show differential sensitivity to oxidant tissue injury. J Biol Chem. 279, 32804-12.
Jefferis, R., 2016. Posttranslational Modifications and the Immunogenicity of Biotherapeutics. J Immunol Res. 2016, 5358272. Kaas, C. S., Fan, Y., Weilguny, D., Kristensen, C., Kildegaard, H. F., Andersen, M. R., 2014. Toward genome-scale models of the Chinese hamster ovary cells:
incentives, status and perspectives. Pharmaceutical Bioprocessing. 2, 437-448. Kanehisa, M., Furumichi, M., Tanabe, M., Sato, Y., Morishima, K., 2017. KEGG: new perspectives on genomes, pathways, diseases and drugs. Nucleic Acids
Res. 45, D353-D361. Kanehisa, M., Goto, S., 2000. KEGG: kyoto encyclopedia of genes and genomes. Nucleic Acids Res. 28, 27-30. Kanehisa, M., Sato, Y., Kawashima, M., Furumichi, M., Tanabe, M., 2016. KEGG as a reference resource for gene and protein annotation. Nucleic Acids Res.
44, D457-62. Keizer, H. G., van Rijn, J., Pinedo, H. M., Joenje, H., 1988. Effect of endogenous glutathione, superoxide dismutases, catalase, and glutathione peroxidase
on adriamycin tolerance of Chinese hamster ovary cells. Cancer Res. 48, 4493-7. Khetan, A., Huang, Y. M., Dolnikova, J., Pederson, N. E., Wen, D., Yusuf-Makagiansar, H., Chen, P., Ryll, T., 2010. Control of misincorporation of serine for
asparagine during antibody production using CHO cells. Biotechnol Bioeng. 107, 116-23. Lao, M. S., Toth, D., 1997. Effects of ammonium and lactate on growth and metabolism of a recombinant Chinese hamster ovary cell culture. Biotechnol
Prog. 13, 688-91. Le Fourn, V., Girod, P. A., Buceta, M., Regamey, A., Mermod, N., 2014. CHO cell engineering to prevent polypeptide aggregation and improve therapeutic
protein secretion. Metab Eng. 21, 91-102. Lee, Y. S., Nakajima, H., Chang, Y. C., Park, K. I., Mitsui, Y., Magae, J., Saida, K., 1998. Alleviation of apoptosis by serum in Chinese hamster ovary cells
ectopically expressing human Fas antigen. Mol Cells. 8, 272-9. Lenaz, G., Genova, M. L., 2010. Structure and organization of mitochondrial respiratory complexes: a new understanding of an old subject. Antioxid Redox
Signal. 12, 961-1008. Lewis, N. E., Hixson, K. K., Conrad, T. M., Lerman, J. A., Charusanti, P., Polpitiya, A. D., Adkins, J. N., Schramm, G., Purvine, S. O., Lopez-Ferrer, D., Weitz, K.
K., Eils, R., Konig, R., Smith, R. D., Palsson, B. O., 2010. Omic data from evolved E. coli are consistent with computed optimal growth from genome-scale models. Mol Syst Biol. 6, 390.
Li, F., Vijayasankaran, N., Shen, A., Kiss, R., Amanullah, A., 2014. Cell culture processes for monoclonal antibody production. mAbs. 2, 466-479. Machado, D., Herrgard, M., 2014. Systematic evaluation of methods for integration of transcriptomic data into constraint-based models of metabolism.
PLoS Comput Biol. 10, e1003580. Matyash, V., Liebisch, G., Kurzchalia, T. V., Shevchenko, A., Schwudke, D., 2008. Lipid extraction by methyl-tert-butyl ether for high-throughput lipidomics.
J Lipid Res. 49, 1137-46. McQueen, A., Bailey, J. E., 1990. Effect of ammonium ion and extracellular pH on hybridoma cell metabolism and antibody production. Biotechnol Bioeng.
35, 1067-77. Opdam, S., Richelle, A., Kellman, B., Li, S., Zielinski, D. C., Lewis, N. E., 2017. A Systematic Evaluation of Methods for Tailoring Genome-Scale Metabolic
Models. Cell Syst. 4, 318-329 e6. Ozturk, S. S., Riley, M. R., Palsson, B. O., 1992. Effects of ammonia and lactate on hybridoma growth, metabolism, and antibody production. Biotechnol
Bioeng. 39, 418-31. Pan, X., Dalm, C., Wijffels, R. H., Martens, D. E., 2017. Metabolic characterization of a CHO cell size increase phase in fed-batch cultures. Appl Microbiol
Biotechnol. 101, 8101-8113. Pereira, S., Kildegaard, H. F., Andersen, M. R., 2018. Impact of CHO Metabolism on Cell Growth and Protein Production: An Overview of Toxic and
Inhibiting Metabolites and Nutrients. Biotechnol J. Pieper, L. A., Strotbek, M., Wenger, T., Gamer, M., Olayioye, M. A., Hausser, A., 2017. Secretory pathway optimization of CHO producer cells by co-
engineering of the mitosRNA-1978 target genes CerS2 and Tbc1D20. Metab Eng. 40, 69-79.
C. Calmels et al. / Metabolic Engineering
28
Placzek, S., Schomburg, I., Chang, A., Jeske, L., Ulbrich, M., Tillack, J., Schomburg, D., 2017. BRENDA in 2017: new perspectives and new tools in BRENDA. Nucleic Acids Research. 45, D380-D388.
Quek, L. E., Dietmair, S., Hanscho, M., Martinez, V. S., Borth, N., Nielsen, L. K., 2014. Reducing Recon 2 for steady-state flux analysis of HEK cell culture. J Biotechnol. 184, 172-8.
Rahimpour, A., Vaziri, B., Moazzami, R., Nematollahi, L., Barkhordari, F., Kokabee, L., Adeli, A., Mahboudi, F., 2013. Engineering the cellular protein secretory pathway for enhancement of recombinant tissue plasminogen activator expression in Chinese hamster ovary cells: effects of CERT and XBP1s genes. J Microbiol Biotechnol. 23, 1116-22.
Reinhart, D., Damjanovic, L., Kaisermayer, C., Kunert, R., 2015. Benchmarking of commercially available CHO cell culture media for antibody production. Appl Microbiol Biotechnol. 99, 4645-57.
Segre, D., Vitkup, D., Church, G. M., 2002. Analysis of optimality in natural and perturbed metabolic networks. Proc Natl Acad Sci U S A. 99, 15112-7. Sellick, C. A., Croxford, A. S., Maqsood, A. R., Stephens, G. M., Westerhoff, H. V., Goodacre, R., Dickson, A. J., 2015. Metabolite profiling of CHO cells:
Molecular reflections of bioprocessing effectiveness. Biotechnol J. 10, 1434-45. Selvarasu, S., Ho, Y. S., Chong, W. P., Wong, N. S., Yusufi, F. N., Lee, Y. Y., Yap, M. G., Lee, D. Y., 2012. Combined in silico modeling and metabolomics
analysis to characterize fed-batch CHO cell culture. Biotechnol Bioeng. 109, 1415-29. Templeton, N., Dean, J., Reddy, P., Young, J. D., 2013. Peak antibody production is associated with increased oxidative metabolism in an industrially
relevant fed-batch CHO cell culture. Biotechnol Bioeng. 110, 2013-24. Thiele, I., Palsson, B. O., 2010. A protocol for generating a high-quality genome-scale metabolic reconstruction. Nat Protoc. 5, 93-121. Toroghi, M. K., Cluett, W. R., Mahadevan, R., 2016. A Multi-Scale Model of the Whole Human Body based on Dynamic Parsimonious Flux Balance Analysis.
IFAC-PapersOnLine. 49, 937-942. Turrens, J. F., 2003. Mitochondrial formation of reactive oxygen species. J Physiol. 552, 335-44. Vriezen, N., 1998. Physiology of mammalian cells in suspension culture. Doctoral thesis. Wen, D., Vecchi, M. M., Gu, S., Su, L., Dolnikova, J., Huang, Y. M., Foley, S. F., Garber, E., Pederson, N., Meier, W., 2009. Discovery and investigation of
misincorporation of serine at asparagine positions in recombinant proteins expressed in Chinese hamster ovary cells. J Biol Chem. 284, 32686-94. Weydert, C. J., Cullen, J. J., 2010. Measurement of superoxide dismutase, catalase and glutathione peroxidase in cultured cells and tissue. Nat Protoc. 5,
51-66. Xie, L., Wang, D. I., 1994. Applications of improved stoichiometric model in medium design and fed-batch cultivation of animal cells in bioreactor.
Cytotechnology. 15, 17-29. Yang, M., Butler, M., 2000. Effect of ammonia on the glycosylation of human recombinant erythropoietin in culture. Biotechnol Prog. 16, 751-9. Zomorrodi, A. R., Suthers, P. F., Ranganathan, S., Maranas, C. D., 2012. Mathematical optimization applications in metabolic networks. Metab Eng. 14,
672-86. Zupke, C., Stephanopoulos, G., 1995. Intracellular flux analysis in hybridomas using mass balances and in vitro (13)C nmr. Biotechnol Bioeng. 45, 292-303.
Highlights
- A genome scale model specific for CHO DG44 cell line was manually adapted to the metabolism of industrial cell lines used for the production of
recombinant therapeutic proteins
- A modeling approach was defined for prediction of intracellular fluxes at different days of an industrial cell culture process
- The curated model can be used to get deeper insight into metabolism of cells cultivated in industrial processes