Application of AI to Oil Refineries and Petrochemical Plants Yokogawa Technical Report English Edition Vol.63 No.1 (2020) Application of AI to Oil Refineries and Petrochemical Plants Tetsuya Ohtani *1 Artificial intelligent (AI), machine learning, data science, and other advanced technologies have been progressing remarkably, enabling computers to handle labor- and time-consuming tasks that used to be done manually. As big data have become available, it is expected that AI will automatically identify and solve problems in the manufacturing industry. This paper describes how AI can be used in oil refineries and petrochemical plants to solve issues regarding assets and quality. INTRODUCTION V arious efforts are being made to achieve a sustainable society, such as developing resources and energies, preventing global warming, predicting and preventing disasters, supporting childcare and nursing care, and treating intractable diseases; progress in advanced science and technology is indispensable for all of these. In the manufacturing industry, the development of high value-added products and efficient production is desired while ensuring safe, stable operation. To achieve this, a wealth of knowledge and wisdom must be combined, and a platform based on AI, machine learning, data science, and other technologies are used (Figure 1). This paper first looks at the challenges in the oil refining and petrochemical industries, then introduces specific cases of applying AI to respective challenges (1)(2) , and finally outlines the future prospects. CHALLENGES AND REQUIREMENTS IN THE OIL REFINING AND PETROCHEMICAL INDUSTRIES One of the main challenges in the oil refining and petrochemical industries is to continue operating while maintaining production equipment. When a plant is forced to shut down due to equipment failure or human error, the loss is tremendous. Therefore, there is strong demand for technology to predict equipment failure. Once stable operation is achieved, the next goal is to improve productivity and maximize profits. Since huge amounts of energy are consumed for separation and other processes in the oil refining and petrochemical industries, it is also important to reduce energy consumption. Figure 1 AI, machine learning, data science, and a platform based on them In this paper, the challenges are divided into two categories: equipment problems and quality problems. Equipment problems require predicting failure as well as identifying root causes of failure and deterioration. Quality problems require visualizing various quality parameters in real time and identifying root causes of quality deterioration. These problems and their solutions are discussed in the following sections. PREVENTIVE MAINTENANCE Production equipment in the oil refining and petrochemical industries is regularly checked during scheduled maintenance. However, various parts of compressors, pumps, and other rotating equipment tend to wear out and deteriorate 7 7 *1 Digital Enterprise Solution Center, Digital Enterprise Business Headquarters
Transcript
Application of AI to Oil Refineries and Petrochemical Plants
Yokogawa Technical Report English Edition Vol.63 No.1 (2020)
Application of AI to Oil Refineries and Petrochemical PlantsTetsuya Ohtani *1
Artificial intelligent (AI), machine learning, data science, and other advanced technologies have been progressing remarkably, enabling computers to handle labor- and time-consuming tasks that used to be done manually. As big data have become available, it is expected that AI will automatically identify and solve problems in the manufacturing industry. This paper describes how AI can be used in oil refineries and petrochemical plants to solve issues regarding assets and quality.
INTRODUCTION
Various efforts are being made to achieve a sustainable society, such as developing resources and energies,
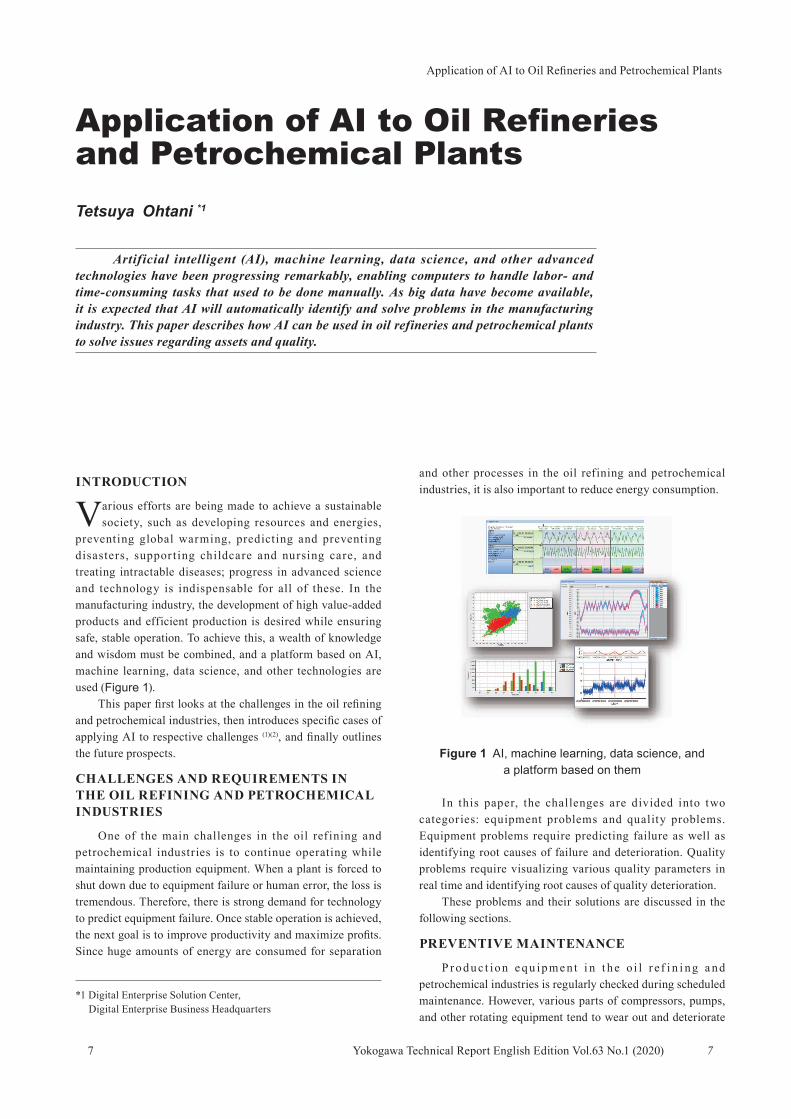
preventing global warming, predicting and preventing disasters, suppor ting childcare and nursing care, and treating intractable diseases; progress in advanced science and technology is indispensable for all of these. In the manufacturing industry, the development of high value-added products and efficient production is desired while ensuring safe, stable operation. To achieve this, a wealth of knowledge and wisdom must be combined, and a platform based on AI, machine learning, data science, and other technologies are used (Figure 1).
This paper first looks at the challenges in the oil refining and petrochemical industries, then introduces specific cases of applying AI to respective challenges (1)(2), and finally outlines the future prospects.
CHALLENGES AND REQUIREMENTS IN THE OIL REFINING AND PETROCHEMICAL INDUSTRIES
One of the main challenges in the oil ref ining and petrochemical industries is to continue operating while maintaining production equipment. When a plant is forced to shut down due to equipment failure or human error, the loss is tremendous. Therefore, there is strong demand for technology to predict equipment failure. Once stable operation is achieved, the next goal is to improve productivity and maximize profits. Since huge amounts of energy are consumed for separation
and other processes in the oil refining and petrochemical industries, it is also important to reduce energy consumption.
Figure 1 AI, machine learning, data science, and a platform based on them
In this paper, the challenges are divided into two categories: equipment problems and quality problems. Equipment problems require predicting failure as well as identifying root causes of failure and deterioration. Quality problems require visualizing various quality parameters in real time and identifying root causes of quality deterioration.
These problems and their solutions are discussed in the following sections.
PREVENTIVE MAINTENANCE
P ro d uc t ion e q u ipme nt i n t he o i l r e f i n i ng a nd petrochemical industries is regularly checked during scheduled maintenance. However, various parts of compressors, pumps, and other rotating equipment tend to wear out and deteriorate
7 7
*1 Digital Enterprise Solution Center, Digital Enterprise Business Headquarters
Application of AI to Oil Refineries and Petrochemical Plants
Yokogawa Technical Report English Edition Vol.63 No.1 (2020) 88
more quickly than expected due to fluctuations in the quality of f luid components and environmental conditions. This may lead to earlier performance deterioration or failure. Unexpected plant shutdowns cause enormous damage, so it is crucial to predict failures and take measures in advance. Quick planning and implementing a new or additional maintenance plan can minimize production losses.
Figure 2 Process variables and predicting abnormalities
Anomalies can be detected not only by direct means such as conventional vibration meters and ammeters but also by monitoring the process state. We are focusing on the latter approach, which detects the performance degradation and abnormalities of equipment at an early stage. For this purpose, machine learning is used to detect changes in the relation among various process variables compared with that during normal operation. The upper part of Figure 2 shows changes in process variables over time. An abnormality is clearly visible at the far-right of the graph. The lower graph shows the output values of a machine learning model, which is created using multiple process variables as inputs for detecting abnormalities early. The values in the lower graph rise much earlier than the raw process data in the upper graph. This suggests that the model can detect abnormalities earlier.
Since there are various types of abnormality, it is not always possible to detect them based on the past relation among process variables. Therefore, we also adopted another method, in which although an alarm is raised when the behavior of a process variable deviates from the usual, the subsequent action is left to human operators.
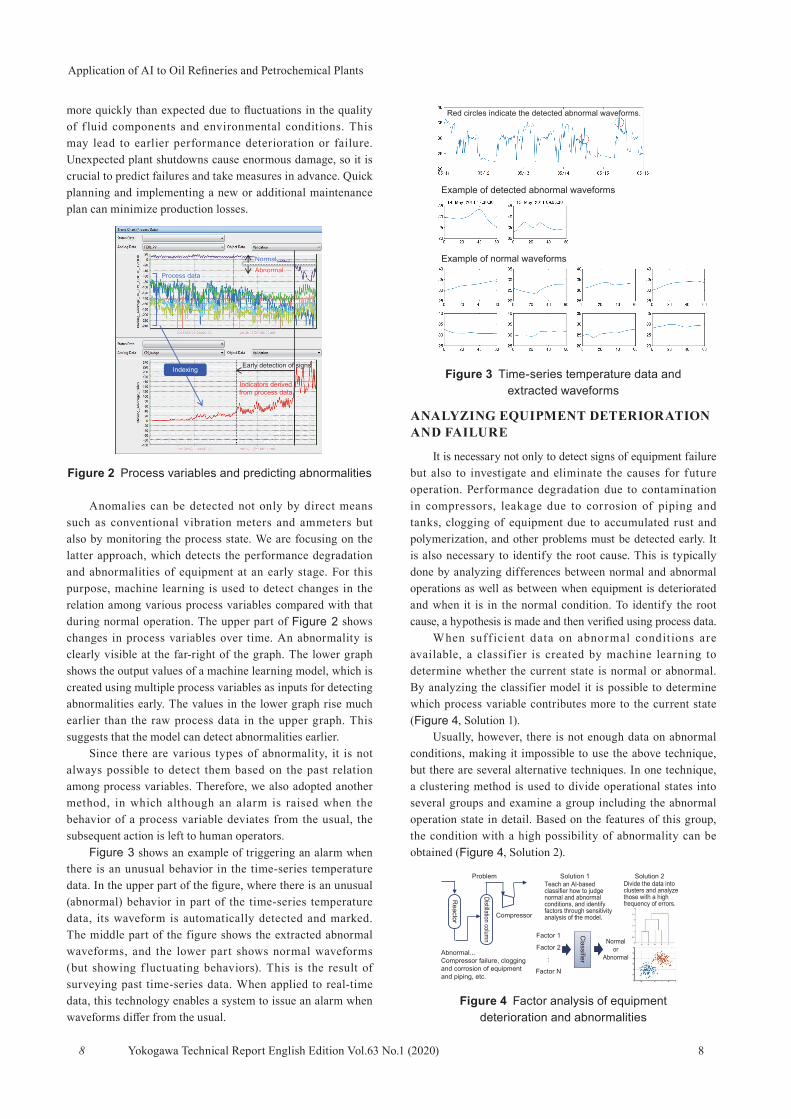
Figure 3 shows an example of triggering an alarm when there is an unusual behavior in the time-series temperature data. In the upper part of the figure, where there is an unusual (abnormal) behavior in part of the time-series temperature data, its waveform is automatically detected and marked. The middle part of the figure shows the extracted abnormal waveforms, and the lower part shows normal waveforms (but showing f luctuating behaviors). This is the result of surveying past time-series data. When applied to real-time data, this technology enables a system to issue an alarm when waveforms differ from the usual.
Figure 3 Time-series temperature data and extracted waveforms
ANALYZING EQUIPMENT DETERIORATION AND FAILURE
It is necessary not only to detect signs of equipment failure but also to investigate and eliminate the causes for future operation. Performance degradation due to contamination in compressors, leakage due to corrosion of piping and tanks, clogging of equipment due to accumulated rust and polymerization, and other problems must be detected early. It is also necessary to identify the root cause. This is typically done by analyzing differences between normal and abnormal operations as well as between when equipment is deteriorated and when it is in the normal condition. To identify the root cause, a hypothesis is made and then verified using process data.
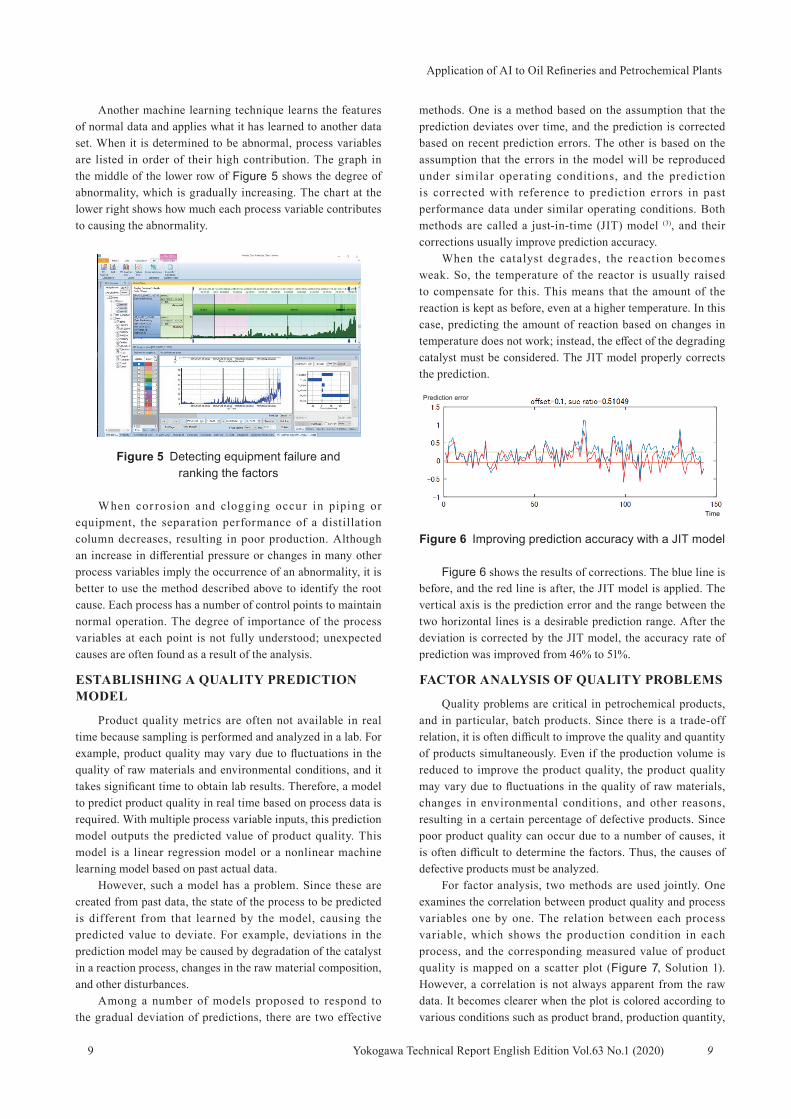
When suff icient data on abnormal condit ions are available, a classif ier is created by machine learning to determine whether the current state is normal or abnormal. By analyzing the classifier model it is possible to determine which process variable contributes more to the current state (Figure 4, Solution 1).
Usually, however, there is not enough data on abnormal conditions, making it impossible to use the above technique, but there are several alternative techniques. In one technique, a clustering method is used to divide operational states into several groups and examine a group including the abnormal operation state in detail. Based on the features of this group, the condition with a high possibility of abnormality can be obtained (Figure 4, Solution 2).
Figure 4 Factor analysis of equipment deterioration and abnormalities
AbnormalNormalAbnormalNormal
Process dataProcess data
Indicators derived from process data
Early detection of signsIndexing
Example of detected abnormal waveforms
Example of normal waveforms
Red circles indicate the detected abnormal waveforms.
Reactor
Distillation column
Compressor
Abnormal...Compressor failure, clogging and corrosion of equipment and piping, etc.
Divide the data into clusters and analyze those with a high frequency of errors.
Teach an AI-based classifier how to judge normal and abnormal conditions, and identify factors through sensitivity analysis of the model.
Classifier
Factor 1
Factor 2
:
Factor N
Normalor
Abnormal
Problem Solution 1 Solution 2
Application of AI to Oil Refineries and Petrochemical Plants
Yokogawa Technical Report English Edition Vol.63 No.1 (2020)
Another machine learning technique learns the features of normal data and applies what it has learned to another data set. When it is determined to be abnormal, process variables are listed in order of their high contribution. The graph in the middle of the lower row of Figure 5 shows the degree of abnormality, which is gradually increasing. The chart at the lower right shows how much each process variable contributes to causing the abnormality.
Figure 5 Detecting equipment failure and ranking the factors
When cor rosion and clogging occur in piping or equipment, the separation performance of a distillation column decreases, resulting in poor production. Although an increase in differential pressure or changes in many other process variables imply the occurrence of an abnormality, it is better to use the method described above to identify the root cause. Each process has a number of control points to maintain normal operation. The degree of importance of the process variables at each point is not fully understood; unexpected causes are often found as a result of the analysis.
ESTABLISHING A QUALITY PREDICTION MODEL
Product quality metrics are often not available in real time because sampling is performed and analyzed in a lab. For example, product quality may vary due to fluctuations in the quality of raw materials and environmental conditions, and it takes significant time to obtain lab results. Therefore, a model to predict product quality in real time based on process data is required. With multiple process variable inputs, this prediction model outputs the predicted value of product quality. This model is a linear regression model or a nonlinear machine learning model based on past actual data.
However, such a model has a problem. Since these are created from past data, the state of the process to be predicted is different from that learned by the model, causing the predicted value to deviate. For example, deviations in the prediction model may be caused by degradation of the catalyst in a reaction process, changes in the raw material composition, and other disturbances.
Among a number of models proposed to respond to the gradual deviation of predictions, there are two effective
methods. One is a method based on the assumption that the prediction deviates over time, and the prediction is corrected based on recent prediction errors. The other is based on the assumption that the errors in the model will be reproduced under similar operating conditions, and the prediction is corrected with reference to prediction errors in past performance data under similar operating conditions. Both methods are called a just-in-time (JIT) model (3), and their corrections usually improve prediction accuracy.
When the catalyst degrades, the reaction becomes weak. So, the temperature of the reactor is usually raised to compensate for this. This means that the amount of the reaction is kept as before, even at a higher temperature. In this case, predicting the amount of reaction based on changes in temperature does not work; instead, the effect of the degrading catalyst must be considered. The JIT model properly corrects the prediction.
Figure 6 Improving prediction accuracy with a JIT model
Figure 6 shows the results of corrections. The blue line is before, and the red line is after, the JIT model is applied. The vertical axis is the prediction error and the range between the two horizontal lines is a desirable prediction range. After the deviation is corrected by the JIT model, the accuracy rate of prediction was improved from 46% to 51%.
FACTOR ANALYSIS OF QUALITY PROBLEMS
Quality problems are critical in petrochemical products, and in particular, batch products. Since there is a trade-off relation, it is often difficult to improve the quality and quantity of products simultaneously. Even if the production volume is reduced to improve the product quality, the product quality may vary due to fluctuations in the quality of raw materials, changes in environmental conditions, and other reasons, resulting in a certain percentage of defective products. Since poor product quality can occur due to a number of causes, it is often difficult to determine the factors. Thus, the causes of defective products must be analyzed.
For factor analysis, two methods are used jointly. One examines the correlation between product quality and process variables one by one. The relation between each process variable, which shows the production condition in each process, and the corresponding measured value of product quality is mapped on a scatter plot (Figure 7, Solution 1). However, a correlation is not always apparent from the raw data. It becomes clearer when the plot is colored according to various conditions such as product brand, production quantity,
Time
Prediction error
9 9
Application of AI to Oil Refineries and Petrochemical Plants
Yokogawa Technical Report English Edition Vol.63 No.1 (2020)
and environment conditions. This is called stratification analysis, a conventional means for correlation analysis. The lower part of Figure 7 is an example of stratification. By excluding the data in a special operation mode, the correlation between product quality and an explanatory variable is revealed.
The second method analyzes a prediction model that outputs product quality. Its input is multiple process variables, which are candidates of factors (Figure 7, Solution 2). A linear regression model or a nonlinear machine learning model is used for this prediction model. Analysis of the model reveals how much each process variable contributes to product quality problems.
With either method, before drawing a scatter plot or creating a prediction model, it is necessary to effectively use the knowledge about the process and narrow down the process variables to ones with high relevance.
Figure 7 Factor analysis of quality problems
PROBLEM-SOLVING PROCESS
The AI-based problem-solving process is carried out in a few weeks or months following the five steps below.(a) Identifying problems: List problems in the process,
prioritize them in order of their impact and difficulty, and decide what problem to focus on. The target problem should be one where sufficient data will be available and whose effect can be quantified when it is solved.
(b) Collecting data: Collect available information and data, and review the purpose of solving the problem.
(c) Forming a hypothesis: List measures effective for solving the problem and prioritize them.
(d) Analyzing: Organize and verify the data based on the hypothesis. Use all obtained data and car ry out an extensive analysis. Create a solution from both approaches.
(e) Repor t i ng: P repa re a repor t . New problems and improvements often emerge in this step. Analysts and people in charge of the process should have frequent meetings; it is important to obtain the results by using each other’s knowledge.
CONCLUSION
This section discusses the future prospects.
Cooperation with a SimulatorIf data are scarce, the results of the AI-based analysis
often fall short of expectations. Therefore, there have been attempts to generate the data necessary for learning through rigorous process simulations. Thousands, tens of thousands, or even more cases are simulated with various combinations of input conditions to obtain data, which are input to a machine learning model. After learning, the machine learning model can perform tasks such as predictions, case studies, and optimization at high speed.
Another way of using process simulation is to draw up measures after the machine learning model detects anomalies in the process.
RoadmapAI plays a crucial role in prediction based on the analysis
of process data, and its most important feature is that it can derive excellent results even if analysts do not have strong domain knowledge and analysis skills. If process data to be input are available, AI creates a model that can solve the problem
At present, however, it is still humans who identify problems and select the necessary data. With extensive human intervention, AI is used to achieve results (Human-driven AI).
In the future, AI is expected to become more autonomous: it will periodically examine data to discover problems and solve them (Data-driven AI).
Ultimately, AI will transform simple f indings into knowledge and use it for other processes (Knowledge-driven AI) (Figure 8).
Figure 8 Roadmap of AI application
REFERENCES
(1) Tetsuya Ohtani, “Examples of using AI in the manufacturing industry: collaboration between humans and machines,” The Society of Separation Process Engineers, Japan, Vol. 50, No. 2, 2020 (in Japanese)
(2) Tetsuya Ohtani, “Digital data improvement ,” Hydrocarbon Engineering, Vol. 25, No. 3, 2020, pp. 69-74
(3) Kimito Funatsu and Masahiro Kaneko, “Introduction to soft sensors: from fundamentals to practical study examples,” Corona Publishing, 2014 (in Japanese)
Process 1
Process 2
Process 3
Process 4
Process 5
Analyze the correlation among quality measurements in each process
An AI-based regression modeling tool is used to create a quality estimation model and factors are identified through sensitivity analysis of the model.
Regression model
Factor 1
Factor 2
:
Factor N
Product quality
Fluctuation in product quality
Problem Solution 1 Solution 2
Human AI
Process data
Knowledge
Human
AI
Process data
Human
Process data
AI
Human-driven AI Data-driven AI Knowledge-driven AI
Current situation Future
Human workers gather data and use AI.
AI autonomously analyzes data.
AI accumulates knowledge and applies it to other processes.