HAL Id: hal-01538046 https://hal.archives-ouvertes.fr/hal-01538046 Submitted on 15 Apr 2019 HAL is a multi-disciplinary open access archive for the deposit and dissemination of sci- entific research documents, whether they are pub- lished or not. The documents may come from teaching and research institutions in France or abroad, or from public or private research centers. L’archive ouverte pluridisciplinaire HAL, est destinée au dépôt et à la diffusion de documents scientifiques de niveau recherche, publiés ou non, émanant des établissements d’enseignement et de recherche français ou étrangers, des laboratoires publics ou privés. Application of an Advanced GTN Model Joseph Fansi, Anne-Marie Habraken, Tudor Balan, Xavier Lemoine, Caroline Landron, Eric Maire, Olivier Bouaziz, Mohamed Ben Bettaieb To cite this version: Joseph Fansi, Anne-Marie Habraken, Tudor Balan, Xavier Lemoine, Caroline Landron, et al.. Applica- tion of an Advanced GTN Model. ASME 2012 11th Biennial Conference on Engineering Systems De- sign and Analysis, Jul 2012, Nantes, France. pp.589-597, 10.1115/ESDA2012-82995. hal-01538046
Transcript
HAL Id: hal-01538046https://hal.archives-ouvertes.fr/hal-01538046
Submitted on 15 Apr 2019
HAL is a multi-disciplinary open accessarchive for the deposit and dissemination of sci-entific research documents, whether they are pub-lished or not. The documents may come fromteaching and research institutions in France orabroad, or from public or private research centers.
L’archive ouverte pluridisciplinaire HAL, estdestinée au dépôt et à la diffusion de documentsscientifiques de niveau recherche, publiés ou non,émanant des établissements d’enseignement et derecherche français ou étrangers, des laboratoirespublics ou privés.
Application of an Advanced GTN ModelJoseph Fansi, Anne-Marie Habraken, Tudor Balan, Xavier Lemoine, Caroline
Landron, Eric Maire, Olivier Bouaziz, Mohamed Ben Bettaieb
To cite this version:Joseph Fansi, Anne-Marie Habraken, Tudor Balan, Xavier Lemoine, Caroline Landron, et al.. Applica-tion of an Advanced GTN Model. ASME 2012 11th Biennial Conference on Engineering Systems De-sign and Analysis, Jul 2012, Nantes, France. pp.589-597, �10.1115/ESDA2012-82995�. �hal-01538046�
The present contribution consists of implementing an advanced GTN damage model as a "User Material subroutine" in the Abaqus FE code. This damage model is based on specific nucleation and growth laws. This model is applied to the prediction of the damage evolution and the stress state innotched specimens made of dual phase steel. By comparing numerical predictions with experimental results based on high-resolution X-ray absorption tomography, the numerical approach was improved and validated.
One of the most powerful damage modeling laws was introduced by Gurson [8]. Using mathematical models and experimental observations, he broke down this phenomenon into two components: nucleation and growth of voids. Numerous authors have extended the original Gurson model to take into account plastic anisotropy, mixed hardening of matrix or nucleation and coalescence of voids. Tvergaard and Needleman [14] introduced the nucleation and coalescence constant parameters (q1, q2, q3), while plastic anisotropy was
developed by Benzerga [4], advanced-isotropic hardening was studied by Pardoen [12] etc.
Motivated by industrial needs, an extended advanced GTN model [2] has been developed by Ben Bettaieb and co-workers [3] which includes a more accurate model plastic anisotropy, kinematic hardening, and a void nucleation law based on experimental X-Ray tomography observations (Landron et al.) [9]. The first section of the present paper introduces the GTNB (Gurson, Tvergaard, Needleman, Ben Bettaieb) model. The second section describes its numerical integration. The third section tests the law using one-element simulation with Abaqus/Explicit and gives some description on the material studied. In the last section, the GTNB model is applied to a notched tensile specimen calculation and compared with measurements using high-resolution X-ray absorption tomography.
The main goal of this damage law is to predict the void volume fraction evolution with the stress rate in a dual-phase (DP) steel.
The total strain representing the matrix and voids is
divided into e and p elastic and plastic contributions:e p Eq.1
The elasticity law simply states
1
:e eC Eq.2
where is the macroscopic Cauchy stress tensor and eC is
the elasticity matrix (isotropic and linear). The plastic flow rule is defined by the normality relationship in associated plasticity:
0 0;
0 0pp P
p
if FFif F
0 f0;PFFFpp PFPF
0 f0Eq.3
The anisotropic GTN yield function Benzerga [4] reads2
221 32
32 cosh 1 0eqv mp
Y Y
qF q f q f2eqv 2eqv 2eqv 11 Eq.4
where : : the shifted or effective stress tensor defined as the difference
between the Cauchy stress tensor and the back stress tensor of the macroscopic medium ( ) (matrix + voids).
: the anisotropic equivalent shifted stress (with respect to the Hill criterion). is assumed to be equal to
where is the Hill matrix defined as a
function of the Lankford coefficients (Annex).
: the yield stress of the dense matrix only, defined by a function related to the matrix hardening.
: the macroscopic mean shifted stress (matrix + void) equal to σ . It must be noted that the spherical part of the back stress is very small compared to the mean normal stress (it is function of the spherical part of the plastic strain which remain also small). So the use of the mean shifted stress or of the mean normal stress does not change significantly the numerical predictions.
: the porosity or the void volume fraction.
are three material parameters initially introduced by Tvergaard and Needleman (Tvergaard, et al., 1984) [14] and used to better match FE cell calculations, within the code they are material parameters, so the user can choose other values for and than the one defined above, but automatically derived from value.
κ: this parameter reflects the influence of the plastic anisotropy. This parameter, derived by Benzerga and Besson [4] from a micromechanical analysis, is a function of the Lankford coefficients . For isotropic materials, the parameter is equal to 2.
DP steel is constituted of Martensitic islands embedded in a Ferritic ductile matrix. The mechanical choice for modeling this microstructure is to apply the Hill anisotropic yield function modified with a Benzerga coefficient [4] (expression in Appendix) and coupled with the mixed hardening law Ben
Bettaieb [2]. The hardening model is defined by the well known isotropic Swift law (Eq.5), and by Amstrong-Frederick (Arndt et al.) [1] for the kinematic part (Eq.6).
0( )p nY mK Eq.5
Where K , n and 0 are material parameters and represents the equivalent plastic strain in the dense matrix only
* * *1(1 ) ; ( )p p
eqvX q f X X C s X* ((** ( * )p** Eq.6
C and s are material parameters, pp is the macroscopic
plastic strain rate and peqvp
eqv is its equivalent value defined as: 12( : : )p p p
eqv H 12( : : )p p p12( : :1eqv 2( : :: ::1p 2( :eqv
Eq.7 1H is the pseudo-inverse of Hill’s anisotropy matrix
(expression in Appendix).
The work equivalence principle in this case reads:: (1 )p p
Y mf ) p) Y m)) Y: (1: (1p (1(1(1(1(1(1 Eq.8
Following Bouaziz [5] the void nucleation and growth are described by relations different from the usual ones in Gurson type model.
2.1 Void nucleation kineticThe numerical void density N (number of nucleated voids
per mm³) is related to T(Triaxiality) and by the following relationship:
Eq.9
where: A: constant equal to 5000 voids/ mm³.
critical value of the strain for which nucleation starts. : critical strain when a pure shear is applied (T=0). A
value of 0.8, for this critical strain in shear, provides a good fit for N evolution compared to experimental measurements. T: the Triaxiality . It is a local value computed by the FE code at each Integration Point as the ratio between the mean stress/ equivalent stress. These stresses are the one computed within the (matrix + void) medium, for kinematic hardening they are the shifted values . However for the experimental observation, the triaxiality is a constant value through the whole macroscopic material. In the case of a notch or non notch tensile test, it expressed in Equation (Eq10).
Eq10
with ; (calculated from Bridgman [6]).S0 and S are the initial and the current surfaces of the
necking section.).
exppl pl
eqv eqv
N N
N A 0 exp N N T
2
2.2 Void growth kinetic The evolution of the mean void radius R is defined by the
Rice and Tracey model [13] but modified by Bouaziz [4] and Maire [11] as expressed:
εε Eq11
The second term in Eq.11 is the reduction due to nucleation of the average radius of the cavities compared to the initial Rice and Tracey model. Indeed, it is easy to check that this last equation reduces to the classic Rice and Tracey model when the nucleation rate dN is equal to zero.
is the mean radius of cavities just after nucleation and before the beginning of the growth phase. At each deformation stage of the specimen, the growth of existing voids and the nucleation of new voids are observed. The radii of the differentnucleated voids at the observation of their nucleation and before any growth stage are not constant. constitutes the average value of these initial radii, as assumed by Eq.12, this average radius is dependent on the equivalent plastic strain (matrix+ void). The expression of is empirical.
ε ε Eq.12 Where:
is equal to 2.35μm and is taken to be equal to 0.25 according Ben Bettaieb [2], theses values are material parameters that the user can define from experiment.
The discrete, incremental constitutive equations are integrated with an explicit scheme for the porosity and an implicit one for the others. The complete set of equations of the constitutive model was rearranged in a condensed form of eight non-linear equations (Ben Bettaieb et al.) [3] and solved by an iterative Newton-Raphson method. This nonlinear system consists of: - The GTN yield function:
( , , , ) 02p t tF f qp Y Eq.13
- The consistency condition:
0F Fp pp q
eqv m Eq.14
-The plastic work equivalence principle:
0(1 )
m p eqv qpmatrix f y
m p eqv qm p eqvp eqvp eqvpp eqvEq.15
Where pmatrix voidplastic , q plastic
matrix voideqv ,
- And the flow rule, defining the unit-length deviatoric direction of plastic strain (5 unknowns) :
:1 5 2
H dneqv
d Eq.16
The unknowns of this system are ( , , , )p q p nmat . The8 equations are solved with the Newton-Raphson method for a non-linear system. The GTNB model has been developed and tested within Lagamine (FE implicit software developed in ULg) [17]. In the current work, the law has been implemented and tested with one element in Abaqus-explicit through a VUMAT user subroutine.
A single element with 8 nodes and one integration point has been modeled to simulate an uniaxial tensile test in Abaqus/explicit and Lagamine (implicit code) (Zhu et al.) [17].The length of the cubic element at initial time is 1 mm. The boundary conditions are applied and a velocity field is introduced in the X direction as illustrated figure 1. The element chosen for Abaqus is C3D8R and the counterpart for Lagamine is BWD3D (Duchêne et al.) [7]. The set of material parameters is applied to the studied Dual Phase material.
Fig 1: Uniaxial tensile test simulated in Lagamine and Abaqus/explicit.
Table 1 reveals the chemical composition of the DP11 steel (commercial grade name) used in this study. According to Landron thesis [10] this grade stands for 11% of volume fraction of martensite.
Table 1 : Chemical composition of the DP11 steel (*10-3wt.%).
Material C Mn Si Cr P,S
DP11 0.08 0.8 0.23 0.68 traces
Rice and Tracey modeling
Bouaziz et al. modeling
3
The optical micrograph of the DP11 (fig. 2a) describes a bi-phased microstructure with Ferrite in light and martensite indark gray. In the DP 11 steel, according to Landron et al. [9] studies, the ferrite phase prevails and the islands of martensite appear to be isotropic and surrounded by the ferrite. The 3D holotomography image (fig. 2b) reveals martensite islands distribution in gray and ferrite phase is transparent.
a) b)Fig 2: a) Optical micrograph of the DP11's microstructure (Ferrite in light gray and martensite in dark gray). b) Volume using holotomography (martensite in gray and ferrite transparent) by Landron PhD-Thesis [10].
The material data for DP11 are listed in Table 2a and 2b. The first line is applies to the full GTNB model of DP11 material and the second line defines the GTNB material parameter set to recover a virtual material characterized by Von Mises yield locus with an isotropic hardening law of Swift type, no damage model, no kinematic hardening. If the first line allows the simulation to recover experimental behavior of DP11 steel, the second line provides just results for code comparison, the true behavior of DP11 could be simulated only with Swift law (in case of no unloading) but the Swift parameters should be adapted (Cx=0,Ssat=0, A=0, ).
Table 2a :Elasticity and plasticity parameters of DP11 GTNB.
Table 2b :Damage and porosity parameters of DP11.
The comparison between Lagamine and Abaqus/explicit simulations underscores a very good similarity in terms of stress, volume fraction of porosity, number of porosity nucleated ( fig.3, fig4, fig5).
Fig 3 : Uniaxial stress-strain curves, comparison between the predictions of Lagamine and Abaqus/explicit codes for DP11 material.
Fig 4 : Porosity evolution curves, comparison between the predictions of Lagamine and Abaqus/explicit codes for DP11 material.
Fig 5 : Number of voids, comparison between the predictions of Lagamine and Abaqus/explicit codes for DP11 material.
5.1 Experimental ConditionsThe GTNB model described in this paper has been applied
on a cylindrical notched specimen (1mm initial diameter at critical zone) to predict the damage evolution during a tensile test. The in-situ tensile test results, to be compared with, have been obtained by using high-resolution X-ray absorption
4
tomography (Landron [10], Weck [15], Bouaziz [5]). The specimen has been mounted on a rotation stage of the tomograph (Fig.11) and the applied displacement speed was between 1μms-1 and 5μms-1.
Fig 6 : In-situ X-ray experimental device at the ID15A beamline with a 1mm×1mm notched sample [10].
Figure 7a shows the notched axisymetric specimen used for measurement and simulation. The volume chosen for the in situ damage evolution measurement is at the center of the specimen and equal to 300μm³ as seen in Figure 7b.
a b Fig 7: a) 1mm notched axisymetric specimen. b) 300μm³ volume chosen for the damage measurement [10].
5.2 SimulationThe in-situ tensile test (Fig 6) has been modeled in 2D
(axisymetric simulation) by meshing one fourth of a 1mm notched axisymetric specimen (Fig 7) in Abaqus/explicit. A small finite element size has been introduced to be in agreement with the volume (300μm³) chosen by Landron [9] during the measurement process at the center. The boundary conditions and the applied velocity field are described in figure 8. The model has 11000 CAX4R elements and 11000 nodes.
Fig 8 : Boundary conditions and velocity field applied on one fourth of a 1mm notched axisymetric.
The isovalues of the stress component in axial direction, the triaxiality factor (T), the total voids per mm³ (N, Eq.9), the mean void radius (R, Eq.11) and the porosity f are presented in fig.9 at the moment when the maximum plastic strain was close to unity in the minimal section. The damage variables and the axial stress are at a maximum at the core of the notch due to the high concentration of the plastic deformation and the triaxiality.
5
Fig 9: Tensile test on notched specimen: isovalues at maximum plastic strain close to unity.
The triaxiality value evolution computed by Eq 17 from the values rsection and RNotch predicted by the GTNB simulation (fig.10) follows closely the experimental average triaxiality obtained by using Bridgman method re-assessed [16] see Eq.17. Here rsection and RNotch are defined by the experiment.
1 2 ln 13 2
Section
Notch
rTR
Eq.17
where rSection the radius of the necking section (perpendicular to Y axis) and RNotch(in plane X-Y) evolve during the tensile test .
Fig 10: Tensile test on 1mm notched specimen: Triaxiality comparison between GTNB prediction and the test.
The axial strain is defined here as a local value, constant for the section y=0.
Axial strain = ln (initial radius R0²/ actual radius R²) where R0 is defined in Figure8.
The GTNB model predicts very well the porosity growth until 0.4 axial strain compared to the experimental curve (fig.11). It has to be highlighted that only growth and nucleation is modeled. Coalescence and fracture criterion parts are missing in this advanced GTN law.
Fig 11: Tensile test on 1mm notched specimen: porosity evolution comparison between GTNB prediction and the test at the center of the specimen.
The Total number of voids per mm³ predicted by the simulation at the center of the notched specimen is in perfect agreement with the experimental measurements as shown in figure 12. Simulation and experiment start to diverge at 0.5 the axial strain due to the coalescence phenomenon. After 0.7 the correlation is not more possible due to the fracture process according to Landron [9] X-ray tomography observations as seen in figure 12.
Fig 12: Tensile test on 1mm notched specimen: Total voids nucleated evolution comparison between GTNB prediction and
6
the testing at the center of the specimen. X-Ray tomography observations [10].
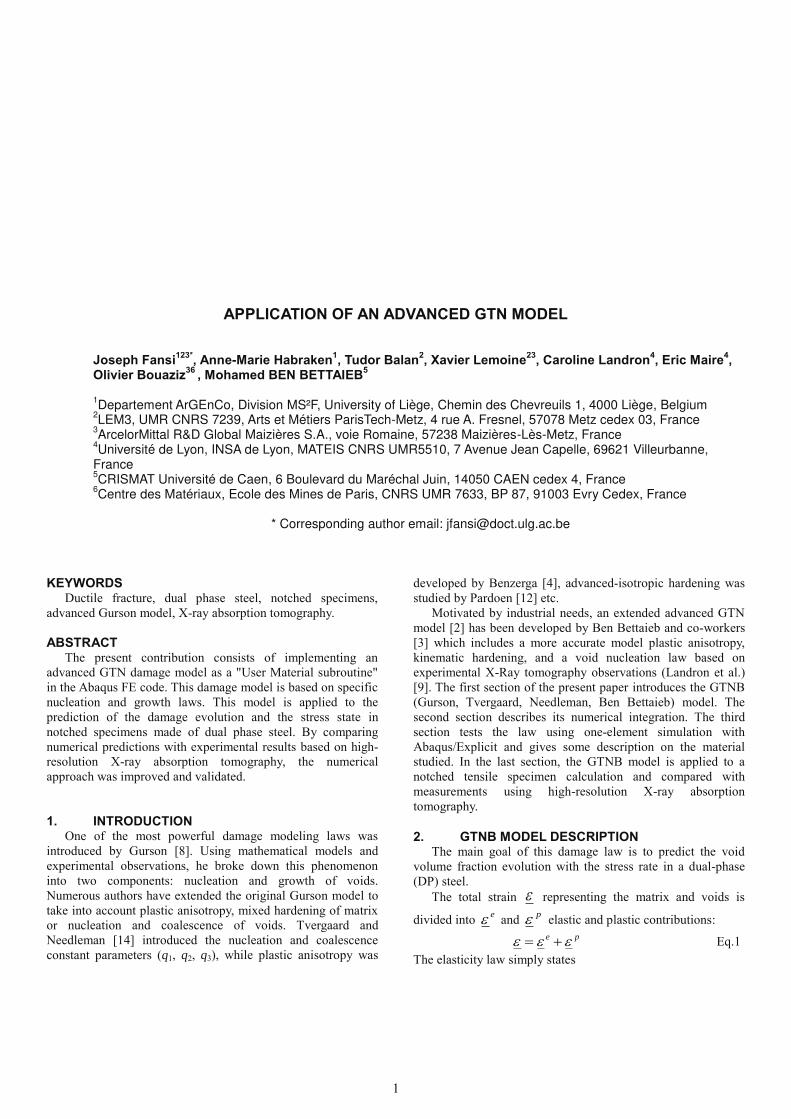
The last comparison concerns the mean void radius evolution of the total voids population (fig 13). The correlation between the simulation and the experiment is good and the evolution can be considered constant or with a very low evolution during loading. When the axial strain reaches 0.5, the correlation cannot be made due to the coalescence and fracture phenomena. The coalescence effect makes the tomography measurement quasi impossible because the voids population is very dense (see fig 12 at 0.83 axial strain).
Fig 13: Tensile test on 1mm notched specimen: equivalent radius evolution comparison between GTNB prediction and experiment at the center of the specimen.
The GTNB model, extension of classical Gurson-Tvergaard-Needleman has been applied for the simulation of a tensile notch test performed on a DP11 steel. The results obtained show a very good comparison with experimental results in terms of the triaxiality factor (T), total number of voids per mm³ (N), the mean void radius (R) and porosity f. Further improvements of the GTNB law will be the modeling of the coalescence step and fracture phenomenon. Also in target, industrial applications are scheduled.
The authors acknowledge Arcelor-Mittal Research S.A., the Interuniversity Attraction Poles Program - Belgian State –Belgian Science Policy (P6/24) and the ANR – Agence Nationale de la Recherche (France) for their support.
[1] Arndt S., Svendsen B. and Klingbeil D.Modellierung der Eigenspannungen und der Rißspitze mit einem Schagi-gungsmodell // Technische Mechanik. - 1997. - 17. - pp. 323-332.
[2] Ben Bettaieb M. [et al.] Numerical modeling of damage evolution of DP steels on the basis of X-ray tomography measurements // Mechanics of Materials. - 2010. - pp. 139-156.
[3] Ben Bettaieb M. [et al.] On the numerical integration of an advanced Gurson model // International Journal for Numerical Methods in Engineering / ed. (wileyonlinelibrary.com). Published online in Wiley Online Library. - 2009. - p. DOI: 10.1002/nme.3010.
[4] Benzerga A.A. and Besson J. Plastic potentials for anisotropic porous solids // Eur. J. Mech. A-Solids. - 2001. - 20. - pp. 397-434.
[5] Bouaziz O. [et al.] A model for initiation and growth of damage in dual phase steels identified by X-ray micro-tomography // Rev. Met.. - 2008. - 2. - pp. 102-107.
[6] Bridgman P.W. Effects of hydrostatic pressure on the plastic properties of the metals // Rev.Mod.Phy. - 1945. - 17. - pp. 3-17.
[7] Duchêne L., EL Houdaigui F. and Habraken A-M.Length changes and texture prediction during free end torsion test of copper bars with FEM and remeshing techniques International Journal of Plasticity // International Journal of Plasticity. - 2007. - Issues 8 : Vol. 23. - pp. 1417-1438.
[8] Gurson A.L. Continiuum theory of ductile rupture by void nucleation and growth part 1-yield criteria and flow rules for porous ductile media // J.Eng Mater Technol. - 1977. - 99. - pp. 2-15.
[9] Landron C. [et al.] Characterization and modeling of void nucleation by interface decohesion in dual phase steels //Scripta Materilia. - 2010. - 10 : Vol. 63. - pp. 973-976.
[10] Landron C. Ductile damage characterization in Dual-Phase steels using X-ray tomography // PhD thesis/ -INSA-Lyon, 2011.
[11] Maire E. [et al.] Initiation and growth of damage in a dual-phase steels observed by X-ray microtomography // Acta Materialia. - 2008. - 18 : Vol. 56. - pp. 4954-4964.
[12] Pardoen T. Numerical simulation of low stress triaxiality ductile fracture // Comput. Struct. - 2006. - 84. - pp. 1641-1650.
[13] Rice J.R. and Tracey D.M. On the ductile enlargement of voids in triaxial stress fields // Journal of the Mechanics and Physics of solids. - 1969. - Issues 3 : Vol. 17. - pp. 201-217.
7
[14] Tvergaard V. and Needleman A. Analysis of the Cup-cone Fracture in a Round Tensile Bar // Acta Metall. - 1984. - 32. - pp. 157-169.
[15] Weck A. The role of coalescence on ductile fracture // PhD thesis / University. - McMaster, Canada , 2007.
[16] Wierzbicki T. and Bao Y. Bridgman Revisited: On the History Effect on Ductile Fracture // Massachusetts Institute of Technology. - Cambrigde,MA : [s.n.], 2004.
[17] Zhu Y.Y., Cescotto S. and Habraken A.M. A fully coupled elastoplastic damage modeling and fracture criteria in metalforming processes // Journal of Materials Processing Technology. - 1992. - Issues 1-2 : Vol. 32. - pp. 197-204.
8
HILL MATRIX
;
PSEUDO INVERT HILL MATRIX
11122
22
11
2 / 0 0[ ] 0
; [ ] 0 2 / 00 [ ]
0 0 2 /
4 2 2 2 21[ ] 2 2 4 2 2
9 ( )2 2 2 2 4
NB
H B NB
N
H G F H F G G H FB H F G H G F F H G
H G H F G FG H F F H G F G H
Κ CALCULATION (FROM BENZERGA AND BESSON [7])
The coefficient κ introduced into the cosh of the yield function.
1 2 3
1 2 2 3 1 3 4 5 6
1 1 11.6 0.8h h hh h h h h h h h h
0 90 0 0 901 2 1
0 0 90 0
0 90 903 1 4 1
0 90 90 0 90 90
0 90 455 1 6 1
0 90 0
2 2 3( 1)2 ; 13 1 2 2
3 ( 1) 3( 1)1 ; 0.52 2 2 2
3 ( 1) (20.5 ; 0.52 2
r r r r rh h hr r r r
r r rh h h hr r r r r r
r r rh h h hr r r
90
0 90 0
1) ( 1)2 2
rr r r
The coefficient κ is equal to 2 when the plasticity of the matrix is isotropic.