Page 1
1
Application of computational fluid dynamics models to aerodynamic
design and optimization of wind turbine airfoils
E. Castiñeira-Martínez, I. Solís-Gallego, J. González, J. Fernández Oro,
K. Argüelles Díaz and S. Velarde-Suárez
Área de Mecánica de Fluidos, Departamento de Energía
Universidad de Oviedo
Edificio Departamental Este, Campus Universitario, 33203 Gijón, España (Spain)
Phone: +0034 985 182101, e-mail: [email protected]
Abstract
In this work, the capability of simple numerical models with coarse grids to predict performance
coefficients in wind turbine airfoils is explored. A wide range of simulations were performed for a typical
wind turbine profile, under the main criteria of design simplicity and low calculation time. The solutions
were computed over different mesh sizes using a two-dimensional Reynolds-Average Navier-Stockes (2D-
RANS) approach. Spalart-Allmaras, k-ε and k- turbulence models were run in the simulations. Lift,
drag and momentum coefficients were computed for four incident angles, ranging from -2.5 to 12.5, for
each mesh size and turbulence model, comparing them later with experimental data. Results show a
useful model which gives a good agreement between numerical and experimental results and can indeed
be used as a first approximation previous to a more detailed and expensive study.
Key words
Wind turbine airfoils, CFD, 2D-RANS
numerical models, turbulence models.
1. Introduction.
The state of the art in the development of wind
energy conversion systems still poses some
questions on the detailed aerodynamic
phenomena involved in the flow around the
turbine blades, generally governed by quite
variable flow conditions and far from the design
ones. One of the particular efforts being carried
out is based on the use of Computational Fluid
Dynamics (CFD) techniques to handle the flow
study around the blade airfoils, even in a design
stage, previous to the blade construction. For
such kind of approach, it is essential a good
selection of the main parameters depending on
the flow conditions such as the spatial
discretization or numerical grid quality, the
turbulent closure scheme, the numerical
uncertainty, the unsteady treatment, etc.
Several two-dimensional Reynolds-Average
Navier-Stockes (2D-RANS) numerical models
have been employed in order to predict the
aerodynamic performance of wind turbine
airfoils with satisfactory results. For instance,
Yu et al. [1] have been applying this kind of
methodology to study the dynamic stall of an
airfoil undergoing sinusoidal pitch oscillations,
finding promising results in predicting lift, draft
and momentum coefficients. In the cases of real
blades at high angles of attack, 2D simulations
are known to overpredict drag, due to tip effects
in the spanwise distribution of drag. These
effects appear to be more pronounced at high
incidence angles and can be adequately
predicted by a 3D-RANS model (Sorensen et al.
[2]). When a full detailed description of the
unsteady flow is needed, such as the case of
generation and propagation of airfoil noise,
large eddy simulation (LES) schemes must be
used (Fleig. et al. [3]), with the subsequent
higher computational costs.
In this work, the capability of simple numerical
models with coarse grids to predict lift and drag
International Conference on Renewable Energies and Power Quality (ICREPQ’14) Cordoba (Spain), 8th to 10th April, 2014
Renewable Energy and Power Quality Journal (RE&PQJ)
ISSN 2172-038 X, No.12, April 2014
https://doi.org/10.24084/repqj12.342 370 RE&PQJ, Vol.1, No.12, April 2014
Page 2
2
in wind turbine airfoils is explored. The main
goal is to develop a simple and fast method
which could be employed in the design stage
with a low computational cost, in order to select
the best alternative between several options, and
previous to more detailed and refined
simulations which will be needed in further
stages of the airfoil development and
construction.
The study starts with the CFD numerical study
of a typical airfoil geometry used in wind
turbines, in order to determine the main criteria
to choose the optimum model and numerical
parameters, depending on the flow conditions.
The study covers the following two main
aspects: sensitivity study of the developed
computational grid and verification of the better
turbulence model to capture the main physical
phenomena. In order to contrast the obtained
numerical results, the experimental public
database of the National Renewable Energy
Laboratory (NREL) at Golden, Colorado, USA
(Selig et al. [4]) has been considered.
2. Methodology
The research begins with the numerical study of
a typical airfoil geometry used in wind turbines.
For all the cases presented in this study, a FX
63-137 airfoil model was used. Simulations
were run combining different parameters, while
some of them have been maintained constant
such as the incident velocity, computed for a
Reynolds number of 350,000 based on the
airfoil chord length.
Three parameters were modified: the number of
mesh cells, the incident angle of the flow and
the turbulence model employed in the
simulation. For the sake of comparison, the
numerical results achieved were validated with
the experimental public database of the NREL
(National Renewable Energy Laboratory) at
Golden, Colorado, USA (Seling et al. [4]).
2.1. Geometry and mesh generation.
GAMBIT meshing software was used for
geometry and mesh generation. This software is
associated with Fluent, where later simulations
were made. Four mesh densities were created to
avoid high skewed elements: a coarse mesh with
2,992 cells, a middle density mesh with 12,451
cells, a high-density mesh with 48,780 cells and
one extra mesh for the k- SST case with
111,105 cells. In the following, a simple
nomenclature is used to refer the different
meshes, named G1, G2, G3 and G4,
respectively. The purpose of the chosen shape is
to create a meshing that is adapted to the
geometry from a simple and effective way as
shown in Fig.1. However, for the finest meshes
it was necessary to make some changes in the
geometry of the mesh to keep the stability in the
simulations.
.
Fig. 1. Simple scheme of the geometry of the mesh
for coarse and middle mesh.
In Fig. 2, a detail of the middle density mesh is
shown, allowing a better appreciation of the
airfoil and the geometry of the mesh around it.
Fig. 2. Detail of middle mesh (G2).
2.2. Incident angles.
In this paper, four different incident angles were
considered for the simulations: -2.5°, 2.5°, 7.5°
and 12.5°, as representative for negative, low,
medium and high angles. These have been
selected owing to its distribution along the
experimental curve, enabling a wide range of
results, without excessively increasing the
calculation time, which is very important in this
study.
https://doi.org/10.24084/repqj12.342 371 RE&PQJ, Vol.1, No.12, April 2014
Page 3
3
2.3 Turbulence models.
Simulations were carried out for three different
turbulence models: Spalart-Allmaras, k-ε and
k- using the commercial CFD code, ANSYS
FLUENT.
Default constants provided by the program were
used for the k-ε and the Spalart-Allmaras
models. In particular, the k-ε model employed
here is the ReNormalization Group (RNG), a
variant of the standard. Variations in the wall
functions have been also conducted, running
simulations with Standard Wall Functions
(SWF) and Enhanded Wall Treatment (EWT).
Finally, initials parameters (k and ) calculated
as exposed by Sorensen et al. [2] and using
NREL experimental values were used for the k-
model. For this model, two variations were
conducted. Firstly, the simulations were run
with the standard model and later the k- SST
model of Menter was used, included in this
latter the option of transient flows.
It is worth noting that a convergence standard of
10-6
to the residual parameters was employed.
A Semi Implicit Method for Pressure Linked
Equations (SIMPLE) algorithm was applied to
enforce the pressure-velocity coupling for the
three models and the spatial derivatives are
discretized using a second order upwind
approach.
In Table 1 the pressure interpolation schemes
employed are summarized.
Table 1. Pressure interpolation schemes used for
each mesh and model.
2.4 Estimation of errors
Dimensionless coefficients obtained
numerically are compared to the experimental
data provided by the bibliography, calculating
the average error for the whole range of incident
angles considered. As only the simulation of
four angles has been performed, the most
rational procedure to obtain an estimation of the
error is to obtain from the experimental
distribution the exact values for each of the
simulated angles through a polynomic equation
of the tendency line. Afterwards, the global
average error is found with equation [1] .
∑
|
|
|
|
[1]
where Rglobal is the average error for a
specific mesh size and turbulence model, N is
the total number of incident angles for which
this calculation is made, Ciexp
is the appropriate
coefficient (lift, drag or momentum) obtained of
the experimental study and Cinum
is the
coefficient obtained by numerical simulation.
3. Results and discussion
3.1 Spalart-Allmaras turbulence model.
The graphs shown in Fig. 3 correspond to this
one-equation turbulence model. The evolution
of the lift coefficient presents a notable
agreement with the experimental data, even in
the case of coarse meshes. As can be seen,
results with G2 appear to be the closest to the
reference data, while G3, supposed to be closer
to the reference values, has a similar behaviour
to G1. That could be because the third grid
involves an excessive amount of near wall cells
for a Spalart-Allmaras turbulence model, as this
model does not include any wall treatment.
On the other hand, an accurate estimation of the
drag coefficent is more difficult to obtain by
numerical simulation, and resulting values are
usually overpredicted regarding to experimental
data. Overall results appear to improve with the
increase of number of cells.
The momentum coefficient is in perfect
correspondence with the experimental curve for
low angles of attack, deviating gradually with
an increasing of the angle of attack.
3.2. k-ε turbulence model.
For this model, the graphs are plotted in Fig. 4.
The lift coefficient shows an accurate prediction
of the values and the tendencies, especially
using medium and refined grids, reporting the
best values with high incident angles with the
S-A k-ε k-
G1,G2 G3 G1,G2 G3 G1,G2,
G3,G4
PRESTO! Second
Order
Second
Order Standard Standard
https://doi.org/10.24084/repqj12.342 372 RE&PQJ, Vol.1, No.12, April 2014
Page 4
4
enhanced wall treatment (EWT) model. For this
turbulence model, the drag coefficient values
are excessively away from the experimental
curve in all type of meshes and conditions, thus
pointing out that this is not a good model to predict the drag coefficient.
Fig. 3. Lift, drag and momentum coefficients for
Spalart-Allmaras model.
For the momentum coefficient, a good accurate
prediction of the values is shown, especially at
low angles of attack .
Fig. 4. Lift,drag and momentum coefficients for k-ε
model.
00,20,40,60,8
11,21,41,61,8
-5 0 5 10 15
CL
coe
ffic
ien
t
Incidence Angle []
Exp Num(G1)
Num(G2) Num(G3)
0
0,05
0,1
0,15
0,2
-5 0 5 10 15
CD c
oe
ffic
ien
t
Incidence Angle []
Exp Num(G1)
Num(G2) Num(G3)
-0,25
-0,2
-0,15
-0,1
-0,05
0
-5 0 5 10 15
Cm
co
eff
icie
nt
Incidence Angle []
Exp Num(G1)
Num(G2) Num(G3)
00,20,40,60,8
11,21,41,61,8
-5 0 5 10 15
CL
coe
ffic
ien
t Incidence Angle []
Exp Num(G1)Num(G2) Num(G3)Num(G1)-EWT Num(G2)-EWTNum(G3)-EWT
0
0,05
0,1
0,15
0,2
-5 0 5 10 15
CD c
oe
ffic
ien
t
Incidence Angle []
Exp Num(G1)Num(G2) Num(G3)Num(G1)-EWT Num(G2)-EWTNum(G3)-EWT
-0,25
-0,2
-0,15
-0,1
-0,05
0
-5 0 5 10 15
Cm
co
eff
icie
nt
Incidence Angle []
Exp Num(G1)Num(G2) Num(G3)Num(G1)-EWT Num(G2)-EWTNum(G3)-EWT
https://doi.org/10.24084/repqj12.342 373 RE&PQJ, Vol.1, No.12, April 2014
Page 5
5
3.3. K- turbulence model
In this turbulence model only the SST version is
shown, because it is the model which has
presented the best results, except for the middle
mesh (G2), where the standard model had slightly better results with respect to the drag
coefficient. The standard model has shown to
reproduce the experimental curve with a good
accuracy, except for high angles of attack in the
finest meshes.
Fig. 5. Lift,drag and momentum coefficients for the
k- SST model.
Looking at the lift coefficient chart, shown in
Fig. 5, it can be noticed that in the most refined
mesh exists a large accuracy at high angles,
although the coefficient is over predicted for the
lowest angles. In this case, the middle mesh
(G2) is the one showing the best agreement with
the experimental data.
In the graph of the drag coefficient, for the
finest meshes, the numerical curve presents the
highest accuracy with respect to the
experimental one of the entire numerical
database.
Finally, the momentum coefficient has an
accurate prediction of values and tendencies;
quite similar with the experimental curve,
especially for the finest meshing (G4).
3.4 Average unitary errors.
Summary tables of average unitary errors for
each turbulence model and for each mesh size
are presented in this section. The computational
time for each simulation is also shown.
These results show that refined meshes and
complex turbulence models are not required for
the lift coefficient. To obtain an accurate
approximation, just a mesh with a relatively low
number of cells (G2) and with a one-equation
model as the Spalart-Allmaras can be used.
Nevertheless, for the drag coefficient, it is very
difficult to obtain accurate numerical results
concerning experimental ones. A more complex
turbulence model, such as k- SST, and high
density meshes are required to achieve an
acceptable error. Results for the momentum
coefficient are better for k- standard model
with a relatively refined mesh (G3), although
low errors are also obtained for middle meshes
and with a one equation turbulence model.
Table 2. Average unitary errors for the Spalart-
Allmaras model.
00,20,40,60,8
11,21,41,61,8
-5 0 5 10 15
CL
coe
ffic
ien
t
Incidence Angle []
Exp Num(G1)-SSTNum(G2)-SST Num(G3)-SSTNum(G4)-SST
0
0,05
0,1
0,15
0,2
-5 0 5 10 15
CD c
oe
ffic
ien
t
Incidence Angle []
Exp Num(G1)-SSTNum(G2)-SST Num(G3)-SSTNum(G4)-SST
-0,25
-0,2
-0,15
-0,1
-0,05
0
-5 0 5 10 15
Cm
co
eff
icie
nt
Incidence Angle []
Exp Num(G1)-SSTNum(G2)-SST Num(G3)-SSTNum(G4)-SST
Spalart-Allmaras
Tested
Grids
Max.
Computation
times
Average unitary
errors
CL CD Cm
G1 10 seconds 0.08 1.93 0.18
G2 2 minutes 0.03 0.73 0.10
G3 2 hours 0.08 0.68 0.14
https://doi.org/10.24084/repqj12.342 374 RE&PQJ, Vol.1, No.12, April 2014
Page 6
6
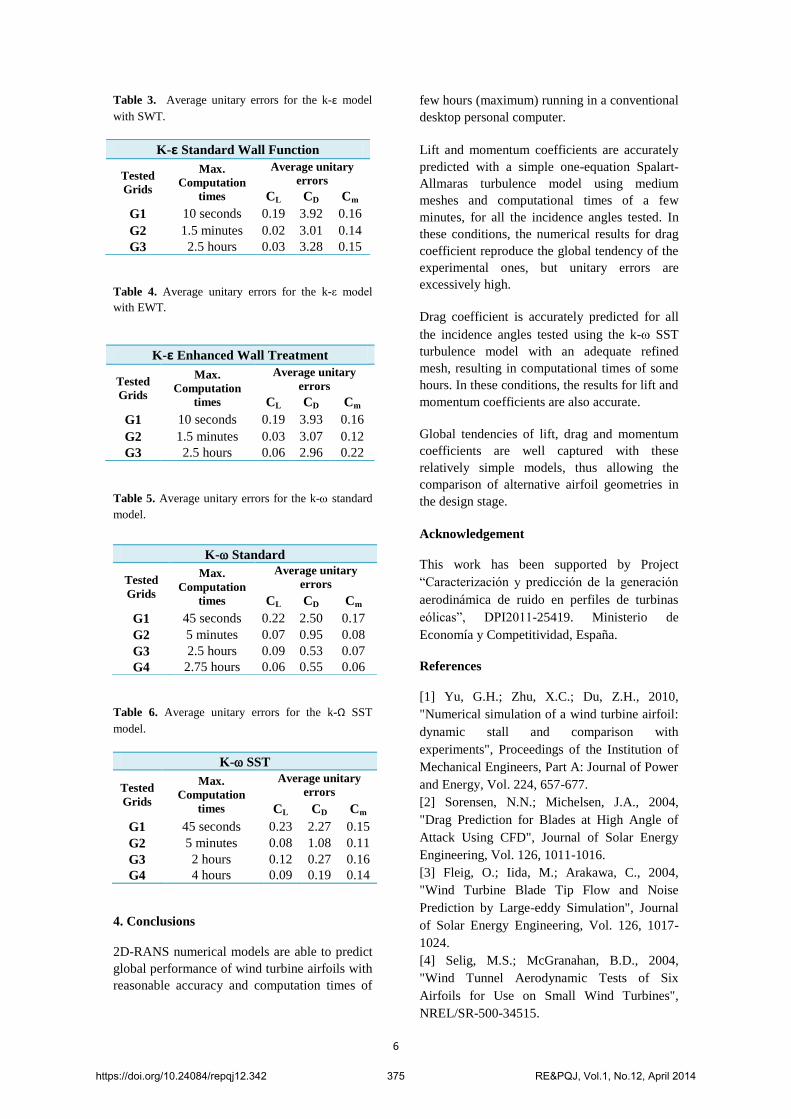
Table 3. Average unitary errors for the k-ε model
with SWT.
Table 4. Average unitary errors for the k-ε model
with EWT.
Table 5. Average unitary errors for the k- standard
model.
Table 6. Average unitary errors for the k-Ω SST
model.
4. Conclusions
2D-RANS numerical models are able to predict
global performance of wind turbine airfoils with
reasonable accuracy and computation times of
few hours (maximum) running in a conventional
desktop personal computer.
Lift and momentum coefficients are accurately
predicted with a simple one-equation Spalart-
Allmaras turbulence model using medium
meshes and computational times of a few
minutes, for all the incidence angles tested. In
these conditions, the numerical results for drag
coefficient reproduce the global tendency of the
experimental ones, but unitary errors are
excessively high.
Drag coefficient is accurately predicted for all
the incidence angles tested using the k- SST
turbulence model with an adequate refined
mesh, resulting in computational times of some
hours. In these conditions, the results for lift and
momentum coefficients are also accurate.
Global tendencies of lift, drag and momentum
coefficients are well captured with these
relatively simple models, thus allowing the
comparison of alternative airfoil geometries in
the design stage.
Acknowledgement
This work has been supported by Project
“Caracterización y predicción de la generación
aerodinámica de ruido en perfiles de turbinas
eólicas”, DPI2011-25419. Ministerio de
Economía y Competitividad, España.
References
[1] Yu, G.H.; Zhu, X.C.; Du, Z.H., 2010,
"Numerical simulation of a wind turbine airfoil:
dynamic stall and comparison with
experiments", Proceedings of the Institution of
Mechanical Engineers, Part A: Journal of Power
and Energy, Vol. 224, 657-677.
[2] Sorensen, N.N.; Michelsen, J.A., 2004,
"Drag Prediction for Blades at High Angle of
Attack Using CFD", Journal of Solar Energy
Engineering, Vol. 126, 1011-1016.
[3] Fleig, O.; Iida, M.; Arakawa, C., 2004,
"Wind Turbine Blade Tip Flow and Noise
Prediction by Large-eddy Simulation", Journal
of Solar Energy Engineering, Vol. 126, 1017-
1024.
[4] Selig, M.S.; McGranahan, B.D., 2004,
"Wind Tunnel Aerodynamic Tests of Six
Airfoils for Use on Small Wind Turbines",
NREL/SR-500-34515.
K-ε Standard Wall Function
Tested
Grids
Max.
Computation
times
Average unitary
errors
CL CD Cm
G1 10 seconds 0.19 3.92 0.16
G2 1.5 minutes 0.02 3.01 0.14
G3 2.5 hours 0.03 3.28 0.15
K-ε Enhanced Wall Treatment
Tested
Grids
Max.
Computation
times
Average unitary
errors
CL CD Cm
G1 10 seconds 0.19 3.93 0.16
G2 1.5 minutes 0.03 3.07 0.12
G3 2.5 hours 0.06 2.96 0.22
K- Standard
Tested
Grids
Max.
Computation
times
Average unitary
errors
CL CD Cm
G1 45 seconds 0.22 2.50 0.17
G2 5 minutes 0.07 0.95 0.08
G3 2.5 hours 0.09 0.53 0.07
G4 2.75 hours 0.06 0.55 0.06
K- SST
Tested
Grids
Max.
Computation
times
Average unitary
errors
CL CD Cm
G1 45 seconds 0.23 2.27 0.15
G2 5 minutes 0.08 1.08 0.11
G3 2 hours 0.12 0.27 0.16
G4 4 hours 0.09 0.19 0.14
https://doi.org/10.24084/repqj12.342 375 RE&PQJ, Vol.1, No.12, April 2014