In recent years electrochemical methods have garnered interest as a means of directly investigating antioxidant levels [1–4]. This interest is due in part to the rapid analy-sis time, low detection limits, ease of use, low consumable costs and diverse range of techniques that electrochemis-try has to offer [5]. Within the family of electrochemical methods, differential pulse voltammetry (DPV) has found a unique place in qualitative and quantitative analysis of tocopherols [1, 6, 7]. Differential pulse voltammetry is a pulsed-voltammetric technique, similar to square-wave voltammetry (SWV). Pulsed-voltammetric techniques are particularly powerful technique due to faradaic cur-rent being recorded shortly after the potential is changed, thus allowing the background current to equilibrate, which increases the signal to noise ratio [5]. Although SWV does offer some advantages compare to DPV, including slightly better sensitivity and faster analysis times [5], DPV is an established technique in the field of antioxidant analysis making it an ideal choice for comparison of our results to literature findings. DPV has been used to investigate the antioxidative power of phenolic compounds such as butyl-ated hydroxytoluene (BHT) and tocopherol isomers against the radical scavenger 2,2′-diphenyl-1-picrylhydrazyl (DPPH) [8, 9]. Diaz et al. [7] utilized DPV to determine the amount of free tocopherols in vegetable oil samples. More recently, Vasilescu et al. [6] used DPV to investigate anti-radical properties of olive oils against DPPH instead of the more traditional Ferric Reducing Ability Plasma (FRAP) or Trolox Equivalent Antioxidant Capacity (TEAC) assays.
Abstract There has been an increase in the use of electro-chemical methods for monitoring antioxidant levels in a variety of disciplines due to the sensitivity, low detection limits, ease of use, low cost and rapid analysis time offered by these techniques. One technique that has received specific attention is differential pulse voltammetry. We describe a novel application of differential pulse voltam-metry to quantitatively and qualitatively determine the effi-ciency of removing tocopherols from commercial fish oil via column chromatographic separation. The relative limits of detection and quantitation of differential pulse voltam-metry are compared to HPLC for determining the removal of tocopherols from commercial fish oil. It was determined that differential pulse voltammetry can monitor the sepa-ration of commercially added antioxidants from the bulk sample via a decrease in antioxidant oxidation currents. Furthermore, the limits of detection and quantitation were found to be comparable with values obtained using HPLC for tocopherol identification and quantitation.
The numerous benefits DPV offers make it a viable tech-nique to be used for routine analysis of antioxidant systems. A number of potential applications may be possible, how-ever one such analysis that our lab identified is monitoring the removal of tocopherols from commercial oils, specifi-cally fish oil. Marine oils contain a large portion of polyun-saturated fatty acids (PUFA) such as eicosapentaenoic acid (EPA) and docosahexaenoic acid (DHA). EPA and DHA have been found to have positive effects on human health including brain development and cardiovascular function [10–13]. In order to protect these fatty acids from degra-dation, a common practice is the addition of antioxidants, such as tocopherols [14, 15]. Commercial fish oil presents itself as a readily available source of PUFA for novel anti-oxidant research. However, the manufacturer-supplemented antioxidants need to be removed prior to investigation of emerging antioxidant systems [16].
HPLC is commonly used for separation and detection of α-, β-, δ- and γ-tocopherols with either ultraviolet or fluo-rescence detection [17, 18]. HPLC has the distinct advan-tage of being able to effectively separate each tocopherol isomer prior to detection, which is difficult with electro-chemical analysis due to an overlap in oxidation potentials for β- and γ-tocopherol [7]. HPLC analysis of tocopherols has a number of drawbacks however, including longer anal-ysis time than electrochemical methods (>15–20 min for HPLC vs 2–3 min for DPV), roughly twice the amount of solvent per sample compared to electrochemical methods (15 mL for HPLC vs 7.5 mL for DPV), expensive instru-mentation and a need for running separations in normal-phase mode instead of reverse-phase. Running an HPLC separation in normal-phase requires less sample prepara-tion than reverse-phase, however normal-phase separations are often susceptible to less durability and poorer stability than running a reverse-phase separation [19].
In this paper, we outline a method for identification and quantitation of tocopherol content remaining in oil samples that were introduced to an aluminum oxide column for the purpose of removing tocopherols from commercial fish oil. Tocopherols are known to have regenerative and synergis-tic interactions with other antioxidative species [20–22]. Although these attributes may be beneficial for optimiz-ing an antioxidant system involving many species, it is not ideal for determining the efficacy and dose dependent activity of candidate antioxidant molecules. Thus, remov-ing supplemented antioxidants is imperative to evaluating the properties of emerging species and their protection of healthful fatty acids such as PUFA. Our findings show that DPV can be used to monitor the efficiency of tocopherol removal from commercial fish oil more rapidly with less solvent required than HPLC analysis. Detection limits of DPV are comparable with comparative detection and quan-titation limits of HPLC, making DPV a viable option for
this type of analysis. It is our aim that by providing a dis-crete use of electrochemical techniques that the field may be more broadly explored by oil chemists as a tool for investigating antioxidant systems.
Experimental Procedures
Materials
Commercial omega-3 fish oil purified from sardines and anchovies and supplemented with tocopherol was obtained from Nordic Naturals (YE-1022/1680677, Watsonville, CA). Aluminum oxide (199974-1 KG, Sigma-Aldrich, St. Louis, MO), sand (S25516B, Fisher Science, Waltham, MA), Pyrex glass wool (3950, Corning Inc., Corning, NY), and hexane at 95% purity (H306-4, Fisher Science) were used for stripping tocopherols from the commercial oil. Tocopherol standards, α-(T3251, Sigma-Aldrich), δ-(47784 Supelco, Bellefonte, PA) and γ (T028, Sigma-Aldrich) were purchased for electrochemical experiments. The sol-vent used for electrochemical testing consisted of sulfuric acid (A300-500, Fisher Scientific), benzene (BX0220-5, EMD Millipore, Darmstadt, Germany) and methanol (A412-4, Fisher Chemical). DPV analysis was performed using a CH Instruments model 660E SN:A3192 using a 3-electrode configuration consisting of a platinum counter electrode (CHI115, CH Instruments, Austin, TX), silver–silver/chloride reference electrode (CHI111, CH Instru-ments) and a glass carbon working electrode (CHI104, CH Instruments).
Methods
Commercial Fish Oil Stripping
Tocopherols were removed from commercial fish oil by slight modification of a previously published procedure [23]. Briefly, aluminum oxide was baked at 180° C for at least 12-h. A glass column (Pyrex, 500 mL) was packed with glass wool and then filled with about 50 mL of hex-ane. The column was prepared by adding a 1-inch layer of sand over the glass wool. Aluminum oxide was then added such that a 1:1.5 w/w ratio of aluminum oxide to fish oil was obtained. Finally, a second 1-inch layer of sand was added on top of the aluminum oxide completing the col-umn. A volume of hexane equivalent to twice the total vol-ume of the column was passed through the column prior to adding fish oil. The hexane level was adjusted to cover the very top of the column materials and then a 1:1 v/v ratio of commercial fish oil to hexane was added to the column carefully as to not disturb the sand or aluminum oxide lay-ers. House supplied air was applied to the column to speed
529J Am Oil Chem Soc (2017) 94:527–536
1 3
up the column flow rate. Stripped fish oil was collected in a round bottom-flask protected from light and purged with argon. Solvent was removed using a Heidolph Rotovap (HEI-Vap Advantage 36000130) set at 30° C for 15–20 min to ensure any remaining hexane were removed from the mixture. Commercial fish oil was split into six batches with each batch being run on a fresh column as prepared above. The oil was analyzed using DPV and HPLC to ensure the tocopherols were removed.
HPLC Determination of Tocopherols in Stripped Fish Oil
Fish oil samples (10 mg) were dissolved in 1 ml hexane. Tocopherol levels were quantified by HPLC using a Var-ian (Palo Alto, CA, USA) ProStar HPLC with autosa-mpler and a fluorescence detector set with an excitation wavelength of 290 nm and an emissions wavelength of 330 nm. The solvent used for analysis was a 97:3 (v/v) hexane:tetrahydrofuran pumped at 0.5 mL/min through a YMC (YMCAmerica, Allentown, PA, USA) diol-120 NP column (150 × 3.0 mm, 5 μm, 60 Å) fitted with a guard column cartridge. Varian Star Chromatography 6.0 was used for HPLC control, data collection, integration and analysis. External standards were used for quantitation using α-, β-, and γ- and δ-tocopherol standards (Matreya Lipids, State College, PA) injected at concentrations rang-ing from 0.01 to 5 µg/ml. The lower limit of detection (LLOD), shown in Eq. 1 was 0.02 μg/ml for α-, γ-, and δ-tocopherols while the lower limit of quantitation (LLOQ), shown in Eq. 2, was 0.06 μg/ml for α-, and δ-tocopherols, and 0.05 μg/ml for γ-tocopherol. In each equation, “s” is the standard error of the slope obtained from the linear regression analysis.
Based on a typical sample concentration of 10 mg/ml, the method LLOD are 2 μg/g and LLOQ are 5–6 μg/g. Higher sensitivity can be achieved by using more concen-trated samples, depending on the signal-to-noise limita-tions. HPLC performance was validated weekly using a standard mixture containing 10 μg/ml of each standard.
DPV Validation of Tocopherol Stripping from Commercial Fish Oil
Unstripped and stripped fish oil samples were run in trip-licate using DPV to determine the efficiency of tocoph-erol removal using an aluminum oxide column. Methods are similar to those previously reported [9, 24]. Briefly,
(1)Limit of detection =
3s
m
(2)Limit of quantitation =
10s
m
750 μL of fish oil (both stripped and non-stripped sam-ples) were added to 7.5 mL of a 1:2 v/v benzene-meth-anol solvent containing 0.12 M sulfuric acid as an elec-trolyte. The mixture was vortexed gently for 10–15 s to avoid creating a colloidal suspension of fish oil droplets. After vortexing, the sample was transferred to an elec-trochemical cell consisting of a platinum counter elec-trode, Ag/AgCl reference electrode and a glassy-carbon disk was used as the working electrode. The potentiostat was operated in DPV mode and the potential was scanned from 0 to 1.0 V at 0.004 V increments with an amplitude of 0.005 V, a pulse width of 0.05 s, a sampling width of 0.0167 s and a pulse period of 0.5 s. Peak potentials and currents were obtained using CH Instruments software (660 E, CH Instruments, Austin, TX). All collected elec-trochemical traces were background subtracted within the software program against a solvent voltammogram col-lected under similar conditions to the samples. All elec-trodes were cleaned in between each sample by rinsing in hexanes to remove any remaining species from the fish oil surface.
Determination of Limit of Detection and Limit of Quantitation for DPV Detection of α‑, δ‑ and γ‑Tocopherols
Limits of detection and quantitation have been previously reported for DPV detection of tocopherols [7, 8]. However, the aim of this research was to compare the figures of merit and reliability of tocopherol detection between an opti-mized HPLC system and a commercial potentiostat system. Standard addition was performed for each tocopherol iso-mer and unless stated otherwise, used the same experimen-tal conditions as outlined in the validation of tocopherol stripping from commercial fish oil. Initially, 0, 1, 3, 5, 7, and 10 μg/mL concentrations were used for the determina-tion of limits of detection and quantitation. For each stand-ard addition value, 750 μL of stripped fish oil was added to a test tube (Pyrex, 16 × 150 mm), followed by an aliquot of appropriate volume of a tocopherol standard followed by enough solvent to provide a total volume of 8.25 mL for each replicate. Each standard addition value was run in triplicate and the current signal was plotted against the con-centration to yield a calibration plot. The slope of this plot was used to determine the limit of detection ([3*standard deviation of the lowest detectable signal]/slope of calibra-tion line; Eq. 1) and the limit of quantitation ([10*standard deviation of the lowest detectable signal]/slope of calibra-tion line; Eq. 2) [25]. The standard deviation for the 3 μg/mL standard was used in the calculation because at this level, all of the tocopherol standards yielded a notable change in signal compared to the 0 μg/mL standard blank.
530 J Am Oil Chem Soc (2017) 94:527–536
1 3
Results and Discussion
Comparison of Stripping Procedure by HPLC and DPV
Our initial aim was to determine if DPV could be used to monitor tocopherol removal from commercial fish oil through a stripping process. Unstripped and stripped com-mercial fish oil were tested for tocopherols content using HPLC and DPV respectively. A 20-g sample of commercial fish oil was run through an aluminum oxide column after which it was split into two different 20 mL scintillation vials. This process was repeated to produce a total of six stripped fish oil samples. A portion of each stripped fish oil sample was analyzed by HPLC while the remaining portion of each sample was retained for DPV analysis.
Tocopherol standards were independently analyzed using DPV to determine their relative oxidation potentials. Figure 1 shows an overlay of the three 10 μg/mL stand-ards with α-tocopherol having the lowest oxidation poten-tial (~0.644 V vs Ag/AgCl), followed by γ-tocopherol (~0.714 V vs Ag/AgCl), and then δ-tocopherol (~0.804 V vs Ag/AgCl). The order of oxidation potentials agrees with Atuma and Lindquist [26] who found that the relative order of oxidation potentials for tocopherols proceeds with the oxidation of alpha-tocopherol at the lowest applied poten-tial, with beta- and gamma-tocopherol having a slightly higher oxidation potential than alpha-tocopherol and delta-tocopherol having the most positive oxidation potential. This has to due to the location and number of methyl sub-stitutions near the phenol group [27]. It has been noted pre-viously that oxidation potentials for β- and γ-tocopherol
overlap [7]. For that reason, in oil samples that contain both β- and γ-tocopherols, it will be difficult to confirm that oxi-dation current observed near 0.714 V versus a Ag/AgCl ref-erence electrode is only due to γ-tocopherol. The unstripped commercial fish oil had 1307 μg/mL α-tocopherol, 146 μg/mL β-tocopherol, 983 μg/mL γ-tocopherol, and 773 μg/mL δ-tocopherol as determined by HPLC. Thus, the rela-tive ratio of β-tocopherol to γ-tocopherol was 1:6.7. This is not surprising, as the commercial fish oil used in this study was supplemented with vitamin E from two sources. The first was direct supplementation with d-alpha-tocopherol at a stated concentration of 30 IU per 5 mL. The second was mixed tocopherols derived from soybean oil. Soybean oil generally contains a higher amount of γ-tocopherol com-pared to δ- or β-tocopherols, with the β-isomer being more prevalent than the β-isomer by a factor of ten for many soy-bean genotypes [28]. The majority of the oxidation current observed at the 0.714 V vs Ag/AgCl is primarily due to oxi-dation of γ-tocopherol.
Once the relative oxidation potentials were identified, the unstripped commercial fish oil and six stripped fish oil samples were analyzed by DPV. Figure 2 shows an overlay of voltammetric signals for the solvent blank (solid line), background subtracted unstripped fish oil (dash-dot line) and background subtracted stripped fish oil (dashed line). It can be seen in Fig. 2 that the oxidation potentials for each tocopherol isomer is shifted roughly +0.04 V compared to the standard provided in Fig. 1. However, the relative order and oxidation currents provide evidence that identification of each tocopherol is possible. The solvent background trace was used as the background for both the unstripped
Fig. 1 Overlaid differential pulse voltammograms of α-, γ- and δ-tocopherol. Voltammograms were recorded from 0.0 to 1.0 V against a Ag/AgCl reference electrode and are shown with solvent background subtracted. All standards shown at 10 ppm concentrations
Fig. 2 Overlaid differential pulse voltammograms of the solvent (filled line), unstripped commercial fish oil (short dotted line) and stripped fish oil (long dotted line). Voltammograms were recorded from 0.0 to 1.0 V against a Ag/AgCl reference electrode. Fish oil vol-tammograms are shown with the solvent voltammogram subtracted
531J Am Oil Chem Soc (2017) 94:527–536
1 3
and stripped traces in Fig. 2. There remains the reality that the oxidation currents in the unstripped commercial fish oil could be from other phenolic compounds that have simi-lar oxidation potentials as tocopherols [29]. However, since phenolic compounds present potential antioxidant capabili-ties, their removal from the commercial fish oil is preferred. Furthermore, with tocopherol being the main antioxidant component of the commercial oil tested, any oxidative cur-rent contributed from non-tocopherol species should be minimal. It is observed that the oxidation currents for the unstripped fish oil are no longer present after the sample was passed through an aluminum oxide column. This pro-vides direct evidence that the removal of tocopherols by an aluminum oxide column can be monitored by differences in oxidation current using DPV.
Of the six fish oil samples that were stripped on an alu-minum oxide column, only one had a noticeable trace of tocopherols, specifically the α-tocopherol isomer. A repre-sentative background subtracted voltammogram for each stripped fish oil sample is provided in Fig. 3. Figure 3a shows the single stripped fish oil sample that produced any tocopherol oxidation current. The oxidation peaks for γ- and δ-tocopherol are not present in the stripped fish oil sample in Fig. 3a. Stripped fish oil samples 2–6 (Fig. 3b–f)
showed no notable oxidation signals for any of the tocoph-erol isomers, suggesting that the columns stripping process successfully removed tocopherols. Using our calibration curve for α-tocopherol, the current signal in Fig. 3a corre-lates to a concentration of 1.1 μg/mL. This value is above our calculated LOD, but below the calculated LLOQ. No tocopherols were detected in this sample by HPLC. The most likely explanation for the residual α-tocopherol in Fig. 3a is that a small amount of unstripped fish oil still remained on the surface of the electrode from an initial voltammogram that was collected of unstripped fish oil directly prior to analysis of the sample shown in Fig. 3a. It is also possible that the oxidation current for the voltammo-gram shown in Fig. 3a is an unsuccessful stripping process, however subsequent testing by HPLC would suggest this is not the case.
Table 1 provides an overview of the average cur-rent values for the triplicate DPV measurements of the unstripped fish oil samples and the six stripped oil samples. In the unstripped fish oil samples, an oxidation current of −531.7 ± 12.6 nA, −379.7 ± 8.0 nA and −233.3 ± 5.8 nA were observed for α-, γ- and δ-tocopherol respec-tively. This is in sharp contrast to the average oxida-tion current for the six stripped fish oils which were
Fig. 3 Representative voltam-mograms from stripped fish oil batches (six total batches). Each trace was recorded from 0.0 to 1.0 V against a Ag/AgCl refer-ence electrode and are shown with the solvent background subtracted
532 J Am Oil Chem Soc (2017) 94:527–536
1 3
−2.0 ± 0.8 nA, −1.9 ± 0.2 nA and −2.0 ± 0.2 nA for α-, γ- and δ-tocopherol respectively. Even with the aver-age α-tocopherol oxidation current for sample 1 included in data analysis (−3.5 ± 3.2 nA), the average observed oxida-tion current for all tocopherol isomers in each stripped sam-ple were significantly lower than those for the unstripped fish oil.
A similar result was found for samples that were run using HPLC. In Fig. 4, chromatograms of tocopherol stand-ards, a stripped oil sample with tocopherol levels below detection limits and a stripped oil sample with tocopherol levels above the detection limits are overlaid. Table 2 out-lines the concentrations for each tocopherol converted from the analytical signal for both DPV and HPLC analysis.
Five out of six stripped fish oil samples yielded tocoph-erol levels below the detection limits for HPLC, while one stripped oil sample (sample 5/Fig. 3e; Table 2) yielded concentrations of 6.9, 3.1, 6.4 and 4.2 μg/mL for α-, β-. γ- and δ-tocopherol respectively, all of which were close to or slightly below the LLOQ. Although no oxidation peaks were observed for stripped fish oil sample 5, the tocoph-erol levels as determined by HPLC are roughly 0.2–2% of the unstripped sample, which would still be a success-ful removal of the commercially added antioxidants. Data from Table 2 show that γ-tocopherol was present at levels above the detection limit for all samples, however well below the limit of quantitation which is 4.9 ppm suggest-ing that any delta-tocopherol that remains in the sample is
Table 1 Overview of average oxidation current with corresponding standard deviation for alpha-, gamma- and delta-tocopherol from unstripped fish oil samples and six different stripped fish oil samples
The average oxidation current and standard deviations are also provided for all six of the stripped fish oil samples
Sample Replicates α-Tocopherol current avg ± std dev (nA)
Fig. 4 HPLC overlays of unstripped fish oil (solid line) and external standards (dotted line) (a) and stripped fish oil sample 1 (solid line) and 6 (dotted Line) (b). Figure 4a shows that the unstripped fish oil sample overlaps with alpha-, beta-, gamma- and delta-tocopherols. No other vitamin E species were found in the commercial fish oil. Figure 4b shows the residual tocopherols that were not completely
removed during the stripping process for stripped fish oil sample 6. However, stripped fish oil sample 1 suggests that all tocopherols were removed from the commercial oil. This data suggests that the oxida-tion current observed from the electrochemical data must have been from a different source than the stripped fish oil sample 1
533J Am Oil Chem Soc (2017) 94:527–536
1 3
not a sufficient concentration to provide evidence that the stripping procedures were unsuccessful. This finding is supported by the HPLC data which show all but sample 5 yielded tocopherol levels below the limits of detection for that technique. The combined data from HPLC and DPV analysis of tocopherol levels in stripped and unstripped commercial fish oil samples suggests that HPLC separation and detection of tocopherol isomers is more reliable than DPV. However, this comes at both a financial cost and time burden due to DPV analysis being less expensive to operate and faster than HPLC analysis.
Limit of Detection and Quantitation for Alpha, Delta and Gamma‑Tocopherol Using DPV
As stated earlier, the detection and identification of toco-pherols using DPV have been performed before using a variety of working electrodes [1–3]. A study by Radu et al. investigated detection limits of DPV versus HPLC analysis of tocopherols and concluded that HPLC provided lower detection limits at a higher cost and longer analysis time than DPV [8]. However, to the best of our knowledge, there are very few studies directly comparing applications of DPV on antioxidant detection directly to other analysis techniques.
To determine the limit of detection and quantitation, calibration plots were created using standard addition for α-, δ-, and γ-tocopherol (Fig. 5). Both α-tocopherol (Fig. 5a) and γ-tocopherol (Fig. 5c) showed good linear-ity between 1 and 10 μg/mL. Both α- and γ-tocopherol provided a notable change in signal for the 1 μg/mL standard. However, δ-tocopherol (Fig. 5b) did not pro-duce a notable change in signal for the 1 μg/mL stand-ard, so the standard curve was extended to include 15 μg/mL in the calibration curve for δ-tocopherol. Although individual tocopherol limits of detection and quantitation were performed as individual species, there is the possi-bility that tocopherols as a mixture will produce different figures of merit due to overlap of each isomer. To ensure that tocopherol oxidation peaks would not overlap a mix-ture of 10 ppm alpha-, gamma- and delta-tocopherol were run. This mixture provided reasonable baseline resolution after solvent background subtraction (data not shown). However, there remains the possibility that larger con-centrations would cause peaks to overlap. Mixtures were run alternating alpha-, gamma- and delta-tocopherol at 100 ppm while holding the remaining isomers at 10 ppm respectively. It was found that at higher concentrations the oxidation peaks did produce an overlap between species (data not shown). This does not propose a seri-ous issue to the goal of these studies as the fundamen-tal question being sought to answer is if antioxidants are Ta
ble
2 O
verv
iew
of
calc
ulat
ed to
coph
erol
con
cent
ratio
ns b
ased
on
DPV
and
HPL
C a
naly
sis
tech
niqu
es
Ana
lytic
al s
igna
l fo
r in
divi
dual
toc
ophe
rols
in
each
str
ippe
d fis
h oi
l sa
mpl
e w
as c
onve
rted
to
an a
ppro
pria
te c
once
ntra
tion
usin
g th
e ca
libra
tion
tech
niqu
es f
or b
oth
HPL
C a
nd D
PV. I
f th
e co
n-ce
ntra
tion
for
an in
divi
dual
toco
pher
ol w
as b
elow
the
tech
niqu
e’s
limit
of d
etec
tion
it is
den
oted
as
an a
ster
isk
(*)
Sam
ple
α-T
ocop
hero
l con
cent
ra-
tion
via
DPV
(pp
m)
α-T
ocop
hero
l con
cent
ra-
tion
via
HPL
C (
ppm
)γ
-Toc
ophe
rol c
once
ntra
-tio
n vi
a D
PV (
ppm
)γ
-Toc
ophe
rol c
once
ntra
-tio
n vi
a H
PLC
(pp
m)
δ-To
coph
erol
con
cent
ra-
tion
via
DPV
(pp
m)
δ-To
coph
erol
con
cent
ratio
n vi
a H
PLC
(pp
m)
Stri
pped
sam
ple
11.
2*
2.1
**
*
Stri
pped
sam
ple
2*
*2.
0*
**
Stri
pped
sam
ple
3*
*1.
9*
**
Stri
pped
sam
ple
4*
*1.
9*
**
Stri
pped
sam
ple
50.
76.
91.
86.
4*
4.2
Stri
pped
sam
ple
6*
*2.
0*
**
534 J Am Oil Chem Soc (2017) 94:527–536
1 3
removed from a commercial fish oil, which in the case of higher concentrations of tocopherols would be a clear and resounding failure in the stripping process.
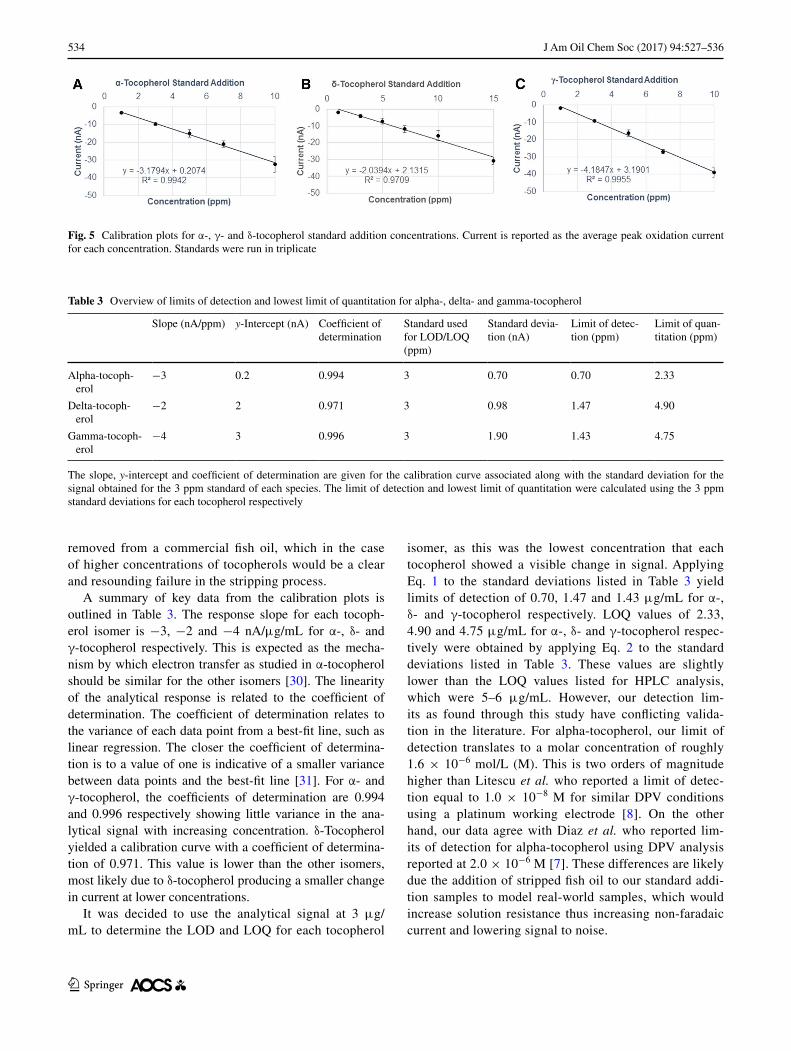
A summary of key data from the calibration plots is outlined in Table 3. The response slope for each tocoph-erol isomer is −3, −2 and −4 nA/μg/mL for α-, δ- and γ-tocopherol respectively. This is expected as the mecha-nism by which electron transfer as studied in α-tocopherol should be similar for the other isomers [30]. The linearity of the analytical response is related to the coefficient of determination. The coefficient of determination relates to the variance of each data point from a best-fit line, such as linear regression. The closer the coefficient of determina-tion is to a value of one is indicative of a smaller variance between data points and the best-fit line [31]. For α- and γ-tocopherol, the coefficients of determination are 0.994 and 0.996 respectively showing little variance in the ana-lytical signal with increasing concentration. δ-Tocopherol yielded a calibration curve with a coefficient of determina-tion of 0.971. This value is lower than the other isomers, most likely due to δ-tocopherol producing a smaller change in current at lower concentrations.
It was decided to use the analytical signal at 3 μg/mL to determine the LOD and LOQ for each tocopherol
isomer, as this was the lowest concentration that each tocopherol showed a visible change in signal. Applying Eq. 1 to the standard deviations listed in Table 3 yield limits of detection of 0.70, 1.47 and 1.43 μg/mL for α-, δ- and γ-tocopherol respectively. LOQ values of 2.33, 4.90 and 4.75 μg/mL for α-, δ- and γ-tocopherol respec-tively were obtained by applying Eq. 2 to the standard deviations listed in Table 3. These values are slightly lower than the LOQ values listed for HPLC analysis, which were 5–6 μg/mL. However, our detection lim-its as found through this study have conflicting valida-tion in the literature. For alpha-tocopherol, our limit of detection translates to a molar concentration of roughly 1.6 × 10⁻⁶ mol/L (M). This is two orders of magnitude higher than Litescu et al. who reported a limit of detec-tion equal to 1.0 × 10⁻⁸ M for similar DPV conditions using a platinum working electrode [8]. On the other hand, our data agree with Diaz et al. who reported lim-its of detection for alpha-tocopherol using DPV analysis reported at 2.0 × 10⁻⁶ M [7]. These differences are likely due the addition of stripped fish oil to our standard addi-tion samples to model real-world samples, which would increase solution resistance thus increasing non-faradaic current and lowering signal to noise.
Fig. 5 Calibration plots for α-, γ- and δ-tocopherol standard addition concentrations. Current is reported as the average peak oxidation current for each concentration. Standards were run in triplicate
Table 3 Overview of limits of detection and lowest limit of quantitation for alpha-, delta- and gamma-tocopherol
The slope, y-intercept and coefficient of determination are given for the calibration curve associated along with the standard deviation for the signal obtained for the 3 ppm standard of each species. The limit of detection and lowest limit of quantitation were calculated using the 3 ppm standard deviations for each tocopherol respectively
Slope (nA/ppm) y-Intercept (nA) Coefficient of determination
Standard used for LOD/LOQ (ppm)
Standard devia-tion (nA)
Limit of detec-tion (ppm)
Limit of quan-titation (ppm)
Alpha-tocoph-erol
−3 0.2 0.994 3 0.70 0.70 2.33
Delta-tocoph-erol
−2 2 0.971 3 0.98 1.47 4.90
Gamma-tocoph-erol
−4 3 0.996 3 1.90 1.43 4.75
535J Am Oil Chem Soc (2017) 94:527–536
1 3
Conclusion
Our study set out to determine if DPV could be used to monitor the removal of tocopherols from a commercial fish oil by aluminum oxide stripping. It was found that DPV can be used to identify and quantitate α-. β-/γ- and δ-tocopherols in unstripped and stripped fish oils. After commercial oils were passed through an aluminum oxide column the oxidation currents for all tocopherols signifi-cantly decreased. These results were confirmed by HPLC, with only one sample yielding tocopherol signal on HPLC but not on DPV. To compare the figures of merit for this application, limits of detection and quantitation were deter-mined in the presence of a real-world sample, such as fish oil. Limits of detection and quantitation for α-, δ- and γ-tocopherol were found to be very similar for DPV when compared to HPLC analysis. The data suggest that DPV can be used as a suitable replacement technique for HPLC, which will save time and money and produce less solvent waste.
The exciting prospect of this study is the application of DPV as a direct method for monitoring changes in antioxi-dant concentration. DPV could be applied to a variety of phenolic antioxidants or antioxidant systems to determine their antioxidant efficiency, shelf-life and their direct rela-tion to fatty acid profile changes when paired with other analysis techniques such as gas–chromatography mass–spectrometry. In addition, upon oxidation, many anti-oxidants can form secondary compounds that still have antioxidant activity. For example, quinines formed from tocopherols and carnosic acid have demonstrated antioxi-dant activity [32, 33]. If previously identified, HPLC meth-ods can be developed for the analysis of these secondary antioxidants. However, in many cases, the structure of these compounds are not known, standards do not exist, and the quantities produced may be too low for detection by HPLC. Since each antioxidant will likely have different oxidation potentials, DPV may prove to be useful in detection of the formation of unknown secondary antioxidants in oils dur-ing oxidation experiments. DPV will allow researchers to investigate the next generation of antioxidant compounds faster, cheaper and provide direct insight into their charac-teristics which current assays such as FRAP or TEAC do not offer.
Acknowledgements The authors would like to thank Julie Ander-son (USDA, ARS, Peoria, IL) for HPLC analysis of stripped samples along with Katelyn Keene (UM-Flint; Flint, MI) for data analysis sup-port. The authors would also like to thank Jerry Craney, Adit Shah, Wolfgang Moorehouse, David Poole, Alex Rizo and Jordan White who provided preliminary data, which validated the viability of this study.
Compliance with Ethical Standards
Funding We would also like to thank the University of Michigan-Flint Research and Creative Activity Committee for funding of this work.
Conflict of Interest None.
References
1. Tomassetti M, Serone M, Angeloni R et al (2015) Ampero-metric enzyme sensor to check the total antioxidant capacity of several mixed berries. Comparison with two other spectro-photometric and fluorimetric methods. Sensors (Switzerland) 15:3435–3452. doi:10.3390/s150203435
2. Lin X, Ni Y, Kokot S (2013) Glassy carbon electrodes modi-fied with gold nanoparticles for the simultaneous determina-tion of three food antioxidants. Anal Chim Acta 765:54–62. doi:10.1016/j.aca.2012.12.036
3. Andrei V, Sharpe E, Vasilescu A, Andreescu S (2016) A single use electrochemical sensor based on biomimetic nanoceria for the detection of wine antioxidants. Talanta 156–157:112–118. doi:10.1016/j.talanta.2016.04.067
4. Gomes SMC, Ghica M-E, Rodrigues IA et al (2016) Fla-vonoids electrochemical detection in fruit extracts and total antioxidant capacity evaluation. Talanta 154:284–291. doi:10.1016/j.talanta.2016.03.083
5. Bard AJ, Faulkner LR (2001) Electrochemical methods: funda-mentals and applications, 2nd edn. Wiley, New York
6. Vasilescu I, Eremia SAV, Albu C et al (2015) Determination of the antiradical properties of olive oils using an electrochemi-cal method based on DPPH radical. Food Chem 166:324–329. doi:10.1016/j.foodchem.2014.06.042
7. Galeano Diaz T, Durán Merás I, Guiberteau Cabanillas A, Alexandre Franco MF (2004) Voltammetric behavior and determination of tocopherols with partial least squares cali-bration: analysis in vegetable oil samples. Anal Chim Acta 511:231–238. doi:10.1016/j.aca.2004.02.010
8. Litescu S, Radu G (2000) Estimation of the antioxidative prop-erties of tocopherols ± an electrochemical approach. Eur Food Res Technol 211:218–221. doi:10.1007/s002170050027
9. Litescu S, Radu G, Diaconu M (2001) Antioxidative power evaluation of some phenolic antioxidants ± electroanalytical approach. Electroanalysis 2:804–806
10. Kapoor R, Patil UK (2011) Importance and production of omega-3 fatty acids from natural sources. Int Food Res J 18:493–499
11. Virtanen JK, Siscovick DS, Lemaitre RN et al (2013) Circu-lating omega-3 polyunsaturated fatty acids and subclinical brain abnormalities on MRI in older adults: the cardiovascu-lar health study. J Am Heart Assoc 2:e000305. doi:10.1161/JAHA.113.000305
12. Ramadeen A, Connelly KA, Leong-Poi H et al (2012) Doco-sahexaenoic acid, but not eicosapentaenoic acid, supplementa-tion reduces vulnerability to atrial fibrillation. Circ Arrhythmia Electrophysiol 5:978–983. doi:10.1161/CIRCEP.112.971515
13. Ruxton CHS, Reed SC, Simpson MJA, Millington KJ (2004) The health benefits of omega-3 polyunsaturated fatty acids: a review of the evidence. J Hum Nutr Diet 17:449–459. doi:10.1111/j.1365-277X.2004.00552.x
14. Kulås E, Ackman RG (2001) Protection of α-tocopherol in nonpurified and purified fish oil. J Am Oil Chem Soc 78:197–203. doi:10.1007/s11746-001-0243-x
15. Zuta PC, Simpson BK, Zhao X, Leclerc L (2007) The effect of α-tocopherol on the oxidation of mackerel oil. Food Chem 100:800–807. doi:10.1016/j.foodchem.2005.11.003
16. Fhaner M, Hwang H-S, Winkler-Moser JK et al (2016) Protec-tion of fish oil from oxidation with sesamol. Eur J Lipid Sci Technol 118:885–897. doi:10.1002/ejlt.201500185
17. Khan A, Khan MI, Iqbal Z et al (2010) An optimized and validated RP-HPLC/UV detection method for simultaneous determination of all-trans-Retinol (Vitamin A) and ??-Tocoph-erol (Vitamin E) in human serum: comparison of different particulate reversed-phase HPLC columns. J Chromatogr B Anal Technol Biomed Life Sci 878:2339–2347. doi:10.1016/j.jchromb.2010.07.009
18. Annunziata MG, Attico A, Woodrow P et al (2012) An improved fluorimetric HPLC method for quantifying tocopherols in Bras‑sica rapa L. subsp. sylvestris after harvest. J Food Compos Anal 27:145–150. doi:10.1016/j.jfca.2012.05.006
19. Panfili G, Fratianni A, Irano M (2003) Normal phase high-per-formance liquid chromatography method for the determination of tocopherols and tocotrienols in cereals. J Agric Food Chem 51:3940–3944. doi:10.1021/jf030009v
20. Zhu QY, Huang Y, Tsang D, Chen ZY (1999) Regeneration of alpha-tocopherol in human low-density lipoprotein by green tea catechin. J Agric Food Chem 47:2020–2025
21. Jovanovic SV, Steenken S, Hara Y, Simic MG (1996) Reduction potentials of flavonoid and model phenoxyl radicals. Which ring in flavonoids is responsible for antioxidant activity? J Chem Soc Perkin Trans 2:2497. doi:10.1039/p29960002497
22. Barclay LRC, Locke SJ, MacNeil JM (1985) Autoxidation in micelles. Synergism of vitamin C with lipid-soluble vitamin E and water-soluble Trolox. Can J Chem 63:366–374. doi:10.1139/v85-062
23. Lampi A-M, Dimberg LH, Kamal-Eldin A (1999) A study on the influence of fucosterol on thermal polymerisation of puri-fied high oleic sunflower triacylglycerols. J Sci Food Agric 579:573–579
24. McBride HD, Evans DH (1973) Rapid voltammetric method for the estimation of tocopherols and antioxidants in oils and fats. Anal Chem 45:445–449. doi:10.1021/ac60325a003
25. Skoog DA, Holler FJ, Crouch SR (1998) Principles of instru-mental analysis sixth edition. Thompson Brooks/Cole. doi: 10.1016/S0003-2670(00)84936-3
26. Atuma SS, Lindquist J (1973) Voltammetric determination of tocopherols by use of a newly developed carbon paste electrode. Analyst 98:886–894. doi:10.1039/AN9739800886
27. Hedenburg JF, Freiser H (1953) Anodic voltammetry of phenols. Anal Chem 25:1355–1358. doi:10.1021/ac60081a015
28. Rani A, Kumar V, Verma SK et al (2007) Tocopherol content and profile of soybean: genotypic variability and correlation studies. J Am Oil Chem Soc 84:377–383. doi:10.1007/s11746-007-1040-x
29. Li C, Hoffman MZ (1999) One-electron redox potentials of phenols in aqueous solution. J Phys Chem B 103:6653–6656. doi:10.1021/jp983819w
30. Nanni EJ, Stallings MD, Sawyer DT (1980) Does superoxide ion oxidize catechol, alpha-tocopherol, and ascorbic acid by direct electron transfer? J Am Chem Soc 102:4481–4485. doi:10.1021/ja00533a029
31. Bewick V, Cheek L, Ball J (2003) Statistics review 7: correlation and regression. Crit Care 7:451–459. doi:10.1186/cc2401
32. Hall CA, Cuppett SL, Dussault P (1998) Hydrogen-donat-ing mechanism of rosmariquinone, an antioxidant found in rosemary. J Am Oil Chem Soc 75:1147–1154. doi:10.1007/s11746-998-0304-4
33. Lindsey JA, Zang H, Kaseki H, Morisaki N, Sato T, Cornwell D (1985) Fatty acid metabolism and cell proliferation. VII. Antioxidant effects of tocopherols and their quinones. Lipids 20:151–157