INTERNATIONAL JOURNAL OF CIVIL AND STRUCTURAL ENGINEERING
Volume 3, No 3, 2013
© Copyright by the authors - Licensee IPA- Under Creative Commons license 3.0
Research article ISSN 0976 – 4399
Received on February 2013 Published on March 2013 629
Application of Finite Element Modeling of Isotropic Drained Monotonic
and cyclic triaxial tests, using Explicit Accumulation Model for non-
cohesive soils under cyclic loading Hassan Golmaei
Sari Agriculture Sciences and Natural Resources University, Sari.Iran
[email protected]
doi:10.6088/ijcser.2 201203013058
ABSTRACT
Finite element modeling is fitted to the results of experimental drained monotonic and cyclic
isotropic triaxial tests. It has been concluded that pseudo-cyclic creep model can predict the
accumulation strain/stress in drain state. For determination of material constants, the first
cycle (loading-unloading) is perfumed step-by-step, using Hardening-Soil-Model for drained
soil, then for the cycles greater than one, the behavior of soil is simulated as a pseudo creep
( Soft-Soil-Creep model, here) where the number of cycles (N) is considered equivalent time.
The prediction of model is compared with experimental results from monotonic and cyclic
drained isotropic triaxial tests. Good correlation exists between predicted and experimental
response.
Keyword: Non-cohesive-Soils, accumulation, drained cyclic triaxial tests, pseudo cyclic
model, explicit model Plaxis.
1. Introduction
Cyclic loading leads to an accumulation of strain and/or excess pore water pressure in soils,
as the generated stress or strain loops are not perfectly closed. Such cumulative phenomena
are of importance in many practical cases (Wichtmann, 2005). For the finite element (FE)
prediction of residual settlements two different numerical strategies can be distinguished:
1. Firstly, the implicit (incremental or low-cycle) models need hundreds of load
increments per cycle and the residual settlement appear as a by-product of classically
stress-strain loops (Wichtmann, 2005).
2. Secondly, the explicit (high-cycle) model. In such a model only the first cycle is
calculated conventionally with strain increment. The strain amplitude is determined
from the first cycle. The accumulation due to the following cycles is from a direct
(explicit) formula. The strain amplitude is assumed to be constant during this
calculation.
Metals, especially under high temperatures, exhibit simultaneously the phenomena of creep
and viscoplasticity. The former is essentially a redistribution of stress and / or strains with
time under elastic material response while the latter is a time dependent plastic deformation.
Experimental observations cannot distinguish between the two phenomena and their
separation has been largely an analytical convenience rather than a physical requirement
(5 ). Residual stresses and strains resulting from cyclic loading can be predicted by at least
two numerical approaches:
Application of Finite Element Modeling of Isotropic Drained Monotonic and cyclic triaxial tests, using
Explicit Accumulation Model for non-cohesive soils under cyclic loading
Hassan Golmaei
International Journal of Civil and Structural Engineering 630
Volume 3 Issue 3 2013
1. Incremental analyses in which the response is traced throughout every individual load
cycle.
2. Analyses which model the change of stress and strain only at the end of each
complete load cycle.
The first approach requires a hysteretic stress-strain relationship, such as those developed in
the anisotropic theory of plasticity. Cyclic loading is treated as sequential static loading and
unloading and the solution is obtained incrementally to account for soil nonlinearity. The
main advantage of this procedure is that one can predict the detailed behavior within a
particular cycle of load. The main disadvantage is the relatively large computational effort
required to model each load cycle. Difficulties can also arise from the gradual accumulation
of errors in predicted stresses and strains (Bouckovolas et al, 1984). The second group of
analyses does not consider in detail the variation of stress and strain during a cycle but
concentrates upon the accumulation of these quantities at the end of one or more cycles; the
load cycle characteristics enter only indirectly in the formulation. The major advantages from
this approach are low cost of analysis as well as simplicity; the major disadvantage is related
to the equations, commonly empirically base, used to relate strains to imposed stresses.
(Bouckovolas et al, 1984). Numerical processes, as described in this work, allow the
simultaneous description of both effects.
1.1 Pseudo - Cyclic Creep Model
The HCA (high-cycle accumulation) model predicts the development of residual strain with
the number of cycles without tracing the strain path during individual cycles. The predicted
accumulation rate depends on the strain amplitude, of the actual state of the soil and the
cyclic preloading (number of cycles in past). This model works similar to viscoplastic model
with the number of cycles N replacing the time t. Therefore, the accumulation of deformation
under cyclic loading is treated similar to the problem of creep under constant load.
Figure 1: Evolution of total strain in a cyclic triaxial test
Where (N): accumulation curve
(N , ) and ( , ):Basics parameters
( - ): Strain paths
= ( - ) , ϒ= ( - , is an alternative to
Application of Finite Element Modeling of Isotropic Drained Monotonic and cyclic triaxial tests, using
Explicit Accumulation Model for non-cohesive soils under cyclic loading
Hassan Golmaei
International Journal of Civil and Structural Engineering 631
Volume 3 Issue 3 2013
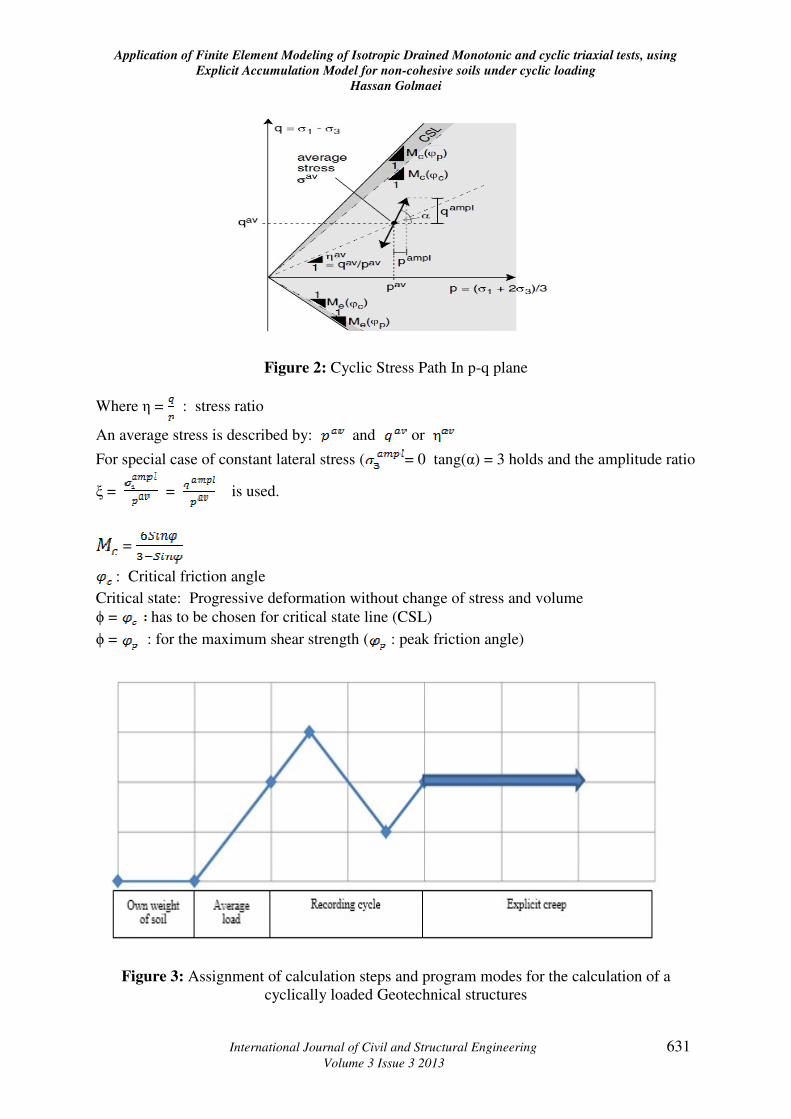
Figure 2: Cyclic Stress Path In p-q plane
Where η = : stress ratio
An average stress is described by: and or
For special case of constant lateral stress ( = 0 tang(α) = 3 holds and the amplitude ratio
ξ = = is used.
=
: Critical friction angle
Critical state: Progressive deformation without change of stress and volume
ϕ = has to be chosen for critical state line (CSL)
ϕ = : for the maximum shear strength ( : peak friction angle)
Figure 3: Assignment of calculation steps and program modes for the calculation of a
cyclically loaded Geotechnical structures
Application of Finite Element Modeling of Isotropic Drained Monotonic and cyclic triaxial tests, using
Explicit Accumulation Model for non-cohesive soils under cyclic loading
Hassan Golmaei
International Journal of Civil and Structural Engineering 632
Volume 3 Issue 3 2013
The explicit model has been used in a combined numerical strategy consisting of
implicit and explicit schemes for saving accumulation problems in the engineering
practice. According to Figure 3, three modes of operation have been distinguished in modes
of the material routines
1- Initial equilibrium: Initial equilibrium under own weight and average load.
2- Recoding mode: In this mode, implicit calculation of the accumulation
according to HSM (Hardening Soil Model ) implemented into the FE
program , PLAXIS has been used.
3- Pseudo-creep mode: In this mode the explicit calculation of accumulation
according to SSCM (Soft Soil Creep Model), implemented into the F.E.
program, is carried out.
2. Materials and methods
2.1 Material Tests
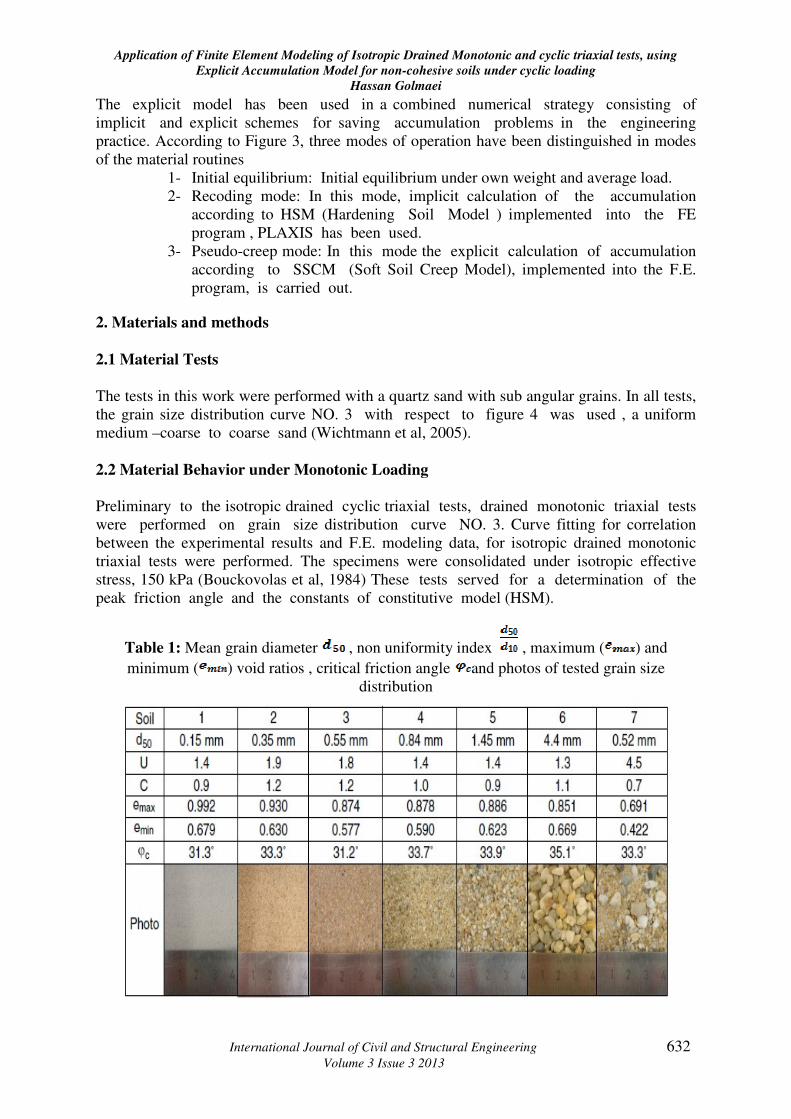
The tests in this work were performed with a quartz sand with sub angular grains. In all tests,
the grain size distribution curve NO. 3 with respect to figure 4 was used , a uniform
medium –coarse to coarse sand (Wichtmann et al, 2005).
2.2 Material Behavior under Monotonic Loading
Preliminary to the isotropic drained cyclic triaxial tests, drained monotonic triaxial tests
were performed on grain size distribution curve NO. 3. Curve fitting for correlation
between the experimental results and F.E. modeling data, for isotropic drained monotonic
triaxial tests were performed. The specimens were consolidated under isotropic effective
stress, 150 kPa (Bouckovolas et al, 1984) These tests served for a determination of the
peak friction angle and the constants of constitutive model (HSM).
Table 1: Mean grain diameter , non uniformity index , maximum ( ) and
minimum ( ) void ratios , critical friction angle and photos of tested grain size
distribution
Application of Finite Element Modeling of Isotropic Drained Monotonic and cyclic triaxial tests, using
Explicit Accumulation Model for non-cohesive soils under cyclic loading
Hassan Golmaei
International Journal of Civil and Structural Engineering 633
Volume 3 Issue 3 2013
Figure 4: Tested grain size distribution curve of a quartz sand
Figure 5: Accumulation curves εacc(N) for different stress amplitude qampl
Figure 6: Accumulation curves εacc(N) for 0.375 ηav 1.375 for qampl = constant
Application of Finite Element Modeling of Isotropic Drained Monotonic and cyclic triaxial tests, using
Explicit Accumulation Model for non-cohesive soils under cyclic loading
Hassan Golmaei
International Journal of Civil and Structural Engineering 634
Volume 3 Issue 3 2013
2.3 Peak Friction Angle from Drained Triaxial Test
In order to determine the peak friction angle in dependence on the relative density, drained
monotonic triaxial tests with initial relative density (0.59≤ ID0 ≤0.67) were performed. The
specimens were compressed in the axial direction with a constant displacement rate ṡ = 0.1 .
For each density, tests with effective lateral stresses 50 kPa ≤ σ3 ≤ 200 kPa were performed.
Volume changes were measured via the pore water volume of the saturated specimens
(Bouckovolas et al, 1984). Figure 7 presents the course of the deviatory stress q and the
volumetric strain with increasing axial strain in the tests on initial medium-dense specimens.
It is clear that icreased with increasing lateral stress . For the six tested lateral stresses, the
maximum value of q was reached at strains 6% ≤ ε3 ≤ 8% (Figure 4). Afterwards, the
devitatoric stress declined, but the residual value was not reached at the maximum tested
axial strain of approx. 23%. The curve εv (ε1) (Figure 7) show the initial contractancy
followed by a distinct dilatancy. The dilatant phase for the higher lateral stresses (e.g. = 200
kPa ) started later than for the smaller pressure, e.g. = 50 kPa (Bouckovolas et al, 1984).
Figure 7: a) Deviatory stress q and b) Volumetric strain as a function of axial strain for
0.59 ≤ ≤ 0.67 and different lateral stress
2.4 Curve Fitting Between Experimental Results and Model Data
2.4.1 Evaluation of mechanical parameters with HS model prediction
PLAXIS has been used for determination of the mechanical parameters. The constitutive
laws (HSM) were selected in recalculation of drain monotonic triaxial tests. The Hardening-
Soil model is utilized for the simulation of drained triaxial tests. A triaxial test can simply
be modeled by means of an axisymmetric geometry of unit dimension (1m x 1m), that
represent a quarter of soil specimen, (Figure 8). These dimensions are not realistic, but
they are selected for simplicity. The dimension of the model does not influence the
results, provided that the soil weight is not taken into account. In this configuration the
stresses and strains are uniformly distributed over the geometry. The deformation
magnitudes in x - and y - direction of the top right hand corner correspond to the
horizontal and vertical strains, respectively (Plaxis, 2010). The left hand side and the
bottom of the geometry are axes of symmetry. At these boundaries the displacements
Application of Finite Element Modeling of Isotropic Drained Monotonic and cyclic triaxial tests, using
Explicit Accumulation Model for non-cohesive soils under cyclic loading
Hassan Golmaei
International Journal of Civil and Structural Engineering 635
Volume 3 Issue 3 2013
normal to the boundaries are fixed and the tangential displacements are kept free to
allow for ‘smooth’ movements. The remaining boundaries are fully free to move.
Figure 8: Simplified configuration of a triaxial test
2.5 Hardening soil model (HS)
The Hardening Soil Model is an advanced model for the simulation of soil behaviors. It uses
theory of plastically and the background of this kind of models the hyperbolic relationship
between vertical stress, ( ), and deviatory stress, ( ), in primary triaxial loading.
However, soil stiffness is described much more accurately by using three different input
stiffness
1. Secant stiffness in standard drained triaxial test:
2. Tangent stiffness for primary oedometer loading:
3. Unloading/reloading stiffness: ( default : )
4. Power for stress-level dependency of stiffness: m
5. Poisson’s ratio for unloading/reloading (default: = 0.2)
6. Reference stress for stiffness: (default: =100 stress unit)
7. value for normal consolidation : (default : = 1 - )
8. Failure ratio : = (default : = 0.9)
9. Tensile strength: (default: = 0)
Application of Finite Element Modeling of Isotropic Drained Monotonic and cyclic triaxial tests, using
Explicit Accumulation Model for non-cohesive soils under cyclic loading
Hassan Golmaei
International Journal of Civil and Structural Engineering 636
Volume 3 Issue 3 2013
Also it defines the oedometer stiffness: =
2.6 Soft Soil Creep Model (SSCM)
The hardening soil model is suitable for all soils, but it does not for viscose effect, i.e. creep
and stress relaxation. In fact, all soils exhibit some creep and primary compressive is
followed by a certain amount of secondary compression.
Basic stiffness parameters:
: Modified swelling index
: Modified compression index
: Modified creep index
It should be noted that the Soft-Soil-Creep model is a relatively new model that has been
developed for application to settlement problems of foundation, embankment, etc…
3. Results and discussion
3.1 Material behavior under monotonic loading
Preliminary to the isotropic drained cyclic triaxial tests, drained monotonic triaxial test were
performed on grain size distribution curve NO. ( ). Curve fitting for correlation between the
experimental results and F.E. modeling data, for isotropic drained monotonic triaxial tests
were performed. The specimens were consolidated under isotropic effective stress, 150 kPa.
These tests served for a determination of the peak friction angle and the constants of
constitutive model (HSM)
According to figure 5, ζ= 0.3 * 200 = 60 kPa
According to figure 6, η = = 0.75 * 200 = 150 kPa
Sand NO. 3: = 0.55, U = 1.8 , C=1.2
= 0.874 , = 0.577
= 0.58 – 0.61 = = 0.595
= = = 0.697
γ = 15.9
In order to determine the material constants, the specimens were consolidated under different
isotropic effective stress, (Figure 9).
Application of Finite Element Modeling of Isotropic Drained Monotonic and cyclic triaxial tests, using
Explicit Accumulation Model for non-cohesive soils under cyclic loading
Hassan Golmaei
International Journal of Civil and Structural Engineering 637
Volume 3 Issue 3 2013
Figure 9: Comparison between experimental (figure 7), and model Data for isotropic drained
monotonic triaxial tests under different lateral stress , a) Deviatory stress q and b)
Volumetric strain as a function of axial strain for 0.59 ≤ ≤ 0.67
3.2 Intensity of accumulation
3.2.1 Influence of amplitude
First, small cycles are considered, i.e. cycles with paths laying between the critical state line
(CSL) and p axis in the p-q- plane. In a first test series, uniaxial stress cycles amplitudes 12
kPa ≤ ≤ 80 kPa (the scheme of the stress cycles in Figure 10). The average stress
( = 200 Kpa, =0.75) was identical in all eigth tests. The specimens were prepared
with similar initial densities 0.58 ≤ ≤ 0.61.
Application of Finite Element Modeling of Isotropic Drained Monotonic and cyclic triaxial tests, using
Explicit Accumulation Model for non-cohesive soils under cyclic loading
Hassan Golmaei
International Journal of Civil and Structural Engineering 638
Volume 3 Issue 3 2013
Table 2 : Summery of the material constants of the hardening-soil model according to curve
fitting with experimental data
Figure 10: Tests with uniaxial stress cycles and different amplitudes, stress paths in the p-q-
plane
Figure 11: Tests with uniaxial stress cycles and different amplitudes, stress paths in the p-q
plane
Application of Finite Element Modeling of Isotropic Drained Monotonic and cyclic triaxial tests, using
Explicit Accumulation Model for non-cohesive soils under cyclic loading
Hassan Golmaei
International Journal of Civil and Structural Engineering 639
Volume 3 Issue 3 2013
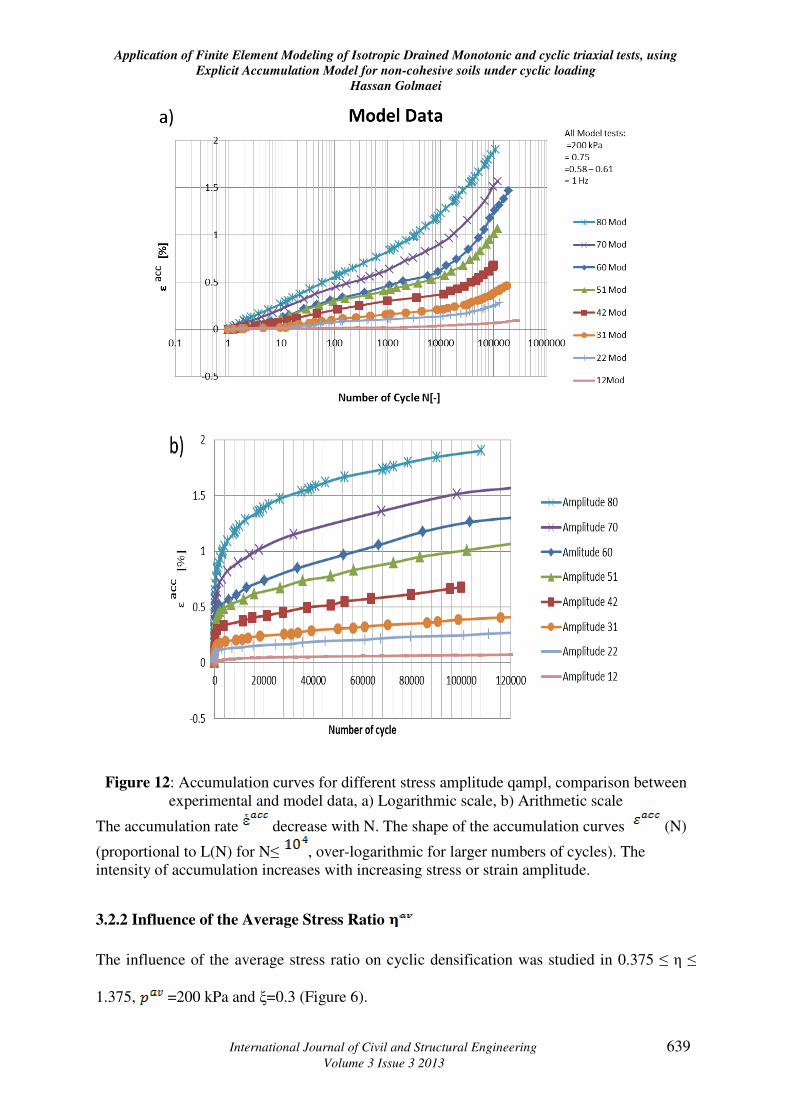
Figure 12: Accumulation curves for different stress amplitude qampl, comparison between
experimental and model data, a) Logarithmic scale, b) Arithmetic scale
The accumulation rate decrease with N. The shape of the accumulation curves (N)
(proportional to L(N) for N≤ , over-logarithmic for larger numbers of cycles). The
intensity of accumulation increases with increasing stress or strain amplitude.
3.2.2 Influence of the Average Stress Ratio
The influence of the average stress ratio on cyclic densification was studied in 0.375 ≤ η ≤
1.375, =200 kPa and ξ=0.3 (Figure 6).
Application of Finite Element Modeling of Isotropic Drained Monotonic and cyclic triaxial tests, using
Explicit Accumulation Model for non-cohesive soils under cyclic loading
Hassan Golmaei
International Journal of Civil and Structural Engineering 640
Volume 3 Issue 3 2013
Table 3: calculating the initial compression and mean deviatoric stress for Sand No. 3
All tests: =200 kPa ξ=0.3, = 0.57-0.67 = 1 Hz
The stress-strain hysteresis in the first cycle are shown in (Figure 14) with increasing stress
ratio , the residual deviatoric strain increases due to the decrease of stiffness during first
loading.
Figure 13: Stress cycles in the tests with different stress ratios
η= ξ= = 60
[kPa]
η
[kPa]
[kPa]
=1.313*200=262.6 1.313 262.6 112.5
=1.25*200 = 250 1.25 250 117
=1.125*200=225 1.125 225 125
=1*200 = 200 1.0 200 133
=0.75 * 200 = 150 0.75 150 150
=0.375*200 = 75 0.375 75 175
Application of Finite Element Modeling of Isotropic Drained Monotonic and cyclic triaxial tests, using
Explicit Accumulation Model for non-cohesive soils under cyclic loading
Hassan Golmaei
International Journal of Civil and Structural Engineering 641
Volume 3 Issue 3 2013
Figure 14: Model stress cycle with different stress ratio
Figure 15: First cycle q - hystereses
Figure 16: Model response for the first cycle q - hysteresis
Application of Finite Element Modeling of Isotropic Drained Monotonic and cyclic triaxial tests, using
Explicit Accumulation Model for non-cohesive soils under cyclic loading
Hassan Golmaei
International Journal of Civil and Structural Engineering 642
Volume 3 Issue 3 2013
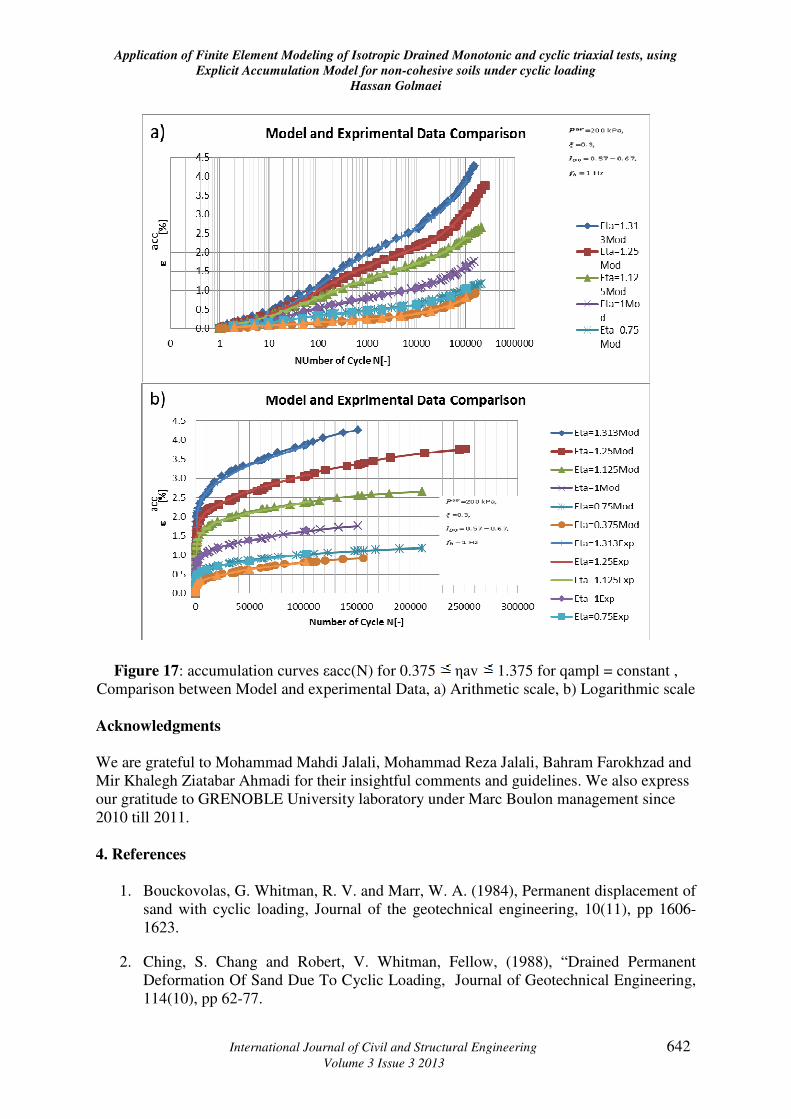
Figure 17: accumulation curves εacc(N) for 0.375 ηav 1.375 for qampl = constant ,
Comparison between Model and experimental Data, a) Arithmetic scale, b) Logarithmic scale
Acknowledgments
We are grateful to Mohammad Mahdi Jalali, Mohammad Reza Jalali, Bahram Farokhzad and
Mir Khalegh Ziatabar Ahmadi for their insightful comments and guidelines. We also express
our gratitude to GRENOBLE University laboratory under Marc Boulon management since
2010 till 2011.
4. References
1. Bouckovolas, G. Whitman, R. V. and Marr, W. A. (1984), Permanent displacement of
sand with cyclic loading, Journal of the geotechnical engineering, 10(11), pp 1606-
1623.
2. Ching, S. Chang and Robert, V. Whitman, Fellow, (1988), “Drained Permanent
Deformation Of Sand Due To Cyclic Loading, Journal of Geotechnical Engineering,
114(10), pp 62-77.
Application of Finite Element Modeling of Isotropic Drained Monotonic and cyclic triaxial tests, using
Explicit Accumulation Model for non-cohesive soils under cyclic loading
Hassan Golmaei
International Journal of Civil and Structural Engineering 643
Volume 3 Issue 3 2013
3. Messast, S, (2006), Modelisation constitutive du comportement cyclique des sables en
codition drainee, Rapport de Recherche, 2eme semester 2006, Dirige par: Boulon, M.
Prof. Emerite, Laboratoire Sols Solides Structures(3S), Universite Joseph Fourier,
Laboratoire de Mathematique et de Calcule Scientifique (LARMACS), Universite de
Skikda, PP 28.
4. Messast, S. Boulon, M. and Flavigny, E, (2007), Constitutive Modeling of the Cyclic
Behavior of the Sands in Drained Condition – Application to Dense Sand, 14eme
CRA MSG. Yaounde, 26-28 Novembre 2007, pp 8.
5. Owen and Hinton, (1986), Elasto-Viscoplastic Problems in two dimensions, pp 271-
281, Pineridge press, Swansea, UK, 1986.
6. Plaxis, essential for geotechnical professionals, (2010), Material Models Manual,
2010, pp188.
7. Poblete, Mauro. Wichtmann, T.Niemunis, Andrez. Triantafyllidis, Thcodor., (2011),
Accumulation of residual deformations due to cyclic loading with multidimensional
strain loops, 5thinternational conference on earthquake Geotechnical Engineering,
January 2011, 10-13, Santiago, Chili.
8. Thanopoulos, I.,(1981), contribution a l’etude du comportement cyclique des
milieuxpulverulent.” These Docteur-ingenieur, Universite Scientifique et medical
&L’institut national polytechnique de Grenoble, pp 1-205.
9. Wichtmann, T.,(2005), Explicit accumulation model for non-cohesive soils under
cyclic loading, PhD thesis, Bochum University, pp 247.
10. Wichtmann, T. Niemunis, A. and Triandtafyllidis, Th., (2005), Strain accumulation in
sand due to cyclic loading: drained triaxial tests, Soil Dynamics and Engineering
25(12), pp 967-979.
11. Wichtmann, T. Niemunis, A. and Triandtafyllidis, Th.,(2007), Strain accumulation in
sand due to cyclic loading: drained cyclic with triaxial extension, Soil Dynamics and
Engineering, 2007, vol .27 No. 1, pp. 42-48.
12. PLAXIS version 8.5: a Finite Element code for soil.