Copyright: Shell Brands International AG 2008 2/10/2011
Application of Application of Internal Olefin Internal Olefin SulfonatesSulfonates and Other and Other Surfactants to EOR Surfactants to EOR
Part 1: Part 1: Industrial Production, Industrial Production, Structure Performance Relationships, Structure Performance Relationships,
Shell Global Solutions
Structure Performance Relationships, Structure Performance Relationships, HandleabilityHandleability
Julian BarnesJulian Barnes
ContentsContents
•• Commercial scale production of IOS surfactants (ENORDETCommercial scale production of IOS surfactants (ENORDETTMTM))
•• Chemical reactionsChemical reactions
•• Molecular structureMolecular structure
•• Structure Structure –– Performance (Phase Performance (Phase BehaviourBehaviour) Relationships) Relationships
•• Octane (model crude)Octane (model crude)•• Octane (model crude)Octane (model crude)
•• Results and molecular modelingResults and molecular modeling
•• Crude oilsCrude oils
•• Surfactant Surfactant –– field matchingfield matching
•• HandleabilityHandleability optimisationoptimisation for field applicationsfor field applications
•• ConclusionsConclusions
Production of IOS Production of IOS –– Chemical reactions (I)Chemical reactions (I)
•• Internal olefin + SO3 => Internal olefin + SO3 => ββ, , γγ and and δδ sultonessultones
•• NeutralisationNeutralisation by by NaOHNaOH => =>
HydroxyAlkaneSulfonateHydroxyAlkaneSulfonate (HAS) and (HAS) and AlkeneSulfonateAlkeneSulfonate (AS)(AS)
R R
S OO
O
n
•• Low concentration of Low concentration of didi--sulfonatessulfonates strongly influence strongly influence hydrophilicityhydrophilicity
•• Final composition depends on feed (linearity, branching) and Final composition depends on feed (linearity, branching) and
sulfonationsulfonation conditionsconditions
R
S
R
O O
O
OH
Na+
R
SO O
O
R
Na+
Production of IOS Production of IOS –– Chemical reactions (II)Chemical reactions (II)
• Our pilot scale production work has shown:
• Representative full scale commercial production in falling film “mono-tube” reactor (*)
• Process parameter control => consistent product composition and performance
• Specific process aids at low level improve production efficiency• Specific process aids at low level improve production efficiency
(*) Ballestra & Chemithon sulfonation technology
Production of IOS Production of IOS –– Molecular structure Molecular structure LCLC--MS analysisMS analysis
40
50
60
70
80
90
% A
bu
nd
an
ce
Hydroxy Alkane Sulfonate
Alkene Sulfonate
•• HAS / AS ratio decreases from IOS 15HAS / AS ratio decreases from IOS 15--18 to 2418 to 24--2828
•• DiDi--sulfonatesulfonate increases for High (vs. Low) SOincreases for High (vs. Low) SO33
0
10
20
30
IOS 15-18 IOS 20-24
(Low
SO3)
IOS 20-24
(High
SO3)
IOS 19-23
(Low
SO3)
IOS 19-23
(High
SO3)
IOS 24-28
% A
bu
nd
an
ce
Alkene Sulfonate
Di-Sulfonate
Structure Performance Relationships: Structure Performance Relationships: Phase Phase BehaviourBehaviour –– octane octane -- 9090°°C (I)C (I)
8
10
12
14
Op
tim
al
sali
nit
y, %
Na
Cl
IOS 15-18
IOS 19-23 Low SO3
IOS 19-23 High SO3
IOS 20-24 Low SO3
95% confidence limits based on samples with slightly different process conditions
Phase behaviour principle
0
2
4
6
Op
tim
al
sali
nit
y, %
Na
Cl
IOS 20-24 Low SO3
IOS 20-24 High SO3
IOS 24-28
•• Optimal salinity decreases with increased carbon chainOptimal salinity decreases with increased carbon chain
•• High SOHigh SO33 (high (high didi--sulfonatesulfonate) increases optimal salinity ) increases optimal salinity
salinity
Structure Performance Relationships: Structure Performance Relationships: Phase Phase BehaviourBehaviour –– octane octane -- 9090°°C (II)C (II)
20
25
30
35
40
45
50
So
lub
ilis
ati
on
Pa
ram
ete
r, m
l/m
l
IOS 15-18
IOS 20-24 Low SO3
IOS 20-24 High SO3
IOS 19-23 Low SO3
Moderate
Optimal Salinity
with High Sol
Ratio
•• Trend: Decreasing optimal salinity Trend: Decreasing optimal salinity �� increasing increasing ssolubilisationolubilisation ratioratio
•• IOS 19IOS 19--23: high 23: high solubilisationsolubilisation at moderate salinityat moderate salinity
0
5
10
15
20
0 5 10 15
So
lub
ilis
ati
on
Pa
ram
ete
r, m
l/m
l
Optimal Salinity, %NaCl
IOS 19-23 Low SO3
IOS 19-23 High SO3
IOS 24-28
Typical
band
Structure Performance Relationships: Structure Performance Relationships: Molecular modelingMolecular modeling
R² = 0.85
6
8
10
12
14
Op
tim
al
sali
nit
y, %
Na
Cl
y = -58x + 81R² = 0.96
12
14
16
Op
tim
al
sali
nit
y, %
Na
Cl
Advanced model based on molecularmolecular descriptors
•• Optimal salinity: Optimal salinity: HLBHLB & molecular descriptor correlations work & molecular descriptor correlations work
•• SolubilisationSolubilisation Ratio:Ratio: Molecular descriptor correlations under developmentMolecular descriptor correlations under development
Standard HLB modelmodel
0
2
4
5 7 9 11 13
Op
tim
al
sali
nit
y, %
Na
Cl
HLB
R² = 0.96
0
2
4
6
8
10
1.15 1.2 1.25 1.3 1.35 1.4 1.45
Op
tim
al
sali
nit
y, %
Na
Cl
DPSA / MW
IOS 19-23?
Structure Performance Relationships: Structure Performance Relationships: Surfactant Surfactant -- Crude Oil interactionsCrude Oil interactions
Tail
oil
ETail-Oil
Tail
oil
ETail-Oil
Surfactant
interaction with
oil and brine
Interaction
energies ETail-Oil
and E
Internal olefin sulfonate
Alcohol ethoxy sulfate
Naphthenate Asphaltene aggregatesolvated by resins
SurfactantSurfactant tails solvated by crude oil molecules
Head
oil
brine
EHead-Brine
Head
oil
brine
EHead-Brine
and EHead-Water
must be large
for low IFT
OHSOO
O
Na+
O
O
O
OO
OO
OS
O
OO
O O
Na+
Na+-
-
-
oil phase
aqueous phase
Synthetic surfactantssurfactantsand….
Interfacially active crude components
Structure Performance Relationships: Structure Performance Relationships: Crude Oil Crude Oil -- IOS 24IOS 24--28 / IOS 1528 / IOS 15--1818
NaphthenicResins (%) Asphaltenes (%) acids (ppm)
Crude A 7.6 0.2 3230
Crude B 10.5 0.2 3010
Crude C 12.2 5.3 1500Crude D 13.6 6.6 na
Crude E 14.9 1.7 1856
High activity High activity Less compatible, viscous phases
NOTE: the crude oils are:
• Regionally different
• Low viscosity (API: 26-38)
• Low TAN (low soaps level)
salinity
% KCl: 0.5 0.75 1.0 1.25 1.50
Crude D
salinity
% NaCl 0.25 0.50 0.75 1.0 1.25 1.50
Crude E
salinity
% NaCl 0.25 0.37 0.50 0.75 1.0
Crude A
viscous
phases
Structure Performance Relationships: Structure Performance Relationships: Crude Oil Crude Oil -- IOS 24IOS 24--28 / IOS 1528 / IOS 15--1818
Crude A 7.6 0.2 3230
Crude B 10.5 0.2 3010
Crude C 12.2 5.3 1500Crude D 13.6 6.6 na
Crude E 14.9 1.7 1856
High activity High activity Less compatible, viscous phases
NOTE: the crude oils are:
• Regionally different
• Low viscosity (API: 26-38)
• Low TAN (no soaps)
Resins (%) Asphaltenes (%) acids (ppm)Naphthenic
salinity
% KCl: 0.5 0.75 1.0 1.25 1.50
Crude D
salinity
% NaCl 0.25 0.50 0.75 1.0 1.25 1.50
Crude E
salinity
% NaCl 0.25 0.37 0.50 0.75 1.0
Crude A
viscous
phasesSolubilisation benefits from long tailed IOS. Applied successfully in single well
tracer test with 90+% oil recovery (ref: Buijse et al, companion PEA meeting paper)
Matching Surfactants to Reservoir Matching Surfactants to Reservoir ConditionsConditions
IOS 20-24IOS 19-23
C16, 17 EOx sulfonate
C12, 13 EOx sulfonate
IOS 24-28
IOS 15-18
as secondary blending
component
IOS 15-18
Am
bie
nt
to 1
40
°CSalinity ranges based on optimal salinities measured with octane
•• The surfactants cover wide range of temperatures and salinitiesThe surfactants cover wide range of temperatures and salinities
C12, 13 EOx sulfonate
C16, 17 POx sulfate
C12, 13 POx sulfate C16, 17 EOx sulfate
C12, 13 EOx sulfate
Se
a w
ate
r
0 5 10 15 20 25
Salinity, %NaCl
Am
bie
nt
to
60
°C
Surfactant ManufacturingCurrent surfactant manufacturing largely 10-14 carbon number (ca. 6 mln ton pa)Good EOR surfactant properties requires 16-28 carbon number
EthyleneNatural Fats
and Oils
Paraffin
waxes
Normal
ParaffinsStarting Materials
Surfactants
Raw Materials
Alpha /
Internal
Olefins
Fatty
Acids
Detergent
range
alcohols
Ethylene
Oxide
PO
Alpha
Internal
olefin
sulfonate
Fatty
amine
oxides
Fatty
alkanol
amides
Alkyl
glyceryl
ether
sulfonate
Alcohol
sulfates
Alcohol
ethoxy-
sulfates
Sulphonat
es
carboxyla
tes
alcohol
ethoxylate
Linear
Alkyl
aromatic
sulfonate
Paraffin
sulfonate
Benzene
Toluene
Xylene
HandleabilityHandleability OptimisationOptimisation::For Logistics & Surface FacilitiesFor Logistics & Surface Facilities
IOS 15IOS 15--18, 35% AM18, 35% AM
Low viscosity liquidLow viscosity liquid
IOS 19IOS 19--23, 35% AM23, 35% AM
High viscosity liquidHigh viscosity liquid
IOS 19IOS 19--23, 66% AM23, 66% AM
PastePaste
HandleabilityHandleability optimisationoptimisation::Surfactant Physical PropertiesSurfactant Physical Properties•• OptimiseOptimise viscosity (and pour point) appropriate for manufacture, viscosity (and pour point) appropriate for manufacture,
transport, pumping, blendingtransport, pumping, blending
•• No phaseNo phase--separation; separation; pumpablepumpable
•• MinimiseMinimise water (and water (and maximisemaximise % active) for shipment% active) for shipment
•• IOS IOS rheologyrheology characteristics:characteristics:
•• SemiSemi--soluble / colloidal dispersion in watersoluble / colloidal dispersion in water•• SemiSemi--soluble / colloidal dispersion in watersoluble / colloidal dispersion in water
•• IO chain lengthIO chain length↑↑:: viscosityviscosity ↑↑
•• %active%active↓↓: : viscosity viscosity ↓↓
•• shear rateshear rate↑↑ : : viscosityviscosity ↓↓ ↓↓
•• Blends of IOS + solvent can help to lower viscosity, e.g.:Blends of IOS + solvent can help to lower viscosity, e.g.:
•• IOS 24IOS 24--28 HAM with water28 HAM with water => 19,000 => 19,000 cPcP (paste) (paste)
•• IOS 24IOS 24--28 HAM with SBA/water => 830 28 HAM with SBA/water => 830 cPcP (liquid)(liquid)
NOTENOTE: More : More viscometricviscometric data (with shear & temperature) is in the papedata (with shear & temperature) is in the paperr
HandleabilityHandleability optimisationoptimisation: : RheologyRheology Diagram for IOS 24Diagram for IOS 24--2828
5 8 14 21 ====> 33 ====> 64
60℃℃℃℃ Liquid Liquid Liquid Thick Liquid Thick Liquid Thick Liquid
50℃℃℃℃ Liquid Liquid Thick Liquid Gel/Paste Gel/Paste Gel/Paste
40℃℃℃℃ Liquid Liquid Thick Liquid Gel/Paste Gel/Paste Gel/Paste
℃℃℃℃
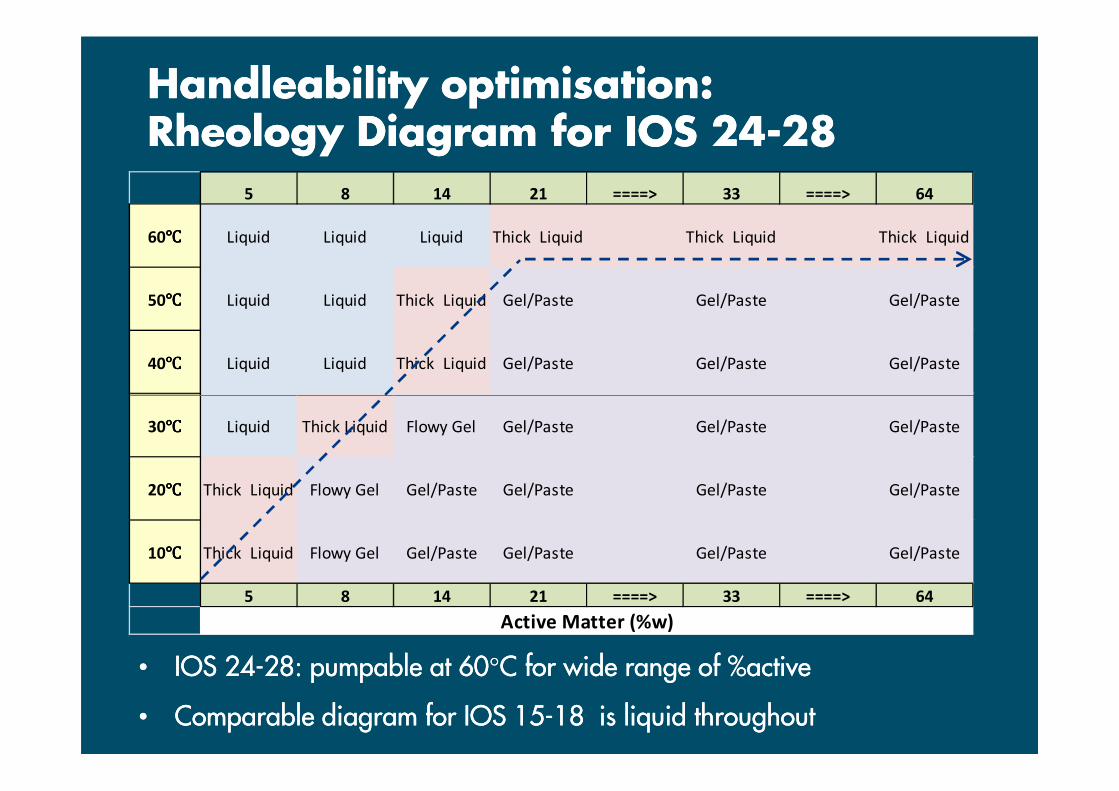
•• IOS 24IOS 24--28: 28: pumpablepumpable at 60at 60°°C for wide range of %activeC for wide range of %active
•• Comparable diagram for IOS 15Comparable diagram for IOS 15--18 is liquid throughout 18 is liquid throughout
℃℃℃℃
30℃℃℃℃ Liquid Thick Liquid Flowy Gel Gel/Paste Gel/Paste Gel/Paste
20℃℃℃℃ Thick Liquid Flowy Gel Gel/Paste Gel/Paste Gel/Paste Gel/Paste
10℃℃℃℃ Thick Liquid Flowy Gel Gel/Paste Gel/Paste Gel/Paste Gel/Paste
5 8 14 21 ====> 33 ====> 64
Active Matter (%w)
ConclusionsConclusions
•• Wide range of commercialWide range of commercial--scale ENORDET EOR surfactants manufactured scale ENORDET EOR surfactants manufactured
and successfully applied in field testsand successfully applied in field tests
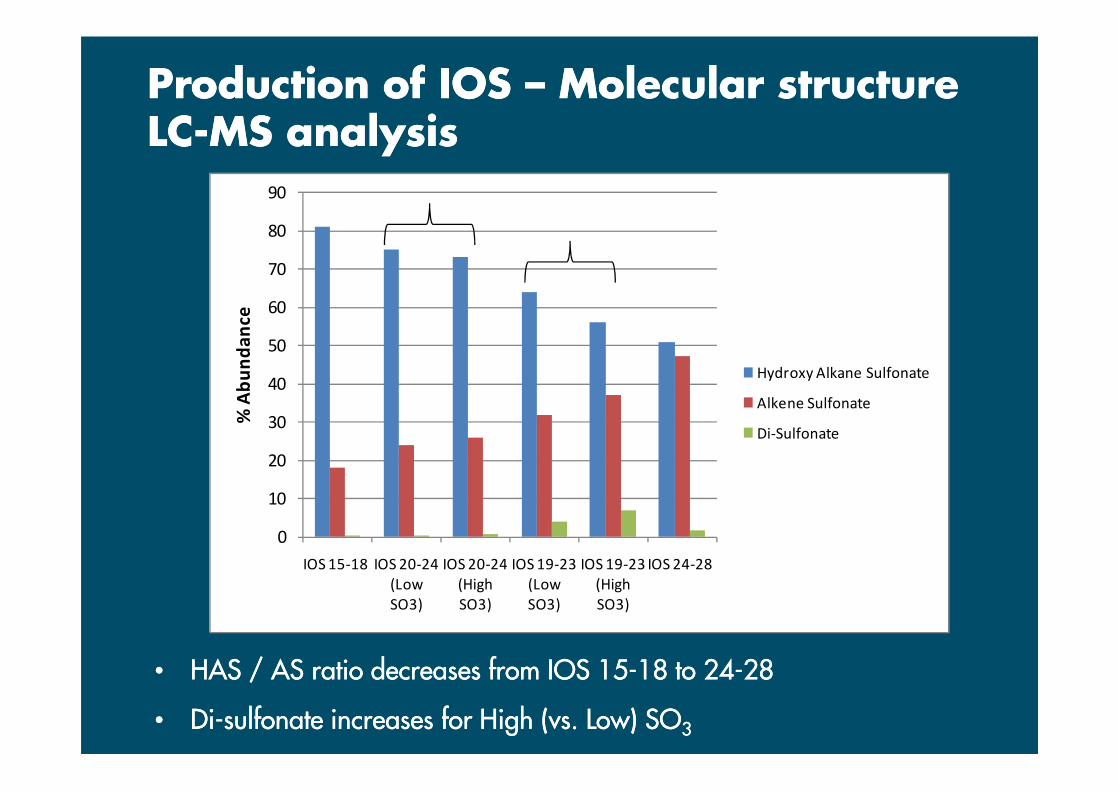
•• IOS structure control through understanding of IOS structure control through understanding of sulfonationsulfonation process process conditions conditions
•• IOS performance correlations developed & applied for model and crude oils IOS performance correlations developed & applied for model and crude oils
•• HandleabilityHandleability options developed to options developed to optimiseoptimise surfactant logistics and surface surfactant logistics and surface
facility design facility design
•• IOSs are “candidate workhorses” in IOSs are “candidate workhorses” in cEORcEOR
•• Good activity in a wide range of crudes and salinitiesGood activity in a wide range of crudes and salinities
•• Stable at high TStable at high T
•• Require fewer production steps c.f. potential alternatives for high TRequire fewer production steps c.f. potential alternatives for high T