Page 1
Application of laser scanning to measure fragmentation in
underground mines
A D Campbell
Senior Geotechnical Engineer - Glencore Copper
PhD Candidate, Sustainable Minerals Institute, University of Queensland, Australia
[email protected]
ORCiD: 0000-0002-1034-1437
M J Thurley
Principal – Innovative Machine Vision Pty Ltd, Melbourne, Australia
Associate Professor Image Analysis – Luleå University of Technology, Sweden
[email protected]
Submitted to Mining Technology Journal: Transactions of the Institutions of Mining
and Metallurgy, Section A
Accepted 12 Feb 2017
Page 2
Application of laser scanning to measure fragmentation in
underground mines
The particle size distribution of fragmented rock in mines significantly affects
operational performance of loading equipment, materials handling and crushing
systems. A number of methods to measure rock fragmentation exist at present,
however these systems have a number of shortcomings in an underground
environment. This paper outlines the first implementation of high resolution 3D
laser scanning for fragmentation measurement in an underground mine. The
system is now used routinely for fragmentation measurement at the Ernest Henry
sublevel-cave mine following extensive testing and calibration. The system is
being used to study the effects of blasting parameters on rock fragmentation to
optimise blast design. Results from 125 three dimensional scans measured the
average P50 and P80 to be 230mm and 400mm respectively. The equipment,
methodology and analysis techniques are described in detail to enable application
of the measurement system at other mines.
Keywords: fragmentation, blasting, mining, sublevel caving, laser scanning
Introduction
Rock fragmentation by blasting affects the efficiency, productivity and cost of
downstream operations including loading, crushing and grinding (Dinis da Gama, 1990;
Scott et al., 1999). In addition, the particle size distribution of rock fragmented by blasting
is known to influence gravity flow and ore recovery in sublevel cave mines (Laubscher,
1994; Power, 2004). Various gravity flow studies have demonstrated the size of
fragmented rock has a direct effect on draw zone geometry and flow mechanisms (Kvapil,
1998; Power, 2004). Larger rock fragments result in larger draw zones and more
favourable recovery conditions (Laubscher, 1994), but can lead to dangerous and costly
blockages called ‘hang-ups’. A number of studies have identified that the size distribution
characteristics of fragmented rock has an influence on loading equipment productivity,
including the loading cycle time and bucket payload (Allen et al., 1999; Brunton et al.,
Page 3
2003; Narendula, 2004). Overall, the particle size distribution of fragmented rock in a
sublevel cave mine (SLC) mine has an effect on most aspects of operational performance.
Commonly used image base systems for fragmentation measurement have a number of
limitations when used underground such as lighting, dust, water and colour which affect
particle delineation. Due to the critical importance of fragmentation, a measurement
system was required that was accurate, automated, fast, low cost and could be conducted
safely at a cave draw point. Using one of the mines existing high-resolution 3D laser
scanning systems, a measurement and analysis strategy was implemented, tested and
configured in an underground mine at the Ernest Henry Mine (EHM). This system was
used to measure a large set of draw point fragmentation data to understand current mine
performance and compare various drill and blast design trails in the future.
Testing of the laser scanning system was conducted at the Ernest Henry mine located 38
km north east of Cloncurry in North West Queensland (see Figure 1). The mine comprises
an operating SLC mine below the previous open pit operation. SLC production began
after completion of the open pit and targets ore down dip to a depth of almost 1,000m as
shown in Figure 2.
Fragmentation in caving mines
The importance of fragmentation in caving mines is outlined by Laubscher (1994) who
used scaled physical models to demonstrate that fragmentation size is proportional to the
draw zone geometry and should be factored into the design of cave mine layouts to
maximise recovery. Laubscher (1994) also noted that fragmentation size affects dilution,
draw control practices, draw point productivity and secondary breakage in a block caving
environment.
A major difference between model and full-scale gravity flow behaviour is the degree of
uniformity, overburden pressure and the large range of particle sizes observed in
operational mines. To enable the effect of fragmentation on gravity flow patterns and ore
recovery to be understood, an assessment of blasting, fragmentation and recovery must
be conducted in a full-scale operational mine. However, to quantify the cause and effect
of fragmentation, a reliable and accurate measurement system in an underground
environment is required.
Page 4
Existing fragmentation assessment methods
There are a number of methods to measure fragmentation of broken rock including
sieving, 2D and 3D image based methods and laser scanning. Sieving (or screening) is
the most common method for measuring the size distribution of granular media. However,
it is acknowledged in the literature that sieving large volumes of broken rock is both
difficult and disruptive in an operating mine and impractical in an underground mining
environment (Brown, 2003). Brown (2003) also points out that image-based methods are
the only practical method for large-scale fragmentation measurement. This was prior to
technological advances that enabled the use of 3D laser scanning for fragmentation
measurement (Onederra et al., 2014).
Image based analysis methods for fragmentation measurement were first developed by
Carlsson and Nyberg (1983) and Ord (1988). Fragmentation measurement using image
analysis provides a fast and inexpensive method for measuring particle size that is less
disruptive to mining operations. However, 2D image based assessments have a number
of limitations outlined in detail by Sanchidria et al. (2009), Noy (2013) and Thurley
(2013). These limitations include particle delineation errors due to lighting and material
colour variation, perspective distortion, and an inability to detect areas-of-fines or
overlapped particles in a meaningful way.
Thurley (2002, 2014) developed a system to conduct fragmentation analysis using 3D
laser data that overcomes many of the issues related to 2D and 3D image analysis
methods. No calibration, scaling or curve fitting is required as the point cloud is a direct
measurement of the muck pile. Individually detected particles are classified as areas-of-
fines, overlapped and non-overlapped particles using automated software algorithms as
described by Thurley (2009). As with any vision based technique, one can only measure
the visible surface of the material meaning size estimations are subject to surface bias due
to material segregation. Size estimations are also dependent on the scan resolution which
will define a limit below which it is not possible to delineate and size small individual
particles. However, the areas-of-visible fines can be detected and included in the
combined particle size distribution.
Page 5
Fragmentation analysis using 3D laser scanning was applied in an operating open pit by
Onederra et al. (2014). Fragmentation measurement using 3D laser scanning in an
underground mine was first conducted at EHM in 2014 as a means for safe, fast, accurate
and automated fragmentation assessment that negates many of the disadvantages of 2D
image analysis techniques.
System selection
A number of fragmentation measurement systems were reviewed as part of the blasting
and recovery optimisation project at EHM. These systems included visual estimation,
sieving, 2D and 3D imaged based methods and laser scanning. The measurement system
required the following attributes:
Data could be collected in a safe manner and does not require a draw point to be
approached to place scale markers on the rill pile and can be conducted behind a
safety bund.
Low cost and highly repeatable.
Not affected by lighting issues in an underground mine.
Not affected by colour or reflectance such as particles covered in water or dust.
Fast and can be conducted without disruption to normal mining operations.
Accurate enough to measure particles as small as 25mm.
Automated analysis software.
A visual estimation method using reference photos was used at the mine prior to this
project for simple comparison fragmentation estimation. This method was quick and
simple, but lacked the accuracy and consistency required for blast optimisation research.
Sieving was also considered, but was not practical at the mine.
A 2D image based method for fragmentation was trialled underground. Photos were
easily affected by dust in the air and muck piles needed to be washed down to remove
dust from the surface to improve particle delineation. Site personnel found the automated
processing function was not representative of the observed particle sizes due to splitting
of large rocks into multiple size fragments. As a result, processing using manual editing
was required to produce representative size distribution data and took approximately one
hour per image. For these reasons, 2D image based methods were discontinued at the
Page 6
mine. A 3D image system based on stereo photogrammetry was also tested at the mine.
Like the 2D image method, it was fast and simple to use, but suffered the same
shortcomings.
Following testing of available fragmentation measurement technology, it became
apparent that no current system was available that could meet the project requirements.
Onederra et. al. (2014) demonstrated the use of an automated 3D high-resolution laser
scanning method that met most of the requirements identified. Test measurements were
performed at EHM using 15 underground scans to configure the analysis algorithms and
demonstrated the system could provide reliable fragmentation measurements in an
underground environment.
Laser scanning equipment and methodology
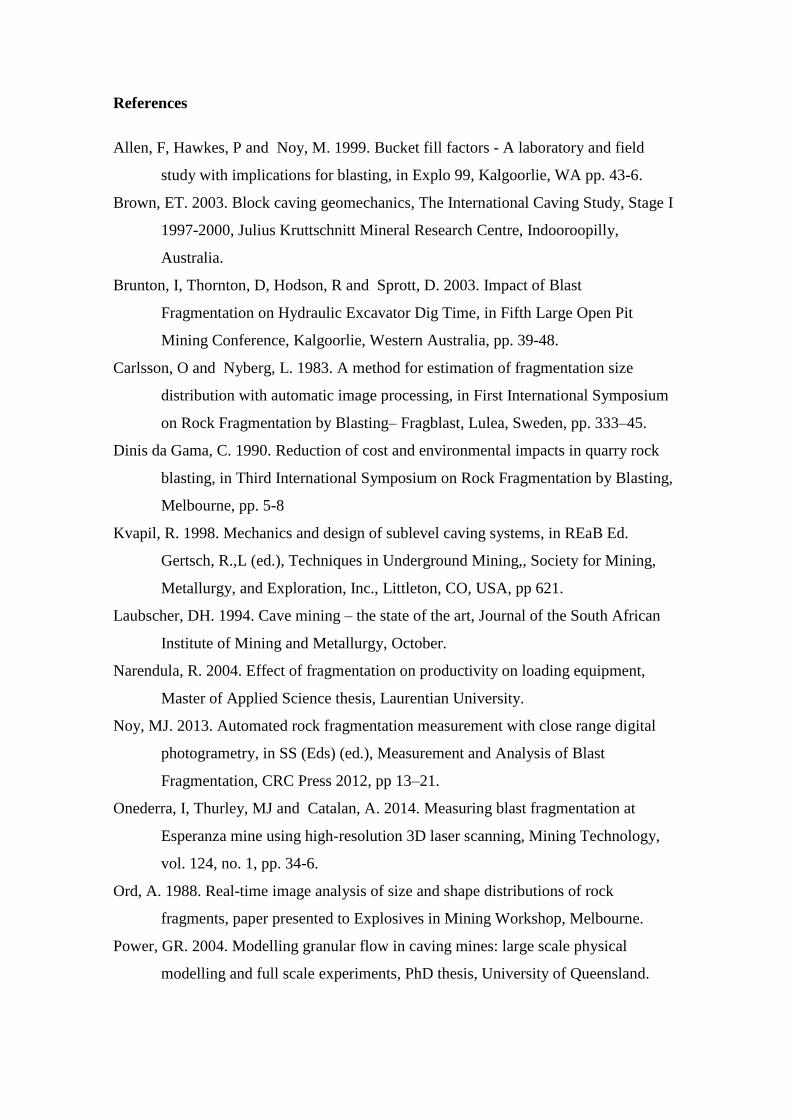
Draw point laser scanning is conducted from behind a safety bund which acts as a barrier
should rocks dislodge from the muck pile or draw point brow. The laser scanner is raised
almost to the drive backs (around 4.5m high) on a hydraulic prop mounted on the
underground vehicle as shown in Figure 3. This enables the scanner to measure all of the
rill pile over the safety bund, as well as scanning at an angle to the pile surface as close
to 90 degrees as practical. The scanning technique also negates the need to place scale
markers on the rill pile which can be unstable and prohibited to access at some
underground mines.
A scan angle of 0.02 degrees is used with the 450m range setting which results in laser
pulse repetition rate of 300 kHz resulting in 122,000 measurements per second. This
enables a draw point to be scanned in approximately 2-3 minutes. This scan resolution
results in point spacing of around 2mm or 4 to 8 million points for a draw point scan. The
total set-up and demobilisation time is in the order of several minutes making the total
time at the draw point around 10 minutes per scan. Once scanning has been completed,
the point data is then trimmed for the area of interest and the automated fragmentation
analysis completed.
Data processing and analysis
Raw scan data of the draw point was cropped manually to remove any parts of the floor,
walls and roof of the tunnel before analysis. The subsequent analysis is an automatic
Page 7
process with no manual intervention required for non-contaminated input data and
consisted of the following steps:
1. Filtering the 3D x,y,z data to remove erroneous 3D points.
2. Orthogonally re-projecting the data (also known as perspective normalisation).
This process involves transforming the 3D data so the measurement rays from
the scanner are remapped to be orthogonal to the viewing plane and parallel to
each other. This allows for simplicity in noise filtering and particle delineation.
3. Perform particle delineation.
4. Classification of the detected particles into areas-of-fines, overlapped particles,
and non-overlapped particles by analysing the 3D topology of the particle and its
surrounds as described by Thurley (2009).
5. Back projecting the data to the original perspective projection.
6. Sizing and data reporting.
The particle delineation approach is based on watershed segmentation and morphological
operators. The following is an overview of the analysis approach with detail presented in
Thurley (2013).
1. Edge detection is performed using a morphological gradient with a spherical
structuring element and then thresholded to classify edges.
2. Seed formation for the watershed segmentation is performed using a three-step
process based on distance transform, local maxima, and seed merging.
3. Watershed segmentation based on the seed regions is applied to the rock pile
data after which a filter is applied to remove small “noise” regions.
On occasion, there was steel mesh or a rock bolt on the rock pile and these objects disturb
the measured 3D surface profile of the rocks causing some rocks to be delineated into
smaller parts. These rocks can be manually delineated before analysis if required. In
practise this is only necessary for large rocks that would have a significant impact on the
resultant size distribution curve. Manual delineation of 1 or 2 large rocks was required
for 11 of the 125 data sets.
Classification is performed to identify delineated regions as areas-of-fines, overlapped
particles, and non-overlapped particles. This distinction is a key advantage of the
presented system as it ensures that overlapped particles (analogous to ice-bergs) are not
Page 8
sized based on their visible profile preventing an underestimation of size and error
towards smaller sizes. Furthermore, it ensures that areas-of-fines are not incorrectly
identified as large rocks preventing a large error towards larger sizes. Mitigating these
opposing sources of error results in a stable and reliable measurement system. Thurley
(2014) demonstrates the capacity of these algorithms to detect significant size variation
that would otherwise fail to be observed.
To adjust the system for operation in the measured draw point geometry, a new classifier
for areas-of-fines was developed. The areas-of-fines were manually specified using eight
data sets to build the classifier, then the automatic analysis was compared against these
manual sets to define which parts of the automatic delineation were fines and which were
not. Thereafter, features were calculated for each delineated region including the region
size, the “visibility ratio” (Thurley and Ng, 2008) which is a measure of the degree to
which a particle is above its neighbours, and a height measure that characterises the
relative height difference of the particle to its neighbours (Thurley, 2009). Using these
features a binomial logistic regression was performed to produce a classification function
indicating the probability that a given region is fines. Then it is possible to set the
threshold to accept regions as fines at any given level depending on the amount of false
fines detection that can be tolerated. In this work the threshold was set to be conservative
in fines detection to prevent large rocks being falsely detected as areas-of-fines. Regions
not classified as areas-of-fines are further classified into non-overlapped and overlapped
particles based on the “visibility ratio” (Thurley and Ng, 2008). Regions classified as
overlapped particles are excluded from further analysis as they are analogous to ice-bergs
and their visible surface profile is an unreliable estimate of their size.
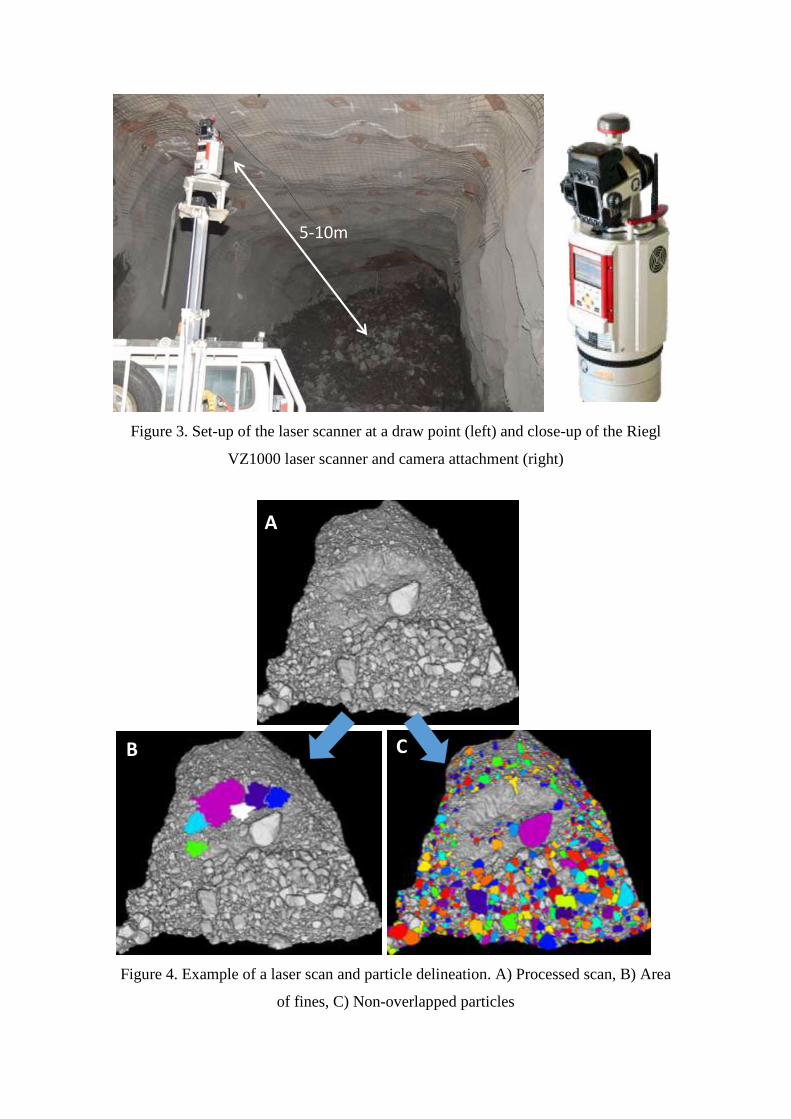
Sizing is performed on the non-overlapped particles and areas-of-fines (as shown in
Figure 4). Particles classified as areas-of-fines are allocated to a fines size class. The fines
size class is dependent on the point resolution of each individual data set but is typically
25mm or less. Non-overlapped regions are sized based on the projection of the region
onto the 2D viewing plane and calculation of the width of the best-fit rectangle of the
region.
Two size distributions are produced, one based on an estimation of the particle volume,
and the other based on the calculated particle area. A cumulative size distribution is
Page 9
produced using the size of each particle, and the calculated area or volume respectively.
For the volume based distribution, an ellipsoid volume is calculated for each non-
overlapped particle with length, width, height respectively based on the length, width and
width of the calculated best-fit-rectangle. For areas-of-fines in the volume based
distribution, the best-fit-rectangle area is also calculated, and this is scaled by an arbitrary
depth factor parameter of 250mm. For the area based distribution, the area of the best-fit-
rectangle is calculated for both the non-overlapped particles and areas-of-fines.
The volume size distribution curves have two notable disadvantages over the area curves.
Firstly, they require an arbitrary scaling factor for the fines, in this case 250mm. The
depth of 250mm was selected to match the P50 measured in scans conducted in the system
development and calibration phase. Secondly, volume curves are heavily biased towards
larger particles because the volume of these particles is proportionately much larger.
Larger rocks are more likely to be visible on the surface of the pile simply because they
are larger, and smaller rocks visible on the surface are indicative of a higher proportion
of these rocks throughout the pile in the case of a well-mixed pile. There is a non-uniform
probably of rocks being visible on the surface of the pile relative to their size and this has
previously been described as “capturing error” and detailed further by Thurley (2002).
The area curves significantly mitigate this bias providing increased emphasis on smaller
size fractions, and provide a better basis for comparison of the whole size distribution
curve.
Scan resolution testing
Resolution testing was conducted for 40 scans at 10 separate draw points to determine
the most suitable scanner settings to be used for the fragmentation study. During each
test, scanning was conducted at an angular resolution of 0.03, 0.02, 0.015 and 0.01
degrees. An example of a scan resolution test is shown in Figure 5.
It is evident in the fragmentation results that the effect of the scan resolution for the setting
selected is relatively low. This is demonstrated by the closely matched particle size
distribution curves shown in Figure 6. The P20, P50 and P80 size fractions are also similar
for the various scan resolutions and provided in Table 1. The main difference in results
from a high-resolution scan to a low-resolution scan was found to be the minimum size
Page 10
particle that could be delineated, fines detection accuracy and the total number of particles
delineated.
Material from the SLC is tipped into the orepass to move material to the underground
crusher. The flow of ore causes significant amounts of breakage and fines generation. A
number of orepass draw points were scanned as part of the resolution testing to determine
the effect of scan resolution on fines detection. Overall, particle detection and fines
content were measured consistently for scan resolution of 0.01 degrees and 0.02 degrees
as shown in Figure 7. This demonstrates that very high scan resolutions are not necessary
for accurate fines detection.
The higher resolution scans had the disadvantage of significantly longer scanning time
(around 10 minutes) and very large files sizes (up to 200 Mb). These disadvantages and
the comparison of the 40 resolution tests led to the decision that the 0.02 degrees
separation was the most suitable setting for draw point fragmentation assessment in an
underground mine.
Fragmentation measurement results
Fragmentation data from any imaging sensor or laser scanner has the disadvantage that
only the surface of the draw point rill can be measured. However, the surface
measurements do enable relative comparisons to be made, such as the difference in
fragmentation between different drill and blast designs.
A total of 125 fragmentation measures were conducted to form the baseline dataset so
that results of future drill and blast experiments could be compared. Fragmentation
measurements were taken after blasting, then every 250 tonnes until 1000 tonnes
extraction and then every 500 tonnes until the prescribed draw was reached (generally
around 5000 tonnes). Results from multiple scans from a single drawpoint were assessed
individually and as combined datasets. The combined dataset was determined by merging
the fragmentation of each scan into a single dataset.
Material larger than 1200mm is classed as oversize at the Ernest Henry mine and requires
secondary breakage prior to being tipped into the orepass system. Between 1% and 2%
of the total mine production tonnes are recorded as oversize. This corresponds closely to
Page 11
the measured fragmentation data which has an average of 1.1% material greater than
1200mm. Overall it was found that the variability in size distribution was significant
between fragmentation scans, though size distributions generally occurred within a
relatively narrow band. The overall dataset also demonstrates relatively similar
fragmentation when all the scan data for a draw point was combined into a single size
distribution and compared to other draw points (shown in Figure 8 and Table 2). It is
intended that similar datasets for different drill and blast designs will be compared to
quantify the effect blast design variables on fragmentation.
Conclusions
This paper outlined the application, testing and configuration of a high-resolution 3D
laser scanning for fragmentation measurement in an underground mine. This is the first
application of laser scanning for automated fragmentation analysis underground and was
developed to overcome limitations of image based analysis methods.
Testing of various scan resolutions found that increasing the point cloud density resulted
in no significant change in particle size distribution despite increasing the number of
particle detections. A total of 125 measurements was used to quantify the size distribution
of blasted material at the mine.
It is known that the particle size distribution of fragmented rock in a SLC mine has an
effect on most aspects of operational performance including loading equipment
productivity, gravity flow and ore recovery, secondary breakage, crushing and grinding.
With the development of the laser scanning system, rapid measurement and development
of large datasets is now possible. Fragmentation measurement using the developed laser
scanning system has enabled the mine to compile one of the largest datasets for
fragmentation analysis in a sublevel cave published to date. This data will be compared
to ongoing fragmentation measurements for a number of experiments in order to quantify
the effect of blast design variables on fragmentation and identify opportunities to improve
ore recovery and the potential to reduce blasting costs.
Word count – 3488
Page 12
References
Allen, F, Hawkes, P and Noy, M. 1999. Bucket fill factors - A laboratory and field
study with implications for blasting, in Explo 99, Kalgoorlie, WA pp. 43-6.
Brown, ET. 2003. Block caving geomechanics, The International Caving Study, Stage I
1997-2000, Julius Kruttschnitt Mineral Research Centre, Indooroopilly,
Australia.
Brunton, I, Thornton, D, Hodson, R and Sprott, D. 2003. Impact of Blast
Fragmentation on Hydraulic Excavator Dig Time, in Fifth Large Open Pit
Mining Conference, Kalgoorlie, Western Australia, pp. 39-48.
Carlsson, O and Nyberg, L. 1983. A method for estimation of fragmentation size
distribution with automatic image processing, in First International Symposium
on Rock Fragmentation by Blasting– Fragblast, Lulea, Sweden, pp. 333–45.
Dinis da Gama, C. 1990. Reduction of cost and environmental impacts in quarry rock
blasting, in Third International Symposium on Rock Fragmentation by Blasting,
Melbourne, pp. 5-8
Kvapil, R. 1998. Mechanics and design of sublevel caving systems, in REaB Ed.
Gertsch, R.,L (ed.), Techniques in Underground Mining,, Society for Mining,
Metallurgy, and Exploration, Inc., Littleton, CO, USA, pp 621.
Laubscher, DH. 1994. Cave mining – the state of the art, Journal of the South African
Institute of Mining and Metallurgy, October.
Narendula, R. 2004. Effect of fragmentation on productivity on loading equipment,
Master of Applied Science thesis, Laurentian University.
Noy, MJ. 2013. Automated rock fragmentation measurement with close range digital
photogrametry, in SS (Eds) (ed.), Measurement and Analysis of Blast
Fragmentation, CRC Press 2012, pp 13–21.
Onederra, I, Thurley, MJ and Catalan, A. 2014. Measuring blast fragmentation at
Esperanza mine using high-resolution 3D laser scanning, Mining Technology,
vol. 124, no. 1, pp. 34-6.
Ord, A. 1988. Real-time image analysis of size and shape distributions of rock
fragments, paper presented to Explosives in Mining Workshop, Melbourne.
Power, GR. 2004. Modelling granular flow in caving mines: large scale physical
modelling and full scale experiments, PhD thesis, University of Queensland.
Page 13
Sanchidria, JA, Segarra, P, Ouchterlony, F and Lopez, LM. 2009. On the accuracy of
fragment size measurement by image analysis in combination with some
distribution functions, Rock Mechanics and Rock Engineering, vol. 42, pp 95-
116.
Scott, A, Kanchibotla, S and Morrell, S. 1999. Blasting for Mine to Mill Optimisation,
paper presented to In Proceedings Explo 99.
Thurley, MJ. 2002. Three dimensional data analysis for the separation and sizing of
rockpiles in mining, PhD thesis, Monash University, Australia
Thurley, M and Ng, K. 2008. Identification and sizing of the entirely visible rocks from
a 3D surface data segmentation of laboratory rock piles, Computer Vision and
Image Understanding, vol 111, no. 2, pp. 170-178.
Thurley, MJ. 2009. Fragmentation size measurement using 3D surface imaging (in LHD
buckets), Proceedings of the Ninth International Symposium on Rock
Fragmentation by Blasting – Fragblast 9, Granada, Spain.
Thurley, MJ. 2013. Automated image segmentation and analysis of rock piles in an
open-pit mine, 2013 International Conference on Digital Image Computing:
Techniques and Applications Hobart, Australia, 26-28 November 2013.
Thurley, MJ. 2014. Measuring the visible particles for automated online particle size
distribution estimation, Proceedings of the XXVII International Mineral
Processing Congress: IMPC 2014, 20-24 October 2014, Santiago, Chile
Thurley, MJ and Andersson, T. 2008. An industrial 3D vision system for size
measurement of iron ore green pellets using morphological image segmentation,
Minerals Engineering, vol. 21, no. 5, pp. 405-15.
Page 14
Table 1. Results of resolution scan data shown in
Figure
Scan
resolution
Number of
Particles
Mean size
(mm)
P20
(mm)
P50
(mm)
P80
(mm)
Fines
(<50mm)
Measured
Minimum
(mm)
Measured
Maximum
(mm)
0.01 deg 934 123 152 269 416 2% 10.5 672
0.015 deg 793 136 165 277 415 2% 12 683
0.02 deg 724 142 162 279 404 2% 16.5 685
0.03 deg 608 155 169 296 436 1% 22.5 661
Table 2. Summary of 125 fragmentation measurements for 10 blast rings
(measurements by ‘area’)
Ring
Number of
measurements
% Fines
(<50mm) P50 (mm) P80 (mm)
% Oversize
(>1200mm)
OD9 R37 15 16.2% 222 364 0.0%
OD9 R38 15 12.0% 235 381 0.6%
OD9 R39 13 14.4% 232 375 0.0%
OD9 R40 10 13.1% 213 398 1.0%
OD11 R34 6 4.9% 251 406 0.0%
OD11 R36 13 13.9% 252 398 1.1%
OD11 R37 15 11.6% 215 392 3.8%
OD11 R38 14 17.5% 204 353 0.0%
OD11 R39 15 12.7% 215 407 0.6%
OD11 R40 9 12.0% 245 510 4.2%
Average 12.8% 228.5 398.6 1.1%
Page 15
Figure 1. Location of Ernest Henry and Australian Glencore Copper Operations
Figure 2. Perspective view of the mine including the SLC and underground
infrastructure
Figure 3. Set-up of the laser scanner at a draw point (left) and close-up of the Riegl
VZ1000 laser scanner and camera attachment (right)
Figure 4. Example of a laser scan and particle delineation. A) Processed scan, B) Area
of fines, C) Non-overlapped particles
Figure 5. An example of a scan resolution test showing the non-overlapped particles.
Scan angle setting of A) 0.01 degrees, B) 0.015 degrees, C) 0.02 degrees, D) 0.03
degrees.
Figure 6. Particle size distribution of scans conducted at a draw point shown in Figure 5
Figure 7. Scan resolution testing in orepass draw points with high fines content
Figure 8. Combined particle size distributions for the 125 baseline fragmentation
measurements for 10 draw points
Page 16
Figure 1. Location of Ernest Henry and Australian Glencore Copper Operations
Figure 2. Perspective view of the mine including the SLC and underground
infrastructure
Page 17
Figure 3. Set-up of the laser scanner at a draw point (left) and close-up of the Riegl
VZ1000 laser scanner and camera attachment (right)
Figure 4. Example of a laser scan and particle delineation. A) Processed scan, B) Area
of fines, C) Non-overlapped particles
5-10m
A
B C
Page 18
Figure 5. An example of a scan resolution test showing the non-overlapped particles.
Scan angle setting of A) 0.01 degrees, B) 0.015 degrees, C) 0.02 degrees, D) 0.03
degrees.
18
0.01 degrees
1346 non-overlapped particles
detected between 15 and 529mm
3 areas-of-fines detected
0.015 degrees
1203 non-overlapped particles
detected between 20 and 529mm
0 areas-of-fines detected
0.02 degrees
982 non-overlapped particles
detected between 28 and 536mm
0 areas-of-fines detected
0.03 degrees
707 non-overlapped particles
detected between 37.5 and 524mm
0 areas-of-fines detected
This data sets starts to miss rocks,
several medium and mostly visible
rocks are not identified
A B
C D
Page 19
Figure 6. Particle size distribution of scans conducted at a draw point shown in Figure 5
Figure 7. Scan resolution testing in orepass draw points with high fines content
0%
10%
20%
30%
40%
50%
60%
70%
80%
90%
100%
10 100 1000
Cu
mu
lati
ve P
erce
nt
Pas
sin
g
Particle Size (mm)
1600 OD37 R90 1250t Fragmentation (by area)
0.01 deg
0.015 deg
0.02 deg
0.03 deg
0%
10%
20%
30%
40%
50%
60%
70%
80%
90%
100%
10 100 1000
Cu
mu
lati
ve P
erce
nt
Pas
sin
g
Particle Size (mm)
Orepass Fragmentation (by area)
EOP B 0.02 deg
EOP B 0.01 deg
WOP B 0.02 deg
WOP B 0.01 deg
EOP C 0.02 deg
EOP C 0.01 deg
Page 20
Figure 8. Combined particle size distributions for the 125 baseline fragmentation
measurements for 10 draw points
0%
10%
20%
30%
40%
50%
60%
70%
80%
90%
100%
10 100 1000
Cu
mu
lati
ve P
erce
nt
Pas
sin
g
Particle Size (mm)
Combined Particle Size Distribution (by area)
OD9 R37
OD9 R38
OD9 R39
OD9 R40
OD11 R34
OD11 R37
OD11 R36
OD11 R38
OD11 R39
OD11 R40