Page 1
Mathematical Theory and Modeling www.iiste.org
ISSN 2224-5804 (Paper) ISSN 2225-0522 (Online)
Vol.4, No.9, 2014
183
Application of Max-min Ant System in Modelling the Inspectional
Tour of Main Sales Points of Ghacem In Ghana.
Francis Julius Gyebil1*
, Francis Y.Anyan1, Isaac Kwasi Adu
2, L. Brew
3, Marshall Wellington Blay
4& Mary
Ann Yeboah1
1Lecturer, Mathematics & Statistics Department, Kumasi Polytechnic, Box 854,Kumasi, Ghana.
2Lecturer,
Mathematics Department, Valley View Univesity, Box. 183. Ghana.
3Lecturer, Mathematics Department. University of Mines and Technology, , Tarkwa, Ghana.
4Lecturer, Accountancy Department, Takoradi Polytechnic, Ghana.
E-mail of the corresponding author: *[email protected]
Abstract
Ant colony optimization (ACO) has widely been applied to solve combinatorial optimization problems in recent
years. There are few studies, however, on its convergence time, which reflects how many iteration times ACO
algorithms spend in converging to the optimal solution. This study aims at using a Max-Min Ant System
(MMAS), which belongs to Ants Algorithm to obtain optimal tour of the Travelling Salesman Problem of
Ghacem. The study considered a twelve city node graph (major sales point of Ghacem) with the nodes
representing the twelve cities, and the edges representing the major roads linking the cities. Secondary data of
the inter-city driving distances was obtained from the Ghana Highway Authority. The results showed that the
objective of finding the minimum tour from the Symmetric Travelling Salesman Problem (STSP) model by
using Max-Min Ants System (MMAS) Algorithm was successfully achieved. The optimal route of total cost
distance was found to be 1873Km. Therefore, Ghacem could minimize the cost of transportation as the
Directors of Ghacem Ghana go on a tour to check on the sales performance of the twelve key Distributors in
the major sales points in Ghana, starting from Tema where the company’s Head office is sited. It is very
prudent for the company to rely on MMAS model to reduce fuel cost in order to maximize profit. In doing so it
go along way to increase the tax revenue of the state.
Keywords: Max-Min Ants System (MMAS), Ant Colony Optimization (ACO), Algorithm, Travelling Salesman
(TSP), Ghacem
1. Introduction
Ant colony optimization (ACO) has widely been applied to solve combinatorial optimization problems in recent
years. There are few studies, however, on its convergence time, which reflects how many iteration times ACO
algorithms spend in converging to the optimal solution. Based on the absorbing Markov chain model, they
analyzed the ACO convergence time. Hen Huanq et al. (2008) presented a general result for the estimation of
convergence time to reveal the relationship between convergence time and pheromone rate. This general result
was then extended to a two-step analysis of the convergence time, which included the following; the iteration
time that the pheromone rate spends on reaching the objective value and the convergence time that was
calculated with the objective pheromone rate in expectation.
Many strategies for ACO have been studied, but little theoretical work has been done on ACO’s parameters α and
β, which control the relative weight of pheromone trail and heuristic value. Shengxianq Yang et al. (2011)
described the importance and functioning of α and β, and drawn a conclusion that a fixed β may not enable ACO to
use both heuristic and pheromone information for solution when α= 1. Abdullah.R.Khader et al. (2008) proposed
an ant colony optimization (ACO) algorithm together with traveling salesman problem (TSP) approach to
investigate the clustering problem in protein interaction networks (PIN). They named this combination as
ACOPIN. Stitizle et al. (1999) gave an overview on the available ACO algorithms for the TSP. they first
introduced the TSP.
Page 2
Mathematical Theory and Modeling www.iiste.org
ISSN 2224-5804 (Paper) ISSN 2225-0522 (Online)
Vol.4, No.9, 2014
184
Shan et al. (2010) addressed an integrated model that schedules multi-item replenishment with uncertain demand
to determine delivery routes and truck loads, where the actual replenishment quantity only becomes known upon
arrival at a demand location. Yuren et al. (2006) presented the first rigorous analysis of a simple ACO algorithm
called (1 + 1) MMAA (Max-Min ant algorithm) on the TSP. Amirahmad et al. (2005) reviewed literature of Ant
Colony Optimization for suspended sediment estimation. Yong et al. (2006) presented a paper that proposed an
adaptive strategy for the volatility rate of pheromone trail according to the quality of the solutions found by
artificial ants. They observed that experimental results of computing traveling salesman problems indicated that
the proposed algorithm was more effective than other ant methods.
White et al. (2008) proposed the addition of Genetic Algorithms to Ant Colony System (ACS) applied to
improve performance. Two modifications were proposed and tested. They found that the performance of
ACS-TSP could be improved by using the suggested values. Eduardo et al. (2009) used a model to solve the
municipal waste collection problem by containers was presented, which applies a concept of partial collection
sequences that must be joined to minimize the total collection distance. In a case study which chose the
well-known travelling salesman problem with time windows, it was clearly demonstrated that Beam-ACO,
even when bounding information was replaced by stochastic sampling, may have important advantages over
standard ACO algorithms (Lopez et al., 2005).
Yunmming et al. (2010) combined with the idea of the Bean Optimization algorithm (BOA), the ant colony
optimization (ACO) algorithm was presented to solve the well-known traveling salesman problem (TSP).
Recently, researchers have been dealing with the relation of ACO algorithms to the other methods for learning
and optimization. An example, Birattari et al. (2002) presented work that relates ACO to the fields of optimal
control and reinforcement learning. Meuleau et al. (2002) showed that the pheromone update as outline in the
proof-of-concept application to the TSP (Dorigo et al. 1991, 1996) is very similar to a stochastic gradient ascent
in the space of pheromone values. Blum (2004) proposed the first implementation of SGA-based ACO
algorithms where it was shown that SGA-based pheromone updates avoid certain types of search bias. Zlochin et
al. (2004) proposed a unifying framework from so-called model-based search (MBS) algorithms. An MBS
algorithm is characterized by the use of a (parameterized) probabilistic.
Merkle et al (2002) identified the competition between the ants as the main driving force of the algorithm.
Nelson et al. (2009) applied the model to a waste collection sector of the San Pedro de la Paz commune in Chile,
obtaining recollection routes with less total distance with respect to the actual route utilized and to the solution
obtained by a previously developed approach.
Ghacem company directors are usually tasked in every two months period to embark on tour in order to check
the sales of the company’s goods. Ghacem has a number of accredited distributor’s through-out the country. Their
choice of the routes for the visit was done without considering any Mathematical model. This study aims at using
a Min-Max Ant System (MMAS), which belongs to Ants Algorithm to obtain optimal tour of the Symmetric
Traveling Salesman Problem (STSP).
2. Materials and Methods
2.1 Study Area and Source of Data
Ghacem Ghana is located at both Takoradi and Tema which are coastal cities in the country. The antennary of the
inspectoral team of the marketing department of Ghacem Ghana was collected. This antennary shows the tour
route of the team whenever they embark the inspectional tour to the key distributors in the various regional
Page 3
Mathematical Theory and Modeling www.iiste.org
ISSN 2224-5804 (Paper) ISSN 2225-0522 (Online)
Vol.4, No.9, 2014
185
capitals in the country, Ghana.
2.2 Connectivity matrix for the twelve major sales points cities of Ghacem in Kilometers (Km)
Figure 1. The road network of the twelve (12) major sales points of Ghacem and their geographical locations on
the map of Ghana.
2.3 The distance matrix was formulated from the connectivity graph of figure 1 .Where the cities have no direct
link ,the minimum distance along the edges are considered .The cells indicated inf shows that there is no direct
distance , thus 0ij jic c from equation (1) below.
Obuasi
Tema
C-coast
Accra
34
2
173
29
Bolga
Wa
Sunyan
i Kuma
si
Takorad
i
36
8
37
8
314
170
615
35
7
30
0
19
4
74
88 136
27
0
163
388
372 133
22
1
23
4
476
Tamale
Ho
Koforidua
114
Page 4
Mathematical Theory and Modeling www.iiste.org
ISSN 2224-5804 (Paper) ISSN 2225-0522 (Online)
Vol.4, No.9, 2014
186
Table 1: Ghana Highways Authority data indicating the matrix for the weighted graph of the major roads linking
twelve major Sales of points of Ghacem in Ghana in Kilometers
City/cityj Tema Accra C-coast Takoradi Obuasi Kumasi Koforidua Sunyani Wa Bolga Tamale Ho
Tema 0 29 inf Inf Inf Inf Inf Inf inf Inf inf 136
Accra 29 0 144 Inf Inf 270 85 Inf inf Inf inf 165
C-coast inf 144 0 74 133 221 Inf Inf inf Inf inf inf
Takoradi inf Inf 74 0 Inf 242 Inf Inf inf Inf inf inf
Obuasi inf Inf 133 Inf 0 88 Inf Inf inf Inf inf inf
Kumasi inf 270 221 242 88 0 194 130 inf Inf 388 inf
Koforidua inf 85 inf Inf Inf 194 0 Inf inf Inf inf inf
Sunyani inf Inf inf Inf Inf 130 Inf 0 378 Inf 388 inf
Wa inf Inf inf Inf Inf Inf Inf 378 0 368 314 inf
Bolga inf Inf inf Inf Inf Inf Inf Inf 368 0 170 614
Tamale inf Inf inf Inf Inf 388 Inf 300 314 170 0 476
Ho 136 165 Inf Inf Inf Inf 163 Inf inf 614 476 0
Table 2: Twelve major sales points of Ghacem in Ghana and their numerical representation
2.3 Mathematical Formulation of TSP Model
The problem can be defined as follows: Let G = (V,E) be a complete undirected graph with vertices V, |V|=n,
where n is the number of cities, and edges E with edge length dij for (i,j). We focus on the symmetric TSP case in
which i j j iC C , for all (i,j). Where ijC The cost matrix representing the distance from city i to city j .
The problem PI is;
Minimize i j i j
i v j v
Z c x
(1)
Subject to
City Allocated number
Tema 1
Accra 2
Cape Coast 3
Takoradi 4
Obuasi 5
Kumasi 6
Koforidua 7
Sunyani 8
Wa 9
Bolgatanga 10
Tamale 11
Ho 12
Page 5
Mathematical Theory and Modeling www.iiste.org
ISSN 2224-5804 (Paper) ISSN 2225-0522 (Online)
Vol.4, No.9, 2014
187
1i j
j v
j i
x i v
(2)
1i j
i v
x j v
i j
(3)
| | 1 ,i j
i s j s
x s s v s
(4)
0 1 ,i jx or i j v (5)
The problem is an assignment problem with additional restrictions that guarantee the exclusion of subtours in the
optimal solution. Recall that a subtour in V is a cycle that does not include all vertices (or cities). Equation (1) is
the objective function, which minimizes the total distance to be traveled.
Constraints (2) and (3) define a regular assignment problem, where (2) ensures that each city is entered from
only one other city, while (2) ensures that each city is only departed to on other city. Constraint (4) eliminates
subtours. Constraint (5) is a binary constraint, where i jx = 1 if edge (i,j) in the solution and i jx = 0,
otherwise.
2.3.1 Algorithm
The Pseudo-code of the algorithm applied to solve the MMAS is shown below.
Procedure of MMAS
Step 1
The Directors Inspectional Tour (DIT), whose serve as Artificial Ants in this study, graph was
transformed into a TSP graph
Step2
The initial pheromone matrix was computed in Table 5.
Set gL best ,iterate=TRUE, i=0
While iterate = TRUE
Set i=i+1
For h =1 to m
Set tabu _h=
Step 3
A city , ijC was randomly selected by ant k as the starting point of the path
ijC was added to tabu_h
For j=I to n-1
Step 4
The next city ,C, was selected according to probability decision rule in (2.2)
City C was added to tabu_h
End-for
Step 5
Compute the length of the path L(h)
Page 6
Mathematical Theory and Modeling www.iiste.org
ISSN 2224-5804 (Paper) ISSN 2225-0522 (Online)
Vol.4, No.9, 2014
188
If gL _best >Lb
Set gL _best >Lb=Lb
If gL _best has not been improved during the last 15 iterations
Set iterate = FALSE
end -if
If ,Lx Ly ,1 ,y
y x y mx
Step 6
Reset the pheromone matrix trails to the value Max
else
update the pheromone matrix according to the expression in (4.5)
end-if
end while
Step 7
The TSP solution was then transformed into DIT solution.
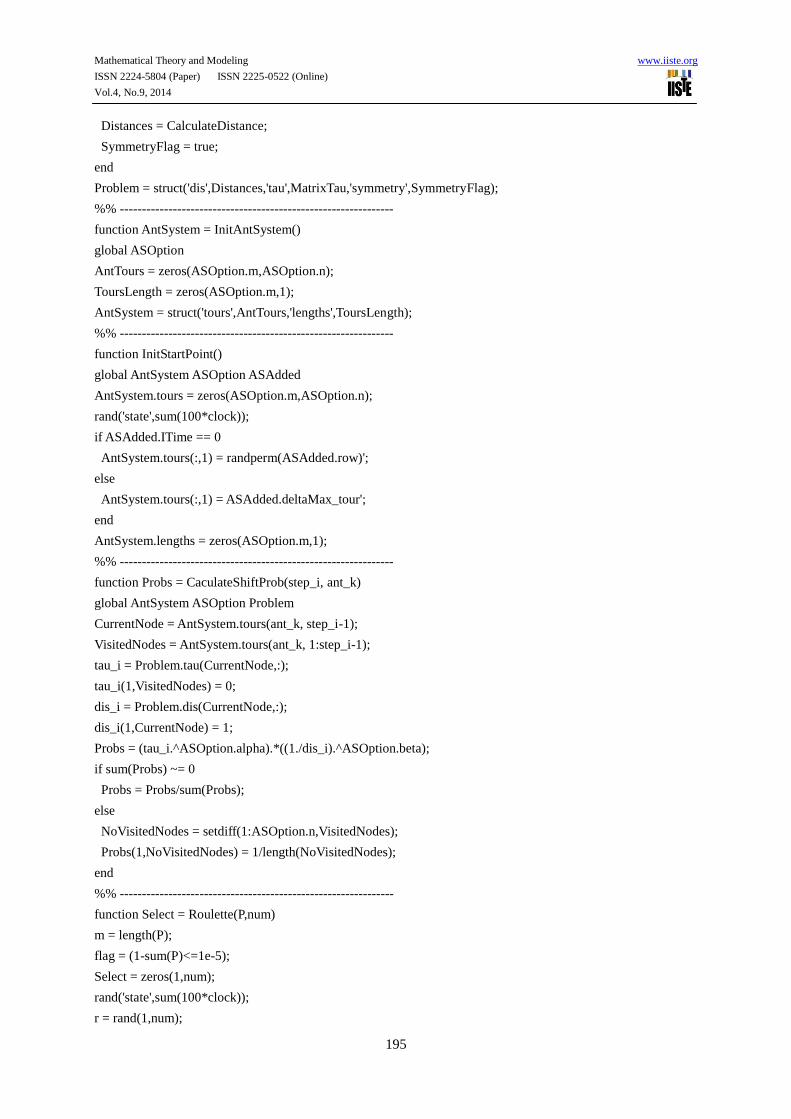
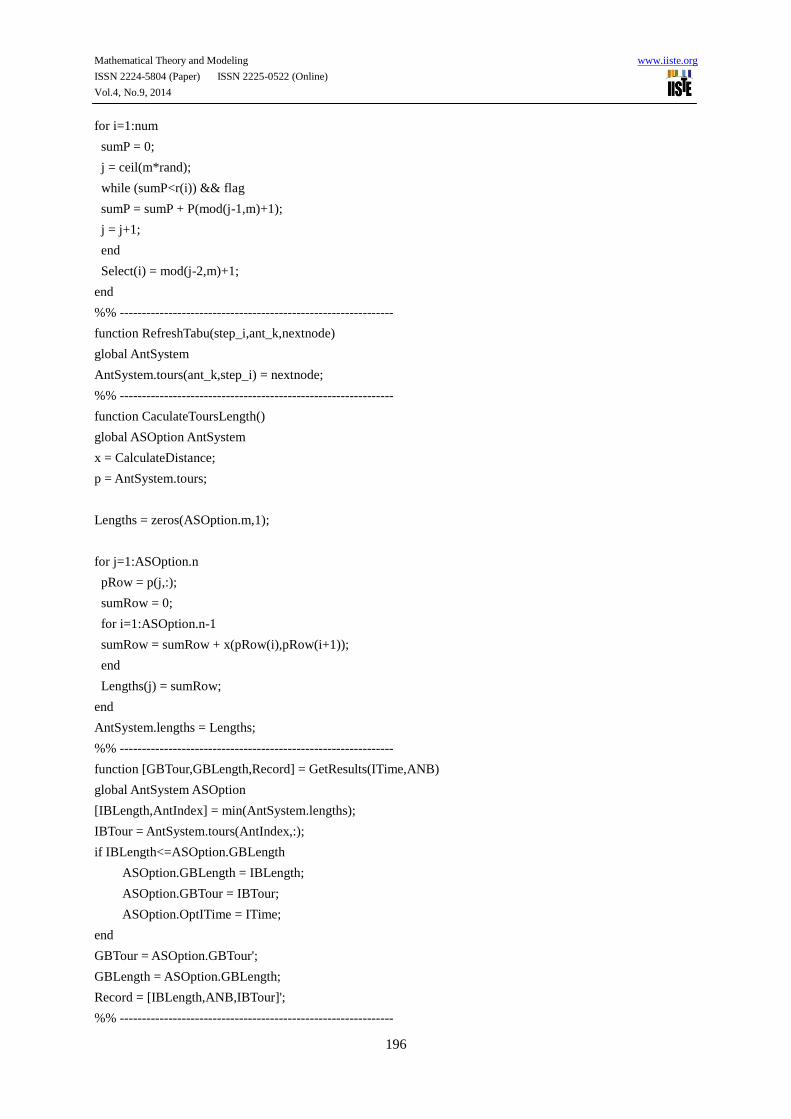
2.4 Computational Method
The MMAS proposed by Stuuzle and Hoos, ( 2000) was coded in Matlab language. The tests were performed on a
personal computer, Dell core 5 Dual processor, 3.0GHZ with RAM 2G memory and working on Window 7
operating system.
3. Analysis and Results
Table 3: Connectivity matrix for the twelve major sales points cities of Ghacem in Kilometers (Km) (All pair
shortest path from Table 2 by Floyd Warshall’s Algorithm)
City/cityj 1 2 3 4 5 6 7 8 9 10 11 12
1 0 29 173 247 352 299 114 429 816 750 612 136
2 29 0 144 218 358 270 85 400 778 770 641 165
3 173 144 0 74 133 221 229 351 729 779 609 309
4 247 218 74 0 213 242 303 372 750 800 630 383
5 352 358 133 213 0 88 282 218 596 646 476 445
6 299 270 221 242 88 0 194 130 508 558 388 357
7 114 85 229 303 282 194 0 324 702 752 582 163
8 429 400 351 372 218 130 324 0 378 470 300 487
9 816 778 729 750 596 508 702 378 0 368 314 790
10 750 770 779 800 646 558 752 470 368 0 170 615
11 612 641 609 630 476 388 582 300 314 170 0 476
12 136 165 309 383 445 357 163 487 790 615 476 0
Page 7
Mathematical Theory and Modeling www.iiste.org
ISSN 2224-5804 (Paper) ISSN 2225-0522 (Online)
Vol.4, No.9, 2014
189
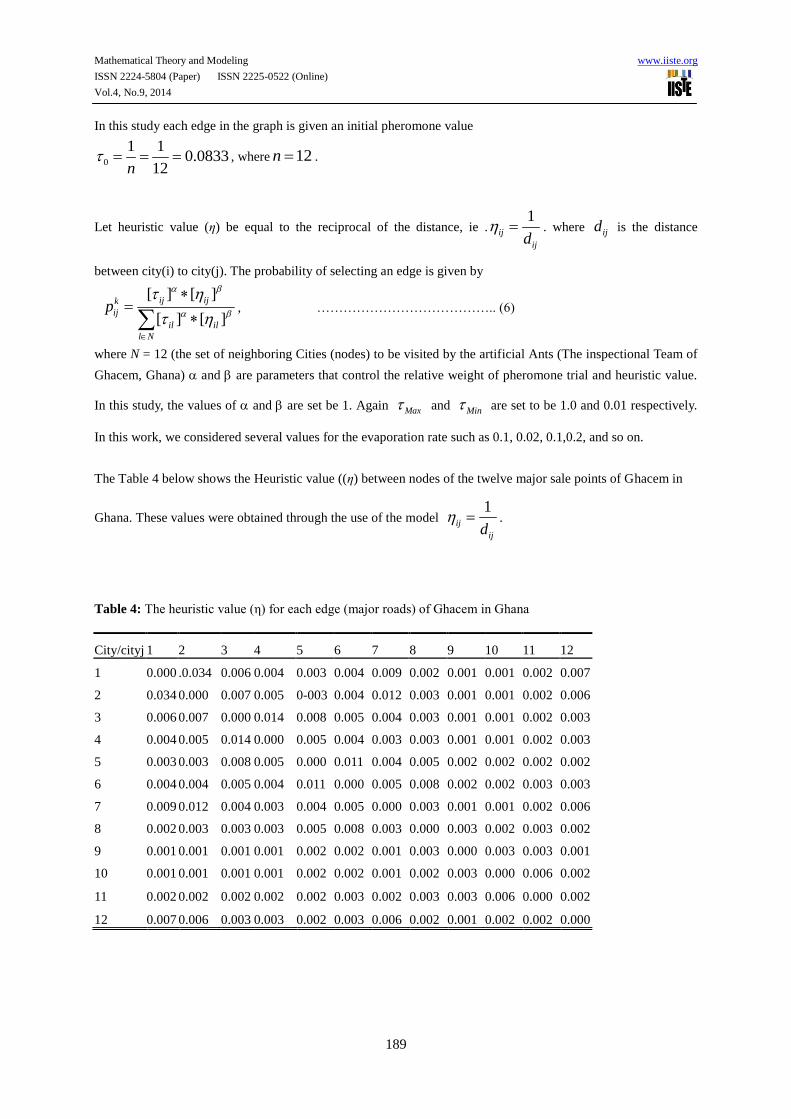
In this study each edge in the graph is given an initial pheromone value
0
1 10.0833
12n , where 12n .
Let heuristic value (η) be equal to the reciprocal of the distance, ie .1
ij
ijd . where ijd is the distance
between city(i) to city(j). The probability of selecting an edge is given by
[ ] [ ]
[ ] [ ]
ij ijk
ij
il il
l N
p
, ………………………………….. (6)
where N = 12 (the set of neighboring Cities (nodes) to be visited by the artificial Ants (The inspectional Team of
Ghacem, Ghana) and are parameters that control the relative weight of pheromone trial and heuristic value.
In this study, the values of and are set be 1. Again Max and Min are set to be 1.0 and 0.01 respectively.
In this work, we considered several values for the evaporation rate such as 0.1, 0.02, 0.1,0.2, and so on.
The Table 4 below shows the Heuristic value ((η) between nodes of the twelve major sale points of Ghacem in
Ghana. These values were obtained through the use of the model 1
ij
ijd .
Table 4: The heuristic value (η) for each edge (major roads) of Ghacem in Ghana
City/cityj 1 2 3 4 5 6 7 8 9 10 11 12
1 0.000 .0.034 0.006 0.004 0.003 0.004 0.009 0.002 0.001 0.001 0.002 0.007
2 0.034 0.000 0.007 0.005 0-003 0.004 0.012 0.003 0.001 0.001 0.002 0.006
3 0.006 0.007 0.000 0.014 0.008 0.005 0.004 0.003 0.001 0.001 0.002 0.003
4 0.004 0.005 0.014 0.000 0.005 0.004 0.003 0.003 0.001 0.001 0.002 0.003
5 0.003 0.003 0.008 0.005 0.000 0.011 0.004 0.005 0.002 0.002 0.002 0.002
6 0.004 0.004 0.005 0.004 0.011 0.000 0.005 0.008 0.002 0.002 0.003 0.003
7 0.009 0.012 0.004 0.003 0.004 0.005 0.000 0.003 0.001 0.001 0.002 0.006
8 0.002 0.003 0.003 0.003 0.005 0.008 0.003 0.000 0.003 0.002 0.003 0.002
9 0.001 0.001 0.001 0.001 0.002 0.002 0.001 0.003 0.000 0.003 0.003 0.001
10 0.001 0.001 0.001 0.001 0.002 0.002 0.001 0.002 0.003 0.000 0.006 0.002
11 0.002 0.002 0.002 0.002 0.002 0.003 0.002 0.003 0.003 0.006 0.000 0.002
12 0.007 0.006 0.003 0.003 0.002 0.003 0.006 0.002 0.001 0.002 0.002 0.000
Page 8
Mathematical Theory and Modeling www.iiste.org
ISSN 2224-5804 (Paper) ISSN 2225-0522 (Online)
Vol.4, No.9, 2014
190
Table 5: Initial pheromone value 0( ) for each edge (major roads)
City/cityj 1 2 3 4 5 6 7 8 9 10 11 12
1 0 0.083 0.083 0.083 0.083 0.083 0.083 0.083 0.083 0.083 0.083 0.083
2 0.083 0 0.083 0.083 0.083 0.083 0.083 0.083 0.083 0.083 0.083 0.083
3 0.083 0.083 0 0.083 0.083 0.083 0.083 0.083 0.083 0.083 0.083 0.083
4 0.083 0.083 0.083 0 0.083 0.083 0.083 0.083 0.083 0.083 0.083 0.083
5 0.083 0.083 0.083 0.083 0 0.083 0.083 0.083 0.083 0.083 0.083 0.083
6 0.083 0.083 0.083 0.083 0.083 0 0.083 0.083 0.083 0.083 0.083 0.083
7 0.083 0.083 0.083 0.083 0.083 0.083 0 0.083 0.083 0.083 0.083 0.083
8 0.083 0.083 0.083 0.083 0.083 0.083 0.083 0 0.083 0.083 0.083 0.083
9 0.083 0.083 0.083 0.083 0.083 0.083 0.083 0.083 0 0.083 0.083 0.083
10 0.083 0.083 0.083 0.083 0.083 0.083 0.083 0.083 0.083 0 0.083 0.083
11 0.083 0.083 0.083 0.083 0.083 0.083 0.083 0.083 0.083 0.083 0 0.083
12 0.083 0.083 0.083 0.083 0.083 0.083 0.083 0.083 0.083 0.083 0.083 0
The Table 5 shows the initial pheromone value 0( ) for each edge. In this study each edge in the graph is given
an initial pheromone value 0
1 10.0833
12n .where n is the number of cities to be visited by the Ant.
The MMAS algorithm was coded used to find the minimum tour of each ant and then selected the best ant tour.
After performing 6652800 iterations the result for the tour of each ant is shown in Table 6 below.
Table 6: The tour of an individual Ant and their various distance covered
Ant
tour
Dist.
Cov.
By
ant
Ant 1 9 12 2 1 7 4 3 5 6 8 11 10 1874
Ant 2 9 10 11 8 6 5 3 4 7 2 1 12 2238
Ant 3 10 5 6 8 4 3 1 2 7 12 11 9 2272
Ant 4 10 8 6 5 7 2 1 12 3 4 11 9 2445
Ant 5 12 3 4 6 5 11 10 8 9 7 1 2 2908
Ant 6 5 9 10 11 6 4 3 1 2 7 12 8 2397
Ant 7 9 7 2 1 12 11 10 8 6 5 3 4 2541
Ant 8 12 1 2 7 6 5 3 4 10 11 8 9 3041
Ant 9 9 6 5 4 3 1 2 7 12 11 10 8 2319
Ant10 8 4 3 5 6 1 2 7 12 10 11 9 2348
Ant11 9 11 10 8 6 4 3 5 7 2 1 12 2541
Ant12 12 2 1 7 3 4 5 6 8 11 10 9 2505
Page 9
Mathematical Theory and Modeling www.iiste.org
ISSN 2224-5804 (Paper) ISSN 2225-0522 (Online)
Vol.4, No.9, 2014
191
Considering the total distances covered by the individual Ants, the optimal tour came out to be
1 7 4 3 5 6 8 11 10 9 12 2 1
This was obtained by Ant 1.Thus the total tour distance came out to be optimal solution, which has a total
distance of 1874km, representing the tour Tema → Koforidua → Takoradi→ Cape coast → Obuasi → Kumasi
→ Sunyani → Tamale → Bolgatanga → Wa → Ho → Accra → Tema would be preferred to the usual route
which is represented as Tema → Accra → Cape coast → Takoradi → Obuasi → Kumasi → Koforidua →
Sunyani → Wa → Bolgatanga → Tamale → Ho → Tema. The total cost distance of their usual tour is
2319Km.
4. Conclusion
The objective of finding the minimum tour from the symmetric TSP model by using Max-Min Ants System
(MMAS) Algorithm was successfully achieved. The optimal route is represented as
Tema → Koforidua → Takoradi→ Cape coast → Obuasi → Kumasi → Sunyani → Tamale → Bolgatanga →
Wa → Ho → Accra → Tema
The total cost distance of the optimal route is 1874km which is far better than their usual tour distance of
2319km . The Ghacem company is therefore advise to make use the of programme to obtain the optimal tour in
the event of cities to be visited being perturbed. We therefore suggested that plying the routes that came out of
the MMAS model would be of help to minimize their cost since the route gave the optimal cost of 1874Km.
We once again recommend further research into this study by researchers.
References
1. Marco Dorigo, et al: Ant colonies for the traveling salesman problem, TR / IRIDIA / 1996- Université
Libre de Bruxelles Belgium
2. M. Dorigo and T. Stutzle. The ant colony optimization metaheuristic: Algorithms, applications, and
advances, 2002.
3. Gambardella .L.M and Marco Dorigo,(1996). Solving symmetric and asymmetric TSPs by ant colonies,
in: Proceedings of the IEEE International Conference on Evolutionary Computation(ICEC’96), IEEE
Press, Piscataway, USA, 1996, pp. 622–627.
4. Stuuzle and Hoos,(2000). Ant-Q: A reinforcement learning approach to the traveling salesman problem,
Proceedings of the 11th International Conference on Machine Learning, Morgan Kaufmann, San
Francisco, CA, 1995, pp.252–260.
5. T. Stutzle and H.H. Hoos.(1999), MAX-MIN Ant System and Local Search for Combinatorial
Optimization Problems. In S. Voss, S. Martello, I.H. Osman, and C. Roucairol, editors,
Meta-Heuristics: Advances and Trends in Local Search Paradigms for Optimization, pages 313-329.
Kluwer, Boston,
6. Yang,J ,Wu C,Lee H,Liang Y, (2008) .Solving traveling Salesman problems generalized chromosome
genetic algorithm ,Progress in Natural Science,Volume 18,Issue 7,10th
July Pages 887-892.
7. Shangxi Yang et al,(2011) . Initial exploration of early carotid arteriosclerosis in type 2 diabetes
mellitus patients evaluated by ultrasonic E-Tracking imaging technology[J].Zhongguo Yi Xue Ying
Xiang Ji Shu, , 23(7): 986-989. Chinese with abstract in English.
8. Abdullah, R., Khader, et al,(2009): An imprvoved ant colony optimization algorithm for clustering
proteins in Protein Interaction Network. In: International Conference on Software Engineering &
Computer Systems, ICSECS 2009
9. Yuren Zhou, et al,(2013) "Ant Colony Optimization with Combining Gaussian Eliminations for Matrix
Multiplication" IEEE Transactions On Cybernetics, Vol. 43,
10. Shen Xioa-Hong et al,(2011), International Conference on Consumer Electronics, Communications and
Networks - CECNet , DOI: 10.1109/CECNET.2011.5768873
11. Blum, C.,( 2004). Theoretical and Practical Aspects of Ant Colony Optimization, Dissertations in
Artificial.Intelligence, 282, Akademische Verlagsgesellschaft Aka GmbH, Berlin, Germany
12. M. Birattari, et al, (2004).Workshop on Ant Colony Optimization and Swarm Intelligence, Lecture
Notes in Computer Science, Springer, Berlin, Germany, 317:
119–130.
Page 10
Mathematical Theory and Modeling www.iiste.org
ISSN 2224-5804 (Paper) ISSN 2225-0522 (Online)
Vol.4, No.9, 2014
192
13. Merkle,et al,( 2002). Ant colony optimization for resource-constrained project scheduling, IEEE Trans.
Evol. Comput., 6(4): 333–346.
14. Zlochin, M., M. Birattari, N. Meuleau and M. Dorigo, (2004). Model-based search for combinatorial
optimization: a critical survey, Ann. Oper. Res., 131(1–4): 373–395.
15. Meuleau,et al, (2002). Ant colony optimization and stochastic gradient descent, Artif. Life, 8(2):
103–121.
16. Amirahmad dehghani (2005) ,Gorgan University of Agricultural Sciences and Natural Resources .Lee
Teang Shui – Faculty of Engineering University Putra Malaysia.
17. Yong. QIN, et al,(2009) "Ant Colony Optimization Based on Adaptive Volatility Rate of Pheromone
Trail," Int'l J. of Communications, Network and System Sciences, Vol. 2 No. 8, pp. 792-796. doi:
10.4236/ijcns.2009.28092.
18. Eduardo Moreno ,et al,(2012), Enrique Rubio, A New Algorithm for the Open-Pit Mine
Production Scheduling Problem, Operations Research, v.60 n.3, p.517-528, 05-06 2012
19. M. Lopez-Ib ´ a´nez.et al,(2011), “The irace package, iterated race for automatic algorithm
configuration,” IRIDIA,Universite Libre de Bruxelles, Belgium, Tech. Rep. TR/IRIDIA/2011-004,
2011. http://iridia.ulb.ac.be/IridiaTrSeries/IridiaTr2011-004.pdf.
20. White. T, et al,(2002). Using genetic algorithms to optimize ACS-TSP. In: Proc. 3rd Int. Workshop on
Ant Algorithms, Brussels, Belgium, pp. 282–287 (2002)
21. Bryn Nelson,et al (2013).Accountable Care Organizations (ACO) Gain Popularity with Physicians in
Wake of Added Incentives, Revised Federal Rules.
Appendix A
Appendix B
Matlab Programme
function ACOtest(inputMatrix)
clc
%% START declare of own Variable for testing
global ASAdded
[row,col] = size(inputMatrix);
if row > col || col > row
end
ASAdded.inputMatrix = inputMatrix;
ASAdded.row = row;
ASAdded.col = col - 1;
ASAdded.MaxDist = max(max(inputMatrix)) * ASAdded.col;
Dimension = ASAdded.row;
NodeWeight = [];
disp(['AS start at ',datestr(now)]);
%%%%%%%%%%%%% the key parameters of Ant System %%%%%%%%%
data_input = ASAdded.inputMatrix
MaxITime=1e3;
AntNum=Dimension; %depends on # of nodes
alpha=1;
Page 11
Mathematical Theory and Modeling www.iiste.org
ISSN 2224-5804 (Paper) ISSN 2225-0522 (Online)
Vol.4, No.9, 2014
193
beta=5;
rho=0.65;
%%%%%%%%%%%%% the key parameters of Ant System %%%%%%%%%
fprintf('Showing Iterative Best Solution:\n');
finalOutput = ...
AS(NodeWeight,AntNum,MaxITime,alpha,beta,rho);
disp(['AS stop at ',datestr(now)]);
function [GBTour,GBLength,Option,IBRecord]=AS(WeightMatrix,AntNum,MaxITime,alpha,beta,rho)
%% (Ant System) date:070427
%%%%%%%%%%%%%%%%%%%%%%%%%%%%%%%%%%%%%%%%%%%%%%%%%%%%%%
%%%%%%%%%%%%%%%%%%%%%
% Reference��
% Dorigo M, Maniezzo Vittorio, Colorni Alberto.
% The Ant System: Optimization by a colony of cooperating agents [J].
% IEEE Transactions on Systems, Man, and Cybernetics--Part B,1996, 26(1)
%%%%%%%%%%%%%%%%%%%%%%%%%%%%%%%%%%%%%%%%%%%%%%%%%%%%%%
%%%%%%%%%%%%%%%%%%%%%
global ASOption Problem AntSystem ASAdded
ASOption = InitParameter(AntNum,alpha,beta,rho,MaxITime);
Problem = InitProblem(WeightMatrix);
AntSystem = InitAntSystem();
ITime = 0;
ASAdded.ITime = ITime;
IBRecord = [];
while 1
InitStartPoint();
for step = 2:ASOption.n
for ant = 1:ASOption.m
P = CaculateShiftProb(step,ant);
nextnode = Roulette(P,1);
RefreshTabu(step,ant,nextnode);
end
end
ITime = ITime + 1;
CaculateToursLength();
GlobleRefreshPheromone();
ANB = CaculateANB();
[GBTour,GBLength,IBRecord(:,ITime)] = GetResults(ITime,ANB);
Page 12
Mathematical Theory and Modeling www.iiste.org
ISSN 2224-5804 (Paper) ISSN 2225-0522 (Online)
Vol.4, No.9, 2014
194
%==================================================
deltaTau = (ASAdded.MaxDist)./(AntSystem.lengths);
[deltaMax_val,deltaMax_indx] = max(deltaTau);
ASAdded.deltaMax_tour = AntSystem.tours(deltaMax_indx,:); %update InitStartPoint
%==================================================
if Terminate(ITime,ANB)
Ant_Tour = AntSystem.tours
format bank
Ant_Tour_Delta = [AntSystem.tours, deltaTau]
format short
Distance_Covered_By_Ant = AntSystem.lengths
[BestVal,BestIdx] = max(Ant_Tour_Delta(:,end));
BestTour = AntSystem.tours(BestIdx,:)
break;
end
end
Option = ASOption;
%% --------------------------------------------------------------
function ASOption = InitParameter(AntNum,alpha,beta,rho,MaxITime)
global ASAdded
ASOption.n = ASAdded.row;
ASOption.m = AntNum;
ASOption.alpha = alpha;
ASOption.beta = beta;
ASOption.rho = rho;
ASOption.MaxITime = MaxITime;
ASOption.OptITime = 1;
ASOption.Q = 10;
ASOption.C = 100;
ASOption.lambda = 0.15;
ASOption.ANBmin = 2;
ASOption.GBLength = inf;
ASOption.GBTour = zeros(ASAdded.row,1);
ASOption.DispInterval = 10;
rand('state',sum(100*clock));
%% --------------------------------------------------------------
function Problem = InitProblem(WeightMatrix)
global ASOption
n = ASOption.n;
MatrixTau = (ones(n,n)-eye(n,n))*ASOption.C;
Distances = WeightMatrix;
SymmetryFlag = false;
if isempty(WeightMatrix)
Page 13
Mathematical Theory and Modeling www.iiste.org
ISSN 2224-5804 (Paper) ISSN 2225-0522 (Online)
Vol.4, No.9, 2014
195
Distances = CalculateDistance;
SymmetryFlag = true;
end
Problem = struct('dis',Distances,'tau',MatrixTau,'symmetry',SymmetryFlag);
%% --------------------------------------------------------------
function AntSystem = InitAntSystem()
global ASOption
AntTours = zeros(ASOption.m,ASOption.n);
ToursLength = zeros(ASOption.m,1);
AntSystem = struct('tours',AntTours,'lengths',ToursLength);
%% --------------------------------------------------------------
function InitStartPoint()
global AntSystem ASOption ASAdded
AntSystem.tours = zeros(ASOption.m,ASOption.n);
rand('state',sum(100*clock));
if ASAdded.ITime == 0
AntSystem.tours(:,1) = randperm(ASAdded.row)';
else
AntSystem.tours(:,1) = ASAdded.deltaMax_tour';
end
AntSystem.lengths = zeros(ASOption.m,1);
%% --------------------------------------------------------------
function Probs = CaculateShiftProb(step_i, ant_k)
global AntSystem ASOption Problem
CurrentNode = AntSystem.tours(ant_k, step_i-1);
VisitedNodes = AntSystem.tours(ant_k, 1:step_i-1);
tau_i = Problem.tau(CurrentNode,:);
tau_i(1,VisitedNodes) = 0;
dis_i = Problem.dis(CurrentNode,:);
dis_i(1,CurrentNode) = 1;
Probs = (tau_i.^ASOption.alpha).*((1./dis_i).^ASOption.beta);
if sum(Probs) ~= 0
Probs = Probs/sum(Probs);
else
NoVisitedNodes = setdiff(1:ASOption.n,VisitedNodes);
Probs(1,NoVisitedNodes) = 1/length(NoVisitedNodes);
end
%% --------------------------------------------------------------
function Select = Roulette(P,num)
m = length(P);
flag = (1-sum(P)<=1e-5);
Select = zeros(1,num);
rand('state',sum(100*clock));
r = rand(1,num);
Page 14
Mathematical Theory and Modeling www.iiste.org
ISSN 2224-5804 (Paper) ISSN 2225-0522 (Online)
Vol.4, No.9, 2014
196
for i=1:num
sumP = 0;
j = ceil(m*rand);
while (sumP<r(i)) && flag
sumP = sumP + P(mod(j-1,m)+1);
j = j+1;
end
Select(i) = mod(j-2,m)+1;
end
%% --------------------------------------------------------------
function RefreshTabu(step_i,ant_k,nextnode)
global AntSystem
AntSystem.tours(ant_k,step_i) = nextnode;
%% --------------------------------------------------------------
function CaculateToursLength()
global ASOption AntSystem
x = CalculateDistance;
p = AntSystem.tours;
Lengths = zeros(ASOption.m,1);
for j=1:ASOption.n
pRow = p(j,:);
sumRow = 0;
for i=1:ASOption.n-1
sumRow = sumRow + x(pRow(i),pRow(i+1));
end
Lengths(j) = sumRow;
end
AntSystem.lengths = Lengths;
%% --------------------------------------------------------------
function [GBTour,GBLength,Record] = GetResults(ITime,ANB)
global AntSystem ASOption
[IBLength,AntIndex] = min(AntSystem.lengths);
IBTour = AntSystem.tours(AntIndex,:);
if IBLength<=ASOption.GBLength
ASOption.GBLength = IBLength;
ASOption.GBTour = IBTour;
ASOption.OptITime = ITime;
end
GBTour = ASOption.GBTour';
GBLength = ASOption.GBLength;
Record = [IBLength,ANB,IBTour]';
%% --------------------------------------------------------------
Page 15
Mathematical Theory and Modeling www.iiste.org
ISSN 2224-5804 (Paper) ISSN 2225-0522 (Online)
Vol.4, No.9, 2014
197
function GlobleRefreshPheromone()
global AntSystem ASOption Problem
AT = AntSystem.tours;
TL = AntSystem.lengths;
sumdtau=zeros(ASOption.n,ASOption.n);
for k=1:ASOption.m
for i=1:ASOption.n
sumdtau(AT(k,i),AT(k,i))=sumdtau(AT(k,i),AT(k,i))+ASOption.Q/TL(k);
if Problem.symmetry
sumdtau(AT(k,i),AT(k,i))=sumdtau(AT(k,i),AT(k,i));
end
end
end
Problem.tau=Problem.tau*(1-ASOption.rho)+sumdtau;
%% --------------------------------------------------------------
function flag = Terminate(ITime,ANB)
global ASOption
flag = false;
if ANB<=ASOption.ANBmin || ITime>=ASOption.MaxITime
flag = true;
end
%% --------------------------------------------------------------
function ANB = CaculateANB()
global ASOption Problem
mintau = min(Problem.tau+ASOption.C*eye(ASOption.n,ASOption.n));
sigma = max(Problem.tau) - mintau;
dis = Problem.tau - repmat(sigma*ASOption.lambda+mintau,ASOption.n,1);
NB = sum(dis>=0,1);
ANB = sum(NB)/ASOption.n;
%% --------------------------------------------------------------
function Distances = CalculateDistance
global ASAdded
Distances = ASAdded.inputMatrix;
%% --------------------------------------------------------------
Page 16
The IISTE is a pioneer in the Open-Access hosting service and academic event
management. The aim of the firm is Accelerating Global Knowledge Sharing.
More information about the firm can be found on the homepage:
http://www.iiste.org
CALL FOR JOURNAL PAPERS
There are more than 30 peer-reviewed academic journals hosted under the hosting
platform.
Prospective authors of journals can find the submission instruction on the
following page: http://www.iiste.org/journals/ All the journals articles are available
online to the readers all over the world without financial, legal, or technical barriers
other than those inseparable from gaining access to the internet itself. Paper version
of the journals is also available upon request of readers and authors.
MORE RESOURCES
Book publication information: http://www.iiste.org/book/
IISTE Knowledge Sharing Partners
EBSCO, Index Copernicus, Ulrich's Periodicals Directory, JournalTOCS, PKP Open
Archives Harvester, Bielefeld Academic Search Engine, Elektronische
Zeitschriftenbibliothek EZB, Open J-Gate, OCLC WorldCat, Universe Digtial
Library , NewJour, Google Scholar