9
Application of Model Assisted Probability of Detection (MAPOD) to a Guided Wave SHM System Gregory Jarmer and Seth S. Kessler Metis Design Corporation IWSHM-2017

Application of Model Assisted Probability of Detection (MAPOD) to a Guided Wave SHM System
Gregory Jarmer and Seth S. Kessler
Metis Design Corporation
IWSHM-2017

ABSTRACT
This paper updates continued development on a study to generate Probability of detection (PoD) and Receiver Operating Characteristic (ROC) curves for a guided wave (GW) Structural Health Monitoring (SHM) system. PoD curves are used to access a detector’s performance as a function of damage size or equivalently the backscattered Energy to Noise Ratio (ENR). ROC curves present statistical representations of the reliability of the method for detecting certain size flaws versus their Probability of False Alarms (PFA). To a large extent, generating meaningful versions of these curves involves multiple repetitions of the same experiments while injecting as much realistic variability as possible. This paper examines the impact of a few key variables such as averaging and distance to flaw and how they can be applied to model assisted PoD.
INTRODUCTION
SHM systems are permanently integrated within a structure to efficiently detect, locate, and characterize damage. This process involves an information extraction procedure where measurements are processed to determine if damage is present. For GW methods, inspection consists of interrogating the structure with an input excitation and then analyzing the resulting scattered wave field using a signal processing method (detector). In this paper, a single GW mode phased array detector is considered.
Before an SHM systems can be fielding in military or commercial applications, its performance as detector needs to be characterized. While no standards presently exist that are specifically written for characterizing SHM performance, best practice suggests that MIL-HDBK-1823 “Non-Destructive Evaluation System Reliability Assessment”, can be leveraged due to the close relationship between many NDE and SHM. The key figure of merit from HDBK-1823A is the PoD(a) curve, which is the probability of detection as a function of damage size (a). Resulting from the PoD(a) curve is the 90 95a_____________Gregory Jarmer, Metis Design Corporation, 205 Portland St. Boston, MA 02114, USA Seth S. Kessler, Metis Design Corporation, 205 Portland St. Boston, MA 02114, USA

value, which is the damage size that can be detected with a 90% probability of detection and a 95% confidence bound. An important implication for SHM in establishing a PoD(a) curve is the required number of independent test specimens. For SHM applications, testing of many specimens is typically impractical due to the expense associated with the permanent nature of SHM sensor installation. Model assisted probability of detection (MAPOD) then becomes vital to establishing PoD curves for SHM applications. This includes the incorporation of propagation, scattering, and operational/environmental models with experimental data to properly establish PoD. Initial sources of variability include but are not limited to temperature, strain, humidity, installation location, bond quality, and sensor element degradation.
A previous paper had presented a preliminary PoD curve established using simulated cracks on a metallic plate structure for a guided wave detector. This paper builds on previous work by examining how key variables can be calibrated then applied using MAPOD strategies to determine the effect on PoD. Specifically, the effect of various numbers of averages and distance between the sensor and damage are explored.
ACTIVE ULTRASONIC GUIDED WAVE INSPECTION
Pulse echo detection
A pulse echo strategy detects damage by interrogating the structure with a waveform and detecting the scattered/echo from damage. The pulse echo detection problem is mathematically modeled in discrete time as:
0 00
0 0 0 0 0
0 01
1 0 0 0 0
0 0
0
[ ] 0,1,..., 1, ,..., 1
cos(2 ) [ ] , 1,... 1
[ ] 0,1,..., 1, ,..., 1
cos(2 ) [ ] , 1,... 1
[ ] 0,1,..., 1, ,..., 1
cos(2 ) [ ]KK
w n n n n M NH
A f n w n n n n n M
w n n n n M NH
A f n w n n n n n M
w n n n n M NH
A f n w n n
0 0 0, 1,... 1n n n M
. (1)
Here KH is the Kth damage state/size with echo amplitude KA , frequency 0f , phase , arrival time 0n and noise [ ].w n . Assuming the noise [ ]w n is a random variable with known probability distribution function (PDF), each damage state is modeled as a multivariate PDF. Damage detection is a multiple hypothesis testing problem; damage not present 0H and damage present KH . Classification is accomplished through multiple hypothesis testing; decide between 0 1 2 1, , , , .K KH H H H H The design of detectors, or the decision rule that decides the proper hypothesis for a given state, is dependent upon the parameters of the signal and corresponding PDF.
Binary Hypothesis Testing
A binary hypothesis test results from Equation (1) when, 0kA for 0,1k . This model simulates the problem of deciding if damage is or is not present. Simple binary hypothesis testing, is deciding between two hypotheses where the PDFs’ parameters

under each hypothesis are known. The Neyman-Pearson method says to maximize the probability of detection DP for a given probability of false alarm FAP , decide 1H if
1
0
( ; )( )
( ; )
p HL x
p H
x
x, (2)
where the threshold is found from
0
{ : ( ) }
( ; ) .FA
L
P p H dx
x x
x (3)
Figure 1: Binary hypothesis testing.
where 1θ̂ is the maximum likelihood estimate (MLE) of 1θ assuming 1H is true (maximizes
1 1( ; , )p Hx θ ), and 0θ̂ is the maximum likelihood estimate of 0θ assuming 0H is true (maximizes 0 0( ; , )p Hx θ ).
Signal Model
An array of M transducers located at arbitrary position m m
T
m x yp p p , samples the spatiotemporal field for backward or forward scattering from damage with inter-element transducers spacing sufficiently small to allow phase coherent processing and avoid affects from spatial aliasing. The scattering source is assumed located several wavelengths away from the array center, and any scattering received by the array approximated as a plane wave with wavevector, k , where the superscript 1, 2 P represents the scattered wave mode. A scattered signal received at the thm transducer and sampled discretely in time is mathematically modeled as
1
exp , exp 2 exp 2P
m ms n A n r j f n j f
(4)
where A is amplitude, is absolute phase relative to the scattering source, f is temporal frequency, and is the relative inter-element phase delay due to the direction of

propagation for given a wavevector. An observation is composed of N samples ranging from0 1n N . The inter-element phase delay referenced to the array center for mode ,
propagating in direction ,is
cos sinT
Tmm
pc
p, (5)
where pc is the phase velocity. The function ,n r , is a boxcar function that
represents the time when wave mode , scattered from a source a distance r away, is present at all array transducers,
,n r H n n H n n K , (6)
where gn r c is the arrival sample,
gc is group velocity and K is the length of the signal. A single mode signal model is given as
0 0 0 0exp , exp 2 exp 2A A A Am ms n A n r j fn j f (7)
Detector Derivation: location, amplitude, phase unknown
It is assumed that amplitude, absolute phase, and scattering location for the signal model are deterministic but unknown and that the excitation frequency, phase velocity and group velocity are known. This represents an active sensing scheme where a known actuation signal interrogates a plate structure of known dispersion relation for damage of unknown size, and location. Determining the presence of damage is equivalent to a binary composite hypothesis test where under the null hypothesis, 0H , only noise is present and under the alternative hypothesis, 1H , noise and scattering from damage is present. The observed array data under each hypothesis is a vector random variable and described by a probability density function (PDF). Letting x represent the observed array data vector, the PDF under 0H is represented as 0;p Hx and under 1H as 1 1; ,p Hx θ , where 1θ is a vector of the unknown parameters. To decide between the two
hypothesizes, the unknown parameters are first estimated and then used in a generalized likelihood ratio test (GLRT). The GLRT decides 1H if
1 1
0
; ,
;G
p HL
p H
x θx
x
, (8)
where 1θ̂ is the maximum likelihood estimate (MLE) of θ under 1H , the value of 1θ that maximizes 1 1; ,p Hx θ . The detector assuming only a single propagating mode model is given as
2
122,
2max H
rT
KM
x h x . (9)
See (Jarmer, Flynn and Todd 2013) for a derivation and description of the detector.

PROBABILITY OF DETECTION
Theoretical POD Curves
The probability of detection and false alarm for the theoretical detector is given as
2 22 2 1
,FA DP Q P Q
. (10)
1 is equal to the energy to noise ratio (ENR), 1 1 2
1 1 11 2 2
2 2
j jA e MNA e A MN
.
22
Q
is the right tail probability for a central Chi-Squared PDF with 2 degrees of freedom and similarly 2
2Q
, is the right tail probability for a noncentral Chi-Squared PDF with
2 degrees of freedom and noncentrality parameter 1 . Figure 2 is a plot of probability of detection as a function of ENR for false alarm rates ranging 1e-1 to 1e-6. POD increases with ENR level and with decreasing false alarm rate.
The probability of detection is thus a function of the energy to noise ratio which allows for the incorporation of model assisted POD through the signal amplitude and noise parameters. For example the signal amplitude can be modeled as an exponential decay when propagating through complex structural features such as longerons. Figure 3 shows experimental data and an exponential decay model for an aerospace structure consisting of wave propagation through multiple longerons in both flat and curved fuselage sections.
Incorporating this model, we explicitly write the probability of detection as a function of inspection distance, DI , as
22 1
( )D DP I Q
. (11)
Figure 4 shows the resulting receiver operating characteristic (ROC) curves; as the inspection distance increases the performance of the detector decreases due to the resulting attenuation of the waveform.
In a similar manner, the variance for the uncorrelated Gaussian noise, 2 , can be parameterized as a function of repeated averages. In theory, uncorrelated Gaussian noise variance is reduced by a factor of 1 AveN where AveN is the number of averages. Figure
5 shows the theoretical reduction in noise variance along with experimental data whereby repeated data sets were collected for averages ranging from 1 to 4096. Figure 6 illustrates the effect of averaging on a time series trace. Figure 7 is an illustrative ROC curve where the ENR ratio is modified to show the effects of increasing number of averages as even for a single actuation the POD can be very high. For active guided wave SHM applications, white Gaussian noise is not the primary factor which dictates POD. Instead the main influencing factor is in-frequency band noise caused by imperfect baseline subtraction.

Figure 2: Theoretical POD curves for single mode array detector.
Figure 3: Theoretical and experimental attenuation profiles.
Figure 4: ROC curve as a function of inspection distance.
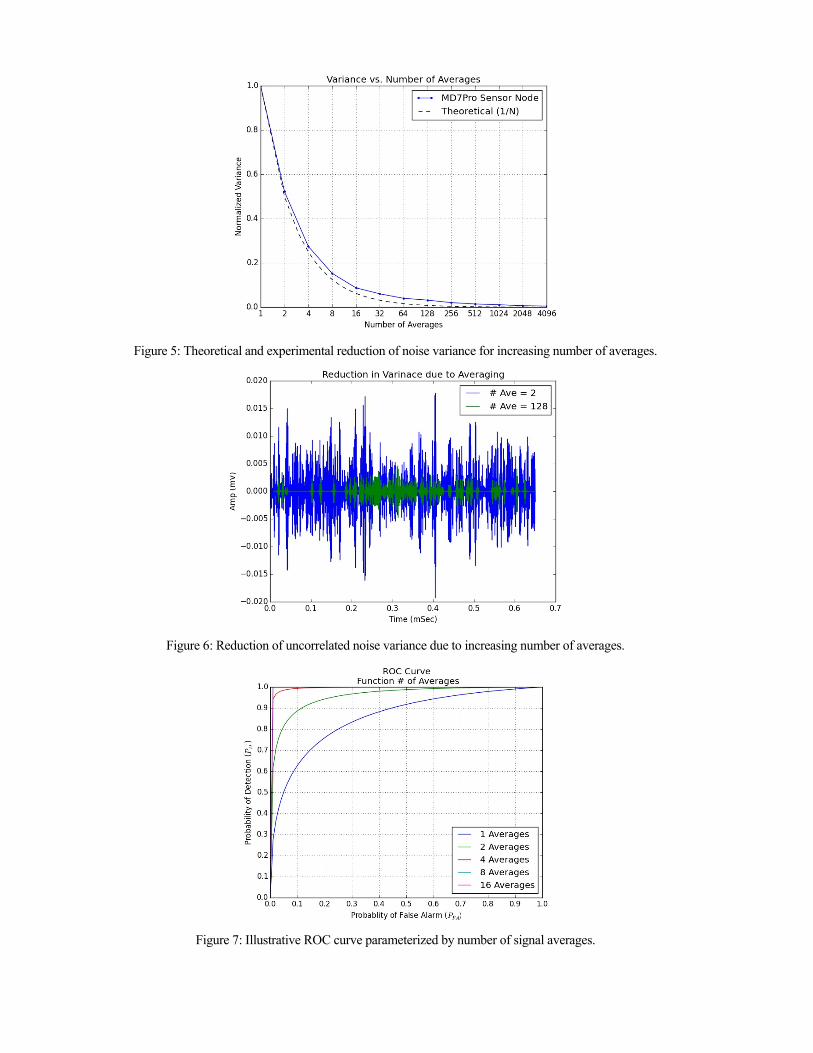
Figure 5: Theoretical and experimental reduction of noise variance for increasing number of averages.
Figure 6: Reduction of uncorrelated noise variance due to increasing number of averages.
Figure 7: Illustrative ROC curve parameterized by number of signal averages.

CONCLUSIONS
During prior work, experimental PoD and ROC curves were generated by Monte Carlo methods using a large number of experimental test runs for a notch in an aluminum sandwich panel. This paper focused on the use of Model Assisted Probability of Detection (MAPOD) to examine the implications of various variables on the generated PoD and ROC curves. The effects of distance to damage and number of averages collect were empirically calibrated, and the resulting PoD and ROC curves were presented. Future planned work will focus on the effect of non-ideal variables on PoD. This includes the testing of specimens under varying temperature and strain in addition to investigation of other factors of influence such as repeatability of sensor bond line and independence of repeated sampling on an individual test specimen. PoD and ROC curves are essential for assessing the reliability of SHM methods, which must be conducted in order to field these technologies within any commercial or military application.
ACKNOWLEDGMENTS
This research was performed at the Metis Design Corporation in Boston, MA, and sponsored by Navy SBIR contracts: N68335-13-C-0226 & N68335-17-C-0184 and Air Force SBIR contracts: FA8501-13-C-0023 & FA8501-15-C-0025.
REFERENCES
1. Jarmer G, Flynn E, and M. D. Todd, “Multi-wave-mode, Multi-Frequency Detectors for Guided Wave Interrogation of Plate Structures,” Structural Health Monitoring, p. 1475921713513972, Dec. 2013.
2. S. M. Kay, Fundamentals of Statistical Signal Processing Detection Theory. Prentice Hall Publishers, 1998 3. Kessler S.S. and A. Raghavan. "Co-Located Triangulation: Single Node Damage Position Identification."
Proceedings of the Sensors, Signal and Information Processing Workshop, 11-14 May 2008, Sedona, AZ. 4. Kessler S.S. and A. Raghavan. "Vector-Based Localization for Damage Position Identification from a Single
SHM Node." Proceedings of the 1st International Workshop on Prognostics & Health Management, 6-9 October 2008, Denver, CO.
5. Kessler S.S. and A. Raghavan. "Vector-based Damage Localization for Anisotropic Composite Laminates." Proceedings of the 7th International Workshop on Structural Health Monitoring, 9-11 September 2009, Stanford University.
6. Dunn C.T., Raghavan A. and S.S. Kessler. "Analytical Axisymmetric Coupled Piezo-Elastodynamic Models for Guided-Wave Structural Health Monitoring." Proceedings of the 7th International Workshop on Structural Health Monitoring, 9-11 September 2009, Stanford University.
7. Kessler S.S., Flynn E.B. and M.D. Todd. "Hybrid Coherent/Incoherent Beam Forming Diagnostic Approach to Naval Assets." Proceedings of the 8th International Workshop on Structural Health Monitoring, 12-15 September 2011, Stanford University.
8. Flynn E.B., Todd M.D., Dunn C.T., and S.S. Kessler "Identifying Scatter Targets in 2D Space using In Situ Phased-Arrays for Guided Wave Structural Health Monitoring." Proceedings of the 8th International Workshop on Structural Health Monitoring, 12-15 September 2011, Stanford University.
9. Kessler S.S. and E.B. Flynn. "Hybrid Passive/Active Impact Detection & Localization for Aerospace Structures." Proceedings of the 9th International Workshop on Structural Health Monitoring, 10-12 September 2013, Stanford University.
10. Jarmer G. and S.S. Kessler S.S. "Probability of Detection Assessment of a Guided Wave Structural Health Monitoring System." Proceedings of the 10th International Workshop on Structural Health Monitoring, 10-12 September 2015, Stanford University.
11. Johnson D.H. and D. E. Dudgeon. Array Signal Processing. 1st ed. Prentice Hall Signal Processing Series. Upper Saddle River, New Jersey: Prentice Hall Publishers.
12. Flynn E.B., Todd M.D., Wilcox P.D., Drinkwater B.W. and A.J. Croxford. 2011. “Maximum-Likelihood Estimation of Damage Location in Guided-Wave Structural Health Monitoring.” Proceedings of the Royal Society A: Mathematical, Physical and Engineering Science 467 (2133): 2575–96. doi:10.1098/rspa.2011.0095.


