Page 1
ORIGINAL ARTICLE
Application of multivariate statistical techniquefor hydrogeochemical assessment of groundwaterwithin the Lower Pra Basin, Ghana
C. K. Tay1• E. K. Hayford2
• I. O. A. Hodgson1
Received: 5 June 2013 / Accepted: 1 February 2017
� The Author(s) 2017. This article is published with open access at Springerlink.com
Abstract Multivariate statistical technique and hydrogeo-
chemical approach were employed for groundwater
assessment within the Lower Pra Basin. The main objective
was to delineate the main processes that are responsible for
the water chemistry and pollution of groundwater within
the basin. Fifty-four (54) (No) boreholes were sampled in
January 2012 for quality assessment. PCA using Varimax
with Kaiser Normalization method of extraction for both
rotated space and component matrix have been applied to
the data. Results show that Spearman’s correlation matrix
of major ions revealed expected process-based relation-
ships derived mainly from the geochemical processes, such
as ion-exchange and silicate/aluminosilicate weathering
within the aquifer. Three main principal components
influence the water chemistry and pollution of groundwater
within the basin. The three principal components have
accounted for approximately 79% of the total variance in
the hydrochemical data. Component 1 delineates the main
natural processes (water–soil–rock interactions) through
which groundwater within the basin acquires its chemical
characteristics, Component 2 delineates the incongruent
dissolution of silicate/aluminosilicates, while Component 3
delineates the prevalence of pollution principally from
agricultural input as well as trace metal mobilization in
groundwater within the basin. The loadings and score plots
of the first two PCs show grouping pattern which indicates
the strength of the mutual relation among the
hydrochemical variables. In terms of proper management
and development of groundwater within the basin, com-
munities, where intense agriculture is taking place, should
be monitored and protected from agricultural activities.
especially where inorganic fertilizers are used by creating
buffer zones. Monitoring of the water quality especially the
water pH is recommended to ensure the acid neutralizing
potential of groundwater within the basin thereby, curtail-
ing further trace metal mobilization processes in ground-
water within the basin.
Keywords Groundwater pollution � Hydrogeochemical
processes � Principal component analysis (PCA) � Lower
Pra Basin � Ghana
Introduction
Globally, groundwater is a fundamental natural resource
for the provision of drinking water, and plays a critical role
in the quest for sustainable human life, as it is estimated
that approximately, 30% of the world’s freshwater is
stocked as groundwater with about 97% of all freshwater
being potentially available for human use (Morris et al.
2003). In Africa, including Ghana, majority of the popu-
lations who depend on groundwater for domestic purposes,
live in rural and peri-urban communities, where poverty
predominates. Lack of access to quality groundwater in
these communities in Africa, therefore, not only infringes
on their basic human rights but also impact negatively on
sustainable human life. Since the last decades, African
governments have continually taken measures to provide
their people with quality water from groundwater sources,
due to the fact that, groundwater is not only feasible but
also the most economical source of potable water for
& C. K. Tay
[email protected] ; [email protected]
1 Council for Scientific and Industrial Research-Water
Research Institute, P.O. Box AH 38, Achimota, Accra, Ghana
2 Department of Earth Science, University of Ghana, Legon,
Accra, Ghana
123
Appl Water Sci
DOI 10.1007/s13201-017-0540-6
Page 2
scattered and remote communities (Duah 2007). It is thus,
paramount to ensure the management and development of
groundwater within the rural communities to ensure
sustainability.
During the past decades, interest in the geochemistry of
groundwater has increased as demonstrated by several
hydrogeochemical studies which are increasingly becom-
ing a firm part of regional hydrogeological studies. Earlier
studies on the categorization of groundwater facies and
chemical evolutionary history employed graphical presen-
tations of major-ion composition of groundwater (Piper
1944; Stiff 1951; Schoeller 1965; Hem 1989). These
schemes were useful in visually describing differences in
major-ion chemistry of groundwater and categorizing
water compositions into identifiable groups which are
usually of similar genetic history (Freeze and Cherry
1979).
Recently, multivariate statistical technique for hydro-
geochemical assessment of groundwater has been applied
with remarkable success as a tool in the study of ground-
water chemistry. The application of multivariate statistical
methods to geo-environmental data sets have facilitated the
unveiling of hidden structures in the data sets and assisted
in resolving key geo-environmental problems at various
scales (Sandaw et al. 2012). Multivariate analysis of geo-
chemical data operated on the concept that each aquifer
zone has its own unique groundwater quality signature,
based upon the chemical makeup of the sediments that
comprise it (Fetter 1994; Suk and Lee 1999; Woocay and
Walton 2008). The application of statistical analysis thus
helps in the interpretation of complex data matrices to
better understand the water quality as well as identify the
possible factors that influence the water chemistry in a
region.
Earlier examples of classical applications of multivari-
ate statistical methods in the earth sciences are contained in
Guler et al. (2002), Cloutier et al. (2008), Jiang et al.
(2009) and Kim et al. (2009), the delineation of zones of
natural recharge to groundwater in the Floridan aquifer
(Lawrence and Upchurch 1982), the delineation of areas
prone to salinity hazard in Chitravati watershed of India
(Briz-Kishore and Murali 1992), characterization of
groundwater contamination using factor analysis (Subbarao
et al. 1995), analysis of marine water quality and source
identification (Zhou et al. 2007), and the resolution of
simple geo-environmental problems in the determination of
groundwater flow directions (Farnham et al. 2003). The
effectiveness of this method in groundwater chemistry over
the traditional piper and stiff schemes stems from its ability
to further reveal hidden inter-variable relationships and
allow the use of virtually limitless numbers of variable,
thus trace elements and physical parameters can be part of
the classification parameters. By its use of raw data as
variable inputs, errors arising from close number systems
(mutual relation between variables with similar character-
istics) are avoided. In addition, because elements are
treated as independent variables, the masking effect of
chemically similar elements that are often grouped together
is avoided (Dalton and Upchurch 1978).
Owing to the discharge of mine effluents into river and
stream sources through mining activities, several of the
surface water resources which hitherto, served as
potable sources for the communities within the Lower Pra
Basin, have become polluted and unsuitable for use as
drinking and potable water supply. Communities within the
basin thus rely heavily on groundwater as sources for
drinking and domestic purposes. However, sulphide rocks
that contain gold ore, which is prevalent in the area often
contain pyrite and arsenopyrites. Exposure of these rocks to
the atmosphere often results in acid mine drainage gener-
ation (low pH waters) and subsequent mobilization of trace
metals in high proportions into the groundwater system.
The indiscriminate use of Hg and other chemicals through
‘‘small-scale’’ mining activities within the basin also lead
to the pollution of surface- and groundwater resources. The
resultant of all these is the change in the characteristics of
both surface-and groundwater resources which serve as
sources of potable water supply to the communities that
rely on them. Earlier studies within the basin include:
Catchment-Based Monitoring Project in Ghana-National
IWRM Plan (2010), Ahialey et al. (2010), Bayitse (2011)
and Tay et al. (2014, 2015). These studies failed to apply
multivariate statistical methods to unveil the hidden
structures and subsequently delineate the factors responsi-
ble for groundwater pollution within the Lower Pra Basin.
It is against this background that, this paper seeks to
apply multivariate statistical analysis as a tool for a com-
prehensive hydrogeochemical assessment of groundwater
in order to facilitate the unveiling of hidden structures in
the data sets and assist in delineating the factors respon-
sible for groundwater pollution for proper development and
management of groundwater within the basin.
Materials and methods
Description of the study area
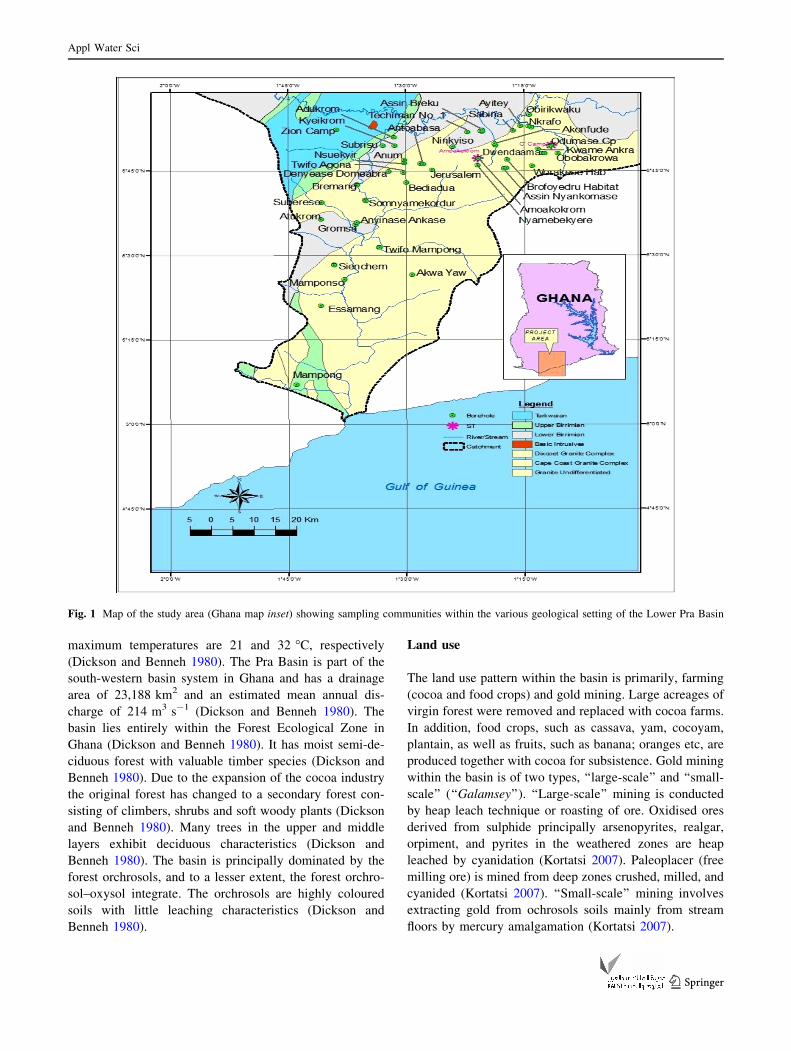
The Lower Pra Basin lies between 05�00000 and 06�00000Nand 01�00000 and 02�00000W (Fig. 1). The climate falls under
the wet semi-equatorial climatic zone of Ghana (Dickson
and Benneh 1980). The basin comes strongly under the
influence of the moist south-west monsoons during the
rainy season. It is quite humid (relative humidity 60–95%)
with annual rainfall in the range of 1500–2000 mm
(Dickson and Benneh 1980). The average minimum and
Appl Water Sci
123
Page 3
maximum temperatures are 21 and 32 �C, respectively
(Dickson and Benneh 1980). The Pra Basin is part of the
south-western basin system in Ghana and has a drainage
area of 23,188 km2 and an estimated mean annual dis-
charge of 214 m3 s-1 (Dickson and Benneh 1980). The
basin lies entirely within the Forest Ecological Zone in
Ghana (Dickson and Benneh 1980). It has moist semi-de-
ciduous forest with valuable timber species (Dickson and
Benneh 1980). Due to the expansion of the cocoa industry
the original forest has changed to a secondary forest con-
sisting of climbers, shrubs and soft woody plants (Dickson
and Benneh 1980). Many trees in the upper and middle
layers exhibit deciduous characteristics (Dickson and
Benneh 1980). The basin is principally dominated by the
forest orchrosols, and to a lesser extent, the forest orchro-
sol–oxysol integrate. The orchrosols are highly coloured
soils with little leaching characteristics (Dickson and
Benneh 1980).
Land use
The land use pattern within the basin is primarily, farming
(cocoa and food crops) and gold mining. Large acreages of
virgin forest were removed and replaced with cocoa farms.
In addition, food crops, such as cassava, yam, cocoyam,
plantain, as well as fruits, such as banana; oranges etc, are
produced together with cocoa for subsistence. Gold mining
within the basin is of two types, ‘‘large-scale’’ and ‘‘small-
scale’’ (‘‘Galamsey’’). ‘‘Large-scale’’ mining is conducted
by heap leach technique or roasting of ore. Oxidised ores
derived from sulphide principally arsenopyrites, realgar,
orpiment, and pyrites in the weathered zones are heap
leached by cyanidation (Kortatsi 2007). Paleoplacer (free
milling ore) is mined from deep zones crushed, milled, and
cyanided (Kortatsi 2007). ‘‘Small-scale’’ mining involves
extracting gold from ochrosols soils mainly from stream
floors by mercury amalgamation (Kortatsi 2007).
Fig. 1 Map of the study area (Ghana map inset) showing sampling communities within the various geological setting of the Lower Pra Basin
Appl Water Sci
123
Page 4
Geology
The Basin is characterized primarily by Cape Coast gran-
itoid complex and a small percentage of Dixcove granitoid
complex. Some portion of the basin is also characterized by
Birimian and Tarkwaian Systems.
Cape Coast granitoid
Most part of the Cape Coast granitoid complex is predomi-
nantly granitic to quartz dioritic gneiss, which in the field is
seen to change gradually from fine to medium grained,
foliated biotite quartz diorite gneiss to exclusively horn-
blende-guartz-diorite gneiss (Ahmed et al. 1977). The
gneissic rocks are interrupted by acidic and basic igneous
rocks, such as white and pink pegmatite, aplites granodior-
ites, and dykes (Ahmed et al. 1977). Typically, the granitoids
are associated with many enclaves of schists and gneisses.
The Cape Coast granitic units are sometimes well foliated
and often magmatic potash-rich granitoids in the form of
muscovite, biotite, granite and granodiorite, granodiorites
biotite gneiss, aplites and pegmatites (Ahmed et al. 1977).
They are usually associated with Birimian metasediments
and their inner structure is always concordant with those of
their host rocks (Ahmed et al. 1977). The Cape Coast gran-
itoid complex is believed to symbolize a multiphase intru-
sion comprising of four separate magmatic pulses. The last
phase of the magmatic pulses is believed to be associated
with the upper group of Birimian metasediments (Ahmed
et al. 1977). The general mineralogical composition of the
Cape Coast granitoid complex includes quartz, muscovite,
biotite, microcline, albite, almandine, beryl, spessartite,
tourmaline, columbite/tantalite and kaolin (Kesse 1985).
Dixcove granitoid
This complex consist of hornblende granite or granodiorite
grading locally into quartz diorite and hornblende diorite,
sometimes believed to have been formed from gabbros by
magmatic differentiation (Ahmed et al. 1977). This complex
forms non-foliated discordant to semi-discordant bodies in
the enclosing country rocks which are generally Upper Bir-
imian metavolcanics, numerous enclaves of which are found
within the granite complex (Ahmed et al. 1977). The Dix-
cove granitoid complex is intruded along deep seated faults
in three distinct phases which follow one another from basic
to acid gabbrodiorite–granodiorite (Ahmed et al. 1977).
Birimian supergroup
The Birimian supergroup comprises the Lower and Upper
Birimian and is separated from the Tarkwaian system by a
major unconformity (Kesse 1985). The Lower Birimian is
principally pelitic in origin having muds and silts with beds
of coarser sediments (Kesse 1985). The Upper Birimian is
predominantly of volcanic and pyroclastic origin (Kesse
1985). The rocks consist of bedded group of green lavas
(greenstones), tuffs, and sediments with minor bands of
phyllite that comprise a zone of manganiferous phyllites
containing manganese ore (Kesse 1985). The sequence is
intruded by batholithic masses of granite and gneiss (Kesse
1985). These principally argillaceous sediments were
metamorphosed to schist, slate and phyllite, with some
interbedded greywacke (Kesse 1985).
The Tarkwaian
The Tarkwaian consists of an overall fining-upwards thick
clastic sequence of argillaceous and arenaceous sediments
(mainly arenaceous) with two well-define zones of pebbly
beds and conglomerate in the lower members of the system
(Junner et al. 1942). The Tarkwaian rocks comprise
slightly metamorphosed shallow-water, sedimentary strata,
predominantly sandstone, quartzite, shale and conglomer-
ate resting unconformably on and derived from rocks of the
Birimian supergroup (Junner et al. 1942).
Aquifer characteristics
Boreholes within the basin are generally shallow with
depths which ranged 22–96 m and a mean value of
44.42 m. Borehole yield is generally low and largely vari-
able, ranging from 0.4 to 51.7 m3 h-1 with a mean value of
4.55 m3 h-1, with schists and granite aquifers having rel-
atively higher yields. The fractures in the rocks are gener-
ally open. The granite and schist rocks are exposed, while,
the Birimian and Tarkwian rocks have thick overburdens.
The soils develop over the same kind of highly weathered
parent material with lateritic to clayey top soil layer and
thickness which generally ranged 4–14 m. However, the
soil layer thickness may extend further in some areas. The
static water levels of the boreholes generally ranged
0.4–22.4 m with a mean value of 6.37 m. Static water levels
in most boreholes are above the top of the aquifer sug-
gesting that the aquifers are either confined or semi-con-
fined. The gneiss and granite associated with the Birimian
rocks are of significant importance to the water economy of
Ghana, since they underlie extensive and often well-popu-
lated areas (Dappah and Gyau-Boakye 2000). They are not
inherently permeable, but secondary permeability and
porosity have developed as a result of fracturing and
weathering (Dappah and Gyau-Boakye 2000). Where, pre-
cipitation is high and weathering processes penetrate deeply
along fracture systems, the granite and gneiss commonly
have been eroded down to low-lying areas (Dappah and
Gyau-Boakye 2000). On the other hand, where, the
Appl Water Sci
123
Page 5
precipitation is relatively low, the granite occurs in massive
poorly jointed inselbergs that rise above the surrounding
lowlands (Dappah and Gyau-Boakye 2000). In some areas,
weathered granite or gneiss form permeable groundwater
reservoir (Dappah and Gyau-Boakye 2000). Major fault
zones are also favourable locations for groundwater storage
(Dappah and Gyau-Boakye 2000). The Birimian phyllite,
schist, slate, greywacke, tuff, and lava are generally
strongly foliated and fractured. Where, they crop out or are
near the surface, considerable water may percolate through
them (Dappah and Gyau-Boakye 2000).
Sampling and laboratory analysis
Fifty-four (54) (No) groundwater samples were collected
from boreholes in January 2012 for quality assessment.
Sampling protocols described by (Claasen 1982) and
(Barcelona et al. 1985) were strictly observed during
sample collection. Samples were collected using 4-1 acid-
washed polypropylene containers. The samples were col-
lected into 1 L polyethylene bottles without preservation.
Samples for trace metals analyses were acidified to a pH
\2 after filtration (Appelo and Postma 1999). All samples
were stored on ice in an ice-chest. Samples for physico-
chemical analyses were transported to the CSIR-Water
Research Institute laboratories in Accra, stored in a
refrigerator at a temperature of\4 �C and analyzed within
1 week. Temperature, pH, and electrical conductivity were
measured on site using Hach Sens ion 156 m. Chemical
analyses of the samples were carried out using appropriate
certified and acceptable international procedures outlined
in the Standard Methods for the Examination of Water and
Wastewater (APHA 1998); sodium (Na) was analysed by
flame photometric method; calcium (Ca) by EDTA titra-
tion; TDS by gravimetric method; Magnesium (Mg) by
calculation after EDTA titration of calcium and total
hardness; chloride (Cl) by argentometric titration; Nitrate-
nitrogen was analysed by hydrazine reduction and spec-
trophotometric determination at 520 nm. Analyses of trace
elements excluding arsenic and mercury were carried out
using Unicam 969 Atomic Absorption Spectrophotometer
(AAS), arsenic (As) determination was carried out using an
ARL 341 hydride-generator), while, mercury (Hg) was
determined using the cold vapour method at the Metals
Section of the Environmental Chemistry and Sanitation
Engineering Division laboratories of the Council for Sci-
entific and Industrial Research-Water Research Institute
(CSIR-WRI) in Accra. An ionic error balance was com-
puted for each chemical sample and used as a basis for
checking analytical results. In accordance with interna-
tional standards, results with ionic balance errors greater
that 5% were rejected (Appelo and Postma 1999). Charge
balances were calculated using Eq. (1):
CB ¼X
zMc �X
zMa
� �=
XzMc þ
XzMa
� �h i� 100
ð1Þ
where z is the ionic charge, M is the molality, and the
subscripts a and c refer to anions and cations, respectively.
Spearman’s correlation matrix
Coefficient of correlation (r) was used to understand the
relationship between the various parameters and to test the
significance of the models. The Spearman’s correlation
matrix was generated using Statistical Programme for Social
Sciences (SPSS) 16.0 for windows. Correlation matrix was
studied to point out any relationship between the observed
parameters in order to explain factor loadings during PCA. In
other words, correlation matrix was utilized to point out the
internal structures and assist in the identification of pollution
sources not accessible at first glance (Satheeshkumar and
Anisa Khan 2011). High correlation coefficient value (i.e.,
-1 or 1) predicts a good relation between two variables and
correlation coefficient value around zero (0) predicts no
relationship between the two variables at a significant level
of P\ 0.05. Parameters showing r[ 0.7 are considered to
be strongly correlated whereas r between 0.4 and 0.7 shows
moderate correlation and parameters showing r\0.4 shows
low to no correlation.
Principal component analysis (PCA)
PCA is a very powerful technique used to reduce the dimen-
sionality of a data set consisting of a large number of interre-
lated variables while retaining as much as possible the
variability presented in a data set (Zhang et al. 2009). The
reduction is achieved by transporting the data set into a new set
of variables- the principal components (PCs), which are
orthogonal (non-correlated) and are arranged in decreasing
order of importance (Zhang et al. 2009). PCA technique
extracts the eigenvalues and eigenvectors from the covariance
matrix of original variables. PCA is designed to transform the
original variables into new, uncorrelated variables (axes),
called the principal components, which are linear combina-
tions of the original variables. The new axes lie along the
directions of maximum variance (Shrestha and Kazama 2007).
PCA reduces the dimensionality of the data set by explaining
the correlation amongst large number of variables in terms of a
smaller number of underlying factors without losing much
information (Vega et al. 1998; Alberto et al. 2001). PCA can be
expressed mathematically as presented in Eq. (2):
Zij ¼ pci1x1j þ pci2x2j þ � � � pcimxmj ð2Þ
where z is the component score, pc is the component
loading, x is the measured value of the variable, i is the
Appl Water Sci
123
Page 6
component number, j is the sample number, and m is the
total number of variables.
Statistical analysis
Statistical analyses were performed using SPSS 16.0 for
windows. PCA technique was used to reduce the dimen-
sionality of the data set while retaining the variability
presented in a data set as much as possible. The Spear-
man’s correlation matrix was generated to determine any
relationship between the observed parameters in order to
explain factor loadings during PCA. In order to ensure
normality of the data, all hydrochemical data (except pH)
were log-transformed prior to statistical analyses. The
hydrochemical data was also auto-scaled by calculating the
standard scores (z scores) and ensuring that all z scores are
\±2.5. For trace metals with concentrations below their
detection limits, one-half of the value of their respective
detection limit was substituted and used in statistical
analysis. A probability value of P\ 0.05 was considered
as statistically significant in this study.
Results and discussion
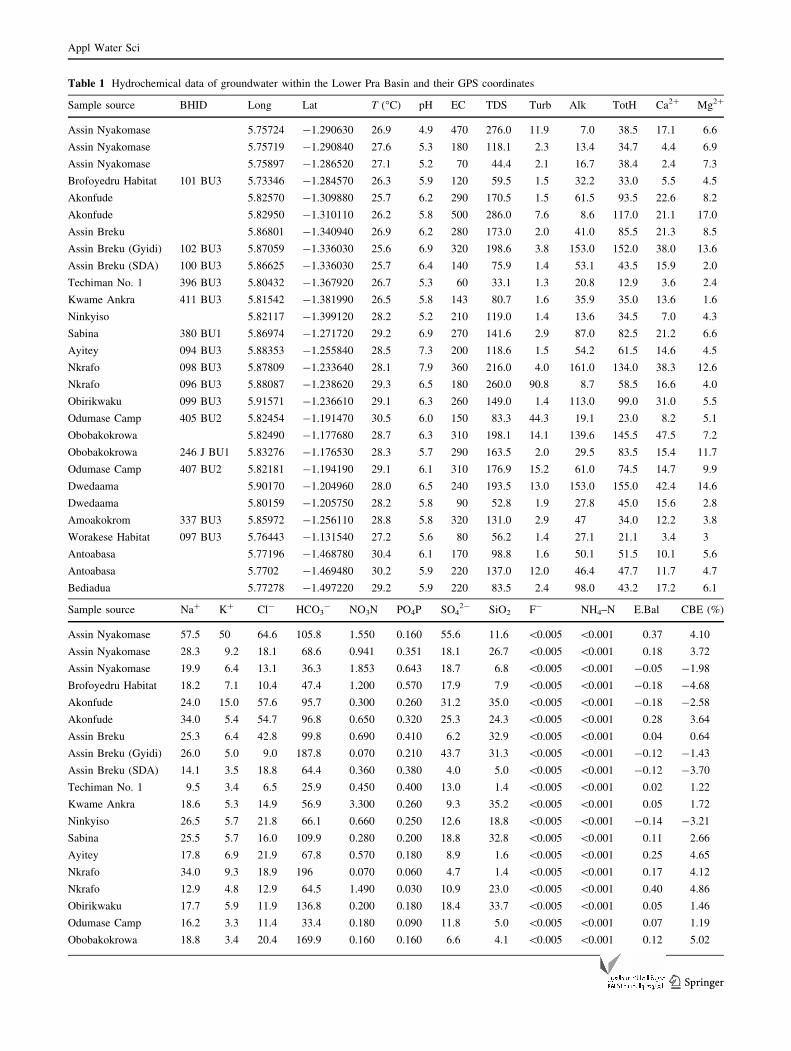
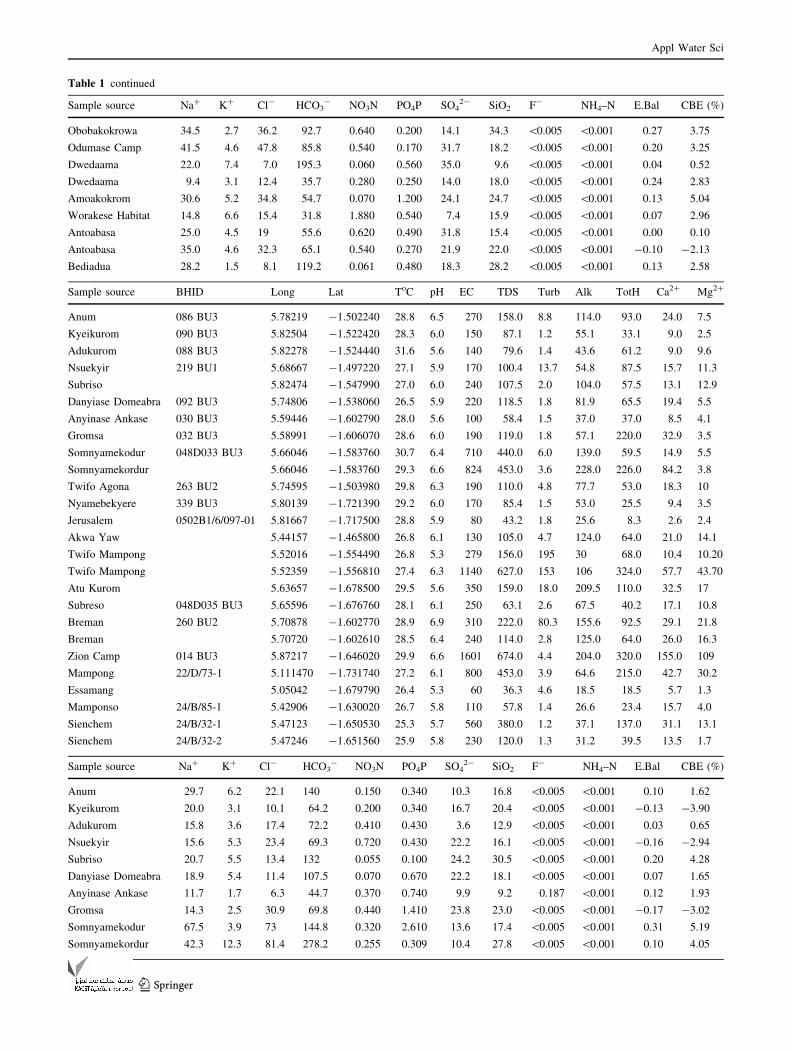
The hydrochemical data for groundwater within the basin
and their GPS Coordinates is presented in Table 1, while
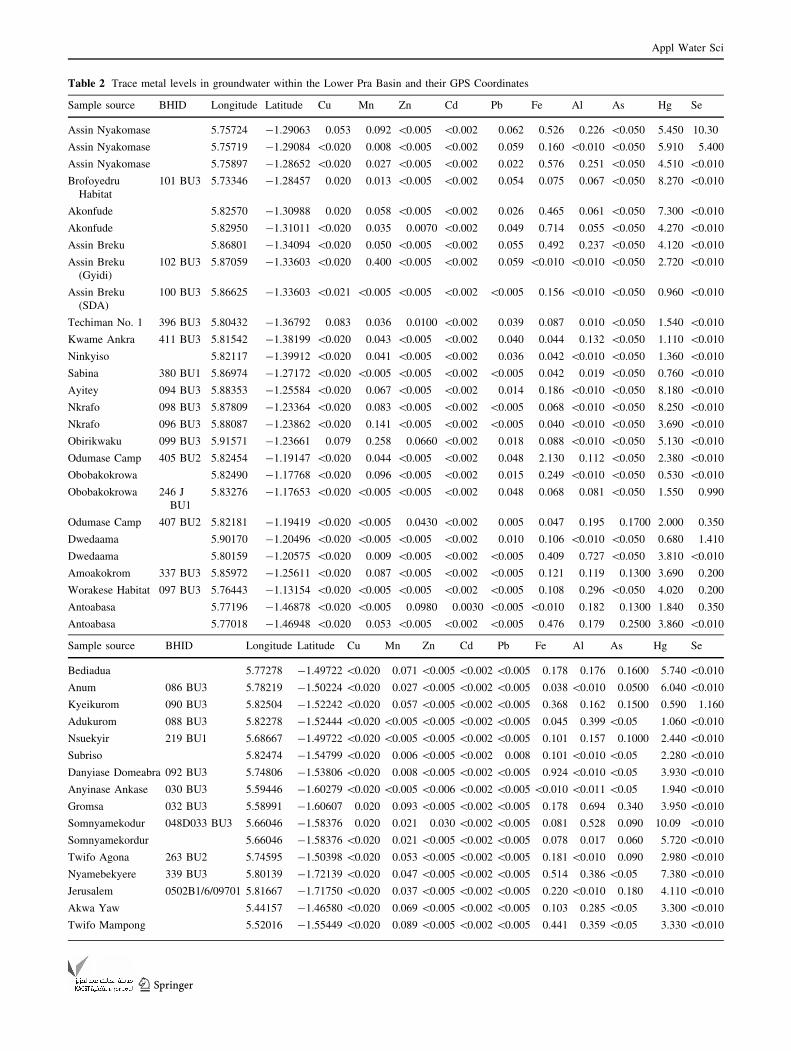
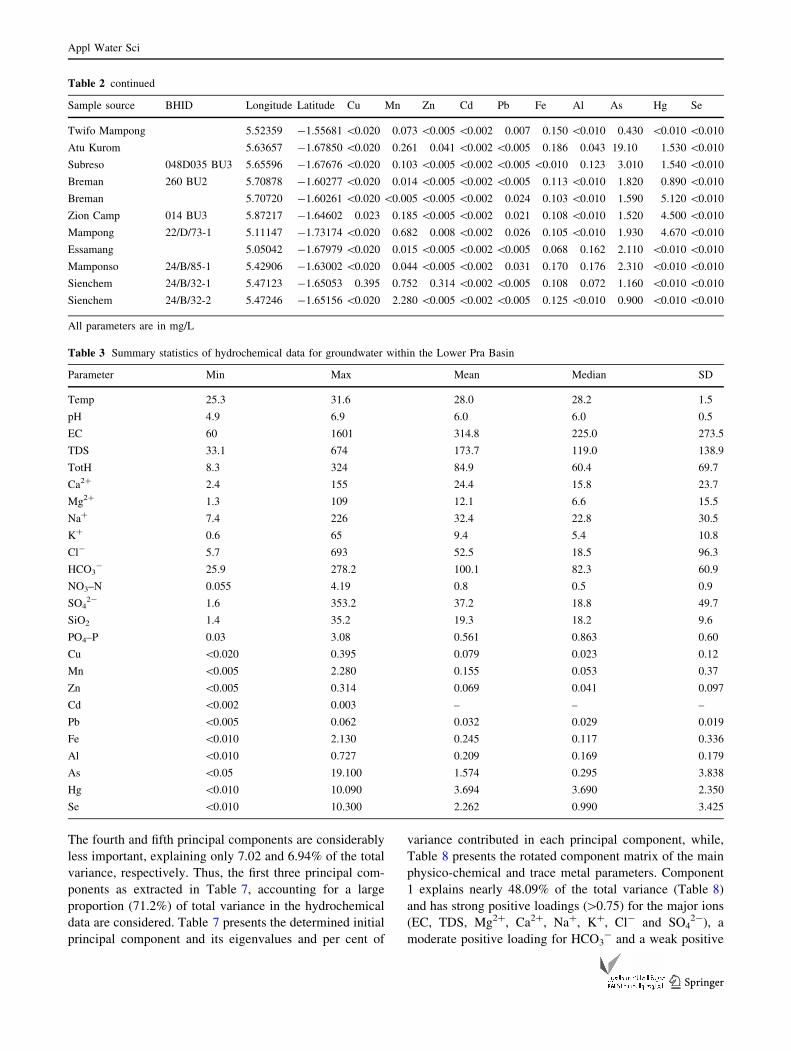
the trace metal levels in groundwater and the GPS Coor-
dinates is presented in Table 2. The statistical summary of
the hydrochemical data is presented in Table 3. The
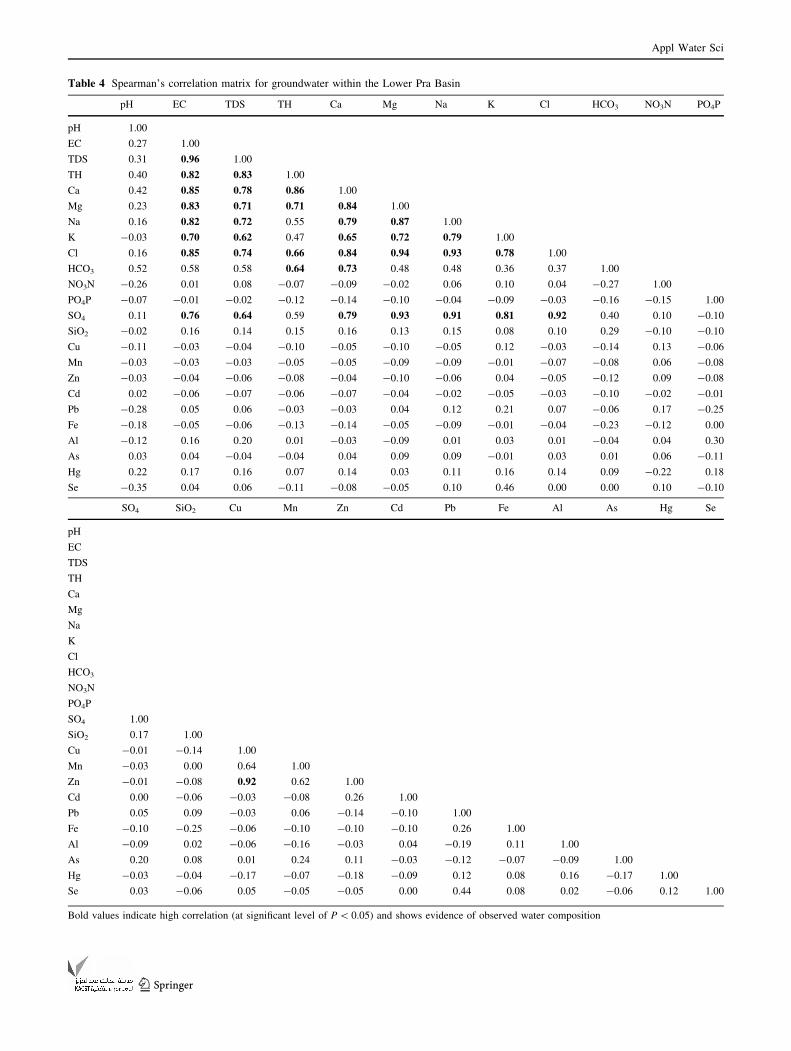
Spearman’s correlation matrix generated (Table 4) indicate
that pH shows low-to-moderate correlation with all major
and minor ions (except K and NO3–N). The Spearman’s
correlation matrix also shows that HCO3- had relatively
high correlations with major ions. According to Hounslow
(1995), essentially in silicate weathering reactions, bicar-
bonate is produced, suggesting that HCO3- perhaps, orig-
inates primarily from silicate weathering reactions in
groundwater within the basin. Total dissolved solids (TDS)
show strong correlation with, Ca2? (r = 0.78; p\ 0.05),
Mg2? (r = 0.71; p\ 0.05), Na? (r = 0.72; p\ 0.05), K?
(r = 0.62; p\ 0.05), Cl- (r = 0.74; p\ 0.05) and SO42-
(r = 0.64; p\ 0.05) (Table 4) suggesting that these major
ions contributes positively to the total dissolved solids of
the groundwater and can be accounted for by a major
geochemical process, perhaps aluminosilicate weathering
and also originating from the same source (Subba Rao
2002). Correlation analysis of major ions revealed expected
process-based relationships between Mg2? and Ca2?
(r = 0.84; p\ 0.05), Ca2? and Na? (r = 0.79; p\ 0.05),
Ca2? and K? (r = 0.65; p\ 0.05), Ca2? and Cl-
(r = 0.84; p\ 0.05), Ca2? and SO42- (r = 0.79;
p\ 0.05), Ca2? and HCO3- (r = 0.73; p\ 0.05), Mg2?
and Na? (r = 0.87; p\ 0.05), Mg2? and K? (r = 0.72;
p\ 0.05), Mg2? and Cl- (r = 0.94; p\ 0.05), Mg2? and
SO42- (r = 0.93; p\ 0.05), Na? and K? (r = 0.79;
p\ 0.05), Na? and Cl- (r = 0.93; p\ 0.05), Na? and
SO42- (r = 0.91; p\ 0.05), K? and Cl- (r = 0.78;
p\ 0.05), K? and SO42- (r = 0.81; p\ 0.05) and Cl-
and SO42 (r = 0.92; p\ 0.05), derived mainly from the
geochemical processes, such as ion-exchange and silicate/
aluminosilicate weathering within the aquifer. These pro-
cess-based relationships between the observed parameters
may be due to mineralogical influence which would be
explicitly explained by factor loadings during principal
component analysis (PCA). The correlation between Cu2?
and Zn2? (r = 0.92; p\ 0.05) reveals the possible exis-
tence of a process-based (biochemical) relationship
between the two metals. Zinc is one of the earliest known
trace metal and a common environmental pollutant which
is widely distributed in the aquatic environment, while
copper is intimately related to the aerobic degradation of
organic matter (Das and Nolting 1993). Aerobic degrada-
tion of organic matter in groundwater within the basin may,
therefore, be responsible for the strong correlation between
Cu2? and Zn2?. The correlation matrix also shows the
expected strong positive correlation between total hardness
(TH) and Ca2? (r = 0.86; p\ 0.05), TH and Mg2?
(r = 0.71; p\ 0.05) as calcium and magnesium ions are
naturally responsible for hardness in water.
Data analysis using principal component analysis
(PCA)
PCA using Varimax with Kaiser normalization has resulted
in the extraction of three main principal components which
identifies the factors influencing each principal components
for the physico-chemical parameters. The three principal
components have accounted for approximately 79% of the
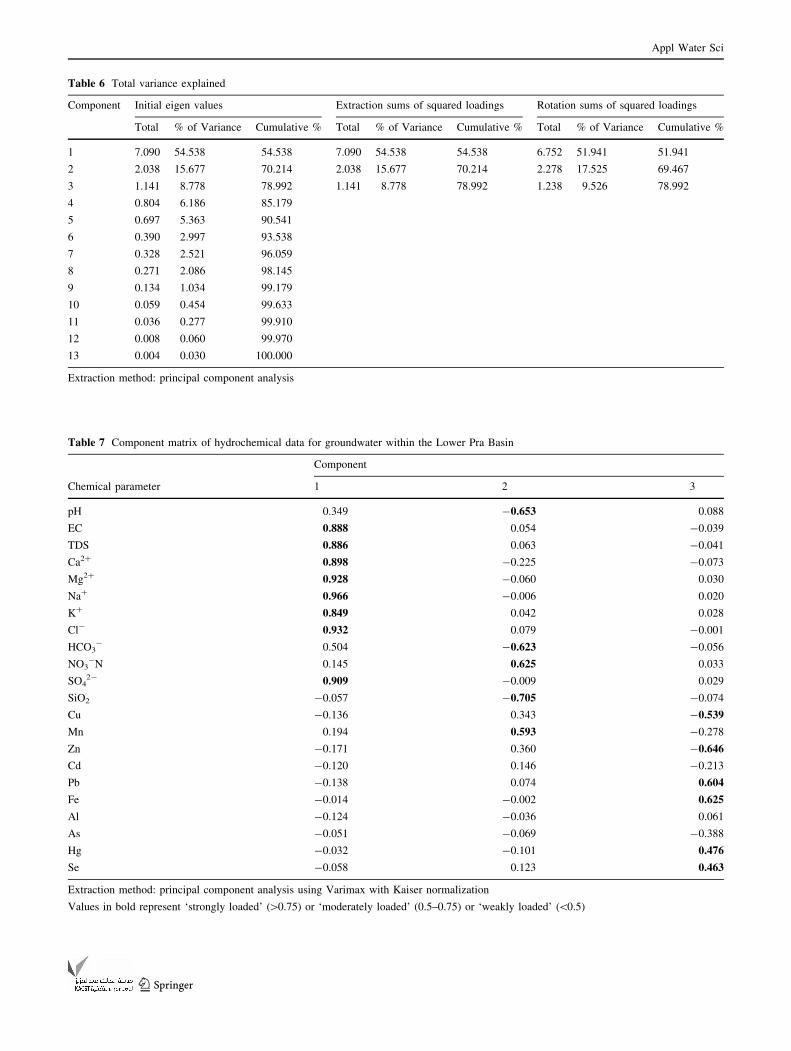
total variance in the hydrochemical data. Table 6 presents
the determined initial principal component and its eigen-
values and per cent of variance contributed in each prin-
cipal component, while, Table 8 presents the rotated
component matrix of the main physico-chemical parame-
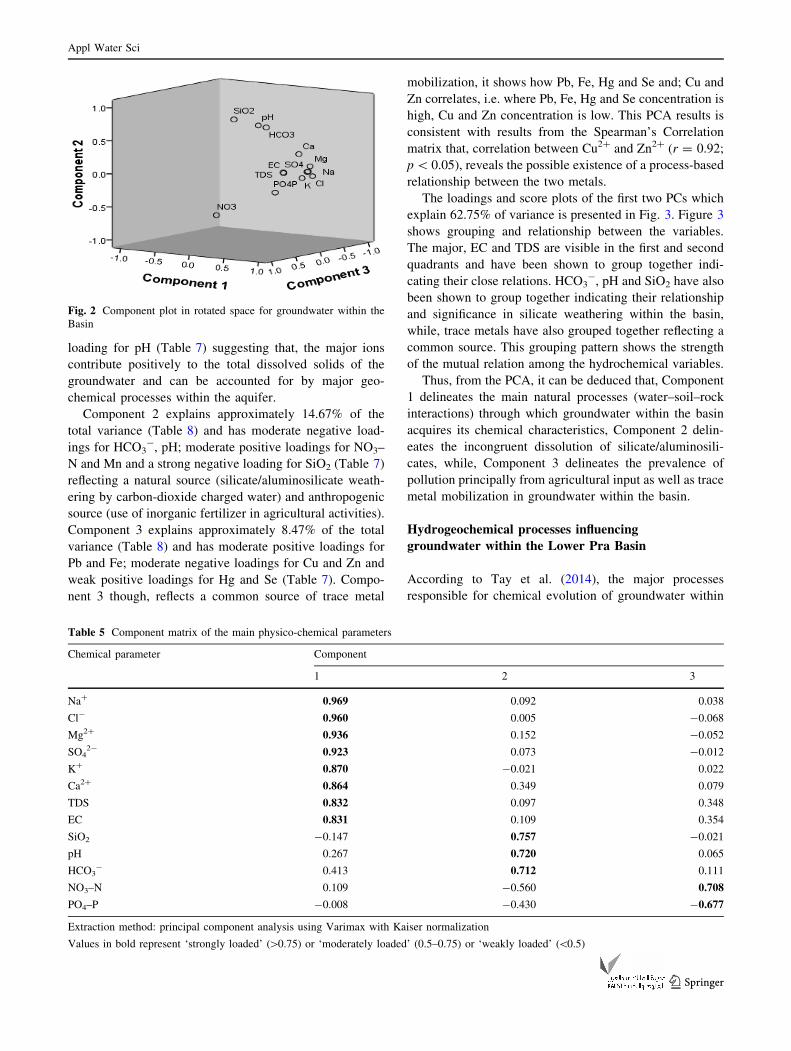
ters. The component plot in rotated space is presented in
Fig. 2. An eigenvalue gives a measure of the significance
of the factor and the factor with the highest eigenvalue as
the most significant. Eigenvalues of 1.0 or greater are
considered significant (Kim and Mueller 1978). Factor
loadings are classified as ‘strong’, ‘moderate’ and ‘weak’
corresponding to absolute loading values of [0.75,
0.75–0.50, and 0.50–0.30, respectively (Liu et al. 2003).
Component 1 explains nearly 51.9% of the total variance
(Table 6) and has strong positive loadings ([0.75) for EC,
TDS, Mg2?, Ca2?, Na?, K?, Cl- and SO42- and a weak
positive loading for HCO3- (Table 5) suggesting that the
Appl Water Sci
123
Page 7
Table 1 Hydrochemical data of groundwater within the Lower Pra Basin and their GPS coordinates
Sample source BHID Long Lat T (�C) pH EC TDS Turb Alk TotH Ca2? Mg2?
Assin Nyakomase 5.75724 -1.290630 26.9 4.9 470 276.0 11.9 7.0 38.5 17.1 6.6
Assin Nyakomase 5.75719 -1.290840 27.6 5.3 180 118.1 2.3 13.4 34.7 4.4 6.9
Assin Nyakomase 5.75897 -1.286520 27.1 5.2 70 44.4 2.1 16.7 38.4 2.4 7.3
Brofoyedru Habitat 101 BU3 5.73346 -1.284570 26.3 5.9 120 59.5 1.5 32.2 33.0 5.5 4.5
Akonfude 5.82570 -1.309880 25.7 6.2 290 170.5 1.5 61.5 93.5 22.6 8.2
Akonfude 5.82950 -1.310110 26.2 5.8 500 286.0 7.6 8.6 117.0 21.1 17.0
Assin Breku 5.86801 -1.340940 26.9 6.2 280 173.0 2.0 41.0 85.5 21.3 8.5
Assin Breku (Gyidi) 102 BU3 5.87059 -1.336030 25.6 6.9 320 198.6 3.8 153.0 152.0 38.0 13.6
Assin Breku (SDA) 100 BU3 5.86625 -1.336030 25.7 6.4 140 75.9 1.4 53.1 43.5 15.9 2.0
Techiman No. 1 396 BU3 5.80432 -1.367920 26.7 5.3 60 33.1 1.3 20.8 12.9 3.6 2.4
Kwame Ankra 411 BU3 5.81542 -1.381990 26.5 5.8 143 80.7 1.6 35.9 35.0 13.6 1.6
Ninkyiso 5.82117 -1.399120 28.2 5.2 210 119.0 1.4 13.6 34.5 7.0 4.3
Sabina 380 BU1 5.86974 -1.271720 29.2 6.9 270 141.6 2.9 87.0 82.5 21.2 6.6
Ayitey 094 BU3 5.88353 -1.255840 28.5 7.3 200 118.6 1.5 54.2 61.5 14.6 4.5
Nkrafo 098 BU3 5.87809 -1.233640 28.1 7.9 360 216.0 4.0 161.0 134.0 38.3 12.6
Nkrafo 096 BU3 5.88087 -1.238620 29.3 6.5 180 260.0 90.8 8.7 58.5 16.6 4.0
Obirikwaku 099 BU3 5.91571 -1.236610 29.1 6.3 260 149.0 1.4 113.0 99.0 31.0 5.5
Odumase Camp 405 BU2 5.82454 -1.191470 30.5 6.0 150 83.3 44.3 19.1 23.0 8.2 5.1
Obobakokrowa 5.82490 -1.177680 28.7 6.3 310 198.1 14.1 139.6 145.5 47.5 7.2
Obobakokrowa 246 J BU1 5.83276 -1.176530 28.3 5.7 290 163.5 2.0 29.5 83.5 15.4 11.7
Odumase Camp 407 BU2 5.82181 -1.194190 29.1 6.1 310 176.9 15.2 61.0 74.5 14.7 9.9
Dwedaama 5.90170 -1.204960 28.0 6.5 240 193.5 13.0 153.0 155.0 42.4 14.6
Dwedaama 5.80159 -1.205750 28.2 5.8 90 52.8 1.9 27.8 45.0 15.6 2.8
Amoakokrom 337 BU3 5.85972 -1.256110 28.8 5.8 320 131.0 2.9 47 34.0 12.2 3.8
Worakese Habitat 097 BU3 5.76443 -1.131540 27.2 5.6 80 56.2 1.4 27.1 21.1 3.4 3
Antoabasa 5.77196 -1.468780 30.4 6.1 170 98.8 1.6 50.1 51.5 10.1 5.6
Antoabasa 5.7702 -1.469480 30.2 5.9 220 137.0 12.0 46.4 47.7 11.7 4.7
Bediadua 5.77278 -1.497220 29.2 5.9 220 83.5 2.4 98.0 43.2 17.2 6.1
Sample source Na? K? Cl- HCO3- NO3N PO4P SO4
2- SiO2 F- NH4–N E.Bal CBE (%)
Assin Nyakomase 57.5 50 64.6 105.8 1.550 0.160 55.6 11.6 \0.005 \0.001 0.37 4.10
Assin Nyakomase 28.3 9.2 18.1 68.6 0.941 0.351 18.1 26.7 \0.005 \0.001 0.18 3.72
Assin Nyakomase 19.9 6.4 13.1 36.3 1.853 0.643 18.7 6.8 \0.005 \0.001 -0.05 -1.98
Brofoyedru Habitat 18.2 7.1 10.4 47.4 1.200 0.570 17.9 7.9 \0.005 \0.001 -0.18 -4.68
Akonfude 24.0 15.0 57.6 95.7 0.300 0.260 31.2 35.0 \0.005 \0.001 -0.18 -2.58
Akonfude 34.0 5.4 54.7 96.8 0.650 0.320 25.3 24.3 \0.005 \0.001 0.28 3.64
Assin Breku 25.3 6.4 42.8 99.8 0.690 0.410 6.2 32.9 \0.005 \0.001 0.04 0.64
Assin Breku (Gyidi) 26.0 5.0 9.0 187.8 0.070 0.210 43.7 31.3 \0.005 \0.001 -0.12 -1.43
Assin Breku (SDA) 14.1 3.5 18.8 64.4 0.360 0.380 4.0 5.0 \0.005 \0.001 -0.12 -3.70
Techiman No. 1 9.5 3.4 6.5 25.9 0.450 0.400 13.0 1.4 \0.005 \0.001 0.02 1.22
Kwame Ankra 18.6 5.3 14.9 56.9 3.300 0.260 9.3 35.2 \0.005 \0.001 0.05 1.72
Ninkyiso 26.5 5.7 21.8 66.1 0.660 0.250 12.6 18.8 \0.005 \0.001 -0.14 -3.21
Sabina 25.5 5.7 16.0 109.9 0.280 0.200 18.8 32.8 \0.005 \0.001 0.11 2.66
Ayitey 17.8 6.9 21.9 67.8 0.570 0.180 8.9 1.6 \0.005 \0.001 0.25 4.65
Nkrafo 34.0 9.3 18.9 196 0.070 0.060 4.7 1.4 \0.005 \0.001 0.17 4.12
Nkrafo 12.9 4.8 12.9 64.5 1.490 0.030 10.9 23.0 \0.005 \0.001 0.40 4.86
Obirikwaku 17.7 5.9 11.9 136.8 0.200 0.180 18.4 33.7 \0.005 \0.001 0.05 1.46
Odumase Camp 16.2 3.3 11.4 33.4 0.180 0.090 11.8 5.0 \0.005 \0.001 0.07 1.19
Obobakokrowa 18.8 3.4 20.4 169.9 0.160 0.160 6.6 4.1 \0.005 \0.001 0.12 5.02
Appl Water Sci
123
Page 8
Table 1 continued
Sample source Na? K? Cl- HCO3- NO3N PO4P SO4
2- SiO2 F- NH4–N E.Bal CBE (%)
Obobakokrowa 34.5 2.7 36.2 92.7 0.640 0.200 14.1 34.3 \0.005 \0.001 0.27 3.75
Odumase Camp 41.5 4.6 47.8 85.8 0.540 0.170 31.7 18.2 \0.005 \0.001 0.20 3.25
Dwedaama 22.0 7.4 7.0 195.3 0.060 0.560 35.0 9.6 \0.005 \0.001 0.04 0.52
Dwedaama 9.4 3.1 12.4 35.7 0.280 0.250 14.0 18.0 \0.005 \0.001 0.24 2.83
Amoakokrom 30.6 5.2 34.8 54.7 0.070 1.200 24.1 24.7 \0.005 \0.001 0.13 5.04
Worakese Habitat 14.8 6.6 15.4 31.8 1.880 0.540 7.4 15.9 \0.005 \0.001 0.07 2.96
Antoabasa 25.0 4.5 19 55.6 0.620 0.490 31.8 15.4 \0.005 \0.001 0.00 0.10
Antoabasa 35.0 4.6 32.3 65.1 0.540 0.270 21.9 22.0 \0.005 \0.001 -0.10 -2.13
Bediadua 28.2 1.5 8.1 119.2 0.061 0.480 18.3 28.2 \0.005 \0.001 0.13 2.58
Sample source BHID Long Lat ToC pH EC TDS Turb Alk TotH Ca2? Mg2?
Anum 086 BU3 5.78219 -1.502240 28.8 6.5 270 158.0 8.8 114.0 93.0 24.0 7.5
Kyeikurom 090 BU3 5.82504 -1.522420 28.3 6.0 150 87.1 1.2 55.1 33.1 9.0 2.5
Adukurom 088 BU3 5.82278 -1.524440 31.6 5.6 140 79.6 1.4 43.6 61.2 9.0 9.6
Nsuekyir 219 BU1 5.68667 -1.497220 27.1 5.9 170 100.4 13.7 54.8 87.5 15.7 11.3
Subriso 5.82474 -1.547990 27.0 6.0 240 107.5 2.0 104.0 57.5 13.1 12.9
Danyiase Domeabra 092 BU3 5.74806 -1.538060 26.5 5.9 220 118.5 1.8 81.9 65.5 19.4 5.5
Anyinase Ankase 030 BU3 5.59446 -1.602790 28.0 5.6 100 58.4 1.5 37.0 37.0 8.5 4.1
Gromsa 032 BU3 5.58991 -1.606070 28.6 6.0 190 119.0 1.8 57.1 220.0 32.9 3.5
Somnyamekodur 048D033 BU3 5.66046 -1.583760 30.7 6.4 710 440.0 6.0 139.0 59.5 14.9 5.5
Somnyamekordur 5.66046 -1.583760 29.3 6.6 824 453.0 3.6 228.0 226.0 84.2 3.8
Twifo Agona 263 BU2 5.74595 -1.503980 29.8 6.3 190 110.0 4.8 77.7 53.0 18.3 10
Nyamebekyere 339 BU3 5.80139 -1.721390 29.2 6.0 170 85.4 1.5 53.0 25.5 9.4 3.5
Jerusalem 0502B1/6/097-01 5.81667 -1.717500 28.8 5.9 80 43.2 1.8 25.6 8.3 2.6 2.4
Akwa Yaw 5.44157 -1.465800 26.8 6.1 130 105.0 4.7 124.0 64.0 21.0 14.1
Twifo Mampong 5.52016 -1.554490 26.8 5.3 279 156.0 195 30 68.0 10.4 10.20
Twifo Mampong 5.52359 -1.556810 27.4 6.3 1140 627.0 153 106 324.0 57.7 43.70
Atu Kurom 5.63657 -1.678500 29.5 5.6 350 159.0 18.0 209.5 110.0 32.5 17
Subreso 048D035 BU3 5.65596 -1.676760 28.1 6.1 250 63.1 2.6 67.5 40.2 17.1 10.8
Breman 260 BU2 5.70878 -1.602770 28.9 6.9 310 222.0 80.3 155.6 92.5 29.1 21.8
Breman 5.70720 -1.602610 28.5 6.4 240 114.0 2.8 125.0 64.0 26.0 16.3
Zion Camp 014 BU3 5.87217 -1.646020 29.9 6.6 1601 674.0 4.4 204.0 320.0 155.0 109
Mampong 22/D/73-1 5.111470 -1.731740 27.2 6.1 800 453.0 3.9 64.6 215.0 42.7 30.2
Essamang 5.05042 -1.679790 26.4 5.3 60 36.3 4.6 18.5 18.5 5.7 1.3
Mamponso 24/B/85-1 5.42906 -1.630020 26.7 5.8 110 57.8 1.4 26.6 23.4 15.7 4.0
Sienchem 24/B/32-1 5.47123 -1.650530 25.3 5.7 560 380.0 1.2 37.1 137.0 31.1 13.1
Sienchem 24/B/32-2 5.47246 -1.651560 25.9 5.8 230 120.0 1.3 31.2 39.5 13.5 1.7
Sample source Na? K? Cl- HCO3- NO3N PO4P SO4
2- SiO2 F- NH4–N E.Bal CBE (%)
Anum 29.7 6.2 22.1 140 0.150 0.340 10.3 16.8 \0.005 \0.001 0.10 1.62
Kyeikurom 20.0 3.1 10.1 64.2 0.200 0.340 16.7 20.4 \0.005 \0.001 -0.13 -3.90
Adukurom 15.8 3.6 17.4 72.2 0.410 0.430 3.6 12.9 \0.005 \0.001 0.03 0.65
Nsuekyir 15.6 5.3 23.4 69.3 0.720 0.430 22.2 16.1 \0.005 \0.001 -0.16 -2.94
Subriso 20.7 5.5 13.4 132 0.055 0.100 24.2 30.5 \0.005 \0.001 0.20 4.28
Danyiase Domeabra 18.9 5.4 11.4 107.5 0.070 0.670 22.2 18.1 \0.005 \0.001 0.07 1.65
Anyinase Ankase 11.7 1.7 6.3 44.7 0.370 0.740 9.9 9.2 0.187 \0.001 0.12 1.93
Gromsa 14.3 2.5 30.9 69.8 0.440 1.410 23.8 23.0 \0.005 \0.001 -0.17 -3.02
Somnyamekodur 67.5 3.9 73 144.8 0.320 2.610 13.6 17.4 \0.005 \0.001 0.31 5.19
Somnyamekordur 42.3 12.3 81.4 278.2 0.255 0.309 10.4 27.8 \0.005 \0.001 0.10 4.05
Appl Water Sci
123
Page 9
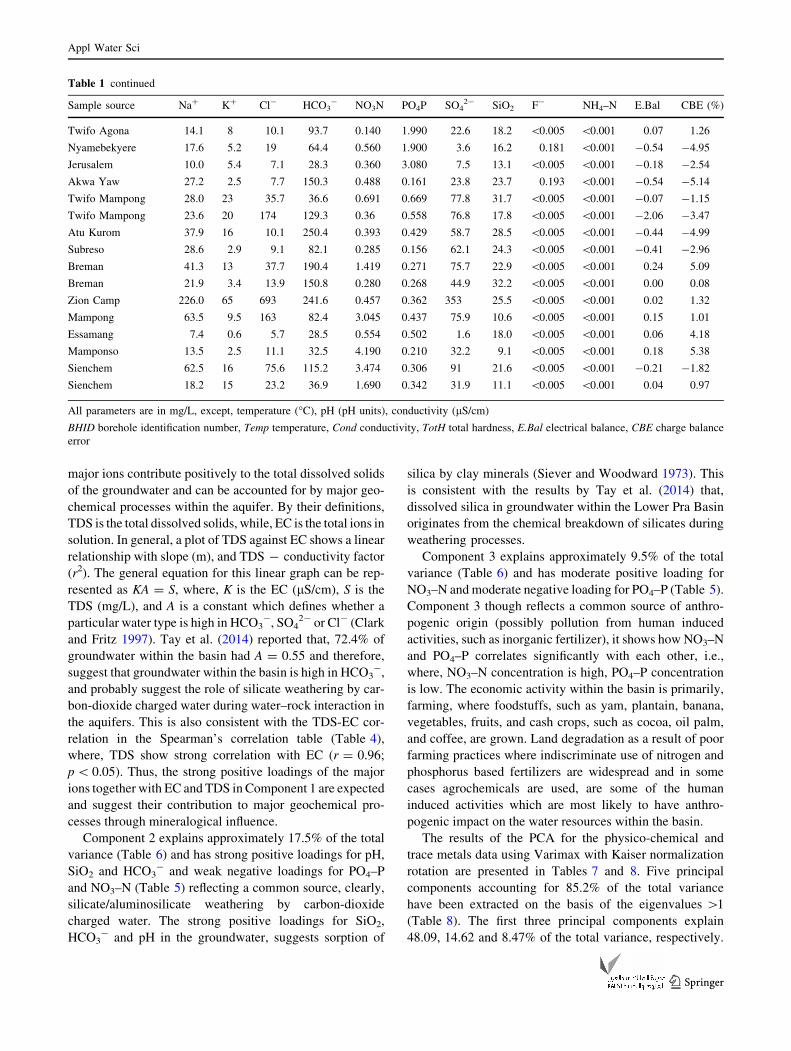
major ions contribute positively to the total dissolved solids
of the groundwater and can be accounted for by major geo-
chemical processes within the aquifer. By their definitions,
TDS is the total dissolved solids, while, EC is the total ions in
solution. In general, a plot of TDS against EC shows a linear
relationship with slope (m), and TDS - conductivity factor
(r2). The general equation for this linear graph can be rep-
resented as KA = S, where, K is the EC (lS/cm), S is the
TDS (mg/L), and A is a constant which defines whether a
particular water type is high in HCO3-, SO4
2- or Cl- (Clark
and Fritz 1997). Tay et al. (2014) reported that, 72.4% of
groundwater within the basin had A = 0.55 and therefore,
suggest that groundwater within the basin is high in HCO3-,
and probably suggest the role of silicate weathering by car-
bon-dioxide charged water during water–rock interaction in
the aquifers. This is also consistent with the TDS-EC cor-
relation in the Spearman’s correlation table (Table 4),
where, TDS show strong correlation with EC (r = 0.96;
p\ 0.05). Thus, the strong positive loadings of the major
ions together with EC and TDS in Component 1 are expected
and suggest their contribution to major geochemical pro-
cesses through mineralogical influence.
Component 2 explains approximately 17.5% of the total
variance (Table 6) and has strong positive loadings for pH,
SiO2 and HCO3- and weak negative loadings for PO4–P
and NO3–N (Table 5) reflecting a common source, clearly,
silicate/aluminosilicate weathering by carbon-dioxide
charged water. The strong positive loadings for SiO2,
HCO3- and pH in the groundwater, suggests sorption of
silica by clay minerals (Siever and Woodward 1973). This
is consistent with the results by Tay et al. (2014) that,
dissolved silica in groundwater within the Lower Pra Basin
originates from the chemical breakdown of silicates during
weathering processes.
Component 3 explains approximately 9.5% of the total
variance (Table 6) and has moderate positive loading for
NO3–N and moderate negative loading for PO4–P (Table 5).
Component 3 though reflects a common source of anthro-
pogenic origin (possibly pollution from human induced
activities, such as inorganic fertilizer), it shows how NO3–N
and PO4–P correlates significantly with each other, i.e.,
where, NO3–N concentration is high, PO4–P concentration
is low. The economic activity within the basin is primarily,
farming, where foodstuffs, such as yam, plantain, banana,
vegetables, fruits, and cash crops, such as cocoa, oil palm,
and coffee, are grown. Land degradation as a result of poor
farming practices where indiscriminate use of nitrogen and
phosphorus based fertilizers are widespread and in some
cases agrochemicals are used, are some of the human
induced activities which are most likely to have anthro-
pogenic impact on the water resources within the basin.
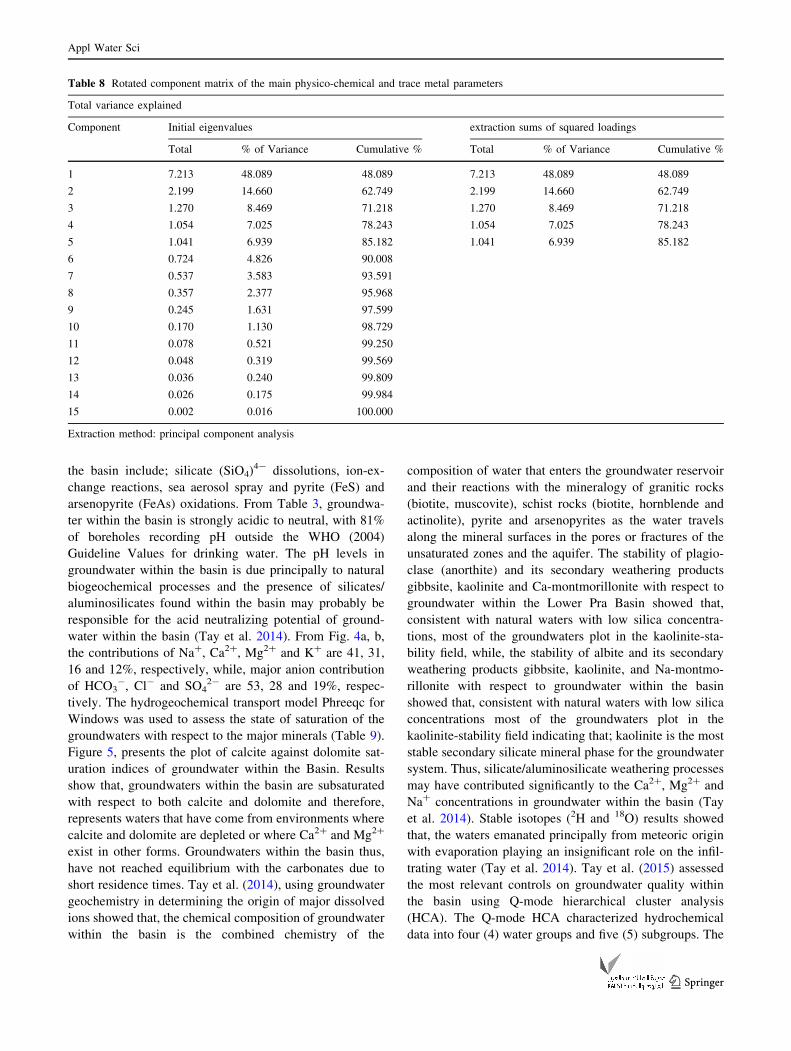
The results of the PCA for the physico-chemical and
trace metals data using Varimax with Kaiser normalization
rotation are presented in Tables 7 and 8. Five principal
components accounting for 85.2% of the total variance
have been extracted on the basis of the eigenvalues [1
(Table 8). The first three principal components explain
48.09, 14.62 and 8.47% of the total variance, respectively.
Table 1 continued
Sample source Na? K? Cl- HCO3- NO3N PO4P SO4
2- SiO2 F- NH4–N E.Bal CBE (%)
Twifo Agona 14.1 8 10.1 93.7 0.140 1.990 22.6 18.2 \0.005 \0.001 0.07 1.26
Nyamebekyere 17.6 5.2 19 64.4 0.560 1.900 3.6 16.2 0.181 \0.001 -0.54 -4.95
Jerusalem 10.0 5.4 7.1 28.3 0.360 3.080 7.5 13.1 \0.005 \0.001 -0.18 -2.54
Akwa Yaw 27.2 2.5 7.7 150.3 0.488 0.161 23.8 23.7 0.193 \0.001 -0.54 -5.14
Twifo Mampong 28.0 23 35.7 36.6 0.691 0.669 77.8 31.7 \0.005 \0.001 -0.07 -1.15
Twifo Mampong 23.6 20 174 129.3 0.36 0.558 76.8 17.8 \0.005 \0.001 -2.06 -3.47
Atu Kurom 37.9 16 10.1 250.4 0.393 0.429 58.7 28.5 \0.005 \0.001 -0.44 -4.99
Subreso 28.6 2.9 9.1 82.1 0.285 0.156 62.1 24.3 \0.005 \0.001 -0.41 -2.96
Breman 41.3 13 37.7 190.4 1.419 0.271 75.7 22.9 \0.005 \0.001 0.24 5.09
Breman 21.9 3.4 13.9 150.8 0.280 0.268 44.9 32.2 \0.005 \0.001 0.00 0.08
Zion Camp 226.0 65 693 241.6 0.457 0.362 353 25.5 \0.005 \0.001 0.02 1.32
Mampong 63.5 9.5 163 82.4 3.045 0.437 75.9 10.6 \0.005 \0.001 0.15 1.01
Essamang 7.4 0.6 5.7 28.5 0.554 0.502 1.6 18.0 \0.005 \0.001 0.06 4.18
Mamponso 13.5 2.5 11.1 32.5 4.190 0.210 32.2 9.1 \0.005 \0.001 0.18 5.38
Sienchem 62.5 16 75.6 115.2 3.474 0.306 91 21.6 \0.005 \0.001 -0.21 -1.82
Sienchem 18.2 15 23.2 36.9 1.690 0.342 31.9 11.1 \0.005 \0.001 0.04 0.97
All parameters are in mg/L, except, temperature (�C), pH (pH units), conductivity (lS/cm)
BHID borehole identification number, Temp temperature, Cond conductivity, TotH total hardness, E.Bal electrical balance, CBE charge balance
error
Appl Water Sci
123
Page 10
Table 2 Trace metal levels in groundwater within the Lower Pra Basin and their GPS Coordinates
Sample source BHID Longitude Latitude Cu Mn Zn Cd Pb Fe Al As Hg Se
Assin Nyakomase 5.75724 -1.29063 0.053 0.092 \0.005 \0.002 0.062 0.526 0.226 \0.050 5.450 10.30
Assin Nyakomase 5.75719 -1.29084 \0.020 0.008 \0.005 \0.002 0.059 0.160 \0.010 \0.050 5.910 5.400
Assin Nyakomase 5.75897 -1.28652 \0.020 0.027 \0.005 \0.002 0.022 0.576 0.251 \0.050 4.510 \0.010
Brofoyedru
Habitat
101 BU3 5.73346 -1.28457 0.020 0.013 \0.005 \0.002 0.054 0.075 0.067 \0.050 8.270 \0.010
Akonfude 5.82570 -1.30988 0.020 0.058 \0.005 \0.002 0.026 0.465 0.061 \0.050 7.300 \0.010
Akonfude 5.82950 -1.31011 \0.020 0.035 0.0070 \0.002 0.049 0.714 0.055 \0.050 4.270 \0.010
Assin Breku 5.86801 -1.34094 \0.020 0.050 \0.005 \0.002 0.055 0.492 0.237 \0.050 4.120 \0.010
Assin Breku
(Gyidi)
102 BU3 5.87059 -1.33603 \0.020 0.400 \0.005 \0.002 0.059 \0.010 \0.010 \0.050 2.720 \0.010
Assin Breku
(SDA)
100 BU3 5.86625 -1.33603 \0.021 \0.005 \0.005 \0.002 \0.005 0.156 \0.010 \0.050 0.960 \0.010
Techiman No. 1 396 BU3 5.80432 -1.36792 0.083 0.036 0.0100 \0.002 0.039 0.087 0.010 \0.050 1.540 \0.010
Kwame Ankra 411 BU3 5.81542 -1.38199 \0.020 0.043 \0.005 \0.002 0.040 0.044 0.132 \0.050 1.110 \0.010
Ninkyiso 5.82117 -1.39912 \0.020 0.041 \0.005 \0.002 0.036 0.042 \0.010 \0.050 1.360 \0.010
Sabina 380 BU1 5.86974 -1.27172 \0.020 \0.005 \0.005 \0.002 \0.005 0.042 0.019 \0.050 0.760 \0.010
Ayitey 094 BU3 5.88353 -1.25584 \0.020 0.067 \0.005 \0.002 0.014 0.186 \0.010 \0.050 8.180 \0.010
Nkrafo 098 BU3 5.87809 -1.23364 \0.020 0.083 \0.005 \0.002 \0.005 0.068 \0.010 \0.050 8.250 \0.010
Nkrafo 096 BU3 5.88087 -1.23862 \0.020 0.141 \0.005 \0.002 \0.005 0.040 \0.010 \0.050 3.690 \0.010
Obirikwaku 099 BU3 5.91571 -1.23661 0.079 0.258 0.0660 \0.002 0.018 0.088 \0.010 \0.050 5.130 \0.010
Odumase Camp 405 BU2 5.82454 -1.19147 \0.020 0.044 \0.005 \0.002 0.048 2.130 0.112 \0.050 2.380 \0.010
Obobakokrowa 5.82490 -1.17768 \0.020 0.096 \0.005 \0.002 0.015 0.249 \0.010 \0.050 0.530 \0.010
Obobakokrowa 246 J
BU1
5.83276 -1.17653 \0.020 \0.005 \0.005 \0.002 0.048 0.068 0.081 \0.050 1.550 0.990
Odumase Camp 407 BU2 5.82181 -1.19419 \0.020 \0.005 0.0430 \0.002 0.005 0.047 0.195 0.1700 2.000 0.350
Dwedaama 5.90170 -1.20496 \0.020 \0.005 \0.005 \0.002 0.010 0.106 \0.010 \0.050 0.680 1.410
Dwedaama 5.80159 -1.20575 \0.020 0.009 \0.005 \0.002 \0.005 0.409 0.727 \0.050 3.810 \0.010
Amoakokrom 337 BU3 5.85972 -1.25611 \0.020 0.087 \0.005 \0.002 \0.005 0.121 0.119 0.1300 3.690 0.200
Worakese Habitat 097 BU3 5.76443 -1.13154 \0.020 \0.005 \0.005 \0.002 \0.005 0.108 0.296 \0.050 4.020 0.200
Antoabasa 5.77196 -1.46878 \0.020 \0.005 0.0980 0.0030 \0.005 \0.010 0.182 0.1300 1.840 0.350
Antoabasa 5.77018 -1.46948 \0.020 0.053 \0.005 \0.002 \0.005 0.476 0.179 0.2500 3.860 \0.010
Sample source BHID Longitude Latitude Cu Mn Zn Cd Pb Fe Al As Hg Se
Bediadua 5.77278 -1.49722 \0.020 0.071 \0.005 \0.002 \0.005 0.178 0.176 0.1600 5.740 \0.010
Anum 086 BU3 5.78219 -1.50224 \0.020 0.027 \0.005 \0.002 \0.005 0.038 \0.010 0.0500 6.040 \0.010
Kyeikurom 090 BU3 5.82504 -1.52242 \0.020 0.057 \0.005 \0.002 \0.005 0.368 0.162 0.1500 0.590 1.160
Adukurom 088 BU3 5.82278 -1.52444 \0.020 \0.005 \0.005 \0.002 \0.005 0.045 0.399 \0.05 1.060 \0.010
Nsuekyir 219 BU1 5.68667 -1.49722 \0.020 \0.005 \0.005 \0.002 \0.005 0.101 0.157 0.1000 2.440 \0.010
Subriso 5.82474 -1.54799 \0.020 0.006 \0.005 \0.002 0.008 0.101 \0.010 \0.05 2.280 \0.010
Danyiase Domeabra 092 BU3 5.74806 -1.53806 \0.020 0.008 \0.005 \0.002 \0.005 0.924 \0.010 \0.05 3.930 \0.010
Anyinase Ankase 030 BU3 5.59446 -1.60279 \0.020 \0.005 \0.006 \0.002 \0.005 \0.010 \0.011 \0.05 1.940 \0.010
Gromsa 032 BU3 5.58991 -1.60607 0.020 0.093 \0.005 \0.002 \0.005 0.178 0.694 0.340 3.950 \0.010
Somnyamekodur 048D033 BU3 5.66046 -1.58376 0.020 0.021 0.030 \0.002 \0.005 0.081 0.528 0.090 10.09 \0.010
Somnyamekordur 5.66046 -1.58376 \0.020 0.021 \0.005 \0.002 \0.005 0.078 0.017 0.060 5.720 \0.010
Twifo Agona 263 BU2 5.74595 -1.50398 \0.020 0.053 \0.005 \0.002 \0.005 0.181 \0.010 0.090 2.980 \0.010
Nyamebekyere 339 BU3 5.80139 -1.72139 \0.020 0.047 \0.005 \0.002 \0.005 0.514 0.386 \0.05 7.380 \0.010
Jerusalem 0502B1/6/09701 5.81667 -1.71750 \0.020 0.037 \0.005 \0.002 \0.005 0.220 \0.010 0.180 4.110 \0.010
Akwa Yaw 5.44157 -1.46580 \0.020 0.069 \0.005 \0.002 \0.005 0.103 0.285 \0.05 3.300 \0.010
Twifo Mampong 5.52016 -1.55449 \0.020 0.089 \0.005 \0.002 \0.005 0.441 0.359 \0.05 3.330 \0.010
Appl Water Sci
123
Page 11
The fourth and fifth principal components are considerably
less important, explaining only 7.02 and 6.94% of the total
variance, respectively. Thus, the first three principal com-
ponents as extracted in Table 7, accounting for a large
proportion (71.2%) of total variance in the hydrochemical
data are considered. Table 7 presents the determined initial
principal component and its eigenvalues and per cent of
variance contributed in each principal component, while,
Table 8 presents the rotated component matrix of the main
physico-chemical and trace metal parameters. Component
1 explains nearly 48.09% of the total variance (Table 8)
and has strong positive loadings ([0.75) for the major ions
(EC, TDS, Mg2?, Ca2?, Na?, K?, Cl- and SO42-), a
moderate positive loading for HCO3- and a weak positive
Table 2 continued
Sample source BHID Longitude Latitude Cu Mn Zn Cd Pb Fe Al As Hg Se
Twifo Mampong 5.52359 -1.55681 \0.020 0.073 \0.005 \0.002 0.007 0.150 \0.010 0.430 \0.010 \0.010
Atu Kurom 5.63657 -1.67850 \0.020 0.261 0.041 \0.002 \0.005 0.186 0.043 19.10 1.530 \0.010
Subreso 048D035 BU3 5.65596 -1.67676 \0.020 0.103 \0.005 \0.002 \0.005 \0.010 0.123 3.010 1.540 \0.010
Breman 260 BU2 5.70878 -1.60277 \0.020 0.014 \0.005 \0.002 \0.005 0.113 \0.010 1.820 0.890 \0.010
Breman 5.70720 -1.60261 \0.020 \0.005 \0.005 \0.002 0.024 0.103 \0.010 1.590 5.120 \0.010
Zion Camp 014 BU3 5.87217 -1.64602 0.023 0.185 \0.005 \0.002 0.021 0.108 \0.010 1.520 4.500 \0.010
Mampong 22/D/73-1 5.11147 -1.73174 \0.020 0.682 0.008 \0.002 0.026 0.105 \0.010 1.930 4.670 \0.010
Essamang 5.05042 -1.67979 \0.020 0.015 \0.005 \0.002 \0.005 0.068 0.162 2.110 \0.010 \0.010
Mamponso 24/B/85-1 5.42906 -1.63002 \0.020 0.044 \0.005 \0.002 0.031 0.170 0.176 2.310 \0.010 \0.010
Sienchem 24/B/32-1 5.47123 -1.65053 0.395 0.752 0.314 \0.002 \0.005 0.108 0.072 1.160 \0.010 \0.010
Sienchem 24/B/32-2 5.47246 -1.65156 \0.020 2.280 \0.005 \0.002 \0.005 0.125 \0.010 0.900 \0.010 \0.010
All parameters are in mg/L
Table 3 Summary statistics of hydrochemical data for groundwater within the Lower Pra Basin
Parameter Min Max Mean Median SD
Temp 25.3 31.6 28.0 28.2 1.5
pH 4.9 6.9 6.0 6.0 0.5
EC 60 1601 314.8 225.0 273.5
TDS 33.1 674 173.7 119.0 138.9
TotH 8.3 324 84.9 60.4 69.7
Ca2? 2.4 155 24.4 15.8 23.7
Mg2? 1.3 109 12.1 6.6 15.5
Na? 7.4 226 32.4 22.8 30.5
K? 0.6 65 9.4 5.4 10.8
Cl- 5.7 693 52.5 18.5 96.3
HCO3- 25.9 278.2 100.1 82.3 60.9
NO3–N 0.055 4.19 0.8 0.5 0.9
SO42- 1.6 353.2 37.2 18.8 49.7
SiO2 1.4 35.2 19.3 18.2 9.6
PO4–P 0.03 3.08 0.561 0.863 0.60
Cu \0.020 0.395 0.079 0.023 0.12
Mn \0.005 2.280 0.155 0.053 0.37
Zn \0.005 0.314 0.069 0.041 0.097
Cd \0.002 0.003 – – –
Pb \0.005 0.062 0.032 0.029 0.019
Fe \0.010 2.130 0.245 0.117 0.336
Al \0.010 0.727 0.209 0.169 0.179
As \0.05 19.100 1.574 0.295 3.838
Hg \0.010 10.090 3.694 3.690 2.350
Se \0.010 10.300 2.262 0.990 3.425
Appl Water Sci
123
Page 12
Table 4 Spearman’s correlation matrix for groundwater within the Lower Pra Basin
pH EC TDS TH Ca Mg Na K Cl HCO3 NO3N PO4P
pH 1.00
EC 0.27 1.00
TDS 0.31 0.96 1.00
TH 0.40 0.82 0.83 1.00
Ca 0.42 0.85 0.78 0.86 1.00
Mg 0.23 0.83 0.71 0.71 0.84 1.00
Na 0.16 0.82 0.72 0.55 0.79 0.87 1.00
K -0.03 0.70 0.62 0.47 0.65 0.72 0.79 1.00
Cl 0.16 0.85 0.74 0.66 0.84 0.94 0.93 0.78 1.00
HCO3 0.52 0.58 0.58 0.64 0.73 0.48 0.48 0.36 0.37 1.00
NO3N -0.26 0.01 0.08 -0.07 -0.09 -0.02 0.06 0.10 0.04 -0.27 1.00
PO4P -0.07 -0.01 -0.02 -0.12 -0.14 -0.10 -0.04 -0.09 -0.03 -0.16 -0.15 1.00
SO4 0.11 0.76 0.64 0.59 0.79 0.93 0.91 0.81 0.92 0.40 0.10 -0.10
SiO2 -0.02 0.16 0.14 0.15 0.16 0.13 0.15 0.08 0.10 0.29 -0.10 -0.10
Cu -0.11 -0.03 -0.04 -0.10 -0.05 -0.10 -0.05 0.12 -0.03 -0.14 0.13 -0.06
Mn -0.03 -0.03 -0.03 -0.05 -0.05 -0.09 -0.09 -0.01 -0.07 -0.08 0.06 -0.08
Zn -0.03 -0.04 -0.06 -0.08 -0.04 -0.10 -0.06 0.04 -0.05 -0.12 0.09 -0.08
Cd 0.02 -0.06 -0.07 -0.06 -0.07 -0.04 -0.02 -0.05 -0.03 -0.10 -0.02 -0.01
Pb -0.28 0.05 0.06 -0.03 -0.03 0.04 0.12 0.21 0.07 -0.06 0.17 -0.25
Fe -0.18 -0.05 -0.06 -0.13 -0.14 -0.05 -0.09 -0.01 -0.04 -0.23 -0.12 0.00
Al -0.12 0.16 0.20 0.01 -0.03 -0.09 0.01 0.03 0.01 -0.04 0.04 0.30
As 0.03 0.04 -0.04 -0.04 0.04 0.09 0.09 -0.01 0.03 0.01 0.06 -0.11
Hg 0.22 0.17 0.16 0.07 0.14 0.03 0.11 0.16 0.14 0.09 -0.22 0.18
Se -0.35 0.04 0.06 -0.11 -0.08 -0.05 0.10 0.46 0.00 0.00 0.10 -0.10
SO4 SiO2 Cu Mn Zn Cd Pb Fe Al As Hg Se
pH
EC
TDS
TH
Ca
Mg
Na
K
Cl
HCO3
NO3N
PO4P
SO4 1.00
SiO2 0.17 1.00
Cu -0.01 -0.14 1.00
Mn -0.03 0.00 0.64 1.00
Zn -0.01 -0.08 0.92 0.62 1.00
Cd 0.00 -0.06 -0.03 -0.08 0.26 1.00
Pb 0.05 0.09 -0.03 0.06 -0.14 -0.10 1.00
Fe -0.10 -0.25 -0.06 -0.10 -0.10 -0.10 0.26 1.00
Al -0.09 0.02 -0.06 -0.16 -0.03 0.04 -0.19 0.11 1.00
As 0.20 0.08 0.01 0.24 0.11 -0.03 -0.12 -0.07 -0.09 1.00
Hg -0.03 -0.04 -0.17 -0.07 -0.18 -0.09 0.12 0.08 0.16 -0.17 1.00
Se 0.03 -0.06 0.05 -0.05 -0.05 0.00 0.44 0.08 0.02 -0.06 0.12 1.00
Bold values indicate high correlation (at significant level of P\ 0.05) and shows evidence of observed water composition
Appl Water Sci
123
Page 13
loading for pH (Table 7) suggesting that, the major ions
contribute positively to the total dissolved solids of the
groundwater and can be accounted for by major geo-
chemical processes within the aquifer.
Component 2 explains approximately 14.67% of the
total variance (Table 8) and has moderate negative load-
ings for HCO3-, pH; moderate positive loadings for NO3–
N and Mn and a strong negative loading for SiO2 (Table 7)
reflecting a natural source (silicate/aluminosilicate weath-
ering by carbon-dioxide charged water) and anthropogenic
source (use of inorganic fertilizer in agricultural activities).
Component 3 explains approximately 8.47% of the total
variance (Table 8) and has moderate positive loadings for
Pb and Fe; moderate negative loadings for Cu and Zn and
weak positive loadings for Hg and Se (Table 7). Compo-
nent 3 though, reflects a common source of trace metal
mobilization, it shows how Pb, Fe, Hg and Se and; Cu and
Zn correlates, i.e. where Pb, Fe, Hg and Se concentration is
high, Cu and Zn concentration is low. This PCA results is
consistent with results from the Spearman’s Correlation
matrix that, correlation between Cu2? and Zn2? (r = 0.92;
p\ 0.05), reveals the possible existence of a process-based
relationship between the two metals.
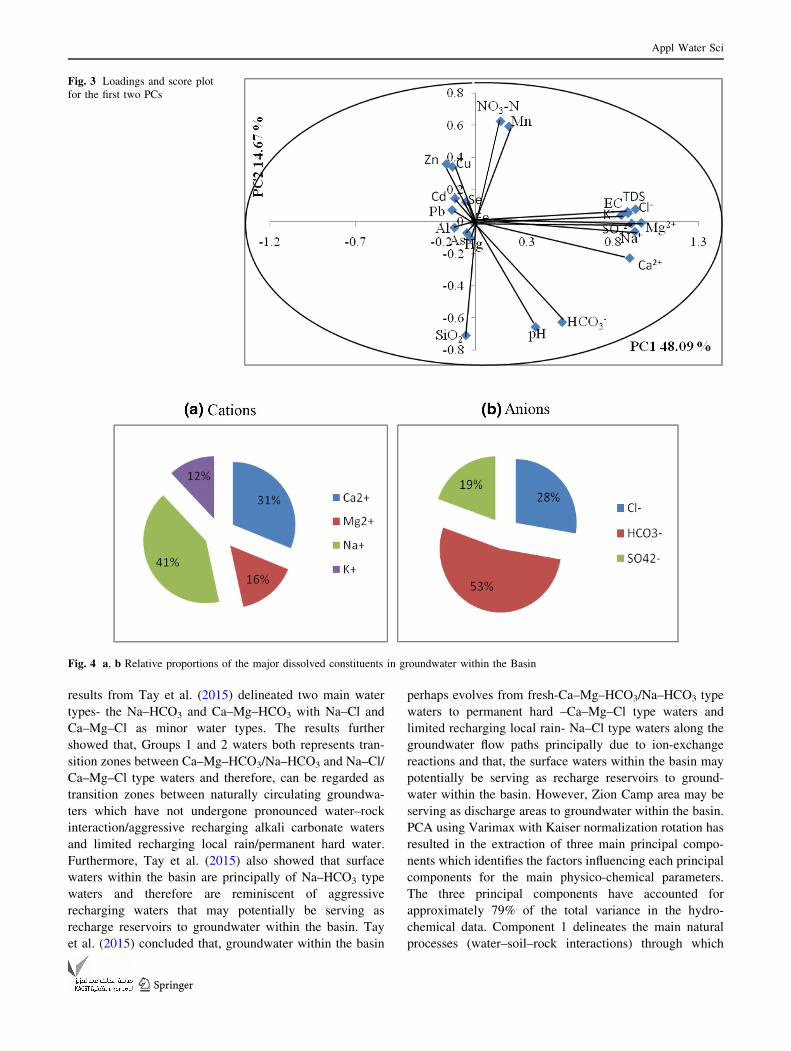
The loadings and score plots of the first two PCs which
explain 62.75% of variance is presented in Fig. 3. Figure 3
shows grouping and relationship between the variables.
The major, EC and TDS are visible in the first and second
quadrants and have been shown to group together indi-
cating their close relations. HCO3-, pH and SiO2 have also
been shown to group together indicating their relationship
and significance in silicate weathering within the basin,
while, trace metals have also grouped together reflecting a
common source. This grouping pattern shows the strength
of the mutual relation among the hydrochemical variables.
Thus, from the PCA, it can be deduced that, Component
1 delineates the main natural processes (water–soil–rock
interactions) through which groundwater within the basin
acquires its chemical characteristics, Component 2 delin-
eates the incongruent dissolution of silicate/aluminosili-
cates, while, Component 3 delineates the prevalence of
pollution principally from agricultural input as well as trace
metal mobilization in groundwater within the basin.
Hydrogeochemical processes influencing
groundwater within the Lower Pra Basin
According to Tay et al. (2014), the major processes
responsible for chemical evolution of groundwater within
Fig. 2 Component plot in rotated space for groundwater within the
Basin
Table 5 Component matrix of the main physico-chemical parameters
Chemical parameter Component
1 2 3
Na? 0.969 0.092 0.038
Cl- 0.960 0.005 -0.068
Mg2? 0.936 0.152 -0.052
SO42- 0.923 0.073 -0.012
K? 0.870 -0.021 0.022
Ca2? 0.864 0.349 0.079
TDS 0.832 0.097 0.348
EC 0.831 0.109 0.354
SiO2 -0.147 0.757 -0.021
pH 0.267 0.720 0.065
HCO3- 0.413 0.712 0.111
NO3–N 0.109 -0.560 0.708
PO4–P -0.008 -0.430 -0.677
Extraction method: principal component analysis using Varimax with Kaiser normalization
Values in bold represent ‘strongly loaded’ ([0.75) or ‘moderately loaded’ (0.5–0.75) or ‘weakly loaded’ (\0.5)
Appl Water Sci
123
Page 14
Table 6 Total variance explained
Component Initial eigen values Extraction sums of squared loadings Rotation sums of squared loadings
Total % of Variance Cumulative % Total % of Variance Cumulative % Total % of Variance Cumulative %
1 7.090 54.538 54.538 7.090 54.538 54.538 6.752 51.941 51.941
2 2.038 15.677 70.214 2.038 15.677 70.214 2.278 17.525 69.467
3 1.141 8.778 78.992 1.141 8.778 78.992 1.238 9.526 78.992
4 0.804 6.186 85.179
5 0.697 5.363 90.541
6 0.390 2.997 93.538
7 0.328 2.521 96.059
8 0.271 2.086 98.145
9 0.134 1.034 99.179
10 0.059 0.454 99.633
11 0.036 0.277 99.910
12 0.008 0.060 99.970
13 0.004 0.030 100.000
Extraction method: principal component analysis
Table 7 Component matrix of hydrochemical data for groundwater within the Lower Pra Basin
Component
Chemical parameter 1 2 3
pH 0.349 -0.653 0.088
EC 0.888 0.054 -0.039
TDS 0.886 0.063 -0.041
Ca2? 0.898 -0.225 -0.073
Mg2? 0.928 -0.060 0.030
Na? 0.966 -0.006 0.020
K? 0.849 0.042 0.028
Cl- 0.932 0.079 -0.001
HCO3- 0.504 -0.623 -0.056
NO3-N 0.145 0.625 0.033
SO42- 0.909 -0.009 0.029
SiO2 -0.057 -0.705 -0.074
Cu -0.136 0.343 -0.539
Mn 0.194 0.593 -0.278
Zn -0.171 0.360 -0.646
Cd -0.120 0.146 -0.213
Pb -0.138 0.074 0.604
Fe -0.014 -0.002 0.625
Al -0.124 -0.036 0.061
As -0.051 -0.069 -0.388
Hg -0.032 -0.101 0.476
Se -0.058 0.123 0.463
Extraction method: principal component analysis using Varimax with Kaiser normalization
Values in bold represent ‘strongly loaded’ ([0.75) or ‘moderately loaded’ (0.5–0.75) or ‘weakly loaded’ (\0.5)
Appl Water Sci
123
Page 15
the basin include; silicate (SiO4)4- dissolutions, ion-ex-
change reactions, sea aerosol spray and pyrite (FeS) and
arsenopyrite (FeAs) oxidations. From Table 3, groundwa-
ter within the basin is strongly acidic to neutral, with 81%
of boreholes recording pH outside the WHO (2004)
Guideline Values for drinking water. The pH levels in
groundwater within the basin is due principally to natural
biogeochemical processes and the presence of silicates/
aluminosilicates found within the basin may probably be
responsible for the acid neutralizing potential of ground-
water within the basin (Tay et al. 2014). From Fig. 4a, b,
the contributions of Na?, Ca2?, Mg2? and K? are 41, 31,
16 and 12%, respectively, while, major anion contribution
of HCO3-, Cl- and SO4
2- are 53, 28 and 19%, respec-
tively. The hydrogeochemical transport model Phreeqc for
Windows was used to assess the state of saturation of the
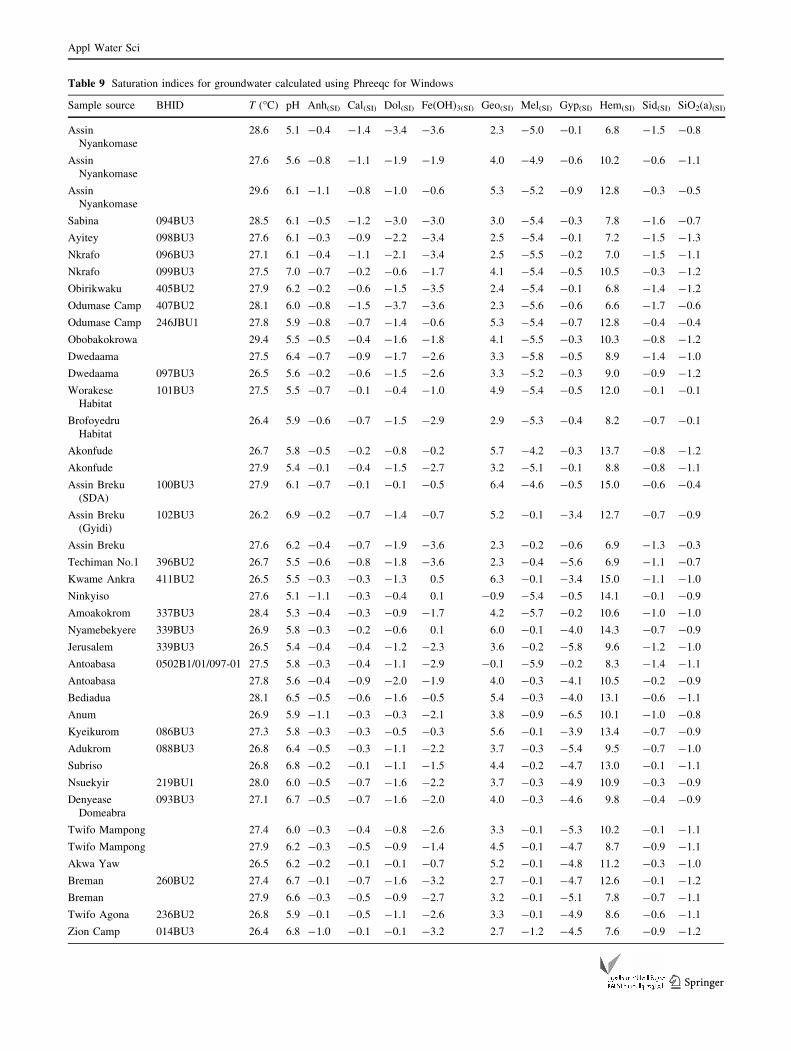
groundwaters with respect to the major minerals (Table 9).
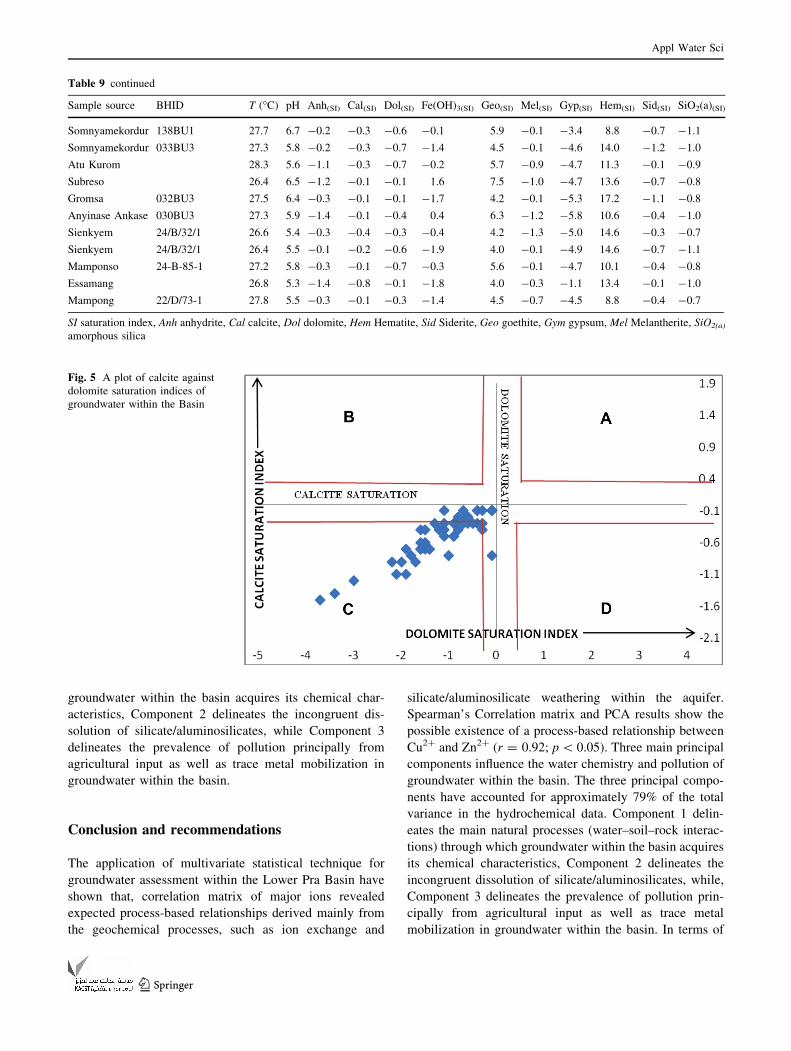
Figure 5, presents the plot of calcite against dolomite sat-
uration indices of groundwater within the Basin. Results
show that, groundwaters within the basin are subsaturated
with respect to both calcite and dolomite and therefore,
represents waters that have come from environments where
calcite and dolomite are depleted or where Ca2? and Mg2?
exist in other forms. Groundwaters within the basin thus,
have not reached equilibrium with the carbonates due to
short residence times. Tay et al. (2014), using groundwater
geochemistry in determining the origin of major dissolved
ions showed that, the chemical composition of groundwater
within the basin is the combined chemistry of the
composition of water that enters the groundwater reservoir
and their reactions with the mineralogy of granitic rocks
(biotite, muscovite), schist rocks (biotite, hornblende and
actinolite), pyrite and arsenopyrites as the water travels
along the mineral surfaces in the pores or fractures of the
unsaturated zones and the aquifer. The stability of plagio-
clase (anorthite) and its secondary weathering products
gibbsite, kaolinite and Ca-montmorillonite with respect to
groundwater within the Lower Pra Basin showed that,
consistent with natural waters with low silica concentra-
tions, most of the groundwaters plot in the kaolinite-sta-
bility field, while, the stability of albite and its secondary
weathering products gibbsite, kaolinite, and Na-montmo-
rillonite with respect to groundwater within the basin
showed that, consistent with natural waters with low silica
concentrations most of the groundwaters plot in the
kaolinite-stability field indicating that; kaolinite is the most
stable secondary silicate mineral phase for the groundwater
system. Thus, silicate/aluminosilicate weathering processes
may have contributed significantly to the Ca2?, Mg2? and
Na? concentrations in groundwater within the basin (Tay
et al. 2014). Stable isotopes (2H and 18O) results showed
that, the waters emanated principally from meteoric origin
with evaporation playing an insignificant role on the infil-
trating water (Tay et al. 2014). Tay et al. (2015) assessed
the most relevant controls on groundwater quality within
the basin using Q-mode hierarchical cluster analysis
(HCA). The Q-mode HCA characterized hydrochemical
data into four (4) water groups and five (5) subgroups. The
Table 8 Rotated component matrix of the main physico-chemical and trace metal parameters
Total variance explained
Component Initial eigenvalues extraction sums of squared loadings
Total % of Variance Cumulative % Total % of Variance Cumulative %
1 7.213 48.089 48.089 7.213 48.089 48.089
2 2.199 14.660 62.749 2.199 14.660 62.749
3 1.270 8.469 71.218 1.270 8.469 71.218
4 1.054 7.025 78.243 1.054 7.025 78.243
5 1.041 6.939 85.182 1.041 6.939 85.182
6 0.724 4.826 90.008
7 0.537 3.583 93.591
8 0.357 2.377 95.968
9 0.245 1.631 97.599
10 0.170 1.130 98.729
11 0.078 0.521 99.250
12 0.048 0.319 99.569
13 0.036 0.240 99.809
14 0.026 0.175 99.984
15 0.002 0.016 100.000
Extraction method: principal component analysis
Appl Water Sci
123
Page 16
results from Tay et al. (2015) delineated two main water
types- the Na–HCO3 and Ca–Mg–HCO3 with Na–Cl and
Ca–Mg–Cl as minor water types. The results further
showed that, Groups 1 and 2 waters both represents tran-
sition zones between Ca–Mg–HCO3/Na–HCO3 and Na–Cl/
Ca–Mg–Cl type waters and therefore, can be regarded as
transition zones between naturally circulating groundwa-
ters which have not undergone pronounced water–rock
interaction/aggressive recharging alkali carbonate waters
and limited recharging local rain/permanent hard water.
Furthermore, Tay et al. (2015) also showed that surface
waters within the basin are principally of Na–HCO3 type
waters and therefore are reminiscent of aggressive
recharging waters that may potentially be serving as
recharge reservoirs to groundwater within the basin. Tay
et al. (2015) concluded that, groundwater within the basin
perhaps evolves from fresh-Ca–Mg–HCO3/Na–HCO3 type
waters to permanent hard –Ca–Mg–Cl type waters and
limited recharging local rain- Na–Cl type waters along the
groundwater flow paths principally due to ion-exchange
reactions and that, the surface waters within the basin may
potentially be serving as recharge reservoirs to ground-
water within the basin. However, Zion Camp area may be
serving as discharge areas to groundwater within the basin.
PCA using Varimax with Kaiser normalization rotation has
resulted in the extraction of three main principal compo-
nents which identifies the factors influencing each principal
components for the main physico-chemical parameters.
The three principal components have accounted for
approximately 79% of the total variance in the hydro-
chemical data. Component 1 delineates the main natural
processes (water–soil–rock interactions) through which
Fig. 3 Loadings and score plot
for the first two PCs
Fig. 4 a, b Relative proportions of the major dissolved constituents in groundwater within the Basin
Appl Water Sci
123
Page 17
Table 9 Saturation indices for groundwater calculated using Phreeqc for Windows
Sample source BHID T (�C) pH Anh(SI) Cal(SI) Dol(SI) Fe(OH)3(SI) Geo(SI) Mel(SI) Gyp(SI) Hem(SI) Sid(SI) SiO2(a)(SI)
Assin
Nyankomase
28.6 5.1 -0.4 -1.4 -3.4 -3.6 2.3 -5.0 -0.1 6.8 -1.5 -0.8
Assin
Nyankomase
27.6 5.6 -0.8 -1.1 -1.9 -1.9 4.0 -4.9 -0.6 10.2 -0.6 -1.1
Assin
Nyankomase
29.6 6.1 -1.1 -0.8 -1.0 -0.6 5.3 -5.2 -0.9 12.8 -0.3 -0.5
Sabina 094BU3 28.5 6.1 -0.5 -1.2 -3.0 -3.0 3.0 -5.4 -0.3 7.8 -1.6 -0.7
Ayitey 098BU3 27.6 6.1 -0.3 -0.9 -2.2 -3.4 2.5 -5.4 -0.1 7.2 -1.5 -1.3
Nkrafo 096BU3 27.1 6.1 -0.4 -1.1 -2.1 -3.4 2.5 -5.5 -0.2 7.0 -1.5 -1.1
Nkrafo 099BU3 27.5 7.0 -0.7 -0.2 -0.6 -1.7 4.1 -5.4 -0.5 10.5 -0.3 -1.2
Obirikwaku 405BU2 27.9 6.2 -0.2 -0.6 -1.5 -3.5 2.4 -5.4 -0.1 6.8 -1.4 -1.2
Odumase Camp 407BU2 28.1 6.0 -0.8 -1.5 -3.7 -3.6 2.3 -5.6 -0.6 6.6 -1.7 -0.6
Odumase Camp 246JBU1 27.8 5.9 -0.8 -0.7 -1.4 -0.6 5.3 -5.4 -0.7 12.8 -0.4 -0.4
Obobakokrowa 29.4 5.5 -0.5 -0.4 -1.6 -1.8 4.1 -5.5 -0.3 10.3 -0.8 -1.2
Dwedaama 27.5 6.4 -0.7 -0.9 -1.7 -2.6 3.3 -5.8 -0.5 8.9 -1.4 -1.0
Dwedaama 097BU3 26.5 5.6 -0.2 -0.6 -1.5 -2.6 3.3 -5.2 -0.3 9.0 -0.9 -1.2
Worakese
Habitat
101BU3 27.5 5.5 -0.7 -0.1 -0.4 -1.0 4.9 -5.4 -0.5 12.0 -0.1 -0.1
Brofoyedru
Habitat
26.4 5.9 -0.6 -0.7 -1.5 -2.9 2.9 -5.3 -0.4 8.2 -0.7 -0.1
Akonfude 26.7 5.8 -0.5 -0.2 -0.8 -0.2 5.7 -4.2 -0.3 13.7 -0.8 -1.2
Akonfude 27.9 5.4 -0.1 -0.4 -1.5 -2.7 3.2 -5.1 -0.1 8.8 -0.8 -1.1
Assin Breku
(SDA)
100BU3 27.9 6.1 -0.7 -0.1 -0.1 -0.5 6.4 -4.6 -0.5 15.0 -0.6 -0.4
Assin Breku
(Gyidi)
102BU3 26.2 6.9 -0.2 -0.7 -1.4 -0.7 5.2 -0.1 -3.4 12.7 -0.7 -0.9
Assin Breku 27.6 6.2 -0.4 -0.7 -1.9 -3.6 2.3 -0.2 -0.6 6.9 -1.3 -0.3
Techiman No.1 396BU2 26.7 5.5 -0.6 -0.8 -1.8 -3.6 2.3 -0.4 -5.6 6.9 -1.1 -0.7
Kwame Ankra 411BU2 26.5 5.5 -0.3 -0.3 -1.3 0.5 6.3 -0.1 -3.4 15.0 -1.1 -1.0
Ninkyiso 27.6 5.1 -1.1 -0.3 -0.4 0.1 -0.9 -5.4 -0.5 14.1 -0.1 -0.9
Amoakokrom 337BU3 28.4 5.3 -0.4 -0.3 -0.9 -1.7 4.2 -5.7 -0.2 10.6 -1.0 -1.0
Nyamebekyere 339BU3 26.9 5.8 -0.3 -0.2 -0.6 0.1 6.0 -0.1 -4.0 14.3 -0.7 -0.9
Jerusalem 339BU3 26.5 5.4 -0.4 -0.4 -1.2 -2.3 3.6 -0.2 -5.8 9.6 -1.2 -1.0
Antoabasa 0502B1/01/097-01 27.5 5.8 -0.3 -0.4 -1.1 -2.9 -0.1 -5.9 -0.2 8.3 -1.4 -1.1
Antoabasa 27.8 5.6 -0.4 -0.9 -2.0 -1.9 4.0 -0.3 -4.1 10.5 -0.2 -0.9
Bediadua 28.1 6.5 -0.5 -0.6 -1.6 -0.5 5.4 -0.3 -4.0 13.1 -0.6 -1.1
Anum 26.9 5.9 -1.1 -0.3 -0.3 -2.1 3.8 -0.9 -6.5 10.1 -1.0 -0.8
Kyeikurom 086BU3 27.3 5.8 -0.3 -0.3 -0.5 -0.3 5.6 -0.1 -3.9 13.4 -0.7 -0.9
Adukrom 088BU3 26.8 6.4 -0.5 -0.3 -1.1 -2.2 3.7 -0.3 -5.4 9.5 -0.7 -1.0
Subriso 26.8 6.8 -0.2 -0.1 -1.1 -1.5 4.4 -0.2 -4.7 13.0 -0.1 -1.1
Nsuekyir 219BU1 28.0 6.0 -0.5 -0.7 -1.6 -2.2 3.7 -0.3 -4.9 10.9 -0.3 -0.9
Denyease
Domeabra
093BU3 27.1 6.7 -0.5 -0.7 -1.6 -2.0 4.0 -0.3 -4.6 9.8 -0.4 -0.9
Twifo Mampong 27.4 6.0 -0.3 -0.4 -0.8 -2.6 3.3 -0.1 -5.3 10.2 -0.1 -1.1
Twifo Mampong 27.9 6.2 -0.3 -0.5 -0.9 -1.4 4.5 -0.1 -4.7 8.7 -0.9 -1.1
Akwa Yaw 26.5 6.2 -0.2 -0.1 -0.1 -0.7 5.2 -0.1 -4.8 11.2 -0.3 -1.0
Breman 260BU2 27.4 6.7 -0.1 -0.7 -1.6 -3.2 2.7 -0.1 -4.7 12.6 -0.1 -1.2
Breman 27.9 6.6 -0.3 -0.5 -0.9 -2.7 3.2 -0.1 -5.1 7.8 -0.7 -1.1
Twifo Agona 236BU2 26.8 5.9 -0.1 -0.5 -1.1 -2.6 3.3 -0.1 -4.9 8.6 -0.6 -1.1
Zion Camp 014BU3 26.4 6.8 -1.0 -0.1 -0.1 -3.2 2.7 -1.2 -4.5 7.6 -0.9 -1.2
Appl Water Sci
123
Page 18
groundwater within the basin acquires its chemical char-
acteristics, Component 2 delineates the incongruent dis-
solution of silicate/aluminosilicates, while Component 3
delineates the prevalence of pollution principally from
agricultural input as well as trace metal mobilization in
groundwater within the basin.
Conclusion and recommendations
The application of multivariate statistical technique for
groundwater assessment within the Lower Pra Basin have
shown that, correlation matrix of major ions revealed
expected process-based relationships derived mainly from
the geochemical processes, such as ion exchange and
silicate/aluminosilicate weathering within the aquifer.
Spearman’s Correlation matrix and PCA results show the
possible existence of a process-based relationship between
Cu2? and Zn2? (r = 0.92; p\ 0.05). Three main principal
components influence the water chemistry and pollution of
groundwater within the basin. The three principal compo-
nents have accounted for approximately 79% of the total
variance in the hydrochemical data. Component 1 delin-
eates the main natural processes (water–soil–rock interac-
tions) through which groundwater within the basin acquires
its chemical characteristics, Component 2 delineates the
incongruent dissolution of silicate/aluminosilicates, while,
Component 3 delineates the prevalence of pollution prin-
cipally from agricultural input as well as trace metal
mobilization in groundwater within the basin. In terms of
Table 9 continued
Sample source BHID T (�C) pH Anh(SI) Cal(SI) Dol(SI) Fe(OH)3(SI) Geo(SI) Mel(SI) Gyp(SI) Hem(SI) Sid(SI) SiO2(a)(SI)
Somnyamekordur 138BU1 27.7 6.7 -0.2 -0.3 -0.6 -0.1 5.9 -0.1 -3.4 8.8 -0.7 -1.1
Somnyamekordur 033BU3 27.3 5.8 -0.2 -0.3 -0.7 -1.4 4.5 -0.1 -4.6 14.0 -1.2 -1.0
Atu Kurom 28.3 5.6 -1.1 -0.3 -0.7 -0.2 5.7 -0.9 -4.7 11.3 -0.1 -0.9
Subreso 26.4 6.5 -1.2 -0.1 -0.1 1.6 7.5 -1.0 -4.7 13.6 -0.7 -0.8
Gromsa 032BU3 27.5 6.4 -0.3 -0.1 -0.1 -1.7 4.2 -0.1 -5.3 17.2 -1.1 -0.8
Anyinase Ankase 030BU3 27.3 5.9 -1.4 -0.1 -0.4 0.4 6.3 -1.2 -5.8 10.6 -0.4 -1.0
Sienkyem 24/B/32/1 26.6 5.4 -0.3 -0.4 -0.3 -0.4 4.2 -1.3 -5.0 14.6 -0.3 -0.7
Sienkyem 24/B/32/1 26.4 5.5 -0.1 -0.2 -0.6 -1.9 4.0 -0.1 -4.9 14.6 -0.7 -1.1
Mamponso 24-B-85-1 27.2 5.8 -0.3 -0.1 -0.7 -0.3 5.6 -0.1 -4.7 10.1 -0.4 -0.8
Essamang 26.8 5.3 -1.4 -0.8 -0.1 -1.8 4.0 -0.3 -1.1 13.4 -0.1 -1.0
Mampong 22/D/73-1 27.8 5.5 -0.3 -0.1 -0.3 -1.4 4.5 -0.7 -4.5 8.8 -0.4 -0.7
SI saturation index, Anh anhydrite, Cal calcite, Dol dolomite, Hem Hematite, Sid Siderite, Geo goethite, Gym gypsum, Mel Melantherite, SiO2(a)
amorphous silica
Fig. 5 A plot of calcite against
dolomite saturation indices of
groundwater within the Basin
Appl Water Sci
123
Page 19
trace metal mobilization, the study show that though, the
trace metals reflects a common source of mobilization,
where Pb, Fe, Hg and Se concentrations are high, Cu and
Zn concentrations are low. The loadings and score plots of
the first two PCs show grouping pattern which indicates the
strength of the mutual relation among the hydrochemical
variables. In terms of proper management and development
of groundwater within the basin, communities where
intense agriculture is taking place should be monitored and
protected from agricultural activities especially, where
inorganic fertilizers are used by creating buffer zones.
Monitoring of the water quality especially the water pH is
recommended to ensure continuous acid neutralizing
potential of groundwater within the basin thereby, curtail-
ing further trace metal mobilization processes in ground-
water within the basin.
Acknowledgements The authors are grateful to the Government of
Ghana through the Council for Scientific and Industrial Research-
Water Research Institute (CSIR-WRI) for providing financial assis-
tance and analytical facilities for this PhD study. We are also grateful
to Mr. Harrison Komladjei a Principal Draughtsman of the CSIR-
WRI, for the maps of the study area.
Open Access This article is distributed under the terms of the
Creative Commons Attribution 4.0 International License (http://
creativecommons.org/licenses/by/4.0/), which permits unrestricted
use, distribution, and reproduction in any medium, provided you give
appropriate credit to the original author(s) and the source, provide a
link to the Creative Commons license, and indicate if changes were
made.
References
Ahialey EK, Serfoh-Armah Y, Kortatsi BK (2010) Hydrochemical
analysis of groundwater in the Lower Pra Basin. J Water Resour
Prot 2:864–871
Ahmed SM, Blay PK, Casto SB, Coakley GJ (1977) Geology of (�)�field sheets Nos. 33 Winneba NE 59, 61 and 62 Accra SW, NW
and NE. Ghana Geological Survey Bulletin No. 32
Alberto WD, Del Pilar DM, Valeria AM, Fabiana PS, Cecilia HA, De
Los Angeles BM (2001) Pattern recognition techniques for the
evaluation of spatial and temporal variations in water quality. A
case study: Suquia River basin (Cordoba-Argentina). Water Res
35:2881–2894
American Public Health Association (APHA) (1998) Standard
methods for the examination of water and wastewater, 20th
edn. American Public Health Association, Washington, DC
Appelo, Postma (1999) Geochemistry, groundwater and pollution.
AA Balkema/Brookfield, Rotterdam
Barcelona M, Gibb J P, Helfrich JA, Garske EE (1985) Practical
guide for groundwater sampling. Ilinois State Water Survey
ISWS Contract Report 37
Bayitse R (2011) Pattern of pollution at the Lower Basin of River Pra,
Unpublished MPhil Thesis. Environmental Science Programme,
University of Ghana
Briz-Kishore BH, Murali G (1992) Factor analysis for revealing
hydrochemical characteristics of a watershed. Environ Geol
Water Sci 19(1):3–9
Catchment-Based Monitoring Project in Ghana-National IWRM Plan
(2010) EU-Funded monitoring groundwater resource occurrence
and their quality in the Tano and Pra River Basins with surface
water quality monitoring in the South-western, Coastal and Volta
River Basins. CSIR-WRI Quarterly Consultancy Report Cover-
ing 01/04/2010 to 30/06/2010. Water Resources Commission
Claasen HC (1982) Guidelines and techniques for obtaining water
samples that accurately represent the quality of an aquifer. US
Geological Survey Open File Report 82-1024, 49 pp
Clark ID, Fritz P (1997) Environmental isotopes in hydrology. Lewis,
Boca Raton
Cloutier V, Lefebvre R, Therrien R, Savard MM (2008) Multivariate
statistical analysis of geochemical data as indicative of the
hydrogeochemical evolution of groundwater in a sedimentary
rock aquifer system. J Hydrol 353:294–313
Dalton MG, Upchurch SB (1978) Interpretation of hydrochemical
facies by factor analysis. Groundwater 16:228–233
Dappah S, Gyau-Boakye P (2000) Hydrologic framework and
borehole yields in Ghana. Hydrogeol J 8:405–416
Das JD, Nolting RF (1993) Distribution of trace metals from soils and
sewage sludge’s Abay refluxing with aqua regia. Analyst
108:277–285
Dickson KB, Benneh GA (1980) New geography of Ghana.
Longman, London
Duah AA (2007) Groundwater contamination in Ghana. In: Xu Y,
Usher B (eds) Groundwater pollution in Africa. Taylor and
Francis Group, London, pp 57–64
Farnham IM, Johannesson KH, Singh AK, Hodge VF, Stetzenbach KJ
(2003) Factor analytical approaches for evaluating groundwater
trace element chemistry data. Anal Chim Acta 490(1):123–138
Fetter CW (1994) Applied hydrology, 3rd edn. Prentice-Hall, New
York
Freeze RA, Cherry JA (1979) Groundwater. Prentice-Hall Inc, New
Jersey
G}uler C, Thyne GD, McCray JE, Turner AK (2002) Evaluation of
graphical and multivariate statistical methods for classification
of water chemistry data. Hydrogeol J 10:455–474
Hem JD (1989) Study and interpretation of the chemical character-
istics of natural water, 3rd edn. US Geological Survey Water
Supply Paper 2254
Hounslow AW (1995) Water quality data analysis and interpretation.
Lewis Publishers, Boca Raton
Jiang Y, Wu Y, Groves C, Yuan D, Kambesis P (2009) Natural and
anthropogenic factors affecting the groundwater quality in the
Nandong karst underground river system in Yunan, China.
J Contam Hydrol 109:49–61
Junner NR, Hirst T, Service H (1942) Tarkwa Goldfield. Memoir No.
6. Gold Coast Geological Survey
Kesse GO (1985) The mineral and rock resources of Ghana. A.A.
Balkema, Rotterdam
Kim JO, Mueller CW (1978) Introduction to factor analysis: what is
and how to do it. Quantitative applications in the social sciences
series. Sage, Newbury Park
Kim JM, Kim RH, Lee JH, Cheong TJ, Yum BW, Chang HW (2009)
Multivariate statistical analysis to identify the major factors
governing groundwater quality in the coastal area of Kimje,
South Korea. Hydrol Process 19(6):1261–1276
Kortatsi BK (2007) Hydrochemical framework of groundwater in the
Ankobra Basin, Ghana. Aquat Geochem 13:41–74. doi:10.1007/
s10498-006-9005-4
Lawrence FW, Upchurch SB (1982) Identification of recharge areas
using geochemical factor analysis. Groundwater 20:680–687
Liu CW, Lin KH, Kuo YM (2003) Application of factor analysis in
the assessment of groundwater quality in a Blackfoot disease
area in Taiwan. Sci Total Environ 313:77–89
Appl Water Sci
123
Page 20
Morris BL, Lawrence ARL, Chilton PJC, Adams B, Calow RC, Klinck
BA (2003) Groundwater and its susceptibility to degradation. A
global assessment of the problem and options for management.
Early Warning and Assessment Report Series, R S 03-3. United
Nations Environmental Programme, Nairobi, Kenya
Piper AM (1944) A graphic procedure in the geochemical interpre-
tation of water analyses. Am Geophys Union Trans 25:914–923
Sandaw MY, Duke O, Banoeng-Yakubu B, Abdul AS (2012) A factor
model to explain the hydrochemistry and causes of fluoride
enrichment in groundwater from the Middle Voltaian Sedimen-
tary Aquifers in the Northern Region, Ghana. ARPN J Eng Appl
Sci 7(1). ISSN 1819-6608
Satheeshkumar P, Anisa Khan B (2011) Identification of mangrove
water quality by multivariate statistical analysis methods in
Pondicherry coast, India. Environ Monit Assess. doi:10.1007/
s10661-011-2222-4
Schoeller H (1965) Qualitative evaluation of groundwater resource.
In: Methods and techniques of groundwater investigation and
development. UNESCO, pp 54–83
Shrestha S, Kazama F (2007) Assessment of surface water quality
using multivariate statistical techniques: a case study of the Fuji
river basin, Japan. Environ Model Softw 22(4):464–475
Siever R, Woodward N (1973) Sorption of silica by clay minerals.
Geochim Cosmochim Acta 37:1851–1880
Stiff HA Jr (1951) The interpretation of chemical water analysis by
means of patterns. J Petrol Technol 3:15–17
Subba Rao N (2002) Geochemistry of groundwater in parts of Guntur
district, Andhra Pradesh, India. Environ Geol 41:552–562
Subbarao C, Subbarao NV, Chandu SN (1995) Characterization of
groundwater contamination using factor analysis. Environ Geol
28(4):175–179
Suk H, Lee KK (1999) Characterization of a groundwater hydro-
chemical system through multivariate analysis: clustering into
groundwater zones. Groundwater 37(3):358–366
Tay CK, Kortatsi BK, Hayford E, Hodgson IO (2014) Origin of major
dissolved ions in groundwater within the Lower Pra Basin using
groundwater geochemistry, source-rock deduction and stable iso-
topes of 2H and 18O. Environ Earth Sci 71:5079–5097. doi:10.
1007/s12665-013-2912-z ISSN: 1866-6280Tay CK, Kortatsi B, Hayford E, Hodgson I (2015) Hydrochemical
appraisal of groundwater evolution within the Lower Pra Basin,
Ghana: a hierarchical cluster analysis (HCA) approach. Environ
Earth Sci 73:3579–3591. doi:10.1007/s12665-014-3644-4 ISSN1866-6280
Vega M, Pardo R, Barrato E, Deban L (1998) Assessment of seasonal
and pollution effects on the quality of river water by exploratory
data analysis. Water Res 32:3581–3592
Woocay A, Walton J (2008) Multivariate analyses of water chemistry:
surface and groundwater interactions. Groundwater
46(3):437–449
Zhang Q, Li Z, Zeng G, Li J, Fang Y, Yuan Q, Wang Y, Ye F (2009)
Assessment of surface water quality using multivariate statistical
techniques in red soil hilly region: a case study of Xiangjiang
watershed, China. Environ Monit Assess 152:123–131. doi:10.
1007/s10661-008-0301-y
Zhou F, Guo HC, Liu Y, Jiang YM (2007) Chemometrics data
analysis of marine water quality and source identification in
Southern Hong Kong. Mar Pollut Bull 54(6):745–756
Appl Water Sci
123