Page 1
International Journal of Scientific & Engineering Research, Volume 4, Issue 10, October-2013 1632 ISSN 2229-5518
IJSER © 2013 http://www.ijser.org
Application of Numerical Model for Drainage Improvement of Dhaka-Narayanganj-Demra
(DND) Area of Dhaka city, Bangladesh *Md Shamim Shams1, Parvez Sarwar Hossain2
Abstract— After 1971 independence of Bangladesh DND area of Dhaka megacity has become victim of unplanned development due to proximity of
central business district of Dhaka and Narayanganj district. Land use of DND area has been transformed from the originally agricultural land to
residential, industrial plots and roads. The generated runoff has been increased more than design runoffs which effects existing drainage system.
Consequently, the existing pump drainage system was unable to drain out storm water along with the excess domestic wastewater. Besides, drainage
canals have been badly diminished due to unauthorized encroachment of canals. To mitigate drainage congestion in DND area and to find an improved
solution a numerical model studies have been initially undertaken during 2010 by Bangladesh Water Development Board with the association of DDC,
Ltd. which would lead up-to set design parameters for building of future drainage infrastructure of DND area. The required data-set used by popular
numerical modeling tool named MIKE11of DHI Water and Environment was collected from various sources. From numerical studies it has been
examined by multiple options based drainage system on the basis of flood depth inundation for 2 days consecutive heavy rainfall of 5 year return period.
Flooding extent for different options in terms of flood depth-level and drainage path length for different interventions has also been assessed. After
rigorous analysis a feasible and cost-effective 97% flood free with improved drainage system of DND area has been idealized from the numerical
analysis output for future implementation.
Index Terms—Drainage improvement, Drainage model, Flood-depth, Numerical analysis, Option development, Unplanned city, Water logging.
—————————— ——————————
1. INTRODUCTION Developing countries experience the urbanization in
exceptionally fast rate than any other first world countries
(United Nations, 2002). But the urbanization process in the
mega-cities of the developing countries grows up with the
lack of efficiency in the urban infrastructure which creates
serious problems for cities, including flooding damage
increase and water logging (Verol et al., 2011). Cities of Latin
America, Asia and Africa which are belong to developing
countries with fast economic growth facing this acute
problem. Some parts of Dhaka (Bangladesh), Lucknow,
Mumbai (India), Sao-Paulo (Brazil), Port-Elizabeth (South-
Africa) etc are the prime exemplar megacities of developing
countries that are notable for prolonged water-logging
during wet season. Although parts of these cities are
vulnerable to the impacts of water logging but the benefits of
living nearer sources of employment have made
disadvantage association with flooding for the low-income
communities. Water logging due to drainage congestion in
urban areas is not just associated to heavy rainfall events but
it is also related to changes in the built-up urban areas
themselves. Unplanned rapid urbanization restricts flood
waters ways by covering large land mass due to
concretization, thus obstructing natural channels (Douglas et
al., 2008). Basically due to unauthorized and uncontrolled
filling of low lying areas and canals, encroaching of natural
canals, subsequent development of the infrastructure,
planned flood control activities are hampered (Ashish &
———————————————— • *Md Shamim Shams is currently working at Bangladesh Water
Development Board,Dhaka, bangladesh. E-mail: [email protected] • Parvez Sarwar Hossain is currently working at Local government
Engineering Department, Dhaka, Bangladesh. E-mail: [email protected] (*Corresponding author)
IJSER
Page 2
International Journal of Scientific & Engineering Research, Volume 4, Issue 10, October-2013 1633 ISSN 2229-5518
IJSER © 2013 http://www.ijser.org
Sheiji, 2004). To mitigate and improvement of drainage
congestion various structural and non-structural methods
are practicing all over the world. Among those, flood
drainage modeling is a kind of non-structural application
which is fundamentally a numerical modeling approach on
urban drainage and flood modeling system.
Applications of numerical models have been used as a
traditional industry practice for urban drainage and flood
modelling work for many years (Vojinovic et al, 2011).
Among the models 1D urban drainage network model is
widely used because of less data-set requirement and
computational efforts. “This kind of model solves the Saint-
Venant one-dimensional flow equations to simulate the
behavior of the flow within a drainage pipe network,
including complex devices such as pumps, gates, weirs and
valve. The quality of such models is highly dependent on the
quality of the input dataset and calibration.”(Justine et al.,
2010). Software packages such as MIKE (DHI), SWMM (US
EPA), INFOWORKS (Wallingford), SOBEK (Deltares); etc
have found widespread commercial use for this purpose.
The study research project presented in this paper based on
application of numerical model for drainage improvement of
DND area of Dhaka city, Bangladesh. From the 1970s there
has been a steady progression in the development for urban
flood and drainage modelling (Boogard et al, 2010). But
urban flood and drainage model was first introduced in
Bangladesh on 1997 as a pilot based project in Dhaka city
due to damage response of 1996 flood event (Ole et al, 2001).
At that time DND area was excluded. DND project area was
implemented during 1962-1968 at outskirt commercial
portion of today’s megacity of Dhaka. At the beginning it
was like flood-proofed agricultural area bounded by high
embankment around under Flood Control Drainage and
Irrigation (FCDI) project. The main objectives of the project
were to protect Dhaka and Narayanganj towns from major
flood events and to accumulate inner croplands from
overflowing rivers. For achieving the self-reliance in food
grain production DND project was a special irrigation
project. But soon after the independence of Bangladesh DND
area continued to develop as an unplanned residential area
as many lower middle income people buying land and
building homes haphazardly. The development gained
tempo after the 1988 major flood event which welcoming
more people inside of dam protected area. As a result most
of the agricultural land was transformed into residential and
industrial zone without any plan. This unplanned housing
and settlement made an adverse impact on the existing
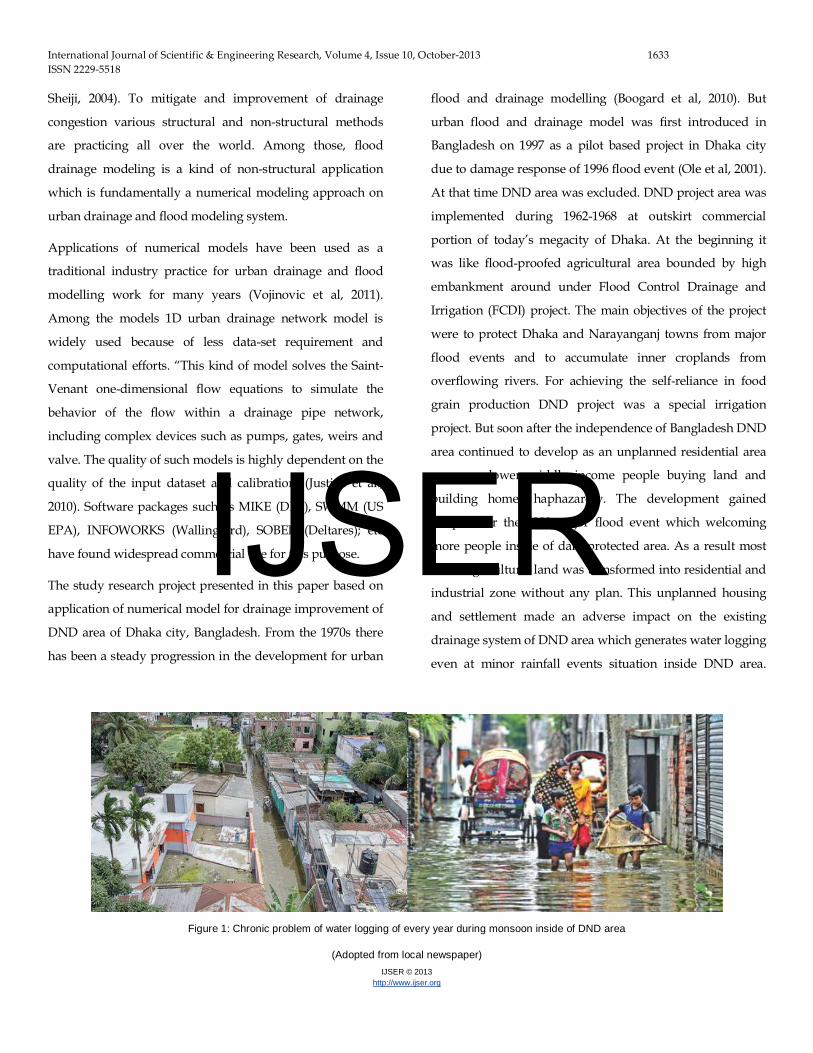
drainage system of DND area which generates water logging
even at minor rainfall events situation inside DND area.
Figure 1: Chronic problem of water logging of every year during monsoon inside of DND area
(Adopted from local newspaper)
IJSER
Page 3
International Journal of Scientific & Engineering Research, Volume 4, Issue 10, October-2013 1634 ISSN 2229-5518
IJSER © 2013 http://www.ijser.org
2. STUDY AREA PROFILE
DND area is situated between the river Buriganga and
Sitalakhya and is in the flood plain of the Meghna. The
Buriganga River covers both the south and a part of west
side and the Lakhya River is in the east side. At the
beginning of DND Project (1962-68) the area was primarily
rural and the land was mainly agricultural excluding existing
canals and homesteads. Now it has changed from the agro-
rural to agro-urban area. Urbanization process is randomly
progressing without any urban planning. Areas devoted to
agriculture and water bodies are continuously engulfed by
urbanization. Demra, Shyampur, Kutubpur, Matuail,
Siddirganj, Godnail, Madaninagar, Bhuigar, Pagla, Fatulla
etc. of DND area are approaching to an urban area at a very
fast rate. Already wards (small administrative part of city
corporation) 88, 89 of Dhaka City Corporation, Wards 1,2,3 &
4 of Narayanganj and Siddirganj Pourashava (local city
council) are declared urban areas within the project. Other
Pourashavas under consideration for declaration are
Kutubpur, Fatulla and Matuail. In 1962 DND project
consisted of over 80 percent agricultural land, and as on 2008
agricultural land is less than 25 percent. In a separate study
by JICA[3] it has projected that, on 2032 there will be 94
percent of urban related area while other minor part will be
water bodies or just open space. Land of DND area is
generally low in the middle and medium high in the
periphery. Slope of the land is form northwest to southeast.
The elevation of low land is 2.0 - 2.5m PWD[4] and medium
high land is 4.0-5.5m PWD. There is hardly any land above
5.5m PWD. The whole DND area is bounded by road-cum-
embankments and floodwalls. The major project components
were 31.25 km (now 31.00 km) road-cum-flood control
embankment, 55.20 km irrigation canal, 45.40 km. drainage
canal, 1.00 km intake canal, 216 nos. water control structures
and one pump station at Shimrail with 4 pumps (14.52
cumec capacity). As the area is developed for drainage and
irrigation, it is supplied with irrigation water in December to
May and generally flood free.
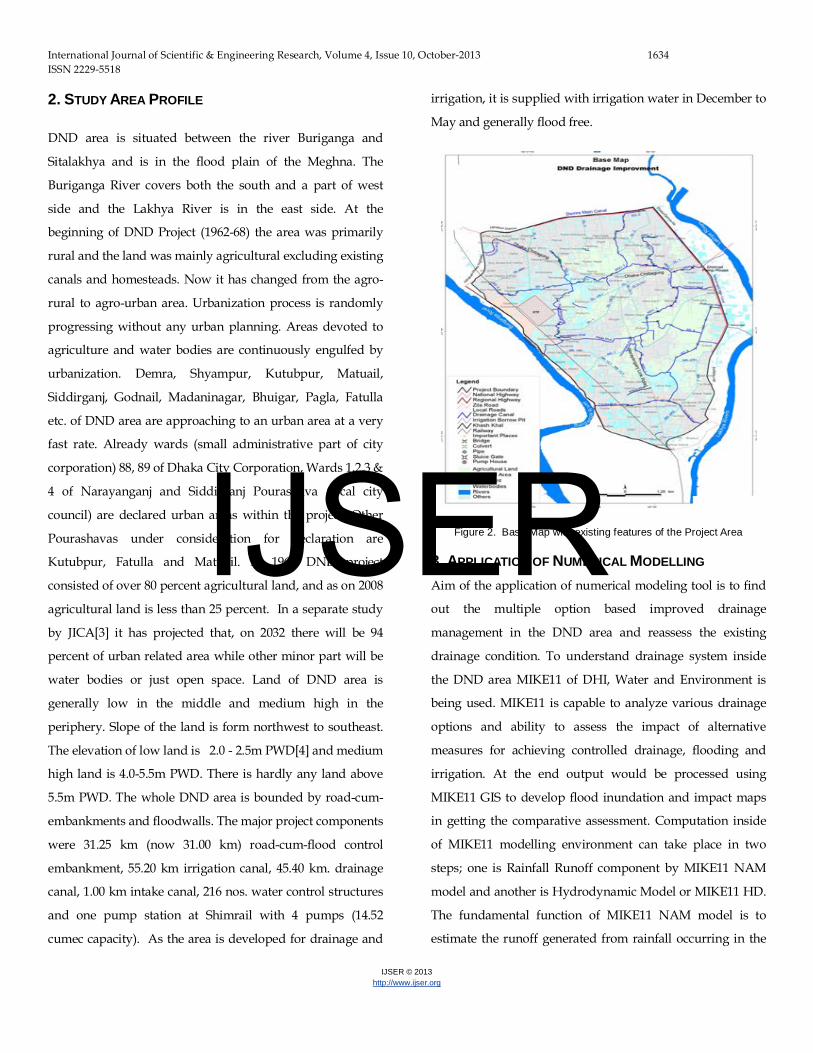
Figure 2. Base Map with existing features of the Project Area
3. APPLICATION OF NUMERICAL MODELLING Aim of the application of numerical modeling tool is to find
out the multiple option based improved drainage
management in the DND area and reassess the existing
drainage condition. To understand drainage system inside
the DND area MIKE11 of DHI, Water and Environment is
being used. MIKE11 is capable to analyze various drainage
options and ability to assess the impact of alternative
measures for achieving controlled drainage, flooding and
irrigation. At the end output would be processed using
MIKE11 GIS to develop flood inundation and impact maps
in getting the comparative assessment. Computation inside
of MIKE11 modelling environment can take place in two
steps; one is Rainfall Runoff component by MIKE11 NAM
model and another is Hydrodynamic Model or MIKE11 HD.
The fundamental function of MIKE11 NAM model is to
estimate the runoff generated from rainfall occurring in the
IJSER
Page 4
International Journal of Scientific & Engineering Research, Volume 4, Issue 10, October-2013 1635 ISSN 2229-5518
IJSER © 2013 http://www.ijser.org
basin. The catchments of the rainfall runoff model are
delineated according to the topographic barriers or
watershed boundaries, roads and river networks. The NAM
validation can be done by real time data set for proper
assessment. On the other hand, MIKE11 HD works from
NAM model output together with components of channel
bathymetry, flood cell topography, location of infra-
structures, resistance of channel bed-form; etc. The
performance of the HD model can be evaluated with known
point observed water level of the river.
3.1 Model Setup for study area
Rainfall Runoff and Hydrodynamic Models of MIKE11 have
been setup as base model for analyzing the different
drainage options. Model setup includes the model
schematization, calibration and validation of rainfall runoff
and hydrodynamic model.
3.1.1 Rainfall Runoff (NAM) Model:
Rainfall Runoff Model (NAM) has been developed to assess
the contribution of runoff generated from rainfall within
DND area using MIKE11 NAM. DND area is divided into 19
drainage sub catchments (Table-1 and Figure 3), derived
from the digital elevation model. These 19 sub-catchments
have been schematized and validated through field
investigation. Mean Areal Rainfall (MAR) and Mean Areal
Evaporation (MAE) for the year 2007-2008 have been used in
this model. Rainfall stations of Dhaka and Shimrail are used
for MAR calculation. Evaporation data of Dhaka station is
used for the NAM model.
Rainfall Runoff Model has been calibrated and validated for
the period of 2007-2008. Model parameters are initially
considered from a previously developed model by IWM[5]
named North Central Regional Model (NCRM) which covers
the DND and the peripheral river system. Then the NAM
model has been calibrated and verified against observed
groundwater level of DND area.
3.1.2 Hydrodynamic Model (HD)
Drainage part of Hydrodynamic Model consisting of all the
main drainage canals is separately developed to examine the
capacity of the existing drainage system for conveying the
design runoff generated from different catchments. Largely,
all the main, secondary and other existing drainage canals
have been schematized in the model for representing the
present situation of the area which has further been modified
during option development. MDC-1, MDC-2, Pagla Canal,
Fatulla Canal, SD-1, SD-2 and SD-3, Shampur Canal
(secondary drainage or SD-4), SD-5, SD-6 have been used for
setting up the base model. All irrigation borrow pits, like DL-
1(Demra Left), DL-2, DL-3, DL-4, NR-1 (Narayanganj Right),
NR-2, and Kangsho Nadi have been used during option
development. The result of Rainfall Runoff Model of the
drainage sub-catchments have been incorporated as lateral
inflow (pointed/distributed) to the existing canals. Cross
section data at every 300 m interval, collected under this
study, have been used in the HD model. Peripheral
hydrodynamic model has been set up with peripheral river
system. The peripheral HD model has also been coupled to
examine the external river water level. Cross section data of
BWDB has been used in the MIKE11 HD model simulation.
Like the NAM model Hydrodynamic model has also been
calibrated and validated for the year of 2007-2008. The model
has been calibrated and validated against observed water
level at specific 7 locations (Figure 4). Similarly
hydrodynamic model of external river system has also been
calibrated and validated against observed water level of 31
years for the period of 1976-2007 from collected BWDB data
series.
IJSER
Page 5
International Journal of Scientific & Engineering Research, Volume 4, Issue 10, October-2013 1636 ISSN 2229-5518
IJSER © 2013 http://www.ijser.org
TABLE 1 SUB-CATCHMENT OF THE DND AREA
Sl. No
Drainage Catchment Drainage Canal Area in
Ha Sl. No
Drainage Catchment
Drainage Canal
Area in Ha
1 C-1 SDC4/Shampur Canal 710
11 C-11
Fatulla Canal (FK) 383
2 C-2 SDC-3 455
12 C-12
-Do- 196
3 C-3 MDC-2 250
13 C-13
-Do- 081
4 C-4 SDC-2 Dogair Canal 279
14 C-14
Pagla Canal ((PK) 276
5 C-5 SDC-1 190
15 C-15
-Do- 229
6 C-6 MDC-2 178
16 C-16
Pagla Branch (PB) 156
7 C-7 MDC-1 085
17 C-17
MDC-2 538
8 C-8 Kangsho River (KN) 031
18 C-18
MDC-1 226
9 C-9 SDC-5 574
19 C-19
MDC-1 160
10 C-10 MDC-1 825
Total Catchment Area in Ha 5822
Note: MDC – Main Drainage Canal, SDC–Secondary Drainage Canal
Figure 3 Drainage sub-catchment based on digital elevation model of DND area
IJSER
Page 6
International Journal of Scientific & Engineering Research, Volume 4, Issue 10, October-2013 1637 ISSN 2229-5518
IJSER © 2013 http://www.ijser.org
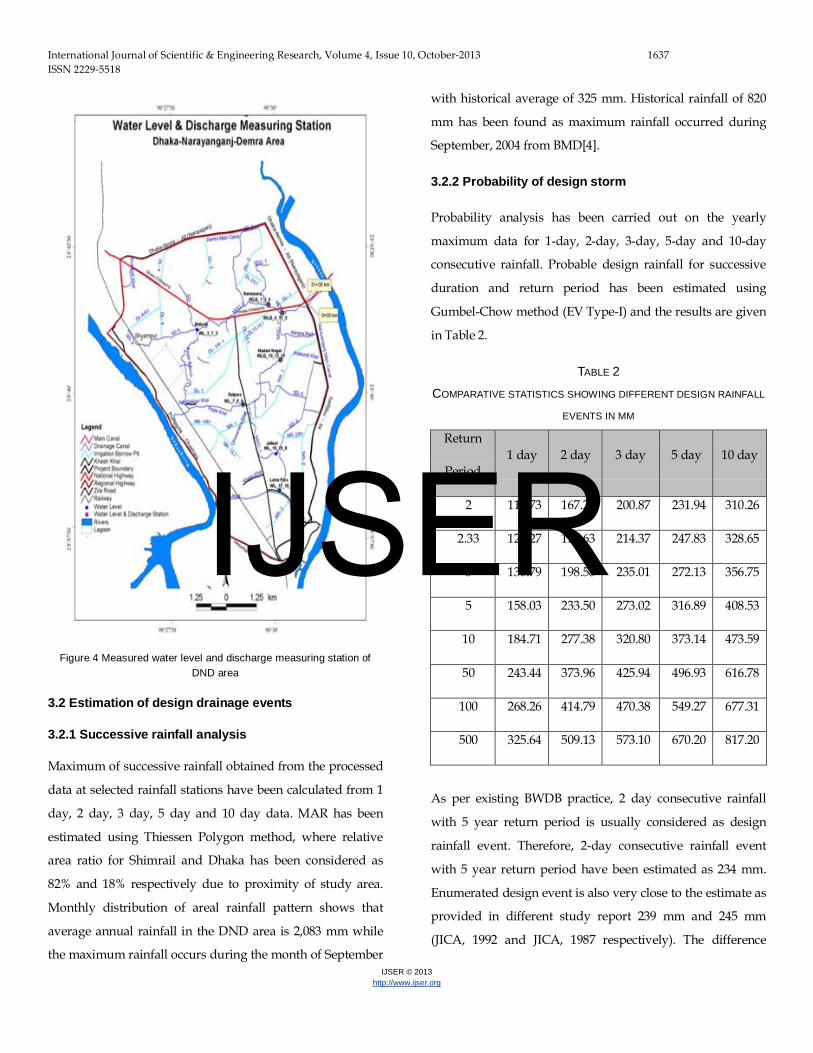
Figure 4 Measured water level and discharge measuring station of DND area
3.2 Estimation of design drainage events
3.2.1 Successive rainfall analysis
Maximum of successive rainfall obtained from the processed
data at selected rainfall stations have been calculated from 1
day, 2 day, 3 day, 5 day and 10 day data. MAR has been
estimated using Thiessen Polygon method, where relative
area ratio for Shimrail and Dhaka has been considered as
82% and 18% respectively due to proximity of study area.
Monthly distribution of areal rainfall pattern shows that
average annual rainfall in the DND area is 2,083 mm while
the maximum rainfall occurs during the month of September
with historical average of 325 mm. Historical rainfall of 820
mm has been found as maximum rainfall occurred during
September, 2004 from BMD[4].
3.2.2 Probability of design storm
Probability analysis has been carried out on the yearly
maximum data for 1-day, 2-day, 3-day, 5-day and 10-day
consecutive rainfall. Probable design rainfall for successive
duration and return period has been estimated using
Gumbel-Chow method (EV Type-I) and the results are given
in Table 2.
TABLE 2
COMPARATIVE STATISTICS SHOWING DIFFERENT DESIGN RAINFALL
EVENTS IN MM
Return
Period 1 day 2 day 3 day 5 day 10 day
2 117.73 167.23 200.87 231.94 310.26
2.33 125.27 179.63 214.37 247.83 328.65
3 136.79 198.58 235.01 272.13 356.75
5 158.03 233.50 273.02 316.89 408.53
10 184.71 277.38 320.80 373.14 473.59
50 243.44 373.96 425.94 496.93 616.78
100 268.26 414.79 470.38 549.27 677.31
500 325.64 509.13 573.10 670.20 817.20
As per existing BWDB practice, 2 day consecutive rainfall
with 5 year return period is usually considered as design
rainfall event. Therefore, 2-day consecutive rainfall event
with 5 year return period have been estimated as 234 mm.
Enumerated design event is also very close to the estimate as
provided in different study report 239 mm and 245 mm
(JICA, 1992 and JICA, 1987 respectively). The difference
IJSER
Page 7
International Journal of Scientific & Engineering Research, Volume 4, Issue 10, October-2013 1638 ISSN 2229-5518
IJSER © 2013 http://www.ijser.org
found is due to the use of only one station by JICA for their
study, while the mean of two stations is used in this study.
Considering the coverage of a drainage area, the value of the
design rainfall has been used for runoff analysis to determine
the design capacity of the main drainage canal, structure,
regulator and pump station. To be in the safer side, this
study has considered the design rainfall amounting to 245
mm. So, rainfall data of BMD has been used in all analyses.
3.3 Rainfall Runoff data Calibrated drainage model has been simulated using design
drainage event (extreme event) of specific return period
derived from probability analysis. Catchment parameters
have been used and considered with respect to prevailing
and future land use considering fully urbanized in the
MIKE11 NAM model.
The Rainfall Runoff model of MIKE11 has been simulated for
the selected rainfall event of 2005 for generating runoff from
rainfall for each catchment within the study area. This runoff
has been used as lateral inflow for the drainage as well as
irrigation borrow pit canal to be converted as drainage canal
for option development inside the DND area to simulate the
hydrodynamic model. Using 2-day 5-year event of rainfall
for 2005, the runoff generated by the Rainfall Runoff model is
presented in Table 2 where the domestic and industrial
effluents are not considered. Domestic and industrial
effluents have been considered during option development
for drainage improvements. It has been found that the total
area has to drain out around 99 MCM of surface runoff for
the design event during the wet season spread over 5 months
period (av. 7.64 cumec). Catchment number ten (C-10)
contributes the highest proportion (14.04 MCM av. 1.03
cumec) while catchment number eight (C-8) discharges the
lowest (0.53 MCM av. 0.04 cumec).
3.4 Hydrodynamic Model Simulation
The hydrodynamic model has been simulated for the
estimated design period of 2005 considering drainage and a
part of the irrigation borrow pit canal for whole DND area.
From the simulation it is found that, the highest peak
discharge (98 cumec) is occurred during mid September. In
addition, several other peaks are found in July and August.
The next peak values are 65 and 60 cumec. The
hydrodynamic model has generated this discharge assuming
fully urbanized DND area in 2032 (predict). This model
result is the basis for developing different options for
drainage solution in the DND area.
A number of command areas (as per land topography) have
been planned to drain out the accumulated drainage volume
(rainfall runoff, industrial and domestic effluents), which
consists of variable proportion of different drainage
catchments. These command areas facilitate the option
development process. A possible formation of four
command areas consisting of nineteen catchments can be
treated as one option with four drainage outlet that
discharges the internal drainage volume in the peripheral
river system. Accumulated drainage volume for each of the
possible combination of command areas has been
investigated thoroughly to determine the best option.
3.5 Peripheral DND area Flood levels with 100 year return period at different locations
have been derived from the Peripheral River Model. At
every 500 m interval, water level data have been extracted to
enumerate the extreme design event for 100 year return
period. This design event has been estimated from the
annual maximum series using the Gumbel Chow method
(EV Type-I).
4. OPTION DEVELOPMENT
4.1 Formulation of Technical Options
Future scenario for the year 2032 (25 years from this study
begins as on 2007) has been taken into consideration while
developing options for the DND area. Detailed Area Plan
(DAP) by RAJUK [7] has considered that the DND area will
be fully urbanized (5 cumec for domestic and 3.42 cumec for
industrial with population density 225 per acre) in the year
IJSER
Page 8
International Journal of Scientific & Engineering Research, Volume 4, Issue 10, October-2013 1639 ISSN 2229-5518
IJSER © 2013 http://www.ijser.org
2030. This study has assumed the same scenario for option
development as recommended in DAP for DND area.
4.2 Drainage Options
For this study three options are developed as per DAP report
up to year of 2030 with population projection 225 per acre.
The options are- Option-1: Two pump stations at Shimrail
(46.11 cumec) and Adamjinagar (28.58 cumec), Option-2:
Three pump stations at Shimrail (41.06 cumec), Adamjinagar
(25.45 cumec) and Pagla (8.19 cumec), and Option-3: Four
pump stations at Shimrail (38.41 cumec), Adamjinagar (30.21
cumec), Pagla (2.82 cumec) and Fatulla (3.25 cumec).
4.3 Comparison of Options
All the three options have been analyzed to identify the
positive and negative points. Option-1 has a strong positive
point that is drainage systems leading to Shimrail and
Adamjinagar follow the existing drainage slope and flow
direction but has the strongest negative point of having
longest drainage travel path to pump stations. On the other
side, Option-3 has the best drainage distribution and shorter
drainage paths but drainage slope and flow direction toward
Pagla and Fatulla pump stations are adverse. For Option-2,
drainage distribution is moderate with adverse slope and
flow direction toward Pagla Pump Station.
4.4 Impact Assessment of Different Options
The impact of different options has been evaluated by
generating and interpreting flood depth maps for 2 days
consecutive rainfall. Flooding extent for different options in
terms of flood level at specific locations and drainage path
length for different interventions has been assessed. The
most feasible option has been selected from the output
generated from numerical model analysis. The flood depth
map i.e. flood impact map has been generated from MIKE11
for two days consecutive rainfall. Standard flood depth
classification has been adopted as per MPO[8] classification.
F0 land has been considered for less than 30 cm flood depth
and F4 land for more than 300 cm. Impact of different
options in terms of flood mitigation is given for Option 3 for
present land use and for projected land use (2032) in Figure
5. Considering 80% efficiency of the existing Shimrail Pump
and 2 days 5 year design rainfall, existing situation shows
that nearly 50% area (2880 ha) of the DND area remains
inundated during wet season. Active drainage canals and
irrigation borrow pits have been considered for this
situation. The duration of inundation is two days. In Option
1, it improves to twenty percent. Table 3 shows eighty
percent (80%) area might become flood free for present land
use situation if Option- 3 is selected, whereas, 61 % for
Option 1 and 64% for Option 2. For projected (2032) situation
about 97% will be flood free for Option-3.
IJSER
Page 9
International Journal of Scientific & Engineering Research, Volume 4, Issue 10, October-2013 1640 ISSN 2229-5518
IJSER © 2013 http://www.ijser.org
TABLE 3
OPTION WISE FLOOD DEPTH AREA
Land Type
Existing condition
Option-1
Option-2
Option-3
(Present)
Option-3
(Year 2032)
Area (ha) % Area (ha) % Area (ha) % Area (ha) % Area (ha) %
F0 (<30 cm) 1868 32 2450 42 2615 45 3712 64 5071 87
F1 (30-90 cm) 1012 17 1091 19 1086 19 928 16 586 10
F2 (90-180 cm) 1540 26 1406 24 1364 23 978 17 193 2
F3 (180-300 cm) 1270 22 790 14 680 12 174 3 2 0
F4 (>300 cm) 133 2 85 1 77 1 31 1 31 1
Total Area 5822 100 5822 100 5822 100 5822 100 5822 100
Figure 5: Impact of flood depth for option3 for recent years land use and 2032 (predicted)
IJSER
Page 10
International Journal of Scientific & Engineering Research, Volume 4, Issue 10, October-2013 1641 ISSN 2229-5518
IJSER © 2013 http://www.ijser.org
5. EXAMINING IMPACT OF PUMP FAILURE UNDER
VARIOUS PUMP OPERATION SCENARIOS
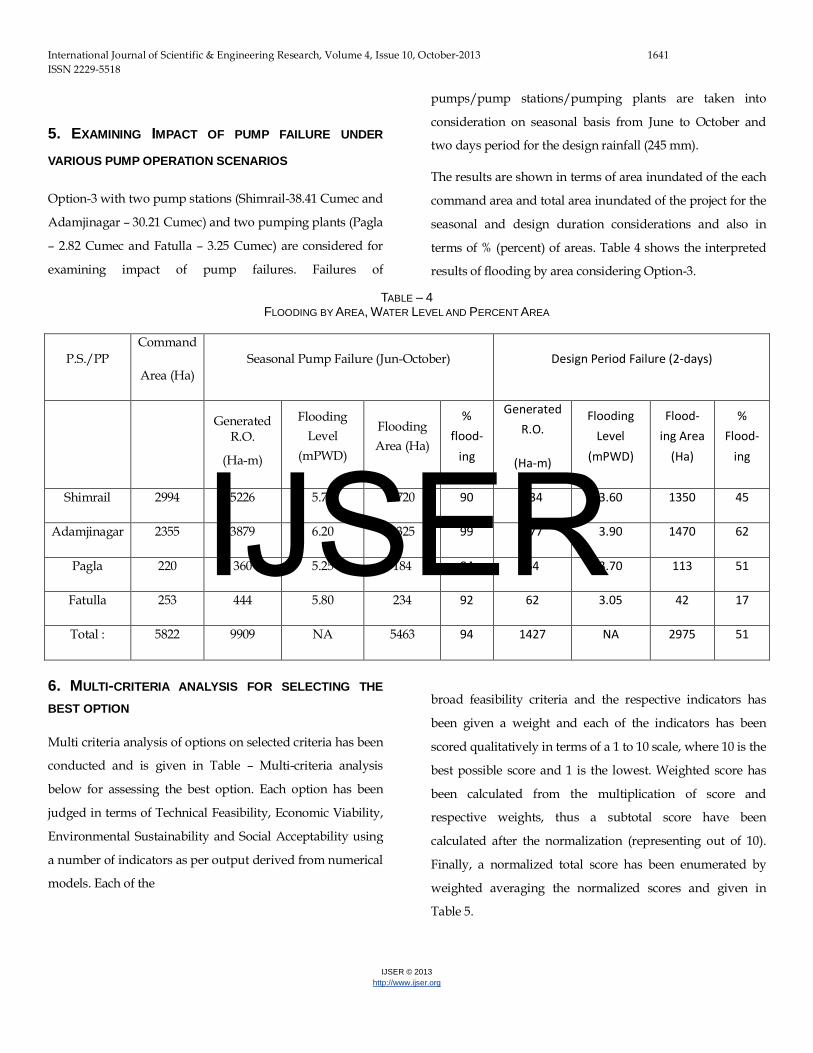
Option-3 with two pump stations (Shimrail-38.41 Cumec and
Adamjinagar – 30.21 Cumec) and two pumping plants (Pagla
– 2.82 Cumec and Fatulla – 3.25 Cumec) are considered for
examining impact of pump failures. Failures of
pumps/pump stations/pumping plants are taken into
consideration on seasonal basis from June to October and
two days period for the design rainfall (245 mm).
The results are shown in terms of area inundated of the each
command area and total area inundated of the project for the
seasonal and design duration considerations and also in
terms of % (percent) of areas. Table 4 shows the interpreted
results of flooding by area considering Option-3.
TABLE – 4 FLOODING BY AREA, WATER LEVEL AND PERCENT AREA
P.S./PP Command
Area (Ha) Seasonal Pump Failure (Jun-October) Design Period Failure (2-days)
Generated
R.O.
(Ha-m)
Flooding Level
(mPWD)
Flooding Area (Ha)
% flood-
ing
Generated R.O.
(Ha-m)
Flooding Level
(mPWD)
Flood-ing Area
(Ha)
% Flood-
ing
Shimrail 2994 5226 5.70 2720 90 734 3.60 1350 45
Adamjinagar 2355 3879 6.20 2325 99 577 3.90 1470 62
Pagla 220 360 5.25 184 84 54 3.70 113 51
Fatulla 253 444 5.80 234 92 62 3.05 42 17
Total : 5822 9909 NA 5463 94 1427 NA 2975 51
6. MULTI-CRITERIA ANALYSIS FOR SELECTING THE
BEST OPTION
Multi criteria analysis of options on selected criteria has been
conducted and is given in Table – Multi-criteria analysis
below for assessing the best option. Each option has been
judged in terms of Technical Feasibility, Economic Viability,
Environmental Sustainability and Social Acceptability using
a number of indicators as per output derived from numerical
models. Each of the
broad feasibility criteria and the respective indicators has
been given a weight and each of the indicators has been
scored qualitatively in terms of a 1 to 10 scale, where 10 is the
best possible score and 1 is the lowest. Weighted score has
been calculated from the multiplication of score and
respective weights, thus a subtotal score have been
calculated after the normalization (representing out of 10).
Finally, a normalized total score has been enumerated by
weighted averaging the normalized scores and given in
Table 5.
IJSER
Page 11
International Journal of Scientific & Engineering Research, Volume 4, Issue 10, October-2013 1642 ISSN 2229-5518
IJSER © 2013 http://www.ijser.org
It has been found that Option-3 is the most feasible option in
terms of Technical Feasibility, Environmental Sustainability
and Social Acceptability; although it’s economic viability is
less attractive from other options due to higher capital cost
involvement.
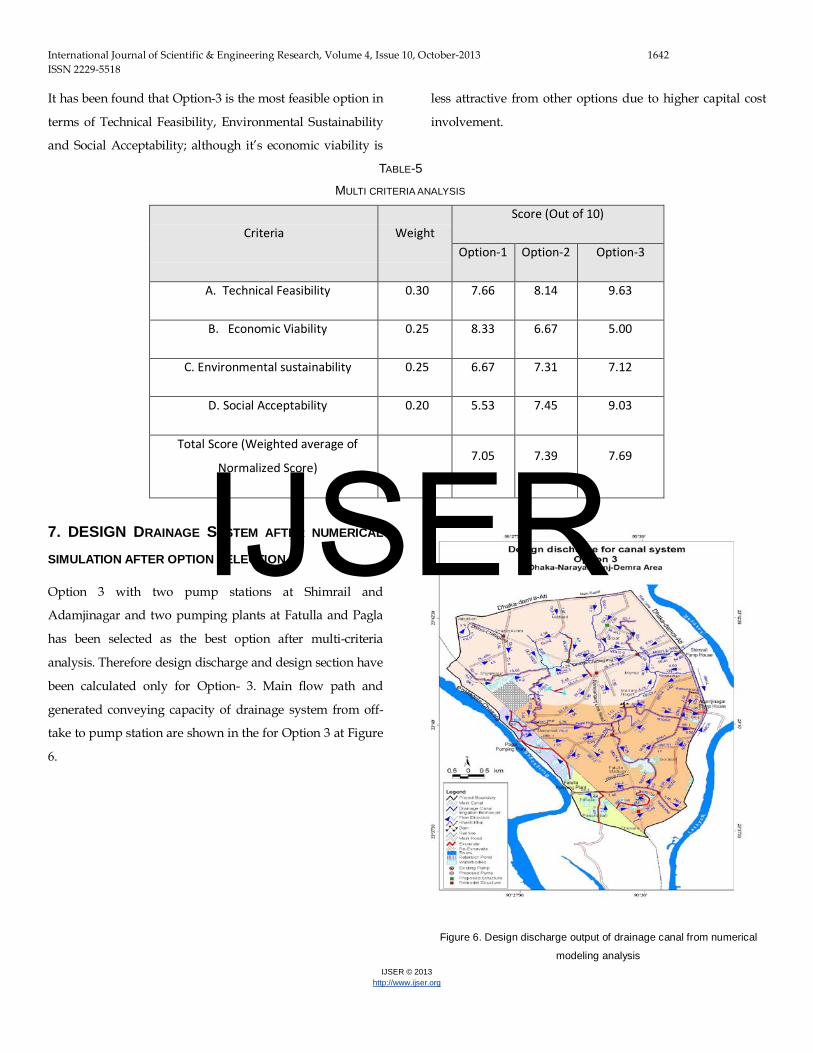
TABLE-5
MULTI CRITERIA ANALYSIS
Criteria Weight Score (Out of 10)
Option-1 Option-2 Option-3
A. Technical Feasibility 0.30 7.66 8.14 9.63
B. Economic Viability 0.25 8.33 6.67 5.00
C. Environmental sustainability 0.25 6.67 7.31 7.12
D. Social Acceptability 0.20 5.53 7.45 9.03
Total Score (Weighted average of
Normalized Score) 7.05 7.39 7.69
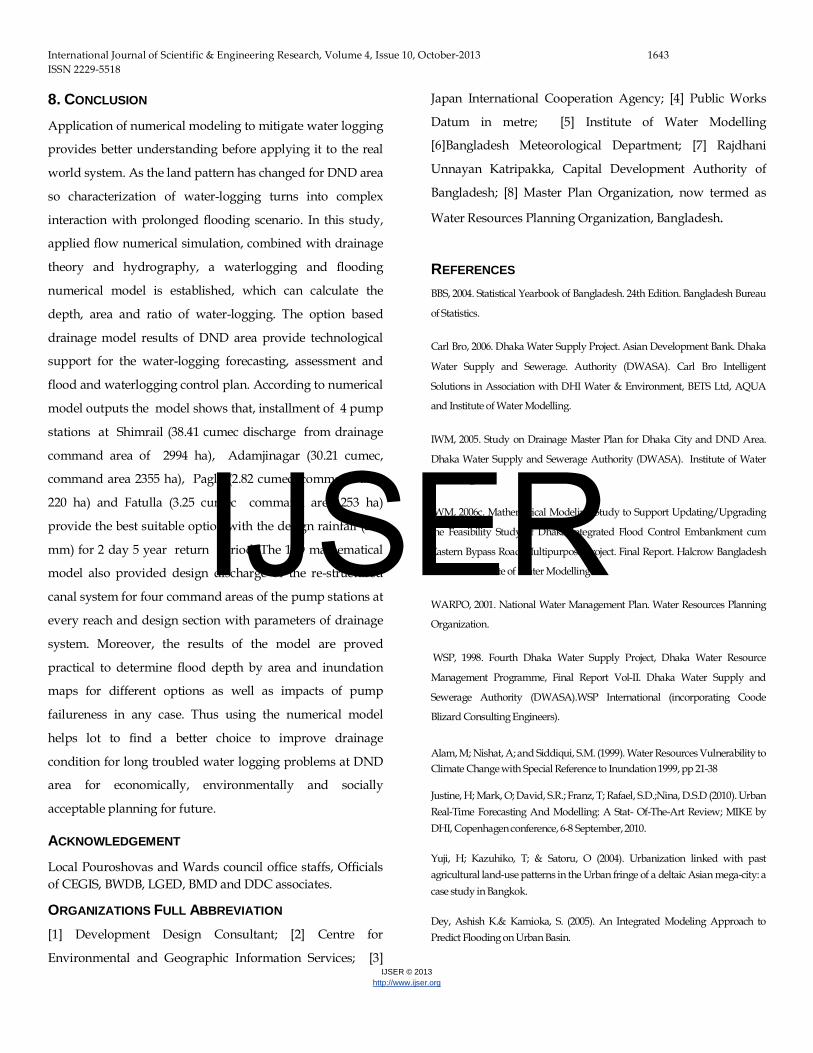
7. DESIGN DRAINAGE SYSTEM AFTER NUMERICAL
SIMULATION AFTER OPTION SELECTION
Option 3 with two pump stations at Shimrail and
Adamjinagar and two pumping plants at Fatulla and Pagla
has been selected as the best option after multi-criteria
analysis. Therefore design discharge and design section have
been calculated only for Option- 3. Main flow path and
generated conveying capacity of drainage system from off-
take to pump station are shown in the for Option 3 at Figure
6.
Figure 6. Design discharge output of drainage canal from numerical
modeling analysis
IJSER
Page 12
International Journal of Scientific & Engineering Research, Volume 4, Issue 10, October-2013 1643 ISSN 2229-5518
IJSER © 2013 http://www.ijser.org
8. CONCLUSION Application of numerical modeling to mitigate water logging
provides better understanding before applying it to the real
world system. As the land pattern has changed for DND area
so characterization of water-logging turns into complex
interaction with prolonged flooding scenario. In this study,
applied flow numerical simulation, combined with drainage
theory and hydrography, a waterlogging and flooding
numerical model is established, which can calculate the
depth, area and ratio of water-logging. The option based
drainage model results of DND area provide technological
support for the water-logging forecasting, assessment and
flood and waterlogging control plan. According to numerical
model outputs the model shows that, installment of 4 pump
stations at Shimrail (38.41 cumec discharge from drainage
command area of 2994 ha), Adamjinagar (30.21 cumec,
command area 2355 ha), Pagla (2.82 cumec, command area
220 ha) and Fatulla (3.25 cumec command area 253 ha)
provide the best suitable option with the design rainfall (245
mm) for 2 day 5 year return period. The 1-D mathematical
model also provided design discharge of the re-structured
canal system for four command areas of the pump stations at
every reach and design section with parameters of drainage
system. Moreover, the results of the model are proved
practical to determine flood depth by area and inundation
maps for different options as well as impacts of pump
failureness in any case. Thus using the numerical model
helps lot to find a better choice to improve drainage
condition for long troubled water logging problems at DND
area for economically, environmentally and socially
acceptable planning for future.
ACKNOWLEDGEMENT Local Pouroshovas and Wards council office staffs, Officials of CEGIS, BWDB, LGED, BMD and DDC associates.
ORGANIZATIONS FULL ABBREVIATION [1] Development Design Consultant; [2] Centre for
Environmental and Geographic Information Services; [3]
Japan International Cooperation Agency; [4] Public Works
Datum in metre; [5] Institute of Water Modelling
[6]Bangladesh Meteorological Department; [7] Rajdhani
Unnayan Katripakka, Capital Development Authority of
Bangladesh; [8] Master Plan Organization, now termed as
Water Resources Planning Organization, Bangladesh.
REFERENCES BBS, 2004. Statistical Yearbook of Bangladesh. 24th Edition. Bangladesh Bureau
of Statistics.
Carl Bro, 2006. Dhaka Water Supply Project. Asian Development Bank. Dhaka
Water Supply and Sewerage. Authority (DWASA). Carl Bro Intelligent
Solutions in Association with DHI Water & Environment, BETS Ltd, AQUA
and Institute of Water Modelling.
IWM, 2005. Study on Drainage Master Plan for Dhaka City and DND Area.
Dhaka Water Supply and Sewerage Authority (DWASA). Institute of Water
Modelling
IWM, 2006c. Mathematical Modeling Study to Support Updating/Upgrading
the Feasibility Study of Dhaka Integrated Flood Control Embankment cum
Eastern Bypass Road Multipurpose Project. Final Report. Halcrow Bangladesh
Limited. Institute of Water Modelling
WARPO, 2001. National Water Management Plan. Water Resources Planning
Organization.
WSP, 1998. Fourth Dhaka Water Supply Project, Dhaka Water Resource
Management Programme, Final Report Vol-II. Dhaka Water Supply and
Sewerage Authority (DWASA).WSP International (incorporating Coode
Blizard Consulting Engineers).
Alam, M; Nishat, A; and Siddiqui, S.M. (1999). Water Resources Vulnerability to Climate Change with Special Reference to Inundation 1999, pp 21-38
Justine, H; Mark, O; David, S.R.; Franz, T; Rafael, S.D.;Nina, D.S.D (2010). Urban Real-Time Forecasting And Modelling: A Stat- Of-The-Art Review; MIKE by DHI, Copenhagen conference, 6-8 September, 2010.
Yuji, H; Kazuhiko, T; & Satoru, O (2004). Urbanization linked with past agricultural land-use patterns in the Urban fringe of a deltaic Asian mega-city: a case study in Bangkok.
Dey, Ashish K.& Kamioka, S. (2005). An Integrated Modeling Approach to Predict Flooding on Urban Basin.
IJSER
Page 13
International Journal of Scientific & Engineering Research, Volume 4, Issue 10, October-2013 1644 ISSN 2229-5518
IJSER © 2013 http://www.ijser.org
Sole, A. and Guccaro. G. (2005) ,New urban area flood model: a comparison with MIKE11-quasi2d; Advances in Geosciences, 2, 279–284, 2005 SRef-ID: 1680-7359/adgeo/2005-2-279
Apirumanekul, C. & Mark, O. (2001). Modelling of Urban Flooding in Dhaka City, 11th International Conference on Urban Drainage, Edinburgh, Scotland, UK, 2008.
Parkinson, J. (2003) Drainage and storm-water management strategies for low-income urban communities, Sage Journals Environment and UrbanizationOctober 2003 vol. 15 no. 2 115-126
MSc research of Tawhid, Golam K, (2004). Causes and Effects of Water Logging in Dhaka City, Bangladesh., Stockholm, 2004.
Blanksby, J; Kluck, J.; Boogaard,C; Simpson, S.; Shepherd, W & Doncaster, S.(2010). Modelling and mapping of urban storm water flooding – Using simple approaches in a process of Triage.
Veról, P.; Miguez, M.; Machado, L. & Siqueira, T. (2011). Urban Flood Control in Vila Fraternidade, Brazil: Analysis of a Polder Installation Supported by a Hydrodynamic Computer Model, 12nd International Conference on Urban Drainage, Porto Alegre/Brazil, 11-16 September 2011
Vojinovic, Z.; Seyoum, S.D.; Mwalwaka, J.M.; Price, R.K.(2011). Effects of model schematisation, geometry and parameter values on urban flood modeling, Water Sci Technol. 2011;63(3):462-7.
Sto Domingo, N.D; Refsgaard, A.; Mark, O.; & Paludan, B. (2010). Flood
analysis in mixed-urban areas reflecting interactions with the complete water
cycle through coupled hydrologic-hydraulic modeling., 4th DHI Software
Conference, 2001.
The Rivers of Bangladesh (2003), Bangladesh Water Development Board.
.
IJSER