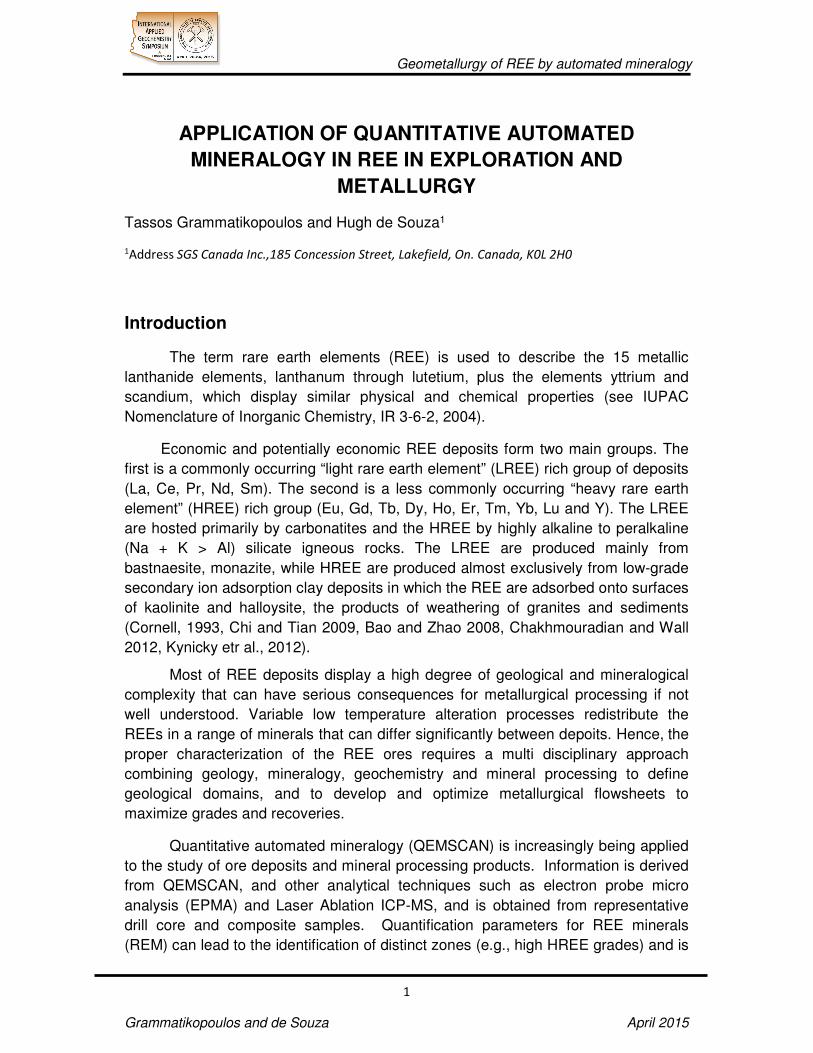
Geometallurgy of REE by automated mineralogy 1 Grammatikopoulos and de Souza April 2015 APPLICATION OF QUANTITATIVE AUTOMATED MINERALOGY IN REE IN EXPLORATION AND METALLURGY Tassos Grammatikopoulos and Hugh de Souza 1 1 Address SGS Canada Inc.,185 Concession Street, Lakefield, On. Canada, K0L 2H0 Introduction The term rare earth elements (REE) is used to describe the 15 metallic lanthanide elements, lanthanum through lutetium, plus the elements yttrium and scandium, which display similar physical and chemical properties (see IUPAC Nomenclature of Inorganic Chemistry, IR 3-6-2, 2004). Economic and potentially economic REE deposits form two main groups. The first is a commonly occurring “light rare earth element” (LREE) rich group of deposits (La, Ce, Pr, Nd, Sm). The second is a less commonly occurring “heavy rare earth element” (HREE) rich group (Eu, Gd, Tb, Dy, Ho, Er, Tm, Yb, Lu and Y). The LREE are hosted primarily by carbonatites and the HREE by highly alkaline to peralkaline (Na + K > Al) silicate igneous rocks. The LREE are produced mainly from bastnaesite, monazite, while HREE are produced almost exclusively from low-grade secondary ion adsorption clay deposits in which the REE are adsorbed onto surfaces of kaolinite and halloysite, the products of weathering of granites and sediments (Cornell, 1993, Chi and Tian 2009, Bao and Zhao 2008, Chakhmouradian and Wall 2012, Kynicky etr al., 2012). Most of REE deposits display a high degree of geological and mineralogical complexity that can have serious consequences for metallurgical processing if not well understood. Variable low temperature alteration processes redistribute the REEs in a range of minerals that can differ significantly between depoits. Hence, the proper characterization of the REE ores requires a multi disciplinary approach combining geology, mineralogy, geochemistry and mineral processing to define geological domains, and to develop and optimize metallurgical flowsheets to maximize grades and recoveries. Quantitative automated mineralogy (QEMSCAN) is increasingly being applied to the study of ore deposits and mineral processing products. Information is derived from QEMSCAN, and other analytical techniques such as electron probe micro analysis (EPMA) and Laser Ablation ICP-MS, and is obtained from representative drill core and composite samples. Quantification parameters for REE minerals (REM) can lead to the identification of distinct zones (e.g., high HREE grades) and is
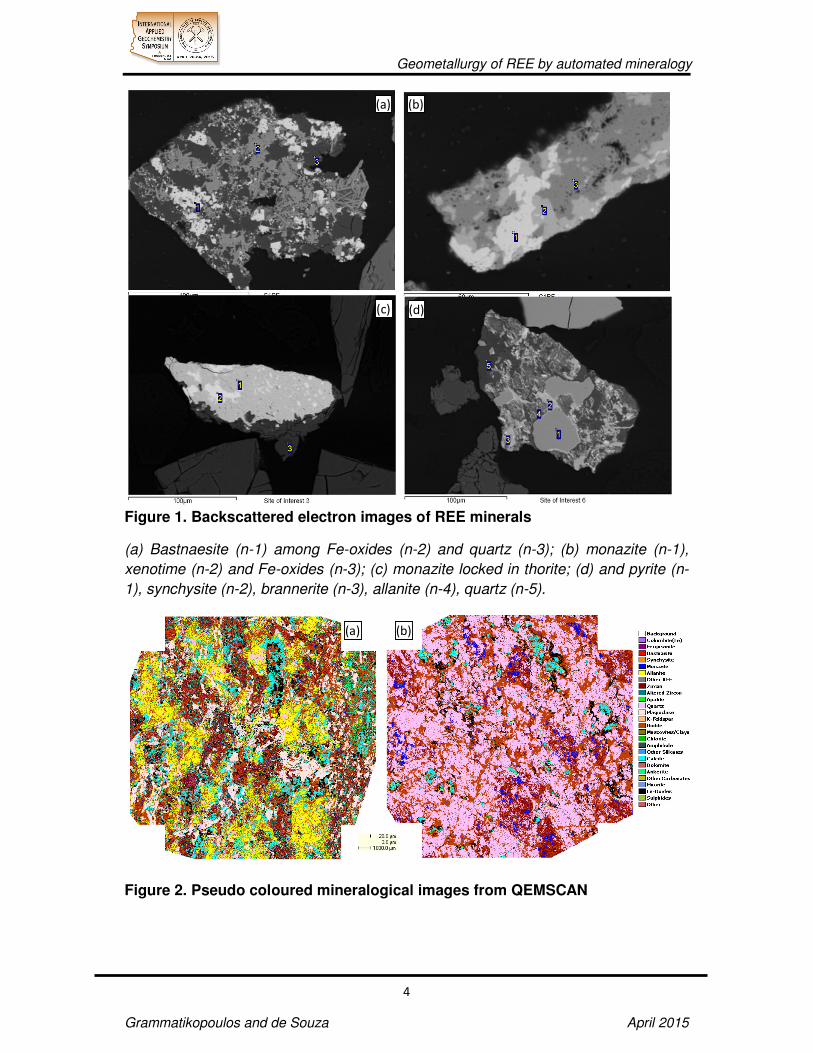
Figure 2. Pseudo coloured mineralogical images from QEMSCAN
(a) (b)
(c) (d)
(a) (b)
Geometallurgy of REE by automated mineralogy
5
Grammatikopoulos and de Souza April 2015
Non-liberated grains are classified according to association characteristics,
where binary association groups refer to particle area percent ≥95% of the two
minerals or mineral groups. Figure 6 shows an example of liberation of monazite
from a carbonatite deposit. Liberation calculated for the head sample is ~41% (pure,
free and liberated combined). Liberation values generally increase with decreasing
size from 1% to 7% to 35% to 60%.
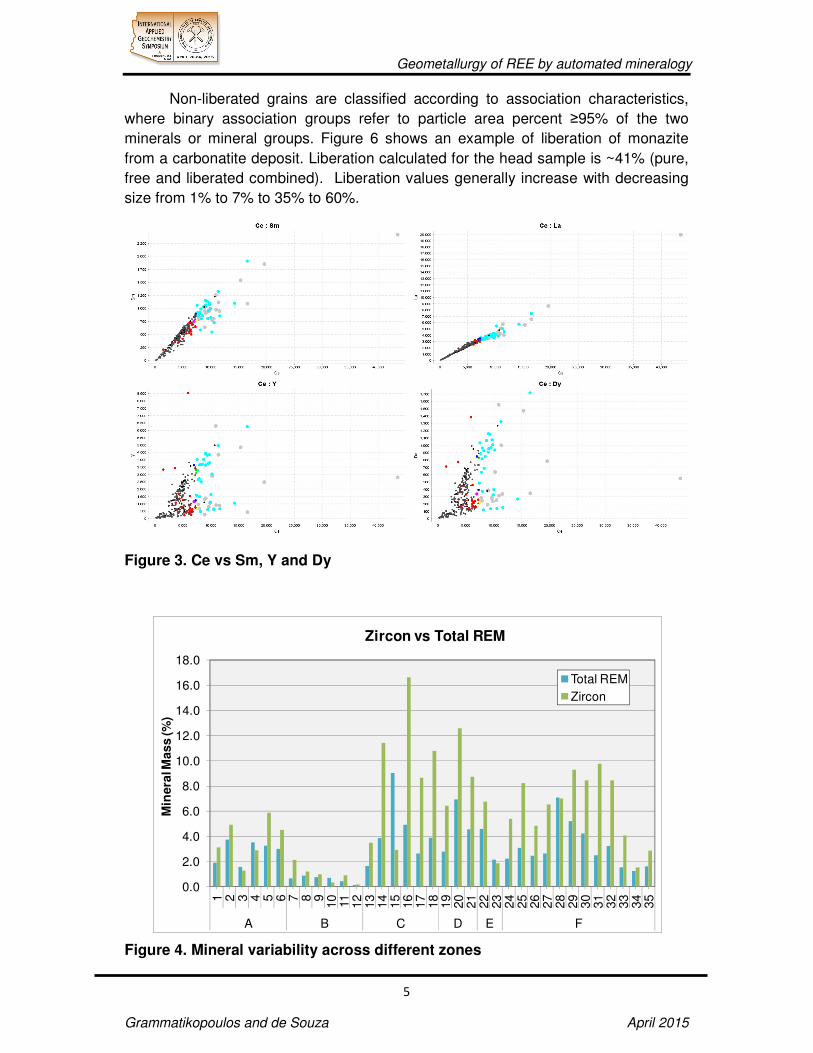
Figure 3. Ce vs Sm, Y and Dy
Figure 4. Mineral variability across different zones
0.0
2.0
4.0
6.0
8.0
10.0
12.0
14.0
16.0
18.0
1 2 3 4 5 6 7 8 910
11
12
13
14
15
16
17
18
19
20
21
22
23
24
25
26
27
28
29
30
31
32
33
34
35
A B C D E F
Min
era
l Mas
s (%
)
Zircon vs Total REM
Total REM
Zircon
Geometallurgy of REE by automated mineralogy
6
Grammatikopoulos and de Souza April 2015
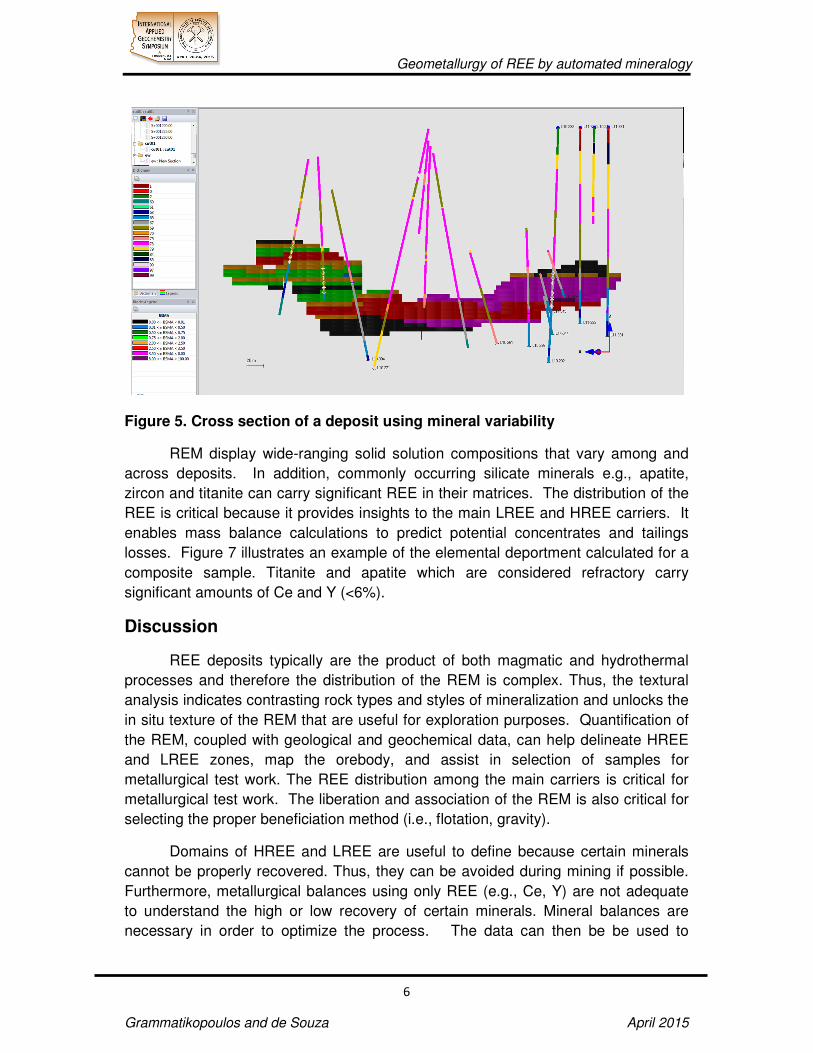
Figure 5. Cross section of a deposit using mineral variability
REM display wide-ranging solid solution compositions that vary among and
across deposits. In addition, commonly occurring silicate minerals e.g., apatite,
zircon and titanite can carry significant REE in their matrices. The distribution of the
REE is critical because it provides insights to the main LREE and HREE carriers. It
enables mass balance calculations to predict potential concentrates and tailings
losses. Figure 7 illustrates an example of the elemental deportment calculated for a
composite sample. Titanite and apatite which are considered refractory carry
significant amounts of Ce and Y (<6%).
Discussion
REE deposits typically are the product of both magmatic and hydrothermal
processes and therefore the distribution of the REM is complex. Thus, the textural
analysis indicates contrasting rock types and styles of mineralization and unlocks the
in situ texture of the REM that are useful for exploration purposes. Quantification of
the REM, coupled with geological and geochemical data, can help delineate HREE
and LREE zones, map the orebody, and assist in selection of samples for
metallurgical test work. The REE distribution among the main carriers is critical for
metallurgical test work. The liberation and association of the REM is also critical for
selecting the proper beneficiation method (i.e., flotation, gravity).
Domains of HREE and LREE are useful to define because certain minerals
cannot be properly recovered. Thus, they can be avoided during mining if possible.
Furthermore, metallurgical balances using only REE (e.g., Ce, Y) are not adequate
to understand the high or low recovery of certain minerals. Mineral balances are
necessary in order to optimize the process. The data can then be be used to
Geometallurgy of REE by automated mineralogy
7
Grammatikopoulos and de Souza April 2015
populate the geological and mining models in order to at least optimize the REE
recovery.
Figure 6. Recoverability as a function of liberation and exposure of monazite
Conclusions
A synthesis of quantitative data from automated mineralogical analysis,
mineral chemistry, and geological information can properly delineate the ore, predict
REE grades and recoveries, and assist with the classification of mineral resources
and economic potential. This is part of evaluating the economic potential of the REE
deposits. The quantification and improved understanding of inherent mineralogical
parameters in exploration, and metallurgy using automated and quantitative
mineralogy constitutes an integral part of the geometallurgical framework.
Combined +212um -212/+106um -106/+25um -25um
Non-Recoverable-Locked 0.1 0.3 0.1 0.1 0.0
Non Recoverable - Exposed 13.6 40.6 27.9 11.8 7.7
Mnz:Carb/Ox/Sil 22.1 43.9 32.4 26.1 13.8
Recoverable 21.8 14.1 31.6 24.5 17.0
Mnz:REM 1.9 0.2 1.5 2.6 1.6
Lib Monazite 11.6 0.3 4.1 14.9 12.7
Free Monazite 2.5 0.0 1.1 4.4 1.9
Pure Monazite 26.3 0.6 1.3 15.7 45.3
0
10
20
30
40
50
60
70
80
90
100
Ma
ss
(%
Mo
na
zit
e)
Geometallurgy of REE by automated mineralogy
8
Grammatikopoulos and de Souza April 2015
Figure 7. REE distribution
References
CORNELL, D.H. 1993. Rare earths from supernova to superconductor. Pure Applied Chemistry, 85, 2453-2464.
CHI, R & TIAN, J. 2009. Weathered Crust Elution- Deposited Rare Earth Ores’, Nova Science Pub Inc, 2009, 288 pp.
BAO, Z. & ZHAO, Z. 2008. Geochemistry of mineralization with exchangeable REY in the weathering crusts of granitic rocks in South China. Ore Geology Reviews, 33, 519-535.
GRAMMATIKOPOULOS, T., MERCER, W. & GUNNING, C. 2013. Mineralogical characterization using the QEMSCAN of the Nechalacho heavy rare earth metal deposit, Northwest Territories, Canada. Canadian Metallurgical Quarterly, 52, 265-277.
KYNICKY, J., SMITH, M. & XU, C. 2012. Diversity of Rare Earth Deposits: A Key Example of China. Elements, 8, 361-367.