80
BeFo Report 155 APPLICATION OF RELIABILITY-BASED DESIGN METHODS TO UNDERGROUND EXCAVATION IN ROCK Fredrik Johansson William Bjureland Johan Spross

BeFo Report 155
APPLICATION OF RELIABILITY-BASED DESIGN METHODS TO UNDERGROUND EXCAVATION IN ROCK
Fredrik JohanssonWilliam BjurelandJohan Spross

STIFTELSEN BERGTEKNISK FORSKNING ROCK ENGINEERING RESEARCH FOUNDATION
APPLICATION OF RELIABILITY-BASED DESIGN METHODS TO UNDERGROUND EXCAVATION IN ROCK
Sannolikhetsbaserade dimensioneringsmetoders tillämpbarhet vid undermarksbyggande i berg
Fredrik Johansson, KTH William Bjureland, KTH Johan Spross, KTH
BeFo Rapport 155 Stockholm 2016 ISSN 1104-1773 ISRN BEFO-R—155—SE


i
BeFo Report 155
PREFACE
The application of reliability-based methods for design of structures has been researched for several decades. Lately, the progress towards practical application of such methods has been strong, in particular for geotechnical structures in soil. One reason is likely that the Eurocodes allow reliability-based methods to verify limit states. As there currently is an ongoing discussion on whether the Eurocodes also should cover underground excavation in rock, there is now reason to study whether reliability-based methods are applicable also for structures in rock.
This research project has analysed for which types of design situations in underground excavation in rock that reliability-based design methods are suitable. The applicability of the semi-probabilistic method of partial factors was also studied. Based on the analysis, this report lists a number of research questions that need further attention before reliability-based methods can be applied fully to underground excavation in rock.
The research was carried out as a senior research project at the Division of Soil and Rock Mechanics at KTH Royal Institute of Technology. The research project is part of the Swedish research collaboration TRUST (www.trust-geoinfra.se). The project was funded by the Development Fund of the Swedish Construction Industry (SBUF), the Swedish Hydropower Centre (SVC), the Rock Engineering Research Foundation (BeFo), and the Swedish Nuclear Waste Management Co (SKB).
A group of experts has been involved in the project and provided valuable comments on our work: Håkan Stille, KTH; Mats Holmberg, Tunnel Engineering; Björn Stille, Sweco.
The support of our reference group is also grateful acknowledged. The reference group consisted of Per Tengborg, BeFo; Mats Holmberg, Tunnel Engineering; Robert Sturk, Skanska; Tommy Ellison, Besab; Jonny Sjöberg, Itasca/LTU; Håkan Stille, KTH; Stefan Larsson, KTH; Isabelle Olofsson, SKB; Lars Olof Dahlström, Chalmers/NCC; and Cristian Andersson, SVC.
Stockholm in September 2016
Per Tengborg

ii
BeFo Report 155
FÖRORD
Användningen av sannolikhetsbaserade metoder för dimensionering av konstruktioner har diskuterats inom forskarvärlden i flera decennier. På senare år har utvecklingen mot sådana metoder gått starkt framåt inom forskningen, särskilt avseende geotekniska konstruktioner i jord. Ett skäl till detta är sannolikt att Eurokoderna anger att sådana metoder får användas för att verifiera gränstillstånd. Eftersom det nu diskuteras om också byggande i berg ska omfattas av Eurokoderna finns därför skäl att studera hur användbara sannolikhetsbaserade dimensioneringsmetoder är för sådana konstruktioner.
I detta forskningsprojekt studerades vid vilka typer av dimensioneringsproblem vid undermarksbyggande i berg som sannolikhetsbaserade metoder är lämpliga att använda. Den semi-probabilistiska partialkoefficientmetodens användbarhet inom bergbyggande har också analyserats. Baserat på analysen ges förslag på frågeställningar som bör studeras vidare för att kunna implementera sannolikhetsbaserade metoder fullt ut inom undermarksbyggande i berg.
Forskningen har utförts som ett seniorforskarprojekt på KTH:s avdelning för jord- och bergmekanik och varit en del av forskningssamarbetet TRUST (www.trust-geoinfra.se). Projektet har finansierats av Svenska byggbranschens utvecklingsfond (SBUF), Svenskt vattenkraftcentrum (SVC), Stiftelsen bergteknisk forskning (BeFo) och Svensk kärnbränslehantering (SKB).
En expertgrupp har varit kopplad till projektet och kommit med värdefulla råd och synpunkter under arbetets gång. Gruppen har bestått av Håkan Stille, KTH; Mats Holmberg, Tunnel Engineering; Björn Stille, Sweco.
Ett särskilt tack riktas också till referensgruppen som bistått projektet: Per Tengborg, BeFo; Mats Holmberg, Tunnel Engineering; Robert Sturk, Skanska; Tommy Ellison, Besab; Jonny Sjöberg, Itasca/LTU; Håkan Stille, KTH; Stefan Larsson, KTH; Isabelle Olofsson, SKB; Lars Olof Dahlström, Chalmers/NCC; samt Cristian Andersson, SVC.
Stockholm i September 2016
Per Tengborg

iii
BeFo Report 155
SUMMARY
Following the introduction of the Eurocodes, design of underground structures in rock has starting to turn from deterministic procedures toward limit state design with partial coefficients. In Sweden, this can be exemplified with the new recommendations and guidelines for underground structures in rock issued by the Swedish Transport Administration (Lindfors et al. 2015). In addition to design with partial coefficients, the Eurocodes allow other design methods to verify limit states, e.g. reliability-based design and the observational method, which may be more suitable to underground excavation in rock, because of the significant uncertainties involved in such construction.
This report investigates the advantages and disadvantages of applying reliability-based design methods in underground excavation in rock. The objective is to identify the types of design problems that are suitable for reliability-based methods, and to identify subjects for future research regarding how to implement such methods fully.
The main chapter of the report analyzes the applicability of reliability-based design in some common design problems in Swedish underground projects. The analyzed cases are chosen from the Swedish Transport Administration’s new guidelines for design of underground structures, which allows direct comparison between their suggested method of partial coefficients and reliability-based design.
Analyzing the cases, it is found that for many rock mechanical problems, the affecting factors (e.g. geometry and uncertainties) may vary significantly from one place to another. Such conditions are not ideal when applying partial coefficients; instead, it is found that reliability-based methods, alone or in combination with the observational method, may be more favourable to achieve rational design from a structural safety perspective. The report shows how reliability-based methods have the ability to account for parameter uncertainties and model uncertainties in the design.
Further research is needed regarding, among other things, how to quantify model and parameter uncertainties, how to combine numerical analysis with reliability-based methods for complex design situations, how to achieve a consistent and acceptable level of safety for the finalised structure as well as during construction.
Keywords: rock engineering, reliability-based design, Eurocode 7, observational method
iv
BeFo Report 155
SAMMANFATTNING
I och med att Eurokoderna har börjat användas för dimensionering av byggnader och geotekniska konstruktioner har det diskuterats om byggande i berg också bör omfattas av Eurokoderna. Exempelvis har Trafikverkets nya projekteringshandbok för bergkonstruktioner (Lindfors et al. 2015) föreslagit att partialkoefficienter bör användas för att verifiera gränstillstånd. Eurokoderna tillåter dock även andra metoder för detta. Exempelvis sannolikhetsbaserad dimensionering och observationsmetoden kan vara lämpligare att använda inom bergbyggande, eftersom dessa metoder bättre tar hänsyn till osäkerheter i markförhållanden och beräkningsmodeller.
Denna rapport undersöker fördelar och nackdelar med sannolikhetsbaserad dimensionering när man bygger i berg. Rapporten syftar till att identifiera vilka bergmekaniska typproblem som är lämpliga att analysera med sannolikhetsbaserade metoder, samt identifiera vilka forskningsfrågor som behöver lösas innan sådana metoder kan implementeras fullt ut.
Huvudkapitlet i rapporten analyserar hur tillämpbara sannolikhetsbaserade metoder är för att analysera ett antal olika typproblem. Problemen är hämtade från Trafikverkets nya projekteringshandbok, vilket ger möjlighet till jämförelse med partialkoefficientmetoden.
Resultatet av analyserna visar att för många typproblem kan förhållandena kraftigt variera från plats till plats, exempelvis med avseende på geometrier och osäkerheter, vilket gör att partialkoefficientmetoden inte förmår ge konsekvent säkerhetsnivå för dessa fall. Sannolikhetsbaserade metoder, eventuellt i kombination med observationsmetoden, har dock förmågan att ta hänsyn till osäkerheter i parametrar och modeller, vilket ger jämnare säkerhetsnivåer hos de byggda konstruktionerna.
För att kunna implementera sannolikhetsbaserade metoder inom bergbyggande krävs fortsatt forskning av hur man kvantifierar osäkerheter i parametrar och modeller, hur man ska kombinera numeriska beräkningar med sannolikhetsbaserade metoder i komplexa designsituationer, samt hur man ska uppnå konsekventa och acceptabla säkerhetsnivåer både för den färdiga konstruktionen och under byggtiden.
Nyckelord: bergmekanik, sannolikhetsbaserad dimensionering, Eurokod 7, observations-metoden

v
BeFo Report 155
CONTENTS
1. INTRODUCTION .............................................................................................. 1
2. DESIGN OF STRUCTURES IN ROCK MASSES ............................................. 3
2.1 General principles ...................................................................................... 3
2.2 Limit states ................................................................................................. 4
2.3 Geotechnical Category ............................................................................... 5
3. RELIABILITY-BASED DESIGN – BASIC CONCEPTS ..................................... 7
3.1 Probabilistic and deterministic approaches to assess safety ...................... 7
3.2 What does a calculated probability of failure mean? .................................. 9
3.3 Accounting for human errors in probabilistic design ................................. 10
3.4 Sources of uncertainty .............................................................................. 10
3.5 Incorporating measurements in reliability analyses .................................. 11
3.6 Methods for computing the probability of failure ....................................... 12
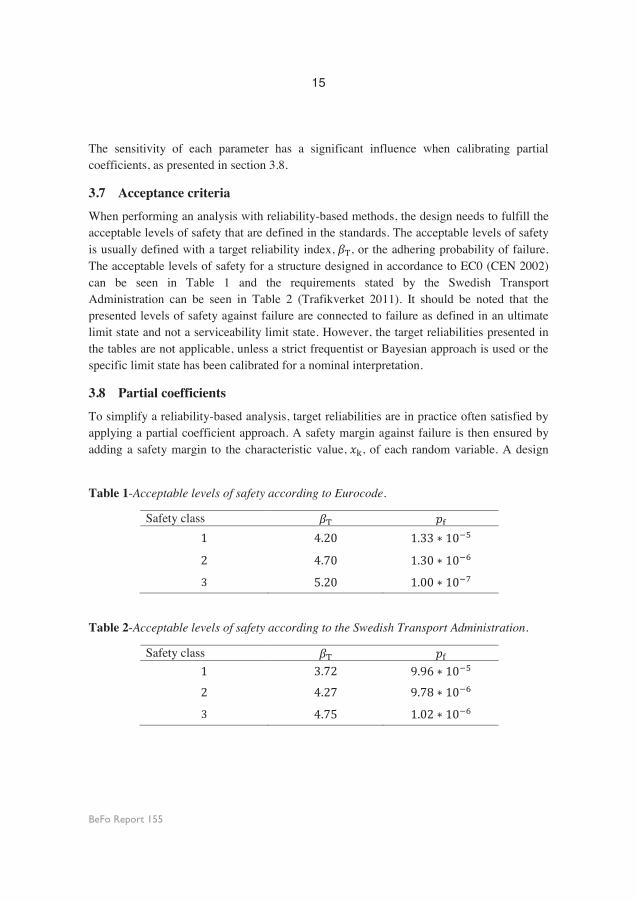
3.7 Acceptance criteria ................................................................................... 15
3.8 Partial coefficients .................................................................................... 15
3.9 Requirements for use of reliability-based methods .................................. 16
4. LITERATURE REVIEW: RELIABILITY-BASED DESIGN IN UNDERGROUND EXCAVATION IN ROCK ....................................................................................... 19
4.1 Introduction .............................................................................................. 19
4.2 Tunnel stability ......................................................................................... 19
4.3 Block stability ........................................................................................... 21
4.4 Face Stability ............................................................................................ 22
4.5 Reliability-based methods and the observational method in combination 22
4.6 Risk management, structural safety, and decision making ....................... 23
4.7 Summary of literature review .................................................................... 24
5. APPLICABILITY OF RELIABILITY-BASED DESIGN IN UNDERGROUND EXCAVATION ....................................................................................................... 25

vi
BeFo Report 155
5.1 General methodology ............................................................................... 25
5.2 Limit states with separable load and resistance ....................................... 25
5.3. Limit states with interaction between load and resistance ........................ 39
6. DISCUSSION ................................................................................................. 51
6.1 General .................................................................................................... 51
6.2 Limit states with separable load and resistance ....................................... 51
6.3 The partial factor approach ...................................................................... 52
6.4 Limit states with interaction between load and resistance ........................ 53
6.5 Definition of failure.................................................................................... 54
6.6 Acceptable Safety .................................................................................... 54
7. CONCLUSIONS ............................................................................................. 57
8. REFERENCES ............................................................................................... 59
APPENDIX A – REGRESSION ANALYSIS........................................................... 65
1
BeFo Report 155
1. INTRODUCTION
Design of rock support for tunnels and other underground facilities in rock is performed under significant uncertainties, as the properties and the behaviour of the rock mass are to some extent unknown. This means that decisions during this process have to take these uncertainties into consideration. It is therefore important that the design tools that we use to design the rock support can consider them; the results should be a uniform level of safety in compliance with the acceptance requirements that we have on our structures.
In Sweden, the safety of rock tunnels and other underground facilities in rock is not regulated in the Eurocodes, but in the 3rd chapter of Plan- och byggförordningen (the Swedish Regulation for planning and building). This regulation, however, consists of very general requirements, for example that a structure must be built such that it does not “completely or partly collapses”. More specified recommendations and guidelines are provided by for example the Swedish Transport Administration (Lindfors et al. 2015). These are often used in practice, in particular in infrastructure projects.
However, work is in progress to include design of rock tunnels and other underground facilities in rock in the Eurocode standardisation. This would imply that underground facilities in rock should be designed in accordance to the same code as structures in soil: the Eurocode EN-1997 (CEN 2004) in combination with Eurocode EN-1990 (CEN 2002). The content of this report satisfies the requirements of the Eurocode. In the following, Eurocode EN-1997 and Eurocode EN-1990 are abbreviated EC7 and EC0.
The main criterion in design according to the Eurocode is that for each design situation, it should be verified that no limit state is violated. According to EC7, the limit states should be verified with one, or a combination of, any of the following methods:
use of calculations,
adoption of prescriptive measures,
experimental models and load tests, or
an observational method.
For tunnels in rock, all of these methods except experimental models and load tests are applicable. Design with calculations can be performed with semi-empirical methods,

2
BeFo Report 155
numerical calculations, partial coefficients or reliability-based calculations, according to EC0. Because of the large uncertainties associated with design in geotechnical engineering (Christian 2004), and the complex limit states, which often include interaction between support and rock mass (Stille et al. 2005), design with reliability-based methods may be preferable. The reason is that such methods may consider the uncertainties stringently, and thus improve the possibility for an optimal design with respect to them. However, the reliability-based design (RBD) methods may be difficult to apply in design of rock support because the available codes and guidelines do not give any advices on how to apply these methods in practical design situations (IEG 2010a, b).
The objective of this report is to investigate for which design problems in underground excavation in rock that reliability-based methods are suitable, and to identify subjects for future research on how to implement these methods. This is investigated by analysis of examples showing the methods’ advantages and disadvantages. In this report, a brief review of the design process in underground excavation is first given. This is followed by the basic principles of RBD methods and a literature review of the research related to the use of RBD methods in design of underground excavations. Thereafter, the applicability of RBD methods for some types of underground excavation problems are analysed based on calculation examples and the results are discussed. Finally, conclusions on the applicability of RBD methods in underground excavation in rock are presented and identified future areas of research on how to implement these methods are presented.
3
BeFo Report 155
2. DESIGN OF STRUCTURES IN ROCK MASSES
2.1 General principles
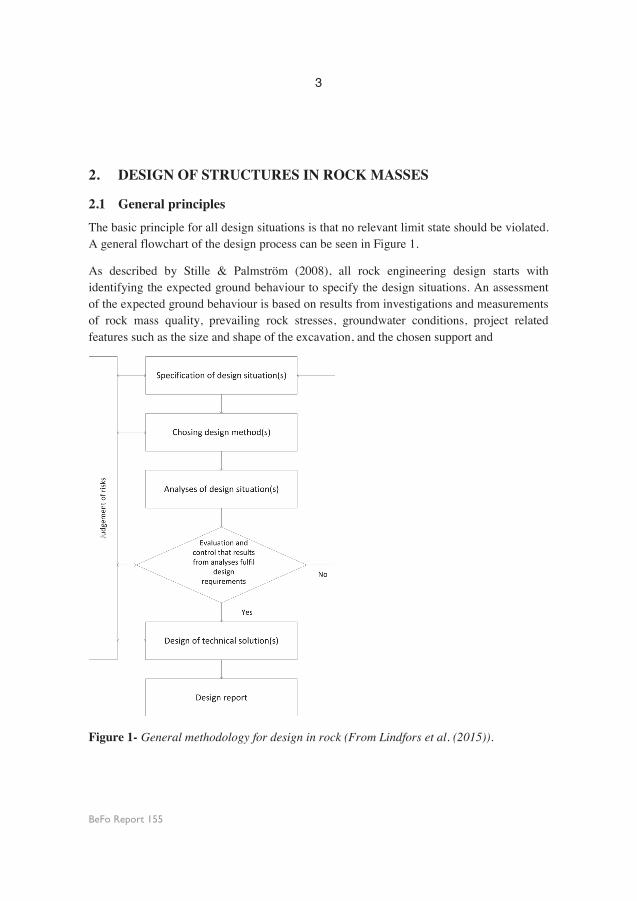
The basic principle for all design situations is that no relevant limit state should be violated. A general flowchart of the design process can be seen in Figure 1.
As described by Stille & Palmström (2008), all rock engineering design starts with identifying the expected ground behaviour to specify the design situations. An assessment of the expected ground behaviour is based on results from investigations and measurements of rock mass quality, prevailing rock stresses, groundwater conditions, project related features such as the size and shape of the excavation, and the chosen support and
Figure 1- General methodology for design in rock (From Lindfors et al. (2015)).
4
BeFo Report 155
excavation method. Descriptions of common ground behaviour are found in e.g. Hoek et al. (2000), Palmström & Stille (2007), and Martin et al. (1999). Examples of ground behaviour in hard crystalline rock, which is the prevailing condition in Sweden, are gravity-driven block falls, cave-ins due to unravelling along discontinuities, brittle failure of intact rock, and plastic behaviour due to overstressing of the rock mass strength.
In rock engineering, design is generally made in accordance to the approach known as the observational method (Peck 1969). This implies that the conditions known and assumed at an early stage are the basis for a preliminary design. Once the preliminary design situations has been specified, i.e. limit states have been identified, loads and rock mass parameters estimated and project requirements determined, a method to verify the limit states by observation is chosen. The observational method requires that if predefined limits of acceptable behaviour are exceeded, the preliminary design must be adjusted by putting prepared contingency actions into operation. Thereby, the final design of the structure is not known until the construction work has finished. According to the principles of the observational method, the limits of acceptable behaviour and the contingency actions must be designed before construction is started, which implies that a design-as-you-go approach is by no means acceptable.
A similar methodology is in Sweden known as active design, which involves three components: prediction, observation and countermeasures (Stille 1986). While the final design is being implemented, control parameters previously identified in the preliminary design are measured to verify the validity of the design.
In addition, other types of methods that can be used, by themselves or in combination with the observational method, are e.g. analytical or numerical calculation or semi-empirical methods. The choice of methods depends mainly on to what extent it reduces uncertainties associated with the load-carrying system (IEG 2010a).
2.2 Limit states
2.2.1 Separable load and resistance
In structural design in general, it is usually assumed that the load, S, and the resistance, R, are constant and independent of each other when different limit states are analysed. Thus, the limit state may be written as
(1)

5
BeFo Report 155
However, in rock engineering design, S and R often depend on the deformation and are therefore not separable in this way, although in some cases it is commonly assumed that R and S are constant and separable. In the Swedish Transport Administration’s design guidelines (Lindfors et al. 2015), some typical rock mechanical problems are presented where this has been assumed. The examples include block analyses, suspension of a core of loose rock, suspension of loose laminated rock in a solid rock mass, design of shotcrete between bolts with and without adhesion between rock and shotcrete, punching of a rock block through shotcrete between bolts, and design of shotcrete for gravity-loaded arches. The applicability of reliability-based methods for some of these limit states are further analysed in chapter 5.2.
2.2.2 Interaction between load and resistance
The radial internal pressure, pi, on the boundary of a tunnel or a cavern reduces with increased radial deformation, ui. This behaviour may be visualised in a ground reaction curve (GRC). A similar curve may be produced for the support as a support reaction curve (SRC). The point of equilibrium between the SRC and the GRC determines the final ui in the rock mass and the final pi acting on the support. The GRC concept is a useful tool in the work of finding suitable rock support under different rock mass conditions. Analytical solutions for the GRC concept with support by anchored bolts, shotcrete and steel sets was presented by e.g. Hoek & Brown (1980). Stille et al. (1989) developed an analytical solution for the GRC for weak rock with grouted bolts and Chang & Stille (1993) presented an analytical solution that considers the influence of the mechanical properties for early age shotcrete on the tunnel construction sequences. A summary of different analytical solutions for the GRC was presented by Brown et al. (1983).
In addition to the design of tunnel lining, other examples of limit states or design situations with dependence between R and S include e.g. squeezing and pillar stability. The applicability of reliability-based methods on limit states with interaction between rock and support is further discussed in chapter 5.3.
2.3 Geotechnical Category
According to EC7, the complexity of the geotechnical conditions should be expressed with Geotechnical Category (GC) 1-3, where GC-1 corresponds to easy conditions and low risk level and GC-3 to difficult and complex conditions and high risk level.

6
BeFo Report 155
The choice of design method among those suggested by EC7 is related to the design method’s ability to reduce uncertainties in the specific design situation (IEG 2010a). This implies that the choice is directly related to the Geotechnical category. Both Hoek (1999) and Palmström & Stille (2007) give suggestions on how to choose a design method based on ground conditions and ground behaviour. Olsson & Palmström (2014) suggest that prescriptive methods, calculations, or calculations combined with the observational method could be used related to the Q-classification system. They also discuss how to relate them to GC. They suggest that prescriptive methods could only be used when Q > 1; for a case when 0.1 < Q < 1, a combination of prescriptive methods and calculation may be suitable, and when Q < 0.1, a combination of calculations and the observational method may be suitable.
According to EC7, GC-3 should include tunnels in fractured rock with requirements of water–tightness or other special demands. However, this formulation would imply that all tunnels in Sweden would be in GC-3, which is not appropriate. In the Swedish application document for tunnels and caverns, it has instead been recommended that GC-2 may be applied when common practical design experience exists from similar structures and that only tunnel and caverns that fall outside this definition should be performed in GC-3 (IEG 2010a). Some examples of GC-2 conditions are when the rock cover is more than half of the width of the tunnel, when non-critical deformation and stability conditions are believed to occur for the specific tunnel width, and when the distance to existing tunnels is more than half of the width of the tunnel (IEG 2010a).
Other limitations with the formulation in EC7 with respect to GC were discussed by Harrison et al. (2014). Among other things, they infer that the requirement in EC7 that GC-2 design “should normally include quantitative geotechnical data and analysis” is difficult to fulfil, because it is generally unfeasible to obtain quantitative data for the properties of the rock mass at the scale of interest. In principle, this statement excludes the application of empiricism in the form of rock mass classification schemes. Harrison et al. (2014) conclude that “clearly, clarification of this issue is required in EC7”. Another limitation with the formulation in EC7 regarding how to choose GC was discussed by Olsson & Palmström (2014). They infer that EC7 does not consider that the ground conditions along the tunnel cannot be completely determined before excavation, which implies that the geological uncertainties at this stage are larger (and so are the excavation risks) than after excavation. Consequently, they argue that it may be possible to use GC-3 during planning of a tunnel or cavern and use GC-2 for the design of the permanent rock support.

7
BeFo Report 155
3. RELIABILITY-BASED DESIGN – BASIC CONCEPTS
3.1 Probabilistic and deterministic approaches to assess safety
The traditional approach in engineering to ensure structural safety is to apply a deterministic safety factor F, i.e. a required ratio between the average resistance R and the average load S:
(2)
The required F for any structure or structural component is often based on a combination of expert judgement and long-time experience from previous failures of similar structures. This has led to a system, where the required safety factors in guidelines and design codes rarely are calibrated to each other, implying that equal safety factors is not the same as equal safety. In addition, safety factors are not able to capture the uncertainty related to the loads and resistance in the individual case.
To overcome these discrepancies, methods of probabilistic design have been developed. Such methods aim directly at assessing the probability of structural failure, which the society ultimately strive to minimise – at a reasonable cost. Seeing the load and resistance as random variables, the probability of structural failure is defined as the probability of having a load exceeding the resistance:
(3)
where is known as the limit state function, defining the limit between safe and unsafe behaviour.
The requirement for a design to be considered safe is obviously that is larger than . Figure 2 shows an example of normally distributed and with mean values, , of both and marked with a thick line. As can be seen in the figure, the average load is substantially lower than the average resistance, suggesting that the design is safe if only average values would be considered.
However, only considering mean values may not give the designer enough information about how safe the design is and, more importantly, whether the design is safe enough. These issues depend not only on the mean values, but also on the variability of the

8
BeFo Report 155
Figure 2-Example of normally distributed load and resistance.
parameters. In Figure 3, both and are presented with two normal distributions each. The standard deviation, , is given by the variability of the parameter and is therefore independent of the distribution type. From Figure 3 it is clear that the variability of the
Figure 3-Load and resistance distributions using different standard deviations. Less uncertainty (smaller standard deviation) implies reduced probability of failure.
Pro
babi
lity
dens
ity
S R
Pro
babi
lity
dens
ity
S-small std R-small std S-large std R-large std

9
BeFo Report 155
random parameters has a significant effect on the pf, which is indicated by the overlapping area of the load and resistance distributions.
3.2 What does a calculated probability of failure mean?
A problem with probabilistic design is the inherent meaning of the calculated probability of failure. Here, the word “failure” is often misleading, as it is not necessarily implying the violent collapse that inadvertently may come to mind. Instead, the term should rather be interpreted as a failure to satisfy some predefined criteria. Mašín (2015) overcame this problem by using the term probability of unsatisfactory performance instead of probability of failure. However, in this report, we have chosen to use the traditional term probability of failure for this concept.
The interpretation of a calculated probability of failure also depends on which statistical school that the calculation is based on. In this regard, there are three possible interpretations: frequentistic, nominal, or Bayesian (Vrouwenvelder 2002).
The frequentistic interpretation implies that the probability of failure is interpreted as the expected failure frequency in the long run among a set of similar structures. However, the frequentistic interpretation is generally ruled out for structural design, as it would require a stationary world with many identical structures and access to large amounts of statistical data or theoretical evidence.
The nominal interpretation is often used in practice. It acknowledges that a probabilistic design analysis at least partially is based on common ideas and empirical experience (and not the statistical or theoretical evidence of the frequentist interpretation). The nominal interpretation is necessary when not accounting for all known uncertainties; hence, the calculated probability of failure has no connection to the true reliability of the structure. However, using a nominal probability of failure may still provide more consistent design results than traditional deterministic approaches, if it considers the more significant uncertainties. Not accounting for all uncertainties requires that the design procedure is thoroughly described and calibrated in a design code to avoid arbitrariness in the design.
The Bayesian interpretation is wider than the frequentist, as it allows both objective data and subjective beliefs to be incorporated in the analysis. Consequently, the calculated probability of failure is interpreted as a degree of belief about the occurrence of the failure. In comparison to the nominal interpretation, the Bayesian interpretation requires that all variables are described as accurate as possible, given all available knowledge – not only

10
BeFo Report 155
objectively acquired data, but also subjective expert judgement. With a Bayesian interpretation, the safety assessments will for a large number of structures only reflect the inherent, true, probability of failure on the average, assuming unbiased estimations of the variables. Still, Vrouwenvelder (2002) and Baecher & Christian (2003) argue that the Bayesian interpretation is the most useful. Notably, a nominal interpretation can be based on Bayesian thoughts. For example, subjectively assessed parameters can be allowable in a nominal design code, if the procedure for how to assess the parameter is defined.
As will be evident to the reader in the following chapters, the nominal interpretation is necessary for the limit states that are discussed in this report, because of their significant simplifications.
3.3 Accounting for human errors in probabilistic design
As human errors cause a majority of recorded structural failures (Melchers 1999), they must be accounted for in the structural design. However, the understanding of the nature of human errors is limited and mostly qualitative. This implies that non-nominal interpretations of structural reliability are difficult to make in practice, as human errors normally cannot be accounted for in structural reliability analyses. Doorn & Hansson (2011) compared the use of deterministic safety factors and probabilistic methods in structural design. One argument for using safety factors instead of probabilistic methods is that the latter tends to neglect events that cannot easily be described by probabilities, for example human errors and unknown failure mechanisms. In applying a probabilistic method, human errors must be accounted for in other ways; for example, by considering them in the probabilistic code calibration. In practice, the risk for human errors are reduced by internal and external reviews of the design, quality control of the construction work, and structural risk management throughout the whole construction project, see SGF (2014) and Spross et al. (2015a) for Swedish examples. A shorter English version of the latter is presented in Spross et al. (2015b).
3.4 Sources of uncertainty
A significant part of the design work in rock engineering is related to the assessment of the relevant parameters, such as loads, material properties, and geometry. Rock mass investigations play an important role in this work, but they are inevitably impaired by uncertainties, which will affect the design decisions. Assessing the uncertainties, and possibly reducing them, is an important aspect of the design work, in particular when probabilistic methods are used.

11
BeFo Report 155
In general, the uncertainties in the design of rock structures have different sources. Baecher & Christian (2003) categorise them as characterisation uncertainty, model uncertainty, and parameter uncertainty. Characterisation uncertainty is related to how the site investigations are interpreted and depends on for example measurement errors and how representative the data samples are. Model uncertainty is related to how well the applied model is able to describe the reality. Parameter uncertainty is related to the error introduced when the property of interest has to be estimated from test data or by transformation with empirical factors. To assess the total uncertainty of a geotechnical parameter, Müller et al. (2014) proposed a similar division expressed in coefficients of variation ( ):
(4)
where is related to the spatial (inherent) variability of the property, is related
to the random measurement error, is related to the determination of the mean value
of the property, and is related to any bias in the transformation of the measured property to the property of interest. Practical evaluation of the terms in Eq. (4) is exemplified in e.g. Müller et al. (2015) and Krounis et al. (2016), along with resulting uncertainty reduction that may be achieved with Bayesian updating procedures; the reader is referred to these references for a more comprehensive discussion of Eq. (4).
3.5 Incorporating measurements in reliability analyses
Measuring and monitoring are commonly performed in rock engineering projects, either as a part of the pre-investigation or to check the structural behaviour during construction. Incorporating the measurement results stringently into the structural reliability analysis may provide valuable information about the structural safety. The techniques and procedures used to draw conclusions about the real world from measurement data are commonly referred to as statistical inference. Some examples are estimation of probabilistic distribution type and its statistical moments, and regression and correlation analyses.
The Bayesian interpretation has the advantage that it allows the combination of both subjective knowledge, such as expert judgement, and objectively achieved data from observations. This statistical application is of particular interest for the design method known as the observational method, as it allows measurements carried out during construction to update the assumptions made in the preliminary design. Some examples related to rock engineering are Holmberg and Stille (2009), Zetterlund et al. (2011), and Spross et al. (2014).
12
BeFo Report 155
3.6 Methods for computing the probability of failure
3.6.1 The general case
For the general case, the random variables representing loads and resistances may be collected in a vector . The limit state function in Eq. (3) is then denoted
. In the evaluation of the probability of failure, we achieve the multidimensional integral over the unsafe region defined by (Melchers 1999)
(5)
where is the joint probability density function for all random variables. This integral is for most cases impossible to solve analytically; the very simple example below is one of few exceptions. Therefore, a number of approximate methods have been developed to cope also with more complex cases that include dependent or non-normal variables and non-linear limit state functions. These methods may be categorised based on their complexity (Melchers 1999):
Level I methods account for uncertainty by adding safety margins to each individual parameter. Example: partial coefficient methods.
Level II methods model uncertainty with mean value, standard deviation, and correlation coefficients of the random parameters, but assume normal distributions. Example: simplified reliability index.
Level III methods model uncertainty with the joint distribution function of all random parameters. Examples: Monte Carlo simulation and the first-order reliability method (FORM).
Level IV methods add the consequences of failure into the analysis, thereby providing a tool for e.g. cost–benefit analyses.
Another method not mentioned above, that can be used together with numerical calculations, is the point estimate method. The method gives an approximate estimation of the pf. With this method, a problem with n random variables results in 2n evaluations. Since the numbers of random variables in rock engineering usually are quite limited, the required number of evaluations is kept within an acceptable level by using this method.

13
BeFo Report 155
For a thorough presentation of the available calculation methods mentioned above, the reader is referred to textbooks on structural reliability analysis: Melchers (1999), Nikolaidis et al. (2005), Ditlevsen & Madsen (2007), and Ang & Tang (2007). In this report, two common methods, Monte Carlo simulation and FORM, are briefly presented.
3.6.2 A simplified calculation example
To illustrate the calculation procedure, an analytic solution with two independent normally distributed random variables in a linear limit state function (e.g. Eq. (3)) is presented in the following. To evaluate the in Eq. (8), the first and second moments of the limit state function are calculated:
(6)
(7)
The is then given by
(8)
where is the standard normal distribution function, which is tabulated in most textbooks on statistics. For convenience, the is often expressed as the reliability index, , as shown in Eq. (8).
3.6.3 Monte Carlo Simulation
In applying Monte Carlo simulation to evaluate Eq. (9), samples from the random variables, , are repeatedly drawn and checked for failure in the limit state function .
Counting the number of failures for a large number of repetitions gives an estimation of the failure probability. The accuracy of the estimation depends on how unlikely failure is. For very small probabilities of failure, the number of repetitions, N, must be very large. The error in the simulation is given by (Ang & Tang 2007)
(9)
where is the mean probability of failure. If N has to be very large and, in particular, if
the parameters are complexly correlated, more refined simulation methods may be required

14
BeFo Report 155
to reduce the computation time. However, with the increasing speed of modern computers, this is less often required.
3.6.4 First-order reliability method
The first-order reliability method (FORM) belongs to the same family of approximate methods that are used to evaluate the integral in Eq. (5) as the method used in the simplified example above. Such methods are commonly known as first-order second-moment methods, because they linearize the limit state function and use the first two moments (i.e. the mean and standard deviation) of the distributions in the evaluation. FORM is a development from this basic concept. Hasofer & Lind (1974) created an invariant format to calculate reliability by transforming all variables and the limit state function into standard normal space. This implied that the calculated reliability became independent of the algebraic formulation of the limit state function. Further improvement was made when non-normal distributions and correlated parameters could be transformed into corresponding independent normal distributions (Hohenbichler & Rackwitz 1981).
The principle of FORM is as follows: after transformation of all random variables and limit state function into standard normal space, the limit state function is linearised into a hyperplane. Then, the shortest distance between the origin and the hyperplane is defined as the . Finding the may consequently be seen as solving the minimisation problem
(10)
Where is the linearised limit state function transformed into standard normal space U, is a vector containing the transformed random variables, n is the number of dimensions of U, and are coordinates on the limit state hyperplane. The point on the hyperplane that is closest to the origin, and thereby satisfies Eq. (10), is often known as the “design point”, *.
A useful feature of FORM is the generation of the sensitivity factors (α-values). These factors indicate how sensitive is to changes in the respective variables at the design point, given that the variables are uncorrelated. This is shown by the equation
(11)
15
BeFo Report 155
The sensitivity of each parameter has a significant influence when calibrating partial coefficients, as presented in section 3.8.
3.7 Acceptance criteria
When performing an analysis with reliability-based methods, the design needs to fulfill the acceptable levels of safety that are defined in the standards. The acceptable levels of safety is usually defined with a target reliability index, , or the adhering probability of failure. The acceptable levels of safety for a structure designed in accordance to EC0 (CEN 2002) can be seen in Table 1 and the requirements stated by the Swedish Transport Administration can be seen in Table 2 (Trafikverket 2011). It should be noted that the presented levels of safety against failure are connected to failure as defined in an ultimate limit state and not a serviceability limit state. However, the target reliabilities presented in the tables are not applicable, unless a strict frequentist or Bayesian approach is used or the specific limit state has been calibrated for a nominal interpretation.
3.8 Partial coefficients
To simplify a reliability-based analysis, target reliabilities are in practice often satisfied by applying a partial coefficient approach. A safety margin against failure is then ensured by adding a safety margin to the characteristic value, , of each random variable. A design
Table 1-Acceptable levels of safety according to Eurocode.
Safety class
Table 2-Acceptable levels of safety according to the Swedish Transport Administration.
Safety class

16
BeFo Report 155
value, , to be used in the design is then achieved. Defining partial coefficients , the following inequality between functions of loads, S( ), and resistances, R( ), must be satisfied:
(12)
for which the design values for the respective loads and resistances are given by
(13)
(14)
The magnitudes of these parameter-specific partial coefficients depend mainly on three aspects: the sensitivity of the parameter on the limit state, αi, the required target reliability, βT, and the variability of the parameter, COVi. For example, assuming normally distributed parameters, the partial coefficients can be calibrated using (Melchers 1999)
(15)
(16)
where are mean values, and are coefficients of variation. Note that inherently is negative for loads.
3.9 Requirements for use of reliability-based methods
The above review of reliability-based methods shows that their application implies requirements on the design problem. These requirements are discussed in the following.
A limit state function must be definable for the unsafe behaviour. Thus, reliability-based methods may not be suitable for very complex ground behaviour that we know little about.
Uncertain parameters must be possible to describe with probability distributions (or at least estimate with first and second moments). An important aspect is how to describe the inherent, spatial variability in the rock mass material in probabilistic terms.

17
BeFo Report 155
Observational data must be precise in order to significantly improve the preliminary design assumptions in updating procedures.
Failure acceptance requirements must reflect the society’s acceptance of structural failure of that particular kind of structure, not including the probability of failure caused by human errors.


19
BeFo Report 155
4. LITERATURE REVIEW: RELIABILITY-BASED DESIGN IN UNDERGROUND EXCAVATION IN ROCK
4.1 Introduction
The design situations for tunnels and underground facilities can generally be divided into different types of problems. In this chapter, a review of previous research on such common design situations is presented. We have divided the design situations into three main types of problems: global tunnel stability, block stability, and face stability. In addition, two more topics, risk management and the observational method, have been included in the review, because both concepts frequently are used in combination with reliability analyses. It should be noted that some of the work presented here concern other geological conditions than what is common in Sweden. Some design situations may therefore seem out of scope to a Swedish reader, but they are included to enable comparison to other design situations that are more relevant for Swedish conditions.
An early and extensive contribution was made by Kohno (1989), who discussed reliability-based design of tunnel support systems, covering topics such as reliability of tunnel support in soft rock, reliability of tunnel linings in jointed hard rock, probabilistic evaluation of tunnel lining deformation through observation, and reliability of tunnel systems. Kohno et al. (1992) studied the failure of a tunnel using the reliability of a given section and a system approach to calculate the reliability over an entire region. Even though Kohno (1989) covered a wide range of probabilistic methods and design situations, the approach used by most other researchers is to cover a specific reliability-based method and a specific design situation. The following sections 4.2–4.6 therefore cover one design situation each. In section 4.7, a brief summary is given.
4.2 Tunnel stability
For stress-induced failure of tunnels, Laso et al. (1995) studied the probability of failure for tunnel support using the concept of ground reaction behavior combined with four definitions of failure, based on excessive pressure on the support lining, soil displacement, lining displacement, and lining strain.
For the design of shotcrete support, Celestino et al. (2006) used the concept of load and resistance factor design considering two failure modes: bearing capacity of support footing

20
BeFo Report 155
for the shotcrete arch, and shotcrete failure. A case study was performed for a tunnel in Brazil with a railway crossing approximately 8 m above the tunnel.
Nomikos and Sofianos (2010) developed an approach to use the factor of safety in a probabilistic manner and applied the developed method on two design situations: stability of rock pillars and stability of underground roofs in a layered rock mass.
Li and Low (2010) used FORM combined with two failure criteria: one for the rock mass and one for the supporting shotcrete. They performed a reliability analysis of a circular tunnel under hydrostatic stress field. Lü and Low (2011) executed the same type of calculation with the same failure criteria but used second-order reliability method (SORM) and response surface method instead of FORM. The results were compared with results from Monte Carlo simulations. Similarly, Lü et al. (2011) used the response surface method to study the same failure criteria as in the previous studies, but extended the analysis with a third criterion: a requirement that the length of the rock bolt must exceed the radius of the plastic zone minus the radius of the tunnel with at least 1.5 m.
Zhang and Goh (2012) used empirical relationships based on RMR ratings to estimate parameters for a FLAC3D analysis for the design of a rock cavern. Using a 2k-factorial design approach (k being the number of variable parameters) for the numerical analysis, distributions for the factor of safety and the strain were obtained. The results were used to develop a regression model that could be used to calculate the probability of failure of a tunnel, both for ultimate and serviceability limit states. Goh and Zhang (2012) used artificial neural networks (ANN) combined with FLAC3D to study the factor of safety for a tunnel.
Langford and Diederichs (2013) discussed a shotcrete support design using a modified point estimate method in combination with a finite element analysis. The proposed modified point estimate was used in a case study of the Yacambú–Quibor tunnel.
Zhao et al. (2014) used an ANN-based response surface to approximate the limit state function for a tunnel and subsequently calculate the probability of failure through FORM. The ANN-based response surface implied an iterative calculation procedure to estimate the reliability index.
As can be seen from the studied papers, a number of authors have worked on this subject. However, most of the work concerns the final design and the final support. No work is done on the preliminary or temporary support, or on the behaviour of the final support during the

21
BeFo Report 155
construction phase, which in many cases might be governing, e.g. during the curing phase of concrete support, before it reaches its maximum capacity.
4.3 Block stability
For rock wedges, various analyses have been made both for rock wedges in slopes and rock wedges in tunnels. Quek and Leung (1995) analysed a rock slope using both the first-order second-moment approach and Monte Carlo simulations.
Low (1997) studied the stability against sliding of a rock wedge in a rock slope. An excel spreadsheet was used to calculate the probability of sliding failure of the wedge using second-moment reliability indexes with both single and multiple failure modes.
Jimenez-Rodriguez and Sitar (2007) analysed the stability of a rock wedge using system reliability methods. A number of failure modes were considered using both FORM and Monte Carlo simulations. FORM was shown to give a good approximation of the results from Monte Carlo simulations.
Bagheri (2011) analysed block stability using both deterministic and reliability-based methods. The analysis studied how clamping forces, the half-apical angle and other parameters affected the results of a stability analysis and the partial factors involved in design. The results show that partial factors needed for a safe design are very sensitive to the half-apical angle.
Park et al. (2012) studied the probability of rock wedge failure using the point estimate method. An equation for the safety factor, based on the maximum likelihood estimation, was derived and combined with the point estimate method to calculate the probability of failure for a rock wedge in a slope. The developed method was used in a case study in Korea.
Low and Einstein (2013) performed a reliability analysis of tunnel roof wedges and forces in rock bolts using mainly FORM and SORM. The results were compared against deterministic calculations and Monte Carlo simulations.
Even though the subject of reliability-based block stability has been studied by a number of authors, we found no work on the design of shotcrete or lining reinforcement for a tunnel with respect to rock wedges in the roof and walls.

22
BeFo Report 155
4.4 Face Stability
To study the stability of the tunnel face during construction, Mollon et al. (2009a) analysed the face stability for active and passive pressure failure induced by the face pressure of the tunnel boring machine with the spreadsheet presented by Low and Tang (1997, 2004). A comparison was made to results from three-dimensional numerical simulations. Continuing this work, Mollon et al. (2009b) used the response surface method compared with extensive numerical simulations to study face stability for both ultimate limit state and serviceability limit state.
Zeng et al. (2014) studied face stability for a circular tunnel considering different distribution types and correlation structures. Three reliability-based calculation procedures were used with different distribution types and correlation structures. The influence of the different types and structures were studied and discussed.
4.5 Reliability-based methods and the observational method in combination
Probabilistic methods in combination with the observational method within rock engineering have been used and presented for various rock engineering applications. Stille et al. (2003) studied the design process of underground structures in rock. They discussed how uncertainties of the different stages of the design and construction process can be managed and how information from measurements can be incorporated into the safety assessment of the structure. To further develop this analysis and to present a foundation for future work, the design situations characterized by rock–structure interaction was studied in Stille et al. (2005). They discussed how the observational method of EC7 and probabilistic methods can be applied in the design of such interaction defined problems.
Continuing on the same topic, Holmberg and Stille (2007, 2009) provided statistical tools to reduce the uncertainty of a design and practical tools for the use of the observational method in the design of tunnels. Calculation examples were presented to illustrate the applicability of the suggested approaches established to reduce uncertainties. The work was further developed by Bjureland et al. (2015), who suggested an approach to fulfil the requirements of the observational method in the design of a tunnel.
Spross et al. (2014) studied how uncertainties may be managed within the framework of the observational method. A calculation example was presented of how prior knowledge and updating through Bayesian statistics could be used for the design of pillar stability in an

23
BeFo Report 155
underground structure. How the reliability-based methods and the observational method may be combined is further discussed in section 5.3.4.
4.6 Risk management, structural safety, and decision making
On a more general topic, not limited to the design of specific tunnel or rock engineering problems, Sturk et al. (1996) studied risk and decision analysis for large underground projects. They described the decision-making process from a risk-informed point of view. Specific cases from the Stockholm Ring Road tunnels were used to exemplify how the proposed procedures can be used in a tunnel project.
Similarly, Einstein (1996) discussed risk analysis and the decision-making procedure for large engineering projects. Statistical distributions for governing parameters were used in an effort to quantify risk in three typical rock engineering problems: slope design, flow through fractured media and tunnelling.
You et al. (2005) presented an approach for optimization of tunnel support pattern and advance rate based on risk. Using three support patterns and advance rates, Monte Carlo simulations were used to estimate the risk of the different support patterns.
Karam et al. (2007) discussed how statistics can be used for decision making in tunnel exploration. The cost of exploration was compared against the “Expected value of sample information (EVSI)”.
Cauvin et al. (2009) discussed risks from old underground mines and the stability of left-behind pillars. They used two different approaches to calculate the probability of failure of the old mines.
The applicability of partial coefficient in rock engineering has not been widely discussed. The topic has however gained some interest in the latest ISRM symposia of EUROCK, at which workshops were held on the applicability of EC 7 in rock engineering (in Vigo, Spain, 2014) and on modern rock design methods (in Salzburg, Austria, 2015). Bedi & Orr (2014) provided a theoretical discussion on how the nature of the uncertainties in rock engineering affects the applicability of partial coefficients within this field, and Estaire & Olivenza (2014) proposed a methodology for design of spread foundations on rock which comply with limit state design with partial factors in EC-7. Gambino & Harrison (2015) discussed the challenging task of defining limit states for progressive rock slope failure. El Matarawi & Harrison (2015) suggested how limit states may be defined when applying the convergence–confinement method.

24
BeFo Report 155
4.7 Summary of literature review
As can be seen from the reviewed papers, reports and theses, probabilistic methods have been used in a wide variety of applications for the design of structures in rock and for the assessment of risk involved in underground projects. Various types of problems can be solved using both simpler and full probabilistic calculations, depending on the nature of the problem. However, there are some general conclusions that can be drawn from the studied work.
The first, and maybe most noteworthy, is that there is very little work done on partial coefficients and its application to rock mechanics. Bedi & Orr (2014) and Estaire & Olivenza (2014) seem to be the only exceptions. Secondly, there is very little work on reliability-based design in combination with the observational method. This is true even though that the observational method often is said to have a central role in rock engineering. Third, little work is also done in the field of numerical calculations in combination with reliability-based design, though Andersson (2010) performed a specific review on this subject. Lastly, no work using reliability-based design was found on the temporary support, on shotcrete or on the behaviour of the support during the curing of the concrete.

25
BeFo Report 155
5. APPLICABILITY OF RELIABILITY-BASED DESIGN IN UNDERGROUND EXCAVATION
5.1 General methodology
In the Swedish Transport Administration’s guidelines (Lindfors et al. 2015) for design of tunnels, a number of typical rock-mechanical design problems is presented. The problems presented in the design guidelines can be separated into two types: (I) where the load and the resistance can be separated and (II) where a distinction between the load and resistance cannot be made. The applicability of reliability-based design on these problems is investigated in this chapter. This is mainly done by probabilistic analyses of some design examples, showing the probabilistic methods benefits and shortcomings and it is discussed how suitable the reliability-based design methods are for these type of problems.
In the following chapter, some typical design problems with separable load and resistance are discussed. The problems are the same as those presented in the Swedish Transport Administration’s guidelines (Lindfors et al. 2015). One of these problems is studied in detail in a separate calculation example, in which partial coefficients are derived. The applicability of the partial coefficient method is discussed in the context of the example. After that, typical design problems where the load and resistance are dependent on deformations are analysed. A design problem based on Bjureland et al. (2015) is presented, in which the ground reaction curve concept is analysed with a probabilistic method for the preliminary design in the planning of a project. In this example, it is also shown how measurements of deformations could be incorporated to reduce the uncertainties in the design at the construction stage using Bayesian statistics.
5.2 Limit states with separable load and resistance
5.2.1 Typical problems
In the Swedish design guidelines (Lindfors et al. 2015), typical rock mechanical problems are presented, for which it is reasonable to assume that the load can be separated from the resistance and a limit state function can be defined. As described in chapter 3.6, there is a number of probabilistic methods that can be used to perform the analysis for these types of problems such as the FORM and Monte Carlo simulations. Even though Monte Carlo simulations in principle will give a more accurate calculation of the probability of failure,

26
BeFo Report 155
calculations using FORM will from a practical point of view, in most cases, probably be accurate enough to be used in the analysis (Jimenez-Rodriguez & Sitar 2007). Independent of which probabilistic method that is chosen, the analysis in its most basic form consists of defining a limit state function. Recalling Eq. (3) and introducing a model uncertainty as a random variable, Ξ, we have that:
(17)
Depending on the particular rock mechanical problem being studied, each problem will have a unique limit state function. Below are some examples from the Swedish Transport Administration’s design guidelines (Lindfors et al. 2015). Acquiring the necessary input data needed for the analysis can sometimes be challenging. Therefore, each limit state has a brief discussion of the level of knowledge of the parameters included in the limit state. Furthermore, the applicability of reliability-based design methods on these limit states is discussed. Note that Ξ has been excluded in the description of the limit states below, even though Ξ usually constitutes a significant part of the total uncertainties and should be quantified and included in the analyses. The model uncertainty is further discussed in Chapter 6.
5.2.2 Suspension of loose core of rock mass
The first limit state function describes the suspension of a loose core of rock mass with rock bolts (Figure 4):
(18)
where is the yield strength of the rock bolt steel, is the area of the rock bolt, and is
the center to center distance between the bolts. On the load side, f is the arching height, is the height from the roof of the tunnel up to the peak of the arch, is the gravitational acceleration, and is the density of the rock mass.
The material parameters and the geometrical parameters and C can usually be
determined with relatively high precision. Therefore, they can often be assumed constant, as their variation will be much less than that of the other parameters.
The parameters and are both related to the shape of the compressed arch that develops in the rock mass above the roof of the tunnel. The shape of the arch mainly depends on the primary stresses in the rock mass, the deformations in the arch and its support (Lindfors et

27
BeFo Report 155
Figure 4-Principle figure showing the load case related to the suspension of a loose core of rock mass (Lindfors et al. 2015).
al. 2015). There are two types of loose cores: either caused by an overstressed and plastic rock mass or caused by low horizontal stresses, which creates a compressive arch in the rock mass higher than the arch of the tunnel. Depending on the type of loose core that occurs, f is calculated with different equations. For an overstressed rock, f is calculated as:
(19)
where B is the width of the tunnel, and is the friction angle of the rock mass. In this case the overstressed rock in the roof is considered a uniaxial compressed rock mass, which gives the angle at failure equal to 45 – /2. For the second case with low horizontal stresses, f is calculated from moment equilibrium and becomes:
(20)
where qv is the vertical load and Hq is the horizontal force at the abutment of the arch. If the stress conditions are uncertain, the largest of these values should be used.
The magnitude of the primary stresses can be difficult to determine, and this parameter also has a large influence on f in both cases. By using analytical solutions such as Kirch’s equations, it is possible to determine the elastic tangential and radial stresses for circular tunnels. From these calculated stresses, together with knowledge of the rock mass strength
28
BeFo Report 155
(usually expressed with the stochastic parameters cohesion and friction angle if the Mohr–Coulomb failure criterion is used), the yielded area of the rock mass can be used to calculate the height of the loose core. However, this will result in a rather complicated limit state that is probably best solved using Monte Carlo simulations even though FORM might be an option.
At low horizontal stresses, f could be approximated with analytical solutions in accordance with Eq. (20), but this requires an estimation of the thickness of the compressed arch to estimate Hq. The assumption of the thickness of the compressed arch in combination with decreasing tangential stresses from the tunnel boundary makes it difficult to assign a probability density function based on analytical solutions only, especially for non-circular tunnels.
If the geometry is complex or if the tunnel is situated at a shallow depth, the use of multiple FEM calculations might be necessary to determine a suitable distribution of ; though, this is seldom feasible because of the large number of required realisations. However, it is possible to use the point estimate method to obtain an approximate value of the probability of failure, since this method only requires a limited number of realisations if the number of stochastic parameters are kept low (which is usually the case), see for example Langford and Diederichs (2013).
Based on the aforementioned discussion, the design of rock support with respect to a core of loose rock using reliability-based design is more complicated than the limit state at a first glance suggests. However, it is clear that the shape of the arch is sensitive to the prevailing stress conditions. Since these primary stress conditions often are uncertain, it also emphasizes the need of a design method which can incorporate these uncertainties. A possible way forward might be using for example numerical calculations in combination with the point estimate method.
5.2.3 Single block with adhesive rock–shotcrete contact
The design of shotcrete for a single block with adhesive contact can be performed with the limit state function (Figure 5):
(21)

29
BeFo Report 155
Figure 5-Principle figure showing the load case related to the analysis of a single block acting on a shotcrete support accounting for adhesion between the shotcrete and the rock mass. (Lindfors et al. 2015).
where is the adhesion between the shotcrete and the rock mass, is the load-bearing width, is the circumferential length of the load-bearing interface between shotcrete and rock, and is the volume of the block and is the unit weight of the rock.
The required input data for the analysis of this limit state is normally not defined in each and every design situation. Therefore, an option is to use experience-based data. The has been tested and documented by for example Hahn (1983) or Bryne et al. (2014). When knowledge of the distribution of this parameter is lacking for the specific design situation, the designer may use these experiences from previous projects as a guide in selecting values for the design.
The has been tested and documented previously (Holmgren 1979). However, available data on this parameter is limited and a probability density function for different thickness of the shotcrete can only be roughly approximated based on previous testing. Additional testing is probably necessary to obtain reasonably accurate probability density functions for this parameter.
The can be controlled and verified by the designer. The precision of the installation of rock bolts governs the precision of as defined in Figure 5. However, there is also an

30
BeFo Report 155
uncertainty in the true value of for natural rock blocks. This uncertainty will be difficult to estimate in regular design situations, which implies that a significant model uncertainty is present with respect to real conditions. This is further discussed below.
The can be difficult to estimate. Two aspects affect the uncertainty: the and the shape of the block. A practicing engineer can likely estimate the with relatively good precision without testing, at least for common rock types. The shape of the block, however, contributes with a significant uncertainty that may be hard to overcome, although the size is partly restricted by the position of the bolts, as the block must fit in between them to be able to fall or slide out. Assuming a pyramid-shaped block as in Figure 5 would increase the model uncertainty, as the block in reality might have another shape. In addition, there is an uncertainty in the estimation of the apical angle, even if the block is pyramid-shaped. On the other hand, estimating the block shape from individual joints in situ would still imply uncertainties and it would be very time-consuming.
If uncertainties related to the size and shape of the block could be described and accepting that the calculated probability of failure is nominal, design of rock support for a single block with adhesion are suitable, in the authors opinion, to be analysed with reliability-based methods. However, is should be noted that the limit state in Eq. (21) presumes that the block exists. Consequently, there is in reality a conditional probability that the block exists that also needs to be considered to obtain the pf. This is a complicated task that requires further research. Possible methods to estimate this conditional probability might be to use discrete fracture network (DFN) models or optical scanning of the tunnel surfaces.
5.2.4 Single block supported by shotcrete without adhesive contact
The design of shotcrete for a single block without adhesive rock–shotcrete contact can be performed with the limit state function (Figure 6):
(22)
where is the bending tensile capacity of the shotcrete, is the thickness of the applied shotcrete, and is the bending moment acting on the shotcrete. An illustration of the failure mode can be seen in Figure 6.
Data from the testing are available for different contents of steel fibre for the shotcrete to estimate the probability density function for fflr. The variation of tc can be measured based

31
BeFo Report 155
Figure 6-Principle figure showing the load case related to the analysis of a single block acting on a shotcrete support without accounting for adhesion between the shotcrete and the rock mass. (Lindfors et al. 2015).
on testing of applied shotcrete in similar projects. An interesting aspect here is how much the variation of tc could be reduced with an improved technique for the application of the shotcrete, which theoretically would enable a reduced thickness of the shotcrete for an equal pf. In addition, it might be possible to use previous measurements as a-priori estimates of the variation of tc and use Bayesian statistics to incorporate the results from measurements of tc to reduce its uncertainty (Stille & Holmberg 2006). In this limit state, the M is calculated based on the weight of the rock block. The shape of this block is assumed to originate from a shear failure in the rock mass between the bolts due to stresses tangential to the shotcrete and low confined radial stresses. This creates a block with angles α to the shotcrete near the bolts (Figure 6).
However, the creation of a block with this geometry depends on many parameters, such as the orientation of the joints, the joint spacing, the distance between the bolts, and the stress state. The limit state is mainly assumed to be relevant when the Rock Mass Rating (RMR) is less than 50, which means that the rock mass most likely can be approximated as a
32
BeFo Report 155
continuum and that the shape of the block is a reasonable approximation. However, the shape of the block could still be considerably uncertain. Also, the load affecting the shotcrete depends on the relative stiffness between the shotcrete and the rock block. If the rock block has a low stiffness, the full distributed load of the block will be taken by the shotcrete over its entire length. However, if the rock block is rather stiff compared to the shotcrete, the distributed load on the shotcrete will be significantly reduced. Both aspects imply that the moment in the shotcrete is associated with significant model uncertainties.
As discussed above, the limit state for a single block with adhesion is in many aspects similar to a single block without adhesion. If accepting the model uncertainties related to the size and shape of the block, and how the relative stiffness of the block compared to the shotcrete influences the probability of failure, and the fact that the calculated probability of failure is nominal, this problem is suitable, in the opinion of the authors, to be analysed with reliability-based methods.
5.2.5 Gravity-loaded arch
The design of a gravity-loaded shotcrete or concrete arch, for situations where there is a limited rock cover above the tunnel roof, can for example be performed using the limit state function:
(23)
where ftunnel is the height of the tunnel arch, is the compression strength of the shotcrete, is the required shotcrete thickness, is the width of the tunnel, and qv is the vertical load
acting on the concrete arch.
Both the ftunnel and B is rather well known and could in most cases likely be assigned a deterministic value. The fcc is well known for different concrete qualities and probability density functions are available. The tc could be measured in situ through testing to ensure an adequate average value and variation (it might be interesting to study how many tests that are required in order to obtain an acceptable design). If testing is not available, previous experience can be used. The probability density function for qv depends to a large extent on the rock cover and the density of the rock mass. Depending on the variation of the rock cover and the density of the rock mass, a probability density function for qv could be estimated.
33
BeFo Report 155
An uncertainty in this analytical model is that it assumes a curved tunnel roof. In most cases, especially in Swedish conditions with rather hard crystalline rock, a flatter arch geometry for the roof is used. This means that a moment could be present which significantly reduces the bearing capacity of the arch. Also, the model assumes that the load will not be reduced with the radial deformation of the tunnel wall, which is usually the case for a concrete lining in tunnels. However, if the tunnel is shallow and situated in poor rock mass conditions, a constant qv with radial deformation might be an acceptable approximation. Another limitation is that the model presumes a moment equilibrium at the top of the tunnel arch. The additional stresses in the concrete arch from the vertical loads are not included which means that the thickness might be underestimated at the abutments of the tunnel. However, this limitation can be accounted for by adjusting the limit state with respect to this.
As previously discussed, these simple analytical solutions have significant model uncertainties and the gravity-loaded arch is no exception. The calculated probability of failure is therefore nominal, implying that model uncertainties to some degree might be acceptable in your design without having the risk to become arbitrary. Based on the above discussion, being aware of the model uncertainties the limit states are associated with we suggest using reliability-based methods for gravity-loaded arches.
5.2.6 Probabilistic calculation example
To illustrate how the design for a specific design situation can be performed using probabilistic methods, a calculation example based on a single block with an adhesive rock–shotcrete interface is shown in the following. Based on Eq. (18), the limit state is expressed as:
(24)
For simplicity, one parameter on the load side and one parameter on the resistance side have been chosen to be a random parameter. The distributions of these parameters are assumed to be independent of each other and normally distributed. In reality, all parameters against which the limit state is sensitive to should be defined as random variables rather than deterministic values. The parameter values are presented in Table 3 and discussed in the following. For illustrative purposes, two cases with different COV for the random variables are presented.

34
BeFo Report 155
Table 3-Input values for the calculation.
Parameter (Case 1) (Case 2) (m) 1–3 – –
(-) 1.15 0.15 0.10 (kN/m3) 27 – –
(mm) 30 – – (m) Varying with C
(kPa) 1000 0.15 0.10
In addition to the possible variation in the centre to centre distance between bolts, the actual size of the block is also highly dependent on the side angle of the block, , defined according to Figure 5. Since this parameter rarely is known, it is chosen to be random on the load side in this calculation example. To achieve a linear limit state function, tan is, for convenience, given a probability distribution.
Hahn (1983) studied the adhesion of shotcrete applied on different rock types. The results from the tests show a significant variation so is therefore, in this calculation example, chosen to be normally distributed.
The is chosen to be 30 mm, which is the width expected for a shotcrete thickness of 60 mm (Stille 1992). The value for should in practical applications be chosen as a distribution but has in this calculation example, for simplicity, been chosen as a deterministic value.
Since the limit state function is linear with independent and normally distributed stochastic variables, the reliability index, β, can be calculated as:
(25)
The mean of the limit state function, , can be found by inserting the mean values of the parameters into the limit state in Eq. (24). The standard deviation of the limit state, , is for the linear limit state in the example calculated as
(26)

35
BeFo Report 155
In Figure 7, the calculated for different values of are presented. For a more comprehensive description of the probabilistic calculation techniques, see e.g. Melchers (1999).
To illustrate the calculated , a comparison with the corresponding deterministic factor of safety FS can be made (Figure 7). The FS is defined as
(27)
Figure 7 shows that if the design in case 1 is performed in safety class 2, a centre to centre distance of 1.5 m would be sufficient to fulfil the requirements of the acceptable safety stated in EC0 (CEN 2002). It should be observed that in the example above, it was assumed that the parameters were independent of each other. However, in some cases, there may be correlation between parameters. This could significantly affect the calculated . A common example is the correlation that exists between cohesion and friction angle (Krounis & Johansson 2011). Another factor that is important is whether the problem at hand is a mean-value-driven process (parallel system) or a brittle process (weakest link system).
Figure 7- Calculated , and required according to EC0 depending on safety class, for different .
0,00
2,00
4,00
6,00
8,00
10,00
1 1,5 2 2,5
Rel
iabi
lity
inde
x/Fa
ctor
of
safe
ty
(b/F
S)
C (m)
Reliability index, Case 1
Reliability index, Case 2
Factor of safety
Required safety index-Safety class 2
Required safety index-Safety class 3

36
BeFo Report 155
In the analysis of a single block, it has been presumed that the block exists in the tunnel. In the design, however, the conditional probability that the block really exists should also be taken into consideration. This is a complicated task to determine; possible methods might include the use of discrete fracture networks with multiple realizations or the use of photogrammetry for identifying blocks that has fallen down after blasting to approximate this number.
The problem analysed in this example belongs to a group of very common problems that are very similar in most projects. For such problems, it may be enough to perform a reliability calculation once, and then re-use the results in similar projects. This would enable the introduction of reliability-based methods in the design of rock support used in ordinary geotechnical conditions, where common practical design experience exists from similar structures (GC-2).
5.2.7 Partial factor calibration example
As a comparison to the previous probabilistic calculation, partial factors are here derived to study the applicability of this method on the problems presented in the Swedish Transport Administration’s guidelines (Lindfors et al. 2015).
Partial factors can be calibrated according to EC0 (CEN 2002), as presented in Chapter 3.8, Eq. (15) and (16). For the two stochastic parameters included in the example, the partial coefficients for and are calculated as (assuming that they are normally distributed and uncorrelated):
(28)
(29)
where and are the partial coefficients of the parameters, and
are the mean value of the parameters, and is the characteristic
values of the parameters (in this calculation example chosen as the mean values of the parameters), and are the sensitivity factors of the parameters and
and are the coefficient of variations of the parameters. The for a
parameter i is defined as

37
BeFo Report 155
(30)
The sensitivity factors for a linear limit state, which is the case for this example, is calculated as:
(31)
where is the deterministic constants with which the random parameter xi is multiplied in
Eq. (24), i.e. and , respectively. The input data for the calculation of the partial coefficients and are the same as in the previously presented
example and can be seen in Table 3. A βT = 5.2 has been used, which corresponds to safety class 3 in the Eurocode 7 (CEN 2002). Two values for the COV have been used in order to illustrate the effect of a changing COV on the derived partial coefficients. The results from the calculations are presented in Figure 8.
In Figure 8, several observations can be made. First, varies significantly with C. For
Case 1, is in the range between 1.61–1.77 for a C between 1 and 2.5 m. This could
imply practical problems, as it indicates that different partial coefficients might be required for different bolt distances for the same analysis. Furthermore, it can be seen that a decrease in from 0.15 to 0.10 implies that instead goes to 1.43–1.52. For Case 2,
varies between 1.11–1.96. Similarly to , a decrease in from
0.15 to 0.10 decreases the partial coefficient to the range 1.06–1.43.
It should also be noted that in Eurocode, partial coefficients are derived based on values that are fixed. Most commonly, values for the resistance, subscript R, and load, subscript S, are chosen in Eurocode EN-1990 as (CEN 2002):
(32)
(33)
These values for is only valid if the following condition is fulfilled (CEN 2002):
(34)
If this condition is not fulfilled, should be used for the variable with the highest standard deviation and for the variable with the lowest standard deviation.

38
BeFo Report 155
Figure 8- Partial coefficients for different C values between rock bolts. The figure shows recommended partial coefficients from the design guidelines, calculated partial coefficients based on the input data given in the calculation example and also calculated partial coefficients using the input data in the calculation example.
However, as previously discussed, α values for the same problem can vary as seen by the change in partial coefficients with a changing C of the rock bolts (implying varying block size). Such an approach with fixed α values for a certain problem are therefore questionable. Tables 4–6 show the recommended values, as stated in the design guidelines (Lindfors et al. 2015) chosen based on information given in Eurocode (CEN 2002), for partial coefficients. If the partial coefficients in Tables 4–6 are compared against the partial
0,9
1,1
1,3
1,5
1,7
1,9
2,1
1 1,2 1,4 1,6 1,8 2 2,2 2,4
Par
tialc
oeff
icie
nt
C (m)
Suggested values for concrete
Suggested values for load
Partial coefficient for adhesion (COV=0.15)
Partial coefficient for tan(α-side) (COV=0.15)
Partial coefficient for adhesion (COV=0.1)
Partial coefficient for tan(α-side) (COV=0.1)

39
BeFo Report 155
Table 4-Suggested values, in the Swedish design guidelines from the Swedish Transport Administration, for partial coefficients depending on safety class.
Safety class 2 0.91 3 1.00
Table 5-Suggested values, in the Swedish design guidelines from the Swedish Transport Administration, for partial coefficients depending on load type.
Load type Permanent 1.10 Exceptional -
Table 6-Suggested value, in the Swedish design guidelines from the Swedish Transport Administration, for partial coefficient for concrete.
Material Concrete 1.50
coefficients derived in the example above, it seen that the partial coefficients suggested in the Swedish Transport Administration’s guidelines deviate from the partial coefficients in the example.
It should be noted that the example presented above is limited to only using a defined distribution for two of the parameters. If more parameters are defined with a distribution instead of deterministic values, the values and, consequently, the partial coefficients would be different.
5.3. Limit states with interaction between load and resistance
5.3.1 The ground reaction curve
The ground reaction curve concept (also known as the convergence–confinement method) describes the complex interaction between the rock mass and the installed support as the tunnel excavation changes the stress distribution in the rock mass. Brown et al. (1983) presented a number of analytical solutions for this interaction problem.
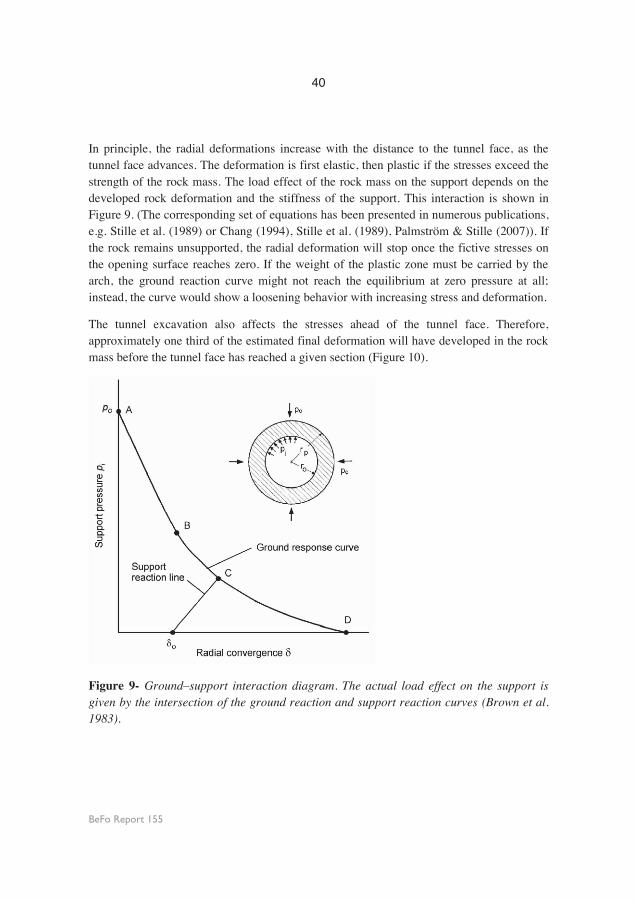
40
BeFo Report 155
In principle, the radial deformations increase with the distance to the tunnel face, as the tunnel face advances. The deformation is first elastic, then plastic if the stresses exceed the strength of the rock mass. The load effect of the rock mass on the support depends on the developed rock deformation and the stiffness of the support. This interaction is shown in Figure 9. (The corresponding set of equations has been presented in numerous publications, e.g. Stille et al. (1989) or Chang (1994), Stille et al. (1989), Palmström & Stille (2007)). If the rock remains unsupported, the radial deformation will stop once the fictive stresses on the opening surface reaches zero. If the weight of the plastic zone must be carried by the arch, the ground reaction curve might not reach the equilibrium at zero pressure at all; instead, the curve would show a loosening behavior with increasing stress and deformation.
The tunnel excavation also affects the stresses ahead of the tunnel face. Therefore, approximately one third of the estimated final deformation will have developed in the rock mass before the tunnel face has reached a given section (Figure 10).
Figure 9- Ground–support interaction diagram. The actual load effect on the support is given by the intersection of the ground reaction and support reaction curves (Brown et al. 1983).

41
BeFo Report 155
Figure 10- Deformations developed on the opening surface as the tunnel excavation advances.
5.3.2 Probabilistic approaches to solve ground–support interaction problems
Applying the concept of the ground reaction curve gives a design situation where a simple limit state function is hard to explicitly state, because the interaction makes it difficult to separate the load from the resistance. Therefore, the use of partial coefficients is unsuitable, and, in addition, some probabilistic methods, such as FORM, become complicated to apply.
Another approach is to use a numerical probabilistic method, such as Monte Carlo simulation (see section 3.5.3). The numerical approach overcomes the interaction problem by repetitively drawing a sample from the random variables and deterministically solving the ground–support analysis for each draw. After a very large number of draws, the number of failure combinations gives a measure of the probability of failure.
An example of how Monte Carlo simulation may be applied for an interaction problem is shown in the following section. The example was previously presented in Bjureland et al. (2015).
5.3.3 Probabilistic calculation example for a ground–support interaction problem
In this calculation example, the expected deformations are analyzed for a deeply located tunnel. The relevant parameters are presented in Table 7. We have assumed an elastic–plastic rock mass with a Mohr–Coulomb failure criterion and a non-associated flow rule for the behavior after failure, as in Stille et al. (1989). The equilibrium point of the rock mass and the support is formulated in accordance to Chang (1994).
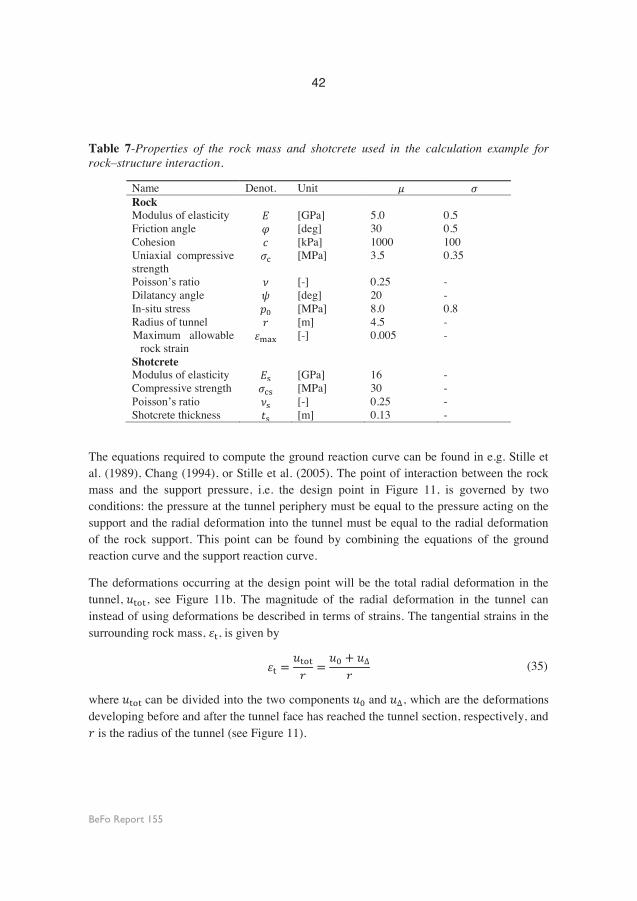
42
BeFo Report 155
Table 7-Properties of the rock mass and shotcrete used in the calculation example for rock–structure interaction.
Name Denot. Unit Rock Modulus of elasticity [GPa] 5.0 0.5 Friction angle [deg] 30 0.5 Cohesion [kPa] 1000 100 Uniaxial compressive strength
[MPa] 3.5 0.35
Poisson’s ratio [-] 0.25 - Dilatancy angle [deg] 20 - In-situ stress [MPa] 8.0 0.8 Radius of tunnel Maximum allowable
rock strain
[m] [-]
4.5 0.005
- -
Shotcrete Modulus of elasticity [GPa] 16 - Compressive strength [MPa] 30 - Poisson’s ratio [-] 0.25 - Shotcrete thickness [m] 0.13 -
The equations required to compute the ground reaction curve can be found in e.g. Stille et al. (1989), Chang (1994), or Stille et al. (2005). The point of interaction between the rock mass and the support pressure, i.e. the design point in Figure 11, is governed by two conditions: the pressure at the tunnel periphery must be equal to the pressure acting on the support and the radial deformation into the tunnel must be equal to the radial deformation of the rock support. This point can be found by combining the equations of the ground reaction curve and the support reaction curve.
The deformations occurring at the design point will be the total radial deformation in the tunnel, , see Figure 11b. The magnitude of the radial deformation in the tunnel can instead of using deformations be described in terms of strains. The tangential strains in the surrounding rock mass, , is given by
(35)
where can be divided into the two components and , which are the deformations developing before and after the tunnel face has reached the tunnel section, respectively, and is the radius of the tunnel (see Figure 11).
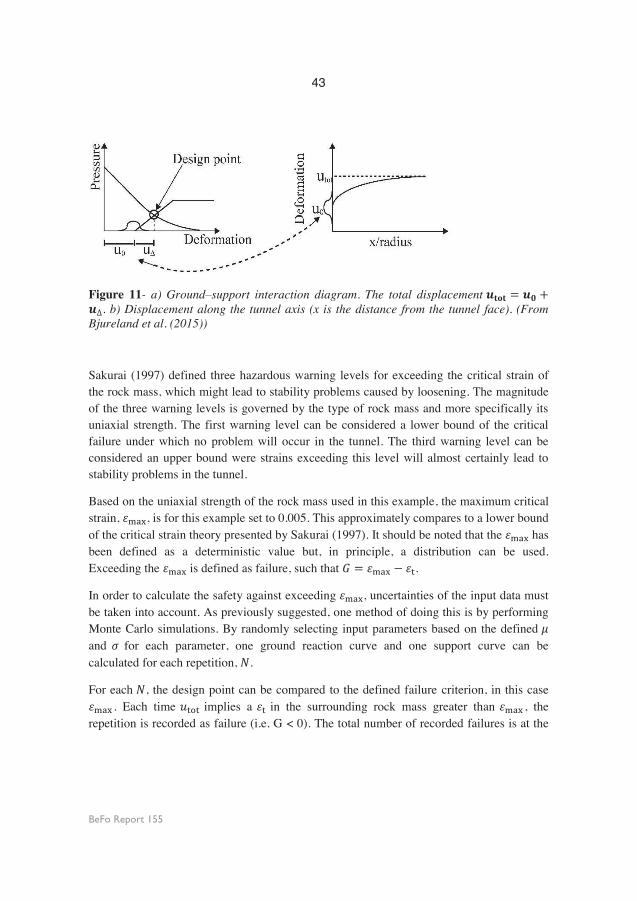
43
BeFo Report 155
Figure 11- a) Ground–support interaction diagram. The total displacement . b) Displacement along the tunnel axis (x is the distance from the tunnel face). (From
Bjureland et al. (2015))
Sakurai (1997) defined three hazardous warning levels for exceeding the critical strain of the rock mass, which might lead to stability problems caused by loosening. The magnitude of the three warning levels is governed by the type of rock mass and more specifically its uniaxial strength. The first warning level can be considered a lower bound of the critical failure under which no problem will occur in the tunnel. The third warning level can be considered an upper bound were strains exceeding this level will almost certainly lead to stability problems in the tunnel.
Based on the uniaxial strength of the rock mass used in this example, the maximum critical strain, , is for this example set to 0.005. This approximately compares to a lower bound of the critical strain theory presented by Sakurai (1997). It should be noted that the has been defined as a deterministic value but, in principle, a distribution can be used. Exceeding the is defined as failure, such that .
In order to calculate the safety against exceeding , uncertainties of the input data must be taken into account. As previously suggested, one method of doing this is by performing Monte Carlo simulations. By randomly selecting input parameters based on the defined and for each parameter, one ground reaction curve and one support curve can be calculated for each repetition, .
For each , the design point can be compared to the defined failure criterion, in this case . Each time implies a in the surrounding rock mass greater than , the
repetition is recorded as failure (i.e. G < 0). The total number of recorded failures is at the

44
BeFo Report 155
end compared to . This gives an estimate of how likely it is that will be exceeded, i.e. the probability of failure. Also, the Monte Carlo simulations will give an estimate of the
in the tunnel, its uncertainty through a statistical distribution, and the pressure that can be expected to act on the support.
The number of repetitions for the Monte Carlo simulations can be chosen based on the acceptable error in Eq. (9). In this calculation example is set to 10000. The chosen is relatively small in this example, implying a possible large statistical error of the calculated probability of failure. However, is in this example considered to be sufficient for the purpose of this example. It should be noted that the statistical properties of the input parameters must be defined before the analysis can be executed. For simplicity, the random parameters are assumed to be normally distributed and statistically independent in this example.
The mean ground reaction curve calculated from the Monte Carlo simulations can be seen in Figure 12 along with the distribution of . The calculated expected deformations and its uncertainty defined as can be seen in Table 8.
Based on the calculated and its related , the resulting probability of failure is calculated to ; thus, the probability of exceeding the is . For simplicity, it is only the critical strain of the rock mass that is considered in this example. In
Figure 12-Mean ground reaction curve and the distribution of the maximum deformation. Modified from Bjureland et al. (2015)
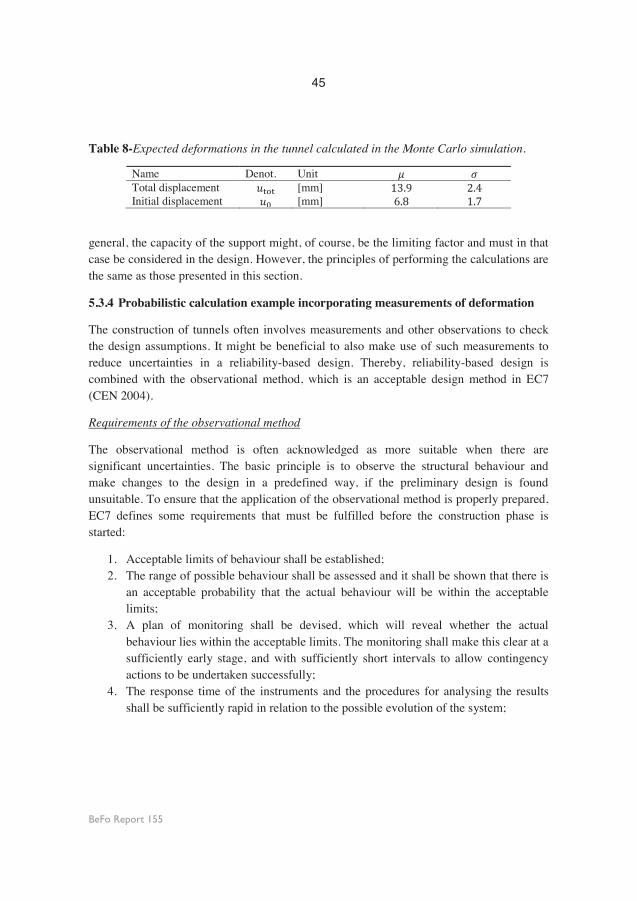
45
BeFo Report 155
Table 8-Expected deformations in the tunnel calculated in the Monte Carlo simulation.
Name Denot. Unit Total displacement [mm] Initial displacement [mm]
general, the capacity of the support might, of course, be the limiting factor and must in that case be considered in the design. However, the principles of performing the calculations are the same as those presented in this section.
5.3.4 Probabilistic calculation example incorporating measurements of deformation
The construction of tunnels often involves measurements and other observations to check the design assumptions. It might be beneficial to also make use of such measurements to reduce uncertainties in a reliability-based design. Thereby, reliability-based design is combined with the observational method, which is an acceptable design method in EC7 (CEN 2004).
Requirements of the observational method
The observational method is often acknowledged as more suitable when there are significant uncertainties. The basic principle is to observe the structural behaviour and make changes to the design in a predefined way, if the preliminary design is found unsuitable. To ensure that the application of the observational method is properly prepared, EC7 defines some requirements that must be fulfilled before the construction phase is started:
1. Acceptable limits of behaviour shall be established; 2. The range of possible behaviour shall be assessed and it shall be shown that there is
an acceptable probability that the actual behaviour will be within the acceptable limits;
3. A plan of monitoring shall be devised, which will reveal whether the actual behaviour lies within the acceptable limits. The monitoring shall make this clear at a sufficiently early stage, and with sufficiently short intervals to allow contingency actions to be undertaken successfully;
4. The response time of the instruments and the procedures for analysing the results shall be sufficiently rapid in relation to the possible evolution of the system;

46
BeFo Report 155
5. A plan of contingency actions shall be devised, which may be adapted if the monitoring reveals behaviour outside acceptable limits.
In the following, the calculation example from the previous section is extended. It is shown how the observational method can be combined with a reliability-based design and how the requirements of the observational method can be fulfilled in this particular case.
The first requirement, definition of limits of acceptable behavior, can be fulfilled using the calculation methodology presented in the previous section. This gives an estimation of the probability of exceeding of the initial design, given the available information, and an estimation of the expected behaviour in terms of deformations. To have a sufficient structural safety for the completed tunnel, the limits of acceptable behavior are defined such that the probability of exceeding must be sufficiently small for the completed tunnel.
The second requirement implies that the preliminary design should be chosen such that it is likely enough that the limits of acceptable behaviour are not violated. The acceptable probability of violation is dependent on the cost for the contingency actions that must be put into operation if the violation occurs. In this case, the first assessment of the probability of exceeding was found to be 0.3%. Thus, the probability of needing contingency actions seems rather small at this stage, which fulfils the requirement. A discussion of the allowable maximum probability of needing contingency actions is given in Spross et al. (2016).
The third and fourth requirements concern the monitoring plan and the analysis of the monitoring data. When setting up a suitable monitoring plan one must of course make sure that the planned observations, or measurements, measures a property that, in some way, can be related to the defined limit state, or failure, used in the preliminary design. In this case, the radial deformation is continuously measured for a tunnel section, as the tunnel face moves further and further into the rock as the construction proceeds. This choice is made because the deformation can be directly related to the strain in the rock mass surrounding the tunnel.
The fifth requirement concerns the contingency actions that must be put into operation, if the measurements show that the behavior is unacceptable. This aspect of the observational method is not within the scope of this example. Thus, we will, at this point, not discuss suitable contingency actions for the example case.

47
BeFo Report 155
Application in the construction phase
A limitation of using deformation measurements in tunnel construction is that it might be difficult in an early stage to assess whether the expected final deformations will be larger than the limits of acceptable behavior, or not. One way of managing this is to use the measurement data in an early stage to predict the final behaviour and the associated safety against failure. Stille et al. (2005) and Holmberg and Stille (2007) presented a methodology where measurements of deformations are used to perform a regression analysis and an extrapolation to predict the final radial deformation of the tunnel. Bjureland et al. (2015) used this methodology and showed how it is possible to verify the expected probability of exceeding for the completed tunnel.
The methodology does not only fulfil the requirements of the observational method, it also gives the engineer an opportunity, at an early stage, to foresee a possible exceedance of the defined failure and therefore allow the engineer to make the decision to install prepared contingency actions, which must be ready according to the fifth requirement of the observational method, before the defined limit is exceeded.
In Table 9, radial deformation measurements for a fictive tunnel section are presented. The measurements start once the tunnel face has reached the relevant section. This implies that the measurements only are made of , which leaves significant uncertainties in the prediction of the , as approximately the first third of the deformation ( ) must be assessed from analytical models (see Eq. (35) and Figure 11).
The deformation increases as the tunnel face is moved further into the rock as the excavation proceeds. Applying the proposed regression analysis and assuming that the measured deformation is normally distributed give the extrapolated curve in Figure 13a for the expected radial deformation. The extrapolation is based on the information available
Table 9-Fictive deformation measurements for a tunnel section. The tunnel face moves further into the rock as the construction proceeds.
Name Denot. Unit Distance to the tunnel face
[-]
Radial deformation
[mm]

48
BeFo Report 155
Figure 13- a) Result of the regression and extrapolation after 4 deformation measurements plotted against the distance to the tunnel face over the tunnel radius (x/r). The range of possible behaviour is defined as three times the standard deviation of the predicted value. b) The calculated deformation with its uncertainty defined as either ( ) or . The maximum allowable deformation is defined as .(Bjureland et al. 2015).
after four measurements. Figure 13a also shows the range of possible final radial deformation, given the uncertainties at this moment. A significant contribution to these uncertainties is the uncertainty of .
However, if the deformation measurements are performed using for example an extensometer installed from the surface before the excavation reaches the measured section, it is possible to significantly reduce the uncertainty in . The effect from this on the uncertainty in is illustrated in Figure 13b, where the situations of having and not having uncertainties in are compared for our example case. With uncertainties only coming from the regression analysis (i.e. ), the range of predicted final radial deformation significantly decreases.
The required calculations for the regression analysis and extrapolation can be seen in Appendix 1.
Remarks on the example
The proposed design methodology for incorporating measurements into the structural safety analysis of the tunnel by relating the deformation to a critical strain provides a possibility to verify the structural safety of the design. The presented example shows that the
05
10152025
0 5
u(m
m)
x/r
Meas. Exp. def.
Range
a)
10 15 20 25Pro
babi
lity
den
sity
u (mm)
N(utot;(σu0+σuΔ)) N(utot;σuΔ)
b)
N(utot;σuΔ)
umaxutot

49
BeFo Report 155
requirements of the observational method are possible to fulfil for such cases. Using extrapolation or similar methods to predict the final displacement before it has occurred gives an opportunity to react before the critical strain is reached.
The example also shows the effect of not measuring , but instead only the deformation that occurs after the tunnel face has passed the measured section ( ). Assuming that all other conditions are the same, a case where only has been measured may imply that a more conservative design is needed to satisfy the target reliability, than if had been measured. However, the practical difficulties in measuring may make this option rare in reality, except for some special cases such as very shallow tunnels.
Although the calculation example is fictive and based on a simplified, analytical solution, the proposed methodology provides a useful concept for how the observational method and reliability-based design can be combined in the design of a tunnel. Future work is however needed to show the applicability to more complex design situations.


51
BeFo Report 155
6. DISCUSSION
6.1 General The choice of design method among those suggested by EC7 is related to the design method’s ability to consider uncertainties in the specific design situation (IEG 2010a). RBD methods have the ability to take uncertainties into account in the design, which means that these methods, alone or in combination with other methods, are more suitable to use for complex problems where the need to manage these uncertainties are higher. In addition, as RBD methods imply a more rigourous analysis than what is common today, using them increases the required work. Consequently, RBD methods are mainly suitable for use in Geotechnical Category 3 (GC-3) cases; they are not intended to replace the prescriptive methods mainly used in GC-1 situations.
To enable analysis of the design situation with RBD methods, it must be possible to formulate a limit state function of the analysed problem. For some types of complex design situations associated with ground behaviours such as flowing ground or swelling ground it may be difficult to set up a limit state function. In other words, it is mainly design situations with ground behaviour for which a limit state function can be formulated that are suitable to analyse with RBD methods. This implies that design situations that are commonly analysed with analytical or numerical calculations can also be analysed with RBD methods. Palmström & Stille (2007) summarized which design methods that are useful for different types of ground behaviour. This summary can be used as a support to evaluate which design situations that are suitable to analyse with RBD methods.
6.2 Limit states with separable load and resistance
Limit states for the design of rock support in the Swedish Transport administration’s guidelines (Lindfors et al. 2015), where the load and the resistance can be assumed separable, were analysed and discussed in this report. It was found that most of these problems are suitable to analyse with RBD methods. It was also found that most of these design situations are based on simplified analytical models with significant model uncertainties. It is therefore important to acknowledge that the calculated pf is nominal. Thus, pf is neither a measure of an expected failure frequency nor a measure of the designing engineer’s degree of belief in failure.

52
BeFo Report 155
Because of the nominal interpretation, we recommend that back-calculations are performed to obtain calibrated acceptance criteria (βT) for support in existing tunnels; this is further discussed below. Parallel to this work, it is also recommended to work on the quantification of model uncertainties and to obtain information for a better statistical description of the stochastic parameters included in the design problems.
Several of the design situations where the load and the resistance are separable belong to a group of common problems that vary little between projects, such as block stability with or without adhesion between the shotcrete and rock. For such problems, we suggest that a probabilistic design calculation is performed once, for reference. This reference calculation could be used in the design of typical rock support that is used under ordinary geotechnical conditions where practical design experience exists from similar structures, i.e. GC-2.
In cases, where the Swedish Transport Administration’s guidelines (Lindfors et al. 2015) suggests the load and resistance to be separated, it was found that obtaining probability density functions for some parameters can be very difficult. For example, in the suspension of a loose core, the probability density function of f is dependent on the stress state around the tunnel. Multiple FEM calculations might then be required to determine a suitable distribution for f. To keep the number of realisations on a reasonable level because of the required calculation time, a possible solution might be to use numerical calculations in combination with the point estimate method or the modified point estimate method (Langford & Diederichs 2013).
When block stability problems are analysed in combination with systematic bolting, the analysis presumes that the block exists. This leads to an overly conservative design. We recommend that future research investigates how to determine and incorporate the conditional probability that the block exists. Possible ways forward might be to use DFN modelling or photogrammetry or a combination of them. An interesting parameter to also study connected to the block stability problem is the thickness and variation of the shotcrete (Stille & Holmberg 2006). How a reduction in the variation of the thickness or increased knowledge from testing might affect the required thickness is recommended for future work.
6.3 The partial factor approach
The results from the calculation example performed in this report showed that it could be questioned whether partial coefficients are suitable for the design of rock support. The main problem is that many of the problems have a varying geometry from case to case and,
53
BeFo Report 155
consequently, the internal relation between the parameters changes significantly. This results in large variations in the partial coefficients for the same type of problem. Having a fixed partial coefficient for these problems becomes too conservative in order to consider all design situations, and it would be impractical to have partial coefficients that vary depending on each design situation.
In addition, having design situations where the sensitivity factors changes depending on the geometry of the problem also implies that the approach used in Eurocode, where the partial factors are based on fixed values on the sensitivity factors, are not suitable. However, in the Swedish Transport Administration’s guidelines (Lindfors et al. 2015), it is recommended to use fixed partial coefficients for design problems where the load and the resistance could be separated. In our opinion, it is questionable whether this is suitable.
6.4 Limit states with interaction between load and resistance
In design situations where the load and resistance vary with the deformation in the tunnel, application of the ground reaction curve concept gives a design situation where a simple limit state function is hard to state explicitly. Therefore, some probabilistic methods, such as FORM, become very complicated to apply and these types of problems are best analysed with other methods, such as for example Monte Carlo simulations or point estimate methods.
As deformations are easier to measure than stresses in the support, a strain-based limit state is preferable. This also makes it easier to combine reliability-based methods with the observational method. However, more research is required to develop this area further than the present state-of-the-art knowledge, here represented by Stille et al. (2005), and Holmberg and Stille (2007, 2009). Another problem within this area is that the observational method, as defined in EC7, does not specify how to ensure an acceptable safety margin based on the observed parameters. This problem was briefly studied by Spross et al. (2014) and Bjureland et al. (2015) but further research is needed in this area to develop a concept for practical use in tunnel engineering.
A problem in applying probabilistic methods for ground–support interaction is that, presently, analytical solutions mainly exist for tunnels with simple geometry. At the same time, probabilistic methods has their main advantage in more complex design situations with complex geometries and different ground behaviour. This means that there is a need to develop design methods where reliability-based methods are combined with numerical

54
BeFo Report 155
analyses for these types of analyses. These combinations could for example be based on Monte Carlo simulations or the point estimate method.
The calculation example in chapter 5.3.3 showed a possible way of performing reliability-based calculations for a rock–support interaction problem using Monte Carlo simulation. One of the advantages with the presented design procedure is that it gives the engineer more information of the effect that e.g. the variability of the parameters has on the results compared to deterministic calculation. The presented procedure also gives a range of possible behavior for the planned structure, which can be used in combination with the observational method.
One disadvantage of the presented calculation procedure is the time that it takes to perform the required number of calculations, if high precision is required. This, in combination with the analytical model used in the calculation procedure, implies limitations in many common applications, such as e.g. in shallow tunnels. Therefore, there is a need for further research to make the design procedure more applicable in the many different design situations that an engineer might face.
6.5 Definition of failure
One of the most difficult parts of the analysis is how to define what failure actually is. Does failure occur when the lower bound of the critical strain is exceeded, as in the presented calculation example, or does it occur when the rock mass goes into plastic behavior? Similarly, does the choice of limit state definition have an impact on the βT in order to satisfy the society’s requirement on structural safety? These are by no means issues for reliability-based design only; the same problem exists when using for example a safety factor. It may therefore be more appropriate to use other terminology for this concept, such as “probability of unsatisfactory behavior”, as exceeding the limit may not cause an actual failure, as suggested by Mašín (2015). This question of how the limit state definition affects target reliabilities is an urgent topic in future research.
6.6 Acceptable Safety
A common problem in probabilistic design calculations is that the calculated probability of failure often is nominal and does not reflect a failure frequency or a degree of belief in failure. To account for this, βT should be calibrated by back-calculation from existing structures that have safety levels that are considered acceptable by society, see e.g. Melchers (1999). When using this methodology, it is common that a discrepancy is

55
BeFo Report 155
obtained between the back-calculated βT and the βT given in the codes. If the back-calculated βT is too low compared to the codes, it could either indicate that the safety of the analysed structure is insufficient or that the calculation model and its parameters do not incorporate all relevant aspects. On the other hand, if the back-calculated βT is too high, it could indicate that the model is poor or that the safety of the analysed structure is too high.
Another issue is whether an underground excavation should be considered as a system of many components (in principle, each wedge in the tunnel may be considered as a component), where each component has a probability of failure. If so, βT must be calibrated also for the system probability of failure.
Because of the difficulties in interpreting the calibration result, it is necessary to have good understanding of the problem and be confident that all important aspects are considered in the calibration procedure. For future work, it is therefore recommended to analyze support in existing tunnels with satisfactory performance to obtain βT by calibration. Quantification of parameter and model uncertainty is of vital importance in such work.


57
BeFo Report 155
7. CONCLUSIONS
It is important that the tools for design of rock support take the uncertainties present in each specific design situation into account; the completed structures should have a sufficient level of safety in compliance with the acceptance requirements, which are defined by the society. RBD methods incorporate these uncertainties. The objective of this report has been to investigate and discuss the applicability of reliability-based design in underground excavation in rock in general and, furthermore, identify areas for future research.
The conclusions from the work in this report are that:
RBD methods, alone or in combination with the observational method, have the ability to account for the parameter and model uncertainties present in the design. They are therefore suitable to use for Geotechnical Category 3 problem, given that a limit state function can be formulated for the problem.
Limit states for the design of rock support in the Swedish Transport Administration’s guidelines (Lindfors et al. 2015) can for some problems be analysed with RBD methods. However, both model uncertainties and probability density functions need to be better quantified. This is not a trivial task and there are practical difficulties that have to be solved.
There is a need to further develop methodologies that enable a combination of numerical calculations and RBD methods. The modified point estimate method might be a useful way forward to keep down the computational time.
A system approach should be taken in the analyses. For block stability analyses, this implies that the conditional probability that the block really exists needs to be considered. DFN or photogrammetry might be possible to use to quantify this probability.
For many rock mechanical problems, the geometry of e.g. blocks and wedges varies significantly from case to case. This implies that sensitivity factors and corresponding calibrated partial factors may be different for each individual case. The methodology of Eurocode 7, which implies fixed sets of partial coefficients for each design approach, is therefore questionable. In our opinion, fixed partial coefficients are not suitable to use for these types of problems.

58
BeFo Report 155
Eurocode 7 does not mention how to ensure an acceptable safety margin based on the observed parameters with the observational method. In order to obtain this, a strain-based limit state combined with reliability-based calculations may be a way forward.
It is often unclear what “failure” means in tunnel engineering. This needs to be further analyzed and clarified. “Probability of unsatisfactory behavior” might be a better term when a limit state is violated instead of “probability of failure”.
The calculated probability of failure should be interpreted as nominal for the discussed limit states. Therefore, we recommend that the βT for the design of tunnel support in the future is calibrated based on representative existing tunnels. This βT also has to consider how the acceptance criterion should be defined with respect to the tunnel as a system; i.e., should the βT be related to the probability of failure of each structural component or should it be related to the probability of having one component failing in a structure consisting of many components?
Finally, reliability-based design has the potential to consider parameter and model uncertainties for the analysed limit state. However, to account for all uncertainties present in the design, including e.g. human errors, a risk management framework also needs to be adopted.

59
BeFo Report 155
8. REFERENCES
Andersson, C. 2010. Probability based design of rock constructions, an overview of numerical means. Stockholm: BeFo.
Ang, A.H.-S. & Tang, W.H. 2007. Probability concepts in engineering – Emphasis on applications in civil & environmental engineering. Hoboken, NJ: John Wiley & Sons.
Baecher, G.B. & Christian, J.T. 2003. Reliability and statistics in geotechnical engineering. Chichester: John Wiley & Sons.
Bagheri, M. 2011. Block stability analysis using deterministic and probabilistic methods. PhD thesis. Stockholm: KTH Royal Insitute of Technology.
Bedi, A. & Orr, T.L.L. 2014. On the applicability of the Eurocode 7 partial factor method for rock mechanics. In: L. R. Alejano, A. Perucho, C. Olalla & R. Jiménez (eds.), EUROCK 2014: Rock engineering and rock mechanics – structures in and on rock, Vigo, Spain, 26-29 May 2014. London: Taylor & Francis group, 1517-1523.
Bjureland, W., Spross, J., Johansson, F. & Stille, H. 2015. Some aspects of reliability-based design for tunnels using observational method (EC7). In: W. Schubert & A. Kluckner (eds.) Proceedings of the workshop Design practices for the 21st Century at EUROCK 2015 & 64th Geomechanics Colloquium, Salzburg, 7 October 2015. Salzburg: Österreichische Gesellschaft für Geomechanik, 23-29.
Brown, E.T., Bray, J.W., Ladanyi, B. & Hoek, E. 1983. Ground response curves for rock tunnels. Journal of Geotechnical Engineering, 109(1), 15-39.
Bryne, L.E., Ansell, A. & Holmgren, J. 2014. Laboratory testing of early age bond strength of shotcrete on hard rock. Tunnelling and Underground Space Technology, 41, 113-119.
Cauvin, M., Verdel, T. & Salomn, R. 2009. Modeling uncertainties in mining pillar stability analysis. Risk Analysis, 29(10), 1371-1380.
Celestino, T.B., Aoki, N., Silva, R.M., Gomes, R.A.M.P., Bortolucci, A.A. & Ferreira, D.A. 2006. Evaluation of tunnel support structure reliability. ITA-World Tunnel Congress. Seoul: Elsevier.
CEN. 2002. SS-EN 1990 – Basis of structural design. Brussels: European Committee for Standardisation.
CEN 2004. EN 1997-1:2004 Eurocode 7: Geotechnical design – Part 1: General rules. Brussels: European Committee for Standardisation.
Chang, Y. 1994. Tunnel support with shotcrete in weak rock – a rock mechanics study. Ph.D. thesis. Stockholm: KTH Royal Institute of Technology.
Chang, Y. & Stille, H. 1993. Influence of early-age properties of shotcrete on tunnel construction sequences. Shotcrete for Underground Support VI, 1993. ASCE, 110-117.
60
BeFo Report 155
Christian, J.T. 2004. Geotechnical engineering reliability: How well do we know what we are doing? Journal of Geotechnical and Geoenvironmental Engineering, 130(10), 985-1003.
Ditlevsen, O. & Madsen, H.O. 2007. Structural reliability methods. Kgs. Lyngby: Coastal, Maritime and Structural Engineering, Department of Mechanical Engineering, Technical University of Denmark.
Doorn, N. & Hansson, S.O. 2011. Should probabilistic design replace safety factors? Philosophy & Technology, 24(2), 151-168.
Einstein, H.H. 1996. Risk and risk analysis in rock engineering. Tunnelling and underground space technology, 11(2), 141-155.
El Matarawi, A. & Harrison, J.P. 2015. Effect of variability on limit state design of underground openings. In: W. Schubert & A. Kluckner (eds.), Proceedings of the workshop Design practices for the 21st Century at EUROCK 2015 & 64th Geomechanics Colloquium, Salzburg, 7 October 2015. Salzburg: Österreichische Gesellschaft für Geomechanik, 31-36.
Estaire, J. & Olivenza, G. 2014. Spread foundations and slope stability calculations on rocks according to Eurocode EC-7. In: L. R. Alejano, A. Perucho, C. Olalla & R. Jiménez (eds.), EUROCK 2014: Rock Engineering and Rock Mechanics: Structures in and on Rock Masses Vigo, Spain, 26-29 May 2014. London: Taylor & Francis group, 1505-1510.
Gambino, G.F. & Harrison, J.P. 2015. Multiple modes of rock slope instability – a limit state design approach. In: W. Schubert & A. Kluckner (eds.), Proceedings of the workshop Design practices for the 21st Century at EUROCK 2015 & 64th Geomechanics Colloquium, Salzburg, 7 October 2015. Salzburg: Österreichische Gesellschaft für Geomechanik, 11-16.
Goh, A.T.C. & Zhang, W. 2012. Reliability assessment of stability of underground rock caverns. International Journal of Rock Mechanics & Mining Sciences, 55, 157-163.
Hahn, T. 1983. Adhesive strength of shotcrete on different rock surfaces (in Swedish). Stockholm: BeFo.
Harrison, J.P., Stille, H. & Olsson, R. 2014. EC7 and the application of analytical and empirical models to rock engineering. In: L. R. Alejano, A. Perucho, C. Olalla & R. Jiménez (eds.), Proceedings of the European Regional Symposium on Rock Engineering and Rock Mechanics (EUROCK 2014), Vigo, Spain, 26-28 May 2014. Boca Raton: CRC Press, 1511-1516.
Hasofer, A.M. & Lind, N.C. 1974. Exact and invariant second-moment code format. Journal of the Engineering Mechanics Division, 100(1), 111-121.
Hoek, E. 1999. Support for very weak rock associated with faults and shear zones. Proc. Rock Support & Reinforcement Practice in Mining, 19-32.
Hoek, E. & Brown, E.T. 1980. Underground excavations in rock. Abingdon: Taylor & Francis.
61
BeFo Report 155
Hoek, E., Kaiser, P.K. & Bawden, W.F. 2000. Support of underground excavations in hard rock. Balkema: Rotterdam.
Hohenbichler, M. & Rackwitz, R. 1981. Non-normal dependent vectors in structural safety. Journal of the Engineering Mechanics Division, 107(EM7), 1227-1238.
Holmberg, M. & Stille, H. 2007. The application of the observational method for design of underground excavations. Stockholm: SveBeFo.
Holmberg, M. & Stille, H. 2009. The observational method and deformation measurements in tunnels. Stockholm: SveBeFo.
Holmgren, J. 1979. Punch-loaded shotcrete linings on hard rock. Stockholm: BeFo. IEG. 2010a. Tillämpningsdokument bergtunnel och bergrum, Rapport 5:2010. Stockholm:
Implementeringskommission för Europastandarder inom geotekniken. IEG. 2010b. Tillämpningsdokument observationsmetoden inom geotekniken, Rapport
9:2010. Stockholm: Implementeringskommission för Europastandarder inom geotekniken.
Jimenez-Rodriguez, R. & Sitar, N. 2007. Rock wedge stability analysis using system reliability methods. Rock Mechanics and Rock Engineering, 40(4), 419-427.
Johnson, R.A., Miller, I. & Freund, J. 2014. Probability and statistics for engineers. Essex: Pearson education limited.
Karam, K.S., Karam, J.S. & Einstein, H.H. 2007. Decision analysis applied to tunnel exploration planning. II: Consideration of uncertainty. Journal of Construction Engineering and Management, 133(5), 354-363.
Kohno, S. 1989. Reliability-based design of tunnel support systems. Doctor of Philosophy, 8924864. Urbana, Illinois: University of Illinois at Urbana-Champaign.
Kohno, S., Ang, A.H.-S. & Tang, W.H. 1992. Reliability evaluation of idealized tunnel systems. Structural Safety, 11(2), 81-93.
Krounis, A. & Johansson, F. 2011. The influence of correlation between cohesion and friction angle on the probability of failure for sliding of concrete dams. In: Escuder-Bueno (ed.) Risk analysis, dam safety, dam security and critical infrastructure management. London: Taylor and Francis Group.
Krounis, A., Johansson, F., Spross, J. & Larsson, S. 2016. Influence of cohesive strength in probabilistic sliding stability reassessment of concrete dams. Journal of Geotechnical and Geoenvironmental Engineering, in press.
Langford, J.C. & Diederichs, M.S. 2013. Reliability based approach to tunnel lining design using a modified point estimate method. International Journal of Rock Mechanics & Mining Sciences, 60, 263-276.
Laso, E., Lera, M.S.G. & Alarcón, E. 1995. A level II reliability approach to tunnel support design. Applied Mathematical Modelling, 19(6), 371-382.
Li, H.-Z. & Low, B.K. 2010. Reliability analysis of circular tunnel under hydrostatic stress field. Computers and Geotechnics, 37(1–2), 50-58.
Lindfors, U., Swindell, R., Rosengren, L., Holmberg, M. & Sjöberg, J. 2015. Projektering av bergkonstruktioner. Stockholm: Trafikverket.

62
BeFo Report 155
Low, B.K. 1997. Reliability analysis of rock wedges. Journal of Geotechnical and Geoenvironmental Engineering, 123(6), 498-505.
Low, B.K. & Einstein, H.H. 2013. Reliability analysis of roof wedges and rockbolt forces in tunnels. Tunnelling and Underground Space Technology, 38, 1-10.
Low, B.K. & Tang, W.H. 1997. Efficient reliability evaluation using spreadsheet. Journal of Engineering Mechanics, 123(7), 749-752.
Low, B.K. & Tang, W.H. 2004. Reliability analysis using object-oriented constrained optimization. Structural Safety, 26(1), 69-89.
Lü, Q. & Low, B.K. 2011. Probabilistic analysis of underground rock excavations using response surface method and SORM. Computers and Geotechnics, 38(8), 1008-1021.
Lü, Q., Sun, H.-Y. & Low, B.K. 2011. Reliability analysis of ground-support interaction in circular tunnels using the response surface method. International Journal of Rock Mechanics & Mining Sciences, 48, 1329-1343.
Martin, C., Kaiser, P., Tannant, D. & Yazici, S. 1999. Stress path and instability around mine openings. 9th ISRM Congress, 1999. International Society for Rock Mechanics.
Mašín, D. 2015. The influence of experimental and sampling uncertainties on the probability of unsatisfactory performance in geotechnical applications. Géotechnique, 65(11), 897-910.
Melchers, R.E. 1999. Structural reliability analysis and prediction. Chichester: John Wiley & Sons.
Mollon, G., Dias, D. & Soubra, A.-H. 2009a. Probabilistic analysis and design of circular tunnels against face stability. International Journal of Geomechanics, 9(6), 237-249.
Mollon, G., Dias, D. & Soubra, A.-H. 2009b. Probabilistic analysis of circular tunnels in homogeneous soil using response surface methodology. Journal of Geotechnical and Geoenvironmental Engineering, 135(9), 1314-1325.
Müller, R., Larsson, S. & Spross, J. 2014. Extended multivariate approach for uncertainty reduction in the assessment of undrained shear strength in clays. Canadian Geotechnical Journal, 51, 231-245.
Müller, R., Larsson, S. & Spross, J. 2015. Multivariate stability assessment during staged construction. Canadian Geotechnical Journal, 53(4), 603-618.
Nau, R. 2015. Introduction to linear regression. http://people.duke.edu/~rnau/411home.htm [Online]. Duke university. [Accessed 2015-11-23].
Nikolaidis, E., Ghiocel, D.M. & Singhal, S. 2005. Engineering design reliability handbook. Boca Raton: CRC Press.
Nomikos, P.P. & Sofianos, A.I. 2010. An analytical probability distribution for the factor of safety in underground rock mechanics. International Journal of Rock Mechanics & Mining Sciencs, 48(4), 597-605.

63
BeFo Report 155
Olsson, R. & Palmström, A. 2014. Critical review of EC7 concerning prescriptive measures for rock mechanics design. In: L. R. Alejano, A. Perucho, C. Olalla & R. Jiménez (eds.), Proceedings of ISRM European Regional Symposium on Rock Engineering and Rock Mechanics (EUROCK 2014), Vigo; Spain, 26-28 May 2014. Boca Raton: CRC Press, 1493-1498.
Palmström, A. & Stille, H. 2007. Ground behaviour and rock engineering tools for underground excavations. Tunnelling and Underground Space Technology, 22(4), 363-376.
Park, H.J., Um, J.-G., Woo, I. & Kim, J.W. 2012. The evaluation of the probability of rock wedge failure using the point estimate method. Environmental Earth Sciences, 65(1), 353-361.
Peck, R.B. 1969. Advantages and limitations of the observational method in applied soil mechanics. Géotechnique, 19(2), 171-187.
Quek, S. & Leung, C. 1995. Reliability based stability analysis of rock excavations. International Journal of Rock Mechanics and Mining Sciences & Geomechanics Abstracts, 32(6), 617-620.
SGF 2014. Hantering av geotekniska risker i projekt – krav. Metodbeskrivning [Management of geotechnical risks in projects – requirements. Methodology]. Linköping: SGF (Swedish Geotechnical Society).
Spross, J., Johansson, F., Stille, H. & Larsson, S. 2014. Towards an improved observational method. In: L. R. Alejano, A. Perucho, C. Olalla & R. Jiménez (eds.), EUROCK 2014: Rock Engineering and Rock Mechanics: Structures in and on Rock Masses Vigo, Spain, 26-29 May 2014. London: Taylor & Francis group, 1435-1440.
Spross, J., Johansson, F., Uotinen, L.K.T. & Rafi, J.Y. 2016. Using observational method to manage safety aspects of remedial grouting of concrete dam foundations. Geotechnical and Geological Engineering. In press.
Spross, J., Olsson, L., Hintze, S. & Stille, H. 2015a. Hantering av geotekniska risker i byggprojekt: ett praktiskt tillämpningsexempel [Management of geotechnical risks in construction projects: a practical example]. Report 13009. Stockholm: SBUF.
Spross, J., Olsson, L., Hintze, S. & Stille, H. 2015b. Would risk management have helped? – A case study. In: T. Schweckendiek, A. F. van Tol, P. Pereboom, M. T. van Staveren & P. M. C. B. M. Cools (eds.), International Symposium on Geotechnical Safety and Risk 2015, Rotterdam, 13–16 October 2015b. Amsterdam: IOS Press, 745-751.
Stille, H. 1986. Experiences of design of large large caverns in Sweden. In: K. H. O. Saari (ed.), Proceedings of the International Symposium on Large Rock Caverns, Helsinki, 25-28 August 1986. Oxford: Pergamon Press, 231-241.
Stille, H. 1992. Keynote Lecture: Rock Support in Theory and Practice. In: K. McCreath (ed.), Rock Support in Mining and Underground Construction, Laurentian University, Sudbury, Ontario, Canada, 1992. Rotterdam, Brookfield: A.A. Balkema, 421-438.

64
BeFo Report 155
Stille, H., Andersson, J. & Olsson, L. 2003. Information based design in rock engineering. Stockholm: SveBeFo.
Stille, H. & Holmberg, M. 2006. En tillämpning av bayesiansk statistik för kontroll av tjockleken på sprutbetongförstärkning. Bergmekanikdag 2006. Stockholm: SveBeFo.
Stille, H., Holmberg, M. & Nord, G. 1989. Support of Weak Rock with Grouted Bolts and Shotcrete. International Journal of Rock Mechanics and Mining Sciences & Geomechanics Abstracts, 1(26), 99-113.
Stille, H., Holmberg, M., Olsson, L. & Andersson, J. 2005. Probability based design methods for underground excavations characterised by rock-structural interaction. Stockholm: SveBeFo.
Stille, H. & Palmström, A. 2008. Ground behaviour and rock mass composition in underground excavations. Tunnelling and Underground Space Technology, 23(1), 46-64.
Sturk, R., Olsson, L. & Johansson, J. 1996. Risk and decision analysis for large underground projects, as applied to the stockholm ring road tunnels. Tunnelling and Underground Space Technology, 11(2), 157-164.
Trafikverket 2011. TRVK Tunnel. Borlänge: Trafikverket. Vrouwenvelder, A.C.W.M. 2002. Developments towards full probabilistic design codes.
Structural Safety, 24(2), 417-432. You, K., Park, Y. & Lee, J.S. 2005. Risk analysis for determination of a tunnel support
pattern. Tunnelling and Underground Space Technology, 20(5), 479-486. Zeng, P., Senent, S. & Jimenez, R. 2014. Reliability analysis of circular tunnel face
stability obeying Hoek-Brown failure criterion considering different distribution types and correlation structures. Journal of Computing in Civil Engineering, 29.
Zetterlund, M., Norberg, T., Ericsson, L.O. & Rosén, L. 2011. Framework for value of information analysis in rock mass characterization for grouting purposes. Journal of Construction Engineering and Management, 137(7), 486-497.
Zhang, W. & Goh, A.T.C. 2012. Reliability assessment on ultimate and serviceability limit states and determination of critical factor of safety for underground rock caverns. Tunnelling and Underground Space Technology, 32, 221-230.
Zhao, H., Ru, Z., Chang, X., Yin, S. & Li, S. 2014. Reliability analysis of tunnel using least square support vector machine. Tunnelling and Underground Space Technology, 41, 14-23.

65
BeFo Report 155
APPENDIX A – REGRESSION ANALYSIS
To estimate the final deformation of the tunnel, a regression and an extrapolation can be performed. The regression can be performed in different ways. Holmberg and Stille (2007) presented a way of performing a regression analysis and extrapolation using specific weights to the points of measurement data. In this document, however, the regression analysis and extrapolation are performed with simple linear regression on a logarithmic scale. This is presented in the following section. The presentation is done in specific terms for the calculation example presented in section 5.3.4. The execution of the regression analysis is performed based on the information provided by Nau (2015). For a general presentation of the theory behind the regression analysis and for presentations in a more general case the reader is recommended to study the referred webpage or one of the many textbooks concerning this subject, e.g. Ang and Tang (2007) or Miller et al. (2014).
It should be noted that a regression analysis for extrapolation should be made with care. Extending the regression line outside the range of the measured data might give results that are unrealistic. The designer should therefore always compare the results with the expected values from the initial design.
The starting point of performing a linear regression is the simple equation of the regression line
where and b are the regression coefficients of the regression line, and the variable is dependent on variable . However, in many engineering applications, and also in this specific example, the relationship between the independent and dependent variable is not linear. There are different ways of solving this matter, out of which one is to transform the variables into a linear relationship. In this specific case, a logarithmic relation has been found suitable. Therefore, the independent variable is transformed into logarithmic space. The transformed values of the measurement data from Table 9 is presented in Table 10. As can be seen in Figure 14, the transformed data can be fitted with a straight line.
After the variables have been transformed into logarithmic space and a linear relationship, the values of the independent and the dependent variables can be normalized into

66
BeFo Report 155
Table 10-Values of the fictive displacement measurements and the transformed distance to the tunnel face.
Name Denot. Unit
Distance to the tunnel face
[-]
Radial deformation
[mm]
Figure 14-Measurements of deformation plotted against the logarithm of the distance to the tunnel face.
standardized values of and . The standardized values are described in units of standard deviations of the mean. The standardized values can be calculated as follows:
y = 2,2207x + 12,925R² = 0,9948
0
2
4
6
8
10
12
14
16
18
20
-3 -2 -1 0 1 2 3
Def
orm
atio
n (m
m)
Distance from measurement section to tunnel face [in ln(x/r)]
Measurements ofdeformation
Linjär (Measurementsof deformation)

67
BeFo Report 155
Using the standardized values of the independent and the dependent variable, the correlation coefficient, that is the coefficient describing the strength of the correlation between the independent and the dependent variable, can be estimated as:
Based on the correlation coefficient the regression coefficients can be calculated respectively as:
where is the least square estimate of the slope and is the least square estimate of the intercept. The value can be estimated by simply squaring
where the value describes how well the data fits the statistical model, i.e. the regression line in this case. The adjusted value can be estimated as
The is used because the regular value does not take into account the fact that two
degrees of freedom for error have been used when estimating the slope and the intercept. Based on the value the standard error of the regression can be calculated as:
Table 11 shows the calculated values after each displacement measurement in the calculation example. Figure 15 and Figure 16 show a snapshot of the estimated regression line after four measurements. The estimated regression equation stated in the figures is the equation that Excel estimates directly. As can be seen, it agrees with the calculated values after four measurements presented in Table 11.

68
BeFo Report 155
Table 11-Calculated regression coefficients after 3, 4, 5, 6, 7, and 8 deformation measurements respectively.
Name Denot. Unit
Correlation coefficient [-]
Regression coefficient [-]
Regression coefficient [-]
Figure 15- Result of the linear regression analysis after 4 measurements. The Distance to the tunnel face has been transformed into logarithmic values in order to illustrate the basics of the input to the linear regression.
y = 0,0021x + 0,0128R² = 0,9981
0,000
0,002
0,004
0,006
0,008
0,010
0,012
0,014
0,016
0,018
-3 -2 -1 0 1 2
Def
orm
atio
n (m
)
Distance from measurement section to tunnel face (ln(x/r))
Measurements ofdeformation
Linjär (Measurementsof deformation)

69
BeFo Report 155
Figure 16- Result of the regression analysis after 4 measurements.
y = 0,0021ln(x) + 0,0128R² = 0,9981
0,000
0,002
0,004
0,006
0,008
0,010
0,012
0,014
0,016
0,018
0,000 1,000 2,000 3,000 4,000
Def
orm
atio
n (m
)
Distance from measurement section to tunnel face (x/r)
Measurements ofdeformation
Log. (Measurements ofdeformation)


Box 5501SE-114 85 Stockholm
[email protected] • www.befoonline.org ISSN 1104-1773Visiting address: Storgatan 19


