energies Article Application of Response Surface Analysis to Evaluate the Effect of Concentrations of Ammonia and Propionic Acid on Acetate-Utilizing Methanogenesis Seung Gu Shin 1 , Joonyeob Lee 2 , Trong Hoan Do 3 , Su In Kim 2 and Seokhwan Hwang 2, * 1 Department of Energy Engineering, Future Convergence Technology Research Institute, Gyeongnam National University of Science and Technology, 33 Dongjin-ro, Jinju 52725, Gyeongnam, Korea 2 Division of Environmental Science and Engineering, Pohang University of Science and Technology, 77 Cheongam-ro, Nam-gu, Pohang 37673, Gyeongbuk, Korea 3 Vietnam Country Office, SEA Regional Program, 13th floor, HCMCC Tower, 249A Thuy Khue street, Tay Ho district, Hanoi 10000, Vietnam * Correspondence: [email protected]Received: 29 July 2019; Accepted: 1 September 2019; Published: 3 September 2019 Abstract: Ammonia and propionate are known inhibitors of anaerobic methanogenesis at higher concentrations, and are likely to coexist in digesters treating high-strength wastewater. Therefore, this study was conducted to assess the effects of ammonia and propionate on acetate-utilizing methanogenesis when they coexist. Response surface analysis with face-centered central composite design was used to explore the total ammonia nitrogen (TAN) level of 2–5 g/L and the propionate level of 2–8 g/L in acetate-fed batch incubation. Two models were successfully derived to estimate the lag period and the methane yield in response to the concentrations of the two chemicals. The lag period was affected by both inhibitors, with clues obtained of a synergistic effect at a higher concentration rage ([TAN] > 3.5 g/L and [propionate] > 5g/L). The methane yield was also affected by the two inhibitors; between the two, it was more significantly dependent on the TAN concentration than on the propionate concentration. Real-time PCR showed that Methanosarcinaceae was the major methanogen group in this system. The results of this study improve our understanding of the inhibition of biogas reactors. Keywords: anaerobic digestion; inhibition; response surface analysis; real-time PCR 1. Introduction The instability of anaerobic system due to the presence of various inhibitors certainly limits the applicability of anaerobic digestion. Although ammonia (NH 3 /NH 4 + ) is an important source of nitrogen for microbial growth in most environmental bioprocesses, a high level of its concentration has been considered as one of the major inhibitory effects associated in failure in numerous anaerobic digestions. Total ammonium-nitrogen (TAN) at a concentration in excess of 3.0 g/L, for example, is likely to be toxic to most anaerobes, especially methane producing bacteria (i.e., methanogens) [1]. This level of ammonia concentration is common in most agricultural wastewater, which has been subjected to anaerobic treatment [2]. An inhibitory mechanism by ammonia is primarily involved in passive transport of ammonia molecules across the cell membrane, resulting in disruption of proton motive force and/or homeostasis [3]. Propionic acid, one of the major volatile fatty acids (VFA) formed in acidogenesis of incoming organics to digestors, often accounts for up to 35% of the total methane produced in an anaerobic digestion [4]. This organic acid is not only one of the important major substrates in methanogenesis but the acid is also a major substance in high concentration that can cause instability of anaerobic digestion Energies 2019, 12, 3394; doi:10.3390/en12173394 www.mdpi.com/journal/energies
Transcript
energies
Article
Application of Response Surface Analysis to Evaluatethe Effect of Concentrations of Ammonia andPropionic Acid on Acetate-Utilizing Methanogenesis
Seung Gu Shin 1 , Joonyeob Lee 2 , Trong Hoan Do 3, Su In Kim 2 and Seokhwan Hwang 2,*1 Department of Energy Engineering, Future Convergence Technology Research Institute, Gyeongnam
National University of Science and Technology, 33 Dongjin-ro, Jinju 52725, Gyeongnam, Korea2 Division of Environmental Science and Engineering, Pohang University of Science and Technology,
Tay Ho district, Hanoi 10000, Vietnam* Correspondence: [email protected]
Received: 29 July 2019; Accepted: 1 September 2019; Published: 3 September 2019�����������������
Abstract: Ammonia and propionate are known inhibitors of anaerobic methanogenesis at higherconcentrations, and are likely to coexist in digesters treating high-strength wastewater. Therefore,this study was conducted to assess the effects of ammonia and propionate on acetate-utilizingmethanogenesis when they coexist. Response surface analysis with face-centered central compositedesign was used to explore the total ammonia nitrogen (TAN) level of 2–5 g/L and the propionatelevel of 2–8 g/L in acetate-fed batch incubation. Two models were successfully derived to estimatethe lag period and the methane yield in response to the concentrations of the two chemicals. Thelag period was affected by both inhibitors, with clues obtained of a synergistic effect at a higherconcentration rage ([TAN] > 3.5 g/L and [propionate] > 5 g/L). The methane yield was also affected bythe two inhibitors; between the two, it was more significantly dependent on the TAN concentrationthan on the propionate concentration. Real-time PCR showed that Methanosarcinaceae was themajor methanogen group in this system. The results of this study improve our understanding of theinhibition of biogas reactors.
The instability of anaerobic system due to the presence of various inhibitors certainly limitsthe applicability of anaerobic digestion. Although ammonia (NH3/NH4
+) is an important source ofnitrogen for microbial growth in most environmental bioprocesses, a high level of its concentrationhas been considered as one of the major inhibitory effects associated in failure in numerous anaerobicdigestions. Total ammonium-nitrogen (TAN) at a concentration in excess of 3.0 g/L, for example, islikely to be toxic to most anaerobes, especially methane producing bacteria (i.e., methanogens) [1]. Thislevel of ammonia concentration is common in most agricultural wastewater, which has been subjectedto anaerobic treatment [2]. An inhibitory mechanism by ammonia is primarily involved in passivetransport of ammonia molecules across the cell membrane, resulting in disruption of proton motiveforce and/or homeostasis [3].
Propionic acid, one of the major volatile fatty acids (VFA) formed in acidogenesis of incomingorganics to digestors, often accounts for up to 35% of the total methane produced in an anaerobicdigestion [4]. This organic acid is not only one of the important major substrates in methanogenesis butthe acid is also a major substance in high concentration that can cause instability of anaerobic digestion
systems [5]. The specific mechanism of propionate toxicity, however, has rarely been understoodcompared to those by ammonia. Although the extent of inhibition by propionic acid is controversial,an unionized form of propionate is reported to be more toxic than the ionized one [6,7].
Methanogens, the methane-producing obligate anaerobes, comprise two archaeal groups:acetoclastic (i.e., acetate utilizers) and hydrogenotrophic (i.e., H2/CO2 utilizers). Because aceticacid is known to be a precursor for more than 70% of methane formation in most anaerobiosis [6],acetoclastic methanogens are believed to play a key role in stabilizing the pollution load of wastewaterby participating in the terminal step, methanogenesis. The acetoclastic methanogens, however, aremore sensitive to the presence of inhibitors such as ammonia and propionic acid than hydrogenotrophicmethanogens [8,9].
Ammonia can originate from wastewater itself such as animal manure and the agriculturalwastewater [10] and from the degradation of proteinaceous wastewaters including the fish- ormeat-processing wastewaters [11]. Propionic acid mostly forms as a result of acidogenesis of organicsin the wastewater [6]. When an anaerobic digester is inhibited by ammonia or other inhibitors,VFAs are likely to accumulate and propionic acid often persists longer than other VFAs due tounfavorable thermodynamics and necessity of syntrophism for degradation [12]. Therefore, it isevident that ammonia and propionate are likely to coexist in most anaerobic digestion, and higherlevels of both compounds are expected when an incomplete methanation of VFAs occur initiated byammonia inhibition. Thus, understanding the effects of the inhibitory substances on the acetoclasticmethanation when they coexist is essential for an effective control of anaerobic digestion, especiallyfor animal manure and agricultural waste management. Although an individual inhibitory thresholdconcentration of ammonia or propionic acid can be found in literature [3,13–17], information aboutsimultaneous effects of the two potential inhibitors on acetoclastic methanation is lacking. Ammoniaand propionic acid may impose opposite effects on pH when they penetrate into microbial cells;ammonia would increase the intracellular pH while propionic acid would decrease it. This means thatthe two inhibitors are likely antagonistic when they coexist. In contrast, synergistic inhibition effectscaused by ammonia and some cations (i.e., Na+, K+, Ca2+, and Mg2+) have been reported [3].
This study aimed to investigate the inhibitory effects of ammonia and propionic acid concentrationson acetoclastic methanogenesis when they coexist, in a systematic manner using response surfaceanalysis (RSA) with a central composite design of experiment. The growth of acetoclastic methanogenswas also quantified using real-time PCR for further discussion.
2. Material and Methods
2.1. Design of Experiment and Variables
RSA, a collection of mathematical and statistical techniques useful for analyzing the effectsof several independent variables, is an iterative statistical technique to approximate multivariateresponses [18] with the following equation:
y = f (n∑
i=1
xi) + ε (1)
where, y, xi, and ε denotes the response of the expected output; independent variable with i = 1, . . . , n(n is the number of the independent variables); and the noise, respectively.
In this study, initial concentrations of TAN and propionate were the independent variables anddesignated as x1 and x2 (Equation (1)), respectively. Initial concentrations of each independent variablewere adjusted to 2.0–5.0 NH4-N/L and 2.0–8.0 g propionate/L. Ranges of the independent variableswere carefully decided based on relevant literature reviews [3,8,15,19,20]. The design boundaries alsofit the NH4-N (up to 4.9 g/L) and propionate (up to 6.8 g/L) levels of full-scale anaerobic digesters in 24biogas sites in a recent survey in Korea (data not shown). Two response variables were evaluated: thelag period and the methane yield.
Energies 2019, 12, 3394 3 of 13
A sequential procedure of collecting data, estimating polynomials with least squares method, andchecking the adequacy of the model [21] was used to investigate the effects on methane production andvariation in lag period of methanogenesis. Central composite design with a center point, replicated 3times, was used. Minitab program (version 17.1.0) was used to analyze the data statistically [22].
2.2. Inoculum and Inhibition Test
Acetic acid (12 g/L) with growth nutrients was used for all subsequent experiments, including theinoculation system and the batch tests. Concentration of the nutrients in the substrate solution (i.e., mg/L)is as follows [23–25]: KH2PO4 750, K2HPO4·3H2O 1450, NaCl 600, KCl 370, NH4Cl 816, MgSO4·7H2O247, nitrilotriacetic acid 40, FeCl3·6H2O 4.89, MnCl2·4H2O 0.9, CoCl2·6H2O 1.5, CaCl2·2H2O 20, ZnCl2anhydrous 0.9, CuCl2·2H2O 4.3, H3BO3 0.17, Na2MoO4·2H2O 0.09, Na2SeO3·5H2O 0.58, Na2SO4·10H2O260, NiCl2·6H2O 1.2, citric acid·H2O 210. Anaerobic seed sludge from a local municipal wastewatertreatment plant was cultivated in a lab-scale anaerobic continuously stirred tank reactor (CSTR) with6.0-L working volume to produce constant inoculum, which would minimize any confounding effectassociated with the use of inconsistent inoculum. The inoculum system was operated at 15 d hydraulicretention time at 35 ◦C, and the pH was maintained at 6.8 with 6.0 N NaOH and 3 N HCl, as describedpreviously [26]. Methane production, residual acetate concentration, and volatile suspended solids(VSS) concentration in the effluent became steady after 60 d of operation.
Eleven batch trials for RSA were performed using identical anaerobic glass bottles (Schott Duran,Germany) with working volume of 0.5 L. In addition, one control trial was also prepared in the samemanner but with no additional ammonia or propionate to the basal medium. Each bottle was equippedwith a gas-tight bag to monitor and store the biogas produced. Ammonium solution (NH4OH) andpropionic acid (>99%) were respectively used to give desired initial TAN and propionate concentrationsfor each trial. Each bottle was seeded (approximately 40% v/v) using the effluent from the inoculumCSTR to give 200 ± 20 mg VSS/L. Initial pH was adjusted to 6.8 using 6 N NaOH solution and allbottles were incubated at 35 ± 0.5 ◦C. The bottles were purged with N2 gas for 2 min at start-up toremove residual oxygen.
2.3. Analytical Methods
A gas chromatograph (6890 plus, Hewlett-Packard, CA), equipped with a HP Innowax capillarycolumn and a flame ionization detector, was used to measure acetic and propionic acid concentrations.Helium was the carrier gas at a flow rate of 2.5 mL/min with a split ratio of 10:1. All samples wereprepared by filtering through a 0.45 µm membrane filter. The filtered samples were acidified byinjecting formic acid (1/200 volume) to convert the fatty acids to their unionized forms before analysis.Biogas production volume was measured using a gas-tight syringe. An identical gas chromatograph(6890 plus), equipped with a GS-Carbon Plot capillary column and a thermal conductivity detector,was used to measure the biogas composition, including methane.
2.4. Real-Time PCR
Total DNA was extracted from the seed inoculum and the RSA trials at the end of batch operationusing a Magtration System 6GC (Precision System Science, Japan). The total archaea and the acetoclasticmethanogens were quantified using real-time PCR with following primer-probe sets: Archaea (ARC),Methanosarcinaceae (Msc), and Methanosaetaceae (Mst) [27]. Real-time PCR analysis was performedusing a LightCycler 1.2 system (Roche, Germany) as described previously [28].
Energies 2019, 12, 3394 4 of 13
3. Results
3.1. RSA Experiment
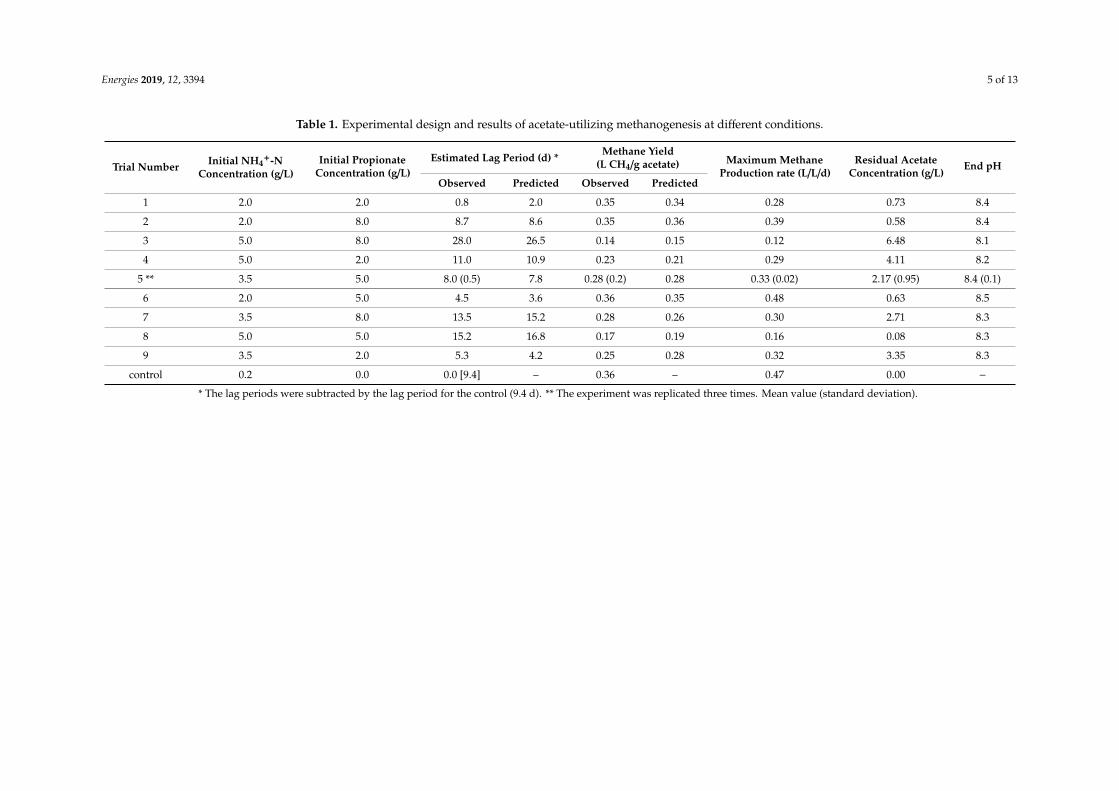
Twelve batch experiments, including the triplicate trials at the center and the control, wereconducted following the face-centered central composite design (Table 1). The batch trials wereoperated for 60 d until no biogas was produced (Figure 1). The lag period of incubation (unit of d)and the methane yield (unit of L CH4/g acetate fed) were estimated and used for the RSA analysis.Maximum methane production rate (unit of L/L/d) was also tested as a dependent variable (Table 1).However, models (1st to 2nd orders) derived from this parameter failed to pass the model validationcriteria (adjusted r2 > 0.8 and p < 0.05) and thus maximum methane production rate is not discussedfurther in this paper.
The acetate was initially fed at 12 g/L in all trials, but the residual acetic acid concentrationsat the end of the batch incubation were dissimilar, accounting for 100% (control) to 46% (trial 3)consumption (Table 1). The end-of-batch pH was between 8.1 and 8.5, within a typical pH range(6.5–8.5) of anaerobic digestion.
Energies 2019, 12, x FOR PEER REVIEW 4 of 12
3. Results
3.1. RSA Experiment
Twelve batch experiments, including the triplicate trials at the center and the control, were conducted following the face-centered central composite design (Table 1). The batch trials were operated for 60 d until no biogas was produced (Figure 1). The lag period of incubation (unit of d) and the methane yield (unit of L CH4/g acetate fed) were estimated and used for the RSA analysis. Maximum methane production rate (unit of L/L/d) was also tested as a dependent variable (Table 1). However, models (1st to 2nd orders) derived from this parameter failed to pass the model validation criteria (adjusted r2 > 0.8 and p < 0.05) and thus maximum methane production rate is not discussed further in this paper.
The acetate was initially fed at 12 g/L in all trials, but the residual acetic acid concentrations at the end of the batch incubation were dissimilar, accounting for 100% (control) to 46% (trial 3) consumption (Table 1). The end-of-batch pH was between 8.1 and 8.5, within a typical pH range (6.5–8.5) of anaerobic digestion.
Table 1. Experimental design and results of acetate-utilizing methanogenesis at different conditions.
control 0.2 0.0 0.0 [9.4] – 0.36 – 0.47 0.00 − * The lag periods were subtracted by the lag period for the control (9.4 d). ** The experiment was replicated three times. Mean value (standard deviation).
Figure 1. Profiles of methane production at different conditions. Blue, green and red colors representinitial TAN levels of 2.0 (N2), 3.5 (N3.5) and 5.0 (N5) g/L, respectively. Triangles (empty), circles(pale filled) and squares (filled) represent initial propionate levels of 2.0 (PA2), 5.0 (PA5) and 8.0 (PA8)g/L, respectively.
Energies 2019, 12, 3394 5 of 13
Table 1. Experimental design and results of acetate-utilizing methanogenesis at different conditions.
Trial Number Initial NH4+-N
Concentration (g/L)Initial Propionate
Concentration (g/L)Estimated Lag Period (d) * Methane Yield
(L CH4/g acetate) Maximum MethaneProduction rate (L/L/d)
* The lag periods were subtracted by the lag period for the control (9.4 d). ** The experiment was replicated three times. Mean value (standard deviation).
Energies 2019, 12, 3394 6 of 13
3.1.1. Lag Period
As shown in Figure 1, a lag phase was observed in all trials. The control showed a lag periodof 9.4 d, and this value was subtracted from the estimated lag periods of the other trials for furtherrepresentation and discussion (Table 1). The shortest lag phase (10.2 d overall; 0.8 d subtracted bythe control) was observed in trial 1, where the concentration of TAN and propionate were the lowest(2.0 g/L and 2.0 g/L, respectively). The longest lag phase (37.4 d overall; 28.0 d subtracted by thecontrol) was observed in trial 3, which was introduced to the highest TAN (5.0 g/L) and propionate(8.0 g/L) concentrations.
After comparing the polynomial models of 1st to 2nd orders, a quadratic model was selected to fitthe response of the lag period for the inhibition test:
where, RLP is the estimated response of the lag period, X1 is the TAN concentration, and X2 is thepropionate concentration. This model fitted well with the observed data (adjusted R2 = 0.95, p < 0.001;Table 2) and no significant lack-of-fit was detected (p > 0.05). This indicates a good agreement betweenthe experimental and the predicted data (Table 1). The residual plot confirmed that there was nosignificant pattern with regard to the fitted values (data not shown). Thus, the model (Equation (2)) issuggested to be able to accurately estimate the response surface within the study region.
Table 2. Significance of the response surface model and the coefficients for the lag period.
* df, degree of freedom. ** adjusted r2 of the model is 0.952.
Analysis of variance (ANOVA) was performed to validate the significance of the model terms(Table 2). Both the linear terms (TAN concentration, X1; propionate concentration, X2) were significant(p < 0.001). This is in agreement with the model prediction that the lag period increases monotonouslyaccording to the increase of both TAN and propionate concentrations (Figure 2). The interaction term(X1X2) was also statistically significant (p < 0.05), while the quadratic terms were only marginallysignificant (p~0.1). The significance of the interaction could be confirmed by the response surface(Figure 2) that the region with higher TAN and propionate concentration (i.e., over 3.5 g TAN/L and5.0 g propionate/L) showed the steepest slope for the lag period response.
Energies 2019, 12, 3394 7 of 13Energies 2019, 12, x FOR PEER REVIEW 6 of 12
Figure 2. Two-dimensional contour plot of the lag period within the experimental design.
3.1.2. Methane Yield
As shown in Figure 1, final methane production was not identical in different trials. The highest methane yield (0.36 L/g acetate) was observed in trial 6 (Table 1), where the TAN concentration was the lowest (2.0 g/L) but the propionate concentration was in the middle (5.0 g/L). The second and the third highest methane yield values (0.35 L/g acetate) were obtained in trials 1 and 2, respectively; the top three observations (0.35–0.36 L/g acetate) were made at the lowest TAN concentration. The lowest methane yield (0.14 L/g acetate) was observed in trial 3, which had the highest TAN (5.0 g/L) and propionate (8.0 g/L) concentrations.
After comparing the polynomial models of 1st to 2nd orders, a quadratic model was selected to fit the response of the methane yield: 𝑅 = 0.350 − 0.0102𝑋 + 0.0203𝑋 − 0.00481𝑋 𝑋 − 0.00300𝑋 − 0.00068𝑋 (3)
where, RMY is the estimated response of the methane yield, X1 is the TAN concentration, and X2 is the propionate concentration. This model fitted well with the observed data (adjusted R2 = 0.846, p = 0.008; Table 3) and no significant lack-of-fit was detected (p > 0.05). This indicates a good agreement between the experimental and the predicted data (Table 1). The residual plot confirmed that there was no significant pattern with regard to the fitted values (data not shown). Thus, the model (Equation (3)) is suggested to estimate the response surface with accuracy within the study region.
Table 3. Significance of the response surface model and the coefficients for the methane yield.
Model** – 5 12.00 0.008 * df, degree of freedom. ** adjusted r2 of the model is 0.846.
ANOVA was performed to validate the significance of the model terms (Table 3). Between the linear terms (TAN concentration, X1; propionate concentration, X2), only the TAN concentration (X1)
Figure 2. Two-dimensional contour plot of the lag period within the experimental design.
3.1.2. Methane Yield
As shown in Figure 1, final methane production was not identical in different trials. The highestmethane yield (0.36 L/g acetate) was observed in trial 6 (Table 1), where the TAN concentration was thelowest (2.0 g/L) but the propionate concentration was in the middle (5.0 g/L). The second and the thirdhighest methane yield values (0.35 L/g acetate) were obtained in trials 1 and 2, respectively; the topthree observations (0.35–0.36 L/g acetate) were made at the lowest TAN concentration. The lowestmethane yield (0.14 L/g acetate) was observed in trial 3, which had the highest TAN (5.0 g/L) andpropionate (8.0 g/L) concentrations.
After comparing the polynomial models of 1st to 2nd orders, a quadratic model was selected to fitthe response of the methane yield:
where, RMY is the estimated response of the methane yield, X1 is the TAN concentration, and X2 is thepropionate concentration. This model fitted well with the observed data (adjusted R2 = 0.846, p = 0.008;Table 3) and no significant lack-of-fit was detected (p > 0.05). This indicates a good agreement betweenthe experimental and the predicted data (Table 1). The residual plot confirmed that there was nosignificant pattern with regard to the fitted values (data not shown). Thus, the model (Equation (3)) issuggested to estimate the response surface with accuracy within the study region.
Table 3. Significance of the response surface model and the coefficients for the methane yield.
* df, degree of freedom. ** adjusted r2 of the model is 0.846.
Energies 2019, 12, 3394 8 of 13
ANOVA was performed to validate the significance of the model terms (Table 3). Between thelinear terms (TAN concentration, X1; propionate concentration, X2), only the TAN concentration (X1)was significant (p = 0.001). This is in agreement with the model prediction that the methane yielddecreases primarily due to the increase of the TAN concentration (Figure 3). The interaction (X1X2) andthe quadratic terms (X1
2, X22) were not statistically significant (p > 0.05) and no proof of interaction
was observed from the response surface (Figure 3).
Energies 2019, 12, x FOR PEER REVIEW 7 of 12
was significant (p = 0.001). This is in agreement with the model prediction that the methane yield decreases primarily due to the increase of the TAN concentration (Figure 3). The interaction (X1X2) and the quadratic terms (X12, X22) were not statistically significant (p > 0.05) and no proof of interaction was observed from the response surface (Figure 3).
Figure 3. Two-dimensional contour plot of the methane yield within the experimental design.
3.2. Methanogen Populations
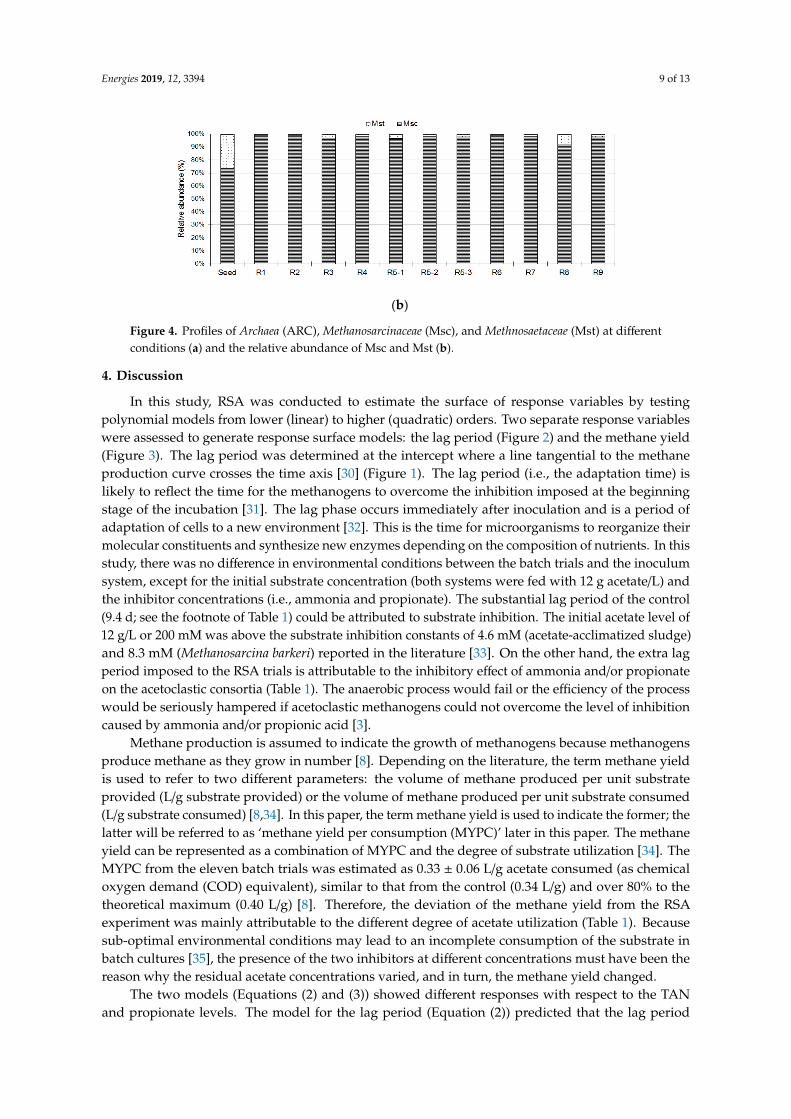
The populations of Archaea (ARC), Methanosarcinaceae (Msc), and Methanosaetaceae (Mst) by real-time PCR analysis were shown in Figure 4. Methanosarcinaceae and Methanosaetaceae are the two known families of methanogens that can directly utilize acetate to produce methane [29], while total archaea covers all methanogenic families of Msc and Mst. Both ARC (>2.4-fold) and Msc (>4.5-fold) showed a distinct growth in all trials, while nearly no growth of Mst was observed during the 60-d period. Between the two acetoclastic methanogen groups (i.e., Msc and Mst), Msc accounted for 74% of the population in the seed inoculum and increased to >92% at the end of the batch incubation (Figure 4b).
(a)
Figure 3. Two-dimensional contour plot of the methane yield within the experimental design.
3.2. Methanogen Populations
The populations of Archaea (ARC), Methanosarcinaceae (Msc), and Methanosaetaceae (Mst) byreal-time PCR analysis were shown in Figure 4. Methanosarcinaceae and Methanosaetaceae are the twoknown families of methanogens that can directly utilize acetate to produce methane [29], while totalarchaea covers all methanogenic families of Msc and Mst. Both ARC (>2.4-fold) and Msc (>4.5-fold)showed a distinct growth in all trials, while nearly no growth of Mst was observed during the 60-dperiod. Between the two acetoclastic methanogen groups (i.e., Msc and Mst), Msc accounted for 74%of the population in the seed inoculum and increased to >92% at the end of the batch incubation(Figure 4b).
Energies 2019, 12, x FOR PEER REVIEW 7 of 12
was significant (p = 0.001). This is in agreement with the model prediction that the methane yield decreases primarily due to the increase of the TAN concentration (Figure 3). The interaction (X1X2) and the quadratic terms (X12, X22) were not statistically significant (p > 0.05) and no proof of interaction was observed from the response surface (Figure 3).
Figure 3. Two-dimensional contour plot of the methane yield within the experimental design.
3.2. Methanogen Populations
The populations of Archaea (ARC), Methanosarcinaceae (Msc), and Methanosaetaceae (Mst) by real-time PCR analysis were shown in Figure 4. Methanosarcinaceae and Methanosaetaceae are the two known families of methanogens that can directly utilize acetate to produce methane [29], while total archaea covers all methanogenic families of Msc and Mst. Both ARC (>2.4-fold) and Msc (>4.5-fold) showed a distinct growth in all trials, while nearly no growth of Mst was observed during the 60-d period. Between the two acetoclastic methanogen groups (i.e., Msc and Mst), Msc accounted for 74% of the population in the seed inoculum and increased to >92% at the end of the batch incubation (Figure 4b).
(a)
Figure 4. Cont.
Energies 2019, 12, 3394 9 of 13Energies 2019, 12, x FOR PEER REVIEW 8 of 12
(b)
Figure 4. Profiles of Archaea (ARC), Methanosarcinaceae (Msc), and Methnosaetaceae (Mst) at different conditions (a) and the relative abundance of Msc and Mst (b).
4. Discussion
In this study, RSA was conducted to estimate the surface of response variables by testing polynomial models from lower (linear) to higher (quadratic) orders. Two separate response variables were assessed to generate response surface models: the lag period (Figure 2) and the methane yield (Figure 3). The lag period was determined at the intercept where a line tangential to the methane production curve crosses the time axis [30] (Figure 1). The lag period (i.e., the adaptation time) is likely to reflect the time for the methanogens to overcome the inhibition imposed at the beginning stage of the incubation [31]. The lag phase occurs immediately after inoculation and is a period of adaptation of cells to a new environment [32]. This is the time for microorganisms to reorganize their molecular constituents and synthesize new enzymes depending on the composition of nutrients. In this study, there was no difference in environmental conditions between the batch trials and the inoculum system, except for the initial substrate concentration (both systems were fed with 12 g acetate/L) and the inhibitor concentrations (i.e., ammonia and propionate). The substantial lag period of the control (9.4 d; see the footnote of Table 1) could be attributed to substrate inhibition. The initial acetate level of 12 g/L or 200 mM was above the substrate inhibition constants of 4.6 mM (acetate-acclimatized sludge) and 8.3 mM (Methanosarcina barkeri) reported in the literature [33]. On the other hand, the extra lag period imposed to the RSA trials is attributable to the inhibitory effect of ammonia and/or propionate on the acetoclastic consortia (Table 1). The anaerobic process would fail or the efficiency of the process would be seriously hampered if acetoclastic methanogens could not overcome the level of inhibition caused by ammonia and/or propionic acid [3].
Methane production is assumed to indicate the growth of methanogens because methanogens produce methane as they grow in number [8]. Depending on the literature, the term methane yield is used to refer to two different parameters: the volume of methane produced per unit substrate provided (L/g substrate provided) or the volume of methane produced per unit substrate consumed (L/g substrate consumed) [8,34]. In this paper, the term methane yield is used to indicate the former; the latter will be referred to as ‘methane yield per consumption (MYPC)’ later in this paper. The methane yield can be represented as a combination of MYPC and the degree of substrate utilization [34]. The MYPC from the eleven batch trials was estimated as 0.33 ± 0.06 L/g acetate consumed (as chemical oxygen demand (COD) equivalent), similar to that from the control (0.34 L/g) and over 80% to the theoretical maximum (0.40 L/g) [8]. Therefore, the deviation of the methane yield from the RSA experiment was mainly attributable to the different degree of acetate utilization (Table 1). Because sub-optimal environmental conditions may lead to an incomplete consumption of the substrate in batch cultures [35], the presence of the two inhibitors at different concentrations must have been the reason why the residual acetate concentrations varied, and in turn, the methane yield changed.
Figure 4. Profiles of Archaea (ARC), Methanosarcinaceae (Msc), and Methnosaetaceae (Mst) at differentconditions (a) and the relative abundance of Msc and Mst (b).
4. Discussion
In this study, RSA was conducted to estimate the surface of response variables by testingpolynomial models from lower (linear) to higher (quadratic) orders. Two separate response variableswere assessed to generate response surface models: the lag period (Figure 2) and the methane yield(Figure 3). The lag period was determined at the intercept where a line tangential to the methaneproduction curve crosses the time axis [30] (Figure 1). The lag period (i.e., the adaptation time) islikely to reflect the time for the methanogens to overcome the inhibition imposed at the beginningstage of the incubation [31]. The lag phase occurs immediately after inoculation and is a period ofadaptation of cells to a new environment [32]. This is the time for microorganisms to reorganize theirmolecular constituents and synthesize new enzymes depending on the composition of nutrients. In thisstudy, there was no difference in environmental conditions between the batch trials and the inoculumsystem, except for the initial substrate concentration (both systems were fed with 12 g acetate/L) andthe inhibitor concentrations (i.e., ammonia and propionate). The substantial lag period of the control(9.4 d; see the footnote of Table 1) could be attributed to substrate inhibition. The initial acetate level of12 g/L or 200 mM was above the substrate inhibition constants of 4.6 mM (acetate-acclimatized sludge)and 8.3 mM (Methanosarcina barkeri) reported in the literature [33]. On the other hand, the extra lagperiod imposed to the RSA trials is attributable to the inhibitory effect of ammonia and/or propionateon the acetoclastic consortia (Table 1). The anaerobic process would fail or the efficiency of the processwould be seriously hampered if acetoclastic methanogens could not overcome the level of inhibitioncaused by ammonia and/or propionic acid [3].
Methane production is assumed to indicate the growth of methanogens because methanogensproduce methane as they grow in number [8]. Depending on the literature, the term methane yieldis used to refer to two different parameters: the volume of methane produced per unit substrateprovided (L/g substrate provided) or the volume of methane produced per unit substrate consumed(L/g substrate consumed) [8,34]. In this paper, the term methane yield is used to indicate the former; thelatter will be referred to as ‘methane yield per consumption (MYPC)’ later in this paper. The methaneyield can be represented as a combination of MYPC and the degree of substrate utilization [34]. TheMYPC from the eleven batch trials was estimated as 0.33 ± 0.06 L/g acetate consumed (as chemicaloxygen demand (COD) equivalent), similar to that from the control (0.34 L/g) and over 80% to thetheoretical maximum (0.40 L/g) [8]. Therefore, the deviation of the methane yield from the RSAexperiment was mainly attributable to the different degree of acetate utilization (Table 1). Becausesub-optimal environmental conditions may lead to an incomplete consumption of the substrate inbatch cultures [35], the presence of the two inhibitors at different concentrations must have been thereason why the residual acetate concentrations varied, and in turn, the methane yield changed.
The two models (Equations (2) and (3)) showed different responses with respect to the TANand propionate levels. The model for the lag period (Equation (2)) predicted that the lag period
Energies 2019, 12, 3394 10 of 13
increases monotonously according to the increase of both TAN and propionate concentrations (Figure 2).The conditions for the shortest and the longest lag period were clearly represented at the boundaryconditions (i.e., 2.0 g TAN/L and 2.0 g propionate/L for the former, 5.0 g TAN/L and 8.0 g propionate/Lfor the latter). The response surface demonstrated that both inhibitors contributed to the lag period(Figure 2), which was also confirmed by the similar p-value levels for X1 and X2 from the ANOVA(Table 2). The statistical significance (p < 0.05) of the interaction term (X1X2) indicated that the twoinhibitors (ammonia and propionate) are likely to interact synergistically (i.e., positive coefficient ofthis term). Accordingly, the region with higher TAN and propionate concentrations (i.e., over 3.5 gTAN/L and 5.0 g propionate/L) showed the steepest slope for the lag period response (upper rightcorner of Figure 2a).
The response model for the methane yield (Equation (3)) exhibited a different pattern. Theresponse surface contour implied that the TAN concentration affected the methane yield more clearlythan the propionate concentration did (Figure 3), and no distinct interaction (neither positive nornegative) between the two parameters was noticed from the response surface (Figure 3) or the ANOVA(term X1X2, Table 3). Instead, the methane yield seems to have depended more significantly on theTAN concentration (Figure 3). This means that ammonia imposes a negative effect on the acetateutilization at lower concentrations, probably by affecting the substrate affinity level.
The pH is regarded as a determining factor for certain types of inhibition for anaerobic digestion [3].As a weak base, ammonia tends to dissociate into ammonium (NH4
+) in aqueous solution, with moredissociation at a lower pH. Between the two forms, free ammonia (NH3), the undissociated form,has been ascribed to the toxicity for methanogenesis [1]. Likewise, the undissociated propionic acid(C2H5COOH), preferably formed at a lower pH, has been suggested as the more toxic form thanthe dissociated propionate (C2H5COO−) [5]. Therefore, the inhibitory effects of the two chemicalsresponse to the pH in an opposite direction. In this study, the initial pH of the batch experimentswas set to 6.8, where 0.4% of total ammonia and 1.2% of total propionic acid are expected to be at themore toxic, undissociated forms. On the other hand, the pH at the end of the batch trials were 8.1–8.5(Table 1), where the undissociated forms account for 0.7–1.8% total ammonia and only 0.02%–0.05%total propionic acid. These trends correspond well with our results that propionate inhibition wasmore significant for the lag period (Table 2), which was determined at earlier stage of the batch culture,than for the methane yield (Table 3), which was governed by the residual acetate concentration at theend of the reaction.
The degree of inhibition detected in this study varied significantly according to the two inhibitorlevels. No direct comparison of these results to the literature could be made because this is the firststudy, to the best of our knowledge, to investigate the co-existing effects of the two inhibitors onacetate-utilizing methanogenesis. Individual effects of ammonia and propionate have been reported:1.7–14 g TAN/L [1,3,8,20,36] and 0.8–8.0 g propionate/L [5,16,37,38] as inhibition threshold. In thisstudy, more than 50% inhibition of methane yield and maximum methane production rate was detectedfrom trials 3 and 8, where [TAN] = 5.0 g/L and [propionate] = 5.0 or 8.0 g/L (Table 1). Consideringthat acetate is the most important intermediate in the anaerobic food chain, minimizing the inhibitoryeffects of these two chemicals would be crucial for an efficient operation of an anaerobic digester.Because ammonia is often generated in the digester when a protein-rich substrate, such as agriculturalwaste and wastewater, is degraded, a well-functioning digester is likely to have a considerable level ofTAN. Therefore, keeping the propionate concentration as low as possible by avoiding overloadingand balancing the propionate formation and oxidation would be a practical strategy to minimize thecombined inhibition [37,39]. Using the models obtained in this study would provide some quantitativeprojections of the inhibitions potentially imposed by ammonia and propionate.
In this study, Msc was evidently the major methanogens that converted acetate to methane(Figure 4). The competition for acetate between Msc and Mst was well documented based on theirgrowth kinetics [6] and various case studies [29,40,41]. Msc, an R-strategist, has a high maximumgrowth rate (R) but a poor substrate affinity (K), while Mst, an K-strategist, has a high substrate
Energies 2019, 12, 3394 11 of 13
affinity but a lower maximum growth rate [6]. Thus Msc has been found dominant groups in arelatively high residual acetic acid concentration [29,40]. The high initial acetate concentration inthe batch system (12 g/L) should have been the key factor that favored the growth of Msc in thisstudy. Comparison between the inhibition trials (trials 1–9) indicated that less growth of Msc wasobserved with higher propionate concentrations and less growth of Mst was noticed with higherTAN concentrations (Figure 4a). However, these trends were not statistically significant and furtherinvestigation is necessary to confirm these trends.
Author Contributions: S.H. was the principal investigator of this project and conceived the experiments. S.G.S. andT.H.D. performed the experiments. S.G.S., J.L. and T.H.D. analyzed the data. S.G.S. and J.L. wrote the manuscript.S.G.S., S.I.K. and S.H. revised the manuscript. All authors read, reviewed, and approved the manuscript.
Funding: This work was financially supported by the Korea Institute of Energy Technology Evaluationand Planning (KETEP) and the Ministry of Trade, Industry & Energy (MOTIE) of the Republic of Korea(No. 20163030091560). This work was also supported by ‘Human Resources Program in Energy Technology’ of theKETEP Grant, funded by the MOTIE, Republic of Korea (No. 20144030200460).
Conflicts of Interest: The authors have no conflict of interest to disclose.
References
1. Yenigün, O.; Demirel, B. Ammonia inhibition in anaerobic digestion: A review. Process Biochem. 2013, 48,901–911. [CrossRef]
2. Westerholm, M.; Moestedt, J.; Schnürer, A. Biogas production through syntrophic acetate oxidation anddeliberate operating strategies for improved digester performance. Appl. Energy 2016, 179, 124–135.[CrossRef]
3. Chen, Y.; Cheng, J.J.; Creamer, K.S. Inhibition of anaerobic digestion process: A review. Bioresour. Technol.2008, 99, 4044–4064. [CrossRef] [PubMed]
4. Dong, X.; Plugge, C.M.; Stams, A.J.M. Anaerobic degradation of propionate by a mesophilic acetogenicbacterium in coculture and triculture with different methanogens. Appl. Environ. Microbiol. 1994, 60,2834–2838. [PubMed]
5. Dogan, T.; Ince, O.; Oz, N.A.; Ince, B.K. Inhibition of volatile fatty acid production in granular sludge from aUASB reactor. J. Environ. Sci. Health 2005, 40, 633–644. [CrossRef]
7. Dhaked, R.K.; Waghmare, C.K.; Alam, S.I.; Kamboj, D.V.; Singh, L. Effect of propionate toxicity onmethanogenesis of night soil at phychrophilic temperature. Bioresour. Technol. 2003, 87, 299–303. [CrossRef]
8. Speece, R.E. Anaerobic Biotechnology for Industrial Wastewaters, 1st ed.; Archae Press: Nashville, TN, USA,1996; ISBN 978-09-6502-260-6.
9. Westerholm, M.; Levén, L.; Schnürer, A. Bioaugmentation of syntrophic acetate-oxidizing culture in biogasreactors exposed to increasing levels of ammonia. Appl. Environ. Microbiol. 2012, 78, 7619–7625. [CrossRef]
10. Ho, L.; Ho, G. Mitigating ammonia inhibition of thermophilic anaerobic treatment of digested piggerywastewater: Use of pH reduction, zeolite, biomass and humic acid. Water Res. 2012, 46, 4339–4350. [CrossRef]
11. Chowdhury, P.; Viraraghavan, T.; Srinivasan, A. Biological treatment processes for fish processingwastewater–A review. Bioresour. Technol. 2010, 101, 439–449. [CrossRef]
12. Stams, A.J.M.; Plugge, C.M. Electron transfer in syntrophic communities of anaerobic bacteria and archaea.Nat. Rev. Microbiol. 2009, 7, 568–577. [CrossRef]
13. Barredo, M.S.; Evison, L.M. Effect of propionate toxicity on methanogen-enriched sludge, Methanobrevibactersmithii, and Methanospirillum hungatii at different pH values. Appl. Environ. Microbiol. 1991, 57, 1764–1769.[PubMed]
14. Mösche, M.; Jördening, H.-J. Comparison of different models of substrate and product inhibition in anaerobicdigestion. Water Res. 1999, 33, 2545–2554. [CrossRef]
15. Aguilar, A.; Casas, C.; Lema, J.M. Degradation of volatile fatty acids by differently enriched methanogeniccultures: Kinetics and inhibition. Water Res. 1995, 29, 505–509. [CrossRef]
16. Li, Y.; Zhang, Y.; Sun, Y.; Wu, S.; Kong, X.; Yuan, Z.; Dong, R. The performance efficiency of bioaugmentationto prevent anaerobic digestion failure from ammonia and propionate inhibition. Bioresour. Technol. 2017, 231,94–100. [CrossRef] [PubMed]
17. Zhang, C.; Yuan, Q.; Lu, Y. Inhibitory effects of ammonia on syntrophic propionate oxidation in anaerobicdigester sludge. Water Res. 2018, 146, 275–287. [CrossRef] [PubMed]
18. Myers, R.H.; Montgomery, D.C.; Anderson-Cook, C.M. Response Surface Methodology: Process andProduct Optimization Using Designed Experiments, 1st ed.; John Wiley & Sons: Hoboken, NJ, USA, 2016;ISBN 978-11-1891-601-8.
19. Gallert, C.; Bauer, S.; Winter, J. Effect of ammonia on the anaerobic degradation of protein by a mesophilicand thermophilic biowaste population. Appl. Microbiol. Biotechnol. 1998, 50, 495–501. [CrossRef] [PubMed]
20. Gallert, C.; Winter, J. Mesophilic and thermophilic anaerobic digestion of source-sorted organic wastes: Effectof ammonia on glucose degradation and methane production. Appl. Microbiol. Biotechnol. 1997, 48, 405–410.[CrossRef]
21. Han, G.; Shin, S.G.; Lee, J.; Lee, C.; Jo, M.; Hwang, S. Mesophilic acidogenesis of food waste-recyclingwastewater: Effects of hydraulic retention time, pH, and temperature. Appl. Biochem. Biotech. 2016, 180,980–999. [CrossRef]
22. Minitab_LLC. Minitab-Data Analysis, Statistical & Process Imporvement Tools. Available online: https://www.minitab.com (accessed on 29 July 2019).
23. Zoetemeyer, R.J.; Arnoldy, P.; Cohen, A.; Boelhouwer, C. Influence of temperature on the anaerobicacidification of glucose in a mixed culture forming part of a two-stage digestion process. Water Res. 1982, 16.[CrossRef]
24. Atlas, R.M. Handbook of Microbiological Media, 2nd ed.; CRC Press: Boca Raton, FL, USA, 2006;ISBN 978-08-4933-561-7.
25. Clarens, M.; Molleta, R. Kinetic studies of acetate fermentation by Methanosarcina sp. MSTA-1.Appl. Microbiol. Biotechnol. 1990, 33, 239–244. [CrossRef]
26. Shin, S.G.; Lee, C.; Hwang, K.; Ahn, J.-H.; Hwang, S. Use of order-specific primers to investigate themethanogenic diversity in acetate enrichment system. J. Ind. Microbiol. Biotechnol. 2008, 35, 1345–1352.[CrossRef] [PubMed]
27. Yu, Y.; Lee, C.; Kim, J.; Hwang, S. Group-specific primer and probe sets to detect methanogenic communitiesusing quantitative real-time polymerase chain reaction. Biotechnol. Bioeng. 2005, 89, 670–679. [CrossRef][PubMed]
28. Song, M.; Shin, S.G.; Hwang, S. Methanogenic population dynamics assessed by real-time quantitative PCRin sludge granule in upflow anaerobic sludge blanket treating swine wastewater. Bioresour. Technol. 2010,101, S23–S28. [CrossRef] [PubMed]
29. Niu, Q.; Kobayashi, T.; Takemura, Y.; Kubota, K.; Li, Y.-Y. Evaluation of functional microbial community’sdifference in full-scale and lab-scale anaerobic digesters feeding with different organic solid waste: Effects ofsubstrate and operation factors. Bioresour. Technol. 2015, 193, 110–118. [CrossRef]
30. Do, H.; Lim, J.; Shin, S.G.; Wu, Y.-J.; Ahn, J.-H.; Hwang, S. Simultaneous effect of temperature, cyanide andammonia-oxidizing bacteria concentrations on ammonia oxidation. J. Ind. Microbiol. Biotechnol. 2008, 35,1331–1338. [CrossRef] [PubMed]
31. Xie, S.; Lawlor, P.G.; Frost, J.P.; Hu, Z.; Zhan, X. Effect of pig manure to grass silage ratio on methaneproduction in batch anaerobic co-digestion of concentrated pig manure and grass silage. Bioresour. Technol.2011, 102, 5728–5733. [CrossRef]
32. Shuler, M.L.; Kargi, F. Bioprocess Engineering: Basic Concepts, 2nd ed.; Prentice Hall: Upper Saddle River, NJ,USA, 2001; ISBN 978-01-3081-908-6.
33. Fukuzaki, S.; Nishio, N.; Nagai, S. Kinetics of the methanogenic fermentation of acetate.Appl. Environ. Microbiol. 1990, 56, 3158–3163.
34. Farghaly, A.; Tawfik, A. Simultaneous hydrogen and methane production through multi-phase anaerobicdigestion of paperboard mill wastewater under different operating conditions. Appl. Biochem. Biotech. 2017,181, 142–156. [CrossRef] [PubMed]
35. Gonçalves, L.M.D.; Ramos, A.; Almeida, J.S.; Xavier, A.M.R.B.; Carrondo, M.J.T. Elucidation of themechanism of lactic acid growth inhibition and production in batch cultures of Lactobacillus rhamnosus.Appl. Microbiol. Biotechnol. 1997, 48, 346–350. [CrossRef]
36. Rajagopal, R.; Massé, D.I.; Singh, G. A critical review on inhibition of anaerobic digestion process by excessammonia. Bioresour. Technol. 2013, 143, 632–641. [CrossRef]
37. Ma, J.; Carballa, M.; Van De Caveye, P.; Verstraete, W. Enhanced propionic acid degradation (EPAD) system:Proof of principle and feasibility. Water Res. 2009, 43, 3239–3248. [CrossRef] [PubMed]
38. Wang, Y.; Zhang, Y.; Wang, J.; Meng, L. Effects of volatile fatty acid concentrations on methane yield andmethanogenic bacteria. Biomass Bioenerg. 2009, 33, 848–853. [CrossRef]
39. Tale, V.P.; Maki, J.S.; Struble, C.A.; Zitomer, D.H. Methanogen community structure-activity relationship andbioaugmentation of overloaded anaerobic digesters. Water Res. 2011, 45, 5249–5256. [CrossRef] [PubMed]
40. Yu, Y.; Lee, C.; Hwang, S. Analysis of community structures in anaerobic processes using a quantitativereal-time PCR method. Water Sci. Technol. 2005, 52, 85–91. [CrossRef] [PubMed]
41. Regueiro, L.; Lema, J.M.; Carballa, M. Key microbial communities steering the functioning of anaerobicdigesters during hydraulic and organic overloading shocks. Bioresour. Technol. 2015, 197, 208–216. [CrossRef][PubMed]