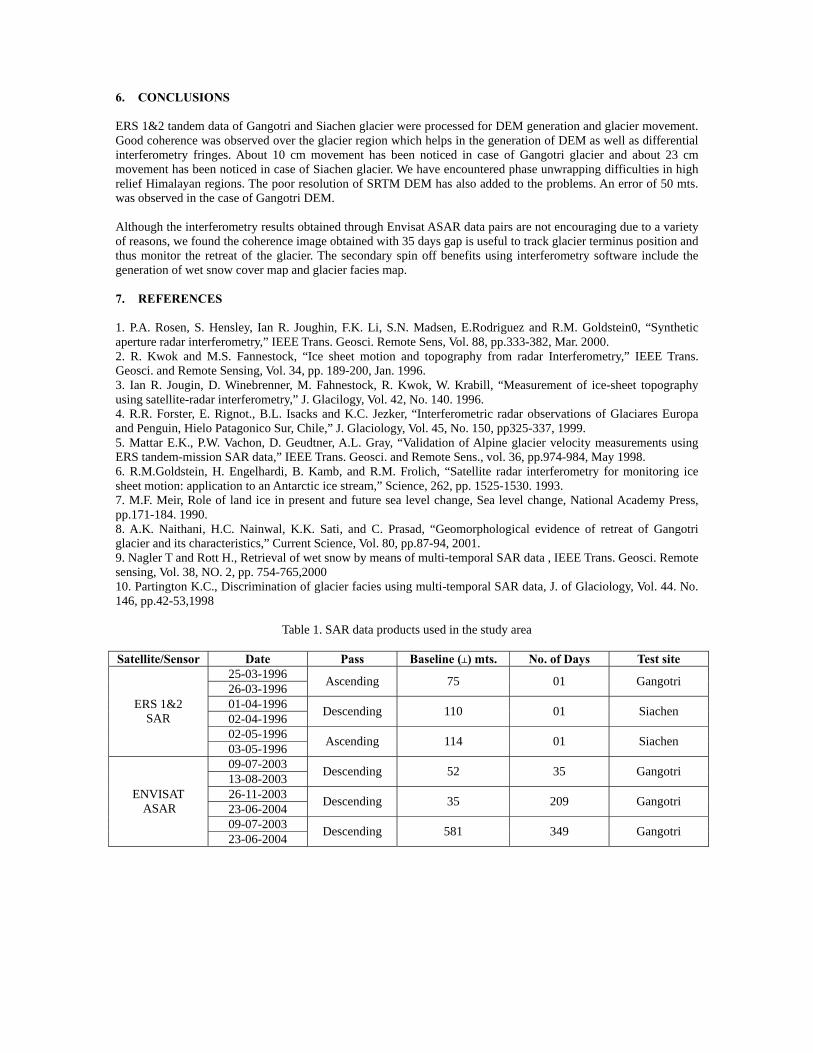
Application of SAR Interferometry for Himalayan Glaciers G. Venkataraman (1) , Y. S. Rao (1) , K. S. Rao (2) (1) Centre of Studies in Resources Engineering, Indian Institute of Technology, Powai, Mumbai-400076, India (2) Department of Physics, Kuwait University, Safat 13060, Kuwait Abstract: With the help of ERS 1 and 2 tandem data, we have produced DEM and glacier movement of two major Himalayan glaciers in India. The glaciers showed good correlation but the surrounding areas had more decorrelation. Contours generated with ERS 1 and 2 SAR tandem data are comparable with topographic maps. We have used SRTM DEM to study the glacier movement involving two-pass differential method. Through the differential interferogram over Gangotri 8.4 cm displacement in the radar look direction represented by 3 fringes has been observed. Siachen glacier exhibits a displacement of 22 cm represented by 8 fringes. However the results obtained with limited data sets of Envisat ASAR data are not highly encouraging. This is mainly due to the longer time interval between data sets and also unfavorable baseline conditions. But the glacier terminus of Gangotri glacier is clearly visible in the coherence image and thus it may help to monitor the retreat of this glacier. Further the generation of color composite with the registration of multitemporal SAR images could help in mapping different zones and facies of the glacier. Key words: SAR Interferometry, DEM, movement, and glacier. 1. INTRODUCTION Surface topography controls the driving and resisting forces responsible for ice motion, hence topographic data are essential and important for glacier and ice sheet research. High-resolution altitude information is critical to determining total ice volume and ice extent. Time series analysis always helps to estimate the rate and nature of changes. SAR Interferometry is capable of generating topography and to observe movement of glaciers [1]-[6]. To study the mountain glaciers, it is essential to generate high-resolution elevation data. Compared to polar ice sheets, mountain glaciers are smaller in volume and hence more responsive to climate change on short time scales. Mountain glaciers also play a major role in sea level changes [7]. Most of the work related to SAR Interferometry for ice and glacier are generally confined to Polar Regions. Mountainous regions like Himalayan region with high relief cause layover and shadow in SAR images. Application of SAR Interferometry is very critical for these regions. Hence an attempt is made to apply SAR Interferometry for Gangotri glacier in Uttaranchal and Siachen glacier in Jammu and Kashmir, India. Further detailed digital elevation models are not available for these regions. The only source possible are the Survey of India toposheets which could be digitized to extract height information in digital form, but then these toposheets are not very frequently updated and hence may become redundant over a period of time, as the elevations would change with the presence of dynamic glaciers and ubiquitous snow cover. 2. STUDY AREA Gangotri and Siachen glaciers form the study area of this work. Gangotri glacier located in Uttaranchal state of India form the major source of water for the major part of northern India. According to some earlier studies [8] this glacier is retreating at the rate of 19 m/yr. This glacier is about 26 km long with a maximum width of 2.4 km. This is the only glacier in India, which flows from south to north initially and then turns south later. Siachen glacier located in Jammu and Kashmir state of India, is the longest glacier outside the polar region. This glacier is located at the highest elevation of about 5600 mts. It’s length is 78 km with width varying from 2 to 6 km. Both the glaciers are complex in nature having many tributaries contributing to the total flow. 3. SAR DATA PRODUCTS ERS 1 and 2 tandem data sets available for Gangotri and Siachen glaciers were used for this study. Three pairs of Envisat ASAR data were available with us for Gangotri glacier and these products were also used for Interferometry studies. The details regarding ERS 1 and 2 tandem data and Envisat ASAR data used in this study are presented in Table 1. SRTM DEM data used in this study were downloaded from the USGS website ftp://edcftp.cr.usgs.gov . This data has a spatial resolution of 90m X 90m with 1201 X 1201 pixels as one tile, i.e 1 Deg X 1Deg. The values are 16 bit signed integer and the DEM file is in raw format without any header.
Transcript
Application of SAR Interferometry for Himalayan Glaciers
G. Venkataraman (1), Y. S. Rao (1), K. S. Rao (2)
(1) Centre of Studies in Resources Engineering, Indian Institute of Technology, Powai, Mumbai-400076, India (2) Department of Physics, Kuwait University, Safat 13060, Kuwait
Abstract: With the help of ERS 1 and 2 tandem data, we have produced DEM and glacier movement of two major Himalayan glaciers in India. The glaciers showed good correlation but the surrounding areas had more decorrelation. Contours generated with ERS 1 and 2 SAR tandem data are comparable with topographic maps. We have used SRTM DEM to study the glacier movement involving two-pass differential method. Through the differential interferogram over Gangotri 8.4 cm displacement in the radar look direction represented by 3 fringes has been observed. Siachen glacier exhibits a displacement of 22 cm represented by 8 fringes. However the results obtained with limited data sets of Envisat ASAR data are not highly encouraging. This is mainly due to the longer time interval between data sets and also unfavorable baseline conditions. But the glacier terminus of Gangotri glacier is clearly visible in the coherence image and thus it may help to monitor the retreat of this glacier. Further the generation of color composite with the registration of multitemporal SAR images could help in mapping different zones and facies of the glacier. Key words: SAR Interferometry, DEM, movement, and glacier. 1. INTRODUCTION Surface topography controls the driving and resisting forces responsible for ice motion, hence topographic data are essential and important for glacier and ice sheet research. High-resolution altitude information is critical to determining total ice volume and ice extent. Time series analysis always helps to estimate the rate and nature of changes. SAR Interferometry is capable of generating topography and to observe movement of glaciers [1]-[6]. To study the mountain glaciers, it is essential to generate high-resolution elevation data. Compared to polar ice sheets, mountain glaciers are smaller in volume and hence more responsive to climate change on short time scales. Mountain glaciers also play a major role in sea level changes [7]. Most of the work related to SAR Interferometry for ice and glacier are generally confined to Polar Regions. Mountainous regions like Himalayan region with high relief cause layover and shadow in SAR images. Application of SAR Interferometry is very critical for these regions. Hence an attempt is made to apply SAR Interferometry for Gangotri glacier in Uttaranchal and Siachen glacier in Jammu and Kashmir, India. Further detailed digital elevation models are not available for these regions. The only source possible are the Survey of India toposheets which could be digitized to extract height information in digital form, but then these toposheets are not very frequently updated and hence may become redundant over a period of time, as the elevations would change with the presence of dynamic glaciers and ubiquitous snow cover. 2. STUDY AREA Gangotri and Siachen glaciers form the study area of this work. Gangotri glacier located in Uttaranchal state of India form the major source of water for the major part of northern India. According to some earlier studies [8] this glacier is retreating at the rate of 19 m/yr. This glacier is about 26 km long with a maximum width of 2.4 km. This is the only glacier in India, which flows from south to north initially and then turns south later. Siachen glacier located in Jammu and Kashmir state of India, is the longest glacier outside the polar region. This glacier is located at the highest elevation of about 5600 mts. It’s length is 78 km with width varying from 2 to 6 km. Both the glaciers are complex in nature having many tributaries contributing to the total flow. 3. SAR DATA PRODUCTS ERS 1 and 2 tandem data sets available for Gangotri and Siachen glaciers were used for this study. Three pairs of Envisat ASAR data were available with us for Gangotri glacier and these products were also used for Interferometry studies. The details regarding ERS 1 and 2 tandem data and Envisat ASAR data used in this study are presented in Table 1. SRTM DEM data used in this study were downloaded from the USGS website ftp://edcftp.cr.usgs.gov. This data has a spatial resolution of 90m X 90m with 1201 X 1201 pixels as one tile, i.e 1 Deg X 1Deg. The values are 16 bit signed integer and the DEM file is in raw format without any header.
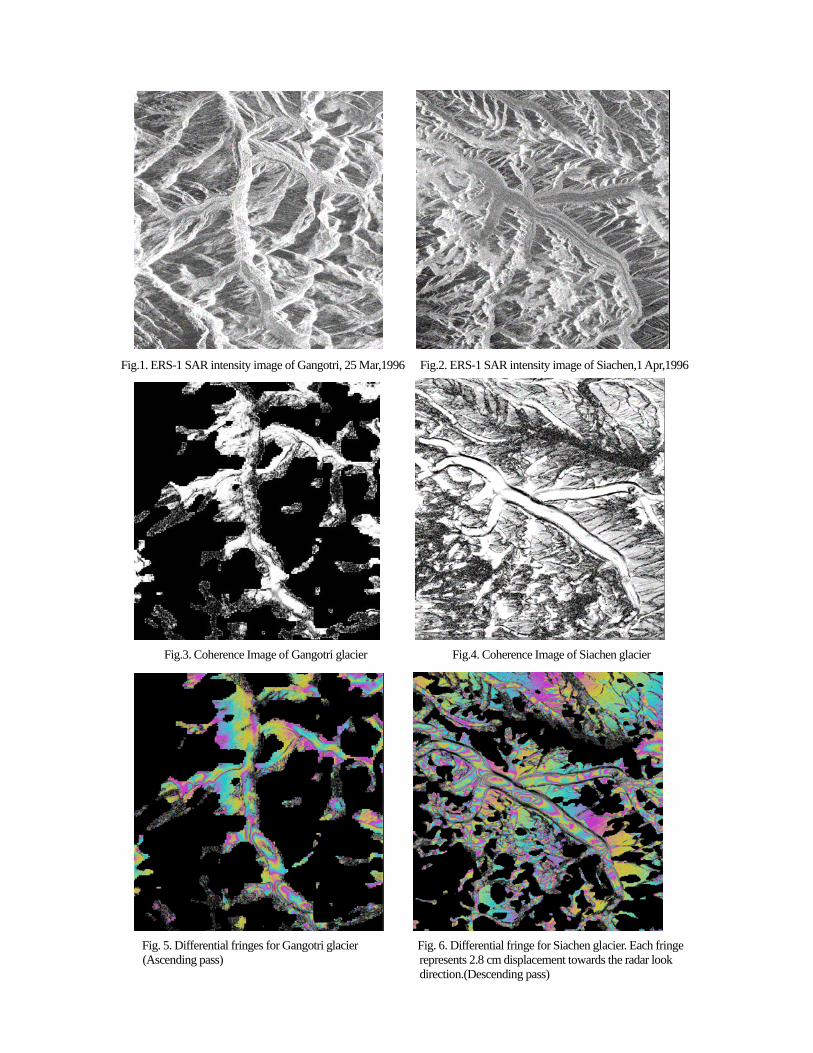
4. SAR DATA PROCESSING Synthetic aperture radar data for this study were processed by using the software developed by Gamma Remote Sensing AG, Switzerland. The raw data were processed initially to generate Single Look Complex (SLC) data product. ERS 1 and 2 tandem SLC data and Envisat ASAR SLC data were registered to generate interferograms. Then these interferograms were flattened for phase unwrapping. Further geocoded DEM’s were developed by converting the unwrapped phase to height with the help of Gamma software. We have generated intensity and coherence images as well. Since we had very limited pairs of data, we have followed the two pass technique to generate differential interferograms by taking advantage of SRTM DEM’s available for the study area in the USGS website. We considered unflattened interferograms for differential Interferometry. For the convenience of using Gamma software, SRTM DEM was conditioned by replacing no data value i.e. –32768 with zero. After removing overlapped lines and pixels to cover larger area, DEM tiles were combined. SRTM DEM is provided in equal area without any projection with WGS 84 datum hence we created DEM parameter file using the task Create_dem_par in Gamma software. For transformation of DEM into SAR coordinates, look up table is generated using DEM and other SAR parameters using the task gc_map. The output of this task is simulated SAR back scatter image in DEM geometry and geocoding look up table. After this task DEM is transformed into SAR coordinates using the task geocode. With the help of transformed DEM, unwrapped topographic phase is created using the task phase_sim. This phase is subtracted from the complex interferogram(not flattened) to get differential phase. This differential interferogram is filtered and then the phase is unwrapped. Finally vertical displacement maps are obtained using task disp_map program. However we could not process Envisat ASAR data sets for differential interferograms because of their poor coherence and higher decorrelation conditions. We have used DORIS software to register multitemporal Envisat ASAR data for wet snow mapping using the methodology developed by [9]. We have created color composites by registering multitemporal Envisat ASAR data (winter, early summer and late summer) following the methodology described by [10] using DORIS software to map various zones of Gangotri glacier. 5. RESULTS AND DISCUSSIONS This section is discussed in two parts, first, the results obtained through ERS 1 and 2 tandem data analysis are discussed and then in the later part the analysis based on Envisat ASAR data is discussed. 5.1 ERS 1 and 2 tandem data sets ERS 1 SAR intensity images of Gangotri and Siachen glacier are shown in Figs. 1&2. Gangotri glacier flows south to north while Siachen flows from north to south. Tonal variation is observed along the main Gangotri glacier (Fig.1) and also along many tributaries. At the highest point of glacier in the lower parts of Fig.1, bare ice with smooth surface appear as dusk tones. In the lower elevation of the glacier, vertical bar like lateral moraines with rough surface are seen. In Siachen glacier also (Fig. 2) tonal variations are observed. Dark patches represent bare ice with smooth surface while bright tones represent rough ice surface. Very bright tones in the image probably represent recrystallized snow. Coherence images for Gangotri and Siachen glacier are shown in Figs. 3&4 respectively. Good coherence is observed along the main glacier body of Gangotri and its tributaries (Fig.3), while in the surrounding areas there is very little coherence due to melting of snow resulting in high decorrelation. Similarly good coherence is observed in Siachen glacier (Fig.4) and surrounding areas in descending April image due to low melting. Siachen glacier has lower temperature even in April compared to Gangotri glacier and hence Siachen glacier image shows higher coherence. However we observed poor coherence comparatively in ascending May image of Siachen glacier. We have used about 15 Ground control points (GCP) from Survey of India toposheet for the purpose of DEM generation of Gangotri. We have confined this exercise to only the glacier regions, as the surrounding areas are essentially decorelated due to melting of snow. We find a difference of 50 mts. for Gangotri glacier by comparing the DEM with available topomap height values. We do not find contours over glaciated regions in topomaps, while InSAR DEM shows many contours. Differences are significant in glacier regions while contours surrounding the glaciers match with the contours of InSAR. DEMs were generated for both ascending as well as descending passes of Siachen glacier. As GCP’s were not available, we could make only a qualitative comparison of InSAR derived heights with measured values. Differences were also observed between the DEMs of descending and ascending passes. Due to phase unwrapping
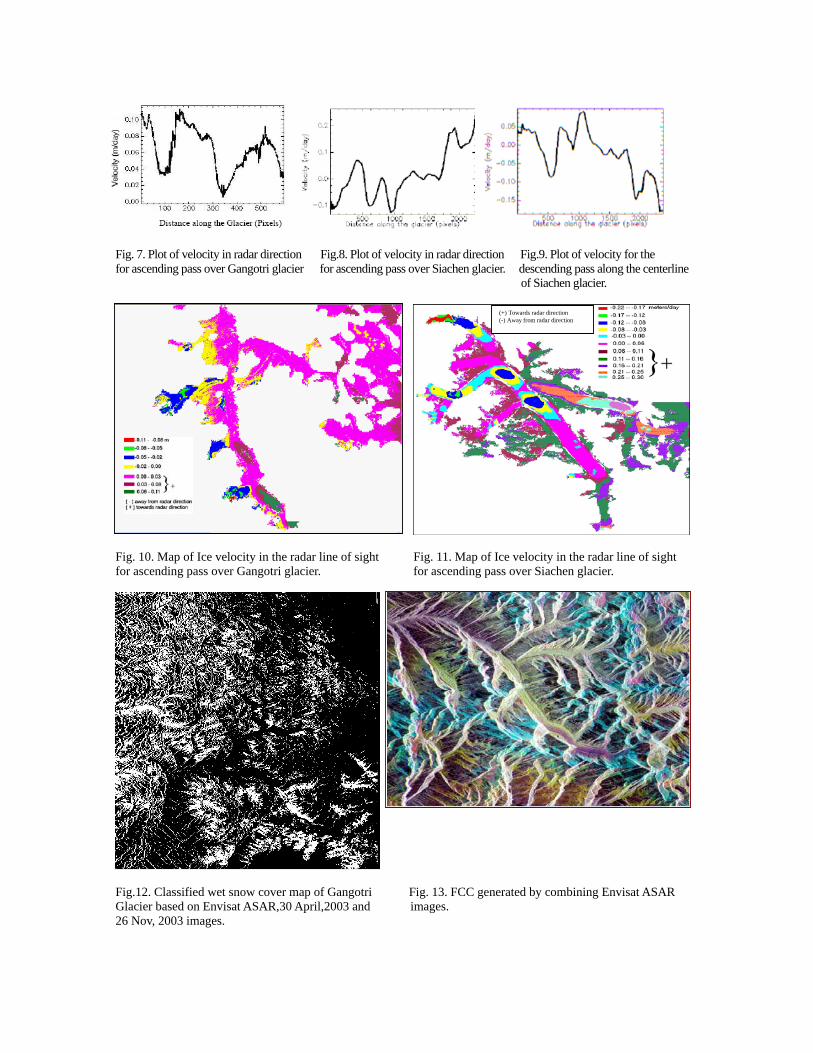
problems, we observed some phase jumps and there by height jumps in DEMs. It is extremely important and prudent to use better phase unwrapping algorithm suitable for high relief terrains for DEM generation. We have used two pass method to generate differential fringes which are shown in Figs. 5&6 for Gangotri and Siachen glacier respectively. These fringes are generated by subtracting topographic fringes from complex interferograms. For this purpose we have used 90 mts. resolution SRTM DEM. In differential interferogram each color cycle (magenta-cyan-yellow-magenta) represents one fringe which is equal to half wavelength (2.8 cm) displacement in the radar direction. Almost 3 fringes (8.4 cm) were observed in Gangotri glacier region particularly at higher elevations (Fig.5). However error in DEM also contributes to displacement as observed in some areas. Error in DEM may cause error in displacement upto 2 cm [4]. Differential interferogram (Fig.6) shows good development of fringes over Siachen glacier particularly at higher elevation as well as lower elevation, i.e. ablation area of Siachen. However at the middle part of the glacier, there are no fringes observed. In this scene fringes are also seen above the Siachen glacier, where there are some small glaciers. Even at some places where there are no glaciers fringes are seen. However it may be due to the elevation differences between SRTM DEM and the actual ground elevation. At the confluence of tributaries with main glacier bull eye shaped fringes (closed fringes) are observed. In this differential interferogram maximum number of 8 fringes equivalent to 23 cm displacement towards the radar direction is observed. Differential interferogram developed for Siachen glacier using ascending pass exhibit more fringes particularly at the ablation area indicating faster movement of glacier in May. We considered velocity profile from highest elevation to the lowest along the middle of the glacier and the plots are shown in Fig. 7,8 &9, for Gangotri glacier and for the ascending and descending pass of the Siachen glacier respectively. The velocity is shown in mt/day on the y-axis and the distance in terms of pixels (each pixel is about 20 mt) on the x-axis. In case of Gangotri (Fig. 7) the curve is not smooth and positive velocity indicates the movement of glacier towards the radar direction. For Siachen glacier the trend of movement along the glacier varies depending on the pass. There was steep change in displacement at the bump of the glacier (525th and 1000th pixel no.). Variation in the movement is observed at the bottom of the glacier also. Variation is highest in the ablation zone. Figs. 10 and 11 show velocity map of Gangotri and Siachen glacier respectively. In these maps positive velocities represent movement towards the radar direction and negative velocities represent movement away from the radar direction as they are ascending pass images. 5.2 Envisat ASAR data results We had three pairs of Envisat ASAR data sets for Gangotri glacier in descending pass (see Table.1). We have processed these 3 pairs of data sets with Gamma Software to generate interferometric fringes. Of these, exhibit the first pair 09 July,2003 and 13 Aug, 2003 shows some interferometric fringes, while the other two pairs do not any fringes. This is mainly due to a variety of reasons which include 1) The time interval between these two data sets is very high and the glacier movement may be very large to be recorded. 2) Unfavorable baseline conditions. 3) Temporal decorelaton due to vegetation growth and melting of snow. Even in the first pair the fringes are limited due to large movement of glaciers in 35 days. This pair had a baseline perpendicular of 52 mts. and hence each fringe equals 176 mts. Coherence image generated through this pair exhibits good coherence at some places, where hill slopes face away from the radar look direction. Over the glacier there is decorrelation which makes it difficult to estimate glacier movement. However in this coherence image, Gangotri glacier terminus is clearly visible and thus it could be possible to track the terminus and monitor the retreat of this glacier through a time series analysis. We have used DORIS software to register Envisat ASAR images of 30 April, 2003 and 26 Nov, 2003 for mapping wet snow following the methodology suggested by [9]. In this algorithm, winter image is used as reference image and another image is used for mapping wet snow cover. Backscatter ratio between the reference image and the other image is calculated and a threshold value of -3dB has been used for mapping wet snow. The extent of wet snow in Gangotri glacier region is shown in Fig.12, where white tone represents wet snow and dark tone represents dry snow or snow free areas. We have also used DORIS software to register winter, early summer and late summer images of Envisat ASAR data for Gangotri glacier to identify and demarcate various glacier zones and other glacier related features [10]. This color composite (Fig.13) helps to map ablation area, accumulation area by drawing the snow line or equilibrium line which appears in pink color. These maps are useful for mass balance studies which help to understand the retreat or surging of the glaciers.
6. CONCLUSIONS ERS 1&2 tandem data of Gangotri and Siachen glacier were processed for DEM generation and glacier movement. Good coherence was observed over the glacier region which helps in the generation of DEM as well as differential interferometry fringes. About 10 cm movement has been noticed in case of Gangotri glacier and about 23 cm movement has been noticed in case of Siachen glacier. We have encountered phase unwrapping difficulties in high relief Himalayan regions. The poor resolution of SRTM DEM has also added to the problems. An error of 50 mts. was observed in the case of Gangotri DEM. Although the interferometry results obtained through Envisat ASAR data pairs are not encouraging due to a variety of reasons, we found the coherence image obtained with 35 days gap is useful to track glacier terminus position and thus monitor the retreat of the glacier. The secondary spin off benefits using interferometry software include the generation of wet snow cover map and glacier facies map. 7. REFERENCES 1. P.A. Rosen, S. Hensley, Ian R. Joughin, F.K. Li, S.N. Madsen, E.Rodriguez and R.M. Goldstein0, “Synthetic aperture radar interferometry,” IEEE Trans. Geosci. Remote Sens, Vol. 88, pp.333-382, Mar. 2000. 2. R. Kwok and M.S. Fannestock, “Ice sheet motion and topography from radar Interferometry,” IEEE Trans. Geosci. and Remote Sensing, Vol. 34, pp. 189-200, Jan. 1996. 3. Ian R. Jougin, D. Winebrenner, M. Fahnestock, R. Kwok, W. Krabill, “Measurement of ice-sheet topography using satellite-radar interferometry,” J. Glacilogy, Vol. 42, No. 140. 1996. 4. R.R. Forster, E. Rignot., B.L. Isacks and K.C. Jezker, “Interferometric radar observations of Glaciares Europa and Penguin, Hielo Patagonico Sur, Chile,” J. Glaciology, Vol. 45, No. 150, pp325-337, 1999. 5. Mattar E.K., P.W. Vachon, D. Geudtner, A.L. Gray, “Validation of Alpine glacier velocity measurements using ERS tandem-mission SAR data,” IEEE Trans. Geosci. and Remote Sens., vol. 36, pp.974-984, May 1998. 6. R.M.Goldstein, H. Engelhardi, B. Kamb, and R.M. Frolich, “Satellite radar interferometry for monitoring ice sheet motion: application to an Antarctic ice stream,” Science, 262, pp. 1525-1530. 1993. 7. M.F. Meir, Role of land ice in present and future sea level change, Sea level change, National Academy Press, pp.171-184. 1990. 8. A.K. Naithani, H.C. Nainwal, K.K. Sati, and C. Prasad, “Geomorphological evidence of retreat of Gangotri glacier and its characteristics,” Current Science, Vol. 80, pp.87-94, 2001. 9. Nagler T and Rott H., Retrieval of wet snow by means of multi-temporal SAR data , IEEE Trans. Geosci. Remote sensing, Vol. 38, NO. 2, pp. 754-765,2000 10. Partington K.C., Discrimination of glacier facies using multi-temporal SAR data, J. of Glaciology, Vol. 44. No. 146, pp.42-53,1998
Table 1. SAR data products used in the study area
Satellite/Sensor Date Pass Baseline (┴) mts. No. of Days Test site 25-03-1996 26-03-1996 Ascending 75 01 Gangotri
01-04-1996 02-04-1996 Descending 110 01 Siachen
02-05-1996
ERS 1&2 SAR
03-05-1996 Ascending 114 01 Siachen
09-07-2003 13-08-2003 Descending 52 35 Gangotri
26-11-2003 23-06-2004 Descending 35 209 Gangotri
09-07-2003
ENVISAT ASAR
23-06-2004 Descending 581 349 Gangotri
Fig.1. ERS-1 SAR intensity image of Gangotri, 25 Mar,1996 Fig.2. ERS-1 SAR intensity image of Siachen,1 Apr,1996
Fig.3. Coherence Image of Gangotri glacier Fig.4. Coherence Image of Siachen glacier
Fig. 5. Differential fringes for Gangotri glacier Fig. 6. Differential fringe for Siachen glacier. Each fringe (Ascending pass) represents 2.8 cm displacement towards the radar look
direction.(Descending pass)
Fig. 7. Plot of velocity in radar direction Fig.8. Plot of velocity in radar direction Fig.9. Plot of velocity for the for ascending pass over Gangotri glacier for ascending pass over Siachen glacier. descending pass along the centerline of Siachen glacier.
Fig. 10. Map of Ice velocity in the radar line of sight Fig. 11. Map of Ice velocity in the radar line of sight for ascending pass over Gangotri glacier. for ascending pass over Siachen glacier.
Fig.12. Classified wet snow cover map of Gangotri Fig. 13. FCC generated by combining Envisat ASAR Glacier based on Envisat ASAR,30 April,2003 and images. 26 Nov, 2003 images.
(+) Towards radar direction (-) Away from radar direction