APPLICATION OF THE CUMULATIVE RISK MODEL IN PREDICTING SCHOOL READINESS IN HEAD START CHILDREN A Dissertation by OLGA LYDIA RODRIGUEZ-ESCOBAR Submitted to the Office of Graduate Studies of Texas A&M University in partial fulfillment of the requirements for the degree of DOCTOR OF PHILOSOPHY August 2007 Major Subject: School Psychology
Transcript
APPLICATION OF THE CUMULATIVE RISK MODEL IN PREDICTING SCHOOL
READINESS IN HEAD START CHILDREN
A Dissertation
by
OLGA LYDIA RODRIGUEZ-ESCOBAR
Submitted to the Office of Graduate Studies of Texas A&M University
in partial fulfillment of the requirements for the degree of
DOCTOR OF PHILOSOPHY
August 2007
Major Subject: School Psychology
APPLICATION OF THE CUMULATIVE RISK MODEL IN PREDICTING SCHOOL
READINESS IN HEAD START CHILDREN
A Dissertation
by
OLGA LYDIA RODRIGUEZ-ESCOBAR
Submitted to the Office of Graduate Studies of Texas A&M University
in partial fulfillment of the requirements for the degree of
DOCTOR OF PHILOSOPHY
Approved by: Chair of Committee, Cynthia A. Riccio Committee Members, Michael J. Ash Amanda Jensen Doss Christine Stanley Head of Department, Michael Benz
August 2007
Major Subject: School Psychology
iii
ABSTRACT
Application of the Cumulative Risk Model in Predicting School Readiness in Head Start
Children. (August 2007)
Olga Lydia Rodriguez-Escobar, B.S., Eastern Michigan University;
M.Ed., University of Texas-Pan American
Chair of Advisory Committee: Dr. Cynthia A. Riccio
This study investigates the degree to which the cumulative risk index predicted
school readiness in a Head Start population. In general, the reviewed studies indicated
the cumulative risk model was efficacious in predicting adverse developmental
outcomes. This study built on this literature by investigating how child, parent, and
family risk factors predicted school readiness in Head Start children using two statistical
models. Specific aims of this study included identifying 1) to what degree multiple
predictors contributed to school readiness and 2) to what degree the cumulative risk
index contributed to school readiness. Participants included 176 Head Start children
ages 3 to 5 years. Data were analyzed using multivariate regression to determine if the
cumulative risk model was a stronger predictor of school readiness than any risk factor
in isolation. Hierarchical regression was also utilized to determine if individual risk
factors contributed anything above and beyond the sum, the cumulative risk index.
Multiple regression analysis revealed that older age and previous enrollment in
Head Start predicted higher scores, while low income predicted lower scores, as did
taking the test in Spanish. Analysis also revealed that higher scores on the cumulative
risk index predicted lower test scores. The analysis revealed that the individual risk
iv
factors did not contribute to the model above and beyond the cumulative risk index.
Adding the individual risk factors did not account for more variance than using gender,
age, and the cumulative risk index as the only predictors. Similarly, the cumulative risk
index did not account for more variance than using age and gender as the only
predictors. The current study adds empirical support to the continued use of the
cumulative risk model in predicting adverse developmental outcomes.
v
DEDICATION
This dissertation is dedicated to my husband Bob and my daughters, Syanne and
Sidney. Their encouragement and patience throughout my entire graduate career has
provided me the motivation to continue throughout this seemingly never ending
endeavor. Bob, thank you for always believing in me and for assuming so many
additional responsibilities to make my doctorate degree a reality—my gratitude is
immeasurable. Only you and I truly know the degree to which our family sacrificed.
Syanne and Sidney, on days when I felt I didn’t have an ounce to continue, your
boundless love and affection for “momma” was all I needed to recharge. As you recall
your childhood, I hope that my love of reading and learning will be firmly shaped in
your memories and encourage you to pursue your wildest dreams.
Next, this dissertation is dedicated to my parents, Jose and Olga; you have been
the catalysts for my educational pursuits. Dad, my interest in psychology and my strong
“child advocate gene” is mostly attributable to you. There is no greater role model of
patience and absolute complete devotion to children than you. Mami, usted a sido un
ejemplo de fuerza inimaginable. Gracias por todo lo que a hecho para que nuestra
familia siempre saliera adelante. Usted y papi siempre pusieron sus hijos sobre todo lo
demas. Nunca lo olvidare.
This dissertation is also dedicated to the rest of my family who have in one way
or another, provided support all these years: my in-laws, my sisters and their families,
my brothers and their significant others, my sister-in-law and her family, and the rest of
the gang that are too many to list.
vi
ACKNOWLEDGMENTS
I would like to express to gratitude to my committee members, Dr. Cynthia
Riccio, Dr. Michael Ash, Dr. Amanda Jensen Doss, and Dr. Christine Stanley, whose
guidance and support have assisted me in finalizing this project. Also, I would like to
express a special thank you to my committee chair, Dr. Riccio, for her endless support
throughout the completion of this dissertation and throughout my entire doctorate
program.
A special appreciation is due to the children and staff of the Brazos Valley
Community Action Agency/Head Start program. Without you, this project certainly
would not have been formulated and I appreciate all your efforts in serving our Head
Start children with the highest standards.
vii
TABLE OF CONTENTS Page
ABSTRACT .................................................................................................. iii DEDICATION .............................................................................................. v ACKNOWLEDGMENTS............................................................................. vi TABLE OF CONTENTS .............................................................................. vii LIST OF TABLES ........................................................................................ ix CHAPTER I INTRODUCTION .......................................................................... 1 Cumulative Risk Model ........................................................... 3 Statement of the Problem and Purpose of the Study................ 4 Definition of Terms .................................................................. 5 II REVIEW OF THE RELATED LITERATURE……….. ............... 7
Ecological Systems Theory...................................................... 7 Risk Factors Related to Academic Achievement ..................... 10 Overview of the Cumulative Risk Model................................. 14 Empirical Support for the Cumulative Risk Model ................. 16 Statement of the Problem ......................................................... 22 Purpose of the Study ................................................................ 23 Research Questions .................................................................. 23
III METHODOLOGY......................................................................... 25
Participants ............................................................................... 25 Instruments ............................................................................... 26 Procedures ................................................................................ 30 Computation of the Cumulative Risk Model ........................... 31 IV RESULTS ...................................................................................... 35
V DISCUSSION AND CONCLUSIONS.......................................... 46
Summary and Implication of Findings..................................... 46 Limitations ............................................................................... 47 Conclusions and Recommendations for Future Research........ 48
VITA ............................................................................................................. 60
ix
LIST OF TABLES
TABLE Page
1 Demographic Characteristics of the Child ........................................... 28
2 Frequencies and Percentages of Risk Factors ...................................... 33
3 Demographic Characteristics of the Parents ........................................ 36
4 Demographic Characteristics of Continuous Variables ....................... 37
5 Multiple Regression of Gender, Age, and Risk Factors on Test Scores 40
6 Multiple Regression of Gender, Age, and the Cumulative Risk Index
on Test Scores ...................................................................................... 41
7 Multiple Regression of Gender, Age, the CRI, and Individual Risk
Factors on School Readiness................................................................ 43
8 Average Scores on the Fall Speed DIAL by Language and Age ......... 44
1
CHAPTER I
INTRODUCTION
On January 8, 1964, President Lyndon B. Johnson declared “War on Poverty”
and called for national cooperative efforts to improve the general welfare of the poor
across the nation (Guskey, 2005). A critical component of this declaration was the
Economic Opportunity Act of 1964, which included several intervention programs such
as Job Corps and Head Start (Malveaux, 2004). Co-founded in 1965 by pioneering child
psychologist, Urie Bronfenbrenner, Head Start is a school readiness program that
provides comprehensive services to low income children and their families such as
education, health, nutrition, and parent involvement (Addison, 1992). These services are
designed to foster the social and cognitive development of economically disadvantaged
children. Significant emphasis is placed on the involvement of parents in the education
of their children as well as parental educational and employment goals (Addison, 1992).
Therefore, not only does Head Start aim to prepare young children for school by
providing early education, but also by providing support at multiple levels in a child’s
environment that impact development. This integrated, multimodal intervention
approach is not accidental and strongly reflects the premises of Bronfenbrenner’s (1979)
ecological systems theory.
The ecological systems theory (Bronfenbrenner, 1979), places the child at the
center of five unique systems: microsystem, mesosystem, exosystem, macrosystem, and
_____________ This dissertation follows the style of American Psychologist.
2
chronosystem. According to Bronfenbrenner, these systems all have the ability to
directly or indirectly impact a child’s development and a change in one system, positive
or negative, will cause changes throughout other systems. The greatest impact to the
child’s development, however, is hypothesized to come from the microsystem, or an
individual’s immediate settings such as home and school. This view is represented in
one of the key features of the Head Start program with significant emphasis placed on
the engagement of parents in their children’s learning as well as in the administration of
the program (Addison, 1992).
If the microsystem is posited to have the most significant impact to a child, then
investigations of early developmental outcomes would benefit from examining risk
factors within the microsystem that comprise learning or academic achievement. This is
especially true for children living in poverty, as these children tend to experience a
higher number of risk factors and more unfavorable outcomes (Pungello, Kupersmidt,
Burchinal & Patterson, 1996). Beginning with their first year of school, poor children are
less likely to evidence school readiness, or those basic or emergent skills needed to
succeed academically (Whitehurst & Lonigan, 1998). Even as they progress in grade,
the number of family risk factors continues to be negatively associated with their
achievement gains (U.S. Department of Education, 2004). These family risk factors
include non-English primary home language, household below poverty level, mother’s
highest education less than a high school diploma/Graduate Equivalency Diploma
(GED), and single-parent household. In general, poor children enter our educational
system lacking school readiness skills that are linked with later academic performance
3
(Baydar, Brooks-Gunn & Furstenberg, 1993 as cited in Whitehurst & Lonigan, 1998).
From an ecological perspective, practice would benefit from research efforts that
investigate the relationship between multiple risk factors within the microsystem, and
adverse outcomes such as inadequate school readiness skills. These investigations
would be helpful in guiding intervention and prevention efforts, such as Head Start.
Although research and ecological systems theory suggest multiple risk factors are likely
responsible for adverse outcomes, research, in general, has not explored how the
accumulation of risk factors contribute to adverse developmental outcomes (Evans,
2004). In an effort to address this need, this study will employ the cumulative risk
model to examine risk factors within the microsystem, specifically, child, parent, and
family risk factors, and their impact on school readiness of Head Start children.
Cumulative Risk Model
The basic premise of the cumulative risk model is that negative developmental
outcomes are not the result of one distinct factor, but the number, or quantity, of factors
taken together (Evans, 2004). Using the cumulative risk model, researchers combine the
absence or presence of risks to calculate a cumulative risk index (hereafter referred to as
the CRI). Each risk factor is categorized and assigned a 0 (absence of risk) or a 1
(presence of risk); the sum of the risk factors present for each individual is labeled the
CRI and then used as a single predictor for the outcome of interest.
Although the cumulative risk model emphasizes quantity of risk factors, the
quality of each risk factor, or the degree to which it impacts the outcome of interest, is
not evaluated (Evans, 2004; Hooper, Burchinal, Roberts, Zeisel & Neebe, 1998). The
4
premise is that the combined effect of multiple risk factors, rather than individual risk
factors, is most responsible for adverse developmental outcomes (Stanton-Chapman,
Chapman, Kaiser & Hancock, 2004). While this model has not been widely tested
(Hooper et al., 1998), researchers have begun to build empirical support for its use in the
last quarter century. Interestingly, the cumulative risk model began to surface around
the time that Bronfenbrenner (1979) proposed the ecological systems theory.
A review of the literature shows that the cumulative risk model has been used to
predict a variety of early developmental outcomes such as cognitive performance,
mental health, physical health, language development, social development, and academic
achievement. Taken together, these studies provide empirical support for the continued
use of the cumulative risk model in predicting developmental outcomes—that is, the
total number of risk factors, rather than any single risk factor in isolation, can better
predict negative developmental outcomes.
Statement of the Problem and Purpose of the Study
While results have yielded positive results for the continued use of this simplistic
model, additional research is necessary to validate its utility and generalizability.
Compared to the current literature base utilizing the cumulative risk model, this study is
important in three ways. First, this study will add to the small body of knowledge that
investigates the efficacy of the cumulative risk model. Second, this model has mostly
been used to investigate the impact of multiple risk factors in populations with inherent
risks (i.e., low SES); however, very few of these studies have included Head Start
populations. As previously stated, children living in poverty often experience more risk
5
with adverse outcomes (Pungello et al., 1996) such as initial and continued unfavorable
academic performance (Whitehurst & Lonigan, 1998). This study will address the
ongoing necessity to study the achievement progress of poor children, specifically the
school readiness of Head Start participants. Lastly, investigations of school readiness or
academic achievement of Head Start children using a cumulative risk approach are
almost non-existent. This study addressed this gap in the literature by testing the efficacy
of the cumulative risk model in predicting school readiness in a Head Start population.
In so doing, the study proposes to test the following hypotheses:
Hypothesis 1
Consistent with the cumulative risk model, it was expected that as the total
number of child, parent, and family risk factors increased, performance on the school
readiness measure would decrease.
Hypothesis 2
Consistent with the cumulative risk model and previous research, the cumulative
risk index was expected to be a stronger predictor of school readiness than any risk
factor in isolation.
Hypothesis 3
It was expected that individual risk factors would not contribute significant
variance above and beyond their sum, the cumulative risk index.
Definition of Terms
Ecological Systems Theory. Introduced by Urie Bronfenbrenner (1979), the
ecological systems theory places the child at the center of five unique systems:
6
microsystem, mesosystem, exosystem, macrosystem, and chronosystem. These systems
all have the ability to directly or indirectly impact a child’s development and a change in
one system, positive or negative, will cause changes throughout other systems. The
greatest impact, however, is hypothesized to come from the microsystem, or an
individual’s immediate settings such as home and school.
Cumulative Risk Model. The cumulative risk model posits that negative
developmental outcomes are not the result of one distinct factor, but multiple risk
factors. The greater the number of risk factors, the more likely an individual will
experience negative developmental outcomes. With this model each factor is assigned a
0 (absence of risk) or a 1 (presence of risk); the sum is then used to predict the outcome
measure of interest. The contribution or weight of any particular risk factor is not
evaluated.
Cumulative Risk Index. Each risk factor is assigned a 0 (absence of risk) or a 1
(presence of risk); the sum of the risk factors present for each individual is known as the
cumulative risk index. The cumulative risk index is then used as a single predictor for
the outcome of interest.
7
CHAPTER II
REVIEW OF THE RELATED LITERATURE
This chapter provides a rationale for investigating the efficacy of the cumulative
risk model in predicting school readiness for a Head Start population. First, a theoretical
framework for this study is provided. Second, the areas of risk that are being considered
to impact school readiness or academic achievement in the current population are
examined. Specifically, these risks include: minority status, family income, family size,
father absence, previous enrollment in Head Start, and child language. Third, an
overview of the cumulative risk model along with a review of the literature highlighting
the efficacy of the cumulative risk in predicting developmental outcomes of Head Start
children is presented. Lastly, the statement of the problem and the research questions for
this study are provided.
Ecological Systems Theory
Utilizing the ecological systems theory as a framework for this study, the
preschool child is at the center of five unique systems: microsystem, mesosystem,
exosystem, macrosystem, and chronosystem (see Figure 1). These systems all have the
ability to directly or indirectly impact a child’s development and a change in one system,
positive or negative, will cause changes throughout other systems. Bronfenbrenner
believed that the greatest impact to a child’s development comes from the microsystem,
or an individual’s immediate settings such as home and school (Bronfenbrenner, 1979).
8
_______________________________________________________________________ Figure 1 An ecological model of child and family risk factors for the Head Start child The macrosystem refers to the interrelations between two microsystems. The chronosystem refers to the dimension of time. _______________________________________________________________________
The first system, the microsystem, refers to the immediate setting in which a
child is developing such as the home or school. Of particular interest within these
settings are the activities the child engages in, the roles that the child is expected to
fulfill, and the interpersonal relations that the child experiences. Aspects of these
immediate settings that have meaning to the child are proposed to have the greatest
impact on the development of the child (Bronfenbrenner, 1979). For example, the
Macrosystem: Overarching values, beliefs, and organization of the culture or subculture as a whole
Exosystem: Parent’s workplace, parent’s support network
Microsystem: Home, School
Head Start Child
9
relationships a child has with his parents or his Head Start teachers would be expected to
have the most powerful impact on his development.
The mesosystem refers to the interrelations between two or more microsystems
in which the child actively participates such as relations between home and school. The
connections between these microsystems are just as important as the events taking place
within each microsystem (Bronfenbrenner, 1979). For instance, a child may benefit not
only from having a positive relationship with his teacher, but also from his school having
accurate knowledge and positive attitudes about his home setting.
The exosystem includes one or more settings in which the child does not actively
participate, but which contains events that have direct and powerful impacts on the
development of the child (e.g., parent’s workplace, parent’s support network;
Bronfenbrenner, 1979). For example, loss of parent employment will impact how basic
needs are met for the family and the child. Similarly, changes in federal funding that
reduce the number of Head Start support staff will impact how academic services are
delivered in the classroom and thus impact the child.
The macrosystem includes the overarching values, beliefs, and organization of
the culture or subculture as a whole. The macrosystem includes the micro-, meso-, and
exosystems characteristic of a given society or group (Bronfenbrenner, 1979). For
example, the United States educational system is predominantly organized so that
children spend much of their day at school and receive most of their academic
instruction from their school teachers. Another example is the valued traditional family
with two heterogeneous parents over the single parent household.
10
The last system, the chronosystem, accounts for the dimension of time. With this
system, Bronfenbrenner (2005) proposed that the child’s development must always be
considered in relation to time. Time not only matures the child physically, but also
provides experiences that influence overall development. More specifically, these
experiences can originate within the child (e.g., illness, growth), in the external
environment (e.g., divorce), are normative (e.g., school entry/Head Start entry), or are
non-normative (e.g., death of a parent). Regardless of their origin, these events are
believed to impact the relation between the child, the environment, and prompt
developmental change (Bronfenbrenner, 2005).
In sum, the ecological systems theory places an individual at the center of five
distinct, but interacting systems, which continuously impact development across time
with the most significant impact stemming from an individual’s immediate settings.
Based on this theory, investigations of child developmental outcomes would benefit
from examining multiple factors within the microsystem. In regard to school readiness,
a better understanding of risk factors within the microsystem is necessary to inform
prevention and intervention efforts such as Head Start. Since risk factors typically do
not occur in isolation, this ecological systems theory provides a suitable framework to
assess multiple risk factors within multiple settings.
Risk Factors Related to Academic Achievement
In 2006, the National Center for Children in Poverty reported that the number of
children living in families with incomes below the poverty level was 13 million, which is
$20,000 for a family of four (Fass & Cauthen, 2006). Official poverty rates were highest
11
for young children. Forty-two percent of children under age 6 years live in low-income
families and experience negative impacts across multiple domains including health,
housing, and education. Economic deprivation affects overall childhood development
(Duncan, Brooks-Gunn & Klebanov, 1994; Korenman, Miller & Sjaastad, 1995). In
regard to education, socioeconomic status (SES) is viewed as one of the most widely
used variables in education research (Sirin, 2005). Children living in poverty exhibit
significant achievement gaps that are evident upon school entry and continue to persist
throughout their schooling (Whitehurst & Lonigan, 1998). When poor children enter the
school system, they are less likely to have attended a preschool development program
that provides them with school readiness skills. Also, throughout their schooling, they
are more likely to attend under-funded schools (Sirin, 2005) and thus continually lack
knowledge, resources, and skills needed to succeed academically.
Not only is SES related to academic achievement, but it is also indirectly linked
through race as minority children are more likely to live in a low-income household or
single-parent families, have less educated parents, and attend under-funded schools
(Sirin, 2005). Additionally, the stress of chronic economic hardship is likely to diminish
positive parent responsiveness and thus the overall quality and opportunity for learning
at home (Jackson, 2003). In the most recent long-term trend assessment (Perie, Moran,
& Lutkus, 2005), children of color across the nation were consistently outperformed by
their White peers in both reading and math across a thirty-three year time span. Though
achievement gaps have shortened from 1971 to 2004, Black and Hispanic students
remain considerably behind.
12
Another risk factor hypothesized to impact school readiness in this study’s
population is family size. Family size has consistently been negatively associated with
academic outcomes; as the number of siblings increases, academic outcomes are
jeopardized (Downey, 1995). A theory used to explain this association is the resource
dilution model (Blake, 1981 as cited in Downey, 1995). The resource dilution model
simply proposes that academic outcomes are vulnerable to family size because parental
resources are diluted. The more children in a family, the less parental resources they
each receive, such as parental attention and teaching. Thus, opportunities for learning
are reduced which in turn compromise academic achievement.
Father absence is also expected to impact school readiness. Consistent with the
resource dilution model, the academic achievement of children raised by single-mothers
is also negatively impacted due to a limited availability of resources (Horowitz & Souza,
2004). In regard to the risk factors being considered for this study, father absence is
considered a risk primarily because of the expected decrease in parental warmth and
quality of parent-child relationships by both the mother and the father. However,
monetary resources are almost always expected to decrease with the absence of the
father.
Further, children who enter school speaking a language other than English are
faced with the overwhelming task of simultaneously learning English and basic skills
needed for academic success. Hispanic students, in particular, face additional
challenges. Not only do Hispanic students often enter the school with the “strikes” of
economic, race, and language disadvantage, but also they are less likely to have
13
participated in preschool programs (U.S. Department of Education, 2006), which further
increases their risk for poor academic achievement. Nichols, Rupley, & Rickelman
(2004) found that students with little or no preschool experience, from low SES families,
and of Hispanic origin were at greatest risk for not developing beginning reading skills.
In terms of school readiness, it appears that Spanish speaking Hispanic students are the
most disadvantaged when we consider additional “strikes”, their often uneducated
parents with a tendency to desire large numbers of children (Unger, 1997).
Last, given that the academic performance of poor minority children is
consistently unfavorable and that these children often carry multiple risks, enrollment in
preschool programs prior to kindergarten entry is critical. Early intervention has been
found to have positive, long-term effects on cognitive and academic development
maternal efficacy and child temperament were tested as protective factors. Results
showed that as the number of risk factors increased, ratings of social competence
decreased. This was also found even for children with less inhibited and less impulsive
22
child temperament as well as for children whose mothers reported higher level of
parenting efficacy. Correlations between social competence and independent risk
variables indicated that children with bigger families and those living with only one
caregiver were rated as more aggressive.
Loutzenhiser (2002) indicated contrary results and found that the cumulative risk
index was not predictive of social competence in a sample of 25 Head Start children.
Risk was assessed in the following ten family factors: 1) parent educational level, 2)
parent occupation, 3) family income, 4) minority status, 5) family size, 6) availability of
family resources, 7) availability of family social support, 8) maternal depression, 9) the
occurrence of stressful life events, and 10) minority status. Contrary to the investigator’s
expectations, the cumulative risk index was not found to be predictive of social
competence. Also, only maternal depression and family social support were correlated
with social competence. One explanation offered by the investigator is the possibility
that parents may have underreported risks, as almost half of the families reported no risk
at all. Based on previous research, Loutzenhiser (2002) expected for this high-risk
population to experience more risk.
Statement of the Problem
Thus, based on the review of the literature, there is a small body of knowledge
that investigates the efficacy of the cumulative risk model with low-income preschool
children in relation to academic readiness. This model has mostly been used to
investigate the impact of multiple risk factors in populations with inherent risks (i.e., low
SES); however, very few of these studies have included Head Start populations. Also,
23
investigations of school readiness or academic achievement of Head Start children using
a cumulative risk approach are almost non-existent. This study addresses this gap in the
literature by testing the efficacy of the cumulative risk model in predicting school
readiness in a Head Start population.
Purpose of the Study
The purpose of this study was to examine the utility of the cumulative risk model
in predicting school readiness in a Head Start population. Given that children from low-
income families are more likely to experience multiple risk factors and subsequent
unfavorable academic performance, an important component of this study was to
investigate the value of the cumulative risk model in predicting school readiness. Also,
in an effort to inform early interventions, this study investigated the degree to which
child, parent, and family risk factors predicted school readiness.
Research Questions
The present study was designed to a) investigate the efficacy of the cumulative
risk model in predicting school readiness in Head Start children, b) compare the
predictive power of the cumulative risk index with the individual risk factors, and c) to
explore if individual risk factors contribute anything above and beyond their sum, as
represented by the cumulative risk index. Thus, the following research questions were
developed:
Research Question 1
Using a multiple regression analysis, to what degree do child, parent, and family
risk factors predict school readiness as measured by the Total Score on the Fall Speed
24
DIAL? It was hypothesized that family income and language status would be most
predictive of school readiness.
Research Question 2
When compared to a multiple regression analysis, is the cumulative risk index as
good as or a stronger predictor of school readiness as measured by the Total Score on the
Fall Speed DIAL? Consistent with the cumulative risk model and previous research, the
cumulative risk index was expected to be a stronger predictor of school readiness than
any risk factor in isolation.
Research Question 3
Using hierarchical regression, do individual risk factors contribute significant
variance above and beyond their sum, the cumulative risk index? It was expected that
individual risk factors would not contribute significant variance above and beyond their
sum, the cumulative risk index.
25
CHAPTER III
METHODOLOGY
This chapter provides details of the research study. First, a description of the
participants in this study is provided. Second, an overview of instruments used, analysis
procedures and variables of interest are presented.
Participants
Participants included 176 children previously enrolled in one of six center-based
Brazos Valley Community Action Agency (BVCAA) Head Start programs during the
fall of 2005. Per federal mandates (PL 107-110, 2001), all BVCAA Head Start children
are administered a developmental screener, the Speed Developmental Indicators for the
Assessment of Learning (Speed DIAL; Mardell-Czudnowski & Goldberg, 1998), within
the first 45 days of their enrollment. Only those children who entered one of six center-
based BVCAA Head Start programs, enrolled no later than September 1, 2005, and were
administered the Speed DIAL within 45 days of their enrollment were included in the
present study. Of the 495 students who were enrolled during the 2005-2006 school year,
309 (62%) were screened out because they did not meet the inclusion criteria. Thus, 186
children met inclusion criteria; however, of these 186 children, ten were not included in
the analyses because there was no demographic or risk information collected for these
children. Independent samples t tests showed that removed children and included
children were not statistically different in age or test score (p > .05). Therefore, analyses
were conducted on 176 children.
26
Of the 176 children who participated in this study, 65 (36.9%) were 3 years of
age, 108 (61.4%), were 4 years, and 3 (1.7%) were 5; the mean age of the sample was 4.
For the sample, 48.3% of the children were female and 51.7% were males. Ethnic
distribution was 42.6% African American, 46.6% Hispanic, and 10.2% Caucasian. Of
the participants, 144 (81.8%) of the children were administered the Speed Dial in
English and 32 were administered in Spanish. All the families reported English or
Spanish as the first language. No children were reported to have a language other than
Spanish as their first language. Finally, 40 (22.7%) were previously enrolled in Head
Start or another childhood development program (see Table 1).
Instruments
The Speed DIAL (Mardell-Czudnowski & Goldberg, 1998), used to measure
school readiness, is a shortened version of the Developmental Indicators for the
Assessment of Learning, Third Edition (DIAL-3; Mardell-Czudnowski & Goldberg,
1998). Both the DIAL-3 and the Speed DIAL can be administered in English and
Spanish. The DIAL-3 screens children ages 3-0 through 6-11 in five areas: motor,
language, concepts, self-help, and social development. The Speed DIAL content
includes ten items taken from the motor, concepts, and language areas of the DIAL-3.
The motor area assesses gross and fine motor development, the concepts area assesses
knowledge of basic concepts such as naming colors, and the language area assesses the
child’s use of expressive and receptive language. With each of the ten items on the
Speed DIAL, the child earns an item raw score, which is then converted into an item
scaled score. These scaled scores are a functional 5-point scale, with 0 as the lowest and
27
4 as the highest. The scaled score for the three areas are summed to obtain the Speed
DIAL Total Score. Speed DIAL Total Scores can be converted to percentile ranks or
standard scores (mean = 100, SD = 15). Results of the Speed DIAL can be used to
determine if the child requires further assessment (“Potential Delay”) or appears to be
developing satisfactorily (“OK”).
Psychometric data on the Speed DIAL is not available; a separate technical
manual specific to the Speed DIAL is nonexistent. The Technical Manual for the DIAL-
3 (Mardell-Czudnowski & Goldberg, 1998) does not include psychometric data for the
Speed DIAL; however, it does include technical information on the DIAL-3. For
example, convergent validity for the DIAL-3 Total range from .53 correlation with the
Brigance Preschool Screen (Brigance, 1985) to .79 correlation with the General
Conceptual Ability composite score on the Different Ability Scales (Elliot, 1990). Also,
Gonzales, Pizzitola, Team, and Ash (2002) obtained statistically significant test-
reliability coefficients with the BVCAA Head Start population (r = 0.82, p < .01). The
Speed DIAL Total Score is also strongly correlated with the DIAL-3 Total Score
(r = 0.94, p < .01) (Mardell-Czudnowski & Goldberg, 1998).
28
_______________________________________________________________________ Table 1 Demographic Characteristics of the Child (N = 176) _______________________________________________________________________ Frequency % Gender Male 91 51.7 Female 85 48.3 Age 3 years 65 36.9 4 years 108 61.4 5 years 3 1.7 Race African American 75 42.6 Hispanic 82 46.6 Caucasian 18 10.2 Language English 144 81.8 Spanish 32 18.2 Previously enrolled in Head Start Yes 40 22.7 No 135 76.7 Disability Yes 24 13.6 No 151 85.8
_______________________________________________________________________ Note: Variables where levels of frequencies do not add to 176 and percentages not totaling 100% reflect missing data.
29
Family Information Form. The Brazos Valley Community Action Agency
(BVCAA) Child Development/Head Start program application is designed to collect
child, parent(s), and family information in order to determine eligibility for acceptance
into the BVCAA Head Start program. The data are intended to provide the U.S.
Department of Health and Human Services information about the population currently
being served by the BVCAA Head Start program. The application domains of the
BVCAA/Head Start program application include child, parent(s), and family. The child
domain, documents information about the child’s age, sex, ethnic origin, child’s primary
language, English speaking ability, whether the child was previously enrolled in Head
Start or other child development program (if so, specific programs attended), disability
status, and specific disability. The parent(s) domain, documents the parent’s date of
birth, whether the person is a supporting adult in the child’s life, whether the parent
resides in the same household with the applicant, whether the person is employed or in
school, whether the parent was previously enrolled in Head Start or other child
development program (if so, specific programs attended), and the person’s primary
occupational status. The mother is also asked to provide as to whether she is currently
pregnant, the length of the pregnancy, and if prenatal care is being received. The third
domain, family, documents information relating to the family type (foster, single parent,
two parent, other relative, or other family type), number of adults in the family, number
of children in the family, gross income, the time period that the income is based on
(previous 12 months or last calendar year), the number of adults contributing to the
family gross income, and the types of services or financial assistance received.
30
Procedures
The current study is an archival study; thus, existing data were utilized. The
BVCAA Head Start program collects the parent responses to the BVCAA program
application and the Speed DIAL Total Scores for each child yearly. The data have been
collected every year beginning in the fall of 2002 and are available for approximately
350 children each year; however, only the data collected during the fall 2005 was
utilized for the current study as it included testing results for new as well as previously
enrolled children. Prior to that, between the academic years 2002-2003 and 2004-2005,
returning children were excluded from testing.
All assessment staff received mandatory half-day training on the administration
of the Speed DIAL by mental health interns employed by Head Start. The mental health
interns are doctoral level students with specialized training in the assessment of the
Speed DIAL. Also, the students’ classroom teacher initially made determination of
language of administration. However, when necessary, assessment staff made subjective
decisions to readminister the Speed DIAL if the student appeared to have difficulty
understanding the tasks due to lack of proficiency.
Before permission to access the data was granted, confidentiality was maintained
by assigning numbers to student names; all identifying child information was removed.
Thus, data were de-identified, and therefore, individual consent forms were not
necessary. The Speed DIAL and the BVCAA application data were then recorded in
Statistical Package for the Social Sciences (SPSS) 14.0.
31
Computation of the Cumulative Risk Index
The cumulative risk index is a score that is utilized to determine the composite
number of risk factors that are present for each participant. Consistent with the
cumulative risk model approach, the current study calculated the cumulative risk index
by assigning a score of 1 to designate the presence of risk or a score of 0 to designate the
absence of risk; the scores were then summed to obtain the cumulative risk index. All
the risk factors were selected from the BVCAA Child Development/Head Start program
application.
Risk Factors/Independent Variables. A total of six variables were evaluated for
risk and their sum was used to compute the cumulative risk index. The six variables
were minority status, gross family income, family size, father absence, previous
enrollment in Head Start, and child speaks a language other than English. These
variables were selected based on previous research that has found them to be predictive
of adverse developmental outcomes (Ackerman, Izard, Schoff, Youngstrom & Kogos,
1999; Ackerman et al., 2004; Burchinal et al., 2006; Gutman et al., 2003; Henry et al,
2003; Ou, 2005; Pungello et al, 1996; Sameroff et al., 1993; U. S. Department of
Education, 1995). The following were the risk factors for this study with frequencies
provided in Table 2.
Risk factor 1 was minority status. This was based on parent report on the Family
Information Form. Children whose ethnicity was anything other than Caucasian were
included in the risk category (assigned 1 point); children who were Caucasian were
32
assigned 0 points. Ninety percent of the sample was classified in the risk category for
this variable.
Risk factor 2 was gross family income; this information was obtained from the
Family Information Form. Children whose gross family income was at, or below, the
median income of $9,200 were included in the risk category (assigned 1 point); if gross
family income was above the median, then 0 was assigned. Forty – nine percent of the
sample was classified in the risk category for this variable.
Risk factor 3 was family size; again, this was based on information from the
Family Information Form. Children with more than four children living in the home,
were included at-risk and assigned 1 point; four or less children in the home resulted in
being assigned 0 points for this category. Twelve percent of the sample was classified in
the risk category for this variable.
Risk factor 4 was father absence or presence in the home. If the father was
reported to reside in the same household as the child only some of the time or not at all,
the child was assigned 1 point for this risk category; if the father was reported to reside
in the same household, the child was assigned 0 points. Sixty – six percent of the sample
was classified in the risk category for this variable.
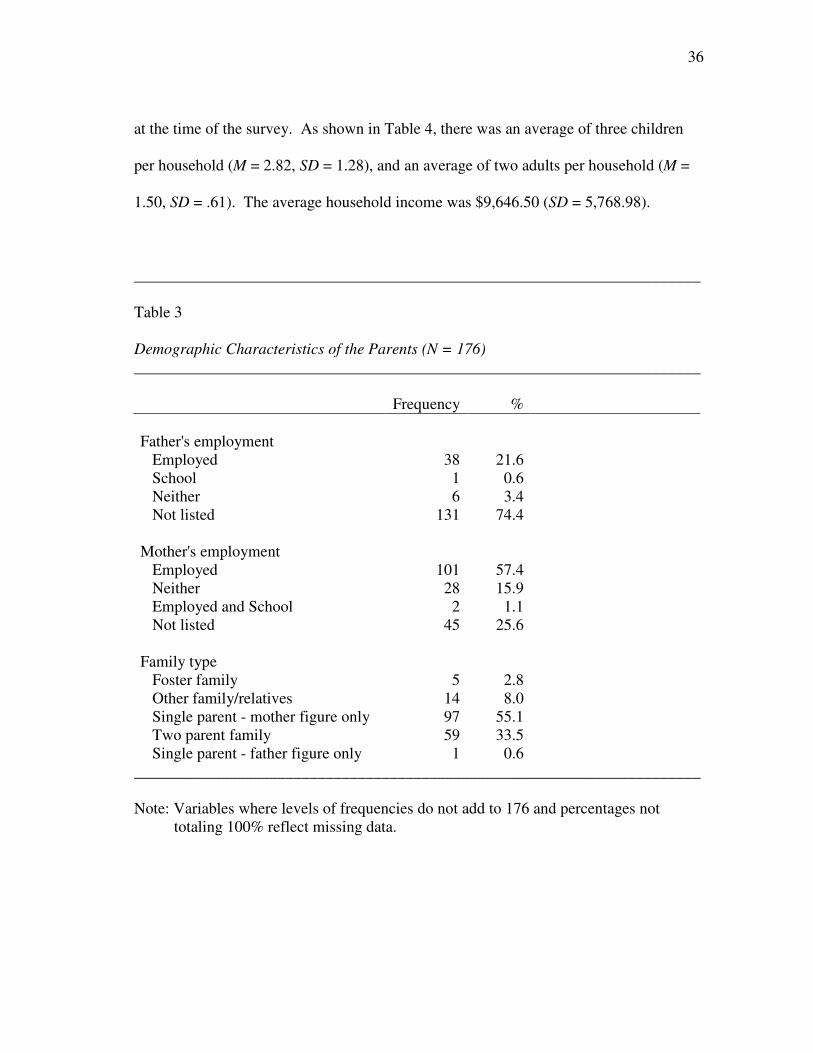
Table 3 Demographic Characteristics of the Parents (N = 176) _______________________________________________________________________ Frequency % Father's employment Employed 38 21.6 School 1 0.6 Neither 6 3.4 Not listed 131 74.4 Mother's employment Employed 101 57.4 Neither 28 15.9 Employed and School 2 1.1 Not listed 45 25.6 Family type Foster family 5 2.8 Other family/relatives 14 8.0 Single parent - mother figure only 97 55.1 Two parent family 59 33.5 Single parent - father figure only 1 0.6
_______________________________________________________________________ Note: Variables where levels of frequencies do not add to 176 and percentages not totaling 100% reflect missing data.
Prior to addressing the hypotheses, data were examined for completeness and
Speed DIAL scores were examined for skewness, kurtosis, and normality (all ps>.05).
Similarly, tests for normality were conducted with the cumulative risk index. Multiple
regression analysis was performed to examine the relationship between child, parent, and
family risk factors and school readiness. School readiness served as the dependent
variable and was measured by the total score on the Fall Speed DIAL. The risk factors
served as predictors and included the following: 1) Minority Status, 2) Absence of
Father Figure, 3) Spanish Speaking, 4) Number of Children in Household, 5) Low
Income, and 6) No Head Start. Demographics of the child, specifically gender and age
of the child, were also included in the analyses as control variables. An increase in
scores with age was expected as part of children's natural development. In regard to
38
gender, during the preschool years, girls are expected to develop verbal and social
skills more rapidly than boys.
All six of the risk factors were dummy coded so that the presence of risk factor
was set to 1 and the absence of the risk factor was set to 0. Specifically, race was
dummy coded so that Caucasian was set to 0 and all other levels of race were set to 1.
The absence of a father figure was assessed by responses to the family type item. The
family type was recoded so that “two parent family” and “single parent – father figure
only” were set to 0 and all other levels of family type were set to 1. Spanish speaking
was set according to whether the child took the test in English or Spanish. The item was
dummy coded so that the Spanish test was set to 1 and the English test set to 0.
Although the number of children in the household was left as a continuous
variable in the analysis, it was also dummy coded in order to calculate the cumulative
risk index. The number of children was recoded so that more than four children was set
to 1 and four children or less was set to 0. Low income was included as a median-split
variable. Frequencies for income were examined to determine the median, or 50%, cut-
off point. Because roughly 50% of the records had incomes at or below 9,200,
participants with incomes less than or equal to 9,200 were classified as having low
income and set to 1, whereas participants with incomes greater than 9,200 were
classified as having higher incomes and set to 0. Whether or not a child had experience
in Head Start was assessed in the survey and recoded so that no previous enrollment in
Head Start was set to 1 and other responses were set to 0.
39
The cumulative risk index (CRI) was calculated by summing the dummy coded
risk factors. Higher scores on the CRI represent the presence of more risk factors,
whereas lower scores represent fewer risk factors. The CRI has a potential range of 0 to
6. The 176 children had an average cumulative risk score of 3.12 (SD = .96) with a
range of 0 – 5.
Research Question 1: Using multiple regression analysis, to what degree do child,
parent, and family risk factors predict school readiness as measured by the Total
Score on the Fall Speed DIAL?
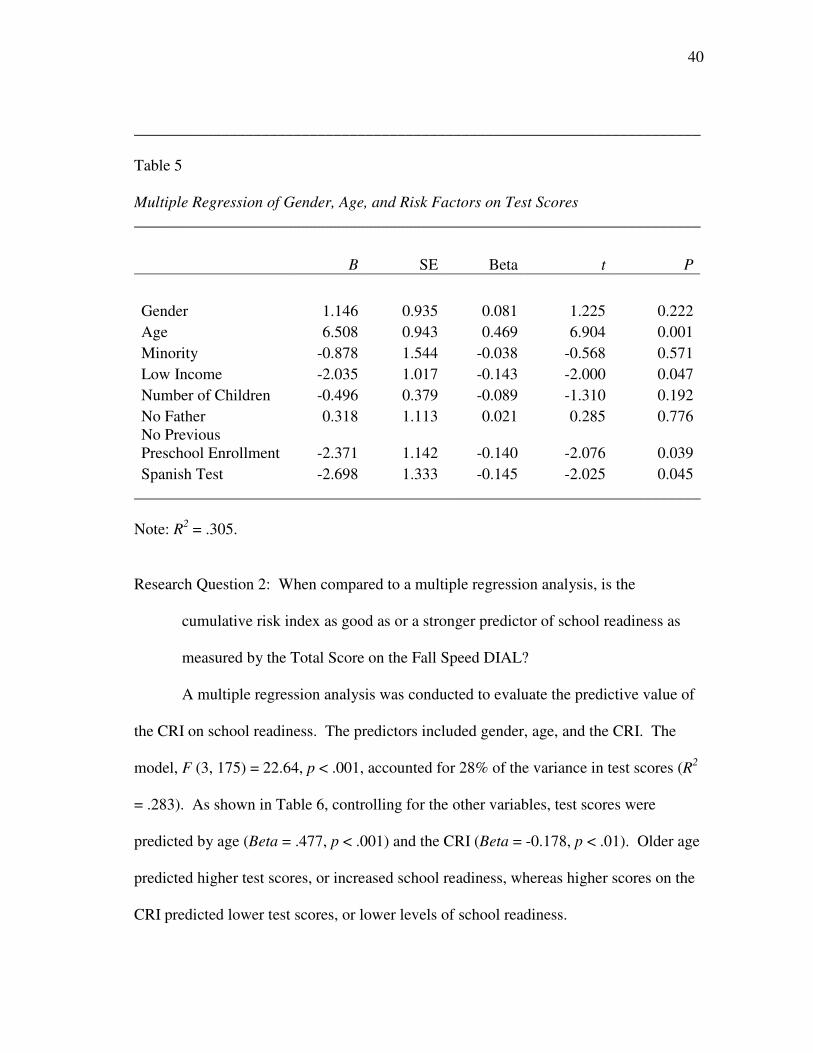
A multiple regression analysis was conducted on test scores using gender, age,
and the six risk factors as predictors. The model, F (8, 173) = 9.31, p < .001, accounted
for 31% of the variance in test scores (R2 = .305). As shown in Table 5, controlling for
the other variables, test scores were predicted by age (Beta = .469, p < .001), low income
(Beta = -0.143, p < .05), no previous experience in Head Start (Beta = -0.140, p < .05),
and taking the Spanish version of the test (Beta = -0.145, p < .05). Multiple regression
analysis revealed that age, income, previous enrollment in Head Start, and language
were significant predictors of test scores on the Fall Speed DIAL. Specifically, older
age and previous enrollment in head start predicted higher scores, while low income
predicted lower scores, as did taking the test in Spanish.
40
_______________________________________________________________________ Table 5 Multiple Regression of Gender, Age, and Risk Factors on Test Scores _______________________________________________________________________
B SE Beta t P
Gender 1.146 0.935 0.081 1.225 0.222 Age 6.508 0.943 0.469 6.904 0.001 Minority -0.878 1.544 -0.038 -0.568 0.571 Low Income -2.035 1.017 -0.143 -2.000 0.047 Number of Children -0.496 0.379 -0.089 -1.310 0.192 No Father 0.318 1.113 0.021 0.285 0.776 No Previous Preschool Enrollment -2.371 1.142 -0.140 -2.076 0.039 Spanish Test -2.698 1.333 -0.145 -2.025 0.045
Research Question 2: When compared to a multiple regression analysis, is the
cumulative risk index as good as or a stronger predictor of school readiness as
measured by the Total Score on the Fall Speed DIAL?
A multiple regression analysis was conducted to evaluate the predictive value of
the CRI on school readiness. The predictors included gender, age, and the CRI. The
model, F (3, 175) = 22.64, p < .001, accounted for 28% of the variance in test scores (R2
= .283). As shown in Table 6, controlling for the other variables, test scores were
predicted by age (Beta = .477, p < .001) and the CRI (Beta = -0.178, p < .01). Older age
predicted higher test scores, or increased school readiness, whereas higher scores on the
CRI predicted lower test scores, or lower levels of school readiness.
41
_______________________________________________________________________ Table 6 Multiple Regression of Gender, Age, and the Cumulative Risk Index on Test Scores _______________________________________________________________________ B SE Beta t p Gender 1.428 0.922 0.101 1.550 0.123 Age 6.600 0.908 0.477 7.269 0.001 Cumulative Risk Index -1.330 0.488 -0.178 -2.723 0.007
_______________________________________________________________________ Note: R2 = .283. The cumulative risk index was as good a predictor of test scores as the six
individual predictors. The model including age, gender and the six risk factors
accounted for 31% of the variance (see Table 5), while the model including age, gender,
and the cumulative risk index accounted for 28% of the variance (see Table 6). Only a
3% difference in variance was found between the two models predicting test scores.
Research Question 3: Using hierarchical regression, do individual risk factors add
anything above and beyond their sum, the CRI?
A hierarchical multiple regression analysis was conducted in order to determine
whether the individual risk factors add anything above and beyond the CRI. The
predictors were entered in three separate blocks. The first block included gender and
age. The second block was comprised of gender, age, and the CRI. The third block
added the six risk factors.
As shown in Table 7, Block 1, F (2, 173) = 29.088, p < .001, contained gender
and age as predictors. The block was significant and accounted for 25% of the variance.
42
Block 2, F (3, 170) = 22.392, p < .001, included age, gender, and the CRI and accounted
for 28% of the variance. The change in R2 from Block 1 to Block 2 was significant, R2
change = .029, p < .01; however, the change was too small to be considered a
meaningful change. Block 3, F (8, 165) = 9.042, p < .001, included gender, age, the CRI,
and the individual risk factors and accounted for about 30% of the variance. Although
the full model accounted for the most variance, the change in R2 from Block 2 and Block
3 was not significant, R2 change = .022, p = .406. Furthermore, Block 3 does not add
any significant predictors. Therefore, the results suggest that the individual risk factors
do not add to the model.
Supplementary Analyses
Additional analyses were conducted to examine potential interaction effects
between age, language, and gender and their effects on school readiness. Specifically, a
three-way (age X language X gender) ANOVA was conducted on the total score on the
Fall Speed DIAL. Means and standard deviations are displayed in Table 8. The results
revealed a main effect for age, with older children (aged 4 and 5) having higher mean
scores (M = 15.52, SD = 6.92) than younger children (M = 7.87, SD = 4.28). The results
failed to reveal any significant interaction effects, all ns.
Table 7 Multiple Regression of Gender, Age, the CRI, and Individual Risk Factors on School Readiness _______________________________________________________________________
B SE Beta t p
Block 1, (F = 29.088, p < .001, R2 = .254)
Gender 1.452 0.945 0.102 1.537 0.126
Age 6.997 0.922 0.504 7.589 0.001
Block 2, (F =22.392, p < .001, R2 = .283)
Gender 1.380 0.929 0.097 1.485 0.139
Age 6.639 0.916 0.478 7.244 0.001
Cumulative Risk Index -1.298 0.492 -0.173 -2.640 0.009
Block 3, (F = 9.042, p < .001, R2 = .305)
Gender 1.195 0.940 0.084 1.272 0.205
Age 6.474 0.956 0.466 6.771 0.001
Total Risk -1.868 1.014 -0.250 -1.842 0.067
Minority 0.872 1.799 0.037 0.485 0.629
No Father 2.116 1.719 0.141 1.231 0.220
No Head Start -0.345 1.534 -0.020 -0.225 0.822
Spanish Test -0.952 1.594 -0.051 -0.597 0.551
Number of Children 1.165 1.725 0.052 0.675 0.501 _______________________________________________________________________
Table 8 Average Scores on the Fall Speed DIAL by Language and Age _______________________________________________________________________ Male Female Total
N Mean SD N Mean SD N Mean SD English 3 years 22 7.32 4.26 31 8.87 3.83 53 8.23 4.05 4-5 years 48 15.65 7.37 43 16.44 6.58 91 16.02 6.98 Total 70 13.03 7.60 74 13.27 6.72 144 13.15 7.13 Spanish 3 years 7 6.00 3.92 5 6.80 6.94 12 6.33 5.11 4-5 years 14 12.14 6.36 6 15.83 5.74 20 13.25 6.27 Total 21 10.10 6.30 11 11.73 7.62 32 10.66 6.70 Total 3 years 29 7.00 4.15 36 8.58 4.31 65 7.87 4.28 4-5 years 62 14.86 7.26 49 16.37 6.44 111 15.52 6.92 Total 91 12.35 7.39 85 13.07 6.81 176 12.70 7.10
_______________________________________________________________________ Note: Means are from a Gender X Age. Gender main effect, F(1, 172) = 97.01, p = 0.106. Age main effect, F(1, 172) = 67.25, p < 0.001. Gender X Age Interaction, F(1, 172) = .001, p = .970. Summary
The study examined the contribution of the cumulative risk index to the
prediction of school readiness in 176 preschool children attending center-based Head
Start programs. Regression analyses and supplementary analysis indicate the cumulative
risk index was a significant predictor of Speed Dial scores. Individual risk factors did
not account for more variance than using gender, age, and the cumulative risk index as
45
the only predictors. Also, the cumulative risk index did not account for more
meaningful variance than using gender and age as the only predictors. No interaction
effects were found. These results will be discussed and implications identified in
Chapter V.
46
CHAPTER V
DISCUSSION AND CONCLUSIONS
Summary and Implication of Findings
The purpose of this study was to provide information regarding the influence of
child, parent, and family factors on the school readiness of a Head Start population using
the cumulative risk model. According to ecological systems theory (Bronfenbrenner,
1979), the microsystem or the child’s immediate settings, such as home and school, are
posited to have the greatest impact on the development of the child. Considering that
Head Start children are a population with inherent risks, this investigation sought to
explore risk factors within the microsystem that are associated with unfavorable school
readiness. Specifically, this exploration was conducted by using multiple analytic
approaches, including a single predictor approach known as the cumulative risk model.
Review of the related literature revealed few studies utilizing the cumulative risk model
have rarely included Head Start populations and have yet to thoroughly investigate
school readiness. This study addressed this gap in the literature by testing the efficacy of
the cumulative risk model in predicting school readiness in a Head Start population. The
investigation was divided into three research questions.
With six major factors accounted for either in multiple regression or with the use
of the cumulative risk index, results indicated that age, income, previous enrollment in
head start, and language were significant predictors of test scores on the Fall Speed
DIAL. Specifically, older age predicted higher scores, low income predicted lower
scores, previous enrollment in head start predicted higher scores, and taking the test in
47
Spanish predicted lower scores. Analysis revealed that the CRI was a significant
predictor of test scores on the Fall Speed DIAL. Higher scores on the CRI predicted
lower test scores and the individual risk factors did not contribute to the model above
and beyond the CRI. Adding the individual risk factors did not account for more
variance than using gender, age, and the CRI as the only predictors. Similarly, the CRI
did not account for more variance than using gender and age as the only predictors.
Further, supplementary analyses indicated a main effect for age, but no interaction
effects. Future studies need to continue to investigate interaction effects between
gender, age, and language.
Limitations
There are various limitations to the present study including validity of parent
information, risk factors measured, convergence of outcome measure, and limitations
inherent in the cumulative risk model. The results of this study must be considered
within the context of its limitations. All risk factor information is based solely on parent
self-report. Parents may provide inaccurate information perhaps with the intention of
increasing their probability of acceptance in the program (e.g., father not being present,
amount of income); thus, measurement of risk factors may be overestimated.
Alternatively, the parents may strive for social desirability in responding, thus resulting
in underestimation of risk. Further, there is potential for risk factors to change over time
and risk information in this study was gathered at a single point in time, when the parent
completed Family Information Form. Any changes in risk factors that may exacerbate
or ameliorate outcomes were not known.
48
Furthermore, the risk factors selected from the application are not exhaustive.
There are other risk factors that may also have the potential to contribute to negative
outcomes, such as child physiology, physical conditions at home, and teacher ability.
Moreover, protective factors (e.g., positive parent-child relationships) were not
considered in the current study. Their potential to offset risk remains unknown for this
sample.
A final limitation relates to the measures used in this study. The Speed Dial
provides a Total Score converging performances for the content areas of motor, concept,
and language. Since subtest area scores are not available on the Speed DIAL, this study
was not able to measure the degree to which the cumulative risk index or individual risk
factors impact different areas of development as may have been possible had the Dial-3
been administered. In addition, the cumulative risk model lacks specificity (Kendall-
Grove, 1997; Krishnakumar & Black, 2002). While empirical support for the continued
use of this model is primarily consistent, the model does not measure which risk factor is
the strongest predictor of school readiness or the process by which the risk factor
impacts outcomes.
Conclusions and Recommendations for Future Research
In sum, the current study adds empirical support to the continued use of the
cumulative risk model in predicting adverse developmental outcomes. This study
extends the cumulative risk model pioneered by Rutter (1979) to the school readiness of
a Head Start population; that is, as the number of risk factors increased school readiness
was compromised. Yet, the body of research exploring the efficacy of the cumulative
49
risk model in predicting school readiness of Head Start children is scarce. Given that
children from low-income families enter school with risks that exceed the general
preschool population (Pungello et al., 1996) and are at an increased risk for initial and
continued adverse academic performance (Whitehurst & Lonigan, 1998), a better
understanding of these risks is critical to inform prevention and intervention efforts.
As posited by Bronfenbrenner’s ecological systems theory, the microsystem,
such as the home and school, has the greatest potential of impacting the development of
children. While the current study provided support for this premise, the design of this
study did not investigate the process by which these risks impact the child. Thus, not
only should future studies explore the impact of the quantity of risk factors, but also
explore the quality of the relationships between the child and the primary caregivers
(e.g., parents and teachers), who are theorized to have the greatest impact on the
developing child (Bronfenbrenner, 1979).
Another area of interest would be to investigate how cumulative risks impact
development at different points in time. For example, as supported in the current study,
an increase in risk factors predicted school readiness during the preschool years. Of
interest would be to investigate if the total number of risks during the first year of Head
Start continued to impact school performance to the same degree during subsequent
years (e.g., end of kindergarten, third grade, end of elementary grades). Findings from
longitudinal studies investigating the impact of high risk in other low income
populations indicate the adverse effects of high risks during early childhood are likely to
persist (Ackerman et al., 2004; Burchinal et al., 2006; Gutman et al., 2003; Pungello et
50
al., 1996). Similar studies utilizing Head Start populations are needed to continue to
validate this hypothesis and add to the limited research base.
Most importantly, future research should consider assessing both risk and
protective factors in Head Start populations and their impact on school readiness.
Bryant, Burchinal, Lau and Sparling (1994) found that the quality of Head Start
classrooms predicted both achievement and cognitive scores. Burchinal et al. (2006)
found that the quality of classrooms as well as the quality of the parent-child interaction
mediated the negative impacts of social risk factors on academic and social skills. Other
protective factors, including ability level, teacher-child ratio, and so on need to be
identified in conjunction with “quality”. The degree to which these protective factors
reduce the negative impacts of risk factors on school readiness is worth investigating.
51
REFERENCES
Ackerman, B. P., Brown, E. D., & Izard, C. E. (2004). The relations between contextual
risks, earned income, and the school adjustment of children from economically
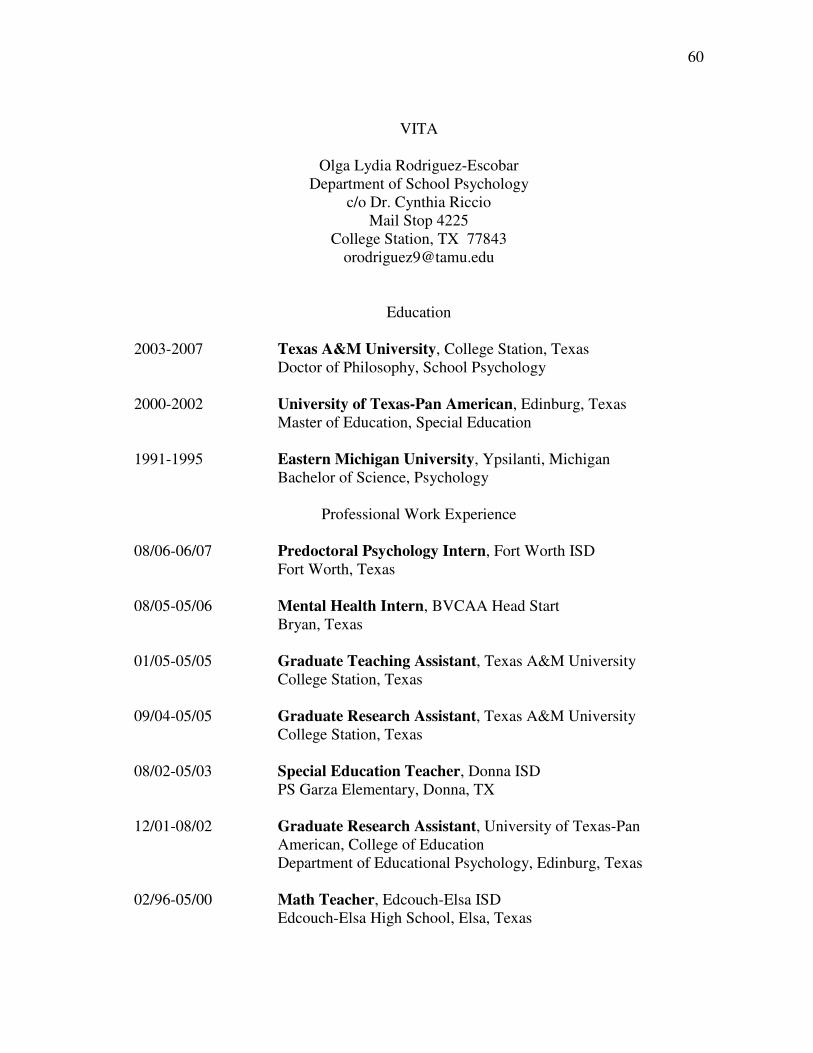
2003-2007 Texas A&M University, College Station, Texas Doctor of Philosophy, School Psychology
2000-2002 University of Texas-Pan American, Edinburg, Texas Master of Education, Special Education 1991-1995 Eastern Michigan University, Ypsilanti, Michigan Bachelor of Science, Psychology
Professional Work Experience
08/06-06/07 Predoctoral Psychology Intern, Fort Worth ISD Fort Worth, Texas 08/05-05/06 Mental Health Intern, BVCAA Head Start Bryan, Texas 01/05-05/05 Graduate Teaching Assistant, Texas A&M University College Station, Texas 09/04-05/05 Graduate Research Assistant, Texas A&M University College Station, Texas 08/02-05/03 Special Education Teacher, Donna ISD PS Garza Elementary, Donna, TX 12/01-08/02 Graduate Research Assistant, University of Texas-Pan American, College of Education Department of Educational Psychology, Edinburg, Texas 02/96-05/00 Math Teacher, Edcouch-Elsa ISD Edcouch-Elsa High School, Elsa, Texas