Clark GlymourCarnegie Mellon UniversityDepartment of Philosophy
Pittsburgh, PA 15213
cgO9 + @andrew. cmu. edu
Abstract
We applied TETRAD II, a causal discovery program developed in Carnegie MellonUniversity’s Department of Philosophy, to a database containing information on 204 U.S.colleges, collected by the US News and World Report magazine for the purpose of collegeranking. Our analysis focuses on possible causes of low freshmen retention in U.S. colleges.TETRAD II finds a set of causal structures that are compatible with the data.
One apparently robust finding is that student retention is directly related to the averagetest scores and high school class standing of the incoming freshmen. When test scoresand class standing are controlled for, factors such as student faculty ratio, faculty salary,and university’s educational expenses per student are all independent of both retentionand graduation rates, and, therefore, do not seem to directly influence student retention.Furthermore, simple linear regression applied to test scores, class standing, and retentiondata showed that the test scores and class standing explain 52.6% of the variance in freshmenretention rate and 62.5% of the variance in graduation rate (test scores alone explain 50.5%and 62.0% respectively). This result becomes even stronger when computed for the groupof top ranking colleges -- regression applied to a group of 41 top ranking colleges showedexplanation of 68.3% of the variance in freshmen retention rate and 77.0% in graduationrate (66.6% and 75% respectively for test scores alone).
As the test scores and class standing are both indicators of the overall quality of theincoming students, we predict that one of the most effective ways of improving studentretention in an individual college is increasing the college’s selectivity. High selectivity willlead to higher quality of the incoming students and, effectively, to higher retention rate.
1 Introduction
Even though some American colleges achieve a student retention rate of over 90%, themean retention rate tends to be close to 55% and in some colleges fewer than 20% ofthe incoming students graduate (see Figure 1 for the distribution of graduation ratesacross a set of 200 U.S. national universities). Low student retention usually means waste in effort, money, and human potential. Retention rate is often thought to indicatestudent satisfaction with their university program and, hence, indirectly, the quality of the
KDD-94 AAA1-94 Workshop on Knowledge Discovery in Databases Page 419
university. Indeed, a significant correlation can be observed between university rankingand retention rate m universities close to the top of ranking lists tend to have highretention rates. Is a university’s low student retention rate an indication of shortcomings inthe quality of education, facilities available to students, tuition costs, university’s location,or perhaps wrong admission policies? More importantly, what action can the universitytake to improve the student retention rate? Can such actions as higher spending onstudent facilities, increasing the student/faculty ratio, increasing quality standards forteaching faculty, or modifications to admission policies make a difference?
~udem rete~ion r~e
Figure 1: Histogram of the graduation rates for 200 U.S. national universities (Source:U.S. News and World Report).
This paper describes a preliminary effort to see what, if anything, aggregate data forman~ U.S. universities can tell us about the problem. Policy decisions demand that weknow the causal structure of the system that we want to manipulate, and we thereforebelieve that determining the interactions among different relevant variables, including thedirection of these interactions, is the necessary first step in addressing the problem. Asuniversity-scale experiments may be too expensive, ethically suspect, or otherwise imprac-tical, our research needs to rely mainly on observations. The analysis has to be practicallylimited to extracting patterns from large collections of measurements of relevant variables.Our analysis involves data concerning 204 U.S. colleges, collected annually by U.S. Newsand World Report for the purpose of their college ranking (the data available to us is for1992). In our analysis, we apply TETlZAD II [3], a program embedding recently devel-oped methods for causal discovery from observations. These methods, described in [4],are closely related to those employed in the induction of probabilistic models from data(e.g., [1]). While we are far from giving clear cut answers to the questions posed above, believe that our analysis provides some interesting insight into the problem. The availabledata suggests that the main factor in student retention among the studied variables is theaverage test scores (or other measures of academic ability) of incoming students. The testscores of matriculating students are a function of the quality of the applicants and theuniversity’s selectivity. High selectivity leads to high average test scores of the incomingstudents and effectively to higher freshmen retention and graduation rates. Factors such
Page 420 AAAI-94 Workshop on Knowledge Discovery in Databases KDD-94
as student faculty ratio, faculty salary, and university’s educational expenses per studentdo not seem to be directly causally related to freshmen retention. This hypothesis shouldbe checked using data internal to any particular university, especially since the nationaldata are aggregated to include both academic and non-academic dropouts. If the na-tional pattern is confirmed locally, we would suggest that, wherever possible, steps aimedat making the university more selective be taken. Improving the comparative image ofthe school, and therefore increasing the number of applicants, increasing the selectivity ofthe admission process, increasing the chance that good applicants will accept admissionoffer rather than choosing another university, should improve student retention in thelong run.
The remainder of the paper is structured as follows. We describe the analyzed dataset (Section 2) and our assumptions about this data (Section 3). Then we summarize view of the system that will provide us with prior information about the problem, usefulin causal discovery procedures (Section 4). The results of our analysis are presented Section 5. Section 5.1 presents the results of TETRAD II’s search for possible causalstructures that generated the data and Section 5.2 reports the results of applying simpleregression to selected interactions identified by TETRAD II. We finish with a discussionof these results and policy suggestions (Section 6).
2 The Data
The data used in our study consists of a set of statistics concerning 204 U.S. national uni-versities and national liberal arts colleges1 collected by the U.S. News and World Reportmagazine for the purpose of college ranking. To prepare the data for its annual rankingof co;lieges,~ U.S. News each year goes through a laborious process of data collection fromseveral hundred of U.S. colleges. The data is collected from various university offices, suchas admissions or business office, by means of surveys prepared by outside companies. Itis subsequently verified by the schools representatives. The process of collecting the dataand combining them into the final college ranking is described in [2].
We started with four spreadsheet files for 204 national universities provided by U.S.News and World Report: Instructional Resources Ranking, Selectivity Ranking, RetentionRanking, and Financial Resources Ranking. Each of the four spreadsheets containedthe 204 universities ranked from the best to the worst in the respective category. Tobring together various measurements and to relate the two variables of interest, freshmenretention rate and graduation rate to such indicators as coneges’ selectivity, financial andinstructional resources, we combined the four spreadsheets into one large spreadsheetcontaining over 100 variables measured for each of the 204 universities. Many of thesevariables were analytical derivatives of other variables (e.g., retention rate was simply theratio of graduating seniors to incoming freshmen, both numbers included separately inthe spreadsheet).
1Defined as major research universities and leading grantors of doctoral degrees.2The data available to us are for the year 1992.
KDD-94 AAAI-94 Workshop on Knowledge Discovery in Databases Page 421
The sample size, redundancy of the variable set, and missing values for various quan-tities, made it important to reduce the number of variables studied) We selected thefollowing nine variables for our analysis: average percentage of freshmen retention (apret),average percentage of graduation (apgra), rejection rate (rejr), average test scores of theincoming students (tstsc), class standing of the incoming freshmen (toplO), which is per-centage of the incoming freshmen who were in top 10% of their high school graduatingclass, percentage of admitted students who accept university’s offer (pace), total educa-tional and general expenses per student (spend), which is the sum spent on instruction,student services, academic support, including libraries and computing services, studentteacher ratio (strut), and average faculty salary (salar). Describing each of over 100 re-maining variables and discussing why we have not considered therefor our analysis wouldmake this paper unacceptably long. We limit ourselves to a few remarks. The valuesof a large nUmber of the variables were included indirectly in the nine chosen variables.Average test scores of incoming students (tstsc), for example, is a normalized compilationof values of 14 variables, including a breakdown of average results for various parts of SATand ACT tests. Average percentage of freshmen retention (apret) and average percentageof graduation (apgra) express the essence of all 14 variables in the Retention Rankingfile. Rejection rate (rejr) and percentage of admitted students who accept university’soffer (pace) express, along with the average test scores (tstsc) and class standing (toplO),selectivity of the school. We chose the total educational and general expenses per student(spend), student teacher ratio (strut) and average faculty salary (salar) as indicators ofthe quality of school’s teaching and financial resources.
From the complete set of 204 universities, we removed 23 universities that had missingvalues for any of the nine variables of interest. This resulted in a set of 181 data points.
3 The Assumptions
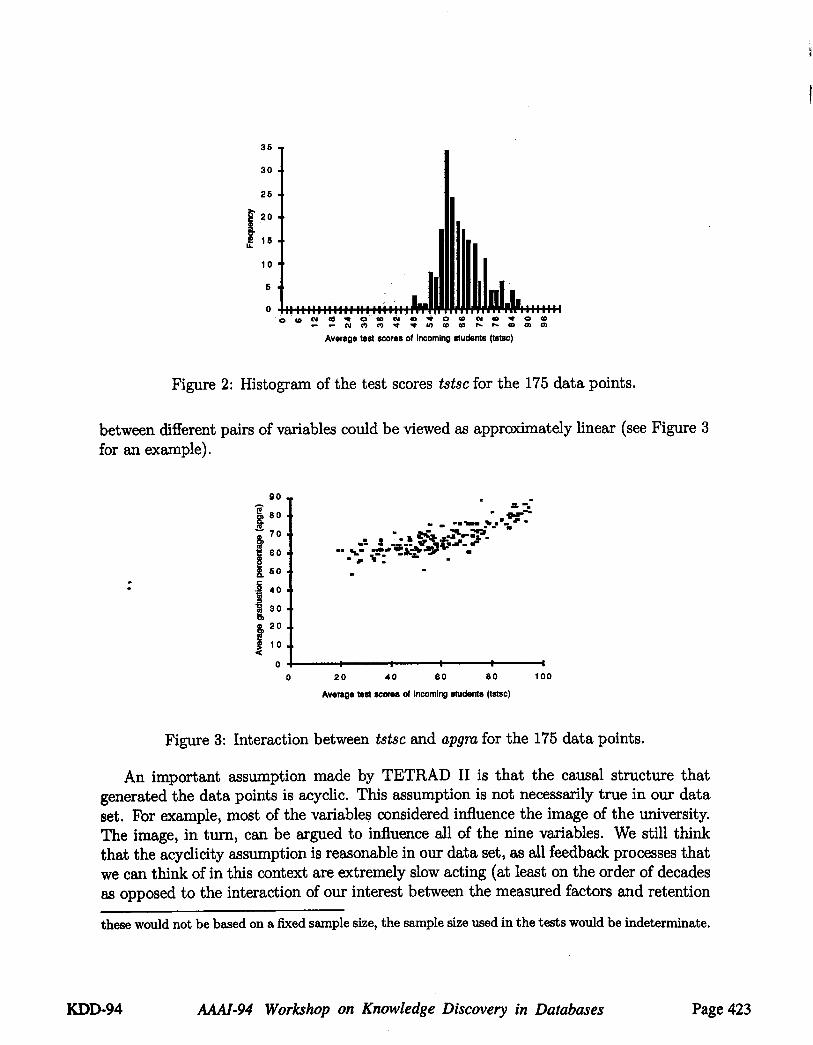
Although TETRAD II’s algorithms are independent on the actual distribution of thevariables, they rely on the outcomes of a series of statistical tests. The necessary tests areespecially powerful if we can assume normally distributed, linearly related variables. Westudied how reasonable this assumption is for the available data set by plotting histogramsof each of the nine variables and scatter plots of each pair of the nine variables. By visualinspection of the histograms and scatter plots, we removed six data points from the setof 181~ data points that appeared to be outliers. The resulting data set, consisting of175 data points, reasonably satisfies the normality and the linearity assumptions. Allhistograms were close to symmetric unimodal distributions (see Figure 2 for an example),with the exception of two positively skewed variables, spend and strut. The interactions
SA reviewer asked why any variables were omitted at all, and why covariances were not computed bysimply skipping missing data points. The power of statistical tests and the reliability of search dependon the ratio of the number of sample points to the number of variables: The higher the ratio, the better.Including variables with missing values and calculating covariances by skipping a particular unit for aparticular variable, as the reviewer suggested, would undermine the theoretical reliability of statisticaltests. Testing partial correlations involves multiple correlations from the correlation matrix and, since
Page 422 AAAI.94 Workshop on Knowledge Discovery in Databases KDD-94
35
3O
26
10
5
0
Average test scores of incoming students (tetsc)
Figure 2: Histogram of the test scores tstsc for the 175 data points.
between different pairs of variables could be viewed as approximately linear (see Figure for an example).
9O
7O
I"g. so.8 40
0
- ,n"m m -Iqlm ’Ib ll~Z ’ilm "
-- ~.- -.=,, ~’A-b-=’J~-- ."j.~:
I I I I I20 40 60 80 100
Average test scoces of incoming studerets (tstsc)
Figure 3: Interaction between tstsc and apgra for the 175 data points.
An important assumption made by TETRAD II is that the causal structure thatgenerated the data points is acyclic. This assumption is not necessarily true in our dataset. For example, most of the variables considered influence the image of the university.The image, in turn, can be argued to influence all of the nine variables. We still thinkthat the acyclicity assumption is reasonable in our data set, as all feedback processes thatwe can think of in this context are extremely slow acting (at least on the order of decadesas opposed to the interaction of our interest between the measured factors and retention
these would not be based on a fixed sample size, the sample size used in the tests would be indeterminate.
KDD-94 AAAI-94 Workshop on Knowledge Discovery in Databases Page 423
rate), so that in the snapshot provided by the 1992 data points they can be assumednegligible.
An assumption frequently made in causal modeling is causal sufficiency, which is anassumption that the analyzed variables form a self-contained structure -- there are nolatent common causes. An equivalent of this assumption is the assumption that all errorterms are independent. TETRAD II allows for search with both the causal sufficiency as-sumption and without it. As it is unlikely that the selected variables form a self-containedstructure, we have run TETRAD II without making the causal sufficiency assumption.Several control runs with causal sufficiency assumption did not reveal anything that wouldput our main conclusions in question.
4 Prior Knowledge
Interactions between some of the considered variables are reasonably well known. Forexample, we know the formula for computing the rejection rate, acceptance rate, retention,and graduation rates. We know what determines the tuition amount, the number ofaccepted students, the average faculty salary, etc. Inseveral discussions between us andour colleagues, we developed a reasonable consensus on the causal graph that involvesthe analyzed variables (see Figure 4). We believe that a variable that we named image
i,..oo..iFigure 4: Initial assumptions about causal interactions in the system. Variables insiderectangles are analyzed in our study.
of the school directly influences the number of applicants, their quality, and the numberof them that will accept the university’s admission offer. It also influences the quality of
Page 424 AAAI.94 Workshop on Knowledge Discovery in Databases KDD-94
the faculty and the financial situation of the college (consider, for example, endowmentfunds and higher likelihood of external funding). Financial status of the school influencesindirectly the tuition rate, the number of admitted students, student teacher ratio, averagefaculty salary, and quality of the faculty. Rejection rate and admission acceptance rateare determined by the number of applicants, the number of admitted students, and thenumber of them accepting the university’s offer. The average test scores of incomingfreshmen are determined by the overall quality of the applicants, the rejection rate, andthe admission acceptance rate. Finally, our only assumption about how freshmen retentionand graduation rates fit into this structure is that they do not cause any other variablesconsidered.
The only purpose for showing Figure 4 is to make explicit the time order among thestudied variables. In particular, the average spending per student (spend), student teacherratio (strut), and faculty salary (salar) are determined based on budget considerationsand are not influenced by any of the five remaining variables. Rejection rate (rejr) andpercentage of students who are offered admission (rcjr) and who accept the university’soffer (pacc) precede the average test scores (tstsc) and class standing (toplO) of incomingfreshmen. The average freshmen retention rate (apret) precedes average graduation rate(apgra) because graduation rate depends on freshmen dropouts but also on dropouts inlater years. We used only the temporal ordering of variables captured below as informationto restrict the model search for TETRAD II.
While applying, for example, simple regressions to the data would allow us to makepredictions about the value of a variable of interest given the values of other variables,this would not be sufficient for our purpose. What we want is to predict the effects ofexternal manipulations of the system by means of new policies aimed at improving theretention rate. For this, we need information about the underlying causal structure of thesystem. We describe the results of the search for a class of causal structures that couldpossibly have generated the analyzed data set by means of a causal discovery program,TETRAD II, in Section 5.1.
In Section 5.2 we describe the results of measuring the strength of the most importantcausal connections suggested by the data: from the average test scores and class standingto retention rate and from test scores and class standing to the graduation rate. We applysimple linear regression to obtain a quantitative estimate of the interaction between thesevariables. We emphasize that we used regression only to estimate the coefficients in alinear model obtained by the TETRAD II search. If regression were used instead tosearch for the variables influencing retention and graduation, it would include variables
KDD-94 AAAI-94 Workshop on Knowledge Discovery in Databases Page 425
that TETRAD II says have no direct influence on the outcome, and that are conditionallyindependent of the outcome variables.
5.1 TETRAD II
When TETRAD II is run on normally distributed data with the linearity assumption,it converts the raw data into a correlation matrix. The values of the elements of this-
matrix is all that matters in discovery. The correlation matrix for all 175 data points isreproduced in Figure 5.
Figure 5: Matrix of correlations among the analyzed variables (175 data points).
When making decisions about independence of a pair of variables conditional on asubset of the remaining variables, TETRAD II uses statistical tests (in the normal-linearcase, standard z-test for conditional independence). The search begins with a completeundirected graph. Edges in this graph are removed by testing for appropriate conditionalindependence relations. If two variables a and b become independent when conditioned ona subset 3 of the remaining variables, there is no direct causal connection between them
all interactions between a and b take place through intermediate variables includedin S. This is a simple consequence of two assumptions known as Markov condition andthe faithfulness condition [4]. Orientation of the remaining edges is based on a theoremproven in [4]. For example, suppose that two variables a and b are not directly connected(i.e., there exists a subset of the remaining variables S that makes a and b conditionallyindependent) and there is an edge between a and c and an edge between b and c. If a and are independent conditional on S and dependent conditional on ,~Uc, then a and b are bothdirect causal predecessors of c. In other words, the edges can be oriented from a to c andfrom b to c. Both, the process of removing edges and the process of orienting edges, can beaided by prior information about the underlying graph. TETRAD II allows for specifyingpresence or absence of direct connections between pairs of variables and also temporalprecedence among the variables. Knowledge of temporal precedence allows for limitingthe number of tests for conditional independence and, under certain circumstances, aids inorienting the edges of the graph. If, for example, variables a and b are directly connected,there is no latent common cause of a and b, and a precedes b in time, then the edge canbe oriented from a to b. The details of TETRAD II’s search algorithm are given in [4].
Page 426 AAAI-94 Workshop on Knowledge Discovery in Databases KDD-94
Depending on the significance level used in independence tests, TETRAD II’s individ-ual statistical decisions regarding independence may be different and a different class ofcausal structures may result. It is, therefore, a good practice to run the program at severalsignificance levels. We ran TETRAD II with the following significance levels: p = 0.2,0.15, 0.1, 0.05, 0.01, and 0.001. The core of the structure, i.e., how freshmen retentionrate and graduation rate are related to the remaining variables, was insensitive to changesin significance. This suggests that the structure proposed by TETRAD II is robust. Thegraphs proposed by TETRAD II for significance levels p = 0.05 and p = 0.001 are pre:sented in Figure 6, The edges of the graph have the following meaning: A single arrow(-----*) denotes a direct causal influence. A double headed arrow (~--,) between two vari-ables denotes presence of a latent common cause of these two variables. An single arrowwith a circle at one end (o---~) expresses TETRAD II’s inability to deduce whether thereis a direct influence between the two variables (---,) or a latent common cause betweenthem (,--~). An edge with circles at both ends (o-~) expresses TETRAD II’s inabilityto deduce whether there is a direct influence between the two variables and, if so, whatis its direction ( > or , ) or a latent common cause between them (4----+).
salar ~ toplO toplO
apgm
p-O.05 I)=O.O01
Figure 6: Two relevant parts of causal graphs proposed by TETRAD II for the completedata set of 175 universities (significance levels p=0.05 and p=0.001).
In both of the graphs in Figure 6 as well as in most of the graphs suggested byTETRAD II any connection between apret and apgra and variables like spend, strat, orsalaris through tstsc or toplO. The "latent common cause" connection between salar andapret, shown in Figure 6 for p - 0.05, disappears at p < 0.04. Most graphs contained adirect causal connection between the average test scores and freshmen retention. Also,the graphs contain a direct (or through a common cause) connection between freshmenretention and graduation rate.
TETRAD II’s algorithms are much more reliable in determining existence of directcausal links than in determining their orientation. Therefore, prior knowledge suppliedto TETRAD II may be critical for the orientation of edges of the graph. We used thetemporal sequence described in Section 4, but we also checked the robustness of ourresult to temporal ordering by running TETRAD II with no assumptions about temporalprecedence. Although TETRAD II proposed different orderings of variables, all direct
KDD-94 ~-94°.
Workshop on Knowledge Discovery in Databases Page 427
links, and the direct link between test scores and retention and graduation in particular,were the same in both cases.
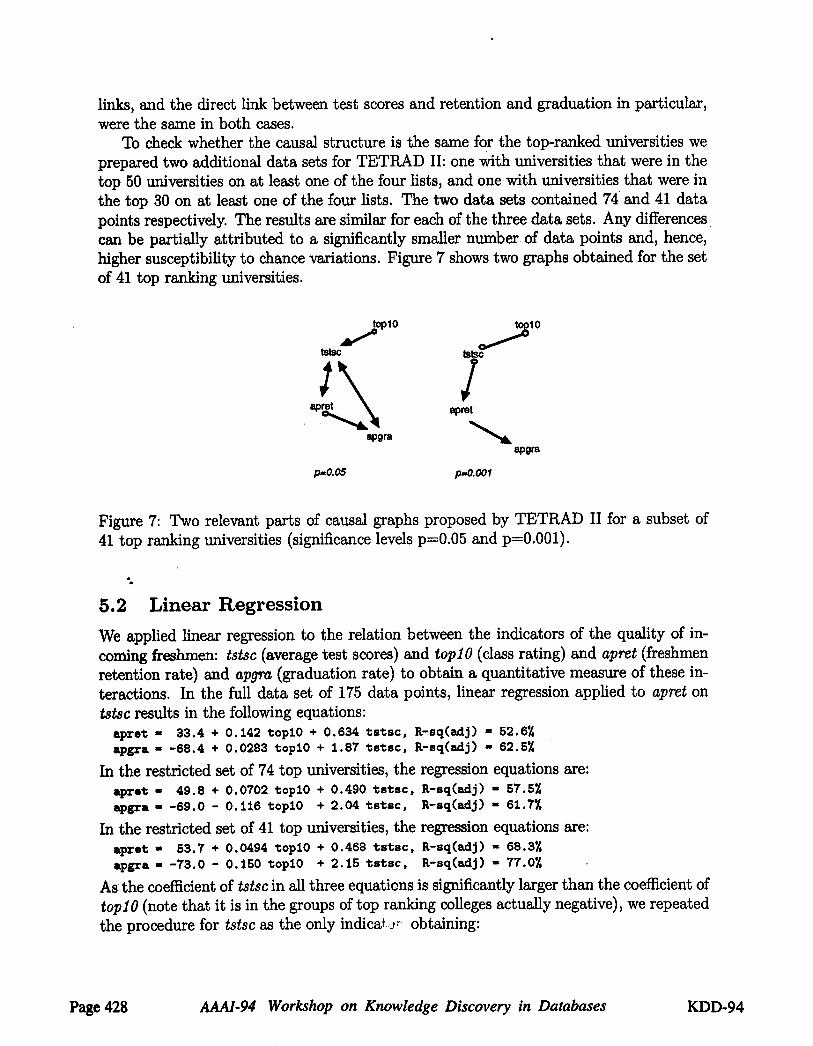
To check whether the causal structure is the same for the top-ranked universities weprepared two additional data sets for TETRAD II" one with universities that were in thetop 50 universities on at least one of the four lists, and one with universities that were inthe top 30 on at least one of the four lists. The two data sets contained 74 and 41 datapoints respectively. The results are similar for each of the three data sets. Any differencescan be partially attributed to a significantly smaller number of data points and, hence,higher susceptibility to chance variations. Figure 7 shows two graphs obtained for the setof 41 top ranking universities.
p-O. 05 t>,0.001
apgra
Figure 7: Two relevant parts of causal graphs proposed by TETRAD II for a subset of41 top ranking universities (significance levels p=0.05 and p=0.001).
5.2 Linear Regression
We applied linear regression to the relation between the indicators of the quality of in-coming freshmen: tstsc (average test scores) and toplO (class rating) and apret (freshmenretention rate) and apgra (graduation rate) to obtain a quantitative measure of these in-teractions. In the full data set of 175 data points, linear regression applied to apret on~s~sc results in the following equations:
As the coefficient of tstsc in all three equations is significantly larger than the coefficient oftoplO (note that it is in the groups of top ranking colleges actually negative), we repeatedthe procedure for tstsc as the only indica~,J,~’ obtaining:
Page 428 AAAI-94 Workshop on Knowledge Discovery in Databases KDD-94
In the restricted set of 74 topapre¢ = 37.7 + 0.713 terseapgra - -61.8 + 1.84 Cstsc,
In the restricted set of 41 topapret = 49.2 + 0.574 tstecap~a - -59.4 + 1.82 ¢stsc,
R-sq(adj) = 50.5ZR-scl(adj) ,, 62.0~,
universities, the same regression equations are:, R-sq(adj) = 57.0Z
R-sq(adj) - 63.2Z
universities, the regression equations are:, R-eq(adj) - 66.6Z
R-sq(adj) - 75.0Z
Although the impact of test scores on the average freshmen retention rate and graduationrate is smaller for top ranking colleges (note a smaller value of the coefficient), these testscores explain more of the variance. In the group of top ranking colleges, the average testscores of incoming freshmen explain as much as 75% of the variance in graduation rates.Average test scores along with class standing explain as much as 77% of the variance ingraduation rates.
6 Discussion
It seems that none of the variables in the data set are directly causally related to freshmenretention except for test scores and class standing. This result, following directly fromthe fact that freshmen retention rate and graduation rate are, given average test scoresand class standing, conditionally independent of all remaining variables, seems to berobust across varying significance levels, availability of prior knowledge, and data set size.The average test scores seem to have a high predictive power for student retention andgraduation rates. For the top 41 ranking colleges, average test scores in combination withclass standing explain as much as 68.3% of the variance in freshmen retention rate and77%~of the variance in graduation rate.
Average test scores and class standing of incoming students can be viewed as indicatorsof the quality of incoming students. It seems that retention rate in an individual collegecan be improved by increasing the quality of the incoming students. This, in turn, can beimproved by increasing the number and the quality of applicants. The better the pool ofapplicants from which an admission committee can select, the better the accepted studentsand, hopefully, the better the matriculating students are likely to be. Changing factorssuch as faculty salary, student/teacher ratio, or spending per student should, accordingto our result, have no direct effect on freshmen retention and graduation rates.
Theoretically, it is possible to use the regression coefficients between average testscores and retention rate obtained in this study to predict the impact of improvementin the average test scores of incoming students on freshmen retention and graduation.There are, however, potential problems with making predictions of an intervention at oneinstitution, as the coefficients of the regression equations do not need to be identical foreach institution.
One limitation in our study is that the available U.[/. News data do not disaggregateacademic from non-academic dropouts. We predict that internal data will show a differ-ence between average test scores of dropouts (academic and non-academic) and graduates.
KDD-94 AAAI-94 Workshop on Knowledge Discovery in Databases Page 429
Another limitation is that our data do not disaggregate between different departments.Some departments may have many academic dropouts, others few. Also, the availabledata set did not include other variables that may have been relevant, as geographicallocation (climate, urban/rural, etc.), tuition costs, available academic support, financialsituation of the students, prominence of athletics on campus, etc.
Finally, it is possible to apply alternative prior models of interaction of the variables inour data set. One alternative, suggested to-us by Steven Klepper, might involve one latentvariable influencing all nine variables studied. This model, however, would not accountfor the strong conditional independences observed in the data, and is in fact rejected bythe standard f ratio test (Chi square of 356 with 27 degrees of freedom).
7, Acknowledgments
Considerable data collection effort and generosity in making the collected data availableon the part of U.S. News and World Report made this study possible. Steven Klepper,Chris Meek, Richard Scheines and Peter Spirtes contributed to our work with valuablesuggestions. We thank Felicia Ferko, Kevin Lamb, and Jeffrey Bolton from CarnegieMellon University’s Office of Planning and Budget for enabling us to access the data filesand providing insightful background information. Anonymous reviewers prompted us formore details in our presentation. Support for this work has been provided by ONR andNPRDC under grant N00014-93-1-0568 to Carnegie Mellon University.
References
[1]%
Gregory F. Cooper and Edward Herskovits. A Bayesian method for the induction ofprobabilistic networks from data. Machine Learning, 9:309-347, 1992.
[2]Robert J. Morse, Senior Editor. U.S. News & World Report’s America’s Best CollegesRankings: How it’s done. Technical report, U.S. News and World Report, Washington,DC, May 8, 1992.
[3] Richard Scheines, Peter Spirtes, Clark Glymour and Christopher Meek. TETRAD II:Tools .for Discovery. Lawrence Erlbaum Associates, Hillsdale, N J, 1994.
[4] Peter Spirtes, Clark Glymour and Richard Scheines. Causation, Prediction, andSearch. Springer Verlag, 1993.
Page 4:30 AAAI-94 Workshop on Knowledge Discovery in Databases KDD-94