Application of Tracer-Injection Techniques to Demonstrate Surface-Water and Ground-Water Interactions Between an Alpine Stream and the North Star Mine, Upper Animas River Watershed, Southwestern Colorado By Winfield G. Wright and Bryan Moore Prepared in cooperation with Animas River Stakeholders Group and San Juan County, Colorado Water-Resources Investigations Report 03–4172 U.S. Department of the Interior U.S. Geological Survey
Transcript
Application of Tracer-Injection Techniques to Demonstrate Surface-Water and Ground-Water Interactions Between an Alpine Stream and the North Star Mine, Upper Animas River Watershed, Southwestern Colorado
By Winfield G. Wright and Bryan Moore
Prepared in cooperation withAnimas River Stakeholders Group andSan Juan County, Colorado
Water-Resources Investigations Report 03–4172
U.S. Department of the InteriorU.S. Geological Survey
U.S. Department of the InteriorGale A. Norton, Secretary
U.S. Geological SurveyCharles G. Groat, Director
U.S. Geological Survey, Reston, Virginia: 2003
For sale by U.S. Geological Survey, Information ServicesBox 25286, Denver Federal CenterDenver, CO 80225
For more information about the USGS and its products:Telephone: 1-888-ASK-USGSWorld Wide Web: http://www.usgs.gov/
Any use of trade, product, or firm names in this publication is for descriptive purposes only and does not imply endorsement by the U.S. Government.
For additional information write to:District ChiefU.S. Geological SurveyBox 25046, Denver Federal CenterMail Stop 415Denver, Colorado 80225
Description of Study Area..................................................................................................2Purpose and Scope.............................................................................................................4Previous Studies..................................................................................................................4
Methods of Study..........................................................................................................................6Tracer-Injection Methods..................................................................................................7
Interpretation of Tracer-Injection Data.................................................................10Results of Tracer Recovery and Discharge Measurements................................................11
Tracer Recovery at the North Star Mine.......................................................................11Continuous-Injection Tests.....................................................................................11Slug-Injection Test...................................................................................................13
Tracer Recovery at Other Sites.......................................................................................14Discharge of Springs, Streams, and Mine Outflows...................................................15
Surface-Water and Ground-Water Interactions at the North Star Mine..........................18Summary......................................................................................................................................20References Cited........................................................................................................................21Appendix—Supplemental Information....................................................................................25
Figures 1. Map showing location of the North Star Mine, Belcher Gulch, and other historical mines in the area, upper Animas River watershed,
southwestern Colorado..............................................................................................2 2. Map showing underground tunnels associated with the North Star,
Sultan, and Gladstone Mines, tracer-injection points, and sampling sites in the vicinity of Belcher Gulch........................................................................3
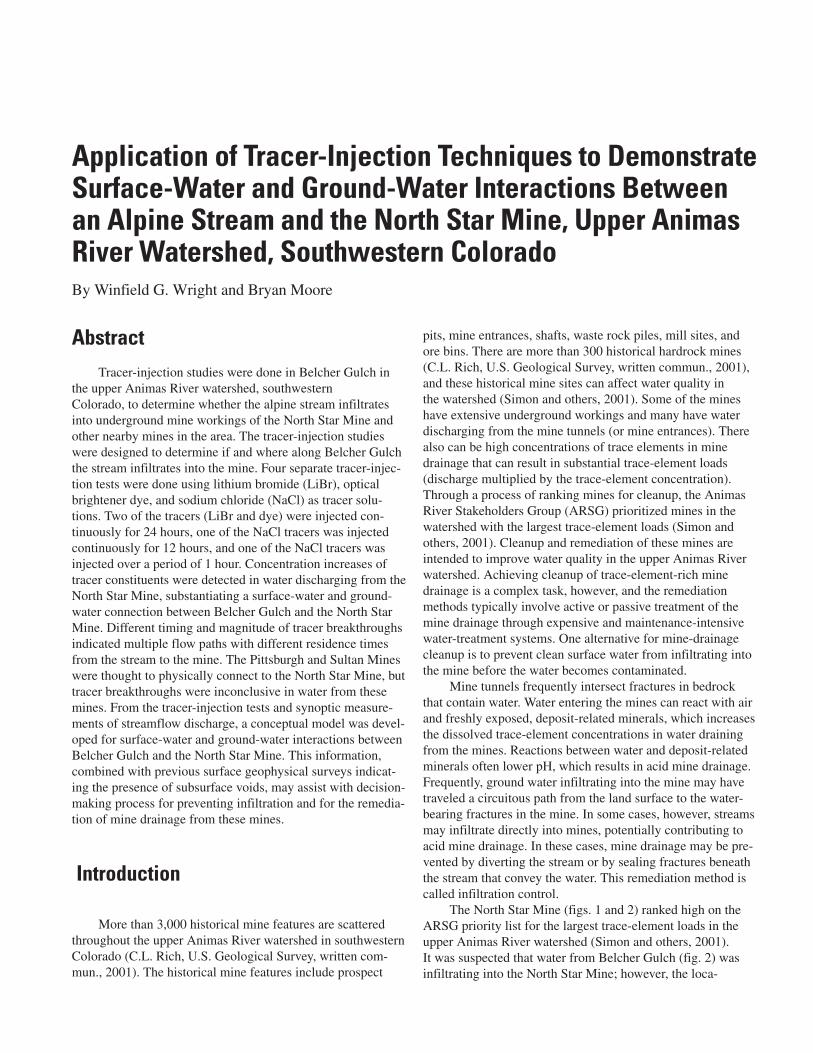
3. Graph showing discharge, pH values, and dissolved-zinc concentrations in water from the North Star Mine, December 1997 through
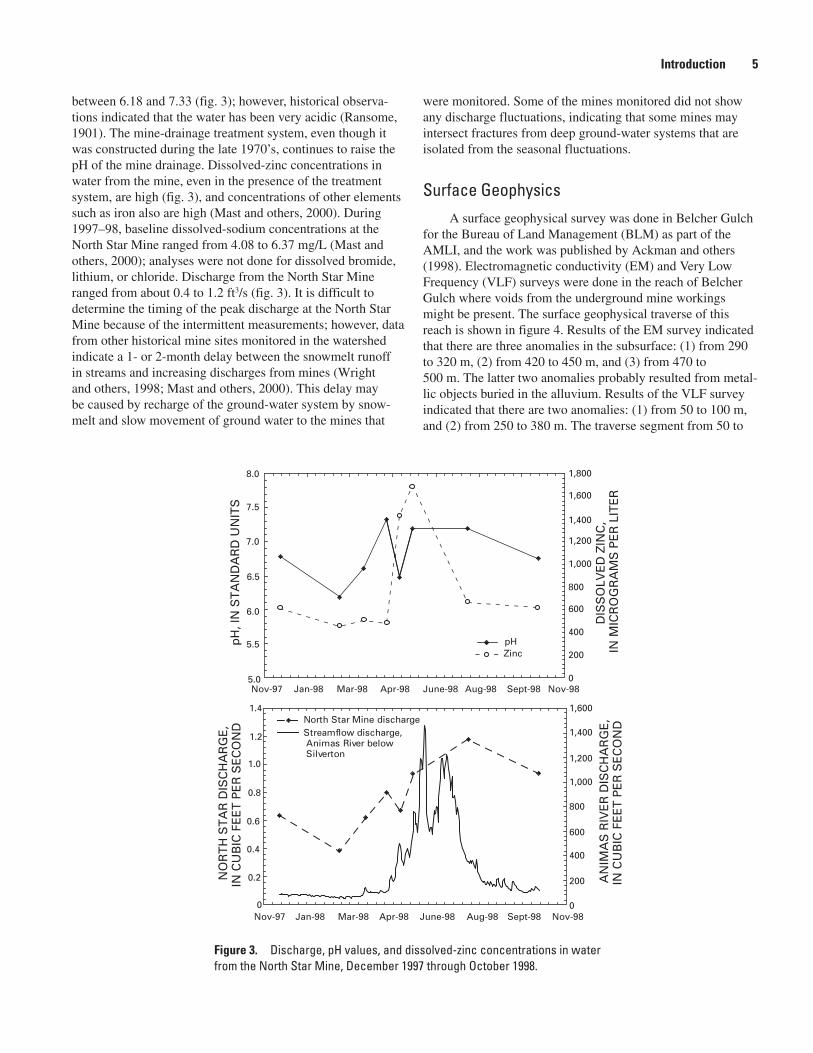
October 1998.................................................................................................................5 4. Aerial photograph showing surface geophysical traverse done in Belcher Gulch by Ackman and others (1998).........................................................................6
iii
5. Photographs showing tracer-injection test locations in Belcher Gulch......................................8 6. Photographs showing the high-altitude northern branch (site A) and southern branch (site B) of Belcher Gulch.....................................................................................................9 7–14. Graphs showing: 7. Hypothetical example of tracer-recovery curve showing breakthrough, peak concentration, and receding concentrations of tracer constituent......................................10 8. Dissolved-lithium and dissolved-bromide concentrations in water from the North Star Mine after injection began at site E....................................................................................12 9. Optical brightener dye concentrations in water from the North Star Mine after injection began at site G...............................................................................................................13 10. Dissolved-sodium and dissolved-chloride concentrations in water from the North Star Mine after injection began at site H.......................................................................14 11. Dissolved-sodium concentrations in water from the North Star Mine after injection began at site B...............................................................................................................15 12. Dissolved-lithium and dissolved-sodium concentrations in water from the Pittsburgh Mine..............................................................................................................................16 13. Dissolved-lithium and dissolved-sodium concentrations in water from the Sultan Mine.....................................................................................................................................17 14. Dissolved-sodium concentrations in water from the spring in the Belcher Gulch alluvial fan............................................................................................................................18 15. Schematic cross section of surface-water and ground-water interactions between Belcher Gulch and the North Star Mine....................................................................20
Appendix figures A1. Graphs showing calibration curves for determination of dissolved lithium and dissolved sodium by atomic absorption spectroscopy and optical brightener dye by fluorometry........................................................................................................26 A2. Graphs showing calibration curves for determination of dissolved potassium by atomic absorption spectroscopy and dissolved bromide and dissolved chloride by ion-selective electrode.............................................................................28
Tables 1. Discharge measurements of water from springs, streams, and mine outflows.............................................................................................................................................19 A1. Laboratory quality-assurance data..................................................................................................29
iv
Conversion Factors
Multiply By To obtain
meter (m) 0.3048 foot (ft)cubic foot per second (ft3/s) 0.02832 cubic meter per second (m3/s)mile (mi) 1.609 kilometer (km)gallon (gal) 3.785 liter (L)kilogram (kg) 0.454 pound (lb)
Abbreviated units used in this report
g gram mL milliliter mA milliamp mV millivolt nm nanometer µm micrometer mg/L milligram per liter mL/min milliliter per minute
Acronyms used in this report:
AMLI U.S. Geological Survey Abandoned Mine Lands Initiative ARSG Animas River Stakeholders Group BLM Bureau of Land Management USGS U.S. Geological Survey
v
Application of Tracer-Injection Techniques to Demonstrate Surface-Water and Ground-Water Interactions Between an Alpine Stream and the North Star Mine, Upper Animas River Watershed, Southwestern Colorado
AbstractTracer-injection studies were done in Belcher Gulch in
the upper Animas River watershed, southwestern Colorado, to determine whether the alpine stream infiltrates into underground mine workings of the North Star Mine and other nearby mines in the area. The tracer-injection studies were designed to determine if and where along Belcher Gulch the stream infiltrates into the mine. Four separate tracer-injec-tion tests were done using lithium bromide (LiBr), optical brightener dye, and sodium chloride (NaCl) as tracer solu-tions. Two of the tracers (LiBr and dye) were injected con-tinuously for 24 hours, one of the NaCl tracers was injected continuously for 12 hours, and one of the NaCl tracers was injected over a period of 1 hour. Concentration increases of tracer constituents were detected in water discharging from the North Star Mine, substantiating a surface-water and ground-water connection between Belcher Gulch and the North Star Mine. Different timing and magnitude of tracer breakthroughs indicated multiple flow paths with different residence times from the stream to the mine. The Pittsburgh and Sultan Mines were thought to physically connect to the North Star Mine, but tracer breakthroughs were inconclusive in water from these mines. From the tracer-injection tests and synoptic measure-ments of streamflow discharge, a conceptual model was devel-oped for surface-water and ground-water interactions between Belcher Gulch and the North Star Mine. This information, combined with previous surface geophysical surveys indicat-ing the presence of subsurface voids, may assist with decision-making process for preventing infiltration and for the remedia-tion of mine drainage from these mines.
Introduction
More than 3,000 historical mine features are scattered throughout the upper Animas River watershed in southwestern Colorado (C.L. Rich, U.S. Geological Survey, written com-mun., 2001). The historical mine features include prospect
pits, mine entrances, shafts, waste rock piles, mill sites, and ore bins. There are more than 300 historical hardrock mines (C.L. Rich, U.S. Geological Survey, written commun., 2001), and these historical mine sites can affect water quality in the watershed (Simon and others, 2001). Some of the mines have extensive underground workings and many have water discharging from the mine tunnels (or mine entrances). There also can be high concentrations of trace elements in mine drainage that can result in substantial trace-element loads (discharge multiplied by the trace-element concentration). Through a process of ranking mines for cleanup, the Animas River Stakeholders Group (ARSG) prioritized mines in the watershed with the largest trace-element loads (Simon and others, 2001). Cleanup and remediation of these mines are intended to improve water quality in the upper Animas River watershed. Achieving cleanup of trace-element-rich mine drainage is a complex task, however, and the remediation methods typically involve active or passive treatment of the mine drainage through expensive and maintenance-intensive water-treatment systems. One alternative for mine-drainage cleanup is to prevent clean surface water from infiltrating into the mine before the water becomes contaminated.
Mine tunnels frequently intersect fractures in bedrock that contain water. Water entering the mines can react with air and freshly exposed, deposit-related minerals, which increases the dissolved trace-element concentrations in water draining from the mines. Reactions between water and deposit-related minerals often lower pH, which results in acid mine drainage. Frequently, ground water infiltrating into the mine may have traveled a circuitous path from the land surface to the water-bearing fractures in the mine. In some cases, however, streams may infiltrate directly into mines, potentially contributing to acid mine drainage. In these cases, mine drainage may be pre-vented by diverting the stream or by sealing fractures beneath the stream that convey the water. This remediation method is called infiltration control.
The North Star Mine (figs. 1 and 2) ranked high on the ARSG priority list for the largest trace-element loads in the upper Animas River watershed (Simon and others, 2001). It was suspected that water from Belcher Gulch (fig. 2) was infiltrating into the North Star Mine; however, the loca-
By Winfield G. Wright and Bryan Moore
tions and amounts of infiltration were uncertain. In addition, scientific evidence was needed regarding the connection of Belcher Gulch to the North Star Mine before proceeding with an expensive infiltration-control remediation plan.
The North Star Mine, which operated intermittently dur-ing 1882–1978, contains about 3 mi of underground tunnels. Historical records generally were not available, and the best information about the mine was obtained by oral communi-cation with previous employees and mining engineers that worked in the mine. During the reconnaissance phase of this study, it was assumed that water discharging from the mine flowed freely through the mine. After the tracer-injection study had begun, oral communication with a previous mine employee revealed that a mine-drainage treatment system had been constructed inside the mine during the late 1970’s before the mine was sealed (the mine entrance was sealed by back-filling). This mine-drainage treatment system consists of an anoxic limestone drain, which contains several tons of lime-stone. In theory, the mine-drainage treatment system would improve acid mine drainage by increasing pH and causing dis-solved metals to precipitate out of solution. Unfortunately, the system also could potentially remove constituents used during tracer-injection studies, thereby complicating interpretation of the tracer-injection results.
Description of Study Area
The upper Animas River watershed encompasses 146 mi2 of rugged mountainous terrain in the San Juan Mountains of southwestern Colorado. Altitudes range from 9,200 ft near the town of Silverton, Colo., to 13,800 ft at the summit of Niagara Peak (fig. 1). The upper Animas River watershed has three main branches upstream from Silverton—the Animas River, Cement Creek, and Mineral Creek. The upper Animas River is a southward-flowing tributary of the San Juan River, which is a major tributary of the Colorado River. The principal form of precipitation occurs as snow during November through May of each year, which can accumulate to 15 ft or more. Streamflow discharges can vary substantially, and about 80 percent of the annual runoff is derived from snowmelt, which occurs during May, June, and July of each year. For example, discharges in the Animas River downstream from Silverton can range from about 55 ft3/s during the low-flow period of late summer to 3,000 ft3/s during snowmelt runoff of May-July.
The North Star Mine entrance is located along lower Mineral Creek downstream from the confluence of Belcher Gulch with Mineral Creek (fig. 2). The underground mine workings were known to penetrate beneath Belcher Gulch; however, there were several sources of water to the mine including a possible deep ground-water source that flows upward from a shaft in the mine, and a possible source of
Figure 1. Location of the North Star Mine, Belcher Gulch, and other historical mines in the area, upper Animas River watershed, southwestern Colorado.
2 Application of Tracer-Injection Techniques to Demonstrate Surface-Water and Ground-Water Interactions Between an Alpine Stream and the North Star Mine, Upper Animas River Watershed, Southwestern Colorado
water where the mine tunnels penetrate beneath the gulch (Steve Fearn, Fearn Engineering, Silverton, Colorado, oral commun., 2001). The principal source of water to the mine, however, is uncertain. It could be difficult to remediate the deep ground-water source, but it may be possible to remediate the source of water from the gulch.
Other mines exist that may be physically connected to the North Star Mine through mine tunnels, or hydrologically connected through fractures that are common to the mineral-
ized vein systems (Steve Fearn, Fearn Engineering, Silverton, Colorado, oral commun., 2001). The Sultan Mine (figs. 1 and 2) is known to physically connect to the North Star Mine; however, the Sultan Mine is higher in the topography than the North Star Mine entrance, and it is uncertain whether there is a water connection. The Pittsburgh Mine (fig. 1) is known to trend in the direction of the North Star Mine because the same vein systems were being developed. The Pittsburgh Mine is lower in the topography than the North Star Mine entrance;
Figure 2. Underground tunnels associated with the North Star, Sultan, and Gladstone mines, tracer-injection points, and sampling sites in the vicinity of Belcher Gulch.
hence, a water connection may be possible. The water must flow a long distance underground, however, for the connection to occur.
During snowmelt (high flow), discharge from Belcher Gulch can be high. The stream is known to flow to Mineral Creek during high flow; however, no discharge measurements have been made of Belcher Gulch during high flow. During low flow, water in Belcher Gulch disappears completely into the alluvium/colluvium as the stream flows down the moun-tain, and the stream does not flow to Mineral Creek. Springs are present in the alluvial fan at the bottom of Belcher Gulch, however, which may be the water that infiltrates into the alluvium. Alluvial fans typically occur at the bottom of alpine catchments, streamflow losses to alluvial fans are common, and springs typically occur at the downgradient (or down-stream) end of the alluvial fans.
Upstream from site E (fig. 2) is a waterfall (site D), and during September 2001, much more water was present in the stream above the waterfall than in the lower reaches. It was apparent from visual inspection that the stream was losing flow to the subsurface at many reaches along Belcher Gulch. It is unclear, however, whether the stream loses flow into the alluvium/colluvium of the alpine catchment, flowing down the canyon in the subsurface through the alluvium, or if the stream loses flow into underground mine structures.
The mine-drainage treatment system in the North Star Mine was designed to remove trace elements; however, the system also could remove tracer-constituent concentrations introduced as part of this study. Several processes may be involved with mine-drainage treatment systems (Wildeman and Updegraff, 1997): (1) anaerobic biological processes, (2) sorption, (3) pH controls, (4) ion exchange, and (5) aerobic biological processes. Anaerobic biological processes can decrease trace-element concentrations through sulfate reduc-tion, which precipitates sulfide minerals such as pyrite, and other trace elements can be coprecipitated with the pyrite. Reducing conditions are stimulated by the addition of organic matter to the mine-drainage treatment system. Trace-element concentrations can be decreased through sorption of trace ele-ments to surfaces within the mine-drainage treatment system. Organic matter, rock substrate, and freshly precipitated iron oxyhydroxides can provide surfaces for sorption of trace elements. Trace-element concentrations can be decreased through pH controls, which is accomplished by the addition of limestone as the rock substrate in the mine-drainage treatment system. Limestone increases the pH, and trace elements such as aluminum, cadmium, copper, iron, and manganese are less soluble at higher pH values. Increasing the pH causes these trace elements to precipitate or sorb to the substrate in the mine-drainage treatment system. Trace-element concentra-tions can be decreased by ion exchange, where certain ions in the mine-drainage treatment system are exchanged for trace elements. After the mine drainage exits the anaerobic mine-drainage treatment system, aerobic biological processes can decrease dissolved trace-element concentrations by precipita-
tion, which includes iron and sulfur oxidation. In a literature search regarding mine-drainage treatment systems, no infor-mation was available on the removal rates of lithium, bromide, sodium, or chloride. From discussions with previous employ-ees at the North Star Mine, it is believed that several tons of limestone was placed in the mine-drainage treatment system, and organic matter was not added to the system (Ernie Kuhn, Mayor, Town of Silverton, oral commun., 2001).
Purpose and Scope
The purposes of this report are to determine (1) whether Belcher Gulch water is infiltrating into the backside of the North Star Mine, (2) where along Belcher Gulch the water is infiltrating, (3) possible hydraulic connections between Belcher Gulch to other historical mines in the area, and (4) ground-water residence times and characteristics of tracer recovery curves from the injection point to the North Star adit. If it is demonstrated that Belcher Gulch water infiltrates into the backside of the North Star Mine, possible remediation steps might include routing the stream around the mine work-ings, construction of a grout curtain to prevent infiltration, or lining the channel.
Tracer-injection techniques were used to determine whether the principal source of water to the North Star Mine was caused by infiltration of surface water from Belcher Gulch into the mine. The tracer-injection studies were designed to determine where along Belcher Gulch the stream infiltrates into the mine. The study also was to determine whether water from Belcher Gulch flows to other mines in the area. If it is demonstrated that Belcher Gulch water infiltrates into the North Star, remediation measures may be undertaken to decrease the discharge of water from the mine, thereby reducing trace-element loads.
Reconnaissance for the tracer-injection studies was done during August to September 2001, and baseline samples were collected during September 10 and 11, 2001. The tracer-injection studies were done during September 15 through October 11, 2001. Water samples were collected for tracer-related constituents from September 15 through November 1, 2001. This work was done by the U.S. Geological Survey in cooperation with the Animas River Stakeholders Group (ARSG) and San Juan County, Colo.
Previous Studies
Water-Quality SamplingAs part of the USGS Abandoned Mine Lands Initia-
tive (AMLI), water-quality samples were collected from the North Star Mine on a monthly or seasonal basis for 1 year during 1997–98 (Mast and others, 2000). Water draining from the North Star Mine has a relatively high pH that fluctuates
4 Application of Tracer-Injection Techniques to Demonstrate Surface-Water and Ground-Water Interactions Between an Alpine Stream and the North Star Mine, Upper Animas River Watershed, Southwestern Colorado
between 6.18 and 7.33 (fig. 3); however, historical observa-tions indicated that the water has been very acidic (Ransome, 1901). The mine-drainage treatment system, even though it was constructed during the late 1970’s, continues to raise the pH of the mine drainage. Dissolved-zinc concentrations in water from the mine, even in the presence of the treatment system, are high (fig. 3), and concentrations of other elements such as iron also are high (Mast and others, 2000). During 1997–98, baseline dissolved-sodium concentrations at the North Star Mine ranged from 4.08 to 6.37 mg/L (Mast and others, 2000); analyses were not done for dissolved bromide, lithium, or chloride. Discharge from the North Star Mine ranged from about 0.4 to 1.2 ft3/s (fig. 3). It is difficult to determine the timing of the peak discharge at the North Star Mine because of the intermittent measurements; however, data from other historical mine sites monitored in the watershed indicate a 1- or 2-month delay between the snowmelt runoff in streams and increasing discharges from mines (Wright and others, 1998; Mast and others, 2000). This delay may be caused by recharge of the ground-water system by snow-melt and slow movement of ground water to the mines that
were monitored. Some of the mines monitored did not show any discharge fluctuations, indicating that some mines may intersect fractures from deep ground-water systems that are isolated from the seasonal fluctuations.
Surface GeophysicsA surface geophysical survey was done in Belcher Gulch
for the Bureau of Land Management (BLM) as part of the AMLI, and the work was published by Ackman and others (1998). Electromagnetic conductivity (EM) and Very Low Frequency (VLF) surveys were done in the reach of Belcher Gulch where voids from the underground mine workings might be present. The surface geophysical traverse of this reach is shown in figure 4. Results of the EM survey indicated that there are three anomalies in the subsurface: (1) from 290 to 320 m, (2) from 420 to 450 m, and (3) from 470 to 500 m. The latter two anomalies probably resulted from metal-lic objects buried in the alluvium. Results of the VLF survey indicated that there are two anomalies: (1) from 50 to 100 m, and (2) from 250 to 380 m. The traverse segment from 50 to
North Star Mine dischargeStreamflow discharge, Animas River below Silverton
Figure 3. Discharge, pH values, and dissolved-zinc concentrations in water from the North Star Mine, December 1997 through October 1998.
Introduction 5
100 m indicated the presence of a highly conductive geologic feature such as a vein of sulfide minerals or fractures filled with conductive liquid such as acid mine drainage (Ackman and others, 1998, p. 10). The cross section of the VLF data indicated a fracture zone dipping toward the southwest. The anomaly from 250 to 380 m was broad and indicative of frac-tures filled with freshwater. This anomaly probably extends to depths of at least 60 m and was observed near the subsurface location of the North Star vein (fig. 2). Anomalies were con-sidered to represent open underground voids.
Methods of Study
To evaluate whether surface water in Belcher Gulch might be infiltrating into the North Star Mine, a salt- and dye-tracing approach was used. In order to pinpoint the location where the stream infiltrates into the mine, tracer-injection tests were done from four sites in Belcher Gulch: (1) the south-ern branch of Belcher Gulch immediately upstream from the confluence with the northern branch and upgradient from the underground mine workings (fig. 2, site E); (2) between the locations where major vein structures were mapped in the underground mine workings (fig. 2, site G); (3) downstream from most of the underground tunnels and mine workings (fig. 2, site H); and (4) at a high-altitude location on the south-
Figure 4. Aerial photograph showing surface geophysical traverse done in Belcher Gulch by Ackman and others (1998).
6 Application of Tracer-Injection Techniques to Demonstrate Surface-Water and Ground-Water Interactions Between an Alpine Stream and the North Star Mine, Upper Animas River Watershed, Southwestern Colorado
100 m �������������������������������������������������������������������
N
��
ern branch of Belcher Gulch (fig. 2, site B). Different tracer solutions were used for the different injection sites described above: (1) lithium bromide (LiBr at site E); (2) optical brightener dye (Tinopal CBS-X at site G); (3) sodium chlo-ride (NaCl at site H); and (4) sodium chloride (NaCl at site B). Laboratory analytical methods, calibration of analytical instruments, calculation of concentration errors, and quality- assurance data are presented in the Appendix at the end of this report.
Tracer-Injection Methods
Continuous-Injection Tests The first tracer-injection test used saturated lithium bro-
mide (LiBr) as the tracer solution, and dissolved lithium and bromide were the target tracer constituents. A bromide ion-selective electrode was placed in the North Star Mine drainage to detect any breakthrough of the tracer solution. On September 14 to 15, pumps, batteries, solar battery charger, portable water tank, and LiBr powder were carried up Belcher Gulch. The LiBr injection site E was located on a 25-degree slope in the southern branch (fig. 5, site E). About 60 gal of stream water was placed in the portable tank and mixed with 53.5 lb of LiBr for an injectate concentration of 11,190 mg/L as Li. Pumping of the LiBr tracer solution began on September 15, 2001, at 1:25 p.m. and continued for 24 hours at a pumping rate of 67.5 + 1.3 mL/min. Injection rates and battery voltages were monitored overnight. Concentration of lithium in the stream downstream from the confluence (fig. 2, site F) was 315 µg/L. Pumping ceased on September 16 at 2:20 p.m. Dissolved-lithium and dissolved-bromide concentra-tions were analyzed in water samples collected from the North Star mine for this injection test.
The second tracer-injection test used optical brightener dye (Tinopal CBS-X) as the tracer solution, and the fluores-cent dye was the target tracer constituent. On September 16, the equipment was transferred to site G (fig. 5), and 70 gal of stream water was placed in the portable water tank and mixed with 14.3 lb of dye for an injectate concentration of 25,000 mg/L. A metal pipe, or well point, was driven about 3 ft into the alluvium to facilitate the injection of the dye into the subsurface (fig. 5). Pumping of the dye tracer solution into the metal pipe began on September 17, 2001, at 3:20 p.m. and continued for about 24 hours at a pumping rate of 50 + 1.5 mL/min. Injection rates and battery voltages were monitored overnight. Concentration of dye in the stream 300 ft downstream from the injection point was 38.5 mg/L, or a relative fluorescence of 200 units. Water samples col-lected from the North Star Mine entrance during dye injection were qualitatively examined for the presence of dye by using a battery-operated ultraviolet (UV) light. Pumping ceased on September 18 at 3:15 p.m.
The third tracer-injection test used saturated sodium chloride (NaCl) as the tracer solution, and dissolved sodium and chloride were the target tracer constituents. On September 18, the equipment was transferred to site H (fig. 5), and 80 gal of stream water was placed in the portable water tank and mixed with 135.5 lb of NaCl for an injectate concentration of 98,349 mg/L as Na. Pumping of the NaCl tracer solution into the stream began on September 19, 2001, at 12:00 p.m. and continued at a pumping rate of 200 + 1.6 mL/min for about 12 hours when the injection pump failed. The dissolved-sodium concentration was 171 mg/L downstream from the injection site. Dissolved sodium and dissolved chloride were analyzed in water samples collected from the North Star Mine for this injection test.
Slug-Injection Test
The initial design of the fourth tracer-injection test was to carry the equipment up the Belcher Gulch canyon to site B and inject saturated NaCl into the stream over a 24-hour period. On October 11, 2001, NaCl was carried up the mountain; however, unexpected winter conditions prevented a standard tracer-injection test from being done. Instead of injecting the NaCl solution over a 24-hour period, 50 lb of NaCl was slowly poured into the stream over a period of 1 hour at site B. A true slug-injection might be defined as the instantaneous dumping of a tracer solution into the stream (Mull and others, 1988; Gospodaric and Habic, 1976); however, pouring of the NaCl into the stream during a 1-hour period is more similar to a slug-injection test than it is to a continuous-injection test. The dissolved-sodium concentration was 524 mg/L at site B down-stream from the slug-injection location. Dissolved-sodium concentrations were analyzed in water samples collected from the North Star Mine for this injection test; dissolved-chloride concentrations were not analyzed.
Sample Collection
An automatic sampler was placed at the North Star Mine entrance (fig. 2, site K) to sample intermittently during and after injection of the tracer solutions. During September 15 through 20, the automatic sampler was set to collect 1 L of water from the mine entrance at 2-hour intervals. During September 20 through November 1, the sampler was set to collect samples at 7-hour intervals. Water samples were collected from the high-altitude northern branch (site A), the high-altitude southern branch (site B), Belcher Gulch downstream from the confluence of the northern and southern branches (site F), Belcher Gulch downstream from the Level 4 tunnel (site I), the spring in the Belcher Gulch alluvial fan (site J), Sultan Mine drainage at the North Star road (site L), Sultan Mine (site M), and the Pittsburgh Mine (fig. 1). Additional samples were collected from the North Star Mine entrance during the injection tests for real-time monitoring of
Methods of Study 7
�������������
Southern Branch��������������� ����
�����������������
���������������������
���������������������������������
��������������
���������������������
��������������
Figure 5. Tracer-injection test locations in Belcher Gulch.
8 Application of Tracer-Injection Techniques to Demonstrate Surface-Water and Ground-Water Interactions Between an Alpine Stream and the North Star Mine, Upper Animas River Watershed, Southwestern Colorado
bromide and chloride concentrations and qualitative dye detec-tion. In all, more than 200 water samples were collected as part of this study, and more than 340 laboratory analyses were done on these samples.
Most of the samples were filtered through 0.45-µm capsule filters into 250-mL plastic bottles; some samples were decanted from the 1-L automatic sampler bottle into 250-mL plastic bottles without filtration. Samples for lithium and sodium analyses were acidified using nitric acid. For the dye analyses, the samples were filtered through 0.45-µm syringe filters and were not acidified. Samples for dye analyses are frequently analyzed unfiltered; however, the iron oxyhydrox-ide precipitates in water from the North Star Mine interfered with the fluorometric analyses; hence, the samples were filtered.
Discharge Determinations
Quantification of the discharges in streams in the study area was done to describe the flow losses in Belcher Gulch, and whether the flows were lost to the alluvial fan or the
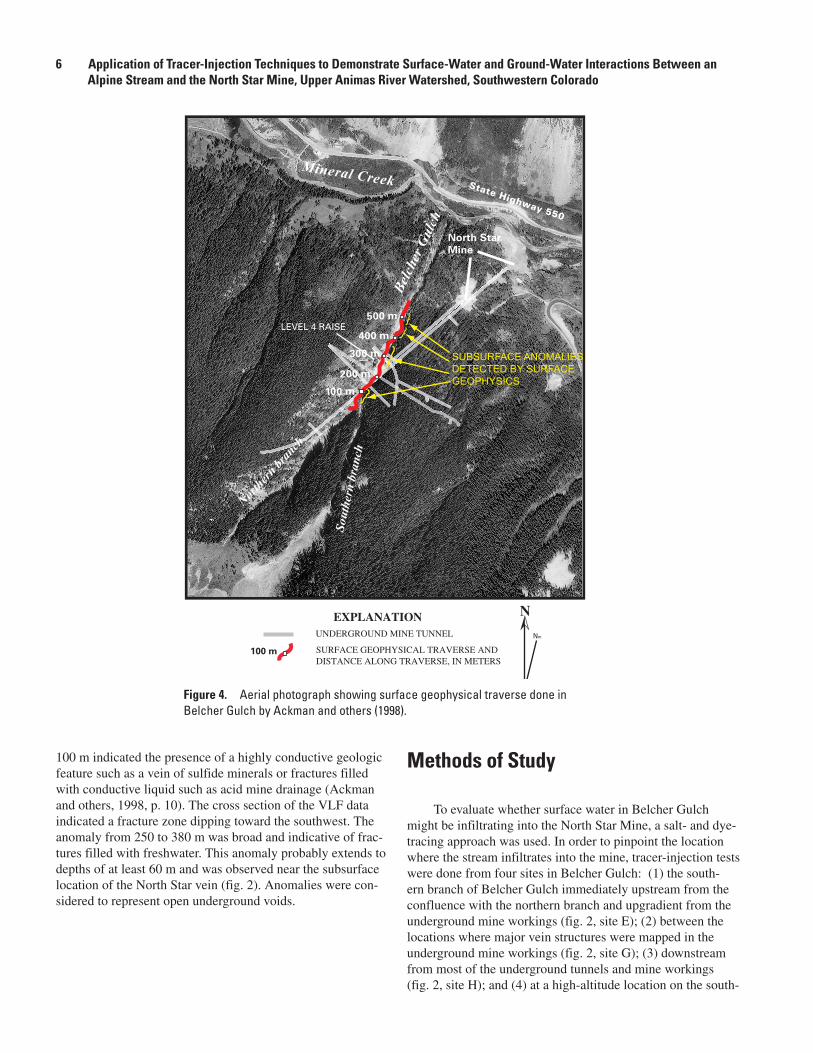
ground-water system, which may then flow to the North Star Mine. Because of the variable nature of the high-altitude stream, several types of discharge-measurement techniques were used. A pygmy meter was used when an open channel was present, and there was adequate water for measurement (for example, sites G, H, and K, fig. 2). For small volumes of water in an open channel and discharge from springs, volu-metric measurements were made (for example, sites I and J). At site A, the channel was filled with rocks (fig. 6); at site B, ground water was emanating over a 100-ft-wide area (fig. 6). Therefore, discharge was determined at these sites by using spot-injection tests. A staff gage was installed at the North Star Mine entrance (site K) so frequent stage readings could be taken, and the stage readings were referenced to discharge measurements.
Errors for pygmy meter measurements can be on the order of +10 percent and can be greater in mountain streams with turbulent flows and irregular cross sections (Rantz, 1982). The volumetric measurements were done using a 2-gal plastic bag that was calibrated and graduated to indicate the fill volumes; the time taken to fill the bag was measured using a stopwatch, and discharge was determined by the volume
Figure 6. The high-altitude northern branch (site A) and southern branch (site B) of Belcher Gulch.
Methods of Study 9
filled per unit of time. Errors on volumetric flow measure-ments are very small, and this method provides the most accurate estimate for discharge of flows from small mountain streams and small mine discharges (Rantz, 1982).
During the spot-injection tests, the northern branch (site A) was flowing underneath rocks and boulders that filled the channel (fig. 6). The stream could not be accessed except by removing rocks, and only part of the stream could then be accessed after removing rocks. In the southern branch (site B), ground water was discharging from bedrock, boulders, mossy areas, and alpine grass clumps amongst dead trees placed by avalanches (fig. 6). Slopes were greater than 30 degrees at site B. Streamflow measurement of these high-altitude streams would be impossible using conventional methods. In order to quantify the amount of water in the high-altitude streams for comparison to the lower reaches, a small pump, battery, solar panel, and 1,000 g of tracer salt were used to make spot-injection tests to determine streamflow discharge. Saturated potassium chloride (KCl) was used as the spot-injec-tion solution, dissolved potassium was the target constituent, and discharge was determined through dilution of the potas-sium by the streamwater. A chloride probe was placed in the streams downstream from the injection sites to determine when the tracer reaches had become fully mixed. After analyz-ing dissolved-potassium concentrations in the laboratory, the equation for the conservation of mass was used to make the discharge determination:
Qs=Q
pC
p/(C
s–C
b)
where: Q
s is unknown streamflow discharge,
Qp is injection-pump discharge,
Cp is spot-injection solution concentration,C
s is dissolved-potassium concentration in the stream
downstream from the injection point, andC
b is baseline dissolved-potassium concentration in the
stream prior to the injection test.
At the northern branch site A, the injection solution was pumped directly into the stream through a cleared space in the rocks (fig. 6). The sample was collected for the tracer solu-tion through another cleared space in the rocks about 300 ft downstream from the injection site. Water in the southern branch discharged over a 100-ft reach (fig. 6), and the tracer solution was injected into one of these water sources. About 300 ft downstream from the injection site, the stream narrows down to a 10-ft-wide channel where an equal-width-integrated sample was collected for determination of the tracer-constitu-ent concentration. In general, errors on spot-injection dis-charge measurements are relatively small compared to pygmy meter measurements (Rantz, 1982), and the errors are limited to analytical determinations of the tracer constituent in the laboratory.
Interpretation of Tracer-Injection Data
Performing a tracer-injection test in underground mines is similar to tracer-injection tests in naturally occurring underground caves. There may be combinations of free-flow-ing streams, calm pools, waterfalls, slow movement through water-filled fractures, and mixing with other water sources. There also may be sediments or gravels that can retain tracer
Figure 7. Hypothetical example of tracer recovery curve showing breakthrough, peak concentration, and receding concentrations of tracer constituent.
10 Application of Tracer-Injection Techniques to Demonstrate Surface-Water and Ground-Water Interactions Between an Alpine Stream and the North Star Mine, Upper Animas River Watershed, Southwestern Colorado
constituents, slowing the recovery of the tracer, resulting in attenuation of the tracer. Attenuation of the tracer also can be caused by chemical reaction of the tracer with other con-stituents in the water, and by reaction with the mine-drainage treatment system. A hypothetical example of a tracer recovery curve is shown in figure 7. Tracer constituents in ground-water systems typically show an initial “breakthrough,” which is the indication of the arrival of the tracer constituent (similar to the rising limb of a streamflow hydrograph, fig. 7). The “residence time,” or traveltime of the bulk of the tracer-constituent mass, is typically indicated by the time from the beginning of injec-tion to the peak concentration of the tracer constituent (fig. 7) (Mull and others, 1988; Gospardic and Habic, 1976).
For this study, the positive indication of tracer recovery is indicated by the tracer breakthrough. The receding concentra-tions of the tracer-recovery curve (fig. 7) might show a gradual decrease of tracer concentrations, which is caused by tracer retention in sediments, the tracer residing in pools or eddies, or ground-water velocities limited by low-permeability fractures. Much information can be derived from the characteristics of the tracer-recovery curve. For example, a sharp peak and rap-idly receding concentrations can indicate little or no storage in the ground-water system; the tracer moves through the system virtually uninhibited. A broad peak and gradual decline of the receding concentrations can indicate slow ground-water veloc-ities or ample storage capacity in the aquifer. Multiple peaks of the tracer-recovery curve can indicate multiple flow paths for tracer movement through the ground-water system, where the different flow paths have different residence times. In this study, the mine-drainage treatment system might attenuate different tracer constituents at different rates, such that a more soluble constituent (or a constituent less subject to removal by the treatment system) might exhibit a more rapid breakthrough than a more reactive tracer constituent. As a result of these characteristics, the tracer-recovery curves are complex and are difficult to interpret.
Baseline concentrations of tracer constituents should have been analyzed for a lengthy period prior to the injection tests. However, during summer of 2001, the study area had above average rainfall, and the hydrologic conditions were variable; hence, baseline samples would not have been representative of the tracer period. For this study, samples were collected during the period of the tracer-injection study, were analyzed in the laboratory, and the range of analytical uncertainty (or analyti-cal error) determined for each data point (see “Laboratory Analytical Methods” section in the Appendix). The data were plotted on time-series graphs, examined for baseline-like val-ues, and the averages and standard deviations of baseline-like values were determined. Some of the data exhibited downward trends on time-series graphs during the tracer period; there-fore, the baseline-like values were represented by sloped lines. The standard deviations were multiplied by 2 to graphically depict envelopes of the plus-or-minus 2-times the standard deviation (or +2-sigma) of the baseline-like values. The crite-ria for determination of tracer breakthrough consisted of tracer
concentrations where the range of uncertainty of individual sample concentrations exceeded the +2-sigma envelope.
Results of Tracer Recovery and Discharge Measurements
Six tracer-injection tests were done as part of this study. Four of the tracer-injection tests—three continuous-injection and one slug-injection test—were done to identify possible hydrologic connections between Belcher Gulch and mines in the area. Two of the tracer-injection tests were done as spot-injection tests to determine streamflow discharge in high-altitude alpine streams. For the connections between Belcher Gulch and the mines, samples were collected from water flowing from mine entrances located thousands of feet or miles (in the case of the Pittsburgh Mine) downgradient from the injection sites. For spot-injections tests, samples were collected from the streams just a few feet downstream from the injection sites.
Tracer Recovery at the North Star Mine
Continuous-Injection TestsInjection of lithium bromide began at site E on
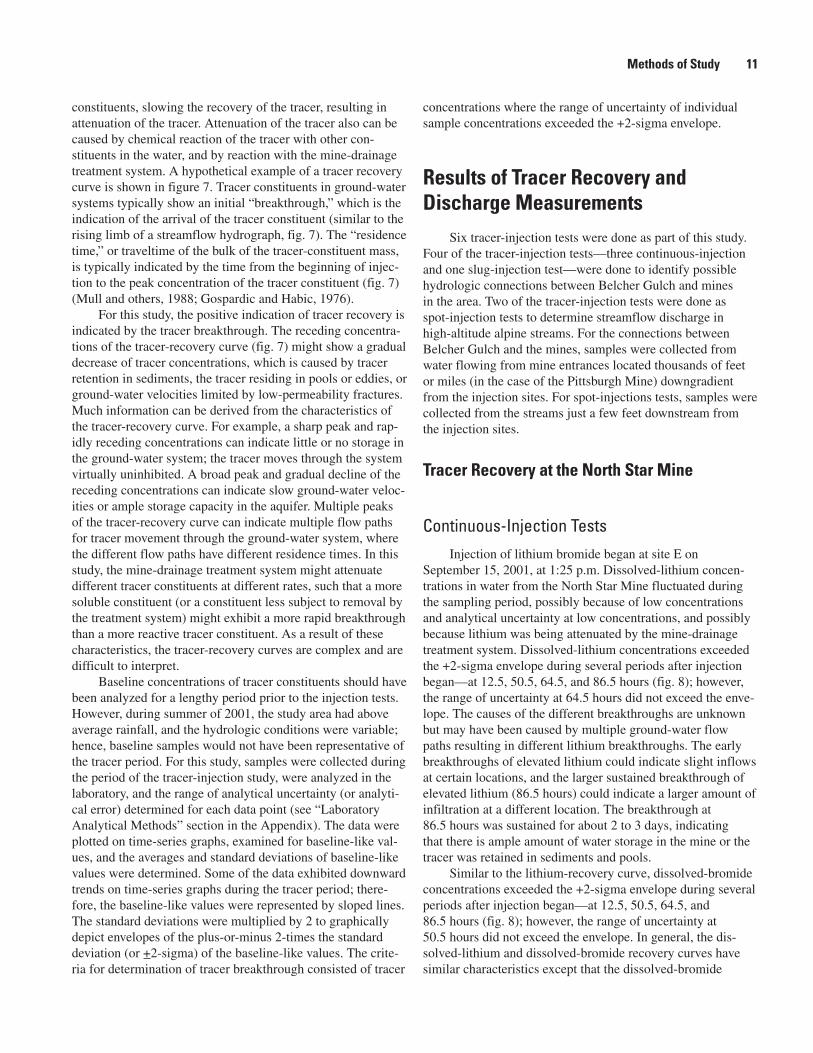
September 15, 2001, at 1:25 p.m. Dissolved-lithium concen-trations in water from the North Star Mine fluctuated during the sampling period, possibly because of low concentrations and analytical uncertainty at low concentrations, and possibly because lithium was being attenuated by the mine-drainage treatment system. Dissolved-lithium concentrations exceeded the +2-sigma envelope during several periods after injection began—at 12.5, 50.5, 64.5, and 86.5 hours (fig. 8); however, the range of uncertainty at 64.5 hours did not exceed the enve-lope. The causes of the different breakthroughs are unknown but may have been caused by multiple ground-water flow paths resulting in different lithium breakthroughs. The early breakthroughs of elevated lithium could indicate slight inflows at certain locations, and the larger sustained breakthrough of elevated lithium (86.5 hours) could indicate a larger amount of infiltration at a different location. The breakthrough at 86.5 hours was sustained for about 2 to 3 days, indicating that there is ample amount of water storage in the mine or the tracer was retained in sediments and pools.
Similar to the lithium-recovery curve, dissolved-bromide concentrations exceeded the +2-sigma envelope during several periods after injection began—at 12.5, 50.5, 64.5, and 86.5 hours (fig. 8); however, the range of uncertainty at 50.5 hours did not exceed the envelope. In general, the dis-solved-lithium and dissolved-bromide recovery curves have similar characteristics except that the dissolved-bromide
Methods of Study 11
curve has a downward slope and the dissolved-lithium curve does not (fig. 8). It is uncertain why the dissolved-bromide recovery curve shows a downward slope and the dissolved-lithium curve does not. Tracer breakthroughs of both lithium and bromide tracer constituents substantiate a surface-water and ground-water connection between Belcher Gulch and the North Star Mine. The numerous breakthroughs indicate mul-
tiple ground-water flow paths; however, there are differences in the magnitude of the concentration increases, which may have been caused by the mine-drainage treatment system or reactions of the tracer constituents with acid mine drainage.
Injection of the optical brightener dye began at site G on September 17, 2001, at 3:20 p.m. Because there are no base-line dye concentrations, the 2-sigma approach was not applied
Figure 8. Dissolved-lithium and dissolved-bromide concentrations in water from the North Star Mine after injection began at site E.
12 Application of Tracer-Injection Techniques to Demonstrate Surface-Water and Ground-Water Interactions Between an Alpine Stream and the North Star Mine, Upper Animas River Watershed, Southwestern Colorado
to the dye-recovery data. About 24 hours after injection began, a slight fluorescence was observed using a hand-held UV light in water samples collected from the North Star Mine entrance. From laboratory analyses, an increase of dye concentration was measured at about 23 hours after injection began (fig. 9). The dye recovery curve lasted about 2 to 3 days, which was similar to the broad lithium concentration peak after 86.5 hours (fig. 8). Because there were no early dye break-throughs (fig. 9), it is possible that the larger quantity of water from Belcher Gulch flows into the mine downstream from site G, and the location of the smaller inflows were upstream from site G. Optical brightener dye is not as easily degraded by acid conditions as are the other types of dye; however, acid mine drainage and mine-drainage treatment systems provide condi-tions not typically experienced in nature. Therefore, the dye concentrations and recovery times are not as reliable as the lithium and bromide tracer-recovery data.
Injection of sodium chloride began at site H on September 19, 2001, at 12:00 p.m. After about 12 hours, the injection pump failed, but a sufficient amount of tracer solu-tion was injected into the stream to accomplish a tracer study. Dissolved-sodium concentrations at the North Star Mine showed a slight increase about 18 hours after injection began (fig. 10); however, the concentration increase was small and the range of uncertainty was not greater than the +2-sigma envelope (fig. 10). Dissolved-chloride concentrations showed a slight increase about 14 hours after injection began; however, the increase was small and the range of uncertainty was not
greater than the +2-sigma envelope. Hence, there are no con-clusive results indicating that tracer constituents flowed into the mine from injection at site H. Therefore, with the positive tracer recoveries of lithium and bromide from site E, and posi-tive recovery of optical brightener from site H, it is believed that little, if any, water flows into the mine downstream from site G.
Slug-Injection Test The fourth tracer-injection test was performed from
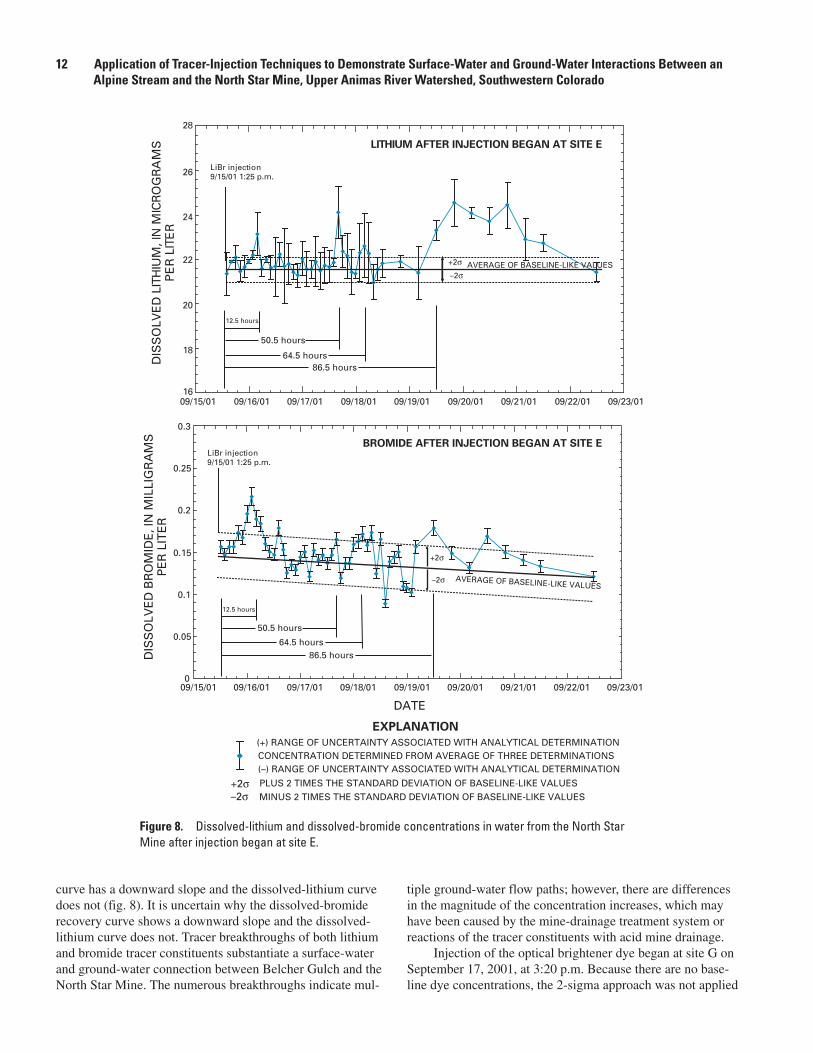
the high-altitude stream (site B), on the southern branch of Belcher Gulch at about 11,000 ft above sea level (fig. 2, fig. 6). A 50-lb bag of NaCl was poured into the stream at a constant rate during a 1-hour period on October 11, 2001, beginning at 1:00 p.m. A slight increase of dissolved-sodium concentration was detected in water from the North Star Mine about 35 hours after injection began (fig. 11); however, the increase was not greater than the +2-sigma envelope. Sev-eral other increases occurred at about 10, 11, 15, and 16 days after injection began (fig. 11), and some of the increases were greater than the +2-sigma envelope. Tracer breakthrough of dissolved sodium further substantiates a surface-water and ground-water connection between Belcher Gulch and the North Star Mine, and numerous tracer breakthroughs support the hypothesis of multiple infiltration locations.
FIgure 9. Optical brightener dye concentrations in water from the North Star Mine after injection began at site G.
Results of Tracer Recovery and Discharge Measurements 13
Tracer Recovery at Other Sites
Water samples were collected intermittently from the Pittsburgh Mine (fig. 1), the Sultan Mine (figs. 1 and 2), and from springs in the alluvial fan at the bottom of Belcher Gulch (fig. 2, site J). In retrospect, interpretation of tracer concentra-tions from intermittent samples was inconclusive. Dissolved-lithium concentrations in water from the Pittsburgh Mine increased slightly after the LiBr injection began at site E (fig. 12); however, the increase was only about 2 µg/L and
within the range of natural variability. Dissolved-sodium concentrations in water from the Pittsburgh Mine increased slightly after the NaCl injection began at site H and after NaCl injection began at site B (fig. 12); however, the increases were small and within the range of natural variability. These results show no conclusive evidence of a surface-water and ground-water connection between Belcher Gulch and the Pittsburgh Mine.
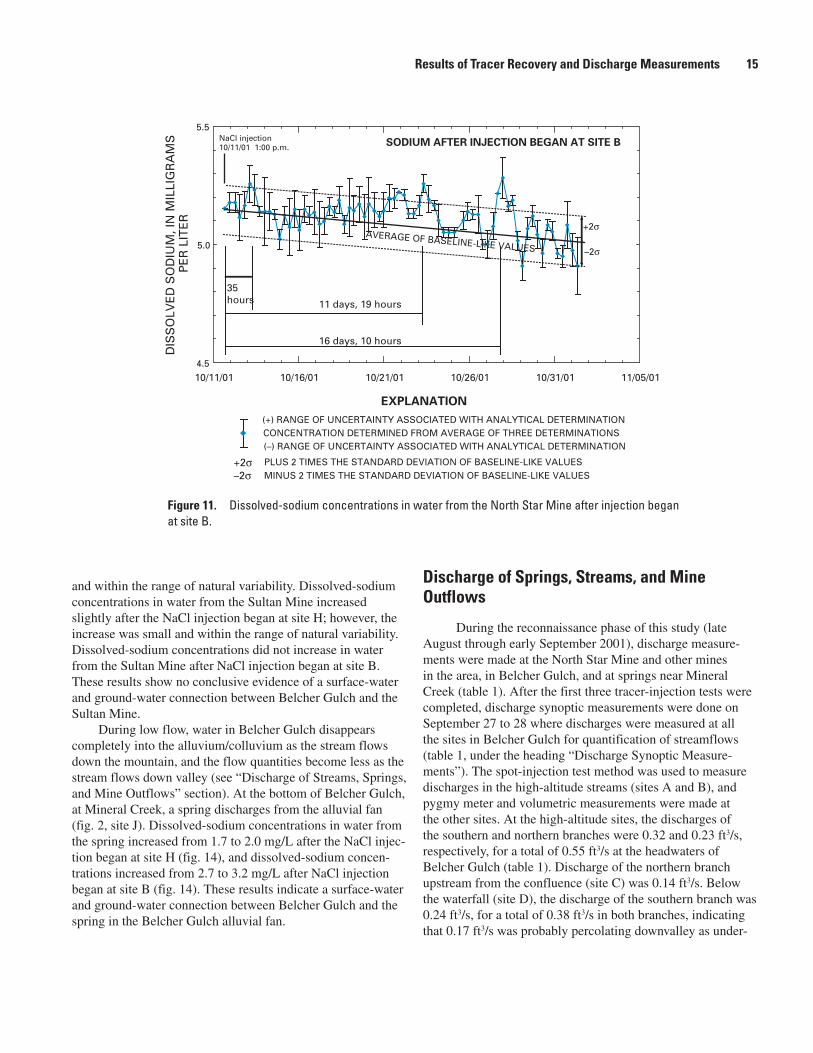
Dissolved-lithium concentrations in water from the Sultan Mine increased slightly after the LiBr injection began at site E (fig. 13); however, the increase was only about 3 µg/L
Figure 10. Dissolved-sodium and dissolved-chloride concentrations in water from the North Star Mine after injection began at site H.
14 Application of Tracer-Injection Techniques to Demonstrate Surface-Water and Ground-Water Interactions Between an Alpine Stream and the North Star Mine, Upper Animas River Watershed, Southwestern Colorado
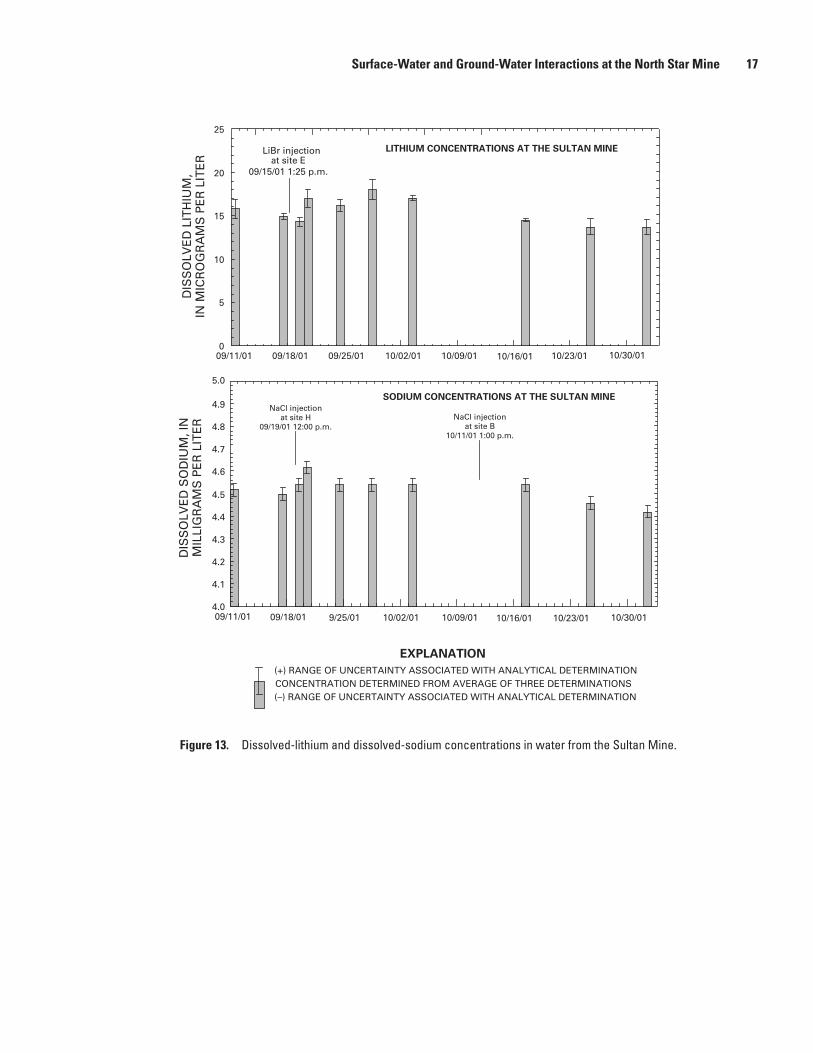
and within the range of natural variability. Dissolved-sodium concentrations in water from the Sultan Mine increased slightly after the NaCl injection began at site H; however, the increase was small and within the range of natural variability. Dissolved-sodium concentrations did not increase in water from the Sultan Mine after NaCl injection began at site B. These results show no conclusive evidence of a surface-water and ground-water connection between Belcher Gulch and the Sultan Mine.
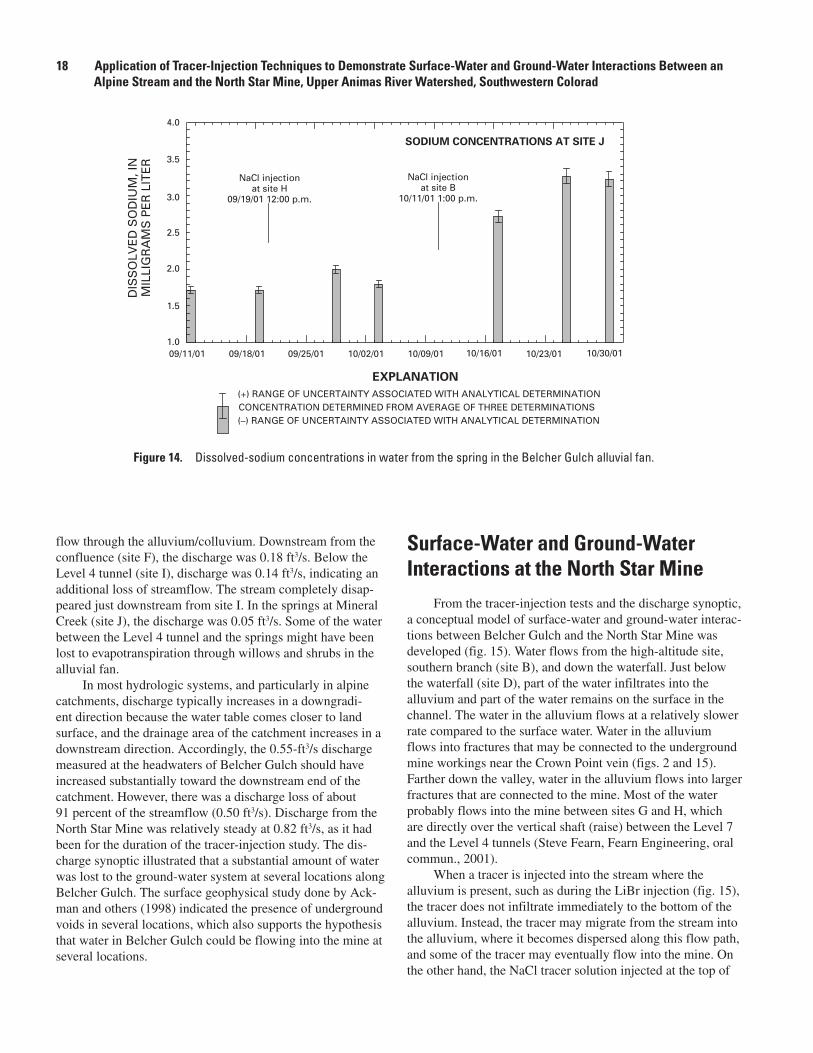
During low flow, water in Belcher Gulch disappears completely into the alluvium/colluvium as the stream flows down the mountain, and the flow quantities become less as the stream flows down valley (see “Discharge of Streams, Springs, and Mine Outflows” section). At the bottom of Belcher Gulch, at Mineral Creek, a spring discharges from the alluvial fan (fig. 2, site J). Dissolved-sodium concentrations in water from the spring increased from 1.7 to 2.0 mg/L after the NaCl injec-tion began at site H (fig. 14), and dissolved-sodium concen-trations increased from 2.7 to 3.2 mg/L after NaCl injection began at site B (fig. 14). These results indicate a surface-water and ground-water connection between Belcher Gulch and the spring in the Belcher Gulch alluvial fan.
Discharge of Springs, Streams, and Mine Outflows
During the reconnaissance phase of this study (late August through early September 2001), discharge measure-ments were made at the North Star Mine and other mines in the area, in Belcher Gulch, and at springs near Mineral Creek (table 1). After the first three tracer-injection tests were completed, discharge synoptic measurements were done on September 27 to 28 where discharges were measured at all the sites in Belcher Gulch for quantification of streamflows (table 1, under the heading “Discharge Synoptic Measure-ments”). The spot-injection test method was used to measure discharges in the high-altitude streams (sites A and B), and pygmy meter and volumetric measurements were made at the other sites. At the high-altitude sites, the discharges of the southern and northern branches were 0.32 and 0.23 ft3/s, respectively, for a total of 0.55 ft3/s at the headwaters of Belcher Gulch (table 1). Discharge of the northern branch upstream from the confluence (site C) was 0.14 ft3/s. Below the waterfall (site D), the discharge of the southern branch was 0.24 ft3/s, for a total of 0.38 ft3/s in both branches, indicating that 0.17 ft3/s was probably percolating downvalley as under-
16 Application of Tracer-Injection Techniques to Demonstrate Surface-Water and Ground-Water Interactions Between an Alpine Stream and the North Star Mine, Upper Animas River Watershed, Southwestern Colorado
Figure 12. Dissolved-lithium and dissolved-sodium concentrations in water from the Pittsburgh Mine.
18 Application of Tracer-Injection Techniques to Demonstrate Surface-Water and Ground-Water Interactions Between an Alpine Stream and the North Star Mine, Upper Animas River Watershed, Southwestern Colorad
Figure 14. Dissolved-sodium concentrations in water from the spring in the Belcher Gulch alluvial fan.
flow through the alluvium/colluvium. Downstream from the confluence (site F), the discharge was 0.18 ft3/s. Below the Level 4 tunnel (site I), discharge was 0.14 ft3/s, indicating an additional loss of streamflow. The stream completely disap-peared just downstream from site I. In the springs at Mineral Creek (site J), the discharge was 0.05 ft3/s. Some of the water between the Level 4 tunnel and the springs might have been lost to evapotranspiration through willows and shrubs in the alluvial fan.
In most hydrologic systems, and particularly in alpine catchments, discharge typically increases in a downgradi-ent direction because the water table comes closer to land surface, and the drainage area of the catchment increases in a downstream direction. Accordingly, the 0.55-ft3/s discharge measured at the headwaters of Belcher Gulch should have increased substantially toward the downstream end of the catchment. However, there was a discharge loss of about 91 percent of the streamflow (0.50 ft3/s). Discharge from the North Star Mine was relatively steady at 0.82 ft3/s, as it had been for the duration of the tracer-injection study. The dis-charge synoptic illustrated that a substantial amount of water was lost to the ground-water system at several locations along Belcher Gulch. The surface geophysical study done by Ack-man and others (1998) indicated the presence of underground voids in several locations, which also supports the hypothesis that water in Belcher Gulch could be flowing into the mine at several locations.
Surface-Water and Ground-Water Interactions at the North Star Mine
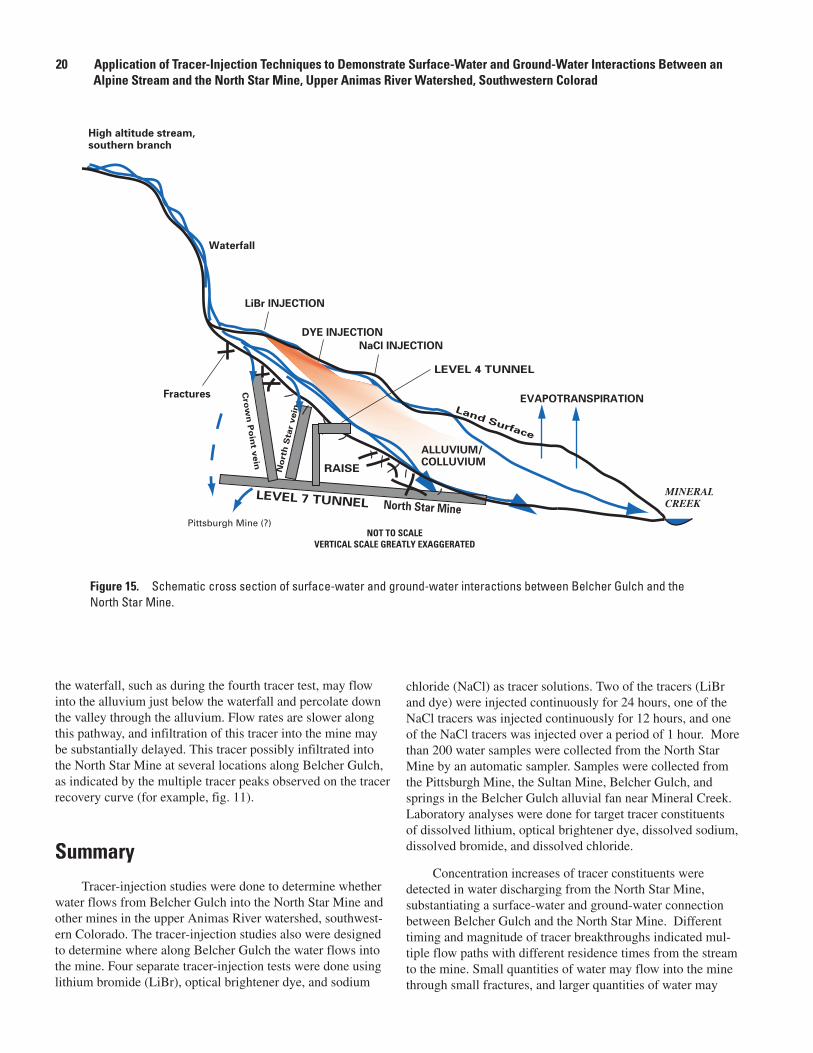
From the tracer-injection tests and the discharge synoptic, a conceptual model of surface-water and ground-water interac-tions between Belcher Gulch and the North Star Mine was developed (fig. 15). Water flows from the high-altitude site, southern branch (site B), and down the waterfall. Just below the waterfall (site D), part of the water infiltrates into the alluvium and part of the water remains on the surface in the channel. The water in the alluvium flows at a relatively slower rate compared to the surface water. Water in the alluvium flows into fractures that may be connected to the underground mine workings near the Crown Point vein (figs. 2 and 15). Farther down the valley, water in the alluvium flows into larger fractures that are connected to the mine. Most of the water probably flows into the mine between sites G and H, which are directly over the vertical shaft (raise) between the Level 7 and the Level 4 tunnels (Steve Fearn, Fearn Engineering, oral commun., 2001).
When a tracer is injected into the stream where the alluvium is present, such as during the LiBr injection (fig. 15), the tracer does not infiltrate immediately to the bottom of the alluvium. Instead, the tracer may migrate from the stream into the alluvium, where it becomes dispersed along this flow path, and some of the tracer may eventually flow into the mine. On the other hand, the NaCl tracer solution injected at the top of
Surface-Water and Ground-Water Interactions at the North Star Mine 19
Table 1. Discharge measurements of water from springs, streams, and mine outflows.�����������������������������������������������������������������������������������������������������������������������������������������
Figure 15. Schematic cross section of surface-water and ground-water interactions between Belcher Gulch and the North Star Mine.
the waterfall, such as during the fourth tracer test, may flow into the alluvium just below the waterfall and percolate down the valley through the alluvium. Flow rates are slower along this pathway, and infiltration of this tracer into the mine may be substantially delayed. This tracer possibly infiltrated into the North Star Mine at several locations along Belcher Gulch, as indicated by the multiple tracer peaks observed on the tracer recovery curve (for example, fig. 11).
SummaryTracer-injection studies were done to determine whether
water flows from Belcher Gulch into the North Star Mine and other mines in the upper Animas River watershed, southwest-ern Colorado. The tracer-injection studies also were designed to determine where along Belcher Gulch the water flows into the mine. Four separate tracer-injection tests were done using lithium bromide (LiBr), optical brightener dye, and sodium
chloride (NaCl) as tracer solutions. Two of the tracers (LiBr and dye) were injected continuously for 24 hours, one of the NaCl tracers was injected continuously for 12 hours, and one of the NaCl tracers was injected over a period of 1 hour. More than 200 water samples were collected from the North Star Mine by an automatic sampler. Samples were collected from the Pittsburgh Mine, the Sultan Mine, Belcher Gulch, and springs in the Belcher Gulch alluvial fan near Mineral Creek. Laboratory analyses were done for target tracer constituents of dissolved lithium, optical brightener dye, dissolved sodium, dissolved bromide, and dissolved chloride.
Concentration increases of tracer constituents were detected in water discharging from the North Star Mine, substantiating a surface-water and ground-water connection between Belcher Gulch and the North Star Mine. Different timing and magnitude of tracer breakthroughs indicated mul-tiple flow paths with different residence times from the stream to the mine. Small quantities of water may flow into the mine through small fractures, and larger quantities of water may
20 Application of Tracer-Injection Techniques to Demonstrate Surface-Water and Ground-Water Interactions Between an Alpine Stream and the North Star Mine, Upper Animas River Watershed, Southwestern Colorad
References Cited 21
flow into the mine through large fractures, as indicated by dif-ferent sharp and broad tracer-recovery peaks. Smaller quanti-ties of water may be flowing into the mine through the Crown Point vein (between sites E and G), and the larger quantities of water may be flowing into the mine near the raise from the Level 7 to the Level 4 tunnels (between sites G and H). Tracer breakthroughs were inconclusive in water from the Pittsburgh and Sultan Mines.
Discharge synoptic measurements indicated that nearly all of the water in Belcher Gulch is lost to the ground-water system before reaching Mineral Creek, and this quantity of water loss (about 0.50 ft3/s) may be flowing into the North Star Mine. From the tracer tests and discharge synoptic, a concep-tual model was developed for surface-water and ground-water interactions between Belcher Gulch and the North Star Mine. This information, combined with previous surface geophysical surveys indicating the presence of subsurface anomalies, may assist with decision-making processes for the prevention of infiltration into the mine and remediation of mine drainage.
References Cited
Ackman, T.E., Hammack, R.W., and Veloski, G.A., 1998, Geophysical investigation of selected stream segments in the upper Animas River watershed, San Juan County, Colo-rado, to identify potential water-loss zones: U.S. Depart-ment of Energy, Federal Technology Center, Pittsburgh, Pa., 15 p.
Gospodaric, Rado, and Habic, Peter, eds., 1976, Underground water tracing—Investigations in Slovenia: Institute for Karst Research, Postojna, Yugoslavia, 305 p.
Long, H.K., Daddow, R.L., and Farrar, J.W., 1998, U.S. Geological Survey Standard Reference Sample Project—Performance evaluation of analytical laborato-ries: U.S. Geological Survey Fact Sheet FS–031–98 April 1998, http://btdqs.usgs.gov/srs/FS_031_98.html, accessed December 12, 2001.
Mast, M.A., Evans, J.B., Leib, K.J., and Wright, W.G., 2000, Hydrologic and water-quality data at selected sites in the upper Animas River watershed, southwestern Colorado, 1997–99: U.S. Geological Survey Open–File Report 00–53, 20 p., 1 plate, CD-ROM.
Mull, D.S., Smoot, J.L., and Liebermann, T.D., 1988, Dye tracing techniques used to determine ground-water flow in a carbonate aquifer system near Elizabethtown, Kentucky: U.S. Geological Survey Water-Resources Investigations Report 87–4174, 95 p., 1 plate.
Ransome, F.L., 1901, Economic geology of the Silverton quadrangle, Colorado: U.S. Geological Survey Bulletin 182, 265 p.
Rantz, S.E., 1982, Measurement and computation of stream-flow: v 1. Measurement of stage and discharge: U.S. Geological Survey Water–Supply Paper 2175, 284 p.
Simon, William, Butler, Peter, and Owen, J.R., 2001, Use attainability analysis for the Animas River watershed: Animas River Stakeholders Group, 240 p., appendixes, CD-ROM, http://www.waterinfo.org/arsg/main.html.
Taylor, J.K., 1987, Quality assurance of chemical measure-ments: Chelsea, Mich., Lewis Publishers, Inc., 328 p.
Wildeman, T.R., and Updegraff, David, 1997, Passive bio-remediation of metals and inorganic contaminants in Macalady, D.L., ed., Perspectives in environmental chemistry: United Kingdom, Oxford University Press, p. 473–495.
Wright, W.G., Leib, K.J., and Mast, M.A., 1998, Seasonal fluctuations of discharge and dissolved constituents from selected abandoned mines in the upper Animas River basin, Colorado, in Nimick, D.A., and von Guerard, P.B., eds., Science for watershed decisions on abandoned mine lands—Review of preliminary results, Denver, Colorado, February 4–5, 1998: U.S. Geological Survey Open–File Report 98–0297, p. 47.
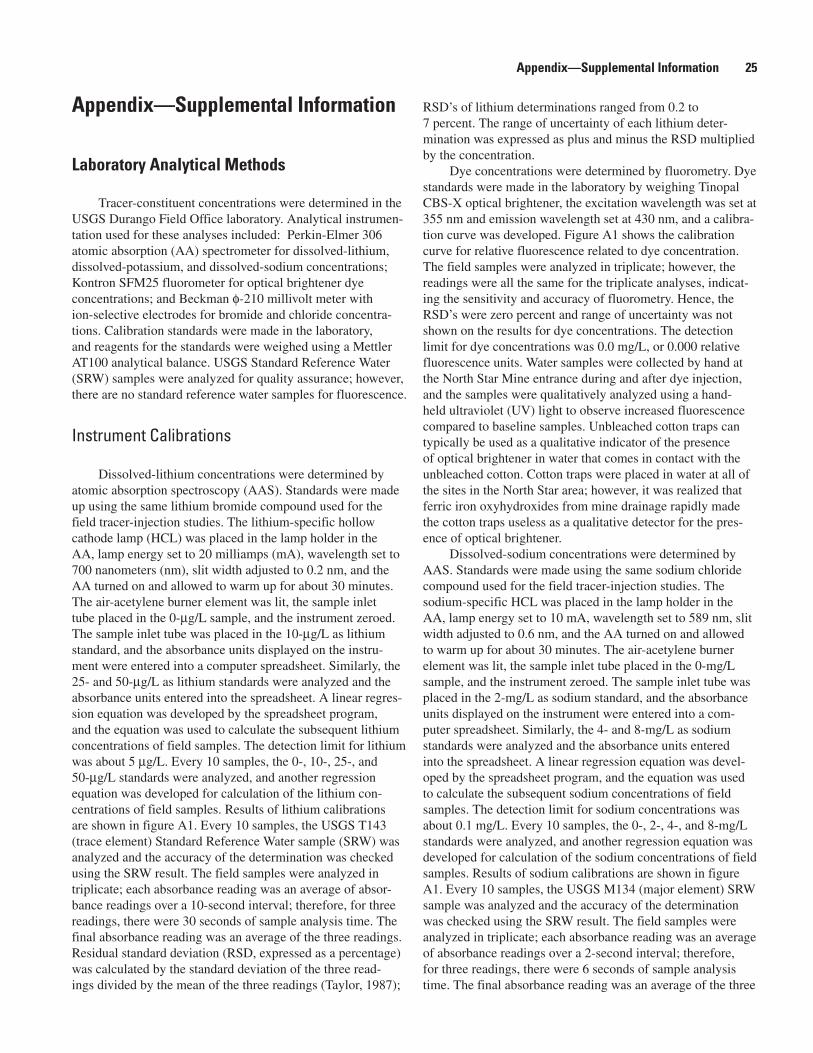
Tracer-constituent concentrations were determined in the USGS Durango Field Office laboratory. Analytical instrumen-tation used for these analyses included: Perkin-Elmer 306 atomic absorption (AA) spectrometer for dissolved-lithium, dissolved-potassium, and dissolved-sodium concentrations; Kontron SFM25 fluorometer for optical brightener dye concentrations; and Beckman φ-210 millivolt meter with ion-selective electrodes for bromide and chloride concentra-tions. Calibration standards were made in the laboratory, and reagents for the standards were weighed using a Mettler AT100 analytical balance. USGS Standard Reference Water (SRW) samples were analyzed for quality assurance; however, there are no standard reference water samples for fluorescence.
Instrument Calibrations
Dissolved-lithium concentrations were determined by atomic absorption spectroscopy (AAS). Standards were made up using the same lithium bromide compound used for the field tracer-injection studies. The lithium-specific hollow cathode lamp (HCL) was placed in the lamp holder in the AA, lamp energy set to 20 milliamps (mA), wavelength set to 700 nanometers (nm), slit width adjusted to 0.2 nm, and the AA turned on and allowed to warm up for about 30 minutes. The air-acetylene burner element was lit, the sample inlet tube placed in the 0-µg/L sample, and the instrument zeroed. The sample inlet tube was placed in the 10-µg/L as lithium standard, and the absorbance units displayed on the instru-ment were entered into a computer spreadsheet. Similarly, the 25- and 50-µg/L as lithium standards were analyzed and the absorbance units entered into the spreadsheet. A linear regres-sion equation was developed by the spreadsheet program, and the equation was used to calculate the subsequent lithium concentrations of field samples. The detection limit for lithium was about 5 µg/L. Every 10 samples, the 0-, 10-, 25-, and 50-µg/L standards were analyzed, and another regression equation was developed for calculation of the lithium con-centrations of field samples. Results of lithium calibrations are shown in figure A1. Every 10 samples, the USGS T143 (trace element) Standard Reference Water sample (SRW) was analyzed and the accuracy of the determination was checked using the SRW result. The field samples were analyzed in triplicate; each absorbance reading was an average of absor-bance readings over a 10-second interval; therefore, for three readings, there were 30 seconds of sample analysis time. The final absorbance reading was an average of the three readings. Residual standard deviation (RSD, expressed as a percentage) was calculated by the standard deviation of the three read-ings divided by the mean of the three readings (Taylor, 1987);
RSD’s of lithium determinations ranged from 0.2 to 7 percent. The range of uncertainty of each lithium deter-mination was expressed as plus and minus the RSD multiplied by the concentration.
Dye concentrations were determined by fluorometry. Dye standards were made in the laboratory by weighing Tinopal CBS-X optical brightener, the excitation wavelength was set at 355 nm and emission wavelength set at 430 nm, and a calibra-tion curve was developed. Figure A1 shows the calibration curve for relative fluorescence related to dye concentration. The field samples were analyzed in triplicate; however, the readings were all the same for the triplicate analyses, indicat-ing the sensitivity and accuracy of fluorometry. Hence, the RSD’s were zero percent and range of uncertainty was not shown on the results for dye concentrations. The detection limit for dye concentrations was 0.0 mg/L, or 0.000 relative fluorescence units. Water samples were collected by hand at the North Star Mine entrance during and after dye injection, and the samples were qualitatively analyzed using a hand-held ultraviolet (UV) light to observe increased fluorescence compared to baseline samples. Unbleached cotton traps can typically be used as a qualitative indicator of the presence of optical brightener in water that comes in contact with the unbleached cotton. Cotton traps were placed in water at all of the sites in the North Star area; however, it was realized that ferric iron oxyhydroxides from mine drainage rapidly made the cotton traps useless as a qualitative detector for the pres-ence of optical brightener.
Dissolved-sodium concentrations were determined by AAS. Standards were made using the same sodium chloride compound used for the field tracer-injection studies. The sodium-specific HCL was placed in the lamp holder in the AA, lamp energy set to 10 mA, wavelength set to 589 nm, slit width adjusted to 0.6 nm, and the AA turned on and allowed to warm up for about 30 minutes. The air-acetylene burner element was lit, the sample inlet tube placed in the 0-mg/L sample, and the instrument zeroed. The sample inlet tube was placed in the 2-mg/L as sodium standard, and the absorbance units displayed on the instrument were entered into a com-puter spreadsheet. Similarly, the 4- and 8-mg/L as sodium standards were analyzed and the absorbance units entered into the spreadsheet. A linear regression equation was devel-oped by the spreadsheet program, and the equation was used to calculate the subsequent sodium concentrations of field samples. The detection limit for sodium concentrations was about 0.1 mg/L. Every 10 samples, the 0-, 2-, 4-, and 8-mg/L standards were analyzed, and another regression equation was developed for calculation of the sodium concentrations of field samples. Results of sodium calibrations are shown in figure A1. Every 10 samples, the USGS M134 (major element) SRW sample was analyzed and the accuracy of the determination was checked using the SRW result. The field samples were analyzed in triplicate; each absorbance reading was an average of absorbance readings over a 2-second interval; therefore, for three readings, there were 6 seconds of sample analysis time. The final absorbance reading was an average of the three
26 Appendix—Supplemental Information
Figure A1. Graphs showing calibration curves for determination of dissolved lithium and dissolved sodium by atomic absorption spectroscopy and optical brightener dye by fluorometry.
readings. Residual standard deviation (RSD, expressed as a percentage) was calculated by the standard deviation of the three readings divided by the mean of the three readings (Tay-lor, 1987); RSD’s of sodium determinations ranged from 0 to 2.7 percent. The range of uncertainty of each sodium determi-nation was expressed as plus and minus the RSD multiplied by the concentration.
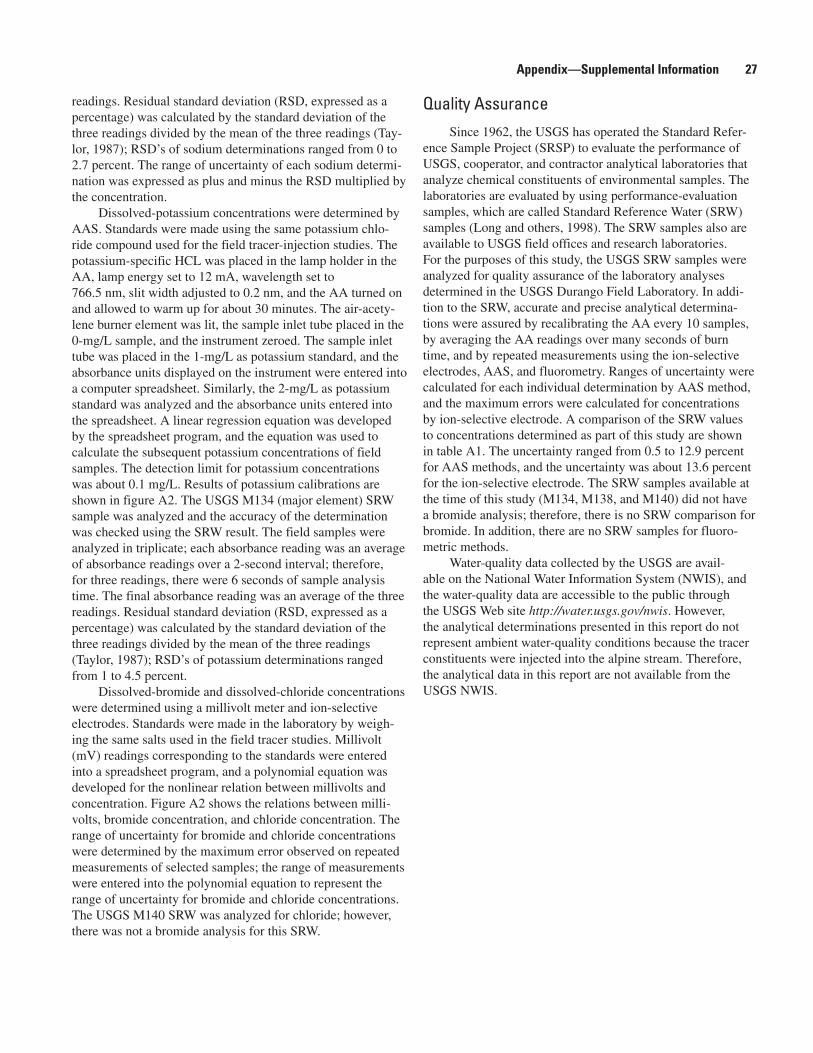
Dissolved-potassium concentrations were determined by AAS. Standards were made using the same potassium chlo-ride compound used for the field tracer-injection studies. The potassium-specific HCL was placed in the lamp holder in the AA, lamp energy set to 12 mA, wavelength set to 766.5 nm, slit width adjusted to 0.2 nm, and the AA turned on and allowed to warm up for about 30 minutes. The air-acety-lene burner element was lit, the sample inlet tube placed in the 0-mg/L sample, and the instrument zeroed. The sample inlet tube was placed in the 1-mg/L as potassium standard, and the absorbance units displayed on the instrument were entered into a computer spreadsheet. Similarly, the 2-mg/L as potassiumstandard was analyzed and the absorbance units entered into the spreadsheet. A linear regression equation was developed by the spreadsheet program, and the equation was used to calculate the subsequent potassium concentrations of field samples. The detection limit for potassium concentrations was about 0.1 mg/L. Results of potassium calibrations are shown in figure A2. The USGS M134 (major element) SRW sample was analyzed and the accuracy of the determination was checked using the SRW result. The field samples were analyzed in triplicate; each absorbance reading was an average of absorbance readings over a 2-second interval; therefore, for three readings, there were 6 seconds of sample analysis time. The final absorbance reading was an average of the three readings. Residual standard deviation (RSD, expressed as a percentage) was calculated by the standard deviation of the three readings divided by the mean of the three readings (Taylor, 1987); RSD’s of potassium determinations ranged from 1 to 4.5 percent.
Dissolved-bromide and dissolved-chloride concentrations were determined using a millivolt meter and ion-selective electrodes. Standards were made in the laboratory by weigh-ing the same salts used in the field tracer studies. Millivolt (mV) readings corresponding to the standards were entered into a spreadsheet program, and a polynomial equation was developed for the nonlinear relation between millivolts and concentration. Figure A2 shows the relations between milli-volts, bromide concentration, and chloride concentration. The range of uncertainty for bromide and chloride concentrations were determined by the maximum error observed on repeated measurements of selected samples; the range of measurements were entered into the polynomial equation to represent the range of uncertainty for bromide and chloride concentrations. The USGS M140 SRW was analyzed for chloride; however, there was not a bromide analysis for this SRW.
Quality AssuranceSince 1962, the USGS has operated the Standard Refer-
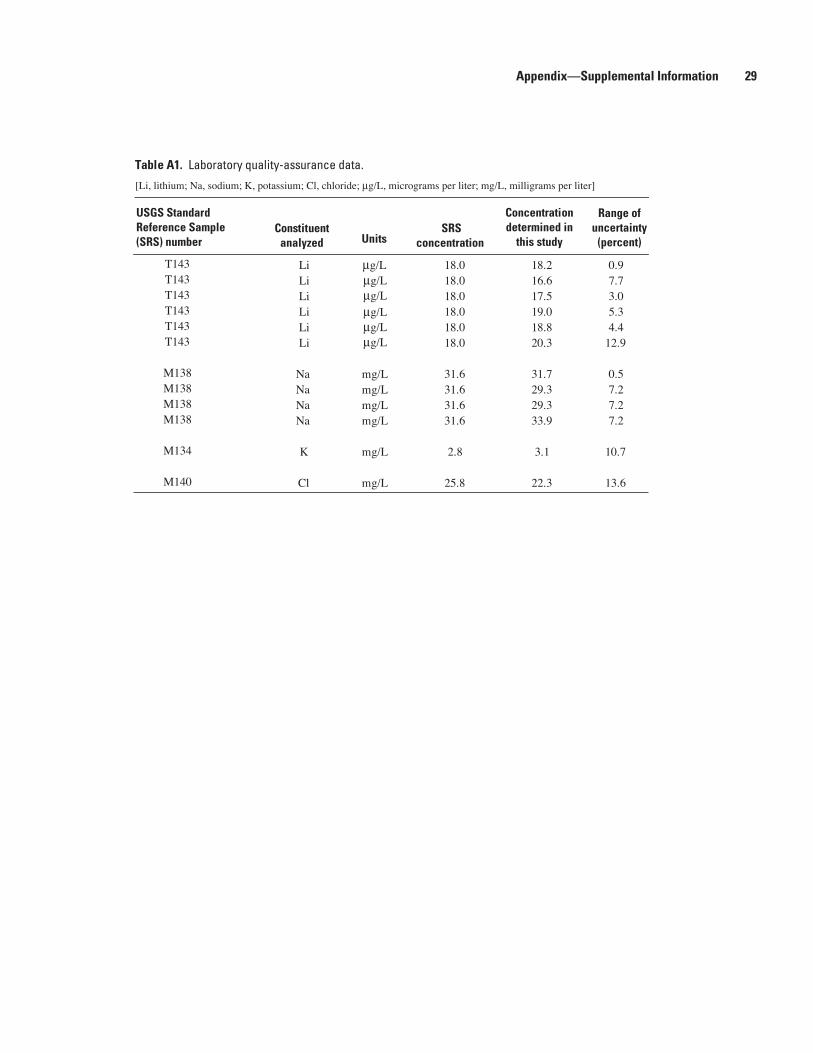
ence Sample Project (SRSP) to evaluate the performance of USGS, cooperator, and contractor analytical laboratories that analyze chemical constituents of environmental samples. The laboratories are evaluated by using performance-evaluation samples, which are called Standard Reference Water (SRW) samples (Long and others, 1998). The SRW samples also are available to USGS field offices and research laboratories. For the purposes of this study, the USGS SRW samples were analyzed for quality assurance of the laboratory analyses determined in the USGS Durango Field Laboratory. In addi-tion to the SRW, accurate and precise analytical determina-tions were assured by recalibrating the AA every 10 samples, by averaging the AA readings over many seconds of burn time, and by repeated measurements using the ion-selective electrodes, AAS, and fluorometry. Ranges of uncertainty were calculated for each individual determination by AAS method, and the maximum errors were calculated for concentrations by ion-selective electrode. A comparison of the SRW values to concentrations determined as part of this study are shown in table A1. The uncertainty ranged from 0.5 to 12.9 percent for AAS methods, and the uncertainty was about 13.6 percent for the ion-selective electrode. The SRW samples available at the time of this study (M134, M138, and M140) did not have a bromide analysis; therefore, there is no SRW comparison for bromide. In addition, there are no SRW samples for fluoro-metric methods.
Water-quality data collected by the USGS are avail-able on the National Water Information System (NWIS), and the water-quality data are accessible to the public through the USGS Web site http://water.usgs.gov/nwis. However, the analytical determinations presented in this report do not represent ambient water-quality conditions because the tracer constituents were injected into the alpine stream. Therefore, the analytical data in this report are not available from the USGS NWIS.
Figure A2. Graphs showing calibration curves for determination of dissolved potassium by atomic absorption spectroscopy and dissolved bromide and dissolved chloride by ion-selective electrode.