Application of two-photon laser-inducedfluorescence for visualization of water vapor incombustion environments
Hans Neij and Marcus Ald6n
Investigations concerning the potential for the visualization of water vapor in combustion processes havebeen made. The water molecules were excited through a two-photon excitation process at 248 nm with atunable excimer laser; this was followed by fluorescence detection between - 400 and 500 nm. In theexperimental work special care was taken to map the possible spectral interferences from hot 02, whichalso absorbs in the same spectral region and which produces fluorescence emission that interferes withthe water fluorescence. Experimental investigations of high-pressure applications are also presented.
Finally, two-dimensional (2-D) measurements made at room temperature, taken in an atmospheric-pressure flame, and taken in an engine simulator at elevated pressure are presented. These resultsindicate that the detection limit for 2-D single-shot registrations under optimized experimental conditionswas estimated to 0.2% at atmospheric pressure and at room temperature. Extrapolations to flameconditions are also presented.
Introduction
The need to understand combustion processes inorder to be able to optimize fuel consumption andminimize air pollution has motivated the develop-ment of several different laser-based spectroscopictechniques and their application in studies of differ-ent combustion processes over the past decade (seeRef. 1 and the references therein). The predominantadvantages of these techniques are their nonintrusive-ness, high temporal and spatial resolutions, andspecies selectivity. One of the techniques most suitedfor measurements of minor species is laser-inducedfluorescence (LIF), where a species is excited from itsground state to an excited state. The subsequentdeexcitation leads to the emission of radiation in theform of fluorescence, which after analysis can yieldinformation on the species number density, gas tem-perature, and even gas velocity. Traditionally, thelaser-induced fluorescence technique has been usedfor species requiring a one-photon excitation process,e.g., OH, CN, C2, and NO. A large number of species
The authors are with the Department of Combustion Physics,Lund Institute of Technology, P.O. Box 118, S-221 00 Lund,Sweden.
Received 30 March 1993; revised manuscript received 8 Febru-ary 1994.
has also been accessed through the use of two- orthree-photon excitation schemes, e.g., 0, H, N, andCO. For these species, which have absorption transi-tions in the vacuum-ultraviolet spectral region, suchmultiphoton excitation schemes have been necessaryfor flame detection.
One of the major advantages of the LIF techniqueis its applicability for visualization in which one- ortwo-dimensional images are obtained with a lineardiode-array detector or a two-dimensional (2-D) detec-tor, e.g., a CCD camera. Most species relevant tocombustion that are excited by single-photon pro-cesses have been investigated through imaging experi-ments. Because of the lower intensity of the fluores-cence signal in two-photon LIF, most imagingmeasurements have been made either along a line2 orin a plane with a multiple-pass arrangement to createa 2-D picture of the species distribution. However,2-D LIF visualization of H2 has been performed witha two-photon process and a powerful tunable excimerlaser at 193 nm.4
As for real-world applications of 2-D LIF, OHradicals have been studied by several investigators,for example in combustion engines5'6 and in a naturalgas burner. At high pressures comparatively fewLIF experiments have been reported under well-controlled conditions, i.e., at known pressures, tem-peratures, and species compositions. The reason forthe few LIF experiments carried out under these
conditions is that most species detected through LIFare radicals with a high probability for quenching in acell environmnent. However, LIF work has beendone in high-pressure flames, e.g., on OH.8
One species in which spectroscopists have beenmost interested over the years is water vapor.Because this species is also present as an exhaust gasin almost all combustion processes and because it is ameasure of combustion efficiency, water is of greatinterest in the field of combustion. There is thus agreat need for nonintrusive techniques for the detec-tion of this species. Traditionally water vapor hasbeen detected by IR absorption. However, that is aline-of-sight technique and has a limited applicabilityto flames. So far almost all spatially resolved combus-tion measurements of this species have been madethrough the use of Raman scattering9 10 or coherentanti-Stokes Raman scattering. 2 The Raman tech-nique is excellent for yielding the absolute numberdensity, but this process suffers from having a lowscattering cross section, which makes 2-D registra-tion impractical; also fluorescence interferences inhydrocarbon flames have been seen as a problem.The coherent anti-Stokes Raman scattering tech-nique, however, functions excellently even in a verypractical environment, but it is, in fact, most suitedfor point measurements. Because water vapor hasits resonance lines in the vacuum-ultraviolet spectralregion, conventional one-photon LIF cannot be ap-plied to flame detection of this species. However, thepotential for laser-induced fluorescence detection ofwater in combustion applications was revealedthrough the use of a two-photon excitation at 248 nm.This approach for flame detection was discussed andproposed by Andresen et al. 13 and recently was demon-strated by preliminary visualization measurementsin an engine 4 and by Pitz et al.'5 for point measure-ments of temperature and water-vapor species concen-tration in a hydrogen flame with the two-photonexcitation process for the detection of water.
In this paper we report experimental studies aimedat investigating the potential for the visualization ofwater vapor in different combustion environmentsusing two-photon excitation at 248 nm followed bybroadband detection at approximately 450 nm.Special emphasis is given to investigations of poten-tial spectral overlap and thus to the introduction ofinterferences in the detection of H20 in a flame fromother species, e.g., hot oxygen molecules and OHradicals. Single-shot, 2-D visualization of the spe-cies mentioned above for different excitation wave-lengths is presented, as are spectroscopic investiga-tions at high pressure and temperature. Finally, thepotential for engine applications is discussed andexemplified with some preliminary results from flamepropagation in a high-pressure cell that simulatesengine combustion.
H20 Spectroscopy
As was indicated above, several spectroscopic investi-gations on water vapor for combustion applications
120-C.) :j2H 20'
cc X2B1 /H0
) 80 O(A2 +) + H(2 S)6) AIB, 400-500 nm
CD
o 40 _H(X 2n) + H(2S)
110
0 XA
rOH-HFig. 1. Energy-level diagram for water vapor showing the transi-tions relevant to combustion diagnostics.
have been made with Raman techniques. In thiscase the Raman-allowed transition at 3651.7 cm-'has been excited.
The fundamental spectroscopy of the water mol-ecule has, over the past decades, attracted greatinterest from both experimentall 7 and theoretical' 8
investigators. Concerning the electronic states, thestructure as well as the dissociation dynamics arebelieved to be well understood. If wavelengths near125 nm are used for excitation from the ground stateX 'Al, the third excited state C 1B, can be reached.A strong coupling of this state to the second excitedstate B 'A1 leads to predissociation. Figure 1 showsschematically the lowest potential energy curves in-volved in the predissociation mechanism for water.19It is known that rotational lines can be resolved in theC -X excitation spectrum.17 The linewidths of therotational lines indicate a lifetime of a few picosec-onds for rovibronic levels in the C state.20 Theemission in the picosecond range enables studies ofthe bound-free C A transitions. These transi-tions are rapidly followed by dissociation through theA state into OH (X 2fl) and H (2S). 2 021
Two different mechanisms have been found tocontrol the predissociation of the third excited state:one that is heterogeneous and rotationally dependentand one that is homogeneous and rotationally indepen-dent.17 The heterogeneous predissociation is be-lieved to occur through the short-lived, second excitedstate, B 'A1, where the v2 = 14 level of this state liesclose to the (000) level of the C B1 state. Thehomogeneous predissociation affects all rotationallevels within a given vibronic level equally. This is apurely electronic predissociation involving anotherstate of B1 symmetry.
where Ja' is the quantum number of the angularmomentum around the a axis and Av0 is the linewidthcaused by the homogeneous predissociation, whichhas been found to be 2.1 cm'1.22 The value of theparameter c, the ratio of heterogeneous to homoge-neous predissociation, has been established to beapproximately 0.35.22 The relative LIF peak signalintensity hab is likewise affected by predissociation;thus hab = ho/F, where ho represents the two-photonabsorption line strength.
Experimental Procedure
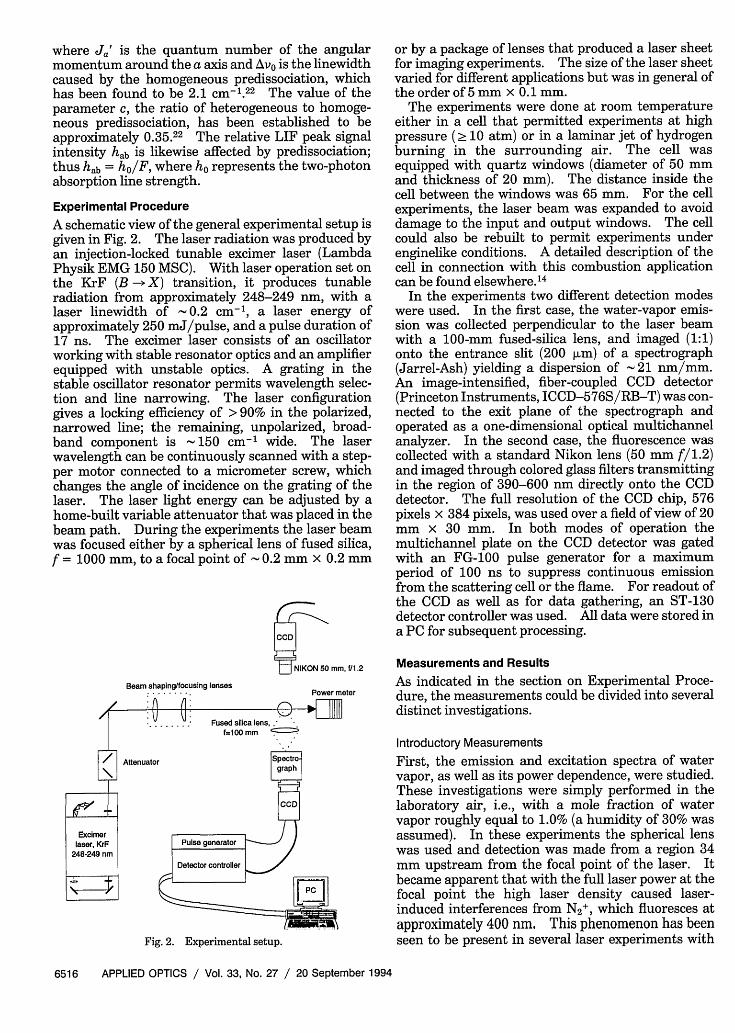
A schematic view of the general experimental setup isgiven in Fig. 2. The laser radiation was produced byan injection-locked tunable excimer laser (LambdaPhysik EMG 150 MSC). With laser operation set onthe KrF (B -- X) transition, it produces tunableradiation from approximately 248-249 nm, with alaser linewidth of - 0.2 cm-', a laser energy ofapproximately 250 mJ/pulse, and a pulse duration of17 ns. The excimer laser consists of an oscillatorworking with stable resonator optics and an amplifierequipped with unstable optics. A grating in thestable oscillator resonator permits wavelength selec-tion and line narrowing. The laser configurationgives a locking efficiency of > 90% in the polarized,narrowed line; the remaining, unpolarized, broad-band component is 150 cm-' wide. The laserwavelength can be continuously scanned with a step-per motor connected to a micrometer screw, whichchanges the angle of incidence on the grating of thelaser. The laser light energy can be adjusted by ahome-built variable attenuator that was placed in thebeam path. During the experiments the laser beamwas focused either by a spherical lens of fused silica,f = 1000 mm, to a focal point of 0.2 mm x 0.2 mm
NIKON 50 mm, f1.2
/
Excimerlaser, KrF
248-249 nm
_t,
Beam shaping/focusing lenses: . . . . .. Power meter
........ . Fused silica lens,.t=00 mm °
Attenuator
Fig. 2. Experimental setup.
or by a package of lenses that produced a laser sheetfor imaging experiments. The size of the laser sheetvaried for different applications but was in general ofthe order of 5 mm x 0.1 mm.
The experiments were done at room temperatureeither in a cell that permitted experiments at highpressure ( 10 atm) or in a laminar jet of hydrogenburning in the surrounding air. The cell wasequipped with quartz windows (diameter of 50 mmand thickness of 20 mm). The distance inside thecell between the windows was 65 mm. For the cellexperiments, the laser beam was expanded to avoiddamage to the input and output windows. The cellcould also be rebuilt to permit experiments underenginelike conditions. A detailed description of thecell in connection with this combustion applicationcan be found elsewhere.'4
In the experiments two different detection modeswere used. In the first case, the water-vapor emis-sion was collected perpendicular to the laser beamwith a 100-mm fused-silica lens, and imaged (1:1)onto the entrance slit (200 plm) of a spectrograph(Jarrel-Ash) yielding a dispersion of 21 nm/mm.An image-intensified, fiber-coupled CCD detector(Princeton Instruments, ICCD-576S/RB-T) was con-nected to the exit plane of the spectrograph andoperated as a one-dimensional optical multichannelanalyzer. In the second case, the fluorescence wascollected with a standard Nikon lens (50 mm f/1.2)and imaged through colored glass filters transmittingin the region of 390-600 nm directly onto the CCDdetector. The full resolution of the CCD chip, 576pixels x 384 pixels, was used over a field of view of 20mm x 30 mm. In both modes of operation themultichannel plate on the CCD detector was gatedwith an FG-100 pulse generator for a maximumperiod of 100 ns to suppress continuous emissionfrom the scattering cell or the flame. For readout ofthe CCD as well as for data gathering, an ST-130detector controller was used. All data were stored ina PC for subsequent processing.
Measurements and Results
As indicated in the section on Experimental Proce-dure, the measurements could be divided into severaldistinct investigations.
Introductory Measurements
First, the emission and excitation spectra of watervapor, as well as its power dependence, were studied.These investigations were simply performed in thelaboratory air, i.e., with a mole fraction of watervapor roughly equal to 1.0% (a humidity of 30% wasassumed). In these experiments the spherical lenswas used and detection was made from a region 34mm upstream from the focal point of the laser. Itbecame apparent that with the full laser power at thefocal point the high laser density caused laser-induced interferences from N2+, which fluoresces atapproximately 400 nm. This phenomenon has beenseen to be present in several laser experiments with
excitation in the UV region (see, e.g., Ref. 23). It hasalso been observed that laser-induced emission fromH2O+ may spectrally interfere with the water emis-sion.2 ' Fluorescence from laser-produced OH radi-cals and scattered laser radiation was rejected by acolored glass filter. For the excitation scans, thedetector was operated in the so-called Y:T mode, i.e.,the total water fluorescence emission was monitoredas a function of time while the laser wavelength wascontinuously scanned. The laser was scanned overthe gain profile of the laser, and we thereby probeddifferent rotational levels in the excited states of thewater molecules. This excitation spectrum [Fig. 3(a)]is known from the literature and has features thathave been identified in previous investigations.22
The lines in Fig. 3(a) are numbered according to thenotation of Meijer et al.22 Normally these linescorrespond to more than one rotational transition.The emission spectrum [Fig. 3(b)] exhibits a broad,structureless spectrum that extends from 380 nm toalmost 600 nm, with a maximum at approximately425 nm. No differences in spectral characteristicsfor the emission spectrum were detected when thelaser wavelength was tuned over the various rota-tional absorption lines, in agreement with the resultsreported in Refs. 20 and 21. The excitation spec-trum form Fig. 3(a) has not been corrected for the
C
C
.8S0
EWi
C
C
0
Ew
_ 11 4 (a)
3W ~~~~~~~~513
2W 16 15 7
15
17 14
01247.90 248.10 248.30 248.50 248.70 248
Excitation wavelength (nm).90
Wavelength (nm)
Fig. 3. (a) Two-photon water-vapor excitation spectrum in thelaboratory air. (b) Emission spectrum from water vapor.
falloff in locking efficiency at the edges of the scan-ning range, nor has the emission spectrum in Fig. 3(b)been corrected for variations in the wavelength sensi-tivity of the detector or the transmission in thecollection optics.
As stated before, the power dependence was studiedto ensure that H20 was monitored without significantcontributions from H2O+. The power dependence,the logarithmic dependence of fluorescence intensityas a function of laser intensity, was measured to beequal to 2.0. This figure is in excellent agreementwith a two-photon absorption process; for the excita-tion of H2O+ the power dependence would be at leastcubic.2' The measurements were performed at thefocal point created by a spherical 1000-mm lens andyielded a straight line from the lowest laser energyused, 1 mJ/pulse, to the highest, 80 mJ/pulse. Atthe higher laser power, 12 GW/cm2, laser-inducedinterferences from N2+ were experienced at the focalpoint.
The detection limit at 300 K was estimated inimaging measurements in the laboratory air with awater content of 1%. The water molecules wereexcited on peak 4 in Fig. 3(a) through the use of alaser sheet of 7 mm x 0.1 mm with an energy of 100mJ/pulse, i.e., a power density of 0.85 GW/cm2 .The single-shot signal-to-noise ratio was estimated to5, which yields a detection limit of 0.2% at 1 bar and300 K.
The signal intensity from the LIF of water vaporexcited on peak 4 in Fig. 3(a) was also compared withthe Raman signal intensity. The quadratic powerdependence of the LIF signal and the linear powerdependence for the Raman signal gave a linear in-crease with laser power for the ratio of the LIF signalto the Raman signal. At the power density used inthe laser-sheet experiments, 0.9 GW/cm2, and withour experimental conditions the LIF signal was foundto be roughly 20 times stronger than the Ramansignal.
High-Pressure Measurements
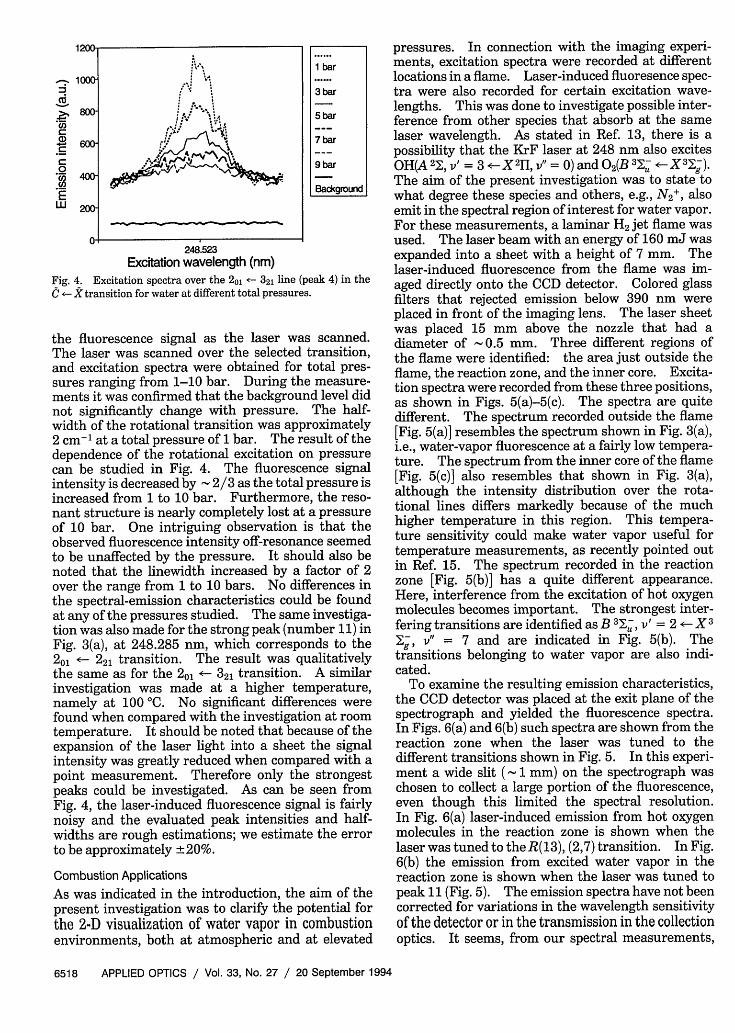
In the second investigation, the effects of pressure onthe excitation spectrum were examined in the high-pressure cell. A small amount of liquid water wasadded to the cell, which was then evacuated of itsgaseous contents. The vapor pressure of water at25 C is roughly 32 mbars, which thus was the waterpressure established in the cell during the experimentperformed at this temperature. Dry nitrogen gaswas added to the cell to increase the total pressure toenginelike conditions. A maximum pressure of 10bars was used. The laser light was expanded into a 5mm x 0.1 mm sheet to avoid damage to the windowsof the cell. The energy of the laser light was 95mJ/pulse giving a power density of 1 GW/cm2 inthe focal plane. The laser was tuned over the strongpeak in the excitation spectrum [peak 4 in Fig. 3(a)] at248.523 nm, corresponding to the 2 0 <- 321 transi-tion.22 As before, the detection system was operatedin the Y:T mode, thus following the time evolution of
Fig. 4. Excitation spectra over the 20, <- 321 line (peak 4) in the
C <- X transition for water at different total pressures.
the fluorescence signal as the laser was scanned.The laser was scanned over the selected transition,and excitation spectra were obtained for total pres-sures ranging from 1-10 bar. During the measure-ments it was confirmed that the background level didnot significantly change with pressure. The half-width of the rotational transition was approximately2 cm-l at a total pressure of 1 bar. The result of thedependence of the rotational excitation on pressurecan be studied in Fig. 4. The fluorescence signalintensity is decreased by 2/3 as the total pressure isincreased from 1 to 10 bar. Furthermore, the reso-nant structure is nearly completely lost at a pressureof 10 bar. One intriguing observation is that theobserved fluorescence intensity off-resonance seemedto be unaffected by the pressure. It should also benoted that the linewidth increased by a factor of 2over the range from 1 to 10 bars. No differences inthe spectral-emission characteristics could be foundat any of the pressures studied. The same investiga-tion was also made for the strong peak (number 11) inFig. 3(a), at 248.285 nm, which corresponds to the20 - 221 transition. The result was qualitativelythe same as for the 20 - 321 transition. A similarinvestigation was made at a higher temperature,namely at 100 'C. No significant differences werefound when compared with the investigation at roomtemperature. It should be noted that because of theexpansion of the laser light into a sheet the signalintensity was greatly reduced when compared with apoint measurement. Therefore only the strongestpeaks could be investigated. As can be seen fromFig. 4, the laser-induced fluorescence signal is fairlynoisy and the evaluated peak intensities and half-widths are rough estimations; we estimate the errorto be approximately ±20%.
Combustion Applications
As was indicated in the introduction, the aim of thepresent investigation was to clarify the potential forthe 2-D visualization of water vapor in combustionenvironments, both at atmospheric and at elevated
pressures. In connection with the imaging experi-ments, excitation spectra were recorded at differentlocations in a flame. Laser-induced fluoresence spec-tra were also recorded for certain excitation wave-lengths. This was done to investigate possible inter-ference from other species that absorb at the samelaser wavelength. As stated in Ref. 13, there is apossibility that the KrF laser at 248 nm also excitesOH(A2 2,v = 3 X21, v"0) and 02(B The aim of the present investigation was to state towhat degree these species and others, e.g., N2+, alsoemit in the spectral region of interest for water vapor.For these measurements, a laminar H2 jet flame wasused. The laser beam with an energy of 160 mJ wasexpanded into a sheet with a height of 7 mm. Thelaser-induced fluorescence from the flame was im-aged directly onto the CCD detector. Colored glassfilters that rejected emission below 390 nm wereplaced in front of the imaging lens. The laser sheetwas placed 15 mm above the nozzle that had adiameter of -0.5 mm. Three different regions ofthe flame were identified: the area just outside theflame, the reaction zone, and the inner core. Excita-tion spectra were recorded from these three positions,as shown in Figs. 5(a)-5(c). The spectra are quitedifferent. The spectrum recorded outside the flame[Fig. 5(a)] resembles the spectrum shown in Fig. 3(a),i.e., water-vapor fluorescence at a fairly low tempera-ture. The spectrum from the inner core of the flame[Fig. 5(c)] also resembles that shown in Fig. 3(a),although the intensity distribution over the rota-tional lines differs markedly because of the muchhigher temperature in this region. This tempera-ture sensitivity could make water vapor useful fortemperature measurements, as recently pointed outin Ref. 15. The spectrum recorded in the reactionzone [Fig. 5(b)] has a quite different appearance.Here, interference from the excitation of hot oxygenmolecules becomes important. The strongest inter-fering transitions are identified as B 31 u, VI = 2 <- X 3
;, vI' = 7 and are indicated in Fig. 5(b). Thetransitions belonging to water vapor are also indi-cated.
To examine the resulting emission characteristics,the CCD detector was placed at the exit plane of thespectrograph and yielded the fluorescence spectra.In Figs. 6(a) and 6(b) such spectra are shown from thereaction zone when the laser was tuned to thedifferent transitions shown in Fig. 5. In this experi-ment a wide slit ('- 1 mm) on the spectrograph waschosen to collect a large portion of the fluorescence,even though this limited the spectral resolution.In Fig. 6(a) laser-induced emission from hot oxygenmolecules in the reaction zone is shown when thelaser was tuned to the R(13), (2,7) transition. In Fig.6(b) the emission from excited water vapor in thereaction zone is shown when the laser was tuned topeak 11 (Fig.5). The emission spectra have not beencorrected for variations in the wavelength sensitivityof the detector or in the transmission in the collectionoptics. It seems, from our spectral measurements,
Fig. 5. Excitation spectra recorded at different positions in ahydrogen-air diffusion flame with detection in the spectral regionof 390-600 nm: (a) The air outside the flame, (b) the reactionzone, (c) the central part of the flame.
that there always exists a slight contribution fromboth water and hot oxygen, irrespective of the excita-tion wavelength. We suggest that this contributionoriginates from absorption from the broadband partof the laser light. No emission from OH radicals wasfound at the detection wavelengths studied in thisexperiment.
Finally, 2-D detection was performed in a hydrogen-diffusion flame as well as in the high-pressure cellafter ignition of a premixed combustible mixture ofmethane and dry air. In all figures shown below, theimages were recorded with one single laser pulse.During the flame measurements, the height of thelaser sheet was maintained at 7 mm and the laser-induced fluorescence was imaged directly onto the
Wavelength (nm)
400.0 440.0 480.0
Wavelength (nm)
Fig. 6. Emission spectra recorded at two different settings of theexcimer laser: (a) Excitation on the R(13) line in the B 3 u, V' =
2 -X 3, V' = 7 transition for oxygen, (b) excitation on the 20, -221 line (peak 11) in the C *- ktransition for water.
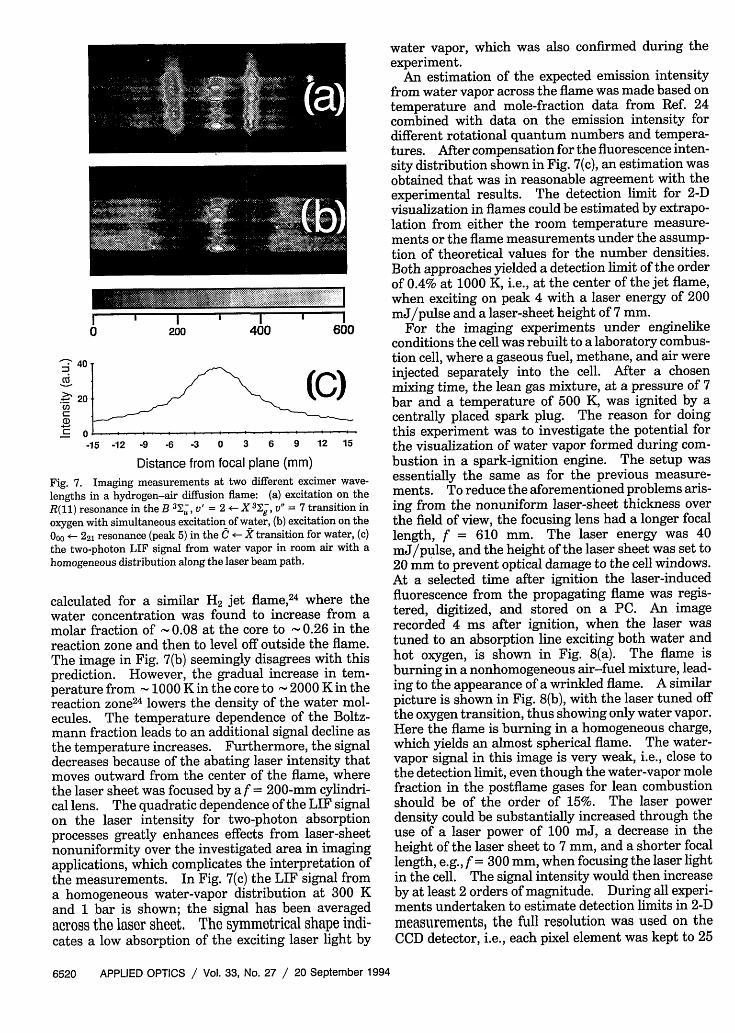
CCD detector. The laser was tuned to differenttransitions, which yielded quite different images.In Fig. 7(a) the laser was tuned to the R(1 1) resonancein the B 3u, v' = 2 - X 37, v" = 7 transition inoxygen. The signal from hot oxygen molecules ap-pears only in the reaction zone of the H2 jet flame.The signal from the central part of the flame isattributed to water vapor, which is also excited at thiswavelength. The signal from oxygen from whatappears to be outside the laser sheet is due to weaktails of laser light with a laser intensity high enoughto produce detectable fluorescence from oxygen, whichoriginates from a one-photon excitation, but not fromwater vapor. The lower signal in the left than in theright reaction zone in Fig. 7(a) indicates that the laserlight is significantly absorbed by the oxygen mol-ecules when traversing the flame. It could also benoted that the laser sheet inhomogeneity is muchmore pronounced in the water-vapor signal than inthe oxygen signal. The image in Fig. 7(b) is theresult of tuning the laser to the 00 - 22, resonance(peak 5) in the water-excitation spectrum. The sig-nal from water vapor is strongest outside the flame,from moisture in the ambient air, and at the center ofthe flame. The distribution of water vapor has been
Fig. 7. Imaging measurements at two different excimer wave-
lengths in a hydrogen-air diffusion flame: (a) excitation on theR(11) resonance in theB 32, V' = 2 -X 3 , v" = 7 transition inoxygen with simultaneous excitation of water, (b) excitation on theOoo - 22, resonance (peak 5) in the C - X transition for water, (c)the two-photon LIF signal from water vapor in room air with ahomogeneous distribution along the laser beam path.
calculated for a similar H2 jet flame,24 where thewater concentration was found to increase from amolar fraction of 0.08 at the core to - 0.26 in thereaction zone and then to level off outside the flame.The image in Fig. 7(b) seemingly disagrees with thisprediction. However, the gradual increase in tem-perature from - 1000 K in the core to 2000 K in thereaction zone24 lowers the density of the water mol-ecules. The temperature dependence of the Boltz-mann fraction leads to an additional signal decline asthe temperature increases. Furthermore, the signaldecreases because of the abating laser intensity thatmoves outward from the center of the flame, wherethe laser sheet was focused by a f = 200-mm cylindri-cal lens. The quadratic dependence of the LIF signalon the laser intensity for two-photon absorptionprocesses greatly enhances effects from laser-sheetnonuniformity over the investigated area in imagingapplications, which complicates the interpretation ofthe measurements. In Fig. 7(c) the LIF signal froma homogeneous water-vapor distribution at 300 Kand 1 bar is shown; the signal has been averagedacross the laser sheet. The symmetrical shape indi-cates a low absorption of the exciting laser light by
water vapor, which was also confirmed during theexperiment.
An estimation of the expected emission intensityfrom water vapor across the flame was made based ontemperature and mole-fraction data from Ref. 24combined with data on the emission intensity fordifferent rotational quantum numbers and tempera-tures. After compensation for the fluorescence inten-sity distribution shown in Fig. 7(c), an estimation wasobtained that was in reasonable agreement with theexperimental results. The detection limit for 2-Dvisualization in flames could be estimated by extrapo-lation from either the room temperature measure-ments or the flame measurements under the assump-tion of theoretical values for the number densities.Both approaches yielded a detection limit of the orderof 0.4% at 1000 K, i.e., at the center of the jet flame,when exciting on peak 4 with a laser energy of 200mJ/pulse and a laser-sheet height of 7 mm.
For the imaging experiments under enginelikeconditions the cell was rebuilt to a laboratory combus-tion cell, where a gaseous fuel, methane, and air wereinjected separately into the cell. After a chosenmixing time, the lean gas mixture, at a pressure of 7bar and a temperature of 500 K, was ignited by acentrally placed spark plug. The reason for doingthis experiment was to investigate the potential forthe visualization of water vapor formed during com-bustion in a spark-ignition engine. The setup wasessentially the same as for the previous measure-ments. To reduce the aforementioned problems aris-ing from the nonuniform laser-sheet thickness overthe field of view, the focusing lens had a longer focallength, f = 610 mm. The laser energy was 40mJ/pulse, and the height of the laser sheet was set to20 mm to prevent optical damage to the cell windows.At a selected time after ignition the laser-inducedfluorescence from the propagating flame was regis-tered, digitized, and stored on a PC. An imagerecorded 4 ms after ignition, when the laser wastuned to an absorption line exciting both water andhot oxygen, is shown in Fig. 8(a). The flame isburning in a nonhomogeneous air-fuel mixture, lead-ing to the appearance of a wrinkled flame. A similarpicture is shown in Fig. 8(b), with the laser tuned offthe oxygen transition, thus showing only water vapor.Here the flame is burning in a homogeneous charge,which yields an almost spherical flame. The water-vapor signal in this image is very weak, i.e., close tothe detection limit, even though the water-vapor molefraction in the postflame gases for lean combustionshould be of the order of 15%. The laser powerdensity could be substantially increased through theuse of a laser power of 100 mJ, a decrease in theheight of the laser sheet to 7 mm, and a shorter focallength, e.g., f = 300 mm, when focusing the laser lightin the cell. The signal intensity would then increaseby at least 2 orders of magnitude. During all experi-ments undertaken to estimate detection limits in 2-Dmeasurements, the full resolution was used on theCCD detector, i.e., each pixel element was kept to 25
Fig. 8. Imaging measurements of water vapor in an enginesimulator: (a) the laser tuned to the oxygen molecule resonance,(b) the laser wavelength tuned off the oxygen molecule resonance.
[lm. Clearly, the decrease in spatial resolution im-posed by the image intensifier would make it possibleto bin a certain number of pixels into a larger pixelsize without loosing spatial resolution, to furtherdecrease the detection limits.
Discussion and Summary
In this paper we have presented results from experi-mental investigations of the potential for detectionand visualization of water vapor in a combustionenvironment using a two-photon excitation at 248nm. It was evident from the experiments that 2-Dvisualization of H20 is quite feasible. We can con-clude from our work that special care must be takenin situations where hot oxygen and water vapor arepresent simultaneously. The experiments in Ref. 15were performed with a narrowband detection (2.2nm) at a spectral position where no interferenceemission from oxygen molecules was seen. How-ever, through the use of this detection approach, thesignal strength was reported to be reduced by a factorof 20, which could not be tolerated for 2-D imaging.In flames where hot oxygen and water may be presentsimultaneously it is evidently important to choose anexcitation wavelength at which minimum interfer-ence from oxygen lines can be expected. We havealso shown in this work that it is possible to choosethe excitation wavelength in a way such that almostonly water is detected. Moreover, the problem ofoverlapping lines may, under well-controlled condi-
tions and with well-chosen filters and excitationwavelength, also be turned to advantage because itgives the potential for multispecies detection. Fur-thermore, this approach makes possible the simulta-neous visualization of the exhaust gas distribution(H20) and the flame-front position (hot 02). Anexample of this multi-element visualization was shownin Fig. 8(a). Our interpretation of this image is thata fairly homogeneous distribution of water vapor issurrounded by hot oxygen molecules, indicating theflame front. This conclusion is supported by Fig.8(b) which show a similar cycle [albeit emanatingfrom a much more homogeneous air-fuel distributionprior to ignition than in Fig. 8(a)] with the laser tunedoff the oxygen peak. As demonstrated in Fig. 4, it isnot possible, at high pressures, to tune off the waterresonance because of the broad structureless back-ground.
In agreement with Refs. 13 and 15, it is expectedthat the strong predissociative nature of the excitedstate of water that we studied will avoid the influenceof quenching effects, because the rate of predissocia-tion from the excited state, P is almost 3 orders ofmagnitude stronger than the quenching rate, Q.However, the results from the high-pressure cell,which yields the two-photon signal intensity as afunction of applied foreign gas pressure, indicate thata pressure-dependent process is present, which de-creases the signal intensity, broadens the linewidths,and degrades the spectral-excitation feature as thepressure is increased. Although experimental mate-rial from combustion applications is limited and thelocking efficiency of the excimer laser was not continu-ously monitored, the general trends seen in theseapplications is in qualitative agreement with theresults of the cell measurements, in that the spectralfeatures are lost at high pressure. This pressure-dependent process would also lead to the loss of thepossibilities for making temperature measurementsat high pressures through the use of two-photonexcitation. It should be mentioned that althoughquench-free conditions also have been stated to pre-vail in excitation to v' = 3 in the A 2+ state of OHthrough fast predissociation, it has been suggestedthat rotational energy transfer can affect the LIFquantum yield at higher pressures.2 5 Furthermore,Ref. 25 showed that the predissociation rates vary fordifferent rotational quantum numbers. Clearly moreexperimental and theoretical investigations of pres-sure-induced phenomena in H20 are needed.
As has been demonstrated in numerous reports, itis of vital importance to be aware of possible laser-induced processes when one uses high-energy laserpulses in the UV spectral region, see e.g., Ref. 26.These phenomena are of most importance when oneis probing atomic species, which may be created bythe laser pulse itself. In the case of H20, the mostsevere interference to be expected was the possiblelaser-induced emission from the other species createdby the laser beam, e.g., from N2+ and C2, that wouldgive rise to emission in the spectral region of the
water emission. The emission from these specieswould be clearly seen in an emission spectrum be-cause of their well-known characteristic spectral fea-tures as compared with the structureless emissionfrom water. In the hydrogen flame only the formerspecies could interfere. However, we used a lasersheet and did not in any case detect this emission,although it was detected in experiments in air whenusing a spherical lens. In the case of hydrocarbonflames, we could expect some C2 interference. How-ever, from our cell and engine experiments, whichwe supplemented with flame measurements in amethane-oxygen flame, we did not experience anyinterfering C2 emission. We cannot, however, drawa more general conclusion because our work waslimited to a certain fuel and only to fuel conditionsthat were lean and stoichiometric.
As was stated in Ref. 15 and further supportedfrom our images of water in the hydrogen flame, thetemperature dependence of the LIF emission may beconsiderable. This fact indicates that quantitative2-D images of water densities in an environment withlarge temperature variations also requires an addi-tional 2-D temperature image. However, for mea-surements taken in situations with less temperaturevariation, a proper choice of rotational transition mayminimize this effect to a level where temperaturemeasurements are not necessary.
Because water vapor is excited by a two-photonprocess, it is of great importance to compensate theLIF images for nonlinear laser-intensity dependence(see Fig. 7). In the case of water vapor, one can dothis quite simply by recording an image with ahomogeneous distribution of water, e.g., in air, whichwould compensate for both the horizontal and verti-cal intensity distributions in the laser sheet. Be-cause the beam-intensity profile of the excimer laseris fairly stable, it is not necessary to make thiscompensation on a single-shot basis. However wefind that, in a general case, when probing a combus-tion intermediate using a two-photon process (e.g., 0or H, which are detected using a dye laser beam incombination with nonlinear frequency-convertingcrystals) the compensating approach becomes moreproblematic. These problems occur because it isnontrivial to produce homogeneous distributions ofthese species. Also the beam-intensity profiles showa much lower shot-to-shot stability than the primaryexcimer laser, which could necessitate an onlinereferencing scheme. We investigate these questionsnext in 2-D experiments on 0 and H.
One interesting question is that of the degree towhich it is possible to image H20 in an operatinginternal-combustion engine. We have made prelimi-nary engine measurements some milliseconds afterignition using natural gas as fuel, and our firstinterpretation is that water vapor was detected.'4
This was further supported by spectral measure-ments that show the typical water fluorescence spec-trum. One potential problem of measurement inthis environment is the possibility of interference
from laser-induced fluorescence of large hydrocar-bons, especially when more realistic fuels, e.g., liq-uids, are used. This fluorescence may be similar tothe unstructured fluorescence from water that leadsto spectral interference. However, our main inter-est in this field is to use this detection scheme for thevisualization of the remaining exhaust-gas distribu-tion at the ignition time and to correlate this with theearly combustion development. For this study weuse a nonfluorescing fuel, and the potential problemof interference from 02 will be avoided because of themuch lower temperature. Furthermore, for measur-ing relative water vapor distributions at the ignitiontime in the engine the comparatively limited varia-tion in temperature reduces the importance of aknown temperature field. Preliminary measure-ments of this kind have been made both in the celland in the engine and the data are currently beingevaluated.
This work was part of a European collaboration,Joint Research Committee-Homogeneous Combus-tion. We are thankful to this organization as well asto the Swedish Board for Industrial and TechnicalDevelopments, NUTEK, for financial support. Weare also grateful to I. Magnusson at Volvo AB foradvice and help.
References1. A. C. Eckbreth, Laser Diagnostics for Combustion and Species
(Abacus, Cambridge, Mass., 1987).2. M. Alden, H. M. Hertz, S. Svanberg, and S. Wallin, "Imaging
laser-induced fluorescence of oxygen atoms in a flame," Appl.Opt. 23, 32-55 (1984).
3. J. Haumann, J. M. Seitzmann, and R. K. Hanson, "Two-photon digital imaging of CO in combustion flows using planarlaser-induced fluorescence," Opt. Lett. 11, 776-778 (1986).
4. W. Lempert, G. Diskin, V. Kumar, I. Glesk, and R. Miles,
"Two-dimensional imaging of molecular hydrogen in a H2-airdiffusion flame using two-photon laser-induced fluorescence,"Opt. Lett. 16, 660-662 (1991).
5. P. G. Felton, J. Mantzaras, D. S. Bomse, and R. L. Woodin,"Initial two-dimensional laser induced fluorescence measure-ments of OH radicals in an internal combustion engine," SAE(Soc. Automot. Eng.) [Tech. Pap.] 88, 16-33 (1988).
6. R. Suntz, H. Becker, P. Monkhouse, and J. Wolfrum, "Two-dimensional visualization of the flame front in an internalengine by laser-induced fluorescence of OH radicals," Appl.Phys. B 47, 287-293 (1988).
7. M. Versluis, M. Boogaarts, R. Klein-Douwel, J. J. ter Meulen,W. L. Meerts, and G. Meijer, "Laser-induced fluorescenceimaging in a 100-kW natural gas flame," Appl. Phys. B 55,164-170 (1992).
8. K. Kohse-H6inghaus, U. Meijer, and B. Attal-Tr6tout, "Laser-induced fluorescence study of OH in flat flames of 1-10 barcompared with resonance CARS experiments," Appl. Opt. 29,1560-1569 (1990).
9. M. Lapp and C. M. Penney, "Raman measurements in flames,"in Advances in Infrared and Raman Spectroscopy, R. J. H.Clark and R. H. Hester, eds. (Heyden, London, 1977), Vol. 3,pp.204-261.
10. D. A. Stephenson, "High-temperature Raman spectra of CO2
and H20 for combustion diagnostics," Appl. Spectrosc. 35,682-684 (1981).
11. R. J. Hall, J. A. Shirley, and A. C. Eckbreth, "Coherent
anti-Stokes Raman spectroscopy: spectra of water vapor inflames," Opt. Lett. 4, 87-89 (1979).
12. R. J. Hall and J. A. Shirley, "Coherent anti-Stokes Ramanspectroscopy of water vapor for combustion diagnostics," Appl.Spectrosc. 37, 196-202 (1983).
13. P. Andresen, A. Bath, W. Groger, H. W. LUilf, G. Meijer, andJ. J. ter Meulen, "Laser-induced fluorescence with tunableexcimer lasers as a possible method for instantaneous tempera-ture field measurements at high pressures: checks with anatmospheric flame," Appl. Opt. 27, 365-378 (1988).
14. H. Neij, N. Georgiev, and M. Ald6n, "Applications of laser-induced fluorescence to spark-ignition engines," in Proceed-ings of the Second International Conference on Fluidmechan-ics, Combustion, Emissions and Reliability in ReciprocatingEngines (Istituto Motori, Capri, Italy, 1992), pp. 61-67.
15. R. W. Pitz, T. S. Cheng, J. A. Wehrmeyer, and C. F. Hess,"Two-photon predissociative fluorescence of H20 by a KrFlaser for concentration and temperature measurements inflames," Appl. Phys. B 56, 94-100 (1993).
16. C. Fotakis, C. B. McKendrick, and R. J. Donovan, "Two-photon excitation of H20 and D2O with a KrF laser (248 nm):photofragment fluorescence from OH and OD (A 21+)," Chem.Phys. Lett. 80, 598-600 (1981).
17. M. N. R. Ashfold, J. M. Bayley, and R. N. Dixon, "Molecularpredissociation dynamics revealed through multiphoton ioniza-tion spectroscopy. I. The C 'B, states of H20 and D2O,"Chem. Phys. 84,35-50 (1984).
18. J. Z. Zhang, E. H. Abramson, and D. G. Imre, "C A emissionin H20 following two-photon excitation: dissociation dynam-
ics in the A state for different initial states," J. Chem. Phys.95, 6536-6543 (1991).
19. S. Tsurubuchi, "Correlation diagrams for electronic states ofH20 and fragment species," Chem. Phys. 10, 335-344 (1975).
20. M. P. Docker, A. Hodgson, and J. P. Simons, "Molecularemission from H2O/D2O C 'B, and photodissociation dynam-ics on the B 'Al surface," Mol. Phys. 57, 129-147 (1986).
21. V. Engel, G. Meijer, A. Bath, P. Andresen, and R. Schinke,"The C - A emission in water: theory and experiment," J.Chem. Phys. 87, 4310-4314 (1987).
22. G. Meijer, J. J. ter Meulen, P. Andresen, and A. Bath,"Sensitive quantum state selective detection of H2O and D20by (2 + 1)-resonance enhanced multiphoton ionization," J.Chem. Phys. 85, 6914-6922 (1986).
23. M. Ald6n and W. Wendt, "Detection of nitrogen moleculesthrough multiphoton laser excitation and N2+ fluorescence,"Opt. Commun. 69, 31-36 (1988).
24. J. A. Miller and R. J. Kee, "Chemical nonequilibrium effects inhydrogen-air laminar jet diffusion flames," J. Phys. Chem. 81,2534-2542 (1977).
25. J. A. Gray and R. L. Farrow, "Predissociation lifetimes of OHA 27+ (' = 3) obtained from optical-optical double-resonancelinewidth measurements," J. Chem. Phys. 95, 7054-7060(1991).
26. U. Meier, K. Kohse-H6inghaus, and Th. Just, "H and 0 atomdetection for combustion applications: study of quenchingand laser photolyses effects," Chem. Phys. Lett. 126, 567-573(1986).