+ All Categories
Home > Documents > Applications of Artificial Intelligence and Graphy Theory ...

Applications of Artificial Intelligence and Graphy Theory ...

Date post: 25-Jan-2022
Category:
Upload: others
View: 4 times
Download: 0 times
Share this document with a friend
58
BearWorks BearWorks MSU Graduate Theses Summer 2020 Applications of Artificial Intelligence and Graphy Theory to Applications of Artificial Intelligence and Graphy Theory to Cyberbullying Cyberbullying Jesse D. Simpson Missouri State University, [email protected] As with any intellectual project, the content and views expressed in this thesis may be considered objectionable by some readers. However, this student-scholar’s work has been judged to have academic value by the student’s thesis committee members trained in the discipline. The content and views expressed in this thesis are those of the student-scholar and are not endorsed by Missouri State University, its Graduate College, or its employees. Follow this and additional works at: https://bearworks.missouristate.edu/theses Part of the Artificial Intelligence and Robotics Commons , and the Data Science Commons Recommended Citation Recommended Citation Simpson, Jesse D., "Applications of Artificial Intelligence and Graphy Theory to Cyberbullying" (2020). MSU Graduate Theses. 3535. https://bearworks.missouristate.edu/theses/3535 This article or document was made available through BearWorks, the institutional repository of Missouri State University. The work contained in it may be protected by copyright and require permission of the copyright holder for reuse or redistribution. For more information, please contact [email protected].
Transcript

BearWorks BearWorks

MSU Graduate Theses

Summer 2020

Applications of Artificial Intelligence and Graphy Theory to Applications of Artificial Intelligence and Graphy Theory to

Cyberbullying Cyberbullying

Jesse D. Simpson Missouri State University, [email protected]

As with any intellectual project, the content and views expressed in this thesis may be

considered objectionable by some readers. However, this student-scholar’s work has been

judged to have academic value by the student’s thesis committee members trained in the

discipline. The content and views expressed in this thesis are those of the student-scholar and

are not endorsed by Missouri State University, its Graduate College, or its employees.

Follow this and additional works at: https://bearworks.missouristate.edu/theses

Part of the Artificial Intelligence and Robotics Commons, and the Data Science Commons

Recommended Citation Recommended Citation Simpson, Jesse D., "Applications of Artificial Intelligence and Graphy Theory to Cyberbullying" (2020). MSU Graduate Theses. 3535. https://bearworks.missouristate.edu/theses/3535

This article or document was made available through BearWorks, the institutional repository of Missouri State University. The work contained in it may be protected by copyright and require permission of the copyright holder for reuse or redistribution. For more information, please contact [email protected].

APPLICATIONS OF ARTIFICIAL INTELLIGENCE AND GRAPH THEORY TO

CYBERBULLYING

A Master’s Thesis

Presented to

The Graduate College of

Missouri State University

In Partial Fulfillment

Of the Requirements for the Degree

Master of Science, Computer Science

By

Jesse D Simpson

August 2020

Copyright 2020 by Jesse D Simpson

ii

APPLICATIONS OF ARTIFICIAL INTELLIGENCE AND GRAPH THEORY TO

CYBERBULLYING

Computer Science

Missouri State University, August 2020

Master of Science

Jesse D Simpson

ABSTRACT

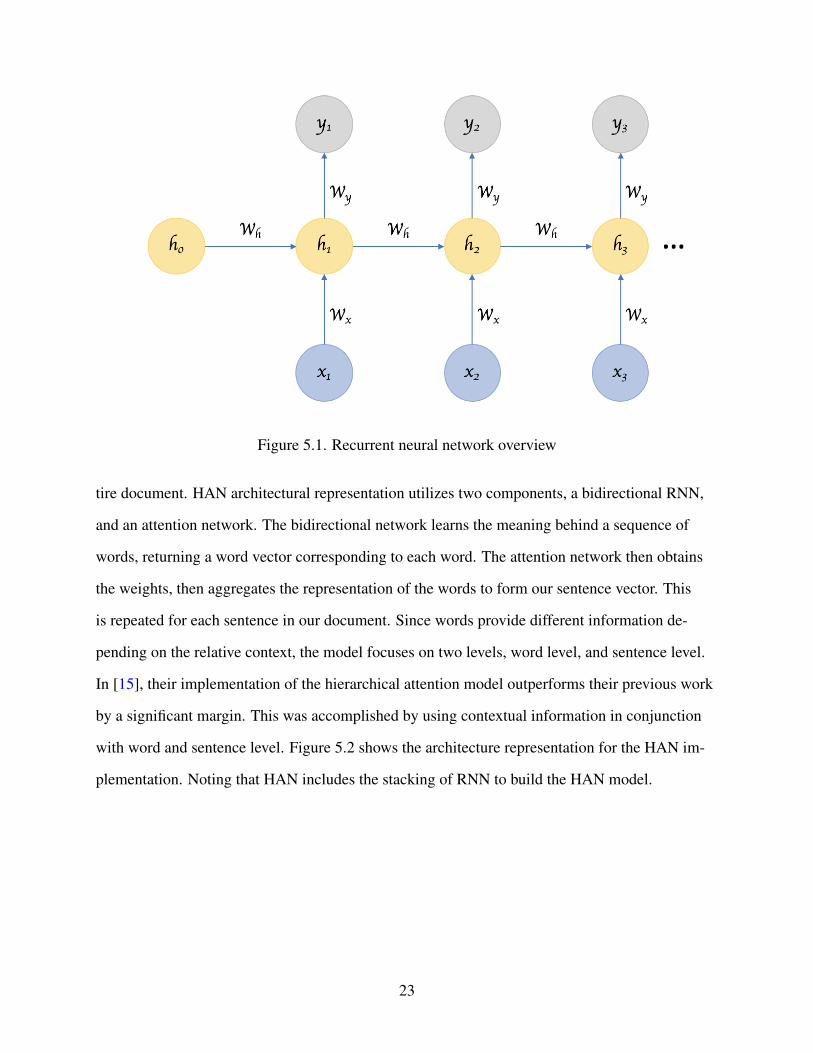
Cyberbullying is an ongoing and devastating issue in today’s online social media. Abusive usersengage in cyber-harassment by utilizing social media to send posts, private messages, tweets, orpictures to innocent social media users. Detecting and preventing cases of cyberbullying is cru-cial. In this work, I analyze multiple machine learning, deep learning, and graph analysis algo-rithms and explore their applicability and performance in pursuit of a robust system for detectingcyberbullying. First, I evaluate the performance of the machine learning algorithms Support Vec-tor Machine, Naıve Bayes, Random Forest, Decision Tree, and Logistic Regression. This yieldedpositive results and obtained upwards of 86% accuracy. Further enhancements were achieved us-ing Evolutionary Algorithms, improving the overall results of the machine learning models. DeepLearning algorithms was the next experiment in which efficiency was monitored in terms of train-ing time and performance. Next, analysis of Recurrent Neural Networks and Hierarchical Atten-tion Networks was conducted, achieving 82% accuracy. The final research project used graphanalysis to explore the relation among different social media users, and analyze the connectivityand communities of users who were discovered to have posted offensive messages.

KEYWORDS: machine learning, deep learning, graph analysis, cyberbullying, social media

iii

APPLICATIONS OF ARTIFICIAL INTELLIGENCE AND GRAPH THEORY TO

CYBERBULLYING

By

Jesse D Simpson

A Master’s ThesisSubmitted to the Graduate College

Of Missouri State UniversityIn Partial Fulfillment of the Requirements

For the Degree of Master of Science, Computer Science

August 2020

Approved:

Jamil M. Saquer, Ph.D., Thesis Committee Chair

Anthony J. Clark, Ph.D., Committee Member

Lloyd A. Smith, Ph.D., Committee Member

Julie Masterson, Ph.D., Dean of the Graduate College

In the interest of academic freedom and the principle of free speech, approval of this thesis indicates the format isacceptable and meets the academic criteria for the discipline as determined by the faculty that constitute the thesiscommittee. The content and views expressed in this thesis are those of the student-scholar and are not endorsed byMissouri State University, its Graduate College, or its employees.

iv

ACKNOWLEDGEMENTS

I am extremely thankful for the support from the Department of Computer Science at Mis-

souri State University. I am thankful for all the help that Dr. Saquer has provided. He has been a

wonderful mentor, professor, and thesis committee chair through my time at Missouri State Uni-

versity. Dr. Saquer’s motivation to help keep me motivated and on track was very appreciated. I

am also thankful for my other thesis committee members Dr. Anthony J Clark and Dr. Lloyd A

Smith, working with them has been a privilege.

I would like to express my gratitude to my family. My mother Becky has been the number

one supporter of my academic career, despite the adversity faced in my youth. I am thankful to

my grandmother Janice, she has provided so much love and dedication to her grandchildren.

I would like to thank all the wonderful colleagues, students, and friends I have met at Mis-

souri State University, for it truly made it feel like a second home.

v

TABLE OF CONTENTS

1 INTRODUCTION 1

2 LITERATURE REVIEW 42.1 Psychological Impact 42.2 Machine Learning Across Multiple Languages 52.3 Deep Learning Applications 62.4 Offensive Social Media Message Dataset 72.5 Identified Research Gap 8

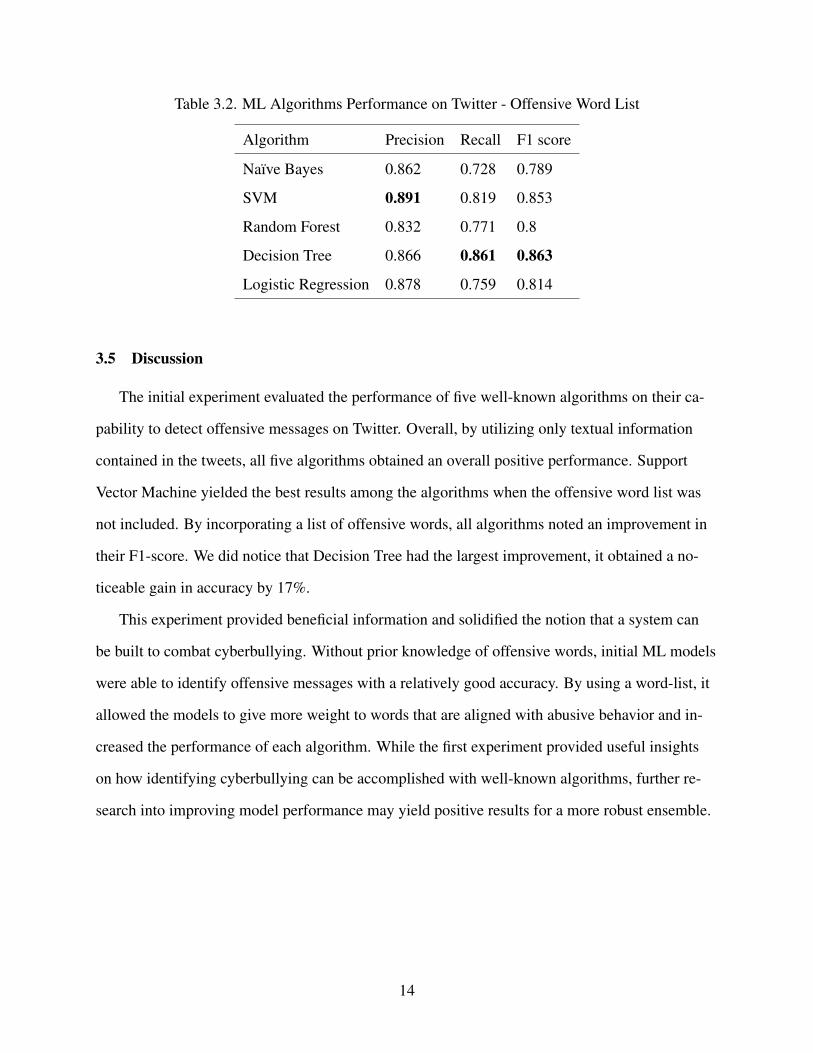
3 ANALYZING THE EFFECTIVENESS OF MACHINE LEARNING 93.1 Background 93.2 Methodology 103.3 Data Preprocessing 113.4 Experiment Setup and Results 123.5 Discussion 14

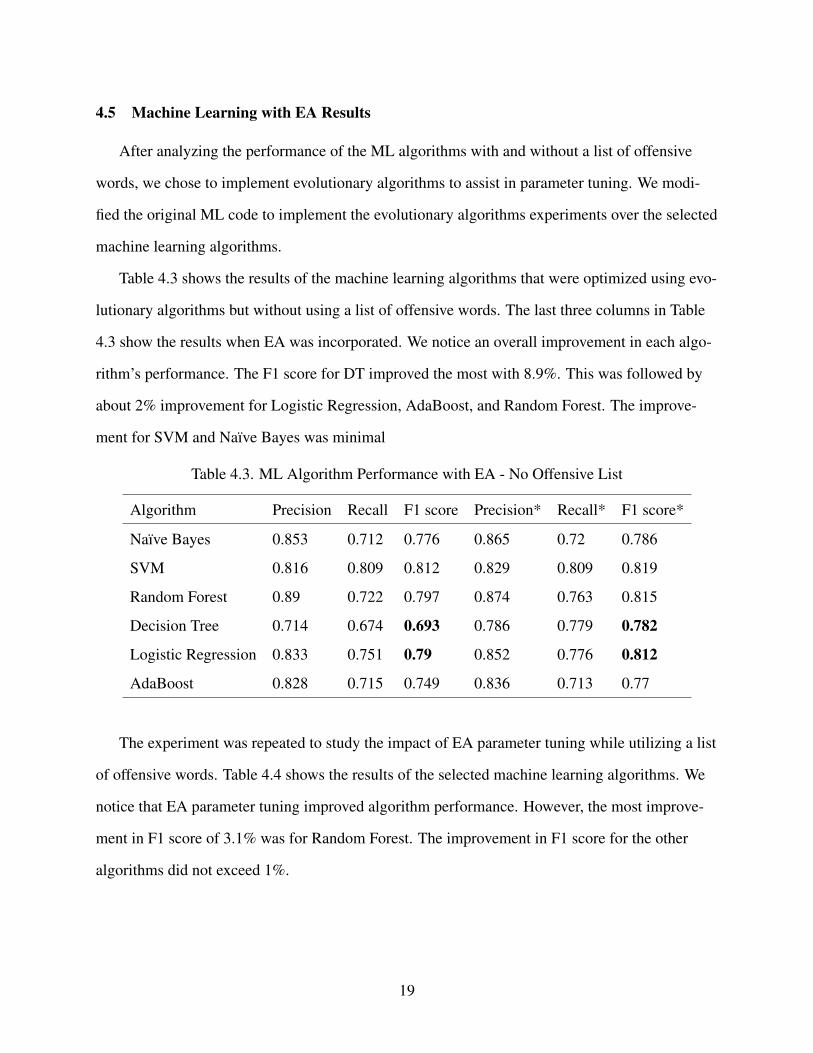
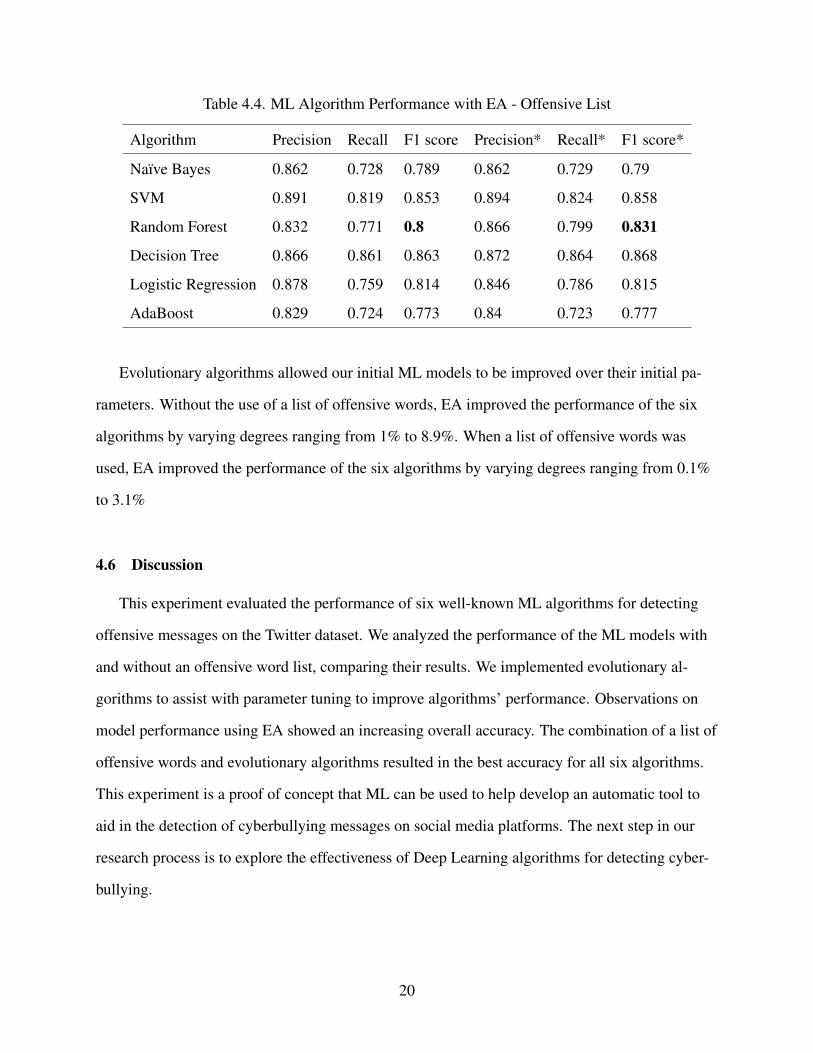
4 MACHINE LEARNING OPTIMIZATIONS WITH EVOLUTIONARY ALGORITHMS 154.1 Background 154.2 Methodology 154.3 Data Preprocessing 174.4 Machine Learning Results 174.5 Machine Learning with EA Results 194.6 Discussion 20

5 DEEP LEARNING APPLICATIONS ON TEXT CLASSIFICATION 215.1 Background 215.2 Deep Learning Methodology 225.3 Data Preprocessing 245.4 Algorithm Setup 255.5 Algorithm Performance 265.6 Discussion 28

6 GRAPH ANALYSIS OF TWITTER DATA 296.1 Background of Graph Theory 296.2 Graph Analysis Implementation 306.3 Data Preprocessing for Analysis 326.4 Graph Analysis on Waseem’s Dataset 336.5 Graph Analysis on Forum Posts 346.6 Discussion 40

7 CONCLUSION 42

vi

References 44

Appendices 46Appendix A. Datasets 46Appendix B. Codes 47

vii

LIST OF TABLES

Table 3.1. ML Algorithms Performance on Twitter - No Offensive Word List 13

Table 3.2. ML Algorithms Performance on Twitter - Offensive Word List 14

Table 4.1. ML Algorithm Performance without EA - No Offensive List 18

Table 4.2. ML Algorithm Performance without EA - Offensive List 18

Table 4.3. ML Algorithm Performance with EA - No Offensive List 19

Table 4.4. ML Algorithm Performance with EA - Offensive List 20

Table 5.1. Deep Learning Algorithm Hyperparameters 26

Table 5.2. Recurrent Neural Network Top Results 27

Table 5.3. Hierarchical Attention Network Top Results 27

Table 5.4. Deep Learning Algorithms Average Run-Time 28

Table 6.1. Waseem’s Dataset Data Sample 34

Table 6.2. Imperium Forum Data Sample 36

Table 6.3. Imperium Forum Data Processed 37

viii

LIST OF FIGURES

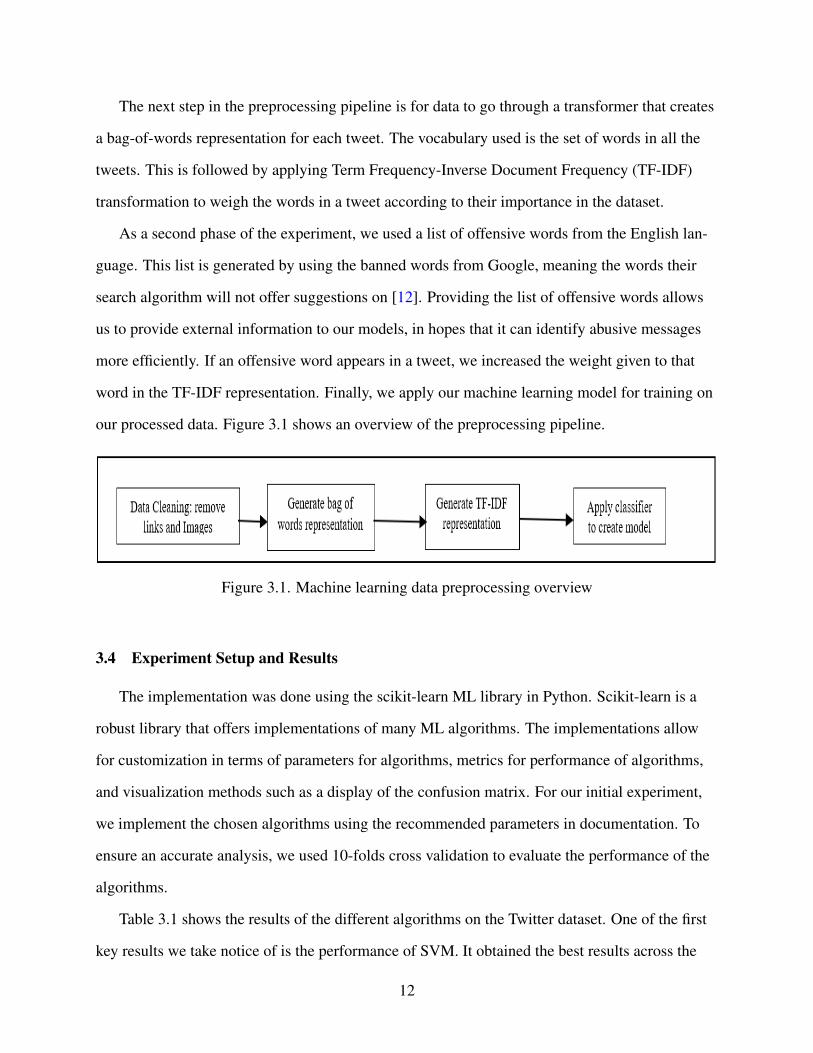
Figure 3.1. Machine learning data preprocessing overview 12

Figure 5.1. Recurrent neural network overview 23

Figure 5.2. Hierarchical attention network overview 24

Figure 5.3. Deep learning processing diagram 25

Figure 6.1. Directed and undirected graphs 30

Figure 6.2. PageRank result example 31

Figure 6.3. Waseem’s example data graph 35

Figure 6.4. Imperium forum user interactions 37

Figure 6.5. Imperium forum user interactions - labeled 38

Figure 6.6. Imperium forum offensive behavior users 39

Figure 6.7. Grouping of imperium forum offensive behavior users 40

ix

1 INTRODUCTION

In today’s modern daily-life, social media platforms like Facebook, Twitter, Snapchat, Insta-

gram, and many others have become the preferred method of communication for many people.

These platforms allow users to communicate in varying formats that are specific to each platform.

Social media platforms make up over 10 billion user accounts worldwide [1]. As such, with the

internet being accessible for most, communication through social media is likely to occur for the

average person. Social media has evolved throughout its age of development, incorporating up-

dates and usability for a broader range of users. The diversity of user interaction in social media

is extensive; however, communication directly between users remains simple. Facebook allows

users to directly message users or post on their public wall. Twitter allows you to mention users

with ‘@’, notifying them of your tweet. Each platform has its unique method of providing social

interactions between the users, making it easy to communicate and network with others. Given

the premise of easier communication, it has great benefits for ease of access and the ability of

sending messages from any device. However, social media and the internet also introduced a rela-

tively new but grave issue, cyberbullying.

Cyberbullying is the concept of bullying that occurs in places that involve digital technology,

such as cell phones, computers, and tablets. This includes SMS, texts, applications, online social

media, forums, and gaming. Cyberbullying entails sending, posting, or sharing negative, abu-

sive, falsified or targeted hurtful remarks about someone else. This does not represent physical

attacks but emotional attacks that aim to cause embarrassment, humiliation, or affect one’s image.

Cyberbullying –or sometimes referred to as online bullying– has been an emergent issue over

the last 10 years in which its shown 37% of teenagers experience cyberbullying [2]. Cyberbully-

ing can have dramatic consequences on victims and can lead to problems such as social anxiety,

depression, and suicidal thoughts [3], [4]. Before social media, incidents of bullying were lim-

ited to physical interaction between the harasser and the victim. If bullying happened on a school

1

premise, there was a chance that someone would have noticed the bullying and intervened. How-

ever, with the emergence of the Internet and social media, cyberbullying is a growing and bigger

problem because it can happen anytime and anywhere. Moreover, the chances of this happening

to teenagers without parents or a responsible adult noticing, and intervening are high. An im-

portant step in dealing with this serious problem is to be able to catch and identify incidents of

cyberbullying.

Social media platforms have realized the rampant issue of cyberbullying that is present in

today’s communication and have begun to take appropriate measures to assist users. Facebook al-

lows users to hide messages and posts that they don’t wish to see in their user feed. Additionally,

should a user receive offensive messages personally, blocking the sender disallows further com-

munication between the sender and receiver. Similarly, Twitter, Snapchat, and Instagram all have

built-in features that allow the user to control whose social media content they view and interact

with. However, this requires the user to manually read and determine if they are being subjected

to cyberbullying.

Natural language processing (NLP) is a domain of computer science that is primarily focused

on the interactions between computers and natural languages. Specifically, allowing computers

to be programmed to process, filter, and analyze large amounts of textual data. Researchers have

worked on implementations of NLP in a multitude of languages and textual formats. Similarly,

with Machine Learning (ML) applications being further researched, the impact of ML in text has

aimed to assist humans in processing, classifying, and handling large amounts of textual data. We

propose that Machine Learning, Deep Learning, Evolutionary Computing, and Graph Analysis

used together with natural language processing can assist in the development of a system to auto-

matically analyze and detect textual cases of cyberbullying on social media.

To combat cyberbullying, we conduct four experiments that show their effectiveness in ei-

ther analyzing or classifying textual information. First, we analyze the effectiveness of machine

learning in conjunction with textual data that has been processed with NLP techniques. To ac-

complish this, we conduct an experiment that analyzes a labeled dataset that contains abusive and

2

non-abusive tweets from Twitter. This dataset was obtained from [5] and it was created to assist

in detecting harassment online. Our experiment allowed us to analyze the effectiveness of ma-

chine learning on textual data that underwent a series of NLP techniques. To further enhance the

original machine learning work, we implement Evolutionary Algorithms (EA) on the parameters

of our machine learning models. EA allowed us to optimize the machine learning algorithms and

further improve our initial experimental results. We note which algorithms gained the largest per-

formance increase, further providing evidence and results on classifying abusive text. After ex-

perimenting with machine learning analysis, we proposed a new approach to our research where

we analyze the performance of Deep Learning (DL) models on classifying tweets. For our ex-

periment, we implemented two DL models: Recurrent Neural Network (RNN) and Hierarchical

Attention Network (HAN). We implement a varied NLP preprocessing pipeline to allow proper

inputs into our chosen networks. The experiment evaluates the labeled Twitter dataset, recording

the runtime required for training, as well as model accuracy. We also evaluate model performance

when network parameters are modified according to referenced journal articles on optimal model

settings. Lastly, we implement a graph analysis on the Twitter dataset. We analyze what type of

messages users are sending and receiving while using Twitter. We evaluate and note potential

users whose graph results aligned with labeled results obtained from previous experiments.

The remainder of this thesis is organized as follows: Chapter 2 provides discussion on re-

lated works; Chapter 3 provides details and results of machine learning experiments; Chapter 4

explains evolutionary algorithm enhancements and results; Chapter 5 provides experiment setup

and results of the deep learning models; Chapter 6 shows the process and performance of graph

analysis on the Twitter social media dataset. Finally, we provide concluding remarks in Chapter

7.

3

2 LITERATURE REVIEW

Existing literature for dealing with cyberbullying and aggressive language originates from

multiple domains, primarily from psychology and more recently computer science. Studies from

psychology focus on the emotional impact people face after being a target of cyberbullying. Specif-

ically, psychological studies on cyberbullying investigate how emotional trauma has impacted

a person’s life. Furthermore, teenagers who are recipients of cyberbullying have a shift in their

daily life, as it affects not only their online interactions but their academic performance as well.

Computer science researchers focus on developing algorithms and models to process natural lan-

guage and speech. They also focus on detecting emotions through means of sentiment analysis,

classifying information using Deep Learning and Machine Learning, and using data mining to

analyze and find the connections among social media. In this chapter, we discuss studies among

several computer science domains, focusing on work that deals with detecting emotions or classi-

fying textual data on social media platforms.

2.1 Psychological Impact

Psychological studies on victims and persons who actively conduct bullying and/or cyberbul-

lying provide insight into the actions, consequences and emotional impact on victims. Parime

and Suri study the transition of physical bullying into cyberbullying [6]. They report how the

methodology has changed for people who receive abusive messages, as well as how an abuser’s

physical methods evolved to online. The paper inspects the effectiveness of utilizing data mining

techniques in conjunction with machine learning to assist in identifying cases of cyberbullying.

This was done by performing text mining, sentiment analysis, and raising awareness of the psy-

chological cues for kids, parents, and users. Their approach is a multi-step process: determining

text characteristics, data preprocessing, feature generation, pattern recognition, and interpretation.

Their process yielded positive results in terms of both pattern recognition and overall enhance-

4

ment of notable cues for persons to be aware of when dealing with cases of cyberbullying. This

includes cues for parents and figures in a position of power to assist a victims, such as monitoring

eating behavior, emotional behavior, fatigue, and personality shifts. These common signs were

vital in aiding in the process of discovering victims of cyberbullying.

The consequences and lasting effects of cyberbullying are more than just inconsequential

messages, there is a lasting, long term symptom in mental health. In [7], Nixon conducts a ro-

bust study on the process of what cyberbullying entails, as well as the consequences it brings to

both the abuser and victim. Nixon shows in his study that victims of cyberbullying can undergo

severe mental and physical symptoms. This includes increased anxiety, sleep disruption, lack

of appetite, depression, headaches, and self-esteem issues. The study also explores the diversity

in terms of victims regarding adolescent age, gender, and developmental risks involved for both

victims and abusers. Furthermore, the study introduces several prevention and intervention tech-

niques that can be applied to assist in identifying and resolving cases of cyberbullying from both

the digital aspect, as well as the academic aspect. The in-depth analysis of the study highlights

the modern issues that not only adolescence teens potentially face while navigating the internet

but showcases that this is a problem that must be addressed, worked on and ultimately preventing

further spread of cyberbullying behavior.

2.2 Machine Learning Across Multiple Languages

Studies in the applications of Machine Learning span across a multitude of languages. In [8],

Eshan and Hasan conduct a machine learning experiment on comments obtained from Facebook

celebrities, classifying Bengali text with the labels abusive and non-abusive. They implement

three well-known ML algorithms: Multinomial Naıve Bayes (MNB), Random Forest (RF), and

Support Vector Machine (SVM). The comments are broken down into unigram, bigram, and tri-

gram features and processed with both a Count Vectorizer and TF-IDF Vectorizer. The authors

analyze the impact of the selected ML algorithms across the different n-gram inputs and pro-

vide multiple graphs explaining their results. They report that overall, the support vector machine

5

model using a linear kernel provided the highest accuracy. This included using the trigram sen-

tence feature with the TF-IDF Vectorizer. Notably, their results indicated positive model appli-

cations on their social media text, while noting that further improvements and optimizations to

create a more robust detection model were possible.

Cyberbullying is a multi-lingual issue that spans a multitude of cultures. A study conducted

by M. Andriansyah et al in [9] used SVM to classify comments on Indonesian Seleb-gram as

whether or not they are cyberbullying. Given language diversity, a similar experiment was per-

formed as mentioned previously on classifying Bengali text. Their approach on analyzing In-

donesian Seleb-gram provides a unique aspect of how the classification is performed. Previously,

in [7], comments were analyzed on an n-gram level; however, M. Andriansyah et al propose clas-

sification being done on a sentence level. Comments contain multipole sentences, each of these

sentences is classified using the SVM model. Should a comment have multiple sentences labeled

as cyberbullying-like sentences, the overall comment is labelled as cyberbullying. Overall, their

implementation obtained 79% accuracy, but the limiting factor was the size of their data set and

testing set, which was limited to 1053 comments. Despite the diversity in language structure and

social media platforms, [8], [9] have shown that ML algorithms are a valid application to analyze

and classify abusive, hate, and cyberbullying messages in different natural languages. Further ex-

pansions on their proposed methodologies can be performed, as well as optimizations regarding

training models for detection.

2.3 Deep Learning Applications

Ruangkanokmas, Achalakul, and Akkarajitsakul present an experiment of Deep Learning

(DL) methodologies in determining sentiment and emotion in text [10]. The experiment covers

a DL network known as Deep Belief Network (DBN) and demonstrates its usage on processing

text-based input and classifying sentiment. Differing from previous methods for data prepro-

cessing in Section 2.2, feature selection is done on the text by using a bag-of-words technique.

This technique describes text by word occurrences while ignoring the positional information that

6

are relative to the words. After feature selection is performed, text cleaning and tokenization are

conducted to prepare for their Deep Belief Network with Feature Selection (DBNFS) model. To

analyze the effectiveness of their model, they use five consumer review datasets that contain pos-

itive, neutral, and negative labeled sentiments. These results were compared to other well-known

algorithm implementations, showing that DBN with feature selection outperformed the follow-

ing algorithms: Spectral, Transductive SVM (TSVM), Personal/Impersonal Views (PIV), DBN,

Hybrid DBN. Overall, their DBNFS model achieved the highest accuracy among three of the five

datasets, while maintaining above average accuracy on the other two. This paper provided great

results at the applications of DL in detecting emotions in text, as well as optimizations to improve

base network performance with feature selection. Their model obtained 75% accuracy when uti-

lized on diverse review datasets, further reinforcing the applications of deep learning on textual

data.

2.4 Offensive Social Media Message Dataset

To design and implement a conclusive system to classify cyberbullying, a thorough and exten-

sive amount of labeled data is required. Waseem and Hovy in [5] conducted a study on the com-

ponents of identifying hateful social media users. However, one of the primary contributions their

paper offers is not the classification methods but the access to an open-source dataset of 16,000

tweets that they labeled. The dataset has extensive and diverse offensive tweets that target dif-

ferent individuals, demographics, and subgroups. The paper has extensive information regarding

how the dataset breaks down on targeted gender types, types of offensive messages received, lex-

ical components, and breakdown of hate messages with their features. The authors perform basic

tests on the dataset using a logistic regression classifier with 10-fold cross-validation to measure

the influence of features on prediction performance. Tweets are processed into character n-grams,

which break words into character-level grouping of n size. The character n-gram features are ana-

lyzed across normal textual information and gender-based slander information. The results show

that certain n-grams are linked to the labeling of offensive messages, as well as key n-grams to

7

determine if there are underlying offensive tones which include sexism and racism. Further work

can be conducted utilizing the dataset presented in Waseem’s paper which can serve as a foun-

dational dataset to train and test initial models in preparation for more diverse cases of offensive

social media messages.

2.5 Identified Research Gap

Social media platforms are in a state of constant evolution, especially in how users commu-

nicate with each other. There has been a multitude of studies that focus on processing textual

information with emotions or sentiment as previously covered [6], [8], and [9], as well as vast

studies on ML on processing text information in general. However, a robust system with multiple

methodologies implemented to detect and prevent cyberbullying is lackluster. We feel it is im-

portant to explore multiple domains of machine learning, combining their classification abilities

to identify, isolate, and remove social media users who conduct acts of cyberbullying. There-

fore, in the following chapters, we present experiments that focuses on identifying cyberbullying

cases among social media using Machine Learning, Evolutionary Algorithms, Deep Learning and

Graph Analysis. The different methods will be evaluated on their performance for combating the

dire issues of cyberbullying.

8

3 ANALYZING THE EFFECTIVENESS OF MACHINE LEARNING

Detecting cases of cyberbullying has relied on human analysis, identification, and manual

prevention. Given the premise of how artificial intelligence originates its designs from the human

brain, we can apply its methods to similarly train a model whose purpose is to identify cyberbul-

lying messages on social media. Following this premise, we conduct an experiment to analyze

the effectiveness of machine learning regarding the classification of abusive messages on social

media. This experiment will implement a pre-processing pipeline that will be used for further

experiments, as well as verifying the overall performance of machine learning algorithms in the

targeted problem domain.

3.1 Background

In today’s modern daily-life, social media platforms like Facebook, Twitter, Snapchat, Insta-

gram, and many others have become a core component. Social media platforms make up over

10 billion user accounts worldwide [1]. As such, with the internet being accessible for most,

communication through social media is most likely to occur for the average person. Given the

premise of easier communication, it has great benefits for ease of access, sending messages from

any device; however, social media and the internet also introduced a new grave issue, cyberbully-

ing. Cyberbullying or sometimes referred to as online bullying is an emergent issue over the last

10 years in which its shown 37% of teenagers experience cyberbullying [2]. Bullying has tran-

sitioned from the original setting of schools where intervention from friends or teachers was a

possibility; therefore, detecting when cases of cyberbullying occur online is critical to filter out

cyberbullying messages and report users who engage in such acts.

Social media platforms have realized the rampant issue of cyberbullying that is present in

today’s communication and have begun to take appropriate measures to assist users. Facebook al-

lows users to hide messages and posts that they don’t wish to see in their user feed. Additionally,

9

should a user receive offensive messages personally, blocking the sender disallows further com-

munication between the sender and receiver. Similarly, Twitter, Snapchat, and Instagram all have

built-in features that allow the user to control whose social media content they view and interact

with. However, this system currently requires the user to manually read and determine if they are

being subjected to cyberbullying.

The goal of the experiment is to first, understand the impact of how machine learning can be

used to classify social media messages. We wish to create a system that can utilize multiple al-

gorithms to assist in classification of potential cyber-harassment messages, as well as identifying

users to actively participate in such behavior, and finally identify users who are victims of horren-

dous behavior.

3.2 Methodology

Machine learning encompasses many different algorithms that can be utilized for classifica-

tion. For our experiment, we wish to develop techniques that can be used in real-time for auto-

matic identification of cyberbullying while browsing on social media. We chose to evaluate the

performance of five well-known algorithms.

• Naıve Bayes

• Support Vector Machine

• Decision Tree

• Random Forests

• Logistic Regression

Naıve Bayes is a probabilistic classifier that is based on Bayes’ theorem. It uses prior proba-

bilities determined from the training data about class probabilities and prior object probabilities

to predicts the posterior class probability of new objects. It is called naıve because it assumes at-

tributes are conditionally independent.

Support Vector Machine (SVM) is a versatile classification method for both linear and non-

linear data. It maps nonlinear data to a higher dimensional space where the data becomes linearly

10

separable. The algorithm finds an optimal separating hyperplane to classify the data. To avoid the

computational expense that arises from mapping the data to a higher dimensional space, SVM

applies what is called the kernel trick. In our experiment, the linear kernel worked well.

Decision Trees (DT) is a non-parametric supervised learning method used for classification

and regression. The algorithm uses the training data to build a tree that is then used to classify

new objects. The algorithm uses a heuristic such as information gain to determine the best at-

tribute to use for the test condition at each internal node of the tree.

Random Forests is an ensemble of decision trees. It uses the idea that if one DT performs

well, then an ensemble of many trees (a forest) should perform better. To classify a new object,

each tree is given a vote and majority voting is used to determine the class of the new object.

Logistic Regression is an extension of linear regression that is used for classification. A logis-

tic function is applied to the regression model to constraint the output to the range [0, 1] so that

the output can be interpreted as the class probability of the test object.

The implementation of these algorithms will provide a strong ensemble of models. Ensem-

ble classification allows each model to contribute a classification to a sample, using a majority

vote system, the most voted label from the ensemble is the resulting label. Ensemble learning is

a strong method for improving the accuracy of classification. In [11], Dietterich covers the im-

plementation and benefits of an ensemble labeling method. Dietterich’s work inspired our future

graph analysis work that utilized labeling from multiple algorithms.

3.3 Data Preprocessing

The experiments conducted in this paper use the Twitter dataset created by Waseem and Hovy

in [5]. The dataset contains a total of 16,914 tweets with 5, 355 tweets labeled as offensive and

11559 labelled as non-offensive. Given the nature of Twitter, improper grammar and Internet jar-

gon may be present. A first preprocessing step is the removal of unnecessary images, links and

stop words. Currently for the experiment being conducted, we are focusing on textual informa-

tion. The removal of noise such as embedded images and URLs is required.

11

The next step in the preprocessing pipeline is for data to go through a transformer that creates

a bag-of-words representation for each tweet. The vocabulary used is the set of words in all the

tweets. This is followed by applying Term Frequency-Inverse Document Frequency (TF-IDF)

transformation to weigh the words in a tweet according to their importance in the dataset.

As a second phase of the experiment, we used a list of offensive words from the English lan-

guage. This list is generated by using the banned words from Google, meaning the words their

search algorithm will not offer suggestions on [12]. Providing the list of offensive words allows

us to provide external information to our models, in hopes that it can identify abusive messages

more efficiently. If an offensive word appears in a tweet, we increased the weight given to that

word in the TF-IDF representation. Finally, we apply our machine learning model for training on

our processed data. Figure 3.1 shows an overview of the preprocessing pipeline.

Figure 3.1. Machine learning data preprocessing overview

3.4 Experiment Setup and Results

The implementation was done using the scikit-learn ML library in Python. Scikit-learn is a

robust library that offers implementations of many ML algorithms. The implementations allow

for customization in terms of parameters for algorithms, metrics for performance of algorithms,

and visualization methods such as a display of the confusion matrix. For our initial experiment,

we implement the chosen algorithms using the recommended parameters in documentation. To

ensure an accurate analysis, we used 10-folds cross validation to evaluate the performance of the

algorithms.

Table 3.1 shows the results of the different algorithms on the Twitter dataset. One of the first

key results we take notice of is the performance of SVM. It obtained the best results across the

12

algorithms with an F1-score of 0.812. Notably, three other algorithms, Naıve Bayes, Random

Forest and Logistic Regression, had performance levels slightly below SVM. We also note that

Decision Tree (DT) algorithm had overall the lowest F1-score of 0.693. This can be attributed to

poor selection of test attributes among the internal nodes of the tree. We also notice that there is

consistency between the precision and recall values while running the experiment. These values

suggest that the algorithms work well for an unbalanced dataset, which is primarily the case for

cyberbullying datasets.

Table 3.1. ML Algorithms Performance on Twitter - No Offensive Word List

Algorithm Precision Recall F1 score

Naıve Bayes 0.853 0.712 0.776

SVM 0.816 0.809 0.812

Random Forest 0.89 0.722 0.797

Decision Tree 0.714 0.674 0.693

Logistic Regression 0.833 0.751 0.79

Table 3.2 shows the results when the experiment incorporated the list of offensive words. We

notice a remarkable improvement in the performance of the Decision Tree algorithm. It resulted

in an F1-score of 0.863, a 17% increase in F1-score when compared to the previous model. DT

performance was followed closely by SVM, which had an F1-score of 0.853, an improvement

of 4%. However, when analyzing the impact of the offensive word list on our algorithms, only

DT saw a significant improvement while the other algorithms yielded slight improvements. The

improvement in the DT algorithm provided us useful insight in how the list of offensive words

aided the algorithm during the selection of its test attributes among the different internal nodes of

the tree.

13

Table 3.2. ML Algorithms Performance on Twitter - Offensive Word List

Algorithm Precision Recall F1 score

Naıve Bayes 0.862 0.728 0.789

SVM 0.891 0.819 0.853

Random Forest 0.832 0.771 0.8

Decision Tree 0.866 0.861 0.863

Logistic Regression 0.878 0.759 0.814

3.5 Discussion

The initial experiment evaluated the performance of five well-known algorithms on their ca-

pability to detect offensive messages on Twitter. Overall, by utilizing only textual information

contained in the tweets, all five algorithms obtained an overall positive performance. Support

Vector Machine yielded the best results among the algorithms when the offensive word list was

not included. By incorporating a list of offensive words, all algorithms noted an improvement in

their F1-score. We did notice that Decision Tree had the largest improvement, it obtained a no-

ticeable gain in accuracy by 17%.

This experiment provided beneficial information and solidified the notion that a system can

be built to combat cyberbullying. Without prior knowledge of offensive words, initial ML models

were able to identify offensive messages with a relatively good accuracy. By using a word-list, it

allowed the models to give more weight to words that are aligned with abusive behavior and in-

creased the performance of each algorithm. While the first experiment provided useful insights

on how identifying cyberbullying can be accomplished with well-known algorithms, further re-

search into improving model performance may yield positive results for a more robust ensemble.

14

4 MACHINE LEARNING OPTIMIZATIONS WITH EVOLUTIONARY ALGORITHMS

Performance from the previous experiment indicated the models that are applicable to identi-

fying cyberbullying cases. In order to further enhance our classification accuracy before we con-

duct graph analysis, we chose to implement parameter optimization. Evolutionary algorithms

(EA) was the selected method to further improve the parameter optimization for our machine

learning models.

In this chapter, we will discuss the advantages of implementing EA, the chosen parameter op-

timization method. We will cover the features behind EA, its implementation method on machine

learning models, as well as discuss the experiment setup and results.

4.1 Background

Evolutionary algorithms are inspired by biological evolution found in nature, including its

fundamental concepts. EA implements parent selection, mutation, crossover, fitness function,

survivor selection, and multiple generations to aid in the domain task. EA are used to primarily

discover solutions to problems humans do not know how to solve efficiently. The concept of EA

allows solutions to problems to be generated without direct influence of biases from humans. For

the experiment, we reference Genetic Programming (GP), a type of evolutionary algorithm. GP

has been shown to be useful in the discovery of the functional relationship between features and

classification. In [13], applications of evolutionary algorithms are extensive discussed, including

the theory and implementation methods.

4.2 Methodology

To further enhance our case study on the effects of Machine Learning in social media, we

utilize evolutionary algorithms. Currently, we are utilizing machine learning models from scikit-

learn that by default have base parameters set. We chose to implement EA to attempt an improve-

15

ment on our original Machine Learning work covered in Chapter 3. In order to implement EA,

we have to define how we will implement the EA components. The components that must be im-

plemented for EA are the following:

• Population

• Parent Selection

• Fitness Function

• Crossover

• Mutation

• Survivor Selection

Population: The population size for our experiment is 100 chromosomes. Each chromosome

is a list representation of parameters that correspond to a specific machine learning algorithm.

The size of each chromosome is consistent throughout the population; however, each correspond-

ing algorithm has a different chromosome size because there are differences in parameter sizes

among the different ML algorithms.

Parent Selection: To enhance our population in each generation, we implement Tournament

Selection to select parents. Tournament selection randomly selects chromosomes from a popu-

lation then compares their fitness results, taking the best k chromosomes for crossover. For our

experiment, we take the two best chromosomes (i.e., k = 2).

Fitness Function: To evaluate the chromosomes in a population, a corresponding evaluation

or fitness function is required. For our work, we evaluate the fitness of a chromosome by running

a ML model with the chromosome parameters, recording the precision, recall, and F1 score and

assigning its fitness rank the F1 score.

Crossover: For our experiment, we implement a two-point crossover [14]. Two-point crossover

is the process of selecting two random crossover points from parent chromosomes. Then, the

slices between the two points are swapped between the parents.

Mutation: Mutation is the process of mutating a select slice of a chromosome. Regarding our

experiment, mutation can occur on 3 types of slices. String parameters are mutated by randomly

16

selecting a different string choice for a specific parameter. Binary parameters selected for muta-

tion are inverted. Numeric parameters are mutated by performing Gaussian mutation, in which a

random value from a Gaussian distribution is added [14]. A mutation occurs with a probability of

1/k, proportionate to the chromosome size k.

Survivor Selection: Survivor selection is the process of determining which chromosomes sur-

vive from one generation to the next. For our experiment, we organize the primary population

and child population by their chromosome fitness. Then, we replace the worst chromosome in the

primary population with the best chromosome created in the child population.

4.3 Data Preprocessing

Given the nature of Twitter, improper grammar and Internet jargon may be present. A first

preprocessing step is the removal of unnecessary images, links and stop words. Then, the data is

passed through a transformer that creates a bag-of-words representation for each tweet. The vo-

cabulary used is the set of words in all the tweets. This is followed by applying Term Frequency-

Inverse Document Frequency (TF-IDF) transformation to weigh the words in a tweet accord-

ing to their importance in the dataset. As a second phase of the experiment, we used a list of of-

fensive words from the English language obtained from [12]. If an offensive word appears in a

tweet, we increased the weight given to that word in the TF-IDF representation by 0.25%. Then

the ML classifier is applied to the processed data.

4.4 Machine Learning Results

For the experiment, the initial analysis was performed on analyzing the machine learning

model’s performance on classifying cyberbullying tweets. The implementation was done using

the scikit-learn ML library in Python. We used 10-folds cross-validation to evaluate the perfor-

mance of the algorithms. Table 4.1 shows the results of the different algorithms on the Twitter

dataset before incorporating EA. We notice that SVM provided the best results with an F1-score

of 0.812. The Decision Tree (DT) algorithm had the lowest F1-core of 0.693. Three other algo-

17

rithms, namely Random Forest, Logistic Regression, and Naıve Bayes performed comparatively

well, although a little behind, relative to SVM. We also notice that there is consistency between

the precision and recall values suggesting that the algorithms work well for unbalanced datasets,

which is the case for cyberbullying datasets.

Table 4.1. ML Algorithm Performance without EA - No Offensive List

Algorithm Precision Recall F1 score

Naıve Bayes 0.853 0.712 0.776

SVM 0.816 0.809 0.812

Random Forest 0.89 0.722 0.797

Decision Tree 0.714 0.674 0.693

Logistic Regression 0.833 0.751 0.79

4.2 shows the result when a list of offensive words was used. 4.2 shows varying degrees of

improvement on F1 score values among the different algorithms as compared with the results

in Table 5.1. The Decision Tree algorithm performance increased by 17% with an F1-score of

0.863. This is followed closely by SVM at F1-score of 0.853, an increase by 4.1%. The large

improvement in the case of DT means that using a list of offensive words helped the algorithm

make a better selection of test attributes at different internal nodes of the tree.

Table 4.2. ML Algorithm Performance without EA - Offensive List

Algorithm Precision Recall F1 score

Naıve Bayes 0.862 0.728 0.789

SVM 0.891 0.819 0.853

Random Forest 0.832 0.771 0.8

Decision Tree 0.866 0.861 0.863

Logistic Regression 0.878 0.759 0.814

18

4.5 Machine Learning with EA Results

After analyzing the performance of the ML algorithms with and without a list of offensive

words, we chose to implement evolutionary algorithms to assist in parameter tuning. We modi-

fied the original ML code to implement the evolutionary algorithms experiments over the selected

machine learning algorithms.

Table 4.3 shows the results of the machine learning algorithms that were optimized using evo-

lutionary algorithms but without using a list of offensive words. The last three columns in Table

4.3 show the results when EA was incorporated. We notice an overall improvement in each algo-

rithm’s performance. The F1 score for DT improved the most with 8.9%. This was followed by

about 2% improvement for Logistic Regression, AdaBoost, and Random Forest. The improve-

ment for SVM and Naıve Bayes was minimal

Table 4.3. ML Algorithm Performance with EA - No Offensive List

Algorithm Precision Recall F1 score Precision* Recall* F1 score*

Naıve Bayes 0.853 0.712 0.776 0.865 0.72 0.786

SVM 0.816 0.809 0.812 0.829 0.809 0.819

Random Forest 0.89 0.722 0.797 0.874 0.763 0.815

Decision Tree 0.714 0.674 0.693 0.786 0.779 0.782

Logistic Regression 0.833 0.751 0.79 0.852 0.776 0.812

AdaBoost 0.828 0.715 0.749 0.836 0.713 0.77

The experiment was repeated to study the impact of EA parameter tuning while utilizing a list

of offensive words. Table 4.4 shows the results of the selected machine learning algorithms. We

notice that EA parameter tuning improved algorithm performance. However, the most improve-

ment in F1 score of 3.1% was for Random Forest. The improvement in F1 score for the other

algorithms did not exceed 1%.

19

Table 4.4. ML Algorithm Performance with EA - Offensive List

Algorithm Precision Recall F1 score Precision* Recall* F1 score*

Naıve Bayes 0.862 0.728 0.789 0.862 0.729 0.79

SVM 0.891 0.819 0.853 0.894 0.824 0.858

Random Forest 0.832 0.771 0.8 0.866 0.799 0.831

Decision Tree 0.866 0.861 0.863 0.872 0.864 0.868

Logistic Regression 0.878 0.759 0.814 0.846 0.786 0.815

AdaBoost 0.829 0.724 0.773 0.84 0.723 0.777

Evolutionary algorithms allowed our initial ML models to be improved over their initial pa-

rameters. Without the use of a list of offensive words, EA improved the performance of the six

algorithms by varying degrees ranging from 1% to 8.9%. When a list of offensive words was

used, EA improved the performance of the six algorithms by varying degrees ranging from 0.1%

to 3.1%

4.6 Discussion

This experiment evaluated the performance of six well-known ML algorithms for detecting

offensive messages on the Twitter dataset. We analyzed the performance of the ML models with

and without an offensive word list, comparing their results. We implemented evolutionary al-

gorithms to assist with parameter tuning to improve algorithms’ performance. Observations on

model performance using EA showed an increasing overall accuracy. The combination of a list of

offensive words and evolutionary algorithms resulted in the best accuracy for all six algorithms.

This experiment is a proof of concept that ML can be used to help develop an automatic tool to

aid in the detection of cyberbullying messages on social media platforms. The next step in our

research process is to explore the effectiveness of Deep Learning algorithms for detecting cyber-

bullying.

20

5 DEEP LEARNING APPLICATIONS ON TEXT CLASSIFICATION

The machine learning experiment provided helpful insight on how machine learning can be

utilized in the detection of cyberbullying. In order to further research various methods of identi-

fying cyberbullying messages, we proposed to experiment with deep learning algorithms that can

identify cases of cyberbullying. In addition, our goal was to optimize training time required for

the deep learning model implementations, including architecture and hyperparameter modifica-

tions.

In this chapter, we analyze the capabilities of Deep Learning algorithms and their effect on

classifying abusive messages received on Twitter. We create two models, a Recurrent Neural Net-

work (RNN) model and a Hierarchical Attention Network (HAN) model. We compare their per-

formance in terms of varied hyperparameters, as well as performance between the models them-

selves. Since the primary focus of this experiment is the performance of its accuracy and runtime,

we use the same dataset mentioned in section 2.4. We explore the architecture of our algorithms,

experiment parameters and results.

5.1 Background

The emergence of Deep Learning and its applications have rapidly expanded over the last

several years. Deep Learning is a machine learning technique in which the goal is to teach a com-

puter to conduct a task that corresponds to a task that humans perform naturally, learning by ex-

ample. Deep learning is the core technique that allow a lot of modern technology to exist such as

automated driving cars and voice commands on smart devices.

Deep learning models attempt to learn and perform tasks such as classification using informa-

tion taken directly from images, sound or text. One of the only drawbacks of deep learning mod-

els is for training purposes, to create a robust model, a large amount of training data is required.

Not only will it require a sizeable amount of data but also a computing device that has enough

21

CPU and/or GPU power to train and run deep learning models.

The goal of the experiment is to explore the applications of deep learning on classifying tex-

tual data for cyberbullying. By utilizing the concept behind deep learning, the goal of the exper-

iment is to yield a second set of models that can be used to classify cyberbullying text. Further-

more, adding in another layer of classifiers to assist in a system to identify users who are engag-

ing in acts of cyberbullying or victims of cyberbullying.

5.2 Deep Learning Methodology

Recurrent neural networks fall under the classification of an artificial neural network (ANN).

Instead of the typical nodal connection set up between layers of an ANN, a recurrent neural net-

work form a directed graph along a temporal sequence. This representation allows a temporal

dynamic behavior. A primary drawback of a typical feed-forward ANN is the lack of coordina-

tion between sequences of information. Recurrent neural networks address this problem by us-

ing their internal state to handle sequential data inputs. Long Short-Term Memory (LSTM) is an

RNN architecture that is a powerful model for dealing with sequential data information. By using

the LSTM encoder, we encode all information of the text in the last output of the recurrent neural

network before running a feed-forward network for classification. Keras provides a powerful and

robust library for the implementation of Deep Learning models, as such, an RNN using an LSTM

encoder can be implemented with relative ease. Figure 5.1 shows the basic architecture repre-

sentation for an RNN implementation. RNN’s are a network that is built of nodes that organize

into successive layers. Each of these nodes is connected with a directed connection to every other

node in the successive layer. Each connection has a weight w, output node, and optionally hidden

nodes.

Hierarchical attention networks are an expansion of recurrent neural networks. HAN uses

the concept of breaking down documents into their basic hierarchical structure. Documents are

represented so that words form sentences and sentences form a document. Following this pro-

cess, a HAN aims to build a sentence representation, aggregating the results to represent an en-

22

Figure 5.1. Recurrent neural network overview

tire document. HAN architectural representation utilizes two components, a bidirectional RNN,

and an attention network. The bidirectional network learns the meaning behind a sequence of

words, returning a word vector corresponding to each word. The attention network then obtains

the weights, then aggregates the representation of the words to form our sentence vector. This

is repeated for each sentence in our document. Since words provide different information de-

pending on the relative context, the model focuses on two levels, word level, and sentence level.

In [15], their implementation of the hierarchical attention model outperforms their previous work

by a significant margin. This was accomplished by using contextual information in conjunction

with word and sentence level. Figure 5.2 shows the architecture representation for the HAN im-

plementation. Noting that HAN includes the stacking of RNN to build the HAN model.

23

Figure 5.2. Hierarchical attention network overview

5.3 Data Preprocessing

The first stage in our preprocessing pipeline is to remove any non-associated information out-

side of the raw text. This includes filtering and removing all image and video links, mentions

towards other twitter users, and any emoticons present in the raw text. Utilizing mentions of

other twitter users will be introduced in the graph analysis chapter. The second stage is to per-

form Natural Language Processing (NLP) preprocessing pipeline to prepare the data for input

into a Deep Learning model. This includes tokenizing our data and the corresponding word em-

bedding matrix, which will be used as our embedding layer. Utilizing Keras preprocessing tok-

24

enizer, we fit our raw data into the tokenizer, maintaining at most 20,000 words to keep, based

on frequency. Next, using our tokenized information, we generate our corresponding embedding

matrix for each tokenized word element. Finally, our embedding layer used in the recurrent neu-

ral network and hierarchical attention network is generated from this step using Keras to create a

custom layer in our network. Figure 5.3 shows a brief representation of our process.

Figure 5.3. Deep learning processing diagram

5.4 Algorithm Setup

As mentioned during the data preprocessing stage, Keras is the primary library we use for the

experiment. Keras is an open-source library that is designed to implement deep learning network

implementations while being optimized to run fast and efficiently. Keras contains built-in meth-

ods for constructing our required networks. For our recurrent neural network implementation,

we handle the input layer, embedding layer, bidirectional LSTM, and our dense layer for output.

To implement our hierarchical attention network in Keras, we handle two stacked RNN models,

where the output of the first model is the input into the next. The only difference is the first RNN

model does not include our dense layer but instead has an attention layer. Our RNN model is con-

structed in reference to Figure 5.1, in [16], and the HAN model referenced by Figure 5.2.

By default, Keras has recommended default hyperparameters for calculating network metrics

including dense layer activation function, LSTM activation function, backpropagation activation

function, and loss. In our analysis, we vary the activation methods, loss, and metric for model

performance. Our experiment analyzes the performance of the generated models with varying

parameters. The performance is measured in terms of the model’s accuracy, also including the

time the model required to train and classify. Shown in Table 5.1 are the default hyperparameters

25

and the options for the parameters that were tested.

Table 5.1. Deep Learning Algorithm Hyperparameters

Parameter Default Tested

Model - Optimizer RMSprop ADAM, Adagrad, SGD

Model - Loss Cross Entropy Binary Cross Entropy, Hinge

Backpropagation TanH Sigmoid, ReLU

Dense - Activation Linear Softmax, ReLU, Sigmoid

5.5 Algorithm Performance

In this section, we report the findings of our RNN and HAN model’s performance in terms

of classification accuracy and time required to train. To ensure performance can be reliably com-

pared, all generated models with corresponding hyperparameters are trained and tested on the

same computer. We utilize tenfold cross-validation on our labeled data. Initially, we withhold

10% of the dataset to be used for testing. Next, we split the remaining dataset into 10 equal-sized

sets. 8 of these sets is used for training the DL models, while 2 sets are retained for validation,

ensuring over-fitting does not occur.

Our recurrent neural network findings are promising in terms of both classification accu-

racy and run-time. By modifying our optimizer from RMSprop into stochastic gradient descent

(SGD), our model achieved a higher accuracy threshold out of all the tested RNN models. It

should be noted that our RNN models have a single parameter difference between each other.

Our findings also show that the performance of the models is similar in terms of accuracy and

run-time. Shown in Table 5.2 is the best resulting models with their corresponding parameter that

has been modified from the default.

26

Table 5.2. Recurrent Neural Network Top Results

Model Time-Epoch Default Changed Accuracy

RNN-Optimizer 15 RMSprop SGD 81.63%

RNN-Optimizer 15 RMSprop ADAM 80.10%

RNN-Optimizer 15 RMSprop Adagrad 79.10%

RNN-Dense 15 Linear ReLU 75.81%

RNN-BackProp 15 TanH ReLU 74.31%

For our hierarchical attention network results, while they did yield decent classification ac-

curacy, its performance was not as strong as the RNN models. In comparison to the RNN model,

the accuracy was relatively lower when comparing the top resulting models. However, among the

resulting HAN models, the performance when comparing the hyperparameters had similar accu-

racy results. The model that achieved the highest result was achieved by modifying our backprop-

agation activation function from TanH into ReLU; this model achieved a higher accuracy among

all the tested HAN models. Table 5.3 reflects the performance of the best resulting HAN models.

Table 5.3. Hierarchical Attention Network Top Results

Model Time-Epoch Default Changed Accuracy

HAN-BackProp 15 TanH ReLU 78.88%

HAN-Loss 15 CrEntropy – 75.06%

HAN-Loss 15 CrEntropy BinaryCr 74.44%

HAN-Optimizer 15 RMSprop – 73.37%

HAN-Optimizer 15 RMSprop SGD 72.87%

Upon the completion of varied model implementations, we achieved desirable results in terms

of our classification accuracy. The recurrent neural network models on average had a similar but

slightly higher accuracy compared to the hierarchical attention network models. These results can

potentially be attributed to the overall size of the dataset and sample sizes, as samples within our

data contain single sentences or at most 280 characters.

27

A notable difference between the model implementations would be the run time required for

the training process. During training, the RNN models were significantly faster. This is attributed

to the HAN architecture utilizing two stacked RNN models, as shown back in Figure 5.2. Table

5.4 demonstrates the average run time between the models for an individual epoch and the aver-

age full training time.

Table 5.4. Deep Learning Algorithms Average Run-Time

Model Time - E Train Time Train Size Test Size

HAN 71s 1065s 15210 1690

RNN 32s 480s 15210 1690

5.6 Discussion

In this experiment, we acknowledge and describe the ongoing cyberbullying issues. We ana-

lyze Twitter data that contains offensive and non-offensive tweets to other users. To analyze our

data, we implement and analyze the performance of a recurrent neural network and hierarchical

attention network. Our results show promising results in terms of classification accuracy and the

effects of deep learning applications on classifying social media data.

This experiment provided beneficial results in regards to how deep learning algorithms can be

utilized on detecting cyberbullying. Overall the deep learning algorithms had similar levels of ac-

curacy when compared with the machine learning algorithms analyzed in chapter 3. Specifically,

when looking at our classification results without using an offensive word list in Table 3.1, we

notice similar performance results.

The final step in our research process is to utilize the optimized machine learning models

and the deep learning models to classify tweets and perform graph analysis on their results. By

looking into the connections between social media users and analyzing their messages that have

been classified, we can potentially identify primary users who engage in cyberbullying or identify

users who are victims of cyberbullying.

28

6 GRAPH ANALYSIS OF TWITTER DATA

In previous chapters we have implemented several experiments on classifying cyberbullying

messages. In order to build a system that can identify users who are victims or abusers, a combi-

nation method with artificial intelligence is required. To create such a system, we chose to imple-

ment graph analysis on the resulting data we obtained from our previous experiment models.

In this chapter, we will compile a base system that uses the textual data from [5], as well as

our classification results obtained through our three experiments. We will cover the implemen-

tation of the graph analysis, how users are identified as abusers or victims, and analyze the built

graphs from the system.

6.1 Background of Graph Theory

Graph analysis originates from a branch of mathematics known as graph theory. Graph theory

is the study of graphs, which are a type of data structure that is used to analyze relationships be-

tween objects. A graph is comprised of several components. First, a graph contains vertices, of-

ten referred to as nodes. Next, vertices are connected by edges, also referred to as links. Further-

more, the graph can be an undirected graph or a directed graph. An undirected graph is defined

such that edges between vertices do not denote a direction, meaning edges connect two vertices

symmetrically. Directed graphs are defined such that edges between vertices denote a direction,

meaning that edges connect two vertices asymmetrically. Figure 6.1 shows the basic structure of

an undirected graph and the directed graph.

In the domain of computer science, graphs have a multitude of applications, including rep-

resenting communication networks, data representations, and data computation. Furthermore,

graphs can be used to analyze how social media can be mapped for analysis, as in Grandjean’s

work [17]. Grandjean’s study analyzes the connectivity of the top 100 followed accounts of Twit-

ter. He shows how several graph analysis metrics were used, such as PageRank, In-degree, Out-

29

Figure 6.1. Directed and undirected graphs

degree, Betweenness, and computed Eigenvector. This study furthermore assisted in developing a

systematic approach for grouping users, as well as discovering social media network structures.

The goal of this chapter is to apply graph analysis techniques on the Twitter dataset, utiliz-

ing both the textual information, the users involved in the messages, and the corresponding label

determined by our Machine Learning models, Deep Learning models, and genetically enhanced

Machine Learning models.

6.2 Graph Analysis Implementation

To implement graph analysis across the Twitter dataset, we decided to implement our ap-

proach using Apache Spark. Apache Spark is an analytical engine that was developed to perform

fast analysis on datasets of large sizes. Furthermore, it allows an implementation to be done using

multiple programming languages, including scala and python. For the experiment implementa-

tion, we decided to utilize scala for our programming language, as it provides a robust analytical

library for creating graphs from data, as well as analytical functions. To conduct the graph anal-

ysis portion, scala offers two data structures that can be used, Graph Frames and GraphX. We

chose to use GraphX due to it being a relatively newer component in Spark, allowing for more

updated methods and diverse data query capabilities.

Overall, the goal is to analyze the Twitter data to identify key users who are participating in

30

Figure 6.2. PageRank result example

cyberbullying or victims of such acts. To accomplish this, we will implement several graph algo-

rithms to attempt to perform this task. First, we implement PageRank on our dataset. PageRank

measures the importance of each vertex in the graph, specifically in our data example, if the user

has a large following, it will obtain a high rank. This will ideally allow us to utilize the consensus

models to identify potential users who abuse their popularity and followers to target others with

abusive or hateful messages. Figure 6.2 shows the general concept behind PageRank. Networks

are expressed using their connections and assigned percentages. An example is shown in Figure

6.2, where Page C has a higher PageRank than Page E. Despite Page C having less connections

to it, Page B, an important node contains a link to Page C. This concept is useful for analyzing

social network structures, as well as social media users.

Next, we implement Connected Components, in which we label each connected component

of our graph with the ID of the lowest-numbered vertex. In Twitter, Connected Components

would represent a cluster of users. Last, we implement In-Degree and Out-Degree for our data.

In-Degree provides the number of incoming connections we have to the vertice. Out-Degree pro-

31

vides the number of outgoing connections we have to other vertices. For social media, this would

be commonly referred to as received messages and sent messages with other users.

To run our graph analysis using Apache Spark Scala, we utilized a cloud data analytics plat-

form Databricks. Databricks allows us to upload our data and associated analysis code for fast

cloud computing and analysis. Due to the nature of cloud computing, this allowed us to load the

entire dataset, analyze it, and generate our results for analysis without any hardware constraints

on local computers.

6.3 Data Preprocessing for Analysis

To utilize the graph analysis tools, the dataset we are currently using must be processed. Cur-

rently, our data holds a user, tweet message, and associated label. To perform graph analysis and

establish In-Degree and Out-Degree, we need to process the tweet message. First, if a tweet mes-

sage does not contain a mention ‘@’ to another user, we simply put a default value of -1 in a new

data column that tracks the recipient of the message. If a tweet message contains a mention to an-

other user, we utilize Twitter’s API to obtain the user ID for the mentioned user, then assigning

the ID value to the column tracking the recipient of the message.

The next step to prepare the data for graph analysis requires the concatenation of our labeling

results from prior models. Using the concept behind ensemble voting for models, we extract a

tweet’s label obtained from the prior three conducted experiments. We utilize the predicted label

from the ensemble in order to analyze the effectiveness of the Machine Learning, Deep Learning,

and Graph Analysis pipeline. Automatic detection for cyberbullying will not have an associated

label in real-time; however, we can reference the actual labels when analyzing the underlying

graphs generated. Next, by utilizing the best performing models from each prior experiment, the

most frequently determined label among the 13 total models will be used as the tweet label. Now

our data has been transformed from the original format into a format containing an author (ver-

tice), the recipient (connected vertice), and the label (edge value). This information will allow us

to utilize our graph algorithms for PageRank, In-Degree, Out-Degree, and Connected Compo-

32

nents.

6.4 Graph Analysis on Waseem’s Dataset

To conduct the graph analysis experiment, we utilize the community free version of Databricks.

Due to discovered restrictions on Waseem’s dataset, we will further conduct another analysis

on a different labeled twitter dataset. Waseem’s dataset provided useful examples and labels

when the goal of the experiment was training a classifier. In order to fully analyze how graph-

ing the results benefits the discovery process of potential cyberbullying incidents, a more diverse

dataset is required. Waseem’s dataset does not contain authors who consistently send or receive

more than a single message. In order to construct more advanced graphs, we looked into a sec-

ondary dataset [18]. This issue was noticed primarily after performing the data preprocessing

on Waseem’s dataset. We notice that despite having a large number of tweets, the dataset was

divided in a way that there was only one tweet per user. In other words, utilizing our proposed

system to determine if a user is continuously harassing another will not work. Therefore this sec-

tion will focus on testing our system, ensuring the performance of all graph algorithms, and dis-

cussing the initial analysis of Waseem’s dataset.

By utilizing Spark, we create a GraphX data structure from loading in the processed data.

After the Graph has been created, we utilize built-in methods for setting up the graph analysis

metrics and algorithms: In-Degree, Out-Degree, Connected Components, and PageRank. Table

6.1 shows the results of 4 randomly selected vertices in our graph.

Initially, we can see that for some example messages that they did not receive any messages,

this is due to the selected dataset. However, we were able to extract the person mentioned in their

tweets as seen among the first 3 entries in Table 6.1. When a user ends up retweeting a tweet

posted by another user, we denote the recipient to be -1 by default, flagging it to be a message

directed toward the user and thus increment their In-Degree.

To construct a graphical result from our data, we will have to utilize GraphX to export our

graph data so that we can use a visualization tool. First, we will export the GraphX data struc-

33

Table 6.1. Waseem’s Dataset Data Sample

AuthorID RecipientID In-Degree Out-Degree PageRank ConsensusLabel

315675025 110486147 0 1 1 Offensive

43830965 24825958 0 1 2 Offensive

52230962 470749892 0 1 3 Offensive

930620467 -1 1 1 4 Offensive

ture and save it as a .GEXF file type. Next, we will use Gephi, an open-source graph visualiza-

tion platform that works with our graph file type. After loading in the data, we can visualize the

results and attempt to infer some analysis based on the resulting graphs obtained from our multi-

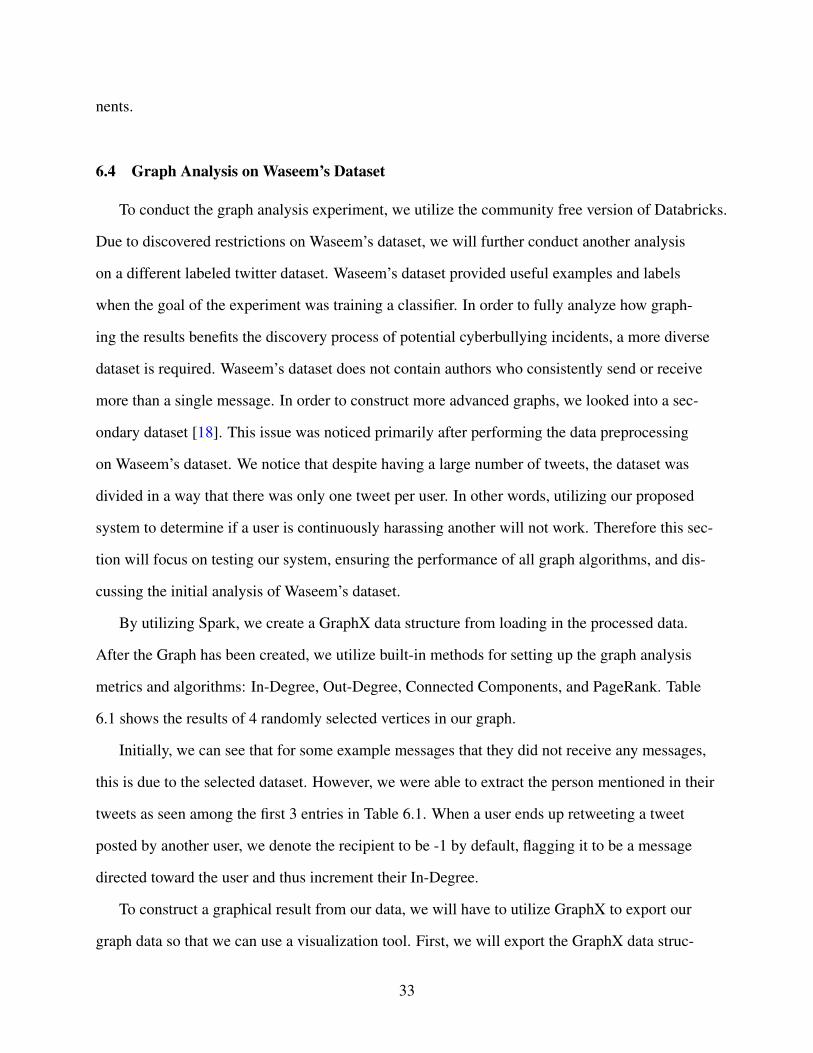
step process on classifying offensive messages. Figure 6.3 demonstrates a basic graph generated

from Table 6.1 and how the information is portrayed. We can see our structure allows us to gener-

ate graphs centered that contain users who sent offensively labeled messages.

As we can see in Figure 6.3, we can set up the vertices structure between users who engage in

sending and being mentioned in tweets. To further expand on this system and its overall effective-

ness to identify users who are engaging in acts of cyberbullying, we decided to analyze another

dataset from [18] that contained multiple tweets sent by the same user, as well as recipients who

received offensive messages from multiple sources. The goal of the final analyzed dataset is to

show an initial system that can be used to identify and eventually prevent cyber-offensive mes-

sages from reaching users who wish to have a safe digital space.

6.5 Graph Analysis on Forum Posts

To test our cyberbullying identification system, we selected a secondary dataset that contained

multiple posts from users, as well as recipients who received messages from multiple sources.

The dataset is from Imperium, which contains personal-level insults while engaging in commu-

nication on forum posts [18]. The datasets are listed in Appendix A. for reference. The posts in

the Imperium dataset contain sentence level comments that can be processed through the defined

preprocessing pipeline used in prior chapters, as well as the machine learning and graph analysis.

34

Figure 6.3. Waseem’s example data graph

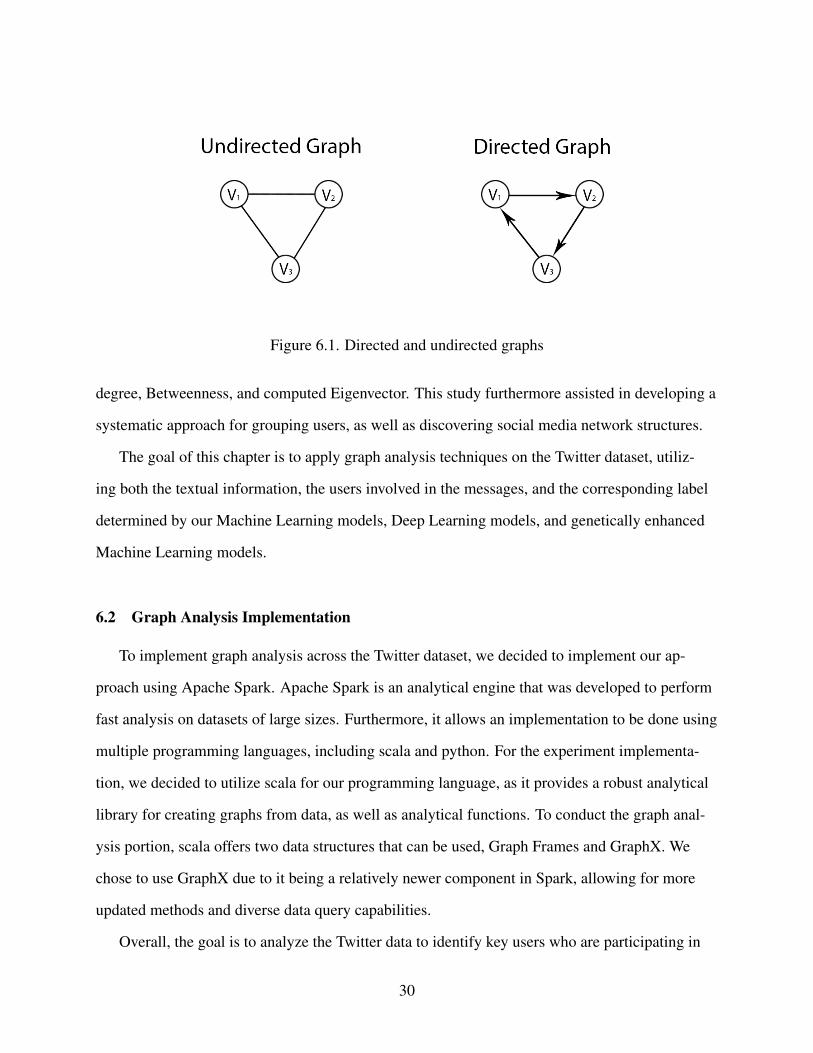
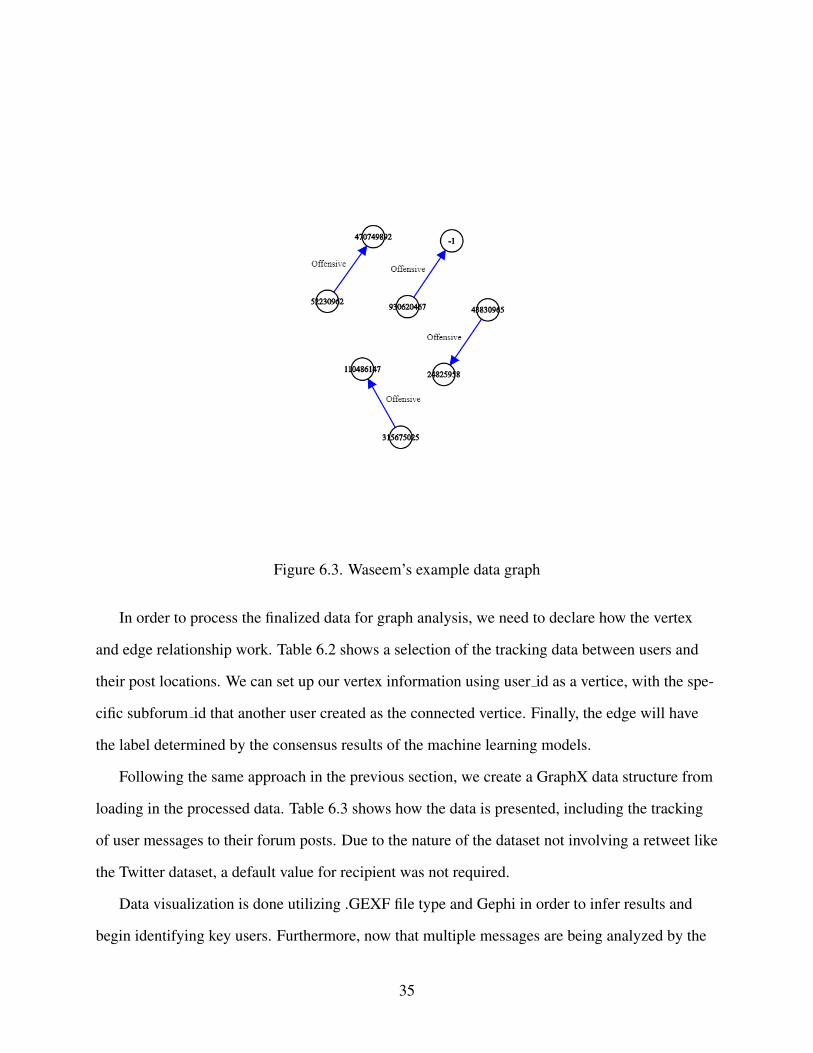
In order to process the finalized data for graph analysis, we need to declare how the vertex

and edge relationship work. Table 6.2 shows a selection of the tracking data between users and

their post locations. We can set up our vertex information using user id as a vertice, with the spe-

cific subforum id that another user created as the connected vertice. Finally, the edge will have

the label determined by the consensus results of the machine learning models.

Following the same approach in the previous section, we create a GraphX data structure from

loading in the processed data. Table 6.3 shows how the data is presented, including the tracking

of user messages to their forum posts. Due to the nature of the dataset not involving a retweet like

the Twitter dataset, a default value for recipient was not required.

Data visualization is done utilizing .GEXF file type and Gephi in order to infer results and

begin identifying key users. Furthermore, now that multiple messages are being analyzed by the

35

Table 6.2. Imperium Forum Data Sample

User ID Post ID Connected Components Consensus Label

581236 1345 2 Offensive

581236 1345 2 Offensive

579436 1345 0 Offensive

579436 1345 0 Offensive

579436 1345 0 Offensive

579436 1345 6 Non Offensive

581373 1347 0 Non Offensive

581373 1347 0 Offensive

572042 1347 0 Non Offensive

575709 1347 0 Non Offensive

same user, we can analyze the graph to check total sent messages (Out-Degree), total offensively

labeled messages, and total offensive messages sent to another user.

Due to computational and figure size restraints, we could not generate a graph illustrating

thousands of connections. To begin analyzing the data, we generate a basic graph to see how the

connections of users and forum posts look. Figure 6.4 shows a sample connection of 35 users,

with a total of 100 forum posts. We can see that depending on a forum topic, various amounts of

users engage in conversation.

Next, we want to see if certain users are sending overall more offensive messages to certain

users and their posts. To accomplish this, we need to generate a graph that establishes the edge

label as offensive or non-offensive. An edge connection will contain a label as offensive if at least

half of their sent messages to the user are labeled offensive by consensus of the machine learning

models. Similarly, if at least half the messages sent are labeled non-offensive, the edge connec-

tion will be labeled non-offensive. Using the same 35 users from Figure 6.4, we will generate a

new graph with establishing edge labels. Figure 6.5 shows the resulting graph with labels com-

pleted with 0 representing overall non-offensive and 1 representing overall offensive users.

36

Table 6.3. Imperium Forum Data Processed

User ID Post ID In-Degree Out-Degree Connected Components ConsensusLabel

581236 1345 1 2 2 Offensive

579436 1345 1 4 0 Offensive

581373 1347 1 1 0 Offensive

572042 1347 1 1 0 Non Offensive

575709 1347 1 2 0 Offensive

575675 1347 1 2 2 Non Offensive

Figure 6.4. Imperium forum user interactions

The final stage of the system is to identify primary users who engage in cyberbullying. We

want to analyze data to find certain users or posts that are repeatedly targeted by users engaging

in offensive, directed messages. To accomplish this feat, we want to analyze our data to generate

37

Figure 6.5. Imperium forum user interactions - labeled

graphs to not only discover individual users engaging in behavior, but groupings or communities

of users who repeatedly send offensive messages.

First, this is performed by analyzing users who share posts on the same user or forum, check-

ing the connected components and trying to isolate key individuals or groups who actively partic-

ipate in targeted, offensive messages. Next, we analyze the data on posts to check for subgraphs

of users who are labeled as offensive posters. If a subgraph of users are labeled as non-offensive

posters, no further checks are performed on the specific subgraph. If a subgraph of users are la-

beled as offensive posters, further analysis is required.

Should a subgraph be labeled as offensive, further analysis is done on other related forum

post topics to check if the subgraph appears in any other posts. If the subgraph appear or a subset

of vertices appear, we assess the consensus edge labels to determine if offensive behavior repli-

38

cated on another post. If the edges contain offensive user labels, we generate a graph that allows

us to identify which user or users is currently behaving with toxic online behavior. Figure 6.6

shows a resulting graph when finding isolated forum posts filled with repeated offensive mes-

sages from a group of users.

Figure 6.6. Imperium forum offensive behavior users

While Figure 6.7 demonstrates a grouping of individuals who have targeted multiple forum

posts with offensive posts, this suggests that have engaged in sending offensive messages to mul-

tiple users, as well as overlapping with other users. This provides us with a graph system that

can identify core users who are targeting individuals posts, and eventually prevent such scenar-

ios from occurring. The code implementation from the machine learning models to the compiled

graph models is available in Appendix B.

39

Figure 6.7. Grouping of imperium forum offensive behavior users

6.6 Discussion

Overall, this introductory graph system for identifying cyberbullying users and victims has

provided useful insights. We were able to process social media information that included users

involved in posts, recipients of posts, and apply machine learning models to classify textual data.

This allowed us to perform graph work, which aided in finding key users or groups of individuals

who on average, sent more offensive messages to other users. This is a potential application in

aiding average users or parents in keeping their digital social space secure from cyberbullying

threats.

To improve this proposed system, future work for improving overall machine learning method-

ology for classifying social media posts will be done. Further research into more specialized

graph analysis tools and algorithms can potentially aid in improving an overall system in discov-

40

ering subgraphs, identifying more key vertices, and discovering new social media patterns. All

with the intent to help prevent cases of cyberbullying while browsing social media.

41

7 CONCLUSION

In the conducted research, we applied a pipeline of methodologies for the identification of

cyberbullying incidents, as well as users involved. We initially explored the applicability of Ma-

chine Learning algorithms, furthermore extending the experiment with an exploration of Genetic

Programming enhancements, then we applied Deep Learning methods, and Graph Analysis.

First, we implemented five popular machine learning algorithms on Twitter data from [5]. We

implemented Support Vector Machine, Naıve Bayes, Random Forest, Decision Tree, and Logistic

Regression. Without the usage of an offensive word list, we discovered that Support Vector Ma-

chine recorded better results overall when compared to the other algorithms. We replicated the

experiment with the addition of an offensive word list [12]. Decision Tree saw the greatest im-

provement with an increase by 0.693 to 0.863. Support Vector Machine is the recommended ap-

proach for classifying the Tweets, due to the overall performance and stability during both exper-

iment scenarios of no provided offensive words, as well as weighting offensive words. Overall,

the initial machine learning experiment provided beneficial results in regards to the applications

of the algorithms on the targeted problem domain of cyberbullying detection.

Following the initial machine learning experiment, we researched the effectiveness of Genetic

Programming on the optimization of algorithm parameters. We define and implement popula-

tion, parent selection, fitness function, crossover, mutation, and survivor selection. We replicated

the prior experiment, fully analyzing the results of machine learning algorithms that have been

optimized using Genetic Programming. This includes the usage and withholding of an offensive

word list. Also, we included the AdaBoost algorithm in the original ensemble of models. We note

an overall increase in model performance among the six algorithms. Without utilizing the offen-

sive word list, we note algorithm improvements ranging from 1% to 8.9%. With the usage of the

offensive word list, we saw varying degrees of improvements from 0.1% to 3.1%. This experi-

ment yielded further improvement on the algorithms, further improving the ensemble of models.

42

The current stage of the experiments still reveal that Support Vector machine is the recommended

algorithm choice for classifying offensive tweets.

The next step in the research process analyzed the effectiveness of Deep Learning on clas-

sifying cyberbullying textual data. We implement Recurrent Neural Networks and Hierarchical

Attention Network using Keras library. Also, we analyze the performance of models using differ-

ent activation functions and loss metrics. We note that both algorithms achieved similar levels of

performance as the prior initial machine learning work when applied to the Twitter dataset. Re-

current Neural Network achieved results of 81.63% accuracy and Hierarchical Attention Network

achieved 78.88%. This experiment aided in concluding our ensemble of models for classifying

offensive social media messages and wrapping up final preparations for graph analysis.

Lastly, we implement and conclude our cyberbullying system using Graph Analysis. We im-

plement the ensemble of models previously discussed to classify social media messages and per-

form graph analysis to attempt an identification of key users or groups engaging in spreading hate

messages. We introduce a more diverse dataset that includes users who have sent multiple offen-

sive or non-offensive messages [18]. We analyze the incoming messages, outgoing messages,

connected users, and model labels to establish graphs for identifying users who prominently

engage in sending offensive messages or recipients who are receiving offensive messages. The

graph work laid the groundwork of a compiled system that can be utilized for combating the dire

issue of cyberbullying.

For future work, we can further improve and expand our algorithm selection for Machine

Learning and Deep Learning. This includes diverse algorithms, newer Deep Learning applica-

tions such as transfer learning, and exploring further optimization methods. We can also further

improve our graph analysis tools to analyze and generate subgraphs that represent user communi-

ties, then further analyzing the members, since social media revolves around friend circles, com-

munity groups, and other social gatherings.

43

REFERENCES

[1] J. Clement, “Global social media ranking 2019,” ”https://www.statista.com/statistics/272014/global-social-networks-ranked-by-number-of-users/”, Feb 2019.

[2] J. W. Patchin, Reney, J. W. Patchin, and J. W. Patchin, “2019 cyberbullying data,” ”https://cyberbullying.org/2019-cyberbullying-data.”, Feb 2020.

[3] L. Korte, “Youth suicide rates are rising. school and the internet may be toblame.” ”https://www.usatoday.com/story/news/nation-now/2017/05/30/youth-suicide-rates-rising-school-and-Internet-may-blame/356539001/”, October 2019.

[4] K. Rosenblatt, “Cyberbullying tragedy: New jersey family to sue after 12-year-old daughter’s suicide,” ”https://www.nbcnews.com/news/us-news/new-jersey-family-sue-school-district-after-12-year-old-n788506/”, Feb 2020.

[5] Z. Waseem and D. Hovy, “”Hateful symbols or hateful people? Predictive features for hatespeech detection on twitter”,” in Proc. NAACL Student Research Workshop, Jun. 2016, pp.88–93.

[6] S. Parime and V. Suri, “Cyberbullying detection and prevention: data mining and psycho-logical perspective,” in 2014 International Conference on Circuits, Power and ComputingTechnologies, 2014, pp. 1541–1547.

[7] C. L. Nixon, “Current perspectives: the impact of cyberbullying on adolescent health,” Ado-lescent health, medicine and therapeutics, vol. 5, p. 143, 2014.

[8] S. C. Eshan and M. S. Hasan, “An application of machine learning to detect abusive bengalitext,” in Proc. 2017 20th International Conference of Computer and Information Technol-ogy, 2017, pp. 1–6.

[9] M. Andriansyah, A. Akbar, A. Ahwan, N. A. Gilani, A. R. Nugraha, R. N. Sari, and R. Sen-jaya, “Cyberbullying comment classification on indonesian selebgram using support vectormachine method,” in Proc. 2017 Second International Conference on Informatics and Com-puting, 2017, pp. 1–5.

[10] P. Ruangkanokmas, T. Achalakul, and K. Akkarajitsakul, “Deep belief networks with fea-ture selection for sentiment classification,” in Proc. 2016 7th International Conference onIntelligent Systems, Modelling and Simulation, 2016, pp. 9–14.

[11] T. G. Dietterich, “Ensemble learning,” The handbook of brain theory and neural networks,vol. 2, pp. 110–125, 2002.

[12] “Google code archive - long-term storage for google code project hosting.” ”https://code.google.com/archive/p/badwordslist/”, Jan 2019.

44

[13] R. Poli, W. B. Langdon, N. F. McPhee, and J. R. Koza, A field guide to genetic program-ming. UK: Lulu.com, 2008.

[14] A. E. Eiben and J. E. Smith, Introduction to evolutionary computing. Heidelberg, Germany:Springer, 2003.

[15] Z. Yang, D. Yang, C. Dyer, X. He, A. Smola, and E. Hovy, “Hierarchical attention networksfor document classification,” in Proc. of the 2016 conference of the North American chapterof the association for computational linguistics: human language technologies, 2016, pp.1480–1489.

[16] T. Mikolov, M. Karafiat, L. Burget, J. Cernocky, and S. Khudanpur, “Recurrent neural net-work based language model,” in Eleventh annual conference of the international speechcommunication association, 2010, pp. 2877–2880.

[17] M. Grandjean, “A social network analysis of twitter: Mapping the digital humanities com-munity,” Cogent Arts & Humanities, vol. 3, no. 1, 2016.

[18] “Detecting insults in social commentary,” https://www.kaggle.com/c/detecting-insults-in-social-commentary/overview/, Mar 2020.

45

APPENDICES

Appendix A. Datasets

1. Waseem’s Twitter Dataset

https://github.com/zeerakw/hatespeech

2. Kaggle Forum Post Dataset

https://www.kaggle.com/c/detecting-insults-in-social-commentary/overview

46

Appendix B. Codes

1. Experiment Implementations

https://drive.google.com/open?id=1D1Syyd2AdOLnBbbeL2reBPdRcH2RYgiI

47

Generated using Graduate Thesis LATEX Template, Version 1.3. Department of Computer

Science, Missouri State University, Springfield, Missouri, USA.

This thesis was generated on Monday 20th July, 2020 at 3:19pm.

48


Recommended