Applications of digital image processing techniques to problems of data registration and correlation by WILLIAM B. GREEN California Institute of Technology Pasadena, California INTRODUCTION JPL's Image Processing Laboratory (IPL) has been pro- cessing imagery using digital computers for approximately ten years. During that period, the computer capability at the IPL has developed from a single job batch oriented system with no volatile image displays to a multi-task environment accommodating both batch processing and several interac- tive tasks simultaneously, supporting a variety of general purpose and special purpose interactive image display sys- tems. The sophistication of the various applications has also developed from simple subjective enhancement of planetary imagery to complex applications requiring correlation of re- motely sensed imagery with auxiliary data and with non- imaging data bases. This paper describes the evolution of the IPL facility, and illustrates the increasing complexity of the image processing tasks with examples of various appli- cations from the planetary program and the earth resources activities that have utilized the IPL facility. HISTORICAL BACKGROUND Ten years ago at JPL, digital image processing of lunar images from Ranger and Surveyor was performed using a central general purpose computer in a batch environment. An analyst submitted his job and often had to wait several days to view the result, since the job had to be run in competition with other tasks using the same computer and the output image had to be recorded on film, processed and printed before he could see the results of processing. In 1968, IPL acquired an IBM 360/44 computer system that was dedicated to image processing applications. This computer, and the 44 PS operating system, were capable of supporting a single user at any given time; the analyst again had to wait to view the result of his processing until film recording, film processing and printing had occurred. At that time, there were no commercially available image dis- play systems that could be easily interfaced to a digital computer so the IPL developed a core-refreshed display (CRD) system. The CRD used the 360/44 core memory as its refresh memory, and the display was capable of display- ing a 256 picture element square image with 4 bits of inten- 141 sity quantization. The core memory of the 360/44 was read every 1/30 of a second to refresh the video display at video rates. The CRD made it possible imagery as soon as it had been processed, although the display was limited to 256 square resolution and 4 bits of intensity information. It had the obvious disadvantage of precluding any processing while image display was occurring, since the 360/44 memory was totally committed to image display refresh buffering whenever an image was being viewed on the CRD. Never- theless, it represented the first interactive image processing capability at the IPL, and substantially shortened the turn- around time for subjective enhancement processing. The 360/44 operating system and hardware display support improved between 1968 and 1975. A new image display system employing lithicon storage tube refreshed display systems was implemented to support the Mariner 9 Mars orbital mission in 1972. By 1974, it was possible to run two or three jobs on the system in a timesharing mode, using foreground and background partitions. However, processing became severely limited by the constraints of the 360/44 system as the size of the imagery returned by the planetary missions increased, as the number of images returned from each mission increased dramatically, and as large multi- spectral images became available from the LANDSAT sat- ellites. In 1975, a decision was made to upgrade the entire IPL computer configuration and associated display systems to meet the following objectives: (a) increase batch process- ing capacity by at least a factor of three, (b) enable simul- taneous interactive image processing to occur at the same time that batch processing was occurring, (c) enable at least two interactive image processing users to be active at any given time. The next section describes the current IPL computer and display configuration, and the remaining sections discuss a variety of applications for which the system has been used. CURRENT IPL CONFIGURATION The current central computer in the IPL is an IBM 360/65 with a megabyte of memory, eight tape drives, and 900 mbytes of on-line disk storage; 800 of the 900 mbytes of on- line storage consists of Memorex 3670 high speed disk drives. From the collection of the Computer History Museum (www.computerhistory.org)
Transcript
Applications of digital image processing techniques to problems of data registration and correlation
by WILLIAM B. GREEN California Institute of Technology Pasadena, California
INTRODUCTION
JPL's Image Processing Laboratory (IPL) has been processing imagery using digital computers for approximately ten years. During that period, the computer capability at the IPL has developed from a single job batch oriented system with no volatile image displays to a multi-task environment accommodating both batch processing and several interactive tasks simultaneously, supporting a variety of general purpose and special purpose interactive image display systems. The sophistication of the various applications has also developed from simple subjective enhancement of planetary imagery to complex applications requiring correlation of remotely sensed imagery with auxiliary data and with nonimaging data bases. This paper describes the evolution of the IPL facility, and illustrates the increasing complexity of the image processing tasks with examples of various applications from the planetary program and the earth resources activities that have utilized the IPL facility.
HISTORICAL BACKGROUND
Ten years ago at JPL, digital image processing of lunar images from Ranger and Surveyor was performed using a central general purpose computer in a batch environment. An analyst submitted his job and often had to wait several days to view the result, since the job had to be run in competition with other tasks using the same computer and the output image had to be recorded on film, processed and printed before he could see the results of processing.
In 1968, IPL acquired an IBM 360/44 computer system that was dedicated to image processing applications. This computer, and the 44 PS operating system, were capable of supporting a single user at any given time; the analyst again had to wait to view the result of his processing until film recording, film processing and printing had occurred. At that time, there were no commercially available image display systems that could be easily interfaced to a digital computer so the IPL developed a core-refreshed display (CRD) system. The CRD used the 360/44 core memory as its refresh memory, and the display was capable of displaying a 256 picture element square image with 4 bits of inten-
141
sity quantization. The core memory of the 360/44 was read every 1/30 of a second to refresh the video display at video rates. The CRD made it possible to~isplay imagery as soon as it had been processed, although the display was limited to 256 square resolution and 4 bits of intensity information. It had the obvious disadvantage of precluding any processing while image display was occurring, since the 360/44 memory was totally committed to image display refresh buffering whenever an image was being viewed on the CRD. Nevertheless, it represented the first interactive image processing capability at the IPL, and substantially shortened the turnaround time for subjective enhancement processing.
The 360/44 operating system and hardware display support improved between 1968 and 1975. A new image display system employing lithicon storage tube refreshed display systems was implemented to support the Mariner 9 Mars orbital mission in 1972. By 1974, it was possible to run two or three jobs on the system in a timesharing mode, using foreground and background partitions. However, processing became severely limited by the constraints of the 360/44 system as the size of the imagery returned by the planetary missions increased, as the number of images returned from each mission increased dramatically, and as large multispectral images became available from the LANDSAT satellites. In 1975, a decision was made to upgrade the entire IPL computer configuration and associated display systems to meet the following objectives: (a) increase batch processing capacity by at least a factor of three, (b) enable simultaneous interactive image processing to occur at the same time that batch processing was occurring, (c) enable at least two interactive image processing users to be active at any given time.
The next section describes the current IPL computer and display configuration, and the remaining sections discuss a variety of applications for which the system has been used.
CURRENT IPL CONFIGURATION
The current central computer in the IPL is an IBM 360/65 with a megabyte of memory, eight tape drives, and 900 mbytes of on-line disk storage; 800 of the 900 mbytes of online storage consists of Memorex 3670 high speed disk drives.
From the collection of the Computer History Museum (www.computerhistory.org)
142 National Computer Conference, 1978
The 360/65 operating system is OS/MVT, and TSO is used to support timesharing operations. The Informatics MARK IV data base management system is also available, and is used to catalog processed . imagery produced by the IPL each day. In addition, MARK IV is used to maintain catalogs of auxiliary data relating to each image processed by the jPL. For example, an image of Mars recorded by the Viking Lander will have a variety of parameters associated with it, such as local Mars time at which the exposure was made, camera gain and offset settings, solar illumination angle at the time of exposure, etc. MARK IV is used to construct, update and search these catalogs.
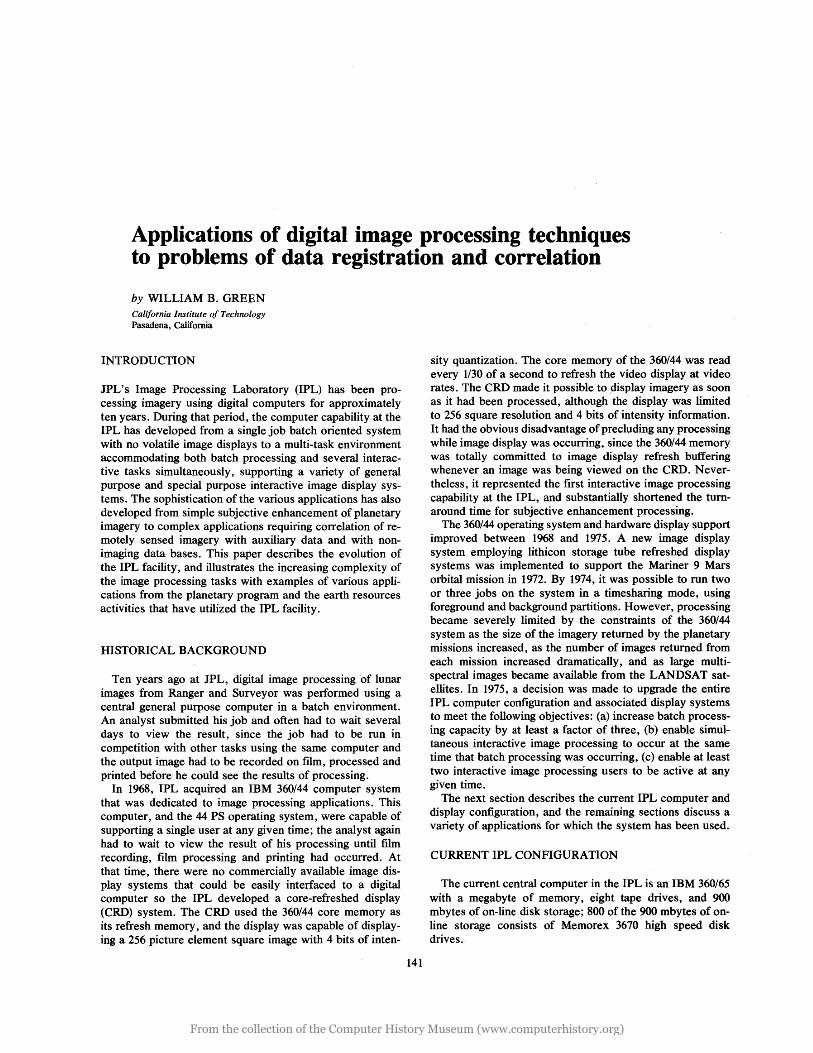
The interactive processing is supported by a variety of terminals and display systems. A Digital Equipment Corporation PDP 11140 computer is interfaced to a channel on the 360 via a DX-IIB channel interface. The PDP 11/40 supports several dial-up and hard-wired interactive terminals, and three image display systems. The interactive terminals include both IMLAC graphics/CRT terminals and TI Silent 700 terminals. The current IPL configuration is shown in Figure 1.
The image display systems are all commercially available
• CARD READER • CARD PUNCH • LINE PRINTER
MEMOREX 3670 DISK STORAGE
IBM 360/65 CPU 1 MEGABYTE STORAGE
I
IBM 2314 DISK STORAGE 4 SPINDLES
(8 SPINDLES)
equipment. They include a RAMTEK display system that accommodates 6 bit black and white imagery up to 640x512 elements. The RAMTEK also has two one-bit graphics overlay planes and two trackball/cursor units. Each of the RAMTEK output signals (video only, video plus either graphics plane, or either of the graphics planes) are available as video signals that may be separately accessed and displayed. Thus more than one user can use the RAMTEK system at a given time. For example, one user can access the black and white video image with one graphics plane overlaid, while a second user can access just the second graphics plane. All video signals are routed into a video network that includes several black and white monitors distributed in two user area locations at IPL, and" a user selects the video signal he wishes to utilize and displays that signal on a monitor near his terminal. One view of one of the interactive user stations is shown in Figure 2, and a user interacting with an image display is shown in Figure 3.
The other image display systems consist of two COMTAL display systems. A CO MT AL 8003 system provides 512x512 resolution for six bit images, and includes graphics overlay planes and trackball/cursor unit. The COMTAL
From the collection of the Computer History Museum (www.computerhistory.org)
Figure 2,.,..-User area station at JPL's Image Processing Laboratory. The user seated at the IMLAC terminal can select video signals to be routed to the display monitors using the video switching box on the right side. Audio
communication with the computer operator is also provided. (JPL Photo Lab Negative No. 324-2009Ac)
8003 provides either a single color image at 512x512 resolution or three black and white images at the same resolution. Again, each output video signal is separately accessible, and can be routed to any monitor in the user areas.
A COMTAL 1024 system provides capability for display of black and white imagery at 1024x 1024 resolution. Because of the high bandwidth, the video output of this device is routed to a single specially modified monitor. The 1024 system also includes graphics overlay and trackball/cursor unit.
A complete description of the IPL computer configuration and the interactive capabilities supported by the PDP 11/40 computer is contained in Reference 1.
Figure 3-Interactive extraction of lakes from LANDSAT imagery achieved through utilization of the COMTAL display and associated
trackbalJJcursor unit. (JPL Photo Lab Negative No. 324-2287Ac)
Applications of Digital Image Processing Techniques 143
GEOMETRIC TRANSFORMATION
IPL has been performing digital geometric transformation of imagery for approximately ten years. The earliest applications included removal of camera system induced geometric distortion2
-4 and projection of planetary imagery to
standard cartographic projection. 5 More recently, geometric transformation has become an important tool in registration of imagery and non-imaging data represented as imagery to standard georeferenced coordinate systems, and in registration of multiple images of the same surface area recorded at different times.
Geometric transformation of digital imagery begins by locating a set of tiepoints within the original image and defining the locations of those tiepoints in the output image. The transformation of the tiepoints may be determined by a mathematical algorithm or by analysis of the imagery itself. For example, image ,transformation to standard mapping projections can be defined by establishing a uniform grid of tiepoints in the output image aligned with a longitude/latitude coordinate system, and then mathematically computing the locations of those tiepoints in the untransformed image based on a model of the spacecraft location and imaging sensor geometric characteristics. The locations in the input image corresponding to points between tiepoints in the output image is computed by an interpolation procedure.
The intensity of picture elements in the output image that do not fall on exact points in the input image is computed by performing an intensity interpolation (or res amp ling) in the input image. The process is shown in Figure 4. Normally, the intensity of each sample on each line of the output image is computed in tum, starting at the upper left comer of the image and working down to the lower right comer. For each output sample, the corresponding location in the input image is computed, and the intensity of that sample is computed based on an interpolation scheme if the location in the input image is not exactly at a discrete image sample point. Typical interpolation schemes include nearest neighbor, bilinear interpolation, and cubic spline.
An example of geometric transformation is shown in Figure 5. A Viking Orbiter image of Mars is shown before and after orthographic projection. The unprojected image shows the large crater to have an elliptical shape, due to distortion
x x x x x x rxe: __________ -~-------'lx'Ix x x x x x ~
x x x x
x x
xx[8]xxxxx -------~ x xGx x x x x
x x x x x x x x
x~x
-.~--x--x------® x~
-----------------
x x x x
x x x x x
INPUT IMAGE OUTPUT IMAGE
®=TlEPOINTS
PICTURE ELEMENT [&J CORRESPONDS TO LOCATION G IN THE :NPUT IMAGE
Figure 4-Digital geometric transformation
From the collection of the Computer History Museum (www.computerhistory.org)
144 National Computer Conference, 1978
Figure 5-Left-Contrast enhanced version of a Viking Orbiter image of a large Martian crater. The crater is ellipsoidal, due to spacecraft viewing
geometry.
introduced because the image was recorded when the camera was at an oblique angle relative to the local surface normal. The orthographic projection is performed to depict the images as if the camera were viewing the scene from directly above the center of the field of view, and the transformation is defined based on spacecraft position and camera orientation data returned in the spacecraft telemetry.
AUTOMATED IMAGE REGISTRATION
It has frequently been possible to perform image registration in an automated manner in the NASA planetary program. Typically, each planetary spacecraft records a large number of images of a planetary surface, and the science investigators require construction of photomosaics showing large portions of the surface of a planet in a single photographic product. In most cases, it is possible to perform standard mapping projections by computing the geometric transformation for each individual image based on auxiliary data returned with each image that describes the spacecraft position relative to the planet and the camera viewing angle. The transformation is computed based on the mathematical model of the planet (generally an oblate spheroid is used as the planet model), the camera system optical components, and the spacecraft and camera viewing geometry.
IPL produced over 1200 images projected to an orthographic projection during the Mariner 9 Mars orbital mission. Each image was individually corrected for camera system geometric distortion, enhanced, and then projected to an orthographic projection. The projected images were then photographically scaled and used to construct the first global photomosaic of a planet ever constructed from remotely sensed imagery. The photo mosaic was constructed on a
Figure 5-Right-The same image after orthographic projection. Shape distortion due to viewing geometry has been removed. (IPL Pic ID
76/09/09/173047 and 76/09/09/175425)
three-foot diameter globe, and a portion of the photomosaic is shown in Figure 6.
The Mariner 10 flyby mission to Venus and Mercury provided several thousand images of the surface of Mercury. IPL produced photomosaics of many standard mapping quadrants on the planet's surface. Figure 7 shows one of the mapping quads produced from over fifty Mercury images from Mariner 10. Again each image was individually processed to remove camera system induced distortion, enhanced, and projected to Mercator projection. Other map-
Figure 6--0ne hemisphere of the photomosaic globe of Mars produced using over 1200 enhanced and orthographically projected images from the Mariner 9 Mars orbital mission. (JPL Photo Lab Negative No. 320-284B)
From the collection of the Computer History Museum (www.computerhistory.org)
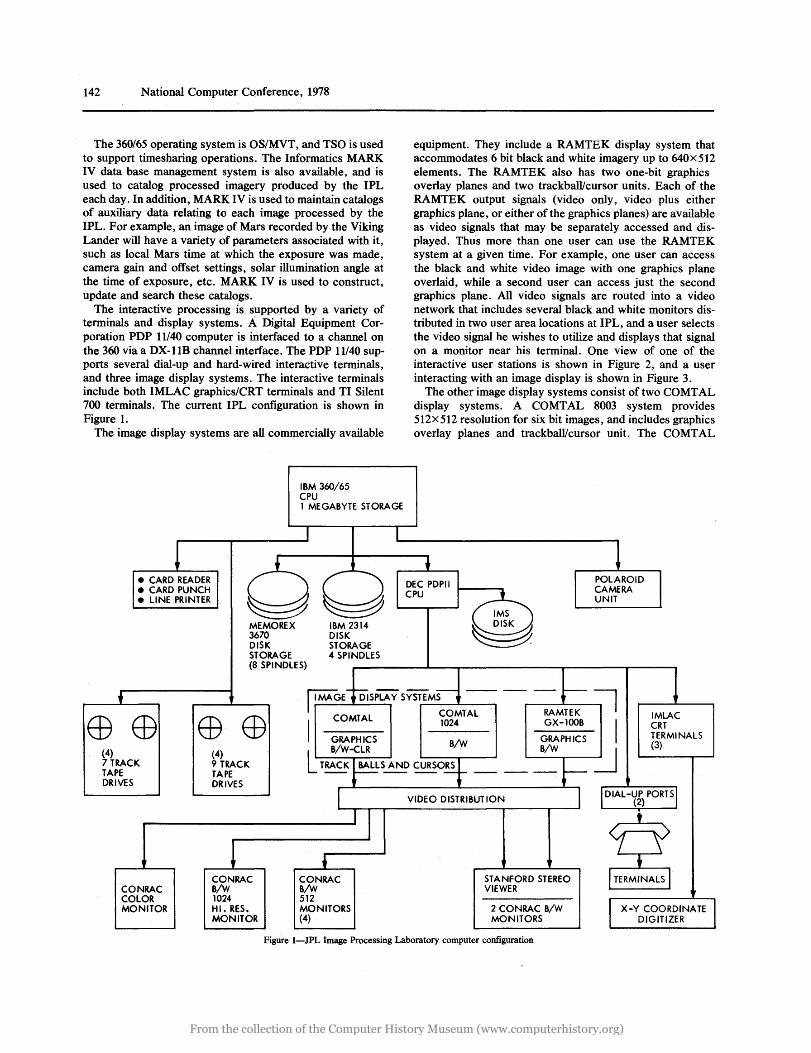
Figure 7-Computer generated mosaic of the region near the south pole of' Mercury, constructed from over twenty separate Mariner 10 vidicon
images. A special scene dependent high pass filter has been applied to bring out local detail throughout the scene, and especially near the terminator.
(JPL Photo Lab Negative No. 324-2306)
ping projections in standard use at IPL include Lambert Conformal Conic and Polar Stereographic.
In both of the cases described above, the navigation data was of sufficient quality to enable mosaicking of automatically projected imagery. After each individual image was projected, it was not necessary to refine the projection transformation to achieve a better match of the imagery. However, there are instances where precise registration to less than a picture element across the entire area of interest is required. In those cases, it is often necessary to perform manual or interactive processing to refine the transformations that are performed. Typical applications of this type are discussed in the next section.
SEMI-AUTOMATED IMAGE REGISTRATION
IPL has developed the capability to perform interactive refinement of image registration for specific applications. An example of an application requiring registration accuracies of less than one picture element is image differencing. For example, the Mariner 9 Mars Orbiter provided repetitive coverage of portions of the Martian surface during 1972. Determination of surface feature variation was one scientific objective of that mission. It was possible to achieve gross (accuracy 2:1 picture element) registration of two images of the same portion of the surface taken at different times during the mission by performing standard mapping transformations. However, change detection can be confusing if there is misregistration on the order of one picture element, since changes are masked by overall misregistration when a difference image is produced. It was necessary to refine the registration using an interactive display and supporting software. The software originally developed for Mariner 9 has been extended and refined for later applications, but the general principles remain the same.
An analyst selects a feature in one of the two images he
Applications of Digital Image Processing Techniques 145
wishes to register. He then identifies the same feature in the second image. The program uses his second location in the second image as the center of a search area, and performs correlation calculations within a local moving window in the second image. A point of maximum correlation is selected as the location in the second image that corresponds to the selected location in the first image, and the offset of that point relative to the location in the first image is retained. The analyst proceeds to select a set of features and performs the same routine with each point, so that a set of offset vectors is ultimately available throughout most of the region of overlap. When an adequate number of feature offsets has been acquired, a geometric transformation is defined that will map the second image onto the first image. Normally, if the two images have been processed to a standard mapping projection prior to the identification of feature points, the second geometric transformation is a small refinement. The result is a registered pair of images where registration has been achieved to less than one picture element accuracy.
Figure 8 shows one of the output products from the Mariner 9 image differencing task at IPL. The top two images are segments of Mariner 9 imagery of the same part of the surface recorded approximately two weeks apart. The lower left image is an unenhanced difference picture, and the lower right image is a contrast stretched version of the difference picture. Any differences in intensity between the two images is displayed as either whiter or blacker than mid-gray in the difference image.
If the two images had been misregistered by more than a picture element, all features in the scene would appear in the difference image as both black and white detail. For example, the crater edge would appear as a double image, one black and the other white. Because the registration is precise in the example shown in Figure 8, the crater edge appears only once in the difference image, and the difference image correctly portrays the change in crater edge definition and albedo that occurred as the great Martian dust storm of 1972 continued to clear during the two-week period in which these images were recorded.
REGISTRATION OF IMAGING AND NON-IMAGING DATA
The registration of non-imaging data to imaging data has always been important in digital image processing applications at IPL. Processing of planetary imagery often required knowledge of auxiliary data relating to each recorded-image. For example, generation of geometric transformation parameters to transform an image into a standard mapping projection requires a knowledge of the spacecraft position and the camera viewing angle at the time the image is recorded. It is also often desirable to remove the shading effects in planetary imagery that are caused by variation in solar illumination and viewing angles from image to image, and removal of these effects is performed using auxiliary ephemeris information and spacecraft position and view angle data.
The planetary program initially provided the motivation for geographically referenced image data bases. It was nec-
From the collection of the Computer History Museum (www.computerhistory.org)
146 National Computer Conference, 1978
9 PICTUF.:E NUMBER .27 ••• ' ... 'InJ ZENITH - ANGLE •••• SOLAR ZENITH *.. ORTHOGRAPHIC PRO.JECTION ••• AT PRO,J. CENTER L= 500.0, S= 500. O~ LAT=-60.5, LONG= 34': .• is tJ S:CALE I). 12', t<N-P::<L, NORTH= -94.00 DEG CLOCKt.4ISE tRotl UP
GEOt1A - FICOR71 TO CONVERT TO FT-l, MULTIPLY Dti YALUE BY 5.949118 IPl ROLL NO. 815 RESSAR - .*. NINE :ElIT DATA TRUHC~T£DTO EIGHT .lITS ••• AIJTOSI4P - S:UPERt1AF' - :STRETCH 77- 83 - CONCAT
DA:S: 4292410 t1It'tUS DAS: 5525873 CONCATINATION
I ' · ,'. LJ'~-TJuJLill~Ll pL.l!. .. " l f>4 'i:?t~ t<./ .,
t1EAH=1:2l:3.70 0"=51.20 Figure 8--An example of image differencing. Top two images are segments of Mariner 9 images of Mars recorded approximately two weeks apart during clearing of the great dust storm of 1972. The two segments are in precise registration. The bottom left image is an unenhanced difference image, and the
bottom right image is a contrast enhanced difference image. Changes in albedo in the center of the crater show as white areas in the difference image. (JPL Photo Lab Negative No. 324-2293A)
From the collection of the Computer History Museum (www.computerhistory.org)
essary to index each image based on the longitude and latitude coordinates of the surface area recorded in each individual image. Computerized data bases were created for imagery of Mars, Venus and Mercury that enabled interactive interrogation to determine surface coverage as a function of a variety of parameters. It is possible at IPL to perform a search to locate all images taken of a particular portion of the planet surface that were taken under a particular set of conditions. Thus an analyst can interactively query a picture catalog to answer the following type of question:
"What Viking Orbiter images exist that show the area within 10 degrees of latitude 650 west longitude 1200 after 3:00 p.m. local Martian time that were taken through the red spectral filter? Limit the search to those images recorded after the 35th day of the Orbital mission."
The LANDSAT satellites have increased the emphasis on
PORTLAND, OREG[]N CENSUS TRACT .
LANDSAT CLASSIFICATION APRIL / JULY 1976
o 5 10 15 .. 1M :iLOMETERS
Applications of Digital Image Processing Techniques 147
correlation of geographically encoded data bases. There are literally hundreds of existing geographically encoded data bases in routine use throughout the country by a variety of federal, state and local government agencies. One of the most familiar examples is the data base maintained by the United States Census Bureau. LANDSAT satellites provide repetitive multispectral imagery of the earth's surface, and have been used to monitor agricultural parameters, geological properties, and land use patterns throughout the country, to list just a few applications. In almost every case, there is a need to relate results obtained from analysis of LANDSAT imagery to existing geographically referenced data bases. In recognition of this need, IPL has developed the Image Based Information System (lBIS).6,7 This system utilizes the geometric transformation capabilities originally developed for the planetary program to correlate imaging and non-imaging data bases. Figure 9 shows the results of a standard thematic classification of land use in the Portland, Oregon area. 9 Each picture element in a LANDSAT multi-
RESIDENTIAL COMMERCIAL
So INDUSTRIAL OPEN SPACE AGRICULTURAL rOREST WATER SEASONAL CHANGE
Figure 9-Thematic map of Portland, Oregon showing land use patterns determined from multispectral classification of LANDSAT imagery. The white overlay indicates U. S. Census tract boundaries registered with the LANDSAT image.
From the collection of the Computer History Museum (www.computerhistory.org)
148 National Computer Conference, 1978.
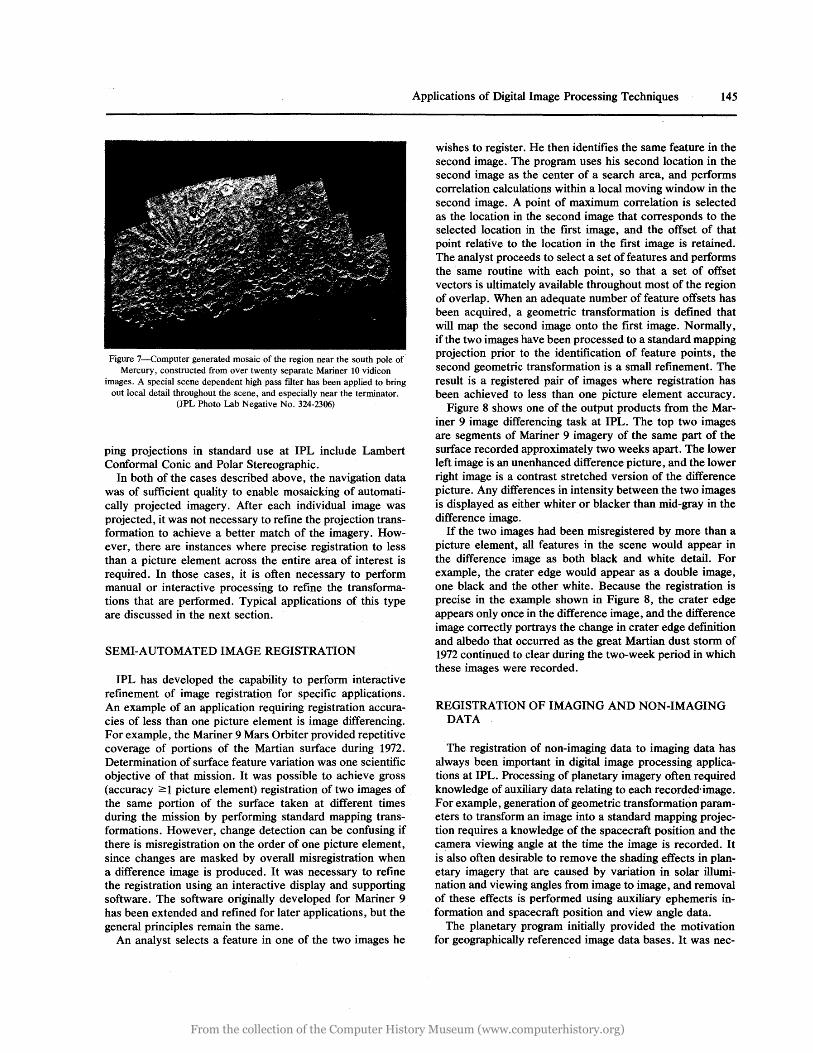
Figure I~District image created from tabular data base containing traffic zone boundaries in Portland, Oregon. The district image display product is
created from the digital district image using a five-color algorithm; 9 the district image is registered to the LANDSAT thematic map shown in
Figure 9.
spectral image is assigned to a particular class of land use based on the relative spectral response in each of the four spectral bands recorded by LANDSAT. Training areas for which ground truth is known are often used to define the spectral signature corresponding to each desired land use category.
The graphical overlay visible in Figure 9 represents the
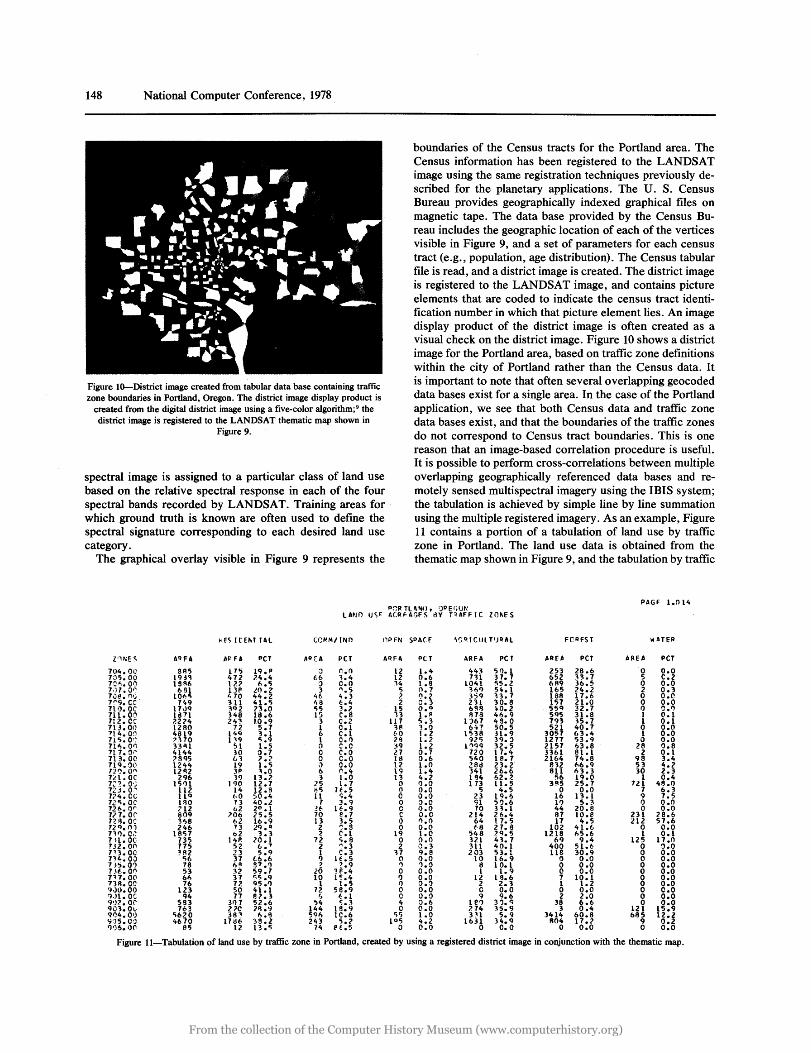
boundaries of the Census tracts for the Portland area. The Census information has been registered to the LANDSAT image using the same registration techniques previously described for the planetary applications. The U. S. Census Bureau provides geographically indexed graphical files on magnetic tape. The data base provided by the Census Bureau includes the geographic location of each of the vertices visible in Figure 9, and a set of parameters for each census tract (e.g., population, age distribution). The Census tabular file is read, and a district image is created. The district image is registered to the LANDSAT image, and contains picture elements that are coded to indicate the census tract identification number in which that picture element lies. An image display product of the district image is often created as a visual check on the district image. Figure 10 shows a district image for the Portland area, based on traffic zone definitions within the city of Portland rather than the Census data. It is important to note that often several overlapping geocoded data bases exist for a single area. In the case of the Portland application, we see that both Census data and traffic zone data bases exist, and that the boundaries of the traffic zones do not correspond to Census tract boundaries. This is one reason that an image-based correlation procedure is useful. It is possible to perform cross-correlations between multiple overlapping geographically referenced data bases and remotely sensed multispectral imagery using the IBIS system; the tabulation is achieved by simple line by line summation using the mUltiple registered imagery. As an example, Figure 11 contains a portion of a tabulation of land use by traffic zone in Portland. The land use data is obtained from the thematic map shown in Figure 9, and the tabulation by traffic
PAGF 1.014 P:1R TlO\NIJ. :JPE(;fJ~
L A~Jf) U <;~ ACRf-AGFS 8Y PAFF Ie ZO~E S
~FS HEM IAL CO/o'M/INO nPFN SPAfF \S 0 I (tIL TIJQ AL FCAfS T wATER
l'lll;E <; AQFA /i~ f,. PCT AA EA PCT AQr:A PC T ARFA PC T /iRE,. PCT AREA PCT
Figure II-Tabulation of land use by traffic zone in Portland, created by using a registered district image in conjunction with the thematic map.
From the collection of the Computer History Museum (www.computerhistory.org)
zone is achieved by correlation of the traffic zone district image with the thematic map.
The IBIS system has recently taken advantage of the inte~active capabilities of the current IPL computer system. In particular, the image display systems provide a convenient way to perform precise registration of non-imaging and imaging data bases. As an example, the Census Bureau tabular data base often contains errors, resulting in failure of tract boundary lines to meet at vertices or generation of erroneous tract boundary lines and an erroneous district image when the tabular data is converted to image format. An interactive display system with graphics overlay capability provides an efficient tool for editing of the census data base to correct or remove occasional erroneous data entries.
SUMMARY
This paper has provided an overview of the evolution of the computer configuration at JPL's Image Processing Laboratory, and a summary of the development of techniques for geometric transformation of digital imagery. Image registration techniques originally developed for the planetary program have been described, and have become an important component of the registration of non-imaging geographically encoded data bases with multispectral imagery returned by earth observations satellites. Registration of existing geocoded data bases with LANDSAT imagery will continue to be important if the LANDSAT data is to be truly useful to the user community.
ACKNOWLEDGMENTS
The recent upgrade of the IPL computer facility was performed by the IPL Operations Group under the direction of Joel Seidman. The interactive display support software was developed under the direction of Paul Jepsen. The image registration software at IPL has evolved through the efforts of Tom Rindfleisch, Arnold Schwartz and Jean Lorre. Dr. Nevin Bryant and Dr. Albert Zobrist have been responsible
Applications of Digital Image Processing Techniques 149
for leading the development of the IBIS system; they are members of the Earth Resources Applications Group supervised by Richard Blackwell. The Mariner 9 image differencing example was provided by Paul Jepsen, and the Mariner 10 computer-generated mosaic was produced by Joel Mosher of our Space Image Processing Group supervised by Donald Lynn.
This paper presents the results of one phase of research carried out at the Jet Propulsion Laboratory, California Institute of Technology under contract NAS 7-100, sponsored by the National Aeronautics and Space Administration.
REFERENCES
1. Jepsen, P. L., "The SoftwareIHardware Interface for Interactive Image Processing at the Image Processing Laboratory of the Jet Propulsion Laboratory," Proceedings of the Digital Equipment Computer Users Society, December 1976.
2. Rindfleisch, T. C., J. A. Dunne, H. J. Frieden, W. D. Stromberg and R. M. Ruiz, "Digital Processing of the Mariner 6 and 7 Pictures," 1. Geophys. Res. 76 (2), 1971, pp. 394-417.
3. Green, W. B., P. L. Jepsen, J. E. Kreznar, R. M. Ruiz, A. A. Schwartz and J. B. Seidman, "Removal of Instrument Signature from Mariner 9 Television Images of Mars," Appl. Opt. 14, 1975.
4. Soha, J. M., D. J. Lynn, J. J. Lorre, J. A. Mosher, N. N. Thayer, D. A. Elliott, W. D. Benton, and R. E. Dewar, "IPL Processing of the Mariner 10 Images of Mercury," 1. Geophys. Res. 80 (17), June 1975.
5. Gillespie, A. R. and J. M. Soha, "An Orthographic Photomap of the South Pole of Mars from Mariner 7," Icarus 16, 1972, pp. 522-527.
6. Zobrist, A. L., "Elements of an Image Based Information System," Proceedings of the CaitechJIPL Conference on Image Processing Technology, Data Sources and Software for Commercial and Scientific Applications, JPL Document JPL SP 43-30, November 1976.
7. Bryant, N. A., "Integration of Socioeconomic Data and Remotely Sensed Imagery for Land Use Applications," Proceedings of the CaitechJIPL Conference on Image Processing Technology, Data Sources and Software for Commercial and Scientific Applications, JPL Document JPL SP 43-30, November 1976.
8. Zobrist, A. L., N. A. Bryant, and A. J. Landini, "Use of LANDSAT Imagery for Urban Analysis," Proceedings of Urban and Regional Information Systems Conference, Kansas City, Mo., August 1977, in press.
9. Zobrist, A. and B. McLemore, "Computability of Five-Color Maps," Image Science Mathematics Symposium Proceedings, Monterey, California, November 1976 (available from Western Periodical Company, North Hollywood, California 91605).
From the collection of the Computer History Museum (www.computerhistory.org)
From the collection of the Computer History Museum (www.computerhistory.org)