Page 1
i
APPLICATIONS OF ELECTROSPUN
NANOFIBERS IN FILTRATION PROCESSES
A Thesis Submitted to
the Graduate School of Engineering and Sciences of
İzmir Institute of Technology
In Partial Fulfillment of the Requirements for the Degree of
DOCTOR OF PHILOSOPHY
in Chemistry
by
Nesrin HORZUM POLAT
September 2013
İZMİR
Page 2
ii
We approve the thesis of Nesrin HORZUM POLAT
Examining Committee Members:
_______________________________
Prof. Dr. Latif ELÇİ
Department of Chemistry, Pamukkale University
_______________________________
Prof. Dr. Ayşe Merih SARIIŞIK
Department of Textile Sciences, Dokuz Eylül University
_______________________________
Assoc. Prof. Mustafa M. DEMİR
Department of Chemistry, İzmir Institute of Technology
_______________________________
Assist. Prof. Hadi M. ZAREİE
Department of Materials Science and Engineering,
İzmir Institute of Technology
_______________________________
Assist. Prof. Mustafa EMRULLAHOĞLU
Department of Chemistry, İzmir Institute of Technology
12 September 2013
_______________________________
Assoc. Prof. Mustafa M. DEMİR
Supervisor, Department of Chemistry
İzmir Institute of Technology
_______________________________ _______________________________
Prof. Dr. Ahmet E. EROĞLU Prof. Dr. R. Tuğrul SENGER
Head of the Department of Chemistry Dean of the Graduate School of
Engineering and Sciences
Page 3
iii
ACKNOWLEDGEMENTS
It would not have been possible to write this work without the help and guidance
of the kind people around me, to only some of whom it is possible to express my sincere
gratitude here.
First and foremost, I would like to express heartfelt gratitude to my advisor
Assoc. Prof. Mustafa M. Demir for his insights, guidance, support and confidence in me
throughout all aspects of this thesis. Above all, he has been patient, inspirational and
accessible. As a scientific mentor, he taught me to think analytically, to be persistent, to
look outside the box, and many skills to succeed in research. I am so grateful to have an
advisor with such kind personality and understanding. To have him as an advisor and to
work with him has been a unique privilege.
Prof. Dr. Ahmet E. Eroğlu is acknowledged not only for accepting being co-
advisor, but also for his useful comments and suggestions to the thesis, which helped to
improve the final version. Special thanks to Prof. Talal Shahwan from Birzeit
University. He made this work possible with their expertise and knowledge in
adsorption processes. The discussions with him and his remarks were also very useful
for the better understanding of the adsorption mechanisms. Prof. Dr. Salih Okur has to
be thanked for the comments on Chapter 5 and 6.
I would like to extend my utmost gratitude to Assist. Prof. Ritchie Curtis Eanes.
He had been the driving source of inspiration since the day i met him as a Master
Student. He is not with us anymore, but i will never forget any single second when he
was teaching analytical chemistry as well as the scientific writing skills.
I am sincerely grateful to my thesis committee members; Prof. Dr. Latif Elçi,
Prof. Dr. Ayşe M. Sarıışık, Assist. Prof. Mustafa Emrullahoğlu, and Assist. Prof. Hadi
Zareie for accepting to be in my committee, and also for their guidance, feedback and
valuable discussions for this thesis.
Dr. Hüseyin Özgener is thanked for his readiness and involvement in the
measurement of FTIR and UV spectra. I am as well thankful to the specialists at İYTE-
Environmental Research Center for the ICP-MS, IC analysis and at İYTE-Center of
Materials Research for the SEM, TGA, BET, XRD analysis. The assistance of technical
staff of the institute cannot be forgotten. In particular, I would like to thank Polat
Bulanık and Hüseyin Bilir for providing the some chemicals and laboratory glasswares.
Page 4
iv
I would like to thank Prof. Katharina Landfester for giving me the opportunity to
be a part of her group on such an interesting research topic and in such nice working
conditions. Besides, I will always respect to her knowledge and ability to follow, orient
and carry every single project one step further in her group. The Max Planck Society are
acknowledged for financial support. B. Schiewe, scientific administrator of the
International Max Planck Research School for Polymer Materials Science, is also
thanked for the administrative support. I owe a big debt of gratitude to my project
leaders, Dr. Daniel Crespy and Dr. Rafael Muñoz-Espí. I will never forget useful
‘Friday meetings’. I have learned a great deal about scientific research, teamwork,
organization, collaboration, and planning. It was a great honor for me to work with
them in such a friendly atmosphere. I wish them the very best in the rest of their life.
Special thanks go to my elder brother, Hasan Samet Varol for taking the best
SEM micrographs for me. I would also like to thank Margherita Mari. Her ‘sisterly and
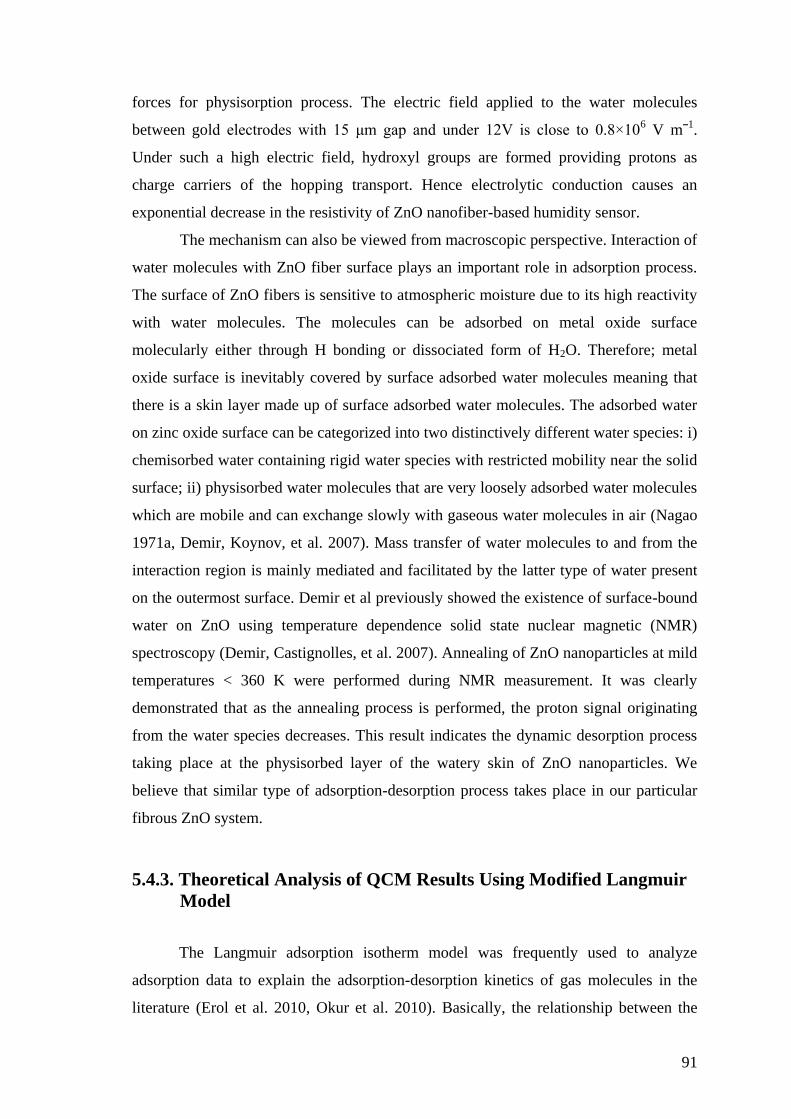
lovely’ behaviour, our weekend brunches, pesto pasta dinners will be all the time
remembered. Moreover, I am indebted to my MPIP friends, Rengin Peköz, Gerard
Sánchez Reina, Clara Isabel Villasana, Jian Chen, and Matthew A. Hood for their helps
and great company. It was a pleasure for me to know them and spend the short time
with them.
I owe very special thanks to Dr. Burcu Ünsal Ünal for being my sister, my
‘fellow travelers’. Her presence in my life will always encourage me to carry on even if
we are away from each other. I would like to thank another close friend at a distance
Özlem Kepenekci for being such a good friend in every respect.
A very special thank to the members of Demir Research Group, Özge Tunusoğlu
for her positive energy and bringing cheers and fun to our laboratory. I am very grateful
to Ece Yapaşan, Onur Parlak, and Özlem Kap. We shared not only the work and
scientific problems, but also a part of our life.
Furthermore, I would like to thank Dr. Ezel Boyacı, for sparing her valuable
time for the numerous scientific discussions. Dr. Semira Ünal Yeşiller and Dr. Ayşegül
Şeker Erdoğan are acknowledged for their friendship, especially our conversations on
the service bus. They were also great scientific colleagues and the interaction with them
brought fruitful ideas for the further development of the work. And, of course, I cannot
skip the members of the ‘C-323 office mates’: thanks to all of them for the nice time we
had together.
Page 5
v
I would like to thank my brother, Uğur Horzum and my kunatё, Soena Horzum
for their warm love and support throughout my studies. Special thanks to my little
niece, Helena for being the sweetest baby. They planned each holiday time according to
me accepting all my excuses.
Most importantly, none of this would have been possible without the love and
patience of my parents, Güler-Hüseyin Horzum. This thesis is dedicated to them who
have given me their unconditional support, both financially and emotionally throughout
my degree. I also would like to thank my parents-in-law, Semiha-Sebahattin Polat,
whose contributions and supports cannot be ignored.
Finally, but in the first place of my mind, I thank the man who has been
emotionally closest to me— my dear, my love and my husband, Serkan Polat —for his
warm love and for being always on my side in the ups and downs that involved in this
work. I owe my deepest thanks to him…
Page 6
vi
ABSTRACT
APPLICATIONS OF ELECTROSPUN NANOFIBERS
IN FILTRATION PROCESSES
Electrospinning is a simple and versatile method to fabricate ultrathin fibrous
mats from a wide variety of organic and/or inorganic materials. Since it allows
fabricating fiber diameter and surface/internal structures by solution and instrumental
parameters, electrospun fibers provide much enhanced functionalities, which can not be
obtained by bulk materials. This thesis examines the filtration, sensing and catalytical
applications associated with the remarkable features of electrospun nanofibers. The
systems studied are reported herein;
(i) The first part of this dissertation deals with the filtration applications of electrospun
nanofibrous membranes.
Nano-sized chitosan fibers were utilized for sorption of Fe(III), Cu(II),
Ag(I), and Cd(II) ions from aqueous solutions.
The surface of chitosan fibers were further functionalized by monodisperse
nano zero-valent iron (nZVI) particles for the removal of inorganic arsenic
species.
Sorption of radioactive U(VI) ions from aqueous systems via column
sorption under continuous flow was performed using amidoximated
polyacrylonitrile fibers.
(ii) The second part of this dissertation presents sensing applications of ceramic fibers.
Humidity sensing properties of electrospun ZnO fiber mats were investigated
by quartz crystal microbalance (QCM) method and electrical measurements.
Electrospinning technique was used as coating process for deposition of
CeO2/ZnO and ZnO based nanofibers on the electrode of QCM. The fiber-
coated QCM sensors were used for the detection of volatile organic compounds
(VOCs).
(iii) The last part of this dissertation describes an approach to fabricate hierarchically
structured composite nanofibers. The nanostructured materials prepared by the
simultaneous electrospinning of CeO2 and LiCoO2 precursors and SiO2 nanoparticles
were used for the photocatalytic degradation of Rhodamine B.
Page 7
vii
ÖZET
ELEKTROEĞİRME NANOLİFLERİN FİLTRASYON
İŞLEMLERİNDE UYGULAMALARI
Elektroeğirme, geniş bir yelpazede organik ve/veya inorganik malzemelerden
ultra ince lifsi yapılar üretmek için basit ve çok yönlü bir yöntemdir. Çözelti ve
enstrümental parametreler ayarlanılarak lif çapı ve yüzey/iç yapıları kontrol
edilebildiğinden dolayı, elektroeğirme nanolifler, kütlesel büyüklükteki aynı
malzemelerle elde edilemeyen gelişmiş özellikler sergilerler. Bu tez, elektroeğirme
nanoliflerin olağanüstü özellkleriyle ilişkili filtrasyon, algılama ve katalitik
uygulamalarını incelemektedir. Çalışılan sistemler burada rapor edilmiştir;
(i) Bu tezin ilk kısmı, elektroeğirme nanolifsi membranların filtrasyon uygulamaları ile
ilgilidir.
Nanometre boyutunda kitosan lifler, Fe(III), Cu(II), Ag(I) ve Cd(II)
iyonlarının sulu çözeltilerden sorpsiyonu için kullanılmıştır.
Kitosan liflerin yüzeyi homojen dağılımlı sıfır değerlikli demir
nanotanecikler ile işlevselleştirilerek inorganik arsenik türlerinin
uzaklaştırılmasında kullanılmıştır.
Sürekli akış altında radyoaktif uranil iyonlarının kolon sorpsiyonu,
amidoksimlenmiş poliakrilonitril lifler kullanılarak gerçekleştirilmiştir.
(ii) Bu tezin ikinci kısmı, seramik liflerin algılama uygulamalarını sunmaktadır.
Elektroeğrilmiş ZnO liflerin nem sensörü özellikleri, kuartz kristal
mikrobalans (KKM) metodu kullanılarak ve elektriksel ölçümler yapılarak
araştırılmıştır
Elektroeğirme tekniği CeO2/ZnO ve ZnO bazlı nanoliflerin KKM elektrodu
yüzeyine depolanması için kaplama işlemi olarak kullanılmıştır. Lif-kaplı KKM
sensörü uçucu organik bileşiklerin (UOB) algılanmasında kullanılmıştır.
(iii) Bu tezin son kısmı katalitik uygulamalar için hiyerarşik yapılı kompozit nanoliflerin
üretimi için bir yaklaşım anlatmaktadır. CeO2, LiCoO2 öncülleri ile SiO2
nanotaneciklerinin birlikte elektroeğrilmesi ile hazırlanan bu nanoyapılı malzemeler,
Rodamin B’nin fotokatalitik bozunmasında kullanılmıştır.
Page 8
viii
Dedicated to my parents…
Page 9
ix
TABLE OF CONTENTS
LIST OF FIGURES ...................................................................................................... xiii
LIST OF TABLES ........................................................................................................ xix
LIST OF ABBREVIATIONS ........................................................................................ xx
CHAPTER 1. INTRODUCTION .................................................................................... 1
1.1. Motivation .............................................................................................. 1
1.2. Structure and Scope of the Thesis .......................................................... 4
1.3. State of the Art: Electrospinning ............................................................ 5
1.3.1.Description of the General Equipment ........................................... 7
1.3.2.The Fundamental Aspect ............................................................... 10
1.3.3.Potential Applications .................................................................. 11
1.3.3.1. Filter Membranes .............................................................. 12
1.3.3.2. Nanofiber-Based Sensors ................................................... 13
1.3.3.3. Catalysts ............................................................................. 14
CHAPTER 2. SORPTION EFFICIENCY OF CHITOSAN NANOFIBERS
TOWARDS METAL IONS AT LOW CONCENTRATIONS ............. 15
2.1. Abstract ................................................................................................ 15
2.2. Introduction .......................................................................................... 15
2.3. Experimental Section ........................................................................... 18
2.3.1. Materials and Methods ................................................................. 18
2.3.2. Electrospinning of Chitosan ......................................................... 19
2.3.3. Structural Characterization of Electrospun Mat .......................... 20
2.3.4. Sorption Studies .......................................................................... 21
2.4. Results and Discussion ........................................................................ 23
2.4.1. Electrospinning of Chitosan and Structural Characterization
of Electrospun Mat ...................................................................... 23
2.4.2. Sorption Studies ........................................................................... 27
2.5. Conclusion ........................................................................................... 34
Page 10
x
CHAPTER 3. CHITOSAN FIBER-SUPPORTED ZERO-VALENT IRON
NANOPARTICLES AS A NOVEL SORBENT FOR
SEQUESTRATION OF INORGANIC ARSENIC .............................. 35
3.1. Abstract ................................................................................................ 35
3.2. Introduction .......................................................................................... 35
3.3. Experimental Section ........................................................................... 38
3.3.1. Materials ....................................................................................... 38
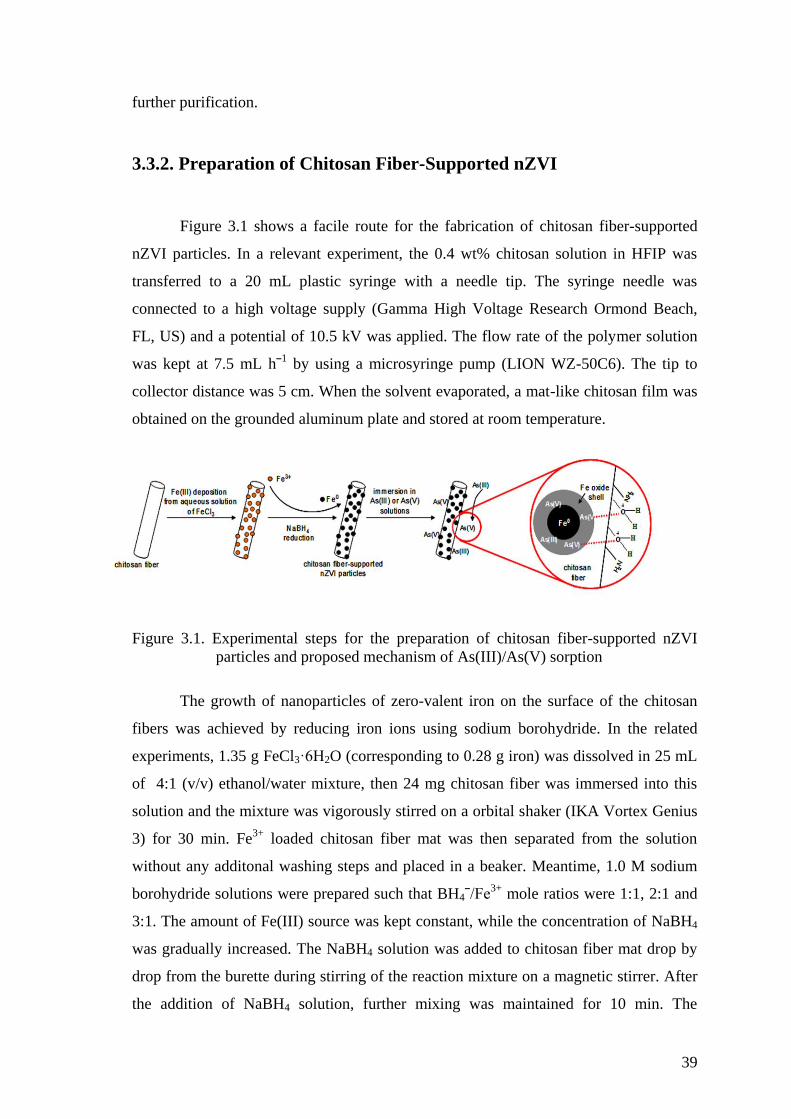
3.3.2. Preparation of Chitosan Fiber-Supported nZVI ........................... 39
3.3.3. Sorption Studies ........................................................................... 41
3.4. Results and Discussion ........................................................................ 42
3.4.1. Characterization of Chitosan-nZVI Fibers ................................... 42
3.4.2. Material Properties After Sorption and Sorption Results ............ 47
3.4.3. Sorption Mechanism .................................................................... 55
3.5. Conclusion ........................................................................................... 57
CHAPTER 4 SYNTHESIS OF AMIDOXIMATED POLYACRYLONITRILE
FIBERS AND ITS APPLICATION FOR SORPTION OF
AQUEOUS URANYL IONS UNDER CONTINUOUS FLOW ....... 58
4.1. Abstract .............................................................................................. 58
4.2. Introduction ....................................................................................... 58
4.3. Experimental Section ......................................................................... 62
4.3.1. Materials .................................................................................... 62
4.3.2. Instrumentation and Software .................................................... 62
4.3.3. Polymerization of Acrylonitrile ................................................. 64
4.3.4. Electrospinning of Polyacrylonitrile .......................................... 64
4.3.5. Surface Treatment of PAN Fibers ............................................. 65
4.3.6. Sorption Studies ......................................................................... 65
4.4. Results and Discussion ...................................................................... 67
4.4.1. Fabrication of PAN Fibers ......................................................... 67
4.4.2. Surface Treatment of PAN Fibers ............................................. 68
4.4.3. Sorption Studies ......................................................................... 72
4.4.3.1. Effect of pH ..................................................................... 72
4.4.3.2. Effect of Initial Concentration ......................................... 73
4.4.3.3. Repetitive Usability ......................................................... 74
Page 11
xi
4.4.3.4. Desorption Tests .............................................................. 76
4.4.3.5. Brief Comments on Sorption Mechanism ....................... 78
4.5. Conclusion ......................................................................................... 79
CHAPTER 5. HUMIDITY SENSING PROPERTIES OF ZnO-BASED FIBERS BY
ELECTROSPINNING ........................................................................... 80
5.1. Abstract ................................................................................................ 80
5.2. Introduction .......................................................................................... 80
5.3. Experimental Section ........................................................................... 82
5.3.1. Preparation and Characterization of ZnO Nanofibers .................. 82
5.3.2. Humidity Measurements Using QCM Technique ........................ 83
5.4. Results and Discussion ....................................................................... 85
5.4.1. Structural Characterization of ZnO Nanofibers ........................... 85
5.4.2. QCM and Electrical Responses under Varying RH ..................... 88
5.4.3. Theoretical Analysis of QCM Results Using Modified
Langmuir Model ........................................................................... 91
5.5. Conclusion ........................................................................................... 93
CHAPTER 6. VOCs SENSOR BASED ON METAL OXIDE NANOFIBROUS
MEMBRANE/QCM SYSTEM PREPARED BY
ELECTROSPINNING ........................................................................... 95
6.1. Abstract ................................................................................................ 95
6.2. Introduction .......................................................................................... 95
6.3. Experimental Section ........................................................................... 97
6.3.1. Chemicals ..................................................................................... 97
6.3.2. Fabrication of Electrospun Metal Oxide Nanofibers ................... 98
6.3.3. Characterization Methods ............................................................ 99
6.4. Results and Discussion ...................................................................... 100
6.4.1. Fabrication and Structural Characterization of the Metal Oxide
Nanofibers ................................................................................... 101
6.4.2. Sensing Properties of Metal Oxide Nanofibers .......................... 105
6.5. Conclusion ......................................................................................... 113
Page 12
xii
CHAPTER 7. ............................................................................................................... 115
7.1. Abstract .............................................................................................. 115
7.2. Introduction ........................................................................................ 115
7.3. Experimental Section ......................................................................... 117
7.3.1. Materials ..................................................................................... 117
7.3.2. Preparation of the Electrospinning Solutions ............................. 117
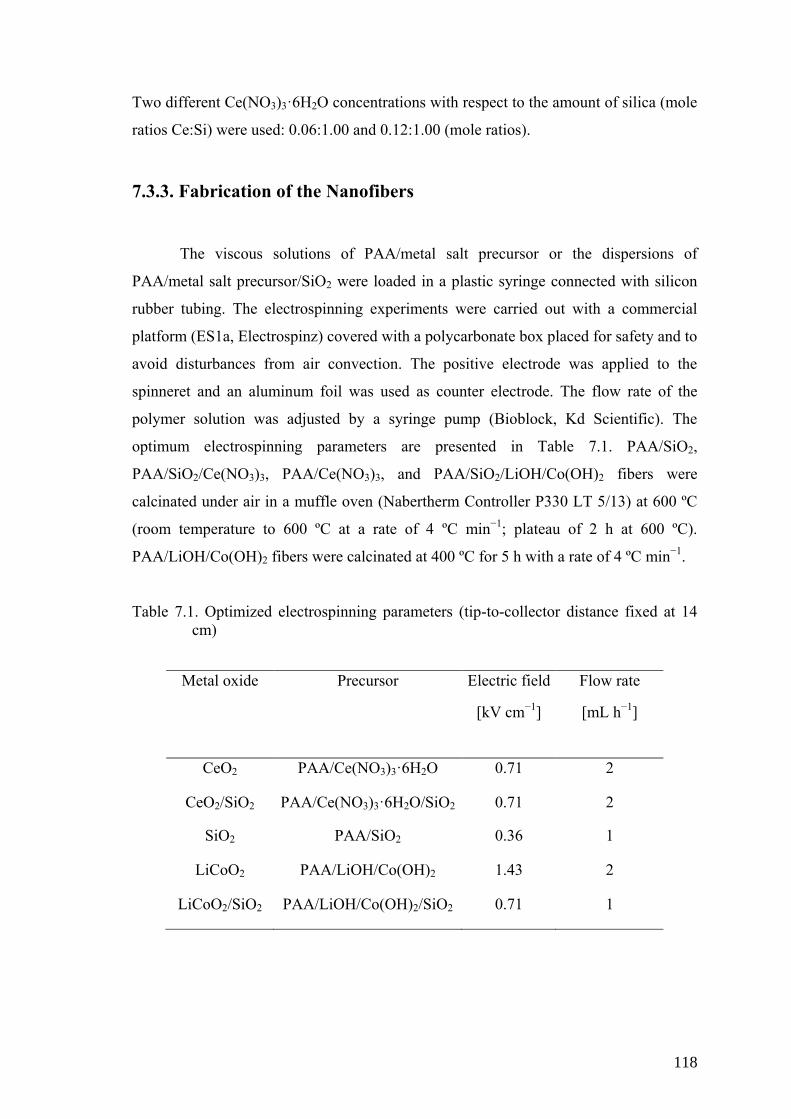
7.3.3. Fabrication of the Nanofibers ..................................................... 118
7.3.4. Characterization Methods ......................................................... 119
7.4. Results and Discussion ...................................................................... 119
7.5. Conclusion ......................................................................................... 131
CHAPTER 8. EVALUATION AND CONCLUDING REMARKS .......................... 133
REFERENCES ............................................................................................................ 136
Page 13
xiii
LIST OF FIGURES
Figure Page
Figure 1.1. (a) Photographic image of electrospun chitosan nonwoven mat, (b)
SEM micrograph of the chitosan nanofibers ............................................... 6
Figure 1.2. The electrospinning set up in our laboratory ............................................... 8
Figure 1.3. A droplet of aqueous poly(ethylene oxide) (PEO) solution dyed with
fluorescein at the needle tip: A) in the absence of electric field, B) in
the presence of electrical field, with a jet perpendicular to the counter
electrode, C) with a jet diagonal to the counter electrode ............................. 9
Figure 1.4. (a) Photographic image of a jet of PEO solution under electrical field,
(b) High-speed photograph showing the jet instabilities .............................. 9
Figure 1.5. SEM micrograph of the irregularly shaped electrospun poly(methyl
methacrylate) (PMMA) fibers from DMF solution .................................... 10
Figure 1.6. The schematic representation of the instantaneous position of the path
of a electrospinning jet that contained three successive electrical
bending instabilities .................................................................................... 11
Figure 1.7. Potential applications of electrospun nanofibers ......................................... 12
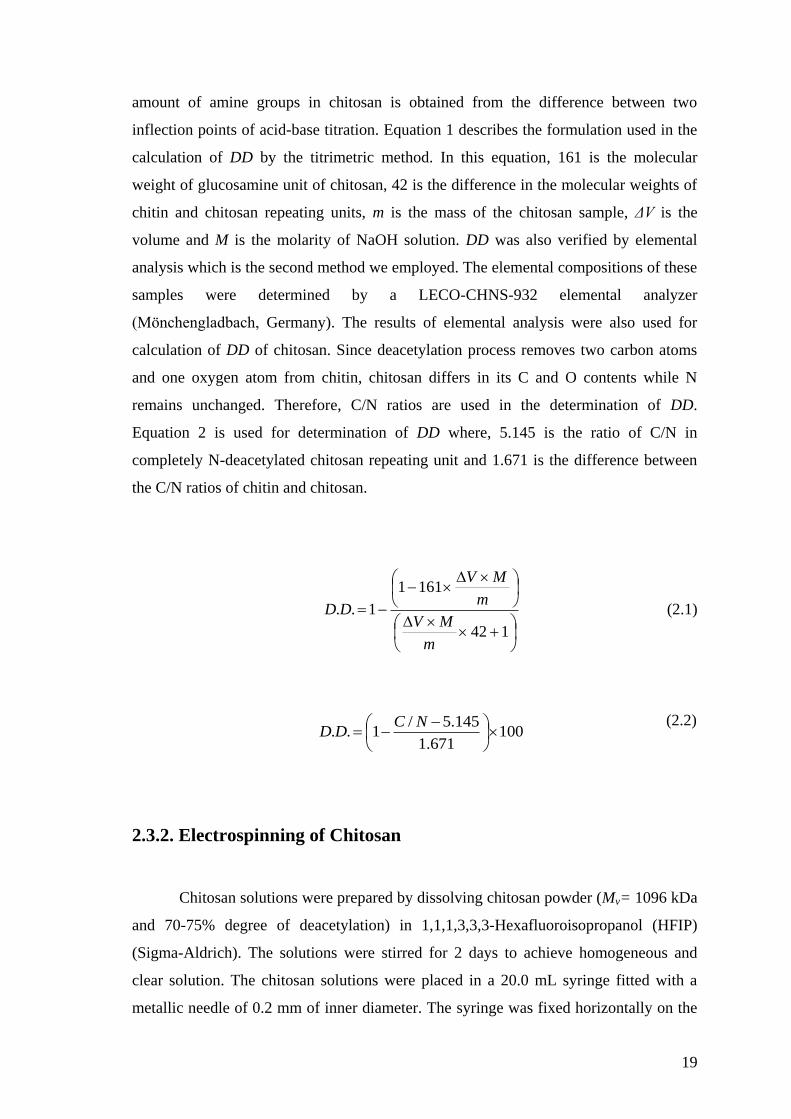
Figure 2.1. Schematic representation of (a) electrospinning setup, and (b)
photographic image of the resulting fiber mat ............................................ 20
Figure 2.2. SEM micrographs of (a) chitosan powder, (b) electrospun mat, and (c)
diameter histogram of the electrospun nanofibers ...................................... 25
Figure 2.3. Structural characterization of the chitosan powder and electrospun
chitosan fibers by means of (a) BET isotherm data, (b) X-ray
diffraction patterns, (c) ATR-FTIR spectra ................................................ 26
Figure 2.4. The effects of (a) sorbent amount, (b) shaking time, (c) initial metal
ion concentration on the sorption of Fe(III), Cu(II), Ag(I), Cd(II) on
chitosan nanofibers at pH=6 ....................................................................... 28
Figure 2.5. Sorption selectivity of chitosan nanofibers for the indicated metal ions
at two different initial concentrations ......................................................... 30
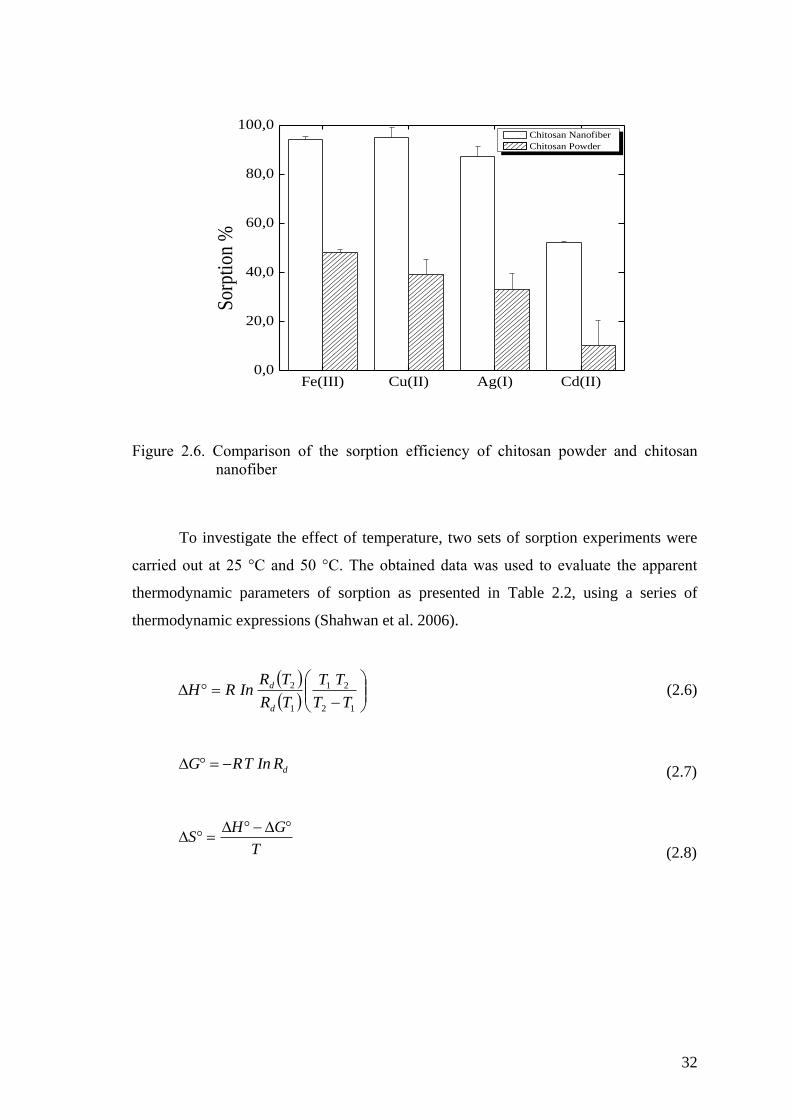
Figure 2.6. Comparison of the sorption efficiency of chitosan powder and chitosan
nanofiber ..................................................................................................... 32
Page 14
xiv
Figure 2.7. Microcolumn application of chitosan nanofiber mat on the sorption of
Fe(III), Cu(II), Ag(I), Cd(II). (Note that each aliquot is 3 mL) .................. 33
Figure 3.1. Experimental steps for the preparation of chitosan fiber-supported
nZVI particles and proposed mechanism of As(III)/As(V) sorption .......... 39
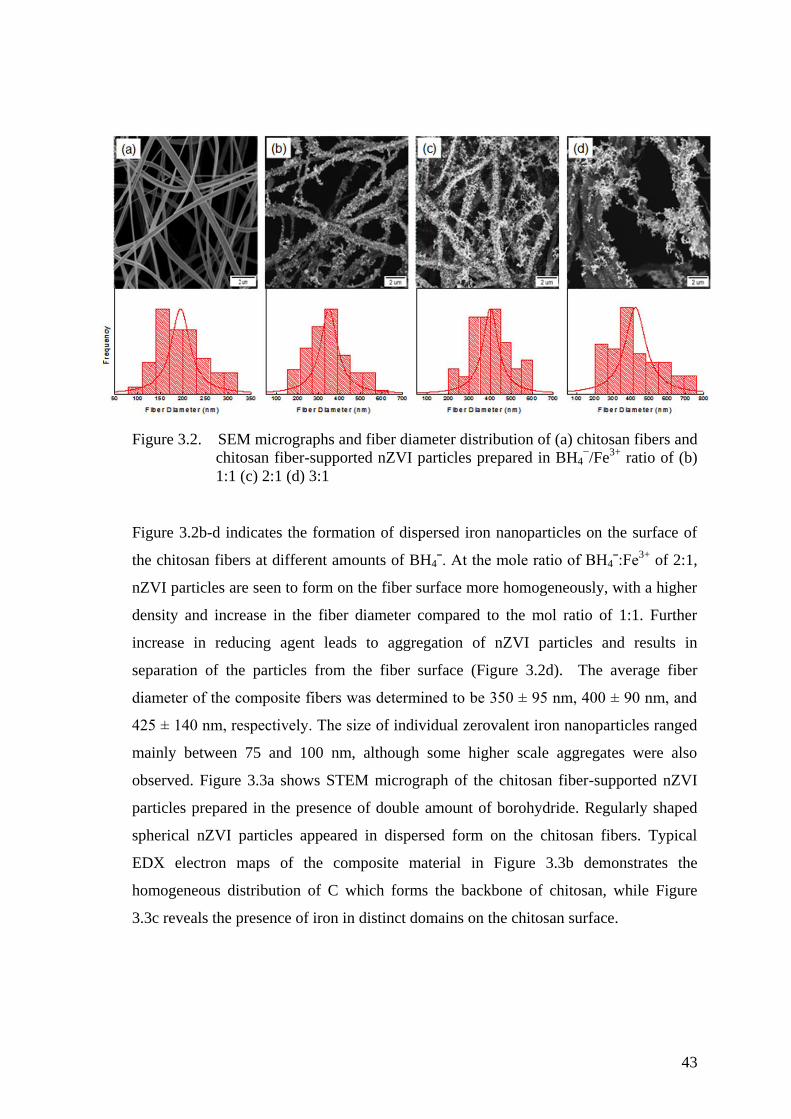
Figure 3.2. SEM micrographs and fiber diameter distribution of (a) chitosan
fibers and chitosan fiber-supported nZVI particles prepared in
BH4−/Fe
3+ ratio of (b) 1:1 (c) 2:1 (d) 3:1 .................................................... 43
Figure 3.3. (a) STEM micrograph, and elemental EDX mapping images (K lines)
of the surface of chitosan fiber-supported nZVI particles (b) C, and (c)
Fe ................................................................................................................. 44
Figure 3.4. TGA curves of (a) chitosan fiber, and nZVI supported on chitosan
nanofibers in BH4ˉ/Fe
3+ ratio of (b) 2:1 (c) 1:1 ........................................... 44
Figure 3.5. Wide XPS survey of the chitosan-nZVI fibers. The insets in the figure
show Fe 2p and C 1s photoelectron profiles ............................................... 46
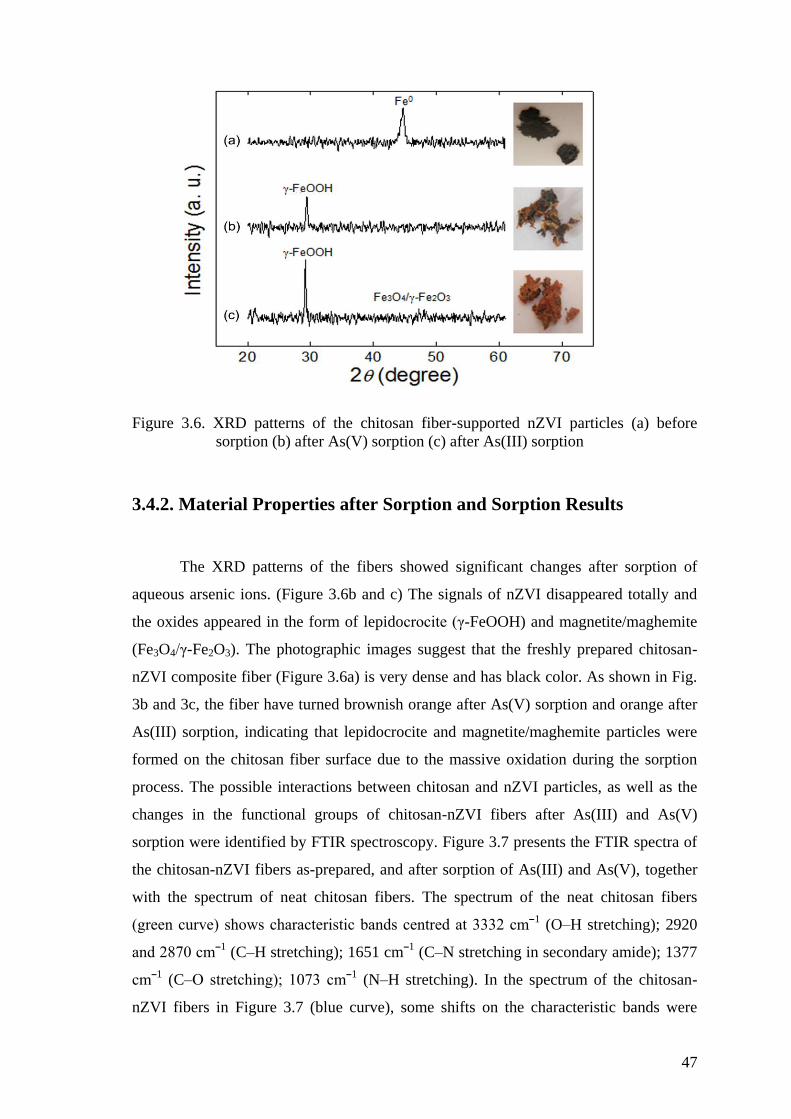
Figure 3.6. XRD patterns of the chitosan fiber-supported nZVI particles (a) before
sorption (b) after As(V) sorption (c) after As(III) sorption ........................ 47
Figure 3.7. FTIR spectra of the chitosan-nZVI fibers as-prepared, after As(III),
and As(V) sorption, compared with the spectrum of pure chitosan
fibers ........................................................................................................... 48
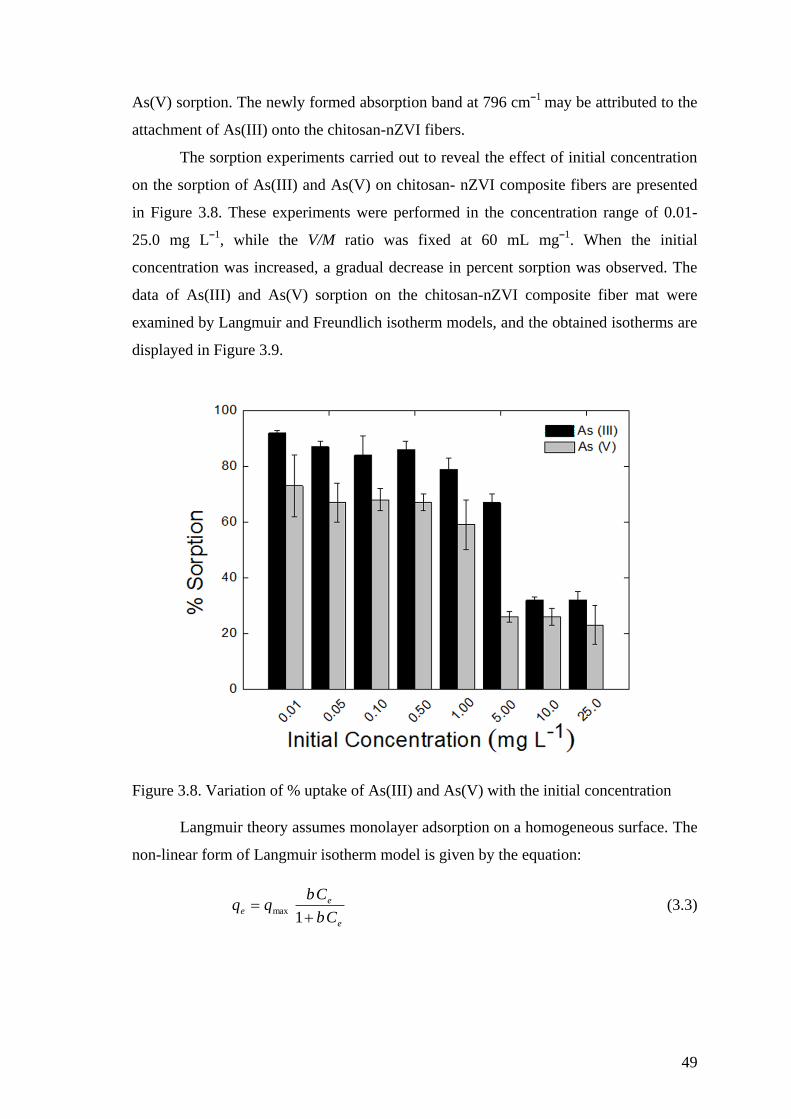
Figure 3.8. Variation of % uptake of As(III) and As(V) with the initial
concentration ............................................................................................... 49
Figure 3.9. (a) Adsorption isotherm and non-linear fits of (b) Langmuir, (c)
Freundlich models for ()As(III) and () As(V) on the chitosan-nZVI
composite fiber mat ..................................................................................... 50
Figure 3.10. Effect of pH on the sorption of 100.0 µg Lˉ1 (a) As(III), and (b)
As(V) solutions by chitosan-nZVI fibers. The insets show speciation
diagrams of As(III) and As(V) .................................................................... 52
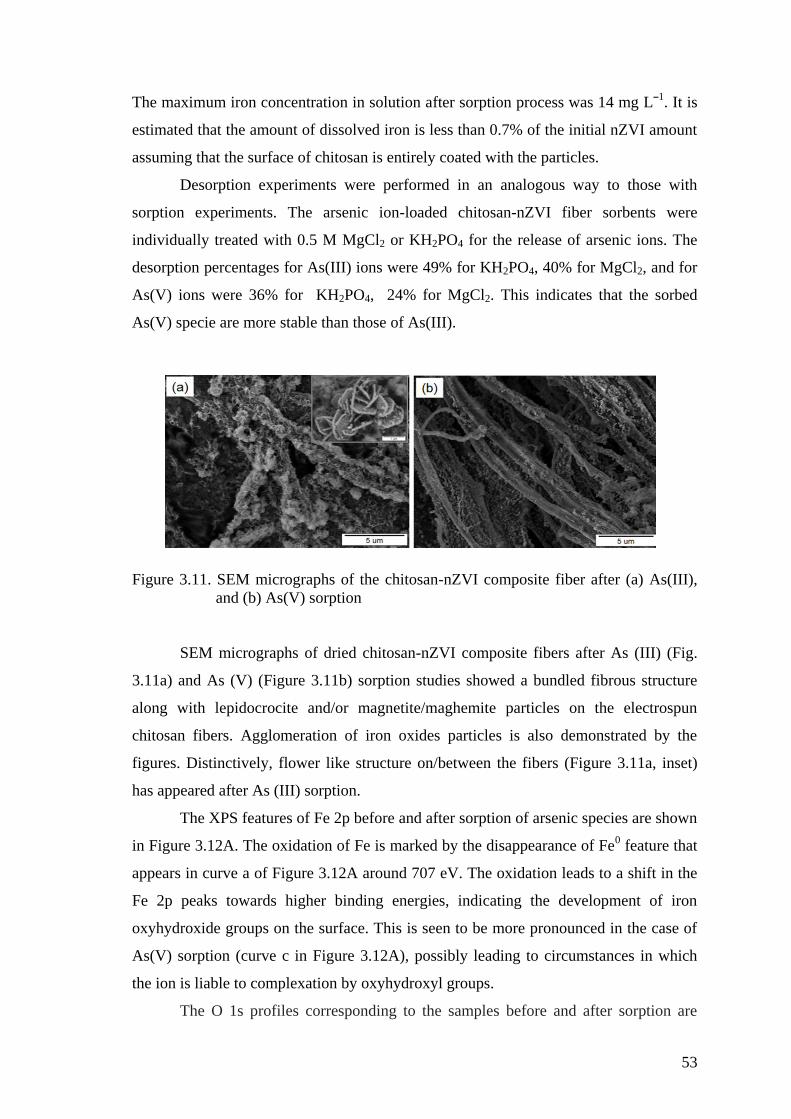
Figure 3.11. SEM micrographs of the chitosan-nZVI composite fiber after (a)
As(III), and (b) As(V) sorption ................................................................... 53
Page 15
xv
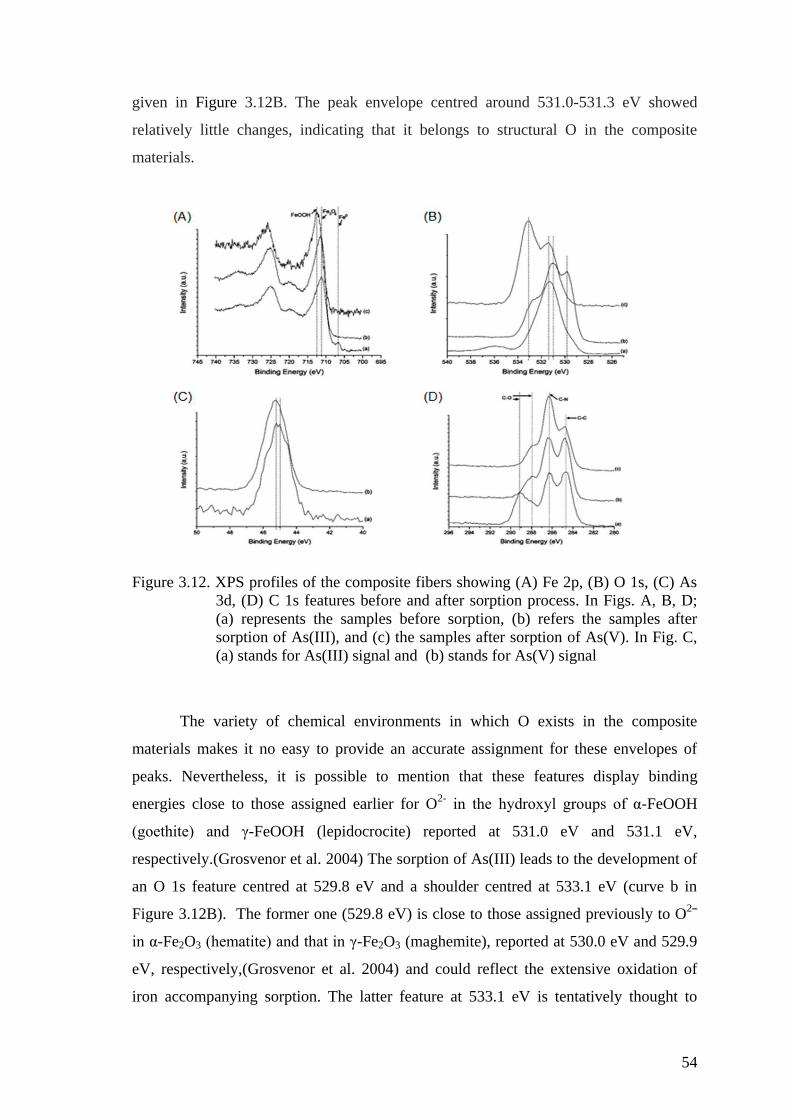
Figure 3.12. XPS profiles of the composite fibers showing (A) Fe 2p, (B) O 1s,
(C) As 3d, (D) C 1s features before and after sorption process. In Figs.
A, B, D; (a) represents the samples before sorption, (b) refers the
samples after sorption of As(III), and (c) the samples after sorption of
As(V). In Fig. C, (a) stands for As(III) signal and (b) stands for As(V)
signal ........................................................................................................... 54
Figure 4.1. Schematic representation of experimental setup of column experiment ..... 66
Figure 4.2.1H NMR spectra of acrylonitrile (AN) monomer and poly(acrylonitrile)
(PAN) polymer in CDCl3 ................................................................................................................... 67
Figure 4.3. The conversion of nitrile groups to amidoxime groups in PAN fiber ......... 68
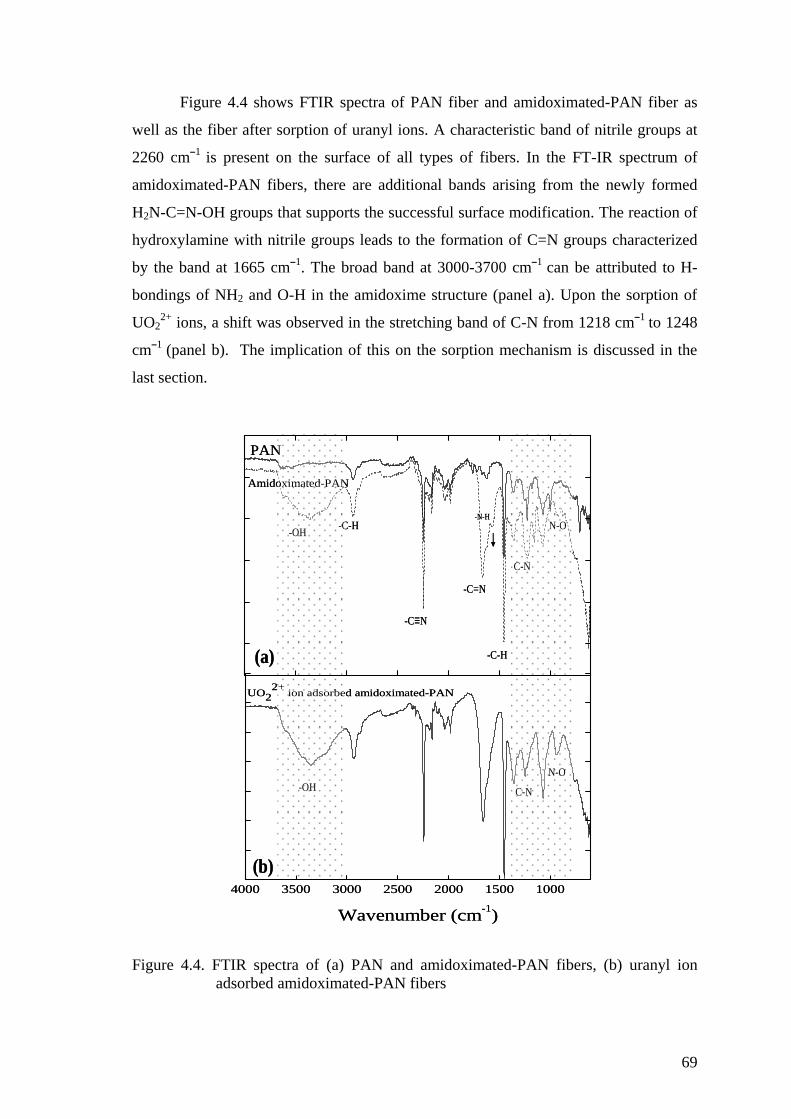
Figure 4.4. FTIR spectra of (a) PAN and amidoximated-PAN fibers, (b) uranyl
ion adsorbed amidoximated-PAN fibers ..................................................... 69
Figure 4.5. Scanning electron micrographs and corresponding fiber diameter
distributions of (a) PAN fibers, (b) amidoximated-PAN fibers and (c)
amidoximated-PAN fibers after uranyl ion sorption ................................. 70
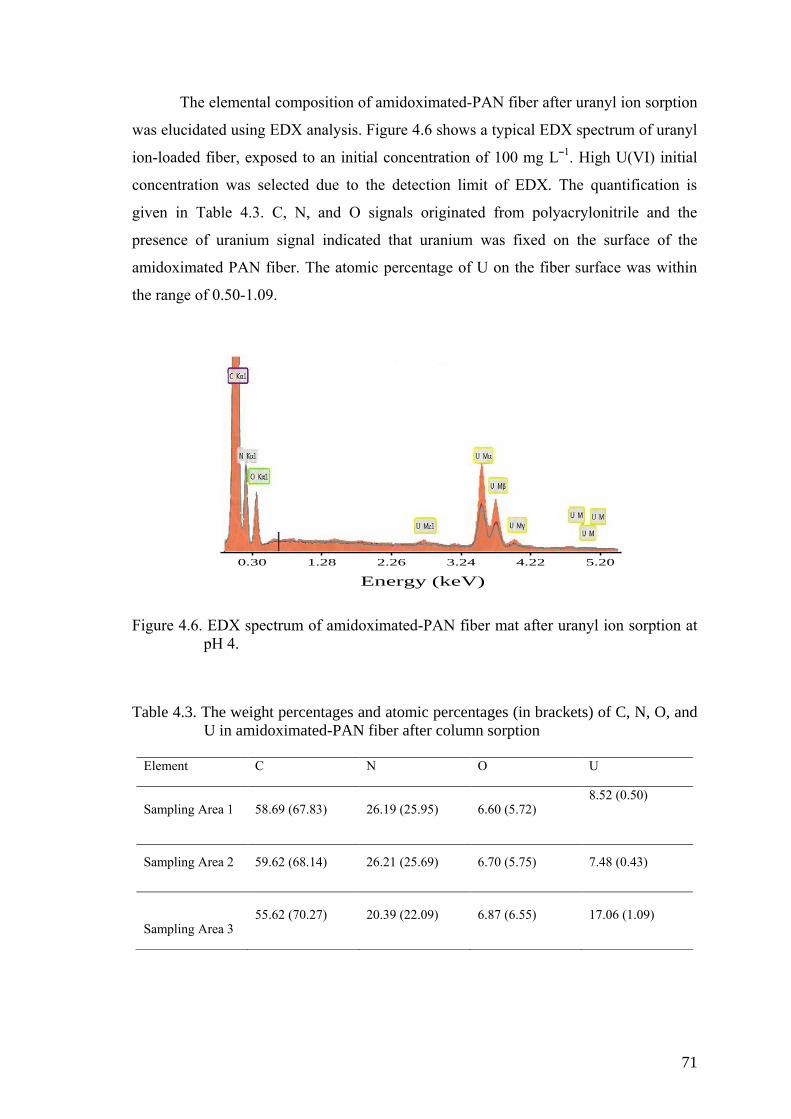
Figure 4.6. EDX spectrum of amidoximated-PAN fiber mat after uranyl ion
sorption at pH 4. .......................................................................................... 71
Figure 4.7. (a) Speciation diagram of U (VI), and (b) microcolumn study for U
(VI) at different pH values (b). (Reaction conditions: The initial
U(VI) concentration of 100 µg L-1
, 0.15 mL min-1
flow rate, 25.0 mg
sorbent) ....................................................................................................... 73
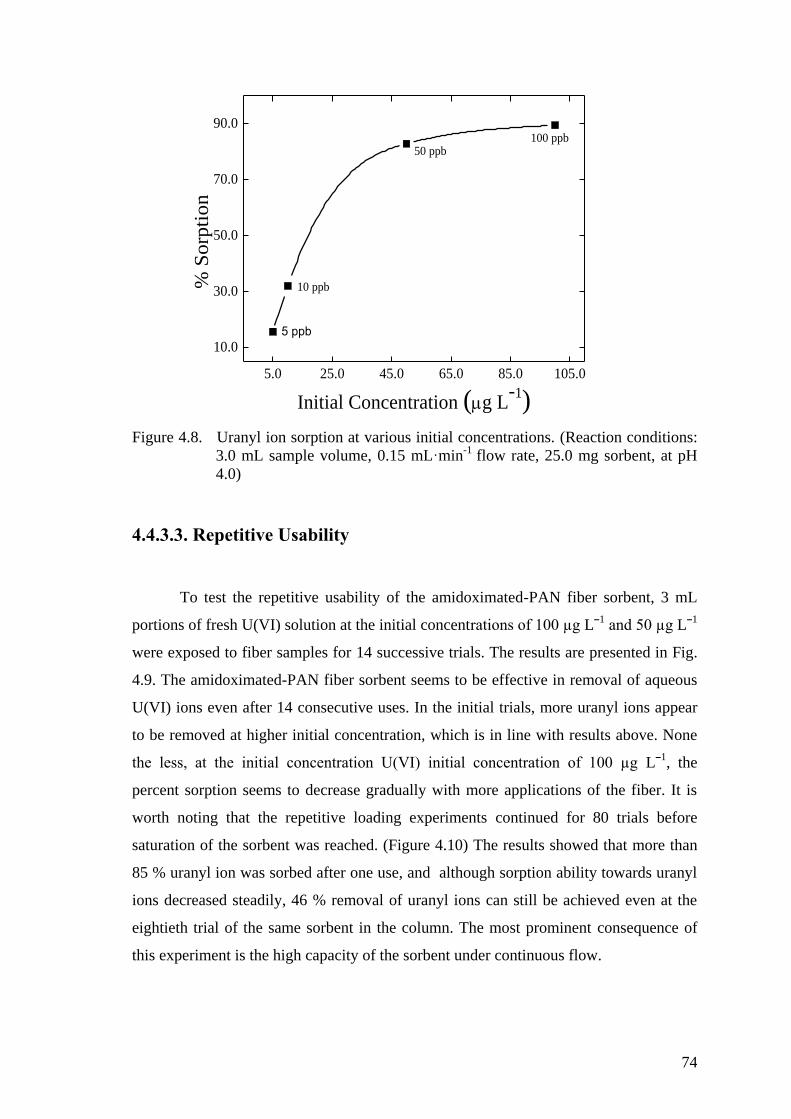
Figure 4.8. Uranyl ion sorption at various initial concentrations. (Reaction
conditions: 3.0 mL sample volume, 0.15 mL min-1
flow rate, 25.0 mg
sorbent, at pH 4.0) ....................................................................................... 74
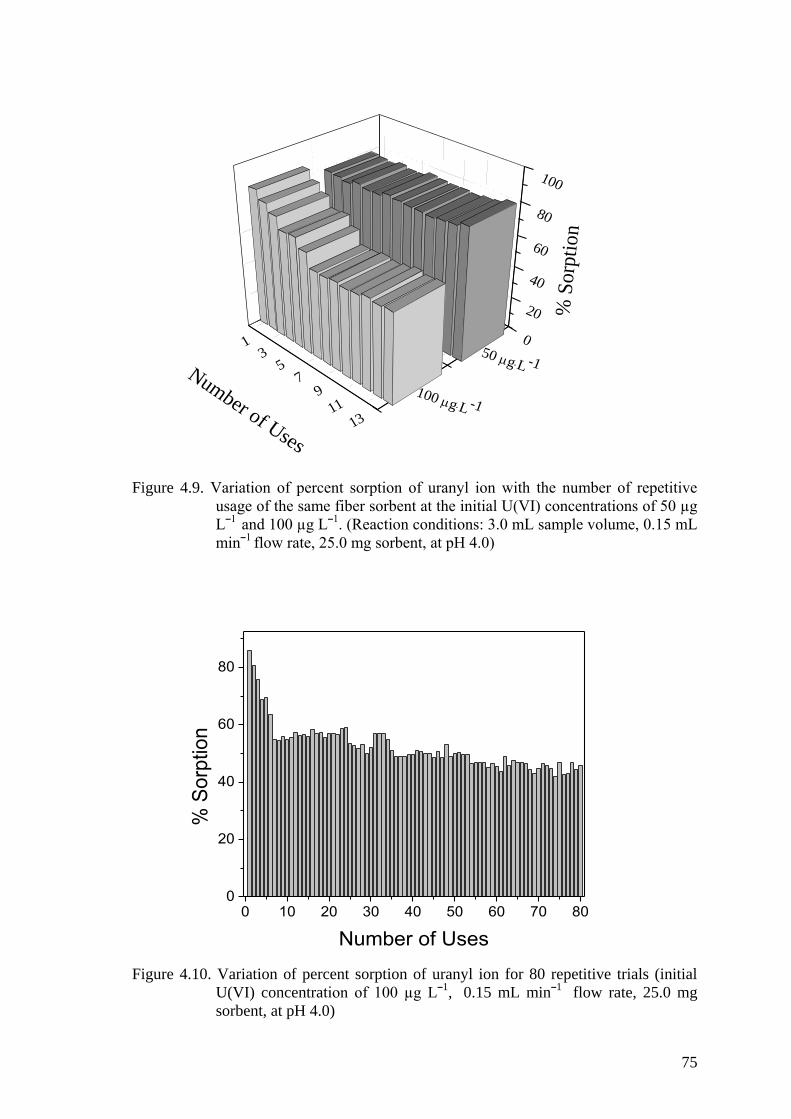
Figure 4.9. Variation of percent sorption of uranyl ion with the number of
repetitive usage of the same fiber sorbent at the initial U(VI)
concentrations of 50 µg Lˉ1
and 100 µg Lˉ1. (Reaction conditions: 3.0
mL sample volume, 0.15 mL minˉ1 flow rate, 25.0 mg sorbent, at pH
4.0) .............................................................................................................. 75
Figure 4.10. Variation of percent sorption of uranyl ion for 80 repetitive trials
(initial U(VI) concentration of 100 µg Lˉ1,
0.15 mL minˉ
1 flow rate,
25.0 mg sorbent, at pH 4.0) ......................................................................... 75
Page 16
xvi
Figure 4.11. Uranyl ion desorption as a function of eluted volume. (Reaction
conditions: The initial U(VI) concentration of 100 µg Lˉ1, 0.15 mL
minˉ1 flow rate, 25.0 mg sorbent) ............................................................... 77
Figure 4.12. Consecutive sorption/desorption cycles of amidoximated-PAN fiber
for 100 µg Lˉ1 of U(VI) solution using 0.5 M NaHCO3 as desorbing
agent. ........................................................................................................... 77
Figure 4.13. Speculative binding mechanism ................................................................ 78
Figure 5.1. Schematic representation for preparation of PVA/ZnO composite
fibers ........................................................................................................... 83
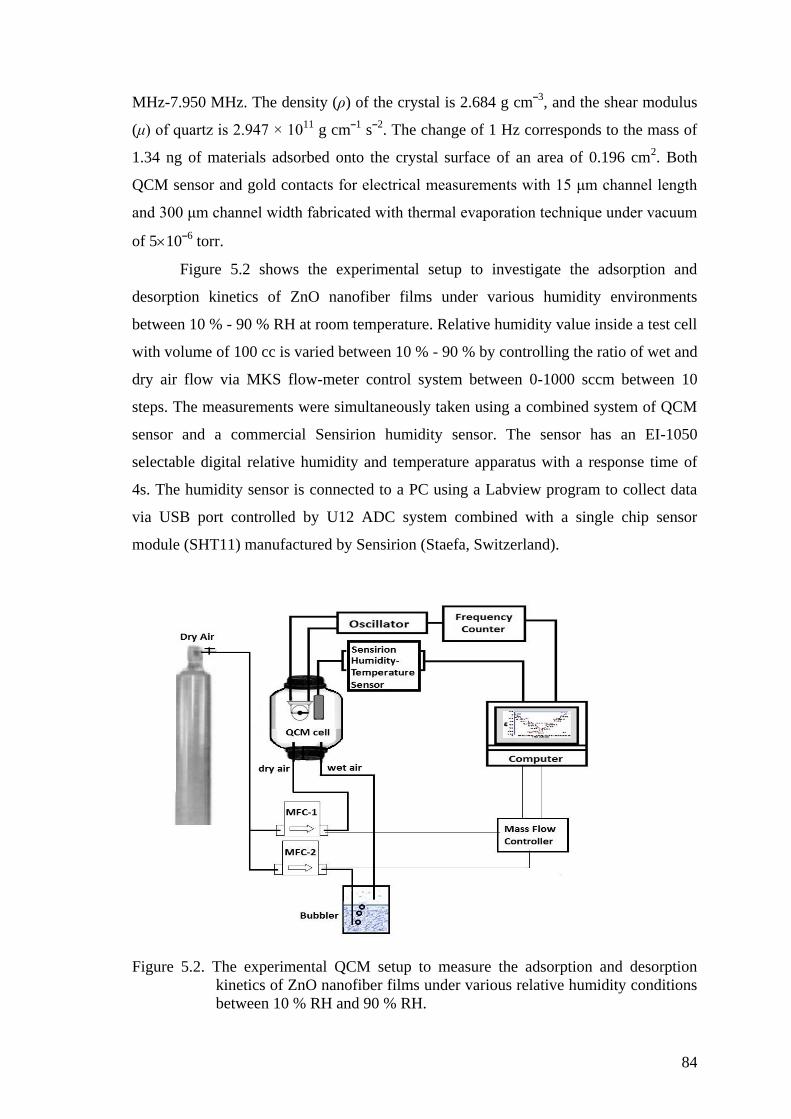
Figure 5.2. The experimental QCM setup to measure the adsorption and
desorption kinetics of ZnO nanofiber films under various relative
humidity conditions between 10 % RH and 90 % RH. .............................. 84
Figure 5.3. SEM micrographs of PVA/ZnO composite fibers and ZnO nanofibers
with respect to increasing amount of Zn(OAc)2.2H2O (a,e) 10 wt%,
(b,f) 14 wt%, (c,g) 17 wt%, (d,h) 20 wt% .................................................. 86
Figure 5.4. Average Fiber Diameter (AFD) versus percent weight of
Zn(OAc)2·2H2O .......................................................................................... 86
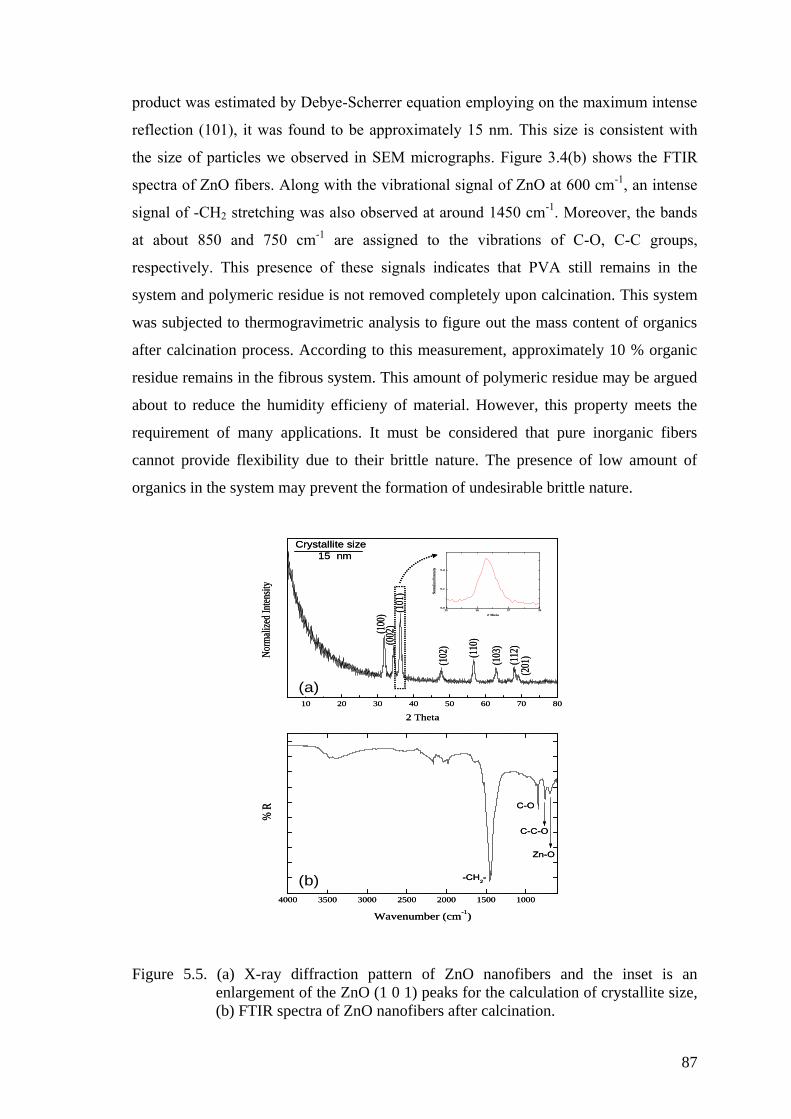
Figure 5.5. (a) X-ray diffraction pattern of ZnO nanofibers and the inset is an
enlargement of the ZnO (1 0 1) peaks for the calculation of crystallite
size, (b) FTIR spectra of ZnO nanofibers after calcination. ....................... 87
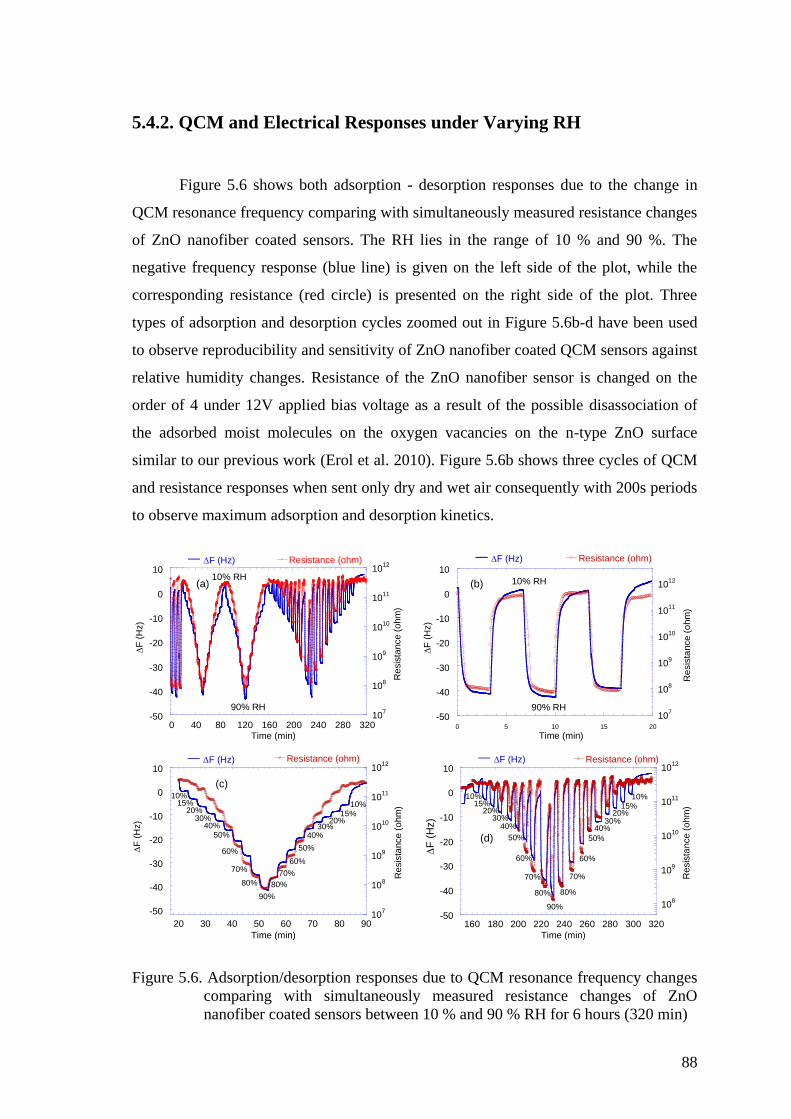
Figure 5.6. Adsorption/desorption responses due to QCM resonance frequency
changes comparing with simultaneously measured resistance changes
of ZnO nanofiber coated sensors between 10 % and 90 % RH for 6
hours (320 min) ........................................................................................... 88
Figure 5.7. Adsorption/desorption responses due to (a) QCM resonance frequency
and (b) resistance changes of ZnO nanofiber sensors comparing with
(c) relative humidity (RH) values simultaneously measured with a
Sensirion commercial RH sensor between 10 % and 90 % RH. (d) The
exponential relationship between QCM frequency and resistance
changes ........................................................................................................ 90
Figure 5.8. The least square fit (solid line) to the Langmuir adsorption isotherm
model given in equation (4) for the adsorbed water mass between 10
% - 84 % RH ............................................................................................... 93
Page 17
xvii
Figure 6.1. Scheme of the preparation of electrospun metal oxide fibers coated
QCM ........................................................................................................... 98
Figure 6.2. TGA termograms of PVA/(Zn(CH3COOH)2 and
PVA/(Zn(CH3COOH)2/Ce(NO3)3 fibers ................................................... 102
Figure 6.3. XRD patterns of CeO2/ZnO and ZnO fibers ............................................. 104
Figure 6.4. EDX spectra of electrospun (a) ZnO and (b) CeO2/ZnO fiber .................. 104
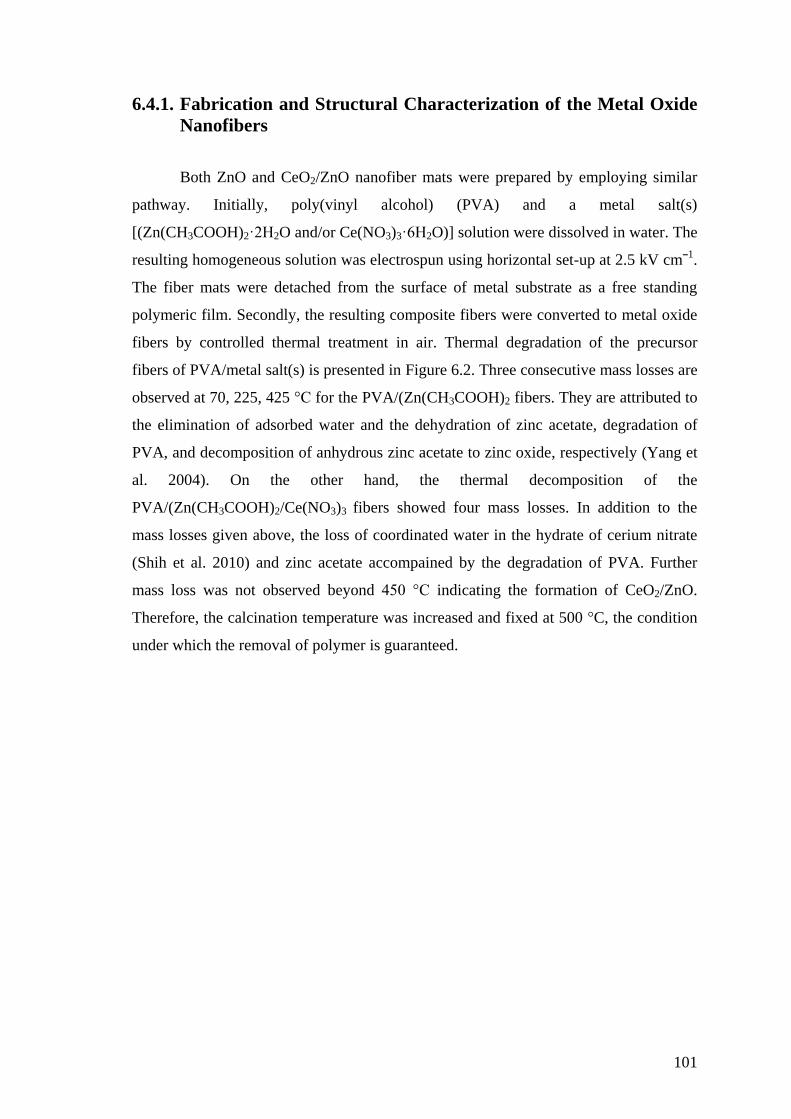
Figure 6.5. SEM micrographs and diameter distributions of (a) ZnO and (b)
CeO2/ZnO fiber ........................................................................................ 105
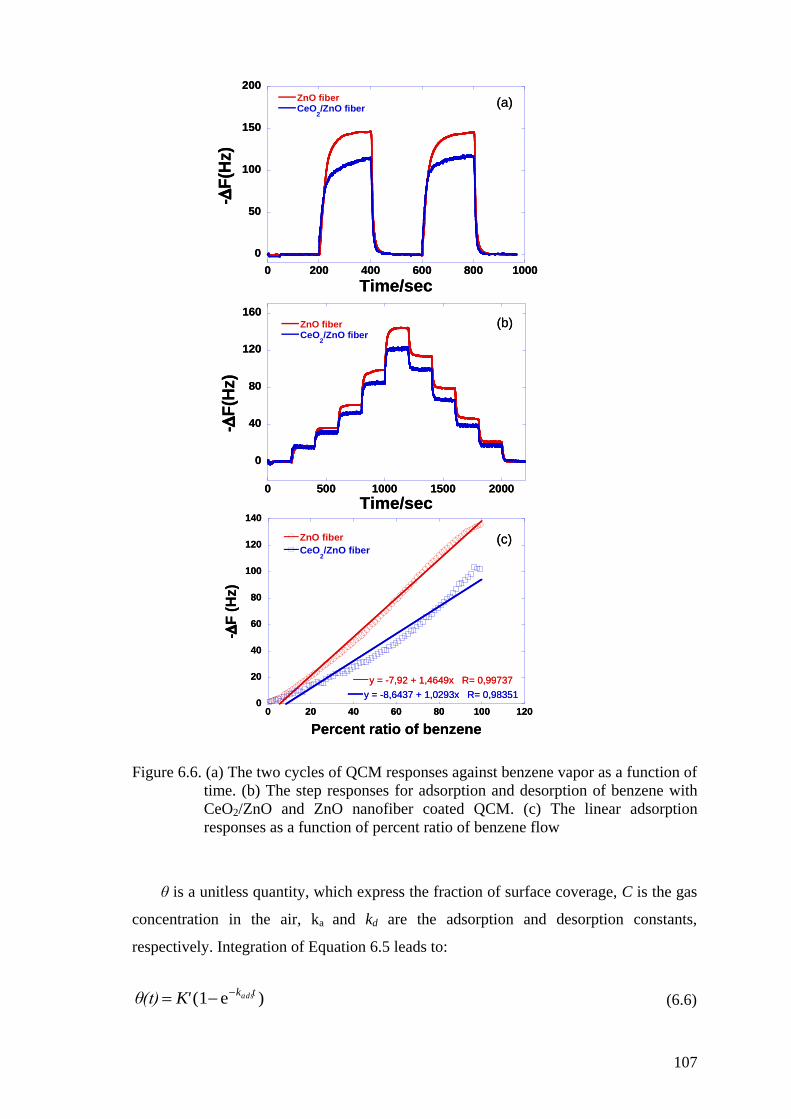
Figure 6.6. (a) The two cycles of QCM responses against benzene vapor as a
function of time. (b) The step responses for adsorption and desorption
of benzene with CeO2/ZnO and ZnO nanofiber coated QCM. (c) The
linear adsorption responses as a function of percent ratio of benzene
flow ........................................................................................................... 107
Figure 6.7. Least square fit (solid lines) using the Langmuir adsorption isotherm
model for 456 ppm benzene concentration ............................................... 109
Figure 6.8. FTIR spectra of (a) ZnO fibers and (b) CeO2/ZnO fibers, as prepared
(black curve) and after benzene vapor treatment (red curve) ................... 110
Figure 6.9. Sensitivity of the CeO2/ZnO and ZnO fiber coated sensor to benzene,
propanol, ethanol and dichloromethane vapor .......................................... 112
Figure 7.1. Scheme of the preparation of metal oxide (top) and metal oxide/silica
(bottom) fibers. The metal oxide fiber are brittle and yield a powder
material whereas the nanofibrous morphology is conserved by using
silica nanoparticles as structural framework ............................................. 121
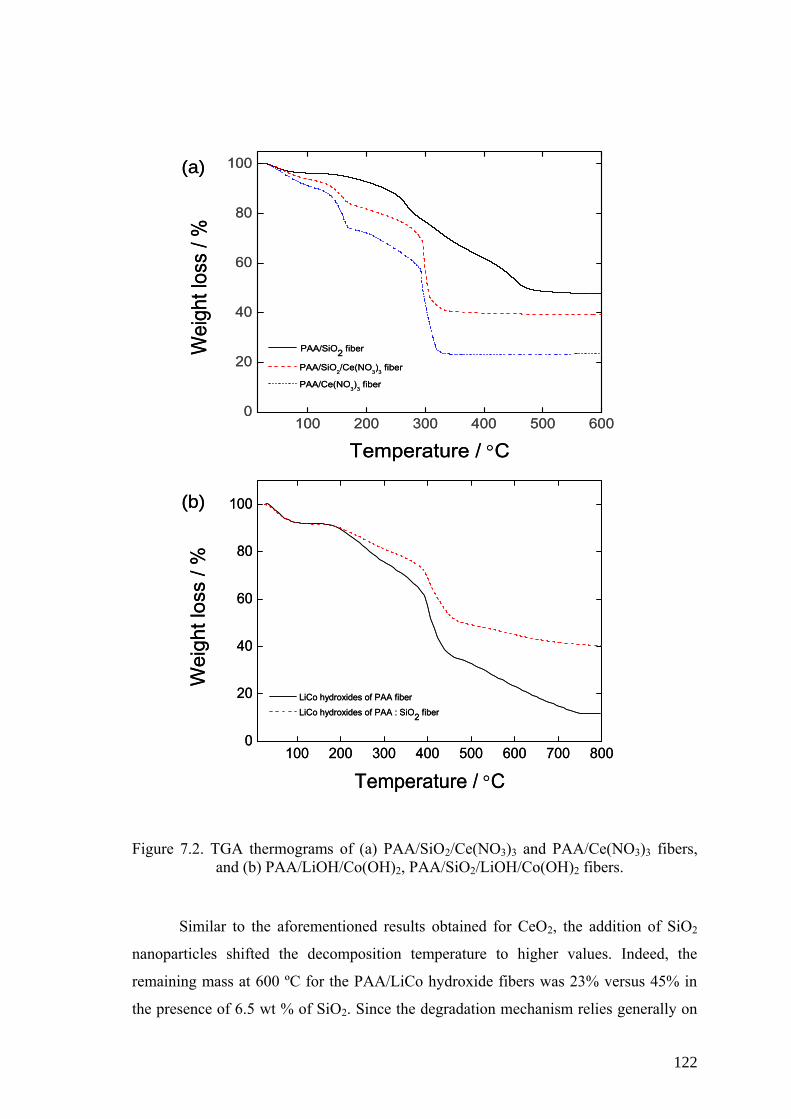
Figure 7.2. TGA thermograms of (a) PAA/SiO2/Ce(NO3)3 and PAA/Ce(NO3)3
fibers, and (b) PAA/LiOH/Co(OH)2, PAA/SiO2/LiOH/Co(OH)2 fibers. . 122
Figure 7.3. SEM micrographs of composite fibers as prepared: (a) PAA/SiO2; (b,
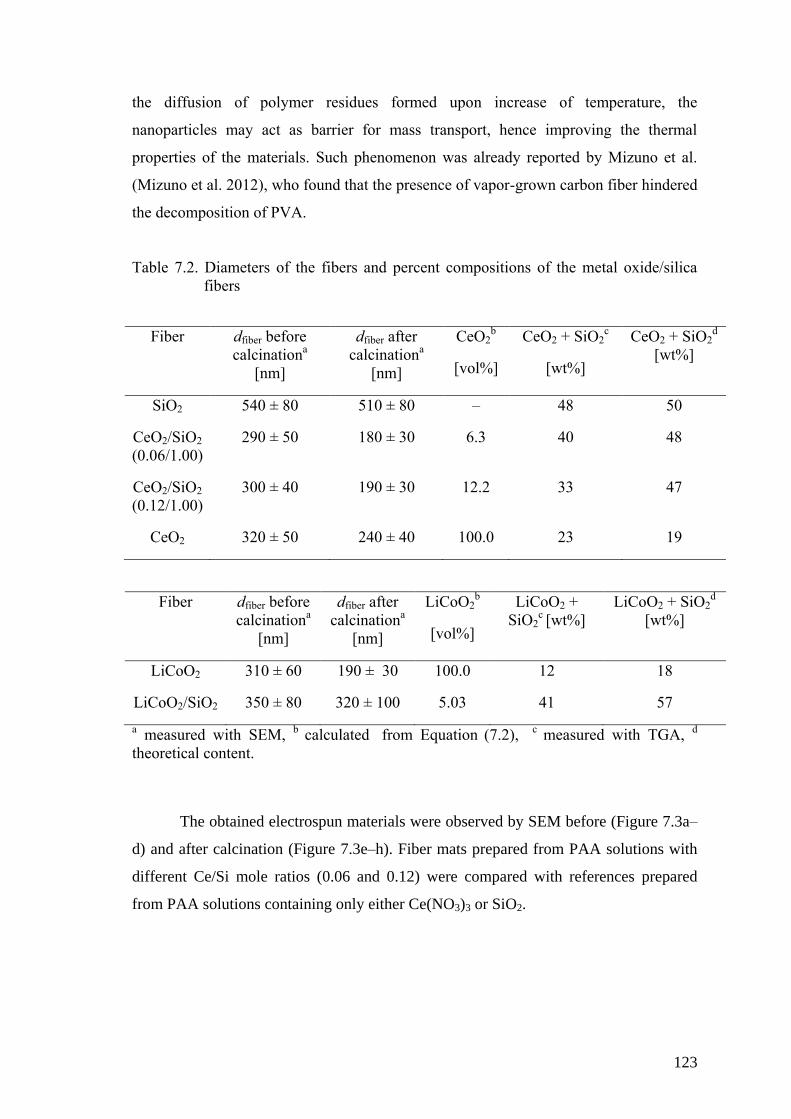
c) PAA/Ce(NO3)3/SiO2 with Ce/Si molar ratios of 0.06 and 0.12,
respectively, (d) PAA/Ce(NO3)3; and oxide fibers after calcination at
600 ºC: (e) SiO2, (f) CeO2/SiO2 (0.06/1.00), (g) CeO2/SiO2
(0.12/1.00), (h) CeO2 .......................................................................................................................... 124
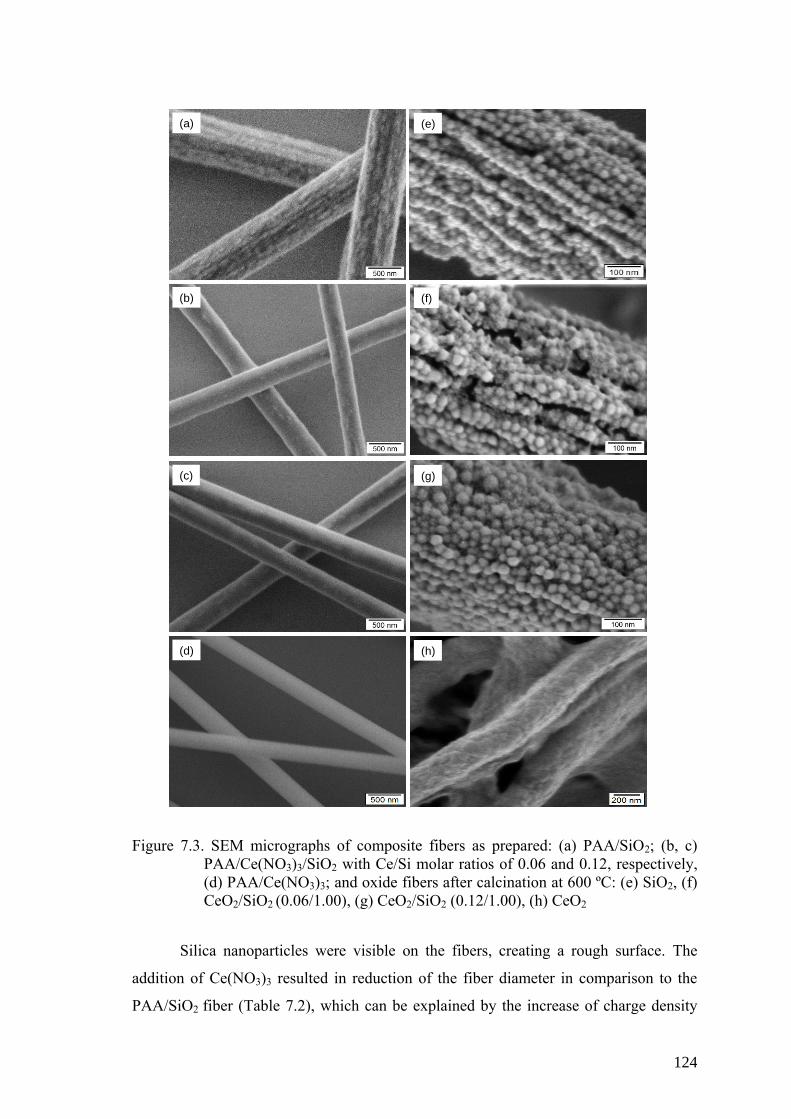
Figure 7.4. SEM micrographs of PAA/LiOH/Co(OH)2 precursor fibers after
calcination (a) at 300 ºC, (b) at 400 ºC and (c) PAA/LiOH/Co(OH)2/
SiO2 precursor fibers calcinated at 600 ºC ................................................ 125
Page 18
xviii
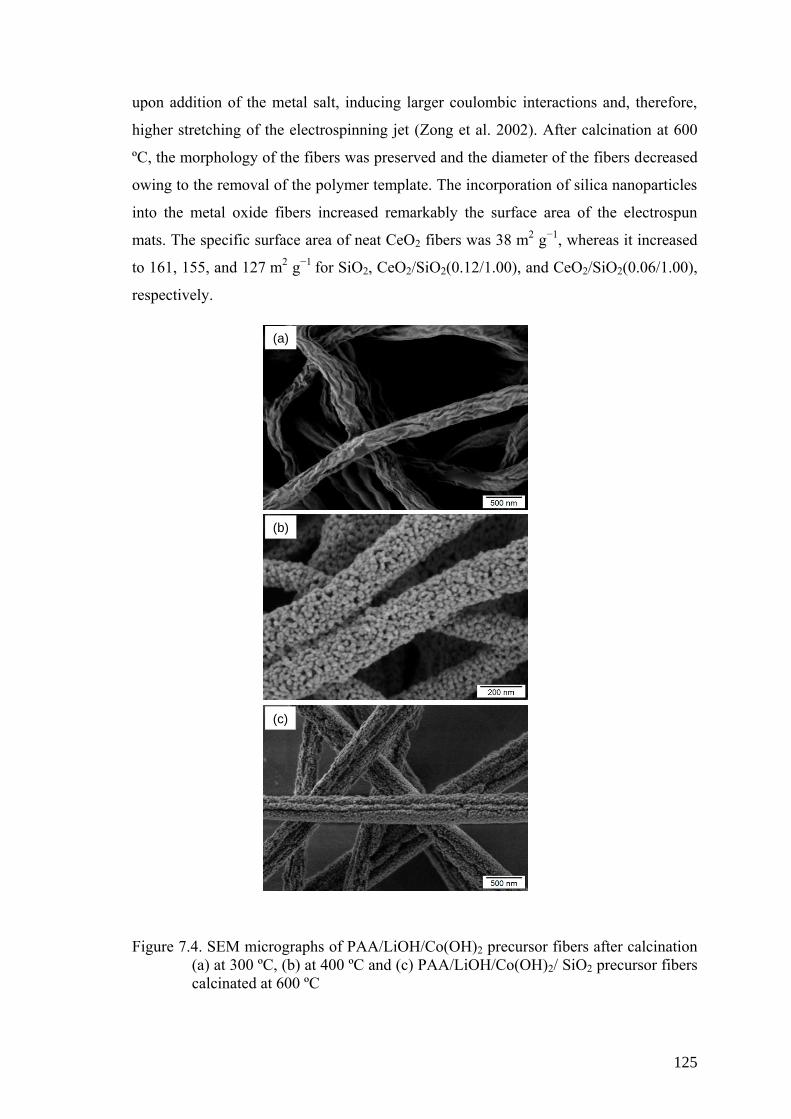
Figure 7.5. (a) XRD patterns of SiO2 fibers (blank) and CeO2 fibers prepared in
the absence and presence of SiO2 nanoparticles after calcination at 600
ºC; (b) XRD patterns of lithium cobalt oxide fibers prepared in the
absence and presence of SiO2 nanoparticles after calcination at 400 ºC
(the stars indicate reflections of Co3O4) .................................................... 127
Figure 7.6. (a) SEM micrograph of a LiCoO2/SiO2 fiber obtained by calcination at
600 ºC and (b) schematic representation of the simple geometrical
model used to calculate percent volume of LiCoO2/SiO2 nanoparticles .. 129
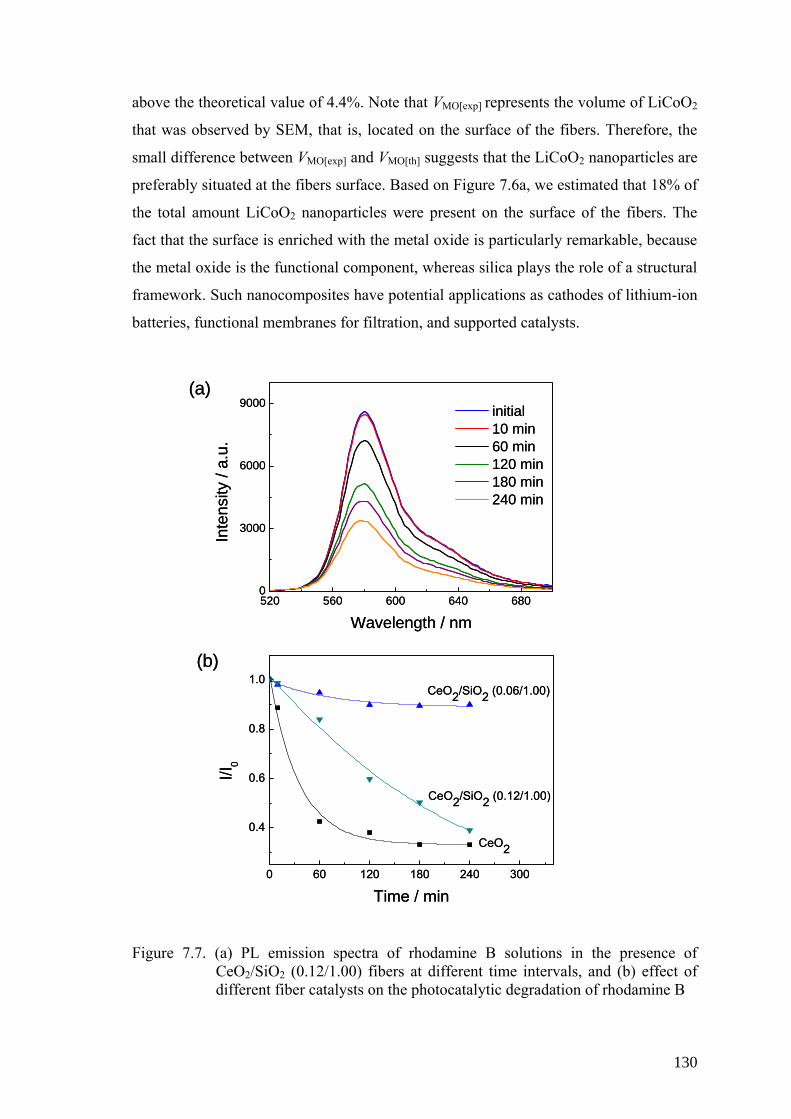
Figure 7.7. (a) PL emission spectra of rhodamine B solutions in the presence of
CeO2/SiO2 (0.12/1.00) fibers at different time intervals, and (b) effect
of different fiber catalysts on the photocatalytic degradation of
rhodamine B .............................................................................................. 130
Page 19
xix
LIST OF TABLES
Table Page
Table 2.1. ICP-MS Operation Parameters ..................................................................... 22
Table 2.2. Thermodynamic parameters of chitosan nanofibers (0.10 mg sorbent,
3.0 mL of 100.0 μg Lˉ1 Fe(III), Cu(II), Ag(I), Cd(II), at pH 6.0, n = 3) .... 33
Table 3.1. ICP-MS operation parameters ...................................................................... 41
Table 3.2. Summary of model coefficients (Solution volume, shaking time,
solution pH, sorbent amount and reaction temperature were 3.0 mL, 1
h, pH 6.0, 0.50 mg, and 25 °C, respectively, n = 3) .................................... 51
Table 4.1. Summary of sorption system suggested for uranium ................................... 60
Table 4.2. ICP-MS operation parameters ...................................................................... 63
Table 4.3. The weight percentages and atomic percentages (in brackets) of C, N,
O, and U in amidoximated-PAN fiber after column sorption ..................... 71
Table 6.1. Percent compositions and surface area characteristics of the metal
oxide fibers ................................................................................................ 102
Table 6.2. The values obtained using the Langmuir adsorption isotherm model for
456 ppm benzene concentration ................................................................ 109
Table 6.3. Properties of the volatile organic compounds ............................................ 111
Table 7.1. Optimized electrospinning parameters (tip-to-collector distance fixed at
14 cm) ....................................................................................................... 118
Table 7.2. Diameters of the fibers and percent compositions of the metal
oxide/silica fibers ...................................................................................... 123
Page 20
xx
LIST OF ABBREVIATIONS
AFD average fiber diameter
ATR attenuated total reflection
BET Brunauer-Emmett-Teller
BPO benzoyl peroxide
DD degree of deacetylation
DMF N,N-dimethylformamide
EDX energy dispersive X-ray
EPA environmental protection agency
FTIR fourier transform infrared spectrometer/spectrometry
HFIP 1,1,1,3,3,3-hexafluoroisopropanol
HSAB hard-soft acid base principle
HVAC heating, ventilating and air conditioning
IC ion chromatography
ICP-MS inductively coupled plasma-mass spectrometer/spectrometry
MCL maximum contamination levels
NF nanofiltration
NMR nuclear magnetic resonance
nZVI nano zero-valent iron
NNI national nanotechnology initiative
PAA polyacrylic acid
PAMAM poly(amidoamine)
PAN polyacrylonitrile
PEI polyethyleneimine
PEO poly(ethyleneoxide)
PL photoluminescence
PPX poly(p-xylene)
PVA polyvinyl alcohol
QCM quartz crystal microbalance
RH relative humidity
SAW surface acoustic wave
SEM scanning electron microscope/microscopy
Page 21
xxi
SMO semiconductor metal oxide
SPE solid phase extraction
STEM scanning transmission electron microscope/microscopy
TFA trifluoroacetic acid
TNT trinitrotoluene
TGA thermogravimetric analysis
TUFT tubes by fiber templates
VLS vapor−liquid−solid
VOCs volatile organic compounds
VS vapor−solid
WHO world health organization
XANES X-ray absorption near-edge spectroscopy
XAS X-ray absorption spectroscopy
XPS X-ray photoelectron spectroscopy
XRD X-ray diffraction
Page 22
1
CHAPTER 1
INTRODUCTION
Nanoscience and nanotechnology represents the application of extremely small
devices in what is science, engineering, and technology performed on a nanoscale -
considered to be a scale between 1 and 100 nanometers. Nanotechnology may be
performed in all areas of science including chemistry, biology, physics, materials
science, and engineering in what is not just a new field of science, but a new way of
looking and studying.
A famous speech entitled “There’s Plenty of Room at the Bottom” by physicist
Richard Feynman introduced the ideas and concepts behind nanoscience and
nanotechnology at an American Physical Society meeting at the California Institute of
Technology on December 29, 1959 (Feynmann 1959). In his talk, Feynman described a
process in which scientists would be in a position to manipulate and control individual
atoms and molecules. Some 15 years after this groundbreaking speech, Professor Norio
Taniguchi used the term nanotechnology in his explorations of ultraprecision machining
(Taniguchi 1974). When K. Eric Drexler popularized the word 'nanotechnology' in the
1980's, he was referring specifically to constructing microscoping machines on a
molecular scale; motors, robot arms, and even whole computers just a few nanometers
wide, far smaller even than a cell (Drexler 1986). The science of nanotechnology in its
modern form gained prominence in 1981, spurred on by the emergence of the scanning
tunneling microscope that could observe individual atoms. As the concept of
nanotechnology gained wider acceptance, the meaning of the word shifted to encompass
the simpler kinds of nanometerscale technology. The U.S. National Nanotechnology
Initiative (NNI) was established in 2001 to fund such nanotechnology: their definition
includes anything smaller than 100 nanometers with novel properties.
1.1. Motivation
Long before people started to make nanomaterials, they were found in the
natural environment. Nanomaterials have a wide array of natural sources which can be
Page 23
2
found throughout the natural environment. The nanosphere is host to a number of
enzymes and viruses. While it may be considered improper to copy the ideas of others,
scientists find that they can use the work of Mother Nature as a template. The natural
presence of nanomaterials provides an inspiring way of bridging nanoscience into the
classroom. Discovering that common natural materials which we use in our everyday
lives such as paper and clay, or materials such as feathers and spider silk or materials,
have properties that depend not only on their chemistry but also on their nanostructure
is especially inspiring.
The process of electrospinning, which was inspired by nature, was established to
mechanically produce nanofibers from different functional materials. The
electrospinning technology is being applied by the Donaldson Company, Inc. and the
Freudenberg Nonwovens Group to manufacture high-quality filtering media. One
subject of research is the advancement of this technology to produce more novel
functional nanofibers (Greiner and Wendorff 2007, Li and Xia 2004, Reneker and Chun
1996). However, it is not just from the point of view of life sciences that the study of
fiber fabrication is of interest – it is also from of interest from the point of view of
industrial applications as well. A number of unique features and properties may be
found in electrospun nanofibers including 1D morphology, extraordinary length, high
surface area and a hierarchically porous structure (Li and Xia 2004). One further
important feature is that they can be easily prepared as membranes (supported or free-
standing, and nonwoven or woven) and which can be conveniently handled and
manipulated during an application. Nanofiber mats are especially well suited for many
membrane-based applications, including filtration and separation, sensors, and as
substrates/supports for catalysts.
The controlling the surface chemistry of nanofibers, has become an active
research field in the last two decades, because of the increasing interest in fabricating
materials with the superior properties, crucial in many applications (Agarwal et al.
2010, Venugopal and Ramakrishna 2005, Wang, Wan, et al. 2009). The functionality of
the nanofibrous scaffold can be controlled through suitable surface modification
schemes for different applications (Gibson et al. 2001). Chu et al. demonstrated that
electrospun nanofibrous scaffolds can be used as a highly efficient microfiltration media
to remove bacteria, viruses, dyes (Ma, Burger, et al. 2012, Wang, Liu, et al. 2012). The
removal of heavy metal ions from wastewater using electrospun nanofiber membranes
is primarily based on the interactions between the functional sites on the nanofiber
Page 24
3
surface and the heavy metal ions. The interactions involved can be physical (e.g.
affinity or electrostatic interactions) or chemical (e.g. chelating or coordination complex
formation) (Rivas and Maureira 2008). Therefore, the nature of functionality on the
nanofiber surface is the primary factor that determines the capability of toxic metal
removal. On the other hand, the nanofibrous scaffold itself is an effective microfiltration
medium. This dual functionality (efficient microfiltration capability with excellent
surface functionality) forms the essence in achieving a good design for separation
membranes that can effectively remove toxic metals in contaminated water sources as
well as performing the typical microfiltration role (Ma et al. 2013).
Although many polymeric materials have been electrospun into nanofibers, the
capability of electrospinning has been successfully extended to fabricate more than 100
different types of ceramic nanofibers through a combination of the sol-gel method (Dai
et al. 2011). Additionally, the excellent semiconducting property of some materials (eg.
ZnO, CeO2, etc.) render them good candidates as sensors for undesirable volatile
organic compounds. Tremendous progress has been achieved in the development of
ultrasensitive sensors in response to the imperative needs for more timely and reliable
detections in environmental monitoring, food inspection and medical diagnostics (Ding
et al. 2010, Huang et al. 2003, Wang et al. 2002). As well as the relatively large specific
surface area and high porosity of electrospun ceramic nanomaterials, deposition of
homogeneous nanostructured coating on the surface of the substrate such as electrode,
QCM, etc. can be obtained through electrospinning to improve the sensor sensitivity.
When it comes removing organic molecules in an aqueous solution and in air
flow, Electrospun ceramic nanofibers also provide an attractive class of solid support for
catalysts (Zhan et al. 2007, Kanjwal et al. 2010, Kanjwal et al. 2011). The supporting
material has been proven to have a significant impact on the performance of a
heterogeneous catalyst, in a mechanism known as synergistic effect. A sound support
should be a stable, a good electron-conductor and offer a significant surface area.
Nevertheless, it should be emhasised that the as-spun inorganic/polymer mats are very
flexible and easy to remove and handle over large areas, while the porous ceramic mats
are fragile and tend to break into small pieces. Such a lack of mechanical strength
undoubtedly restricts their board applications. Therefore, new ceramic nanofibers are
still in great demand in overcoming this issue and in electrospinning. A new concept for
the preparation of nanofibrous metal oxides based on the simultaneous electrospinning
of metal oxide precursors and silica nanoparticles was presented by Horzum et al.
Page 25
4
(Horzum et al. 2012). In the study, the obtained continuous silica fibers were found to
act as a structural framework for metal oxide nanoparticles and exhibited improved
mechanical integrity compared to the neat metal oxide fibers.
1.2. Structure and Scope of the Thesis
Each chapter of this thesis, with the logical exception of the general introduction
(Chapter 1) and the conclusive chapter (Chapter 8), is organized in the same manner: a
theoretical section, which reviews important theoretical concepts and the fundamentals
of the experimental methods, followed by the experimental details; and a discussion of
the results and the main conclusions are provided at the end of the chapter.
The first part of the work (Chapter 2) deals with the fabrication and
characterization of the chitosan nanofibrous scaffold used as a sorbent for the removal
of undesirable metal ions through sorption from contaminated water. While these
membranes are already considered as superior microfiltration media, given their higher
permeation flux and lower pressure drop performance than conventional microfiltration
membranes, they also have a high surface area-to-volume ratio. The sorption efficiency
of chitosan nanofiber was compared to that of powder and checked with a mixture of Cu
(II), Fe (III), Ag (I) and Cd (II) ions by both batch and column methods. The
Electrospun nanofibers also provide a surface which can be further modified to remove
toxic metal ions with enhanced capability. In Chapter 3, chitosan fibers were decorated
with nanoscale zero-valent iron (nZVI) particles for sequestration of inorganic arsenic
species. The obtained chitosan fibers-supported nZVI particles overcome disadvantages
such as agglomeration of the magnetic nZVI nanoparticles, and pH limitation of
chitosan, particularly in acidic environment by combining the integrated high surface
area of both nanoparticles and electrospun fibers,. After characterization of the chitosan-
nZVI samples before and after the removal of As(III) and As(V), the estimation of the
sorption mechanisms is discussed. nZVI particles were deposited on electrospun mat by
mixing the metal precursor with the fiber, then followed by reducing metal cations in a
reducing media. In Chapter 4, the nitrile groups on the polyacrylonitrile (PAN) fibers’
surface were modified to amidoxime groups by solution process. The sorption
efficiency of amidoxime-modified fiber were determined for the removal of radioactive
Page 26
5
and chemically toxic U(VI) ions from aqueous systems via column sorption under
continuous flow.
Studies were performed of the fabrication of electrospun metal oxide fibers and
their sensing applications. ZnO nanofibers were applied as a humidity sensor. (Chapter
5) Next, ZnO and CeO2/ZnO nanofibers were exampled in an effort to sense volatile
organic compounds (VOCs). (Chapter 6). The determination of the sensing ability of
the nanofibers was determined with the help of QCM technique. The synthetic pathway
for the coating of the QCM electrode and formulations used are represented.
A new concept for the preparation of nanofibrous metal oxides based on the
simultaneous electrospinning of metal precursors and silica nanoparticles is set out in
Chapter 7. Metal oxide/silica nanofibers hierarchically structured by colloid
electrospinning were exemplified for the cases of CeO2 and LiCoO2 as models and the
catalytic activity of the composite nanofibers were also described.
The main theme of this study is to extend the work to the filtration applications
of electrospun nanofibrous mats with different chemical nature and investigate the
influence of their structure on the morphology and sorption efficiency of the resulting
materials.
1.3. State of the Art: Electrospinning
The process of electrostatic fiber spinning, or “electrospinning,” involves
electrostatic forces in the ejection a charged fluid jet from a nozzle to construct a fiber.
On the whole, the fiber is laid down on a collector to form a nonwoven mat, an example
of which is shown in Figure 1.1. In an example from the rapidly growing domain of
electrospinning, tissues can be made of fibers that are too thin to be observed under the
most senstive optical microscope, polymer webs can be placed on plants which are
more intricate than spider’s webs, and filters can be covered by a “whiff of nothing” (as
it was once referred to by J. C. Binzer) that increases their effectiveness immensely, or
wound dressings can be made of gossamer fibers carrying a medical agent, enabling
faster healing.
Page 27
6
Figure 1.1. (a) Photographic image of electrospun chitosan nonwoven mat, (b) SEM
micrograph of the chitosan nanofibers
The technology of electrospinning has its basis in early studies. The first record
of the electrostatic attraction of a liquid was observed in 1600 by William Gilbert
(Tucker et al. 2012). In 1745, Bose described aeresols generated by the application of
high electric potentials to drops of fluids (Bose 1745). Christian Friedrich Schönbein
produced highly nitrated cellulose in 1846. In 1882, Lord Rayleigh investigated the
question of how many charges are needed to overcome the surface tension of a drop
(Rayleigh 1882). In 1887 Charles Vernon Boys described the process in a paper on
nano-fiber manufacture. John Francis Cooley filed the first electrospinning patent in
1900. Later, the first devices to spray liquids through the application of an electrical
charge were patented by Cooley and Morton, in 1902 and 1903 (Cooley 1902, 1903,
Morton 1902). In 1914, Zeleny presented one of the earliest studies of the electrified
jetting phenomenon (Zeleny 1917). In 1929, Hagiwaba et al. described the fabrication
of artificial silk through the use of electrical charge (Hagiwaba et al. 1929).
The crucial patent, in which the electrospinning of plastics was described for the
first time, appeared in 1934 with Anton Formhals from Mainz as the author (and can be
traced back to a German patent filing in 1929) (Formhals 1934). Despite these early
discoveries, the procedure was not utilized commercially. In 1938, N.D. Rozenblum and
I.V. Petryanov-Sokolov generated electrospun fibers, which they developed into filter
materials. Between 1964 and 1969 Sir Geoffrey Ingram Taylor produced the beginnings
of a theoretical underpinning of electrospinning by mathematically modelling the shape
of the (Taylor) cone formed by the fluid droplet under the effect of an electric field
(Taylor 1969, Taylor 1966). However, the practice of electrospinning technology
remained largely dormant until the 1970s. Simm et al. patented the production of fibers
with diameters of less than 1 mm in the 1970s (Simm et al. 1972). However, this work,
which was followed by other patents, also remained unnoticed. Similarly, in
(a) (b) (a) (b)
Page 28
7
electrospinning research, only a few publications appeared in the 1970s and 1980s,
notably by Baumgartner (Baumgarten 1971) and by Larrondo and St. John Manley
(Larrondo and Manley 1981). In Baumgartner’s experiment, a glass capillary was filled
with an acrylic polymer solution. A charged wire was inserted into the capillary. There
was no flow rate control; once a critical voltage was applied, a fluid jet ejected out from
the capillary tip. The effect of humidity on the electrospinning process was studied.
High humidity caused the fluid jet to dry improperly. Larrondo and Manley
demonstrated the feasibility of electrospinning polymer melt instead of a solution. A
melt extruder was used to deliver a polyethylene to a charged capillary. The electrospun
fibers were about 10 microns in diameter.
In the 1990s, a great interest in electrospinning research was generated when
Reneker and co-workers reintroduced this technique as a facile way to make submicron
fibers (Srinivasan and Reneker 1995, Reneker and Chun 1996, Fang and Reneker 1997,
Doshi and Reneker 1995, Kim and Reneker 1999). Since then, it has been shown that
almost any material that can be spun from melt or solution by conventional methods can
likely be electrospun into fibers.
Researchers also experimented with novel electrospinning devices. A
miniaturized version of the electrospinning device was made using microfabrication
technique (Kameoka et al. 2003). The micro-elecrospinning device acts like a scanning
tip, depositing the fiber in a well-aligned way. In another device, a series of large
capillaries is placed in line to electrospinning multiple fibers at the same time to
increase productivity (Fang et al. 2006). Additionally, some electrospinning devices do
not have the capillary tube at all; they are nozzle-less. Charges are injected directly into
the fluid using needle-shaped electrodes (Yarin and Zussman 2004a). A commercial
electrospinning is available for scale-up production as well (NanoSpiderTM
developed
by Elmarco).
1.3.1. Description of the General Equipment
Electrospinning is a simple and easily controlled process in the production of
fibers with dimensions down to a nanometer scale. First of all, polymers will be
surveyed as fiber forming materials. Later, materials such as metals, ceramics, and
glasses will be considered as fiber precursors. In a typical electrospinning experiment in
Page 29
8
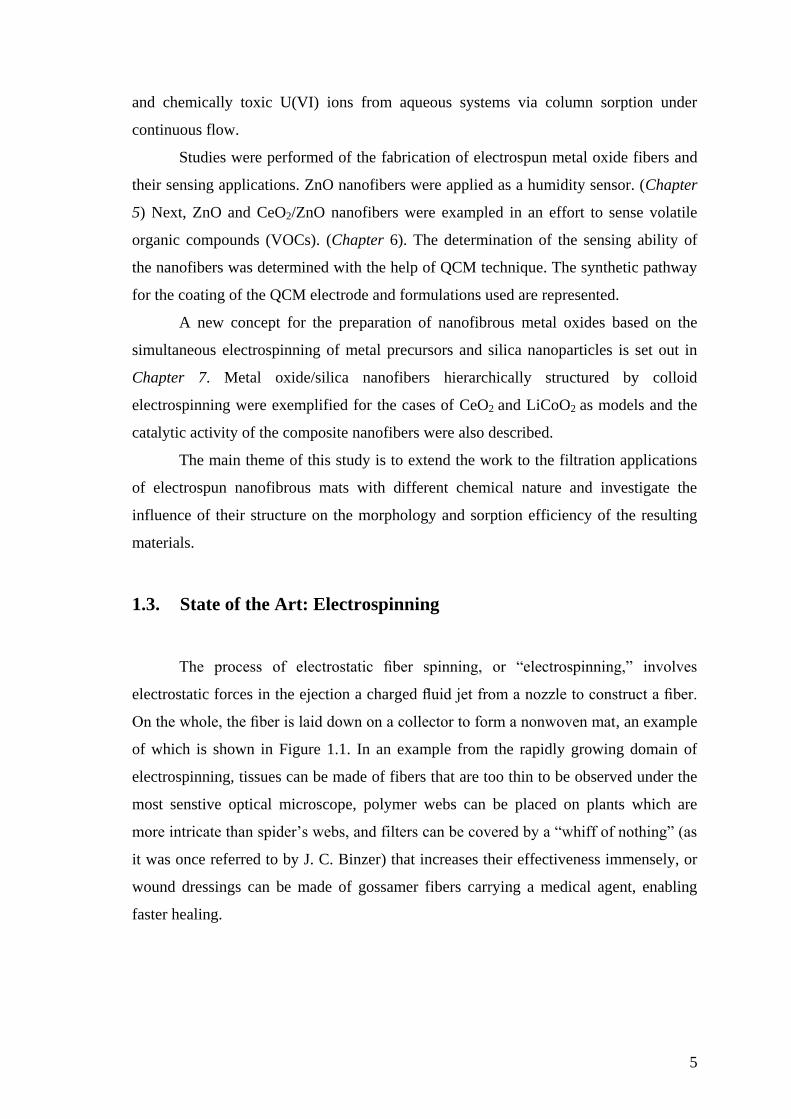
a laboratory, a polymer solution or melt is pumped through a thin nozzle with an inner
diameter on the order of 100 mm (Figure 1.2). The nozzle simultaneously serves as an
electrode, to which a high electric field of 100–500 kV mˉ1 is applied, and the distance
to the counter electrode is 10–25 cm in laboratory systems. The currents that flow
during electrospinning range from a few hundred nanoamperes to microamperes. The
substrate on which the electrospun fibers are collected is typically brought into contact
with the counter electrode. Electrospinning can be carried out both “from bottom to top”
or horizontally and “from top to bottom” or vertically.
Figure 1.2. The electrospinning set up in our laboratory
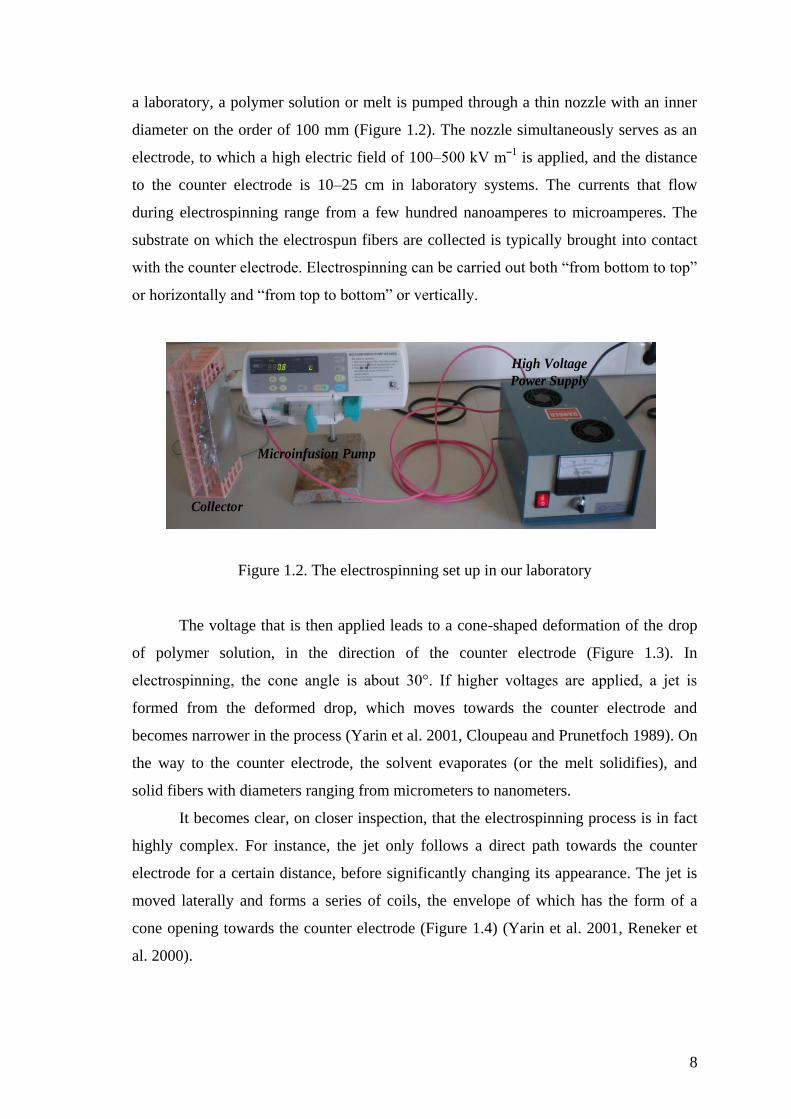
The voltage that is then applied leads to a cone-shaped deformation of the drop
of polymer solution, in the direction of the counter electrode (Figure 1.3). In
electrospinning, the cone angle is about 30°. If higher voltages are applied, a jet is
formed from the deformed drop, which moves towards the counter electrode and
becomes narrower in the process (Yarin et al. 2001, Cloupeau and Prunetfoch 1989). On
the way to the counter electrode, the solvent evaporates (or the melt solidifies), and
solid fibers with diameters ranging from micrometers to nanometers.
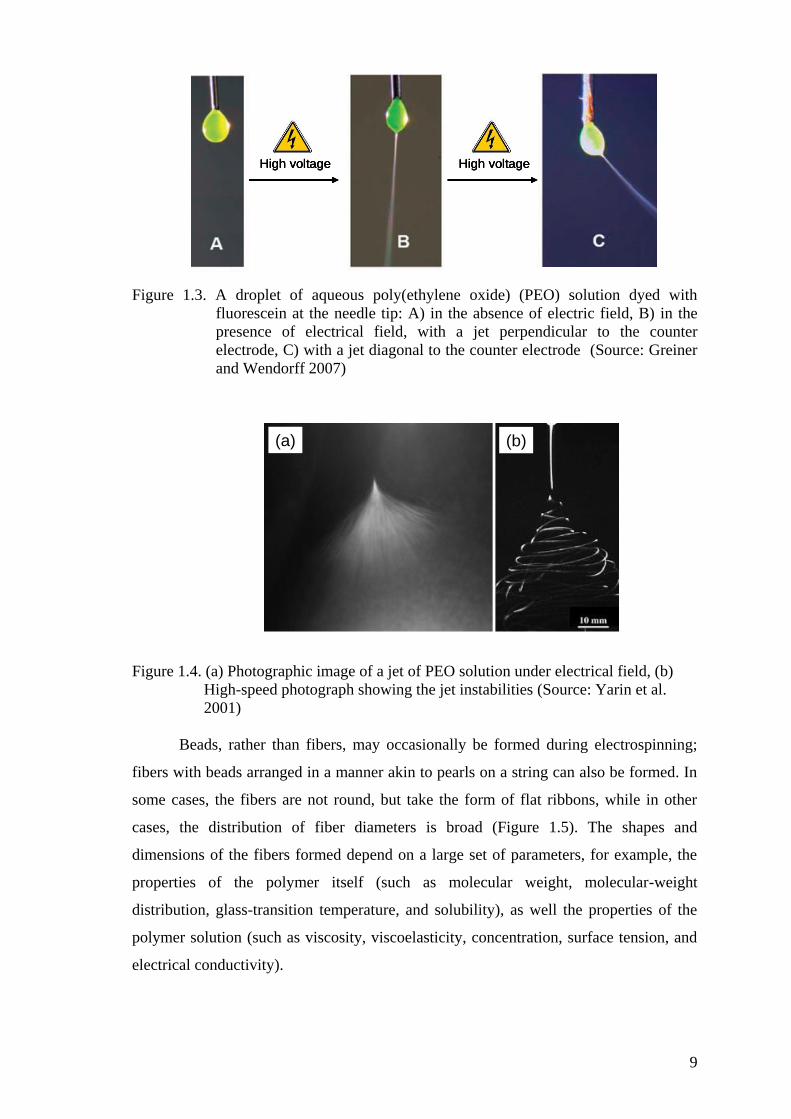
It becomes clear, on closer inspection, that the electrospinning process is in fact
highly complex. For instance, the jet only follows a direct path towards the counter
electrode for a certain distance, before significantly changing its appearance. The jet is
moved laterally and forms a series of coils, the envelope of which has the form of a
cone opening towards the counter electrode (Figure 1.4) (Yarin et al. 2001, Reneker et
al. 2000).
High Voltage
Power Supply
Collector
Microinfusion Pump
High Voltage
Power Supply
Collector
Microinfusion Pump
Page 30
9
Figure 1.3. A droplet of aqueous poly(ethylene oxide) (PEO) solution dyed with
fluorescein at the needle tip: A) in the absence of electric field, B) in the
presence of electrical field, with a jet perpendicular to the counter
electrode, C) with a jet diagonal to the counter electrode (Source: Greiner
and Wendorff 2007)
Figure 1.4. (a) Photographic image of a jet of PEO solution under electrical field, (b)
High-speed photograph showing the jet instabilities (Source: Yarin et al.
2001)
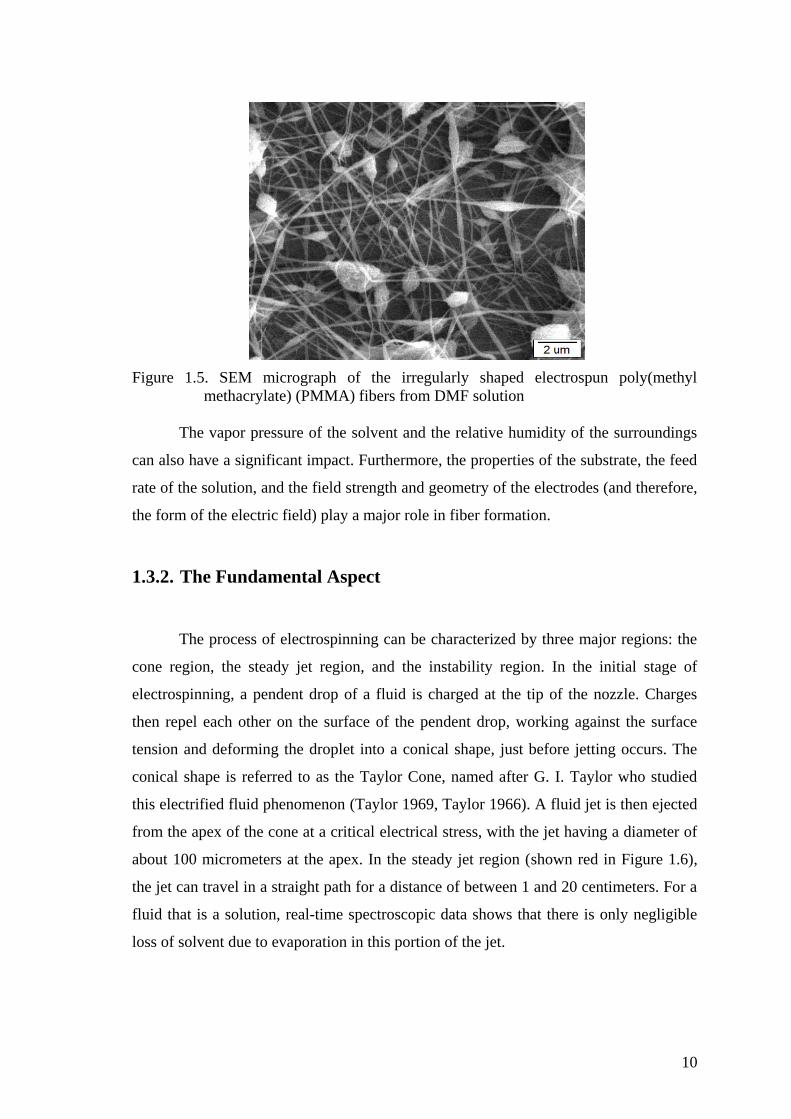
Beads, rather than fibers, may occasionally be formed during electrospinning;
fibers with beads arranged in a manner akin to pearls on a string can also be formed. In
some cases, the fibers are not round, but take the form of flat ribbons, while in other
cases, the distribution of fiber diameters is broad (Figure 1.5). The shapes and
dimensions of the fibers formed depend on a large set of parameters, for example, the
properties of the polymer itself (such as molecular weight, molecular-weight
distribution, glass-transition temperature, and solubility), as well the properties of the
polymer solution (such as viscosity, viscoelasticity, concentration, surface tension, and
electrical conductivity).
High voltage High voltageHigh voltageHigh voltage High voltageHigh voltage
(a) (b)(a) (b)
Page 31
10
Figure 1.5. SEM micrograph of the irregularly shaped electrospun poly(methyl
methacrylate) (PMMA) fibers from DMF solution
The vapor pressure of the solvent and the relative humidity of the surroundings
can also have a significant impact. Furthermore, the properties of the substrate, the feed
rate of the solution, and the field strength and geometry of the electrodes (and therefore,
the form of the electric field) play a major role in fiber formation.
1.3.2. The Fundamental Aspect
The process of electrospinning can be characterized by three major regions: the
cone region, the steady jet region, and the instability region. In the initial stage of
electrospinning, a pendent drop of a fluid is charged at the tip of the nozzle. Charges
then repel each other on the surface of the pendent drop, working against the surface
tension and deforming the droplet into a conical shape, just before jetting occurs. The
conical shape is referred to as the Taylor Cone, named after G. I. Taylor who studied
this electrified fluid phenomenon (Taylor 1969, Taylor 1966). A fluid jet is then ejected
from the apex of the cone at a critical electrical stress, with the jet having a diameter of
about 100 micrometers at the apex. In the steady jet region (shown red in Figure 1.6),
the jet can travel in a straight path for a distance of between 1 and 20 centimeters. For a
fluid that is a solution, real-time spectroscopic data shows that there is only negligible
loss of solvent due to evaporation in this portion of the jet.
Page 32
11
Figure 1.6. The schematic representation of the instantaneous position of the path of a
electrospinning jet that contained three successive electrical bending
instabilities (Source: Reneker and Yarin 2008)
The jet deviates from its straight path in the instability region, and undergoes an
instability referred to as bending or whipping instability (Hohman et al. 2001b, a,
Reneker et al. 2000, Yarin et al. 2001).This region may also be examined as three
segments. The jet path continued and transformed to a smaller three-dimensional coil,
with an axis that followed the curved path extrapolated from the first coil. The second
spiral eventually transformed to an even smaller spiral and so forth until the jet
solidified, by evaporation of the solvent. After the onset of the electrically driven
bending instability in electrospinning, every segment of the resulting coil moved
outward and downward in a complicated, but not random way.
1.3.3. Potential Applications
The technique of electrospinning is remarkably simple and powerful when it
comes to generating fibers which are ultra-thin from a wide array of different materials.
This technique and resultant structures are attractive for a number of applications thanks
Page 33
12
to the simplicity of the fabrication scheme, the diversity of materials which are suitable
for use with electrospinning, as well as the unique and interesting features associated
with electrospun nanofibers. The potential application areas of electrospun nanofibers
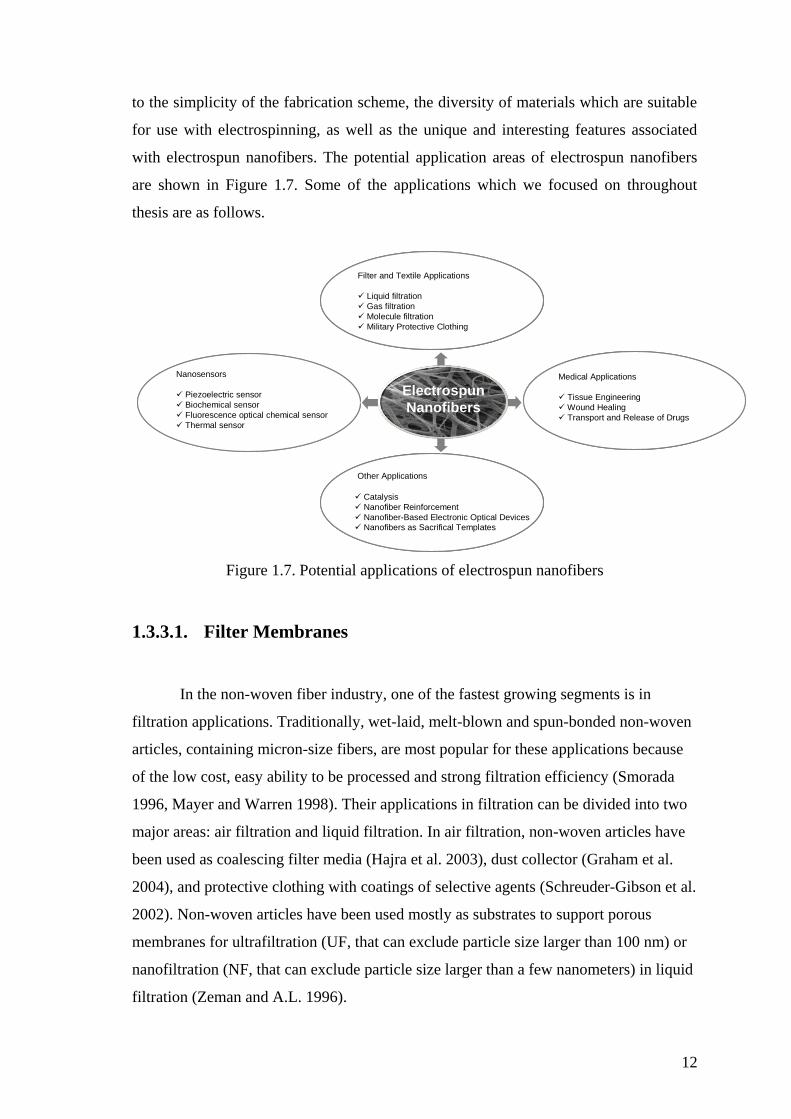
are shown in Figure 1.7. Some of the applications which we focused on throughout
thesis are as follows.
Figure 1.7. Potential applications of electrospun nanofibers
1.3.3.1. Filter Membranes
In the non-woven fiber industry, one of the fastest growing segments is in
filtration applications. Traditionally, wet-laid, melt-blown and spun-bonded non-woven
articles, containing micron-size fibers, are most popular for these applications because
of the low cost, easy ability to be processed and strong filtration efficiency (Smorada
1996, Mayer and Warren 1998). Their applications in filtration can be divided into two
major areas: air filtration and liquid filtration. In air filtration, non-woven articles have
been used as coalescing filter media (Hajra et al. 2003), dust collector (Graham et al.
2004), and protective clothing with coatings of selective agents (Schreuder-Gibson et al.
2002). Non-woven articles have been used mostly as substrates to support porous
membranes for ultrafiltration (UF, that can exclude particle size larger than 100 nm) or
nanofiltration (NF, that can exclude particle size larger than a few nanometers) in liquid
filtration (Zeman and A.L. 1996).
Filter and Textile Applications
Liquid filtration
Gas filtration
Molecule filtration
Military Protective Clothing
Medical Applications
Tissue Engineering
Wound Healing
Transport and Release of Drugs
Nanosensors
Piezoelectric sensor
Biochemical sensor
Fluorescence optical chemical sensor
Thermal sensor
Other Applications
Catalysis
Nanofiber Reinforcement
Nanofiber-Based Electronic Optical Devices
Nanofibers as Sacrifical Templates
Electrospun
Nanofibers
Filter and Textile Applications
Liquid filtration
Gas filtration
Molecule filtration
Military Protective Clothing
Filter and Textile Applications
Liquid filtration
Gas filtration
Molecule filtration
Military Protective Clothing
Medical Applications
Tissue Engineering
Wound Healing
Transport and Release of Drugs
Medical Applications
Tissue Engineering
Wound Healing
Transport and Release of Drugs
Nanosensors
Piezoelectric sensor
Biochemical sensor
Fluorescence optical chemical sensor
Thermal sensor
Other Applications
Catalysis
Nanofiber Reinforcement
Nanofiber-Based Electronic Optical Devices
Nanofibers as Sacrifical Templates
Other Applications
Catalysis
Nanofiber Reinforcement
Nanofiber-Based Electronic Optical Devices
Nanofibers as Sacrifical Templates
Electrospun
Nanofibers
Electrospun
Nanofibers
Page 34
13
A unique feature of electrospinning is its ability to affect the diameter of the
fiber (from tens of nanometers up to a few micrometers) by altering processing
variable(s) including solution concentration, applied voltage, fluid flow rate and surface
tension (Theron et al. 2004, Fridrikh et al. 2003). Adjusting the fiber diameter provides
an opportunity to fine-tune the porosity of the membrane, which also depends on the
thickness of the membrane. The pores in a non-woven structure (i.e. the empty space)
are closely interconnected and would be particularly appropriate for fluid filtration
under hydraulic pressure; the pores cannot be entirely blocked by particles which have
penetrated the membrane. In liquid filtration, porous polymeric membranes
manufactured by conventional methods have their intrinsic limitations, e.g. low-flux and
high-fouling performance, due to the geometrical structure of pores and the
corresponding pore size distribution, for example, produced by the phase immersion
method (Wrasidlo and Mysels 1984) and undesirable macro-void formation across the
whole membrane thickness (Paulsen et al. 1994). We could conclude that nanofibrous
membranes produced by electrospinning are able to overcome of these limitations.
1.3.3.2. Nanofiber-Based Sensors
Tremendous progresses have been made in the development of ultrasensitive
sensors in responding to the imperative needs for more timely and reliable detections in
environmental monitoring, food inspection and medical diagnostics. Developments of
electrospun nanomaterials, such as nanofibers and nanowebs, have offered opportunities
to construct more efficient interfaces with electronic components whose size is
comparable to that of molecules. The tiny size of the components may bring benefits to
people, with some special size effects, such as quantization and single-molecule
sensitivity. The relatively expansive specific surface area and considerable porosity of
electrospun nanomaterials have attracted significant interest, because these properties
closely meet requirements for ultrasensitive sensors (Ding et al. 2010).
The fabrication of polymeric nanowire chemical sensors was demonstrated by
Liu et. al. They investigated the effect of orientation and diamaters of polyaniline
nanowires on the sensing ability to Ammonia gas. Both response time and sensitivity of
the nanostructures could be improved compared to film-based polyaniline sensors (Liu
et al. 2004). The fluorescence-based porphyrin-doped nanocomposite fiber sensor for
Page 35
14
the rapid detection of trace trinitrotoluene (TNT) vapor was fabricated by Tao and co-
workers. It was found that constricting the diameter and introducing a pore structure
into nanofibers could considerably enhance the sensitivity of the resulting materials
(Tao et al. 2007). The performed experiments clearly indicated that the electrospun
nanofibrous membranes and their assemblies may hold broad promise as active
components for the sensing technology.
1.3.3.3. Catalysts
Both polymeric and ceramic Electrospun nanofibers provide another attractive
class of solid support for conventional catalysts and enzymes by virtue of their
compactness and relatively significant surface area. In this vein, Demir et al.
investigated the catalytic activity of palladium-incorporated nanofibers in the selective
hydrogenation of dehydrolinalool. The study found that the catalytical activity of such
fibers was 4.5 times higher than the traditional Pd catalyst supported on alumina
powders (Demir et al. 2004).
The removal and recycling of the catalysts after the reaction is a crucial stake in
the catalysis process. One intriguing solution to this is the undertaking of
immobilization of homogeneous or heterogeneous catalysts in nanofibers. The
homogeneous catalyst, which is comprised of core–shell nanofibers combined with
proline and scandium triflate Sc(OTf)3 (TfO=CF3SO3) catalysts was fabricated by the
tubes by fiber templates (TUFT) process. Complete conversion of the fiber systems can
be achieved in the same or shorter reaction times, in contrast to the conventional
catalysis in homogeneous solutions. The fibers can be used several times without loss of
activity (Stasiak et al. 2007). Lindner et. al. reported reusable dendritic catalysts
‘bottled’ in poly “bottled” in poly(p-xylylene) (PPX) nanotubes through conjugation of
poly(amidoamine) (PAMAM). The nanotubes displayed activity as a recyclable catalyst
in a Knoevenagel reaction (Lindner et al. 2009). Additionally, nanofibers were
employed as carriers for enzymes, where enzymes were either chemically attached to
the electrospun fibers or directly dispersed in the nanofibers during the process of
electrospinning (Jia et al. 2002, Wang, Wan, et al. 2009). High catalyst activities were
also reported in this study.
Page 36
15
CHAPTER 2
SORPTION EFFICIENCY OF CHITOSAN NANOFIBERS
TOWARDS METAL IONS AT LOW CONCENTRATIONS
2.1. Abstract
Nanometer-sized chitosan fibers showing narrow diameter distribution with a
mean of 42 nm were produced by electrospinning and utilized for sorption of Fe(III),
Cu(II), Ag(I), and Cd(II) ions from aqueous solutions. Filtration efficiency of the fibers
was studied by both batch sorption and microcolumn methods, and the ion
concentrations remained in the filtrates was determined by inductively coupled plasma-
mass spectrometry (ICP-MS). High efficiency in sorption of the metal ions was
obtained in both methods. In former method, sorption parameters including the effect of
sorbent amount (0.10-0.50 mg), shaking time (15-120 min), initial metal ion
concentration (10.0-1000.0 μg Lˉ1), and temperature (25 and 50 C) were examined.
The sorbent amount did not significantly alter the efficiency of sorption; however,
shaking time, temperature, and metal ion concentration were found to have strong
influence. By virtue of the mechanical integrity, the applicability of the chitosan mats in
solid phase extraction under continuous flow looks promising.
2.2. Introduction
Ground water pollution originating from both natural and anthropogenic sources
forms a detrimental problem to the environment. Metal ions are released into the
environment from a variety of natural sources including mineral and metallic deposits in
sedimentary rocks and soil. Manmade activities such as mining, plating, glass making,
ceramics, and battery manufacturing also lead to a great increase in heavy metal
contamination in water, causing an ongoing risk to the biosphere. Cadmium, for
instance, is one of the most toxic metals for the biosystems that accumulates in the
human body, especially in the kidneys. The intake of overdoses of cadmium has been
Page 37
16
reported to cause renal diseases, prostate cancer, and bone lesions (Benguella and
Benaissa 2002). Excessive intake of copper, as another example, causes damages to
liver, kidneys, and intestinal system (Ngah et al. 2002). Moreover, iron in drinking
water or water supplies bring about problems regarding the quality of water such as
providing reddish color, metallic taste and odor (Cho 2005). When silver or its
compounds come into contact with the skin, they may cause permanent discoloration
known as argyria. Although Cu and Fe are essential elements for the living organisms,
they become potentially toxic at higher concentrations; thus, their contents must be kept
at certain threshold levels. The maximum contamination levels (MCL) in drinking water
set by Environmental Protection Agency (EPA) are 0.005 mg Lˉ1 for cadmium, 1.3 mg
Lˉ1 for copper, 0.3 mg Lˉ
1 for iron, and 0.05 mg Lˉ
1 for silver.
The removal of toxic metals from aqueous solution can be achieved using
different methods including ion exchange (Lee et al. 2001, Ngah and Fatinathan 2010),
reverse osmosis (Yang and Zall 1984), chemical precipitation (EPA 2000), and
coagulation (Assaad et al. 2007). Among the applicable methods, sorption has been
recognized as the most optimum one due to its high efficiency, ease of implementation,
and low cost (Justi et al. 2005, Li and Bai 2005, Ng et al. 2002). Sorption of aqueous
metals can be realized by employing sorbents that contain functional groups possessing
metal binding ability such as amino (Li et al. 2008), carboxyl (Wong et al. 2003),
phosphoric (Puziy et al. 2004), mercapto (Mondal and Das 2003), amidoxime (Nilchi et
al. 2008, Saeed et al. 2008), and the like.
Chitosan is a nontoxic, biodegradable polymer derived from naturally occurring
chitin, which is found in the exoskeleton of crustacean shells, such as crabs, insects, and
shrimps. It is the largest biomass polysaccharide component along with starch. The
main structure of chitin is the β-linked N-acetyl-D-glucosamine and upon N-
deacetylation, it is transformed into chitosan by thermochemical alkaline treatment.
Chitosan (C6H11NO4)n has been widely reported as an effective sorbent of metal ions. It
has a mass of 161 g per unit monomer, and has a concentration of amino group (–NH2)
of 6.21 mmol gˉ1 if it is completely deacetylated (Wu et al. 2010). The extent of
deacetylation controls the fraction of free amine groups and hydroxyl groups on
chitosan (Ngah et al. 2002). In order to enhance the sorption capacity, physical and
chemical methods (Miretzky and Cirelli 2009) have been used to modify this natural
polysaccharide. Chitosan with different morphologies such as powder (Gamage and
Shahidi 2007, Juang and Shiau 2000), bead (Lee et al. 2005, Li, Bai, et al. 2005, Ngah
Page 38
17
and Fatinathan 2008, Twu et al. 2003), membrane, microsphere (Vieira and Beppu
2006a, Zhou et al. 2009), fiber (Desai et al. 2008, Desai et al. 2009, Haider and Park
2009, Vieira and Beppu 2006a, Zhou et al. 2009), and their cross linked forms (Chen,
Liu, et al. 2008, Ngah et al. 2005, Vieira and Beppu 2006b) has been used to remove
heavy metals from aqueous systems. Surface area of sorbents is known as the most
important parameter in sorption studies. Larger surface area provides higher number of
available active sites and results higher sorption activity. Therefore, attempts have been
made to increase surface area of chitosan sorbent. For example, drying in supercritical
CO2 was used as a method to improve surface area of chitosan structures (Okamoto et
al. 2003). Application of this process allows to generate porosity and enlarges surface
area (close to 110 m2 gˉ
1) to be potentially used in catalysis (Valentin et al. 2003).
Among other diverse fields, water treatment is an important field that can benefit
from the advances in nanoscale science and engineering. Nanotechnology based
products that are capable to reduce the concentrations of toxic compounds to sub-ppb
levels can enhance water quality standards and sanitations. Fibrous materials prepared
by electrospinning process are increasingly attracting attention in this field due to the
structural advantages conveyed by the nanosized diameter of the constituent fibers. The
fiber diameter can be controlled by solution properties (viscosity, conductivity, and
surface tension) and instrumental parameters (applied electrical field and flow rate) of
the electrospinning process (Demir et al. 2004, Demir et al. 2002). The fibers exhibit
high mechanical integrity which is a desired property for filtration process under
continuous flow. Moreover, the nanosized diameters of fibers provide much enhanced
functionalities which can not be obtained by bulk materials (Greiner and Wendorff
2007). Along with filtration (Haider and Park 2009, Sang et al. 2008), electrospun fibers
can be used in potential and existing technologies such as biosensors (Frey et al. 2009),
drug delivery (Jiang et al. 2004), wound dressing (Chen, Chang, et al. 2008), and
protective clothing (Yarin and Zussman 2004b). Although the filtration efficiency of
chitosan and chitosan derivatives has been known for many years, the studies that focus
on the efficiency of electrospun chitosan fibers are scarce. Previously, electrospun
chitosan fibers were applied for the removal of chromium ion (Desai et al. 2008).
Chitosan was blended with poly (ethyleneoxide), (PEO) in solution to improve its
processibility in electrospinning process. While PEO brings electrospinnability to the
blend system, the binding ability of metal ions in filtration process was attributed to
chitosan. The blending of the similar material components was also used for removal of
Page 39
18
pathogenic microorganisms and Cr2O72-
ions demonstrated by the same group of authors
(Desai et al. 2009). Another interesting study related to metal ion filtration by
electrospun chitosan fibers was reported by Park et al (Haider and Park 2009). The
authors used chitosan itself without using additional material component like
polyethylene oxide or polyvinyl alcohol. The dissolution of chitosan was achieved by
trifluoroacetic acid (TFA) and electrospun fibers were neutralized by K2CO3. The
chitosan fiber mats exhibited good erosion stability and high metal binding capacity in
aqueous solution. In the present study, chitosan nanofiber mats were prepared via
electrospinning. The filtration performance of the fiber material was then tested for
Fe(III), Cu(II), Ag(I), and Cd(II) ions in aqueous solution. Both of batch and
microcolumn sorption methods were employed to characterize sorption over a range of
experimental parameters.
2.3. Experimental Section
2.3.1. Materials and Methods
Medium molecular weight chitosan powder was used as received from Sigma-
Aldrich. Reagent grade glacial acetic acid and sodium chloride were obtained from
Riedel-de Haen. Viscosimetry was employed for determination of molecular weight of
the chitosan powder using the Mark-Houwink equation; [η] = KMvα, where K and α are
the specific constants for a given polymer and vary for the used solvent system and
temperature (Planas 2002). The constants, K and α of chitosan were determined as
1.81×10ˉ3 cm
3 gˉ
1 and 0.93, respectively, when 0.20 M NaCl/0.10 M acetic acid solvent
system were used (Kasaai 2007, Taghizadeh and Davari 2006). A Petrotest capillary
viscosimeter (Dahlewitz, Germany) was used to measure the viscosity of chitosan/acid
solution at 25 ºC. The degree of deacetylation (DD) of chitosan was determined by
titrimetric (Tolaimate et al. 2000) and elemental analysis (Kasaai et al. 2000) methods.
The potentiometric method depends on the titration of chitosan with standardized NaOH
(Merck) solution, used to deprotonate positively charged amine groups in chitosan. For
this purpose, 250.0 mg portion of chitosan was dissolved in 10.0 mL of 0.30 M HCl
(Merck) and after being diluted to 50.0 mL with ultra pure water, it was titrated with
0.100 M NaOH solution. The consumed volume of NaOH which corresponds to the
Page 40
19
amount of amine groups in chitosan is obtained from the difference between two
inflection points of acid-base titration. Equation 1 describes the formulation used in the
calculation of DD by the titrimetric method. In this equation, 161 is the molecular
weight of glucosamine unit of chitosan, 42 is the difference in the molecular weights of
chitin and chitosan repeating units, m is the mass of the chitosan sample, ΔV is the
volume and M is the molarity of NaOH solution. DD was also verified by elemental
analysis which is the second method we employed. The elemental compositions of these
samples were determined by a LECO-CHNS-932 elemental analyzer
(Mönchengladbach, Germany). The results of elemental analysis were also used for
calculation of DD of chitosan. Since deacetylation process removes two carbon atoms
and one oxygen atom from chitin, chitosan differs in its C and O contents while N
remains unchanged. Therefore, C/N ratios are used in the determination of DD.
Equation 2 is used for determination of DD where, 5.145 is the ratio of C/N in
completely N-deacetylated chitosan repeating unit and 1.671 is the difference between
the C/N ratios of chitin and chitosan.
142
1611
1..
m
MV
m
MV
DD (2.1)
(2.2)
2.3.2. Electrospinning of Chitosan
Chitosan solutions were prepared by dissolving chitosan powder (Mv= 1096 kDa
and 70-75% degree of deacetylation) in 1,1,1,3,3,3-Hexafluoroisopropanol (HFIP)
(Sigma-Aldrich). The solutions were stirred for 2 days to achieve homogeneous and
clear solution. The chitosan solutions were placed in a 20.0 mL syringe fitted with a
metallic needle of 0.2 mm of inner diameter. The syringe was fixed horizontally on the
100671.1
145.5/1..
NCDD
Page 41
20
microsyringe pump (LION WZ-50C6) and the electrode of the high voltage power
supply (Gamma High Voltage Research Ormond Beach, FL, US) was attached to the
metal needle tip.
Figure 2.1 shows the schematic diagram of electrospinning setup and a
photographic image of the resulting fiber mat. The concentration of the chitosan was
kept constant at 0.4 wt % of the solution. An electrical field of 1.1 kV cmˉ1 (the applied
voltage: 8 kV and the tip-to-collector distance: 7 cm) was applied to the solution, and
the deposition time was adjusted to obtain a dense film. The flow rate of the polymer
solution was 0.8 mL hˉ1, and the electrospinning was performed in a horizontal position
at room temperature. A mat-like film was obtained on the grounded aluminum plate.
The electrospun fiber mat was removed easily, washed with acetone, and dried under
vacuum at 60 ºC overnight.
Figure 2.1. Schematic representation of (a) electrospinning setup, and (b) photographic
image of the resulting fiber mat
2.3.3. Structural Characterization of Electrospun Mat
The morphology of electrospun chitosan mat was characterized by a scanning
electron microscope (SEM, Philips XL-30S FEG) after coating the sample with gold.
The average fiber diameter was determined by statistical treatment of the SEM images
with the image processing software, ImageJ (Rasband 2010). The diameter distribution
of the electrospun fibers were obtained by measuring at least 100 test fibers. The
crystalline structure of the samples was analyzed using an X-ray diffractometer (Philips
X’Pert Pro X-Ray Diffractometer). Fourier transform infrared spectroscopy (FTIR)
measurements of the samples were performed with Perkin Elmer Spectrum 100 FTIR
HV
High voltage power
supply
0
.
8
L
Micro infusion syringe pump
syringe
Charged
jet
Jet length
Grounded
collector
Syringe
needle
chitosan
nanofiber mat
conductive
plate
(a) (b)
Page 42
21
Spectrometer (Shelton, USA) with Pike Miracle single reflection horizontal attenuated
total reflection (ATR) accessory. The surface area of the fiber sample was measured
with a Micromeritics Gemini V Brunauer-Emmett-Teller (BET) analyzer with N2 gas.
2.3.4. Sorption Studies
The electrospun chitosan fiber mat was used as a sorbent for the removal of
Fe(III), Cu(II), Ag(I), and Cd(II) ions from aqueous solution. Stock standard solutions
(1000.0 mg L−1
) were prepared by dissolving FeCl3.6H2O (Merck), CuSO4.5H2O
(Riedel-de Haen), AgNO3 (Sigma-Aldrich), and CdCl2 (Merck) in ultra-pure water (18.2
MΩ cm). The working standard concentrations of the ions were then obtained by serial
dilution. The sorption experiments encompassed the effects of the sorbent amount,
shaking time, initial ion concentration, and sorbent type on the extent of fixation of the
aforementioned cations.
The chitosan fiber mats were immersed in 3.0 mL of 100.0 μg Lˉ1
multielement
solution (adjusted to pH of 6.0) and continuously shaken in a GFL 1083 water bath
shaker (Burgwedel, Germany) equipped with microprocessor. Following each of the
batch experiments, the liquid solution was separated from the fiber sorbent by
centrifugation and the supernatant phase was analyzed for its iron, copper, silver or
cadmium content using ICP-MS (Agilent 7500ce Series, Japan). The ICP-MS operating
conditions are provided in Table 2.1.
In addition to batch sorption studies, microcolumn tests were also performed for
the sake of comparison. These studies were employed using a home-made microcolumn
system involving PTFE tubing with internal diameter of 1.5 mm and a height of 6.0 cm.
The substrate chitosan fibers were folded and immersed into the flexible tube.
Cylindrically shaped small sponge pieces were squeezed into both ends of the tube such
that chitosan fibers were sandwiched and the back-pressure of the continuous flow was
prevented. In each trial, a 3.0 mL aliquot was passed through the sorbent tube.
Additional tubes connecting the microcolumn to peristaltic pump tubing were inserted
at both ends of the columns. The flow rate of the solution was adjusted to 0.15 mL min-
1. This process was performed 13 times, consecutively. For the sake of control, parallel
experiments were conducted by both batch and microcolumn tests, in which Fe(III),
Cu(II), Ag(I), and Cd(II) ions free of chitosan fiber were used.
Page 43
22
Table 2.1. ICP-MS Operation Parameters
Operation Parameters Value
RF power 1550W
Make up gas flow rate 0.27 L minˉ1
Argon carrier gas flow rate 0.85 L minˉ1
Octopole collision gas flow rate (He) 4.5 mL minˉ1
Chamber temperature 2 ºC
Sample depth 7 mm
Nebulizer Concentric
Nebulizer pump 0.1 rps
Tune setting (m/z) 7, 89, 205
Isotopes monitored (m/z) 56
Fe, 57
Fe, 63
Cu, 107
Ag, 111
Cd
Metal solutions at concentrations of 5.0, 10.0, 25.0, 50.0, 100.0, 200.0, 500.0,
and 1000.0 μg Lˉ1
were prepared by serial dilution of 10.0 mg Lˉ1 stock solutions of
Fe(III), Cu(II), Ag(I), and Cd(II) ions. All samples and standard solutions were acidified
by adding proper amounts of concentrated HNO3 to produce 1.0 % (v/v) HNO3 in the
final solution. The percentage sorption and the metal ion concentration on the fibers
were calculated using the following equations:
(2.3)
(2.4)
100%
i
fi
C
CCSorption
M
VCCggq
fi /
Page 44
23
where Ci is the initial concentration, Cf is the final concentration of the ions in
solution (μg Lˉ1), V is the solution volume (L) and M is the sorbent fiber amount (g)
(Sang et al. 2008)
The selectivity of the nanofiber mat against a certain cation was also examined.
The selectivity is expressed in terms of the distribution coefficient (D) (Rodrigues
1986), calculated using the equation below.
(2.5)
Attention was paid to measure the concentration of any residual fluoride ion that
would be potentially desorbed from the electrospun mat into solution. The concentration
of fluoride ion was followed by Ion Chromatography (IC).
2.4. Results and Discussion
2.4.1. Electrospinning of Chitosan and Structural Characterization of
Electrospun Mat
Both solution and instrumental parameters of electrospinning were varied for
chitosan/HFIP system. The process was optimized as electrospinning of 0.4 wt %
solution at an electric field of 1.1 kV cmˉ1 under a flow rate of 0.8 mL hˉ
1. Panel a and b
of Figure 2.2 present SEM micrographs of powder and electrospun nanofibers of
chitosan, respectively, at different magnifications. When the chitosan powder was
electrospun, its morphology changed drastically from bulk into nonwoven fibrous
material. Panel c shows diameter histogram and Gaussian distribution of the electrospun
nanofibers. The fibers have uniform diameter with 42 15 nm.
Electrospinning of chitosan from solution is problematic due to its limited
solubility and the presence of high degree of intermolecular and intramolecular
interactions. In particular, low surface tension solvents or solvent compositions have
been frequently used for electrospinning of chitosan for example TFA and HFIP
(Ohkawa et al. 2004, Sangsanoh and Supaphol 2006, Schiffman et al. 2009). However,
the usage of volatile and corrosive nature of these solvents may raise some
solutionofmLMmg
adsorbentpolymerofgMmgD
n
n
/
Page 45
24
environmental concern. Potential release of this molecule could be disadvantageous and
limit the applicability of the fibrous chitosan sorbent in water treatment.
To figure out the content of HFIP in our particular system, the decantate was
analyzed after sorption experiments using Ion Chromatography (IC). The results of
measurements showed that the concentration of fluoride ion is around 0.022 mg Lˉ1.
This concentration is two orders of magnitude lower than the threshold set by World
Health Organization (1.5 mg Lˉ1) (WHO 2004). Consequently, this level of fluoride is
not risky as expected at least for the sorbent amount employed.
Nitrogen adsorption/desorption measurements were conducted to determine the
BET surface area of the fibers. The shapes of the isotherms for powder and electrospun
fibers are provided in panel a of Figure 2.3 Increasing the relative pressure does not
vary the quantity of N2 adsorbed on chitosan powder, however, a linear increase in
adsorbed N2 is observed for electrospun fibers. At a given temperature the isotherms for
the chitosan nanofibers and the powders have a different shape. This difference can be
explained by the larger effective surface area in fibrous electrospun mat compared to the
powder. The BET surface area is calculated from the isotherms to be about 0.92 m2 g
-1
for the powder and 22.4 m2 g
-1 for the electrospun fibers, i.e. more than twenty-fold
increase of the surface area of chitosan were observed upon electrospinning. Increasing
the surface area results in higher number of exposed binding sites for the metal ions.
X-Ray Diffraction pattern of chitosan powder is given in Figure 2.3b. Two
prominent reflections at 10° and 20° are evident. These signals, which are in agreement
with the literature (Schiffman et al. 2009), can be attributed to hydrated crystals of
chitosan. The crystalline form of chitosan powder disappears upon electrospinning,
indicating that the resulting fibers have amorphous texture. Since rapid solidification
takes place during the process, the stretched molecular chains do not have enough time
to align into three dimensional ordered crystal structures (Zhou et al. 2008). Figure 2.3c
demonstrates the FTIR spectra of chitosan powder and electrospun chitosan nanofibers.
Both spectra contain broad –OH stretching absorption bands between 3600 and 3300
cm–1
. The absorption band observed between 3000 and 2800 cm–1
is attributed to the
aliphatic C–H stretching. In the carbonyl region of the both spectra, the absorption band
centered at around 1400 cm1
is a characteristic band of chitin. The presence of these
signals indicates that N-acetyl amino groups of chitin are still present in the system, i.e.
chitosan is not completely deacetylated. The percent of deacetylation was determined as
70-75 % as mentioned in the experimental part, indicating that 25-30 % of the repeating
Page 46
25
glucose units remain in acetylated form. A characteristic group of free primary amino
group (–NH2) at C2 position of glucosamine is present in chitosan. The band related
with the bending of this group is identified within the spectral range of 1200-1000 cm–1
.
0 20 40 60 80 1000
10
20
30
40
50
Per
cen
tag
e
Fiber Diameter / nm
(b)
(a)
(c)
1 mm
10 μm
Diameter (nm)
Min. 18
Max. 97
Average 42
Figure 2.2. SEM micrographs of (a) chitosan powder, (b) electrospun mat, and (c)
diameter histogram of the electrospun nanofibers
Page 47
26
Figure 2.3. Structural characterization of the chitosan powder and electrospun chitosan
fibers by means of (a) BET isotherm data, (b) X-ray diffraction patterns,
(c) ATR-FTIR spectra
0,0 0,2 0,4 0,6 0,8 1,0
0,0
0,4
0,8
1,2
1,6
powder
fiber
Qua
ntit
y A
dsor
bed
(mm
ol/g
)
Relative Pressure (P/Po)
(a)
(b)
(c)
10 20 30 40 50
Inte
nsi
ty (
a.u
.)
2 theta
chitosan nanofiber
chitosan powder
4000 3500 3000 2500 2000 1500 1000
Wavenumbers (cm-1)
% R
chitosan powder
chitosan nanofiber
ν(O-H) ν(C-H) ν(C-N) δ(C-O)
δ(N-H)
Page 48
27
2.4.2. Sorption Studies
Figure 2.4a shows the sorption percentage of Fe(III), Cu(II), Ag(I), and Cd(II)
ions onto a chitosan nanofiber mat in a 100.0 µg L-1
synthetic multielement solution as a
function of sorbent amount. The experiments were conducted at pH of 6.0 to prevent the
formation of metal hydroxides at higher pH values. Lower pH values were also avoided
due to possible solubility of chitosan fibers as a result of protonation of the amine
groups. As the sorbent amount increases, the sorption percentage of the ions increases
slightly. This observation may be explained as follows. Electrospun fibers are randomly
distributed as independent filaments without having preferential alignment. When fibers
stay long time in solution under shaking, the fibers assemble in solution into fiber
bundles. The mechanism of this process is not fully understood in literature (Demir et
al. 2008). However, it is regarded as disadvantageous because it leads to decrease of
surface-to-volume ratio of the system. Assembling of sorbents will yield a reduction in
the specific surface area and an increase in the kinetic (diffusion) barrier against
sorption of aqueous ions, hence hindering the effectiveness of the sorbent entities and
lowers the efficiency of sorption. Since the production of electrospinning is slow, the
smallest amount of chitosan nanofiber sorbent (0.10 mg) was fixed in all experiments.
Another tentative explanation for reduction in sorption at high sorbent amount could be
the aggregation of sorbate entities. It is generally assumed that the sorbate ions are
individually and homogeneously dispersed in the solution medium. However, this might
not always be the case. Such presumed aggregation will reduce the area of contact
between the sorbate and solution medium, thus decreasing the extent of sorption. In
addition, kinetically, any plausible aggregation will slow down sorption due to imposing
further surface diffusion necessity on the sorbed ions.
The percentage sorption at different shaking times is illustrated in Figure 2.4b.
As expected, the extent of sorption of Fe(III), Cu(II), Ag(I), and Cd(II) increased with
shaking time and maximum sorption was achieved for each metal ion at about 60 min of
contact time. Prolonged exposure to 120 min resulted in slight decrease in sorption,
probably due to desorption of some weakly bonded ions. The loading percentage of
chitosan nanofiber sorbent was approximately 95 % for copper, 94 % for iron, 87 % for
silver, and 52 % for cadmium in the 60 min contact period.
Page 49
28
Figure 2.4. The effects of (a) sorbent amount, (b) shaking time, (c) initial metal ion
concentration on the sorption of Fe(III), Cu(II), Ag(I), Cd(II) on chitosan
nanofibers at pH=6
10,0 100,0 1000,00,0
20,0
40,0
60,0
80,0
100,0
Sor
ptio
n %
Log Concentration
Fe(III)
Cu(II)
Ag(I)
Cd(II)
(a)
(b)
(c)
0 20 40 60 80 100 120
20,0
40,0
60,0
80,0
100,0
Fe(III)
Cu(I)
Ag(I)
Cd(II)
Sor
ptio
n %
Shaking Time (min)
0,10 0,20 0,30 0,40 0,50
40,0
100,0
Fe(III)
Cu(II)
Ag(I)
Cd(II)
Sor
ptio
n %
Sorbent Amount (mg)
Page 50
29
The effect of initial concentration of metal ions on the sorption behavior of
chitosan nanofiber mat was determined for the concentrations of 0.01 mg Lˉ1
, 0.1 mg
Lˉ1
, and 1.0 mg Lˉ1
. The results, given in Figure 2.4c, indicate that, except for Fe(III),
the sorption of metal ions decreased almost linearly with the increase in the initial metal
ion concentration. The percentage sorption of Fe(III) was higher than 65 for all the
concentrations tried. Maximum sorption percentages of 99 % for copper, 97 % for
silver, 85 % for cadmium, and 78 % for iron were obtained at 0.01 mg Lˉ1
, where the
concentration of the analyte is not sufficiently high to saturate all available functional
sites. Increasing the initial concentration to higher value resulted in differences of
affinity of the sorbent toward the analytes. As it is usually the case, increasing the initial
concentration caused a decrease in percentage sorption. Increasing the ion concentration
causes larger competition of the ions to reach the limited number of functional groups,
with the ions accommodated by these groups being usually smaller in number compared
to ions remaining in solution.
The selectivity of the sorbent against the metal ions was also examined. Figure
2.5 gives the distribution coefficients (D) (Rodrigues 1986) for Fe(III), Cu(II), Ag(I),
and Cd(II) ions which were determined under competitive conditions. These
coefficients are frequently used as a measure of the capacity of a sorbent towards the
sorbates. The order of decreasing selectivity at 100.0 µg Lˉ1
is Cu > Fe > Ag > Cd,
whereas at 1.0 mg Lˉ1
, the order becomes Cu Fe > Ag > Cd. The distribution
coefficients of Cu and Ag are three fold larger at 100.0 µg Lˉ1
than at 1.0 mg Lˉ1
. Thus,
the concentration of the analyte is significantly effective for the selectivity of the
sorbent towards the analytes of interest.
The extent of removal of metal ions pertains directly to the operating
mechanism. The sorption mechanism on chitosan is quite complicated. It depends
basically on the structural properties of the polymer (like the number of monomer units,
the degree of deacetylation, crystallinity, etc.). Moreover, the structural parameters are
reported to affect the equilibrium and kinetic aspects of sorption (Guibal 2004). The
speciation of the metal ions under the prevailing experimental conditions is another
important parameter in determining the sorption mechanism. Under neutral-slightly
basic pH conditions, the major mechanism of metal sorption is binding to the free
electron pair on amine groups. It is reported that chitosan has the highest chelating
ability in comparison to other natural polymers obtained from seafood wastes and many
other natural substances like activated sludge (Varma et al. 2004). Nevertheless, the
Page 51
30
contribution of hydroxyl groups to metal uptake can not be totally disregarded,
especially under pH conditions leading to deprotonation of these groups. In addition, the
pH of the medium and the presence of ligands can change the speciation of the metal
ion in a way that may result in turning the chelation mechanism into the electrostatic
attraction mechanism (Guibal 2004).
Figure 2.5. Sorption selectivity of chitosan nanofibers for the indicated metal ions at
two different initial concentrations
As reported previously in this work, the extent of metal sorption was studied at
pH of 6.0. At such pH, the deprotonation of amino and hydroxyl groups is not plausible,
and as a result the metal ions seem to be fixed mainly by coordination to amine groups.
The extent of such complexation is closely related to the speciation of those ions, their
charge density, and electronic structure. Under the pH of our experiments speciation
analysis using Visual MINTEQ (version 2.53) program suggests that the ions are
expected to exist primarily in their ‘bare’ form (Ag+, Cu
2+, Cd
2+, Fe(OH)
2+). Thus as a
first approximation, it seems that the charge density and electronic structure
(availability of unsaturated d orbitals) will determine the extent of complexation. The
coordination mechanism might explain the relatively lower sorption of Ag+ and Cd
2+ in
comparison to the Cu2+
and Fe3+
, as the d orbitals of Ag+ and Cd
2+ are full. From this
perspective, Fe3+
would be expected to have the highest affinity, which is in line with
the results observed at the highest studied concentration, i.e. 1.0 mg Lˉ1.
FeCu
AgCd
1000.0 μg/L
100.0 μg/L0
10000
20000
30000
40000
50000
60000
D
FeCu
AgCd
1000.0 μg/L
100.0 μg/L0
10000
20000
30000
40000
50000
60000
D
Page 52
31
The preferential sorption behavior can also be explained in terms of steric
reasons, i.e. ionic radii of the metal ions. The results obtained from the uptake of the
metals throughout the study are in agreement of various results obtained with chitosan
flakes that reported the same order of affinity for Cu2+
and Cd2+
(Bassi et al. 2000,
Rhazi et al. 2002). It might be said that sorption of Cd2+
and Ag+ is less favorable
probably due to their larger ionic radii, the thing that might create mismatch to the
binding sites on chitosan.
The mechanism can also be roughly viewed from another perspective. The
liability of ions toward coordinative bonding with ligands can be explained based on
hard-soft acid base principle (HSAB). This approach provides general guidelines that
qualitatively describe the ion-ligand coordinative bond stability in light of the relative
sizes and charge densities of the potential partners. Smaller ions with higher charge
densities tend to behave as hard acids and bind preferentially to ligands of smaller size
which behave as hard bases. On the contrary, larger ions with smaller charge densities
(soft acids) would preferentially bind to ligands that are diffuse and bulky (soft bases).
In our particular case, the amine group on the backbone of chitosan chains plays the
main role in sorption of metal ions, and can be classified as a hard base. Based on
HSAB principle, amine ligand will preferentially bind to hard acids (Fe3+
in this case)
and demonstrate low tendency towards binding with soft acids (Ag+ in this case), which
is consisted with our experimental results, Both of Cu2+
and Cd2+
are classified as
borderline acids, and as such, their different sorption affinities to amine groups can not
be explained based on this approach.
The differences of sorption characteristics for commercial chitosan flake and the
prepared nanofiber are illustrated in Figure 2.6. As seen, higher sorption was observed
for the fiber in all cases. This result illustrates the most prominent advantage of the
fibers prepared. The higher sorption of the fiber can be attributed to the increased
surface area (22.4 m2 g
ˉ1) in comparison with commercial chitosan (0.92 m
2 g
ˉ1), hence
a much larger number of functional (surface active sites) are readily available for
sorption in the case of the fiber. In addition, the crystallinity of the prepared sorbent was
completely different from that of commercial chitosan which may also affect the
sorption properties of the fibers (Guibal et al. 1999, Milot et al. 1998, Piron and Domard
1998).
Page 53
32
Figure 2.6. Comparison of the sorption efficiency of chitosan powder and chitosan
nanofiber
To investigate the effect of temperature, two sets of sorption experiments were
carried out at 25 °C and 50 °C. The obtained data was used to evaluate the apparent
thermodynamic parameters of sorption as presented in Table 2.2, using a series of
thermodynamic expressions (Shahwan et al. 2006).
12
21
1
2
TT
TT
TR
TRInRH
d
d (2.6)
dRInTRG (2.7)
T
GHS
(2.8)
Fe(III) Cu(II) Ag(I) Cd(II)0,0
20,0
40,0
60,0
80,0
100,0
Sor
ptio
n %
Chitosan Nanofiber
Chitosan Powder
Page 54
33
Table 2.2. Thermodynamic parameters of chitosan nanofibers (0.10 mg sorbent, 3.0 mL
of 100.0 μg Lˉ1 Fe(III), Cu(II), Ag(I), Cd(II), at pH 6.0, n = 3)
ΔG° (kJ/mol)
ΔH° (kJ/mol) ΔS° (J/molK)
298 K 323 K 298 K 323 K
Fe(III) -27.2 -27.7 -21.4 19.5 19.5
Cu(II) -29.9 -30.9 -17.3 42.2 42.2
Ag(I) -31.0 -31.5 -25.9 17.3 17.3
Cd(II) -25.0 -26.0 -13.0 40.3 40.3
The extent of sorption of the metal ions decreases as the temperature of the
system increases, demonstrating an exothermic sorption behavior. This result is in line
with the one reported earlier for As sorption on chitosan (Boyaci et al. 2010) The S°
values for Fe(III), Cu(II), Ag(I), and Cd(II) were found to be positive indicating that the
system gains more entropy upon fixation of the ions. This could be resulting from
dehydration steps of the ions upon sorption. The combination of H° and S° values
yields negative G° values, which characterizes situations in which the reaction
products are favored over the reactants.
Figure 2.7. Microcolumn application of chitosan nanofiber mat on the sorption of
Fe(III), Cu(II), Ag(I), Cd(II). (Note that each aliquot is 3 mL)
0.0 6.0 12.0 18.0 24.0 30.0 36.0 42.0
0.0
200.0
400.0
600.0
Ad
sorb
ed A
mo
un
t (m
g/g
)
Eluted Volume (mL)
Fe(III)
Cu(II)
Ag(I)
Cd(II)
Page 55
34
In order to investigate the applicability of the sorbents for column sorption
studies, similar experiments were conducted with nanofiber-filled microcolumn. The
sorption results obtained via column application are illustrated in Figure 2.7. These tests
signify the adequacy of the prepared chitosan nanofibers for continuous removal of
Fe(III), Cu(II), Ag(I), and Cd(II) from aqueous solutions. The first eluted 3.0 mL
aliquots did not show significant differences in the extent of sorption of the studied ions,
while further increase in solution volume significantly enhanced the difference between
the sorbed amounts of the metal ions. Fe(III), Cu(II), and Ag(I) ions did not demonstrate
sorption maxima after 39.0 mL of solution volume. This result states that the fibers are
still active in sorption even after 13 repetition of elution. (thanks to electrospinning) On
the other hand, Cd(II) ions almost reached maximum sorption. The lower sorption of
Cd(II) was probably not related with saturation of the available functional groups, and
may have resulted from different kinetic details and/or sorption mechanism in
comparison to the other ions. Further investigation is required to clarify this issue. In
addition, for Fe(III) and Ag(I) ions, the affinity of the nanofiber towards each ion is
different from that observed in batch type sorption, while Cu(II) and Cd(II) show
similar behavior with batch sorption studies.
2.5. Conclusion
Electrospinning of biopolymer chitosan is a difficult procedure due to its limited
solubility in most organic solvents and strong inter and intrachain hydrogen bonding
that leads to increase in viscosity of solution even at low weight fraction. In this study,
uniform diameter of nanosized electrospun chitosan fibers were successfully fabricated
by using medium molecular weight chitosan dissolved in HFIP. It was shown that
chitosan nanofibers can be applied in the continuous removal of several metal ions. The
environmentally friendly chitosan-based nanofibrous filter material has prominent
benefits due to the high surface area per unit mass resulting from the very fine diameter.
The results of the sorption study showed that shaking time, metal ion concentration, and
temperature have strong influence on the sorption of Fe(III), Cu(II), Ag(I), and Cd(II)
on chitosan nanofiber mat. In addition, Cu(II) was selectively filtered in contrast to
Cd(II). Since the fibers are integrated to each other in a dense polymeric film, chitosan
nanofiber mat can be used as sorbent for solid phase extraction (SPE) cartridges.
Page 56
35
CHAPTER 3
CHITOSAN FIBER-SUPPORTED ZERO-VALENT IRON
NANOPARTICLES AS A NOVEL SORBENT FOR
SEQUESTRATION OF INORGANIC ARSENIC
3.1. Abstract
This study proposes a new sorbent for the removal of inorganic arsenic from
aqueous solutions. Monodispersed nano zero-valent iron (nZVI) particles were
nucleated at the surface of electrospun chitosan fibers (average fiber diameter of 195 ±
50 nm) by liquid phase reduction of FeCl3 using NaBH4. The material was characterized
using SEM, STEM, XPS, and XRD. The diameter of iron nanoparticles was found to
vary between 75–100 nm. A set of batch experiments were carried out to elucidate the
efficiency of the composite sorbent toward fixation of arsenite and arsenate ions. The
ion concentrations in the supernatant solutions were determined using inductively
coupled plasma-mass spectrometry (ICP-MS). The results revealed that the chitosan
fiber supported nZVI particles is an excellent sorbent material for inorganic arsenic
uptake at concentrations ranging from 0.01 to 5.00 mg Lˉ1 over a wide range of pH
values. Based on XPS analysis, As(III) was found to undergo oxidation to As(V) upon
sorption, while As(V) retained its oxidation state. By virtue of the successful
combination of the electrospun fibers’ mechanical integrity and the large reactivity of
dispersed nZVI particles, the applicability of the resulting sorbent material in arsenic
sorption holds broad promise.
3.2. Introduction
Arsenic, notoriously known for centuries as a poison, is currently considered as
one of the most common and harmful water pollutants. The presence of dissolved
arsenic in ground water affects the health of millions of people all around the world, and
has given rise to a major environmental concern. Natural arsenic contamination of soil
Page 57
36
and surface waters mainly originates from its geological presence and oxidative
weathering. The discharge of industrial wastes resulting from anthropogenic activities
like burning of coal, mining-related activities, usage of fertilizers and additives in
agriculture contribute to arsenic pollution in ground water (Mandal and Suzuki 2002).
A primary route of exposure of human body to arsenic occurs through the consumption
of contaminated water and marine food which leads to arsenic poisoning or arsenicosis
(Saha et al. 1999). Long term exposure to arsenicals eventuates in severe diseases as
keratosis, gangrene or cancer (Choong et al. 2007). Acute poisoning shows symptoms
such as bloody diarrhea and vomiting (Mohan and Pittman 2007). The predominant
species of arsenic in natural ground and surface waters are either neutrally charged
arsenite [As(III)] complex, or negatively charged arsenate [As(V)] oxyanions depending
on pH, redox potential (Eh), and the presence of other chemical species. Arsenic is
considered by the World Health Organization (WHO) to be among the chemicals of
greatest health concern in some natural waters. The maximum contamination level of
arsenic in drinking water set by WHO and the US Environmental Protection Agency
(EPA) is 10 µg Lˉ1. Therefore, it is necessary to isolate arsenic from aqueous systems to
avoid possible harmful exposure.
A number of arsenic removal technologies have been explored (Mohan and
Pittman 2007). Many chemical treatments include oxidation/precipitation (Sun et al.
2009, Leupin and Hug 2005, Bissen and Frimmel 2003, Gihring et al. 2001),
coagulation (Lacasa et al. 2011, Lakshmanan et al. 2010, Balasubramanian et al. 2009,
Lakshmanan et al. 2008, Song et al. 2006, Wickramasinghe et al. 2004), sorption
(Chutia et al. 2009, Boddu et al. 2008, Gimenez et al. 2007, Chen and Chung 2006,
Deschamps et al. 2005, Cumbal and Sengupta 2005, Dousova et al. 2003, DeMarco et
al. 2003, Lenoble et al. 2002, Dambies et al. 2000), ion-exchange (An et al. 2005, Kim
and Benjamin 2004, Ghurye et al. 1999), and membrane technologies (Pagana et al.
2008, Iqbal et al. 2007, Shih 2005, Ning 2002). The traditional remediation processes
based on sorption are characterized by its ease of application and low-cost (Daus et al.
2004). Various sorbents are available for arsenic removal such as activated carbon,
activated alumina, silica, and titanium, zirconium, iron-based materials (Mohan and
Pittman 2007). Although the efficiency of the aforementioned sorbents has been
demonstrated, recent studies are proceeding for other innovative new materials.
Nanoscale zero-valent iron (nZVI) technology has attracted considerable attention due
to the high surface reactivity of the material which was reported to yield high arsenic
Page 58
37
sequestration ability (Kanel et al. 2005, Kanel et al. 2006). However, the tendency of
the nanoparticles to agglomerate impedes dispersibility and stability of the material and
limits its potential in water remediation. Although nZVI particles allow for magnetic
separation techniques (Ai et al. 2008, Karatapanis et al. 2012, Li et al. 2006, Sharma et
al. 2009), their redispersion and accordingly reusability are not readily possible due to
their strong magnetic interaction. The aggregation/agglomeration of the nanoparticles
reduces significantly their effective surface area, as a result, their sorption efficiency.
To overcome this problem, nZVI particles were either entrapped in a porous polymer
(Geng et al. 2009, Gupta et al. 2012, Liu et al. 2012, Sun et al. 2011), supported on
porous materials (Shi et al. 2011, Karabelli et al. 2011, Shahwan et al. 2010, Uzum et al.
2009, Xiao et al. 2009), or nanofibrous materials (Xiao et al. 2010, Xiao et al. 2011,
Ma, Huang, et al. 2012). Chitosan is mostly chosen as a mechanical support because of
its low-cost, wide availability, biodegradability, nontoxicity, as well as unique structural
properties. The reactive amino groups on the backbone of chitosan enable fixation of
several metal ions (Bailey et al. 1999). However, raw chitosan is not preferred for usage
in the sorption of arsenic from water because of the pH limitation of chitosan in the
arsenic uptake, reduced accessibility of chelating groups in case of crosslinked form
(Crini 2005). Another disadvantage of raw chitosan is that it has poor physical nature
and correspondingly low mechanical integrity leading to difficult isolation from the
reaction media (Horzum et al. 2010).
Recently, Geng et al. proposed chitosan-stabilized nZVI particles produced by
liquid phase reduction with potassium borohydride for the removal of hexavalent
chromium in water.(Geng et al. 2009) The usability of Fe0 nanowires modified with
chitosan embedded in porous anodic alumina as sorbent towards the elimination of
chromium ions was reported by Sun et al (Sun et al. 2011). To date, chitosan-nZVI
based studies have mainly focused on the remediation of chromium ions. Distinctively,
Gupta et al. evaluated that nZVI encapsulated chitosan spheres are potential candidate
for the adsorption of total inorganic arsenic from aqueous systems (Gupta et al. 2012).
Although the stability of Fe0 nanoparticles was increased by the addition of chitosan,
the resulting materials still have poor physical strength which is an undesirable property
for filtration processes.
In this work, we focused on the fabrication of a new functional material which
allows for advantageous combination of nZVI particles and electrospun chitosan fibers.
Electrospinning has been known as versatile and efficient technique for the fabrication
Page 59
38
of fibrous mats from a wide variety of both organic and/or inorganic materials (Huang
et al. 2003). Electrospun nanofibers provide excellent characteristics as sorbents such as
high surface area to volume ratio, enhanced surface functionalities, and superior
mechanical performance compared with the powdered material (Horzum et al. 2010).
Due to the integrated high surface area inherent in both nanoparticles and
submicron electrospun fibers which have also porous structure and high mechanical
integrity, chitosan fibers-supported nZVI particles are optimal candidates for filtration
applications. Contrasting to the available systems, we present a facile route to fabricate
a new functional material, which overcomes the disadvantages of the nZVI particles and
chitosan system such as agglomeration of the magnetic nZVI nanoparticles and pH
limitation of chitosan particularly in acidic environment. The material was effectively
used in As(III) and As(V) uptake from aqueous systems. The main advancement for the
particular material combination arises from the following issues: (i) The proposed
method is facile and yields a very effective material for sorption of As. (ii) The fiber
material provides stable surfaces for the homogeneous dispersion of iron nanoparticles.
(iii) The composite sorbent material composed of submicron sized nonwoven fibers
possess high stability and mechanical integrity not only under shaking but also under
continuous flow. (iv) The composite sorbent material can be repetitively used.
3.3. Experimental Section
3.3.1. Materials
All the chemicals were of reagent grade and were used without any further
purification. Ultrapure water (Milli-Q Millipore 18.2 MΩ cm resistivity) was used
throughout the study. Plastic containers and glassware were cleaned by soaking in
diluted HNO3 (10 %) and were rinsed with ultrapure water prior to use.
Medium molecular weight chitosan (Mv= 1096 kDa, 70-75% degree of
deacetylation, Aldrich), iron(III) chloride hexahydrate (Merck, 99%), sodium
borohydride (Aldrich, 98+%), ethanol (Sigma-Aldrich, ≥99.5%), As2O3 (Acros
Organics, 99.5%), As2O5 (Merck, 99%), potassium dihydrogen phosphate (Alfa Aesar,
98%), magnesium chloride hexahydrate (Carlo Erba, 98%), and 1,1,1,3,3,3-
Hexafluoroisopropanol (HFIP, Aldrich, ≥99%) were used as received without any
Page 60
39
further purification.
3.3.2. Preparation of Chitosan Fiber-Supported nZVI
Figure 3.1 shows a facile route for the fabrication of chitosan fiber-supported
nZVI particles. In a relevant experiment, the 0.4 wt% chitosan solution in HFIP was
transferred to a 20 mL plastic syringe with a needle tip. The syringe needle was
connected to a high voltage supply (Gamma High Voltage Research Ormond Beach,
FL, US) and a potential of 10.5 kV was applied. The flow rate of the polymer solution
was kept at 7.5 mL hˉ1 by using a microsyringe pump (LION WZ-50C6). The tip to
collector distance was 5 cm. When the solvent evaporated, a mat-like chitosan film was
obtained on the grounded aluminum plate and stored at room temperature.
Figure 3.1. Experimental steps for the preparation of chitosan fiber-supported nZVI
particles and proposed mechanism of As(III)/As(V) sorption
The growth of nanoparticles of zero-valent iron on the surface of the chitosan
fibers was achieved by reducing iron ions using sodium borohydride. In the related
experiments, 1.35 g FeCl3·6H2O (corresponding to 0.28 g iron) was dissolved in 25 mL
of 4:1 (v/v) ethanol/water mixture, then 24 mg chitosan fiber was immersed into this
solution and the mixture was vigorously stirred on a orbital shaker (IKA Vortex Genius
3) for 30 min. Fe3+
loaded chitosan fiber mat was then separated from the solution
without any additonal washing steps and placed in a beaker. Meantime, 1.0 M sodium
borohydride solutions were prepared such that BH4ˉ/Fe3+
mole ratios were 1:1, 2:1 and
3:1. The amount of Fe(III) source was kept constant, while the concentration of NaBH4
was gradually increased. The NaBH4 solution was added to chitosan fiber mat drop by
drop from the burette during stirring of the reaction mixture on a magnetic stirrer. After
the addition of NaBH4 solution, further mixing was maintained for 10 min. The
Page 61
40
reduction reaction of ferric ions (Fe3+
) on chitosan fibers was marked by the formation
of black particles characteristic for Fe0. The reaction can be written as:
4Fe3+
+ 3BH4ˉ+ 9H2O → 4Fe0↓ + 3H2BO3ˉ + 12H
+ + 6H2 (3.1)
The solid material was separated from the liquid phase by vacuum filtration. The
filtrate was washed with absolute ethanol in an ultrasonic bath for 5 min to remove any
physically adsorbed nZVI. The washing procedure was repeated three times to stabilize
nZVI against immediate oxidation. Finally, the prepared material was dried at 40 ºC
overnight.
Scanning electron microscopy (SEM) was used for morphological
characterization. This analysis was performed using a FEI Quanta250 FEG scanning
electron microscope. Scanning transmission electron microscopy (STEM) mode was
used to visualize nZVI particles on the surface of the chitosan nanofibers. The average
fiber diameter was evaluated from the SEM micrographs for 100 individual fibers by
using Fiji/ImageJ software. SEM micrographs were used also in the estimation of the
surface area coverage of the nano- zerovalent iron particles using Scandium software
(Soft Imaging System Corp.). EDX elemental mappings were obtained using ZEISS
Libra 200FE TEM operating at 200 kV. Small chitosan nanofibres were mounted on
holey carbon film supported on copper substrate, and elemental mappings at the fibers’
thin edges for iron and carbon were revealed. The thermal properties of the sorbent were
analyzed using a Perkin Elmer Diamond TG/DTA.
XPS spectra were acquired for chitosan-nZVI samples before and after the
removal of each of As(III) and As(V) using VG Scientific ESCALAB 250 operating
using Al Kα at 400 W. Data analysis and manipulation were performed using CasaXPS
software, the binding energies for the collected photoelectrons were referenced using C
1s peak at 284.6 eV. X-Ray diffraction (XRD) was used for structural characterization
of the composite material before and after sorption of As(III) and As(V). The XRD
analysis was performed using a Philips X’pert Pro diffractometer monochromatized Cu
Kα radiation (λ = 1.540 Å). Fourier transform infrared (FTIR) spectra were acquired
using a Perkin Elmer Spectrum 100 FTIR Spectrometer (Shelton, U.S.A.), equipped
with Pike Miracle single reflection horizontal attenuated total reflection (ATR)
accessory.
Page 62
41
3.3.3. Sorption Studies
Separate stock solutions of As(III) and As(V) ions were prepared at a
concentration of 1000 mg Lˉ1
by dissolving each of As2O3 and As2O5 in dilute HCl
aqueous solution (1.0%, v/v). The initial concentrations used in the sorption
experiments were 0.01, 0.05, 0.10, 0.25, 0.50, 1.00, 5.00, 10.0, and 25.0 mg Lˉ1, and
were prepared by serial dilution from the stock solutions. The pH of the solutions was
adjusted to 6.0 using 0.10 M and/or 1.0 M NH3 or HNO3.
Dried samples of chitosan fiber-supported zero-valent iron nanoparticles (0.50
mg) were immersed in 3.0 mL synthetic As(III) and As(V) solutions and continuously
shaken in a GFL 1083 water bath shaker (Burgwedel, Germany) equipped with a
microprocessor. The batch sorption experiments were performed as a function of initial
concentration at 25 ºC for contact period of 1 h. The eluates were then separated from
the fiber sorbent by centrifugation followed by decantation. The concentrations of the
metal ions in solution after sorption were determined by ICP-MS (Agilent 7500ce
Series, Japan). The ICP-MS operation parameters are given in Table 3.1.
Table 3.1. ICP-MS operation parameters
Operation Parameters Value
RF power 1550 W
Make up gas flow rate 0,1 L minˉ1
Argon carrier gas flow rate 0,87 L minˉ1
Octopole collision gas flow rate 4,5 mL minˉ1
Spray Chamber temperature 2 ºC
Sample depth 7,8 mm
Nebulizer Concentric
Nebulizer pump 0,1 rps
Tune setting (m/z) 7,89,205
Isotopes monitored (m/z) 75
As, 56
Fe
Page 63
42
The effect of pH was studied by adjusting the initial pH values to 4.0, 5.0, 6.0,
7.0, 8.0 and 9.0 using 0.10 M and/or 1.0 M NH3 or HNO3. For each experiment,
separate 0.50 mg of chitosan/iron nanoparticles were placed into their respective
solutions of 3.0 mL of 100.0 g Lˉ1 As(III) and As(V). The speciation analysis of
arsenic-containing ions at various pH values was performed using Visual MINTEQ
software.
The extent of desorption was investigated by exposing the As-loaded fiber
samples to 0.5 M KH2PO4 or 0.5 M MgCl2 for 1h, and were then centrifuged and the
supernatant solutions were finally analyzed for possibly released As ions.
3.4. Results and Discussion
3.4.1. Characterization of Chitosan-nZVI Fibers
The morphology and diameter distribution histogram of the chitosan fibers and
chitosan fibers-supported nZVI particles are shown in Figure 3.2. SEM micrograph
(Figure 3.2a) shows that the chitosan fibers have a smooth surface morphology with an
average diameter of 195 ± 50 nm. ZVI nanoparticles were produced at the surface of
electrospun chitosan mats by reducing FeCl3 with NaBH4. To obtain homogeneous
particle dispersion on the chitosan fibers, the amount of BH4ˉ with respect to Fe
3+ was
varied.
Page 64
43
Figure 3.2. SEM micrographs and fiber diameter distribution of (a) chitosan fibers and
chitosan fiber-supported nZVI particles prepared in BH4−/Fe
3+ ratio of (b)
1:1 (c) 2:1 (d) 3:1
Figure 3.2b-d indicates the formation of dispersed iron nanoparticles on the surface of
the chitosan fibers at different amounts of BH4ˉ. At the mole ratio of BH4ˉ:Fe3+
of 2:1,
nZVI particles are seen to form on the fiber surface more homogeneously, with a higher
density and increase in the fiber diameter compared to the mol ratio of 1:1. Further
increase in reducing agent leads to aggregation of nZVI particles and results in
separation of the particles from the fiber surface (Figure 3.2d). The average fiber
diameter of the composite fibers was determined to be 350 ± 95 nm, 400 ± 90 nm, and
425 ± 140 nm, respectively. The size of individual zerovalent iron nanoparticles ranged
mainly between 75 and 100 nm, although some higher scale aggregates were also
observed. Figure 3.3a shows STEM micrograph of the chitosan fiber-supported nZVI
particles prepared in the presence of double amount of borohydride. Regularly shaped
spherical nZVI particles appeared in dispersed form on the chitosan fibers. Typical
EDX electron maps of the composite material in Figure 3.3b demonstrates the
homogeneous distribution of C which forms the backbone of chitosan, while Figure
3.3c reveals the presence of iron in distinct domains on the chitosan surface.
Page 65
44
Figure 3.3. (a) STEM micrograph, and elemental EDX mapping images (K lines) of the
surface of chitosan fiber-supported nZVI particles (b) C, and (c) Fe
Figure 3.4 displays the thermal decomposition profiles of the chitosan (curve a)
and chitosan-nZVI composite fibers prepared at different BH4ˉ/Fe3+
ratios. Curve b and
c refer to 1:1 and 1:2, respectively. Both types of the fibers, regardless of the BH4ˉ/Fe3+
mole ratio, exhibit three stages of decomposition. These are consecutive to the
elimination of chemi/physisorbed water, degradation of 2-amino-2-deoxy-D-
glucopyranose, and 2-acetamido-2-deoxy-D-glucopyranose units of chitosan (Nam et al.
2010). After heating beyond 250 °C, mass loss occurs sharply and the chitosan fibers
seem to be decomposed completely at temperatures higher than 600 °C.
Figure 3.4. TGA curves of (a) chitosan fiber, and nZVI supported on chitosan
nanofibers in BH4ˉ/Fe
3+ ratio of (b) 2:1 (c) 1:1
Page 66
45
On the other hand, within the same temperature range, the composite fibers yield
more than 60% of the initial mass. The remaining residue of the composite fibers can be
attributed mainly to the iron based species developed on the fibers surface. Note that in
comparison with the thermogram of neat chitosan fiber, the particles improve the
thermal stability of chitosan-nZVI composite fibers approximately 30 °C particularly at
early stage of the decomposition. Moreover, the composite fibers prepared with high
BH4ˉ/Fe3+
mole ratio yields higher amount of inorganic residual mass (67%) compared
to the one prepared by the low ratio (57%). The higher residual mass can be attributed
to the formation of higher number of Fe-based particles developed in the presence of
higher amount of reducing agent (BH4ˉ). This result seems to be in line with the
electron microscopy micrographs (see Figure 3.2b and c).
The chitosan-nZVI samples were analyzed using XPS. The wide survey of the
sample contained signals arising from the backbone of chitosan, namely C, N, and O,
and signals that corresponded to iron (Figure 3.5). The iron signals are attributed mainly
to the shell structure of nZVI, as the obtained signals in XPS arise from the upper few
nm’s of the surface. The insets in the figure correspond to Fe 2p and C 1s photoelectron
profiles. The Fe 2p3/2 line appears to be centred at 711.2 eV binding energy which
correspond to iron oxide. The shoulder that appears at 712.3 eV is very close to binding
energy values reported earlier for iron oxohydroxide (FeOOH) (Wagner et al. 1979).
The feature at 706.6 eV is close to the value reported for Fe in its zero oxidation state
(Oku and Hirokawa 1979). This feature originates to the core region of the
nanoparticles. The photoelectron profile of C 1s shows three distinct signals that are
observed at 284.6, 286.2, and 289.0 eV. These features are attributed to three different
C environments in chitosan structure, namely C-C, C-N, and C-O environments,
respectively.
Page 67
46
Figure 3.5. Wide XPS survey of the chitosan-nZVI fibers. The insets in the figure show
Fe 2p and C 1s photoelectron profiles
The X-ray diffraction patterns of the chitosan-nZVI composite fibers before and
after arsenic sorption are given in Figure 3.6. The crystalline structure of nZVI is
characterized by the main reflection appearing at 2θ of 44.7º as shown in Figure 3.6a.
The absence of chitosan signals in the XRD diagram can be referred to the fact that
electrospun chitosan fibers have amorphous internal structure, as reported previously
elsewhere (Horzum et al. 2010).
Page 68
47
Figure 3.6. XRD patterns of the chitosan fiber-supported nZVI particles (a) before
sorption (b) after As(V) sorption (c) after As(III) sorption
3.4.2. Material Properties after Sorption and Sorption Results
The XRD patterns of the fibers showed significant changes after sorption of
aqueous arsenic ions. (Figure 3.6b and c) The signals of nZVI disappeared totally and
the oxides appeared in the form of lepidocrocite (γ-FeOOH) and magnetite/maghemite
(Fe3O4/γ-Fe2O3). The photographic images suggest that the freshly prepared chitosan-
nZVI composite fiber (Figure 3.6a) is very dense and has black color. As shown in Fig.
3b and 3c, the fiber have turned brownish orange after As(V) sorption and orange after
As(III) sorption, indicating that lepidocrocite and magnetite/maghemite particles were
formed on the chitosan fiber surface due to the massive oxidation during the sorption
process. The possible interactions between chitosan and nZVI particles, as well as the
changes in the functional groups of chitosan-nZVI fibers after As(III) and As(V)
sorption were identified by FTIR spectroscopy. Figure 3.7 presents the FTIR spectra of
the chitosan-nZVI fibers as-prepared, and after sorption of As(III) and As(V), together
with the spectrum of neat chitosan fibers. The spectrum of the neat chitosan fibers
(green curve) shows characteristic bands centred at 3332 cmˉ1 (O‒H stretching); 2920
and 2870 cmˉ1 (C‒H stretching); 1651 cmˉ
1 (C‒N stretching in secondary amide); 1377
cmˉ1 (C‒O stretching); 1073 cmˉ
1 (N‒H stretching). In the spectrum of the chitosan-
nZVI fibers in Figure 3.7 (blue curve), some shifts on the characteristic bands were
Page 69
48
observed depending upon the adsorption of nZVI particles on the chitosan surface. The
stretching band of the hydroxyl groups at 3332 cmˉ1 in neat chitosan fibers are shifted to
3262 cmˉ1 in chitosan-nZVI fibers. On the other hand, there are shifts in the band
corresponding to C-N stretching vibrations from 1651 to 1634 cmˉ1, and also in the
band of N-H stretching from 1073 to 1025 cmˉ
1. It is worth noting that the intensity of
C‒H, and C‒O bands are significantly decreased in chitosan-nZVI fiber. The results
clearly show that the interaction of nZVI with the O‒H, C‒N, and N‒H groups of
chitosan. Such phenomenon was already reported for Cu (Monteiro and Airoldi 1999),
and Fe (Bhatia and Ravi 2003) metals, which were not only coordinated to NH2, but
also formed metal complexes with ‒OH groups.
Figure 3.7. FTIR spectra of the chitosan-nZVI fibers as-prepared, after As(III), and
As(V) sorption, compared with the spectrum of pure chitosan fibers
To gain further insight on the sorption mechanisms, the spectra of chitosan-
nZVI fibers after As(III) (red curve) and As(V) (black curve) sorption are also
investigated. The stretching band of the hydroxyl groups for chitosan-nZVI fiber after
As(III) sorption is shifted to 3206 cmˉ1
accompanied by an increase in the intensity. In
contrast, after As(V) sorption, a blue shift is observed in the hydroxyl band with a
weaker intensity. Furthermore, the intensity of N‒H stretching bands decreased in the
chitosan-nZVI fiber after As(III) sorption, but increased in that of the sample after
Page 70
49
As(V) sorption. The newly formed absorption band at 796 cmˉ1
may be attributed to the
attachment of As(III) onto the chitosan-nZVI fibers.
The sorption experiments carried out to reveal the effect of initial concentration
on the sorption of As(III) and As(V) on chitosan- nZVI composite fibers are presented
in Figure 3.8. These experiments were performed in the concentration range of 0.01-
25.0 mg Lˉ1, while the V/M ratio was fixed at 60 mL mgˉ
1. When the initial
concentration was increased, a gradual decrease in percent sorption was observed. The
data of As(III) and As(V) sorption on the chitosan-nZVI composite fiber mat were
examined by Langmuir and Freundlich isotherm models, and the obtained isotherms are
displayed in Figure 3.9.
Figure 3.8. Variation of % uptake of As(III) and As(V) with the initial concentration
Langmuir theory assumes monolayer adsorption on a homogeneous surface. The
non-linear form of Langmuir isotherm model is given by the equation:
e
ee
Cb
Cbqq
1max (3.3)
Page 71
50
where qe, is the amount of metal ions adsorbed onto the chitosan-nZVI composite fiber
sorbent (mmol gˉ1) at equilibrium, Ce (mmol Lˉ
1) is the equilibrium concentration of
metal ions in liquid phase, qmax (mmol gˉ1) and b (L mmolˉ
1) are Langmuir constants
related to the adsorption capacity and affinity, respectively.
Figure 3.9. (a) Adsorption isotherm and non-linear fits of (b) Langmuir, (c) Freundlich
models for ()As(III) and () As(V) on the chitosan-nZVI composite fiber
mat
The basic assumption of the Freundlich theory is that the adsorbent consists of a
heterogeneous surface over a wide range of concentrations. Freundlich isotherm model
is described by the equation:
n
eFe CKq /1 (3.3)
Here, KF and n are the Freundlich constants for a given sorbent-sorbate system.
The values of Langmuir and Freundlich constants were obtained from linear fits of the
sorption data and are given in Table 3.2. Adequate linear correlations were observed for
both Langmuir and Freundlich isotherm models. The adsorption capacities (qmax) of
As(III) and As(V) for chitosan-nZVI composite fiber sorbent have been evaluated to be
0.0223 and 0.0305 mmol/g. The Langmuir constant, b, can be treated as an empirical
Page 72
51
equilibrium constant, and used in the evaluation of the standard free energy of
adsorption using the following equation;
InbRTG (3.4)
The free energy of adsorption were found to be -19.99 kJ/mol for As(III) and -
16.74 kJ/mol for As(V). The negative free energy values indicate that the adsorption
reaction is driven far to the right, i.e. that products are much more favored over the
reactants.
The value of Freundlich constant (1/n) reflects sorption linearity, and it usually
varies between 0 and 1. The corresponding values obtained from linear regression
indicates that sorption is nonlinear, which is a typical behavior for surfaces with fixed
and limited sorption capacities. The sorption of As(III) seems closer to linearity, which
suggests higher extent of sorption. The KF values show that the fiber sorbent possesses
good affinity towards the adsorbate ions, with its affinity toward As(III) being relatively
higher than As(V).
Table 3.2. Summary of model coefficients (Solution volume, shaking time, solution pH,
sorbent amount and reaction temperature were 3.0 mL, 1 h, pH 6.0, 0.50 mg,
and 25 °C, respectively, n = 3)
The effect of solution pH on the uptake of As(III) and As(V) ions on the
chitosan-nZVI fibers is shown in Figure 3.10 at the initial concentration of 100.0 µg/L.
In the case of As(III), chitosan-nZVI fiber sorbent shows higher than 80% removal at
pH within 4.0-7.0. On the other hand, a significant decrease is observed in As(III)
sorption beyond pH of 7.0. (Figure 3.10a) Similar trend of the pH dependence of As(III)
sorption was also observed using nano scale zero-valent iron (Kanel et al. 2005). The
underlying reason for the decrease in As(III) removal was explained by formation of its
anionic specie that undergoes repulsion by the negatively charged sorbent surface. This
is confirmed by the speciation analysis provided in the inset of Figure 3.10a which
Adsorption
model Parameter As(III) As(V)
Langmuir R2 0.9888 0.9958
Qmax (mmol/g) 0.0223 0.0305
b (L/mmol) 3178.94 856.94
Freundlich R2 0.9950 0.9970
KF 9.5499 2.2542
1/n 0.8323 0.7601
Page 73
52
reveals increase in formation of H2AsO3ˉ in the alkaline conditions, accompanied with a
decrease in the concentration of the H3AsO3 specie.
Figure 3.10. Effect of pH on the sorption of 100.0 µg Lˉ
1 (a) As(III), and (b) As(V)
solutions by chitosan-nZVI fibers. The insets show speciation diagrams of As(III) and As(V)
It was reported that chitosan flakes do not show any affinity for As(III) over the
wide range of pH values, whereas the same sorbent has highest As(V) sorption at pH
3.0 (Boyaci et al. 2010). However, at low pH values, the dissolution problem of
chitosan precludes the possibility of its usage as a sorbent material for arsenic removal.
As seen in Figure 3.10, pH trials for As(III) and As(V) sorption indicated that it is also
possible to remove both species at neutral pH values using chitosan fiber-supported
nZVI particles. The nature of As(V) sorption around pH 4-8, can be explained by
coulombic interaction between chitosan-nZVI surfaces which exhibit positive charge at
pH lower than the point of zero charge of 7.8 for nZVI (Kanel et al. 2005) and
H2AsO4ˉ/HAsO42ˉ ions which are the main species at the pH range.
It is worth noting that the fate of iron was taken into account while removing the
arsenicals by using chitosan-nZVI fibers. Higher amount of dissolved iron was
determined after As(V) sorption compared with the iron content after As(III) sorption.
Page 74
53
The maximum iron concentration in solution after sorption process was 14 mg Lˉ1. It is
estimated that the amount of dissolved iron is less than 0.7% of the initial nZVI amount
assuming that the surface of chitosan is entirely coated with the particles.
Desorption experiments were performed in an analogous way to those with
sorption experiments. The arsenic ion-loaded chitosan-nZVI fiber sorbents were
individually treated with 0.5 M MgCl2 or KH2PO4 for the release of arsenic ions. The
desorption percentages for As(III) ions were 49% for KH2PO4, 40% for MgCl2, and for
As(V) ions were 36% for KH2PO4, 24% for MgCl2. This indicates that the sorbed
As(V) specie are more stable than those of As(III).
Figure 3.11. SEM micrographs of the chitosan-nZVI composite fiber after (a) As(III),
and (b) As(V) sorption
SEM micrographs of dried chitosan-nZVI composite fibers after As (III) (Fig.
3.11a) and As (V) (Figure 3.11b) sorption studies showed a bundled fibrous structure
along with lepidocrocite and/or magnetite/maghemite particles on the electrospun
chitosan fibers. Agglomeration of iron oxides particles is also demonstrated by the
figures. Distinctively, flower like structure on/between the fibers (Figure 3.11a, inset)
has appeared after As (III) sorption.
The XPS features of Fe 2p before and after sorption of arsenic species are shown
in Figure 3.12A. The oxidation of Fe is marked by the disappearance of Fe0 feature that
appears in curve a of Figure 3.12A around 707 eV. The oxidation leads to a shift in the
Fe 2p peaks towards higher binding energies, indicating the development of iron
oxyhydroxide groups on the surface. This is seen to be more pronounced in the case of
As(V) sorption (curve c in Figure 3.12A), possibly leading to circumstances in which
the ion is liable to complexation by oxyhydroxyl groups.
The O 1s profiles corresponding to the samples before and after sorption are
Page 75
54
given in Figure 3.12B. The peak envelope centred around 531.0-531.3 eV showed
relatively little changes, indicating that it belongs to structural O in the composite
materials.
Figure 3.12. XPS profiles of the composite fibers showing (A) Fe 2p, (B) O 1s, (C) As
3d, (D) C 1s features before and after sorption process. In Figs. A, B, D;
(a) represents the samples before sorption, (b) refers the samples after
sorption of As(III), and (c) the samples after sorption of As(V). In Fig. C,
(a) stands for As(III) signal and (b) stands for As(V) signal
The variety of chemical environments in which O exists in the composite
materials makes it no easy to provide an accurate assignment for these envelopes of
peaks. Nevertheless, it is possible to mention that these features display binding
energies close to those assigned earlier for O2-
in the hydroxyl groups of α-FeOOH
(goethite) and γ-FeOOH (lepidocrocite) reported at 531.0 eV and 531.1 eV,
respectively.(Grosvenor et al. 2004) The sorption of As(III) leads to the development of
an O 1s feature centred at 529.8 eV and a shoulder centred at 533.1 eV (curve b in
Figure 3.12B). The former one (529.8 eV) is close to those assigned previously to O2ˉ
in α-Fe2O3 (hematite) and that in γ-Fe2O3 (maghemite), reported at 530.0 eV and 529.9
eV, respectively,(Grosvenor et al. 2004) and could reflect the extensive oxidation of
iron accompanying sorption. The latter feature at 533.1 eV is tentatively thought to
Page 76
55
belong to the O in the sorbed arsenic species. This feature becomes more distinct when
As(V) is sorbed (curve c in Figure 3.12B). Given that As(III) is largely oxidized to
As(V) upon sorption, as discussed in next section, and the fact that O 1s level bonded to
As(V) would experience a decrease in electron density, it seems logical to assign this
feature to sorbed arsenate species.
3.4.3. Sorption Mechanism
The sorption mechanism of As specie by nZVI was addressed in several studies,
and seems not to be totally resolved yet. Earlier studies reported that As(III) undergoes
fast sorption on nZVI surface, and as time passes, As(III) near or in contact with the
corroding nZVI surface may be oxidized to As(V), which subsequently is sorbed by an
inner-sphere mechanism (Kanel et al. 2005). In a study of As(V) sorption on nZVI, it
was confirmed that As(V) is fixed through an inner-sphere surface complexation.(Kanel
et al. 2006) The same study indicated that until 60 days, only As(V) was detected, but
on a longer time scale As(III) was identified due to the reduction of As(V).
In later studies, it was shown that As(III) undergoes both oxidation and
reduction at nZVI particle surfaces (Ramos et al. 2009). Oxidation was reported to yield
As(V), while reduction lead to formation of As(0). This was confirmed in another study
in which it was stated that As(V), formed via oxidation of As(III), was fixed
predominantly by outer surface of the oxide shell of nZVI surface, while reduced
species were enriched in a subsurface layer close to the Fe(0) core (Yan et al. 2010).
Recently, it was reported, based on analysis using the structural techniques − X-ray
absorption spectroscopy (XAS) and X-ray absorption near-edge spectroscopy
(XANES) − that for nZVI in anoxic As(III) solutions, As(III) species sorbed on nZVI
surface undergoes diffusion across the thin oxide layer enclosing the nanoparticles,
which results in arsenic forming an intermetallic phase with the Fe(0) core (Yan et al.
2012). The same study reported that As(V), presumably resulting from As(III), could
not be detected, and attributed its detection in other studies to alteration of surface
chemistry of nZVI during XPS analysis.
The XPS profiles obtained in this study for the sorption of As(III) and As(V) are
shown in Figure 3.12C. The XPS profile of As 3d resulting from the sorption of As(V)
seems to be centred at 45.2 eV (curve b in Figure 3.12C). Similarly, the profile of As 3d
Page 77
56
resulting from the sorption of As(III) is slightly split to two peaks centred at 45.2 eV
and 45.0 eV (curve a in Figure 3.12C). Based on this, it seems that, while As(V) retains
its oxidation state upon fixation by nZVI surface, As(III) undergoes oxidation to As(V).
The split might suggest the formation of two types of surface complexes of As(V). The
absence of a signal at 43.5 eV indicates that As(III) is totally oxidized. Moreover, no
signal of As(0) was observed in both cases, suggesting that reduction is not involved in
the mechanism. These results should be viewed within the context of conditions applied
in this study. The formation of As(0) was well documented before as one of the options
of the fixation mechanisms for both of As(III) and As(V) on nZVI.(Ramos et al. 2009)
However, the same study mentioned that arsenic concentration and solution pH, and the
properties of iron materials play crucial roles in determining the final arsenic speciation.
The contribution of chitosan component in the composite material to the uptake
of As ions cannot be ruled out. This has been well documented in literature,(Pontoni
and Fabbricino 2012) and is obvious from the changes observed in the relative
intensities of C 1s components in the XPS spectrum. It is important to mention that the
fixation of As(III) and As(V) resulted in a great decrease in the intensity and shift in the
binding energy of C 1s feature corresponding to C-O environment (Figure 3.12D),
possibly indicating that the hydroxyl groups of chitosan form more attractive centers for
arsenite and arsenate complexation. In both cases, no important change in the C 1s
feature corresponding to C-N environment is observed. It could be useful to note also
that the sorption of As(V) lead to a large decrease in the C 1s intensity corresponding C-
C environment, possibly suggesting partial disruption of these bonds in chitosan
structure upon sorption of As(V) species. As revealed by the speciation analysis
mentioned above, within the pH conditions used of this study, the major forms of
As(III) are expected to be H3AsO3/H2AsO3ˉ, while the major forms of As(V) are
H2AsO4ˉ/HAsO42ˉ, hence the mode of interaction between these specie and the
protonated hydroxyl groups on chitosan surface would be dominated by electrostatic
attraction. Due to its neutral H3AsO3 form, the extent of sorption of As(III) by chitosan
component is expected to be smaller than that of As(V).
Page 78
57
3.5. Conclusion
Chitosan fiber-supported nZVI particles were synthesized and then used in the
removal of inorganic arsenic species from aqueous systems. High sorption capacity and
stable performance of the chitosan-nZVI fibers were achieved over a wide range of pH.
The fiber sorbent showed higher affinity toward As(III) compared to As(V), and the
sorption behavior was adequately described using both Langmuir and Freundlich
isotherms. Spectroscopic investigation showed that the arsenic ions seem to be fixed to
oxide and oxyhydroxide groups at the outer shells of nZVI surfaces. While As(V)
retains its oxidation state upon fixation by nZVI, As(III) undergoes oxidation to As(V).
Moreover, chitosan seems to contribute to arsenite and arsenate complexation mainly
via its hydroxyl groups.
The ease of preparation of chitosan fiber-supported nZVI particles can offer a
very convenient way for the development of sorption-enhanced materials to use in the
removal of undesirable metal ions from water.
Page 79
58
CHAPTER 4
SYNTHESIS OF AMIDOXIMATED
POLYACRYLONITRILE FIBERS AND ITS
APPLICATION FOR SORPTION OF AQUEOUS URANYL
IONS UNDER CONTINUOUS FLOW
4.1. Abstract
This study reports a feasible method for the removal of radioactive U(VI) ions
from aqueous systems via column sorption under continuous flow. Electrospun
polyacrylonitrile (PAN) fibers were used as sorbent materials in a home-made
minicolumn. The nitrile groups on the fibers’ surface were modified to amidoxime
groups using hydroxylamine hydrochloride. Surface modification was observed to
enhance the sorption capacity of PAN fibers toward uranium ions by more than 4 folds,
by virtue of the chelating ability of amidoxime groups. The experiments investigated the
effect of pH, initial concentration, and repetitive loading on the sorption properties of
amidoximated-PAN fibers. Based on the overall results, the surface-modified fibers
seem as a suitable potential sorbent material for the applications in environmental
cleanup particularly nearby nuclear plants.
4.2. Introduction
Uranium is the heaviest naturally occurring radionuclide that has various
harmful fouling in the environment. There are hundreds of uranium species that
accounts for 5% of all known minerals (Kalin et al. 2005). This element is present in
most of rocks, soil, surface and groundwater in the order of a few parts per million. It is
also discharged into the environment from many anthropogenic activites such as
mining, military applications, production and use of phosphate fertilizers, combustion
from coal and other fuels, and nuclear power facilities. The increasing usage of nuclear
reactors for large scale energy production leads to radioactive contamination, hence
Page 80
59
research concerning the separation of U(VI) ions from waters has been a critical
environmental issue in the last decade (Mun et al. 2007, Pekel and Guven 2003, Sadeghi
et al. 2012).
There are two commonly used ways to remove U(VI) ions from solutions: i)
sequestration using organic compounds ii) fixation on surfaces of sorbent materials. The
former involves the covalent interaction of uranyl ions with specific organic compounds
until the ions are not radioactive anymore (Arnold et al. 2012). However, this requires
reconsideration as radioactivity cannot be eliminated by chemical bonding. In the latter,
the ions are fixed onto the surface of a heterogeneous material through sorption. While
the concentration of uranyl ions decreases in solution, it is enriched on the surface of the
sorbent material.
The sorption of U(VI) ions can be achieved by various forms of natural and
synthetic adsorbents given in Table 4.1. Several works related to uranium sorption onto
naturally occuring clay minerals and soil fractions have been performed. Hudson et al.
(Hudson et al. 1999) examined vermiculate and hydrobiotite, and Sylwester et al.
(Sylwester et al. 2000) examined silica, alumina and montmorillonite as sorbents. They
both investigated the pH dependence of uranyl oxo-cation (UO22+
) sorption and
determined the local structure around the sorbed uranium atom. Fouchard et al. (Kowal-
Fouchard et al. 2004) illuminated the surface complexation of the uranyl ions and
montmorillonite sorption sites. Kilincarslan and Akyil (Kilincarslan and Akyil 2005)
studied uranium sorption on clinoptilolite zeolit surfaces and determined the optimum
conditions such as pH, initial concentration, contact time and temperature. The sorption
behavior of uranium on sodium aluminosilicate solid phases was investigated by
Mensah et al. (Addai-Mensah et al. 2005). Greathouse and Cygan (Greathouse and
Cygan 2006) concluded that siloxane groups of beidellite, montmorillonite, and
pyrophyllite were responsible for uranyl sorption. Donat et al. (Donat et al. 2009)
combined biomass and clay mineral to prepare Ulva sp.-sepiolite composite sorbent and
Khani (Khani 2011) carried out optimization of uranium removal by Padina sp. algae
biosorbent.
To improve the sorption capacity of sorbents, many attempts have been made on
chemical modification of sorbent surfaces using functional groups such as amidoxime
(Pekel and Guven 2003, Saeed et al. 2008, Takeda et al. 1991), imidazole (Pekel et al.
2000), and metal oxides (Zou et al. 2009, Sadeghi et al. 2012, Comarmond et al. 2011),
which possess chelating abilities towards U(VI) ions. As commonly used sorbents are in
Page 81
60
powder form, their utilization as a filter material is not convenient due to the difficulty
in the isolation of the solid from solution medium following the sorption stage.
Table 4.1. Summary of sorption system suggested for uranium
Sorbents Size Types of Sorption Reference
Streptomyces and chlorella cells - Column (Nakajima et al. 1982)
Polyethylene hollow fiber 380 µm Column (Takeda et al. 1991)
Montmorillonite < 2 µm Batch
(Greathouse and Cygan 2006,
Kowal-Fouchard et al. 2004,
McKinley et al. 1995, Sylwester
et al. 2000)
Vermiculite and hydrobiotite < 45 µm Batch (Hudson et al. 1999)
Silica, alumina 0.48 µm Batch (Addai-Mensah et al. 2005,
Sylwester et al. 2000)
Amidoximated poly(acrylonitrile/N-
vinylimidazole) 4-5 mm in length Batch
(Pekel and Guven 2003)
Clinoptilolite zeolite < 74 µm Batch (Kilincarslan and Akyil 2005)
Hydrogels based on PEG and
methacrylic acid - Batch
(Mun et al. 2007)
Ulva sp.-Sepiolite <125 µm Batch (Donat et al. 2009)
Manganese oxide coated zeolite 60-200 µm Column (Zou et al. 2009)
Manganese oxide coated sand 670-990 µm Batch (Zou, Zhao, et al. 2011)
Padina sp. algae biomass 1.0-1.25 mm Batch (Khani 2011)
Titanium dioxide 4-240 nm Batch (Comarmond et al. 2011)
Iron oxide <15 nm Batch (Sadeghi et al. 2012)
Therefore, additional treatments might be needed such as coating of these
sorbents onto a supporting surface to efficiently use them for uranium removal. Zou et
al. (Zou, Bai, et al. 2011) modified the natural zeolite surfaces using manganese oxide
and tested uranium(VI) sorption performance by fixed bed ion-exchange column. The
same authors reported the usage of manganese oxide coated sand as a sorbent for the
removal of uranyl ions in batch process. Recent attention is paid to amidoxime
chelating adsorbent in removing heavy toxic metals and/or selective-recovering of
precious metals. Takeda et al. (Takeda et al. 1991) proposed fixed bed adsorption unit
containing amidoxime-modified commercial polyethylene hollow fiber for the recovery
Page 82
61
of uranium from seawater. Pekel and Guven (Pekel and Guven 2003) studied uranyl
ions uptake by amidoximated poly(acrylonitrile/N-vinylimidazole) complexing
sorbents. It was reported that uranyl ions adsorption was achieved via the complexation
abilities of vinylimidazole and amidoxime groups. However, colloidal hydrogels as
filter medium are not favorable for their lack of mechanical integrity accompanied with
difficulty in the separation of the solid phase from aqueous medium.
Electrospun fibrous materials are emerging as suitable alternatives to
conventional sorbents due to their structural advantages conveyed by the nanosized
diameter of the constituent fibers (Demir et al. 2002, Desai et al. 2009, Haider and Park
2009, Klimov et al. 2010, Ren et al. 2012, Saeed et al. 2008, Si et al. 2012). The high
surface area to volume ratio which leads to high sorption capacity, porosity and
mechanical integrity are the benefits of electrospun fibers. The fibers also serve as
substrates for functional groups upon surface modification (Agarwal et al. 2010, Dong
et al. 2006). They can thus be potentially used for sorption and desorption of metal ions.
Based on this, it seems reasonable to investigate the sorption efficiency of amidoxime
modified electrospun fiber for the removal of radioactive and chemically toxic U(VI)
ions from aqueous systems. The surface-modified electrospun fibers used in this work
enjoy large surface area and porosity as well as mechanical integrity which are desirable
properties in filtration applications. This makes such fibers superior in terms of sorption
capability over many of powdered sorbents and colloidal hydrogels reported in earlier
works. The sorption study described herein was designed to survey the characteristics of
amidoximated- PAN fiber and to test their properties as a sorbent for U(VI) ions from
synthetic solutions via a column system. Column-type continuous-flow sorption has an
advantage over batch type sorption as the rate of sorption depends on the concentration
of solute in the solution being treated. In column treatment, the filter material is
continuously in contact with a fresh solution. By virtue of column sorption, the
concentration in the solution changes very slowly, however in batch sorption, the
concentration of the solute decreases much more rapidly and thereby reduces the
effectiveness of the sorbent. Compared to batch sorption, column sorption is more
convenient in industrial applications due to its simplicity, not requiring any additional
processes such as filtration and centrifugation, and providing higher residence time.
Many applications of filtering processes involve the removal of undesirable species
under continuous flow of the solution. For example, in agriculture irrigation pipes, the
filtering material is placed on cross section of the pipes such that it is normal to the flux
Page 83
62
direction of solution, and as such the mechanical resistance to continuous flow becomes
the main requirement for filtering material. Electrospun fiber mat, in this sense can be a
promising candidate for such applications (Horzum et al. 2010).
4.3. Experimental Section
4.3.1. Materials
Acrylonitrile (AN) and benzoyl peroxide (BPO) were provided from Fluka
Chemical Company. For the surface modification of PAN fibers, hydroxylamine
hdyrochloride (H3NO·HCl) and sodium hydroxide (NaOH) were supplied from Sigma-
Aldrich and Riedel-de Haen Chemicals, respectively. N,N-dimethylformamide (DMF)
(Sigma-Aldrich) was used as electrospinning solvent and uranylacetate dihydrate
(UO2(CH3COO)2·2H2O) (Merck’s Reagenzien) was used as sorbate. Sodium
bicarbonate (NaHCO3) (Fluka), ammonium citrate (C6H17N3O7) (Sigma),
ethylenediamminetetraacetic acid (C10H16N2O8) (Riedel-de Haen) were used as
desorbing eluents. All the chemicals were of reagent grade and ultrapure water (18.2
MΩ cm) was used throughout the study.
4.3.2. Instrumentation and Software
Electrospun fibers were analyzed by scanning electron microscope (SEM)
(Philips XL-30S FEG, Eindhoven, The Netherlands). ImageJ 1.43u software was used
for the determination of fiber diameter from SEM micrographs. At each trial, 100 test
fibers were measured in each trial, and the average fiber diameter (AFD) and its
standard deviation were determined. Energy Dispersive X-ray (EDX) analysis was
performed using FEI XL30 W instrument equipped with Apollo X Silicon Drift
detector. Atomic distribution of the surface of the sorbents was obtained from randomly
selected points.
The amidoximation reaction and uranyl sorption were investigated via Fourier
Transform Infrared Radiation (FT-IR) spectroscopy. FT-IR measurements of the
samples before and after the amidoximation reaction as well as uranyl sorbed-fibers
were performed by Perkin Elmer Spectrum 100 FTIR Spectrometer (Shelton, USA)
Page 84
63
with Pike Miracle Single Reflection Horizontal ATR Accessory. The amount of
uranium ions was determined using an inductively coupled plasma (ICP) spectrometer
(Agilent 7500ce Series, Japan). The ICP-MS operation parameters are given in Table
4.2. Standard solutions in 5.0, 10.0, 25.0, 50.0, 100.0, 200.0, 500.0, and 1000.0 μg Lˉ1
concentrations were prepared by appropriate dilution of 10.0 mg Lˉ1 of stock U(VI)
solution to the required volume. All samples and standard solutions were acidified
through the addition of proper amount of concentrated HNO3 to produce 1.0% (v/v)
acid in the final solution. The percentage of uranium sorption was calculated using
Equation 4.1, where Ci is the initial and Cf is the final concentration in the solution.
100%
i
fi
C
CCSorption (4.1)
The speciation analysis of uranium-containing ions at various pH values was
performed using Visual Minteq software.
Table 4.2. ICP-MS operation parameters
Operation Parameters Value
RF power 1550 W
Make up gas flow rate 0.1 L minˉ1
Argon carrier gas flow rate 0.9 L minˉ1
Octopole collision gas flow rate 4.5 mL minˉ1
Chamber temperature 2 °C
Sample depth 7.8 mm
Nebulizer Concentric
Nebulizer pump 0.1 rps
Tune setting (m/z) 7/89/205
Isotopes monitored (m/z) 238
U
Page 85
64
4.3.3. Polymerization of Acrylonitrile
Polymerization of acrylonitrile was carried out at 60 °C using benzoyl peroxide
as an initiator. AN (0.076 mol) and BPO (0.0076 mol) were mixed in a sealed glass tube
and after sonication for 15 min. Three cycles of a freeze-thaw process were applied
prior to polymerization. The glass tube containing the AN and BPO were placed into a
preheated bath at 60 °C; the polymerization was performed under an N2 atmosphere, and
it was stopped after the desired time by quenching to room temperature. The resulting
product were dissolved in DMF and purified in methanol under continuous mixing
along 3 hours, then filtrated in vacuum. After filtration, the polyacrylonitrile were dried
under vacuum for 6 hours at 40 °C.
The viscosity average molecular weight of the synthesized polymer was
determined by using a petrotest capillary viscosimeter (Dahlewitz, Germany) placed in
a water bath thermostatically controlled at 25 °C. The polymerization products were
dissolved in DMF at concentrations ranging from 1.3 g Lˉ1 to 3.9 g Lˉ
1. Calculations
were made using the Mark-Houwink equation [η] = KMvα, where K and α are the
specific constants for a given polymer which vary for the used solvent system and
temperature (Seferis 1999). K and α of PAN are equal to 0.21 cm
3 gˉ
1 and 2.20,
respectively. The polymer used in the experiment has viscosity molecular weight (Mv)
in the range of 180 kg molˉ1.
400 MHz NMR (Varian VnmrJ, Palo Alto, USA) was employed to determine
the number average molecular weight (Mn) of the polymer and it was calculated as 14
kg molˉ1. The ratio of protons on the end-groups to the protons on the polymer
backbone was determined by integration of 1H NMR signals.
4.3.4. Electrospinning of Polyacrylonitrile
The electrospinning solution of the synthesized PAN was prepared by dissolving
the polymer (4 wt%) in DMF. The PAN solution was placed in a 20 mL syringe fitted
with a metallic needle of 0.2 mm of inner diameter. The syringe was fixed horizontally
on the microinfusion pump (LION WZ-50C6) and the electrode of the high voltage
power supply (Gamma High Voltage Research Ormond Beach, FL, US) was attached to
the metal needle tip. The flow rate of the polymer solution was 2 mL hˉ1, the voltage of
Page 86
65
15 kV was applied to the needle and the distance between the needle and the collector
was 5 cm. The electrospinning process was performed at room temperature and the
resulting fiber mat was held in vacuum at 50 °C overnight to remove any residual
solvent.
4.3.5. Surface Treatment of PAN Fibers
The hydrophilic character of the electrospun PAN fiber was increased by
converting the nitrile groups of AN to amidoxime groups. For the amidoximation
reaction, a recipe given in the literature was followed (Sahiner et al. 1999).
Hydroxylamine hydrochloride (0.375 g), sodium hydroxide (0.375 g), and 25.0 mg of
PAN nanofiber mats were added to a 50 mL beaker and continuously stirred for 2 days
at RT. After surface reaction, the nanofiber mats were washed several times with
distilled water to remove the remaining salts, and dried in a vacuum oven at 60 °C.
4.3.6. Sorption Studies
Aqueous U(VI) solutions were prepared by dissolving proper amount of
(UO2(CH3COO)2·2H2O) in ultrapure water. Column studies were carried out in order to
show the applicability of amidoximated-PAN fiber sorbent in the continuous removal of
uranyl from aqueous solution. A home-made microcolumn system involving Teflon
tubing with internal diameter of 1.5 mm and 50 mm of height was employed in the
experiments. The 30 mm height of tubing was filled with amidoximated-PAN fiber
sorbents. Cylindrically shaped small sponge pieces were squeezed into both ends of the
tube such that amidoximated-PAN fibers were sandwiched and the back-pressure of the
continuous flow was prevented. The schematic representation of the experimental setup
of column study is illustrated in Figure 4.1. The U(VI) solution flowed downward flow
at a flow rate of 0.15 mL minˉ1 using a peristaltic pump. The samples of effluent were
collected regularly at 3 mL volume fractions at different initial concentrations and
solution pH values.
The effect of pH on the extent of sorption was conducted after adjusting the
initial pH’s of the solutions to 3.0, 4.0, and 8.0 using 0.01 M, 0.1 M, 1.0 M of HNO3
and NH3 solutions. In each experiment 45.0 mL of U (VI) solution was circulated.
Page 87
66
The experiments investigating the effect of initial concentration was performed
at 5.0, 10.0, 50.0, and 100.0 µg gˉ1
concentrations. In each study 3.0 mL of U(VI)
solution (adjusted to pH of 4.0) was circulated.
Figure 4.1. Schematic representation of experimental setup of column experiment
In order to study the effect of repetitive loading, a series of experiments were
carried out. In each experiments 3 mL aliquots of fresh U(VI) solutions having initial
concentrations of 50.0, and 100.0 µg gˉ1
was loaded for 14 times. The experiments were
further continued using 100.0 µg gˉ1
solution and the sorbent was exposed to eighty
successive doses of 3.0 mL solutions.
For desorption experiments, the uranyl ion loaded sorbent was treated with 3.0
mL aliquots of 0.5 M NaHCO3, 0.5 M C6H17N3O7, and 0.1 M EDTA. Consecutive
sorption-desorption cyles were performed to study the reusability of the amidoximated-
PAN fiber sorbent. The eluted solutions were then analyzed for possibly sorbed and
released U(VI) ions.
PAN-oxime
fiber layers
Peristaltic
pump
U (VI) solution
Eluent
sponge
sponge
PAN-oxime
fiber layers
Peristaltic
pump
U (VI) solution
Eluent
PAN-oxime
fiber layers
Peristaltic
pump
U (VI) solution
Eluent
sponge
sponge
Page 88
67
4.4. Results and Discussion
The main aim of this work was to design a sorbent material as well as an easily
practicable column system to remove contaminating uranium(VI) ions from aqueous
solutions. For this aim, we prepared submicron-diameter polyacrylonitrile (PAN) fibers
using electrospinning method. The surface of the fibers was modified by amidoxime
groups and the sorption ability of the both modified and unmodified fibers was studied.
4.4.1. Fabrication of PAN Fibers
PAN was synthesized through free radical bulk polymerization at 60 °C using
BPO as an initiator. Figure 4.2 shows NMR spectra of acrylonitrile and
polyacrylonitrile. The number average and viscosity molecular weights are 14 and 180
kg molˉ1, respectively. PAN fibers were obtained through electrospinning of PAN/DMF
solution at different concentrations. The concentration was fixed to 4 wt% in terms of
solid content. A series of trials were carried out to obtain bead free and uniform
morphology at different potential differences and flow rates. The electrospinning
process (the fiber fabrication) was optimized at 3 kV cmˉ1 potential difference and 2 mL
hˉ1 flow rate.
Figure 4.2. 1H NMR spectra of acrylonitrile (AN) monomer and poly(acrylonitrile)
(PAN) polymer in CDCl3
Page 89
68
4.4.2. Surface Treatment of PAN Fibers
The surface modification of PAN fibers was performed by a wet chemical
process. Figure 4.3 shows the proposed reaction mechanism of hydroxylamine
hydrochloride with PAN nitrile group in a neutralized medium. The nitrile groups on
the surface of PAN fibers react with H2NOH at room temperature. The hydroxylamine
undergoes nucleophilic addition to the fibers surface and a subsequent arrangement to
carboximidamide. Eventually, the surface of the fibers is functionalized for chelating
uranyl cations. The conversion of nitrile group in PAN into amidoxime group (Cn) was
estimated using the following equation (Lin et al. 1993).
1001
0
0
01 xM
Mx
W
WWCn
(4.2)
Here, W0 and W1 are the weights of the PAN nanofiber mat before and after
amidoximation reaction, respectively. M1 is the molecular weight of hydroxylamine (33
g molˉ1) and M0 is the molecular weight of acrylonitrile repeat unit (53 g molˉ
1).
Conversion of the nitrile group in polyacrylonitrile into amidoxime group was
calculated as 30%. The resulting fibers were soft and light yellow and this observation
is compatible with previously reported results (Saeed et al. 2008).
Figure 4.3. The conversion of nitrile groups to amidoxime groups in PAN fiber
C N
+ H2NOHC N
H2N
HOC N
NHO
H
H
C NH
HN
HOC NH
HN
HO
C NH
NHO
H
C NH2
NHO
C N
+ H2NOHC N
H2N
HOC N
NHO
H
H
C NH
HN
HOC NH
HN
HO
C NH
NHO
H
C NH2
NHO
RTC N
+ H2NOHC N
H2N
HOC N
NHO
H
H
C NH
HN
HOC NH
HN
HO
C NH
NHO
H
C NH2
NHO
RT
C N
+ H2NOHC N
H2N
HOC N
NHO
H
H
C NH
HN
HOC NH
HN
HO
C NH
NHO
H
C NH2
NHO
C N
+ H2NOHC N
H2N
HOC N
NHO
H
H
C NH
HN
HOC NH
HN
HO
C NH
NHO
H
C NH2
NHO
RTC N
+ H2NOHC N
H2N
HOC N
NHO
H
H
C NH
HN
HOC NH
HN
HO
C NH
NHO
H
C NH2
NHO
RT
Page 90
69
Figure 4.4 shows FTIR spectra of PAN fiber and amidoximated-PAN fiber as
well as the fiber after sorption of uranyl ions. A characteristic band of nitrile groups at
2260 cmˉ1
is present on the surface of all types of fibers. In the FT-IR spectrum of
amidoximated-PAN fibers, there are additional bands arising from the newly formed
H2N-C=N-OH groups that supports the successful surface modification. The reaction of
hydroxylamine with nitrile groups leads to the formation of C=N groups characterized
by the band at 1665 cmˉ1. The broad band at 3000-3700 cmˉ
1 can be attributed to H-
bondings of NH2 and O-H in the amidoxime structure (panel a). Upon the sorption of
UO22+
ions, a shift was observed in the stretching band of C-N from 1218 cmˉ1
to 1248
cmˉ1
(panel b). The implication of this on the sorption mechanism is discussed in the
last section.
Figure 4.4. FTIR spectra of (a) PAN and amidoximated-PAN fibers, (b) uranyl ion
adsorbed amidoximated-PAN fibers
4000 3500 3000 2500 2000 1500 1000
UO22+
ion adsorbed amidoximated-PAN
Wavenumber (cm-1)
-OH
-C=N
N-O
-C≡N
-C-H-N-H
-C-H
C-N
(a)
(b)
-OH
N-O
C-N
PAN
Amidoximated-PAN
4000 3500 3000 2500 2000 1500 1000
UO22+
ion adsorbed amidoximated-PAN
Wavenumber (cm-1)
-OH
-C=N
N-O
-C≡N
-C-H-N-H
-C-H
C-N
(a)
(b)
-OH
N-O
C-N
PAN
Amidoximated-PAN
Page 91
70
Figure 4.5 presents SEM micrographs and diameter distributions of PAN,
amidoxime-modified PAN, and the modified fibers after uranyl sorption. Panel a of Fig.
4.5 shows PAN fibers prepared from 4 wt % PAN/DMF solution. The average fiber
diameter (AFD) was 122±39 nm. The fibers appear to possess a homogeneous
morphology with some surface roughness. Upon the amidoximation process, the AFD
came out to be slightly larger (127±24 nm) than untreated PAN fibers (panel b). The
sorption of uranyl ions by the amidoximated-PAN fibers seemed to render the fiber
thicker and undulating, as the AFD for the fibers increased to 132±26 nm (panel c). No
serious deterioration of the surface texture or roughness was observed after the sorption
process, and the morphology and the integrity of fibers were preserved.
Figure 4.5. Scanning electron micrographs and corresponding fiber diameter
distributions of (a) PAN fibers, (b) amidoximated-PAN fibers and (c)
amidoximated-PAN fibers after uranyl ion sorption
20 40 60 80 100 120 140 160 180 200
AFD= 122 39 nm
20 40 60 80 100 120 140 160 180 200
Fre
qu
ency
AFD=127 24 nm
20 40 60 80 100 120 140 160 180 200
Fiber Diameter (nm)
AFD=132 26 nm
(a)
(b)
(c)
20 40 60 80 100 120 140 160 180 200
AFD= 122 39 nm
20 40 60 80 100 120 140 160 180 200
Fre
qu
ency
AFD=127 24 nm
20 40 60 80 100 120 140 160 180 200
Fiber Diameter (nm)
AFD=132 26 nm
(a)
(b)
(c)
Page 92
71
The elemental composition of amidoximated-PAN fiber after uranyl ion sorption
was elucidated using EDX analysis. Figure 4.6 shows a typical EDX spectrum of uranyl
ion-loaded fiber, exposed to an initial concentration of 100 mg Lˉ1. High U(VI) initial
concentration was selected due to the detection limit of EDX. The quantification is
given in Table 4.3. C, N, and O signals originated from polyacrylonitrile and the
presence of uranium signal indicated that uranium was fixed on the surface of the
amidoximated PAN fiber. The atomic percentage of U on the fiber surface was within
the range of 0.50-1.09.
Figure 4.6. EDX spectrum of amidoximated-PAN fiber mat after uranyl ion sorption at
pH 4.
Table 4.3. The weight percentages and atomic percentages (in brackets) of C, N, O, and
U in amidoximated-PAN fiber after column sorption
Element C N O U
Sampling Area 1 58.69 (67.83) 26.19 (25.95) 6.60 (5.72) 8.52 (0.50)
Sampling Area 2 59.62 (68.14) 26.21 (25.69) 6.70 (5.75) 7.48 (0.43)
Sampling Area 3 55.62 (70.27) 20.39 (22.09) 6.87 (6.55) 17.06 (1.09)
0.30 1.28 2.26 3.24 4.22 5.20
Energy (keV)
Page 93
72
4.4.3. Sorption Studies
The sorption capability of amidoxime-modified PAN fibers was compared
with that of unmodified PAN fibers. The unmodified PAN fibers exhibited 19%
sorption; on the other hand, amidoxime modified PAN fibers showed nearly 4 times
higher sorption capacity (81%). It is worth noting that sponge has no contribution to
uranyl sorption. The surface modification also transformed the hydrophobic nitrile
groups into hydrophilic amidoxime groups, and the sorption of uranyl ions increased
due to the chelating ability of amidoxime groups (Pekel and Guven 2003, Saeed et al.
2008, Takeda et al. 1991).
4.4.3.1. Effect of pH
The initial pH value of solution is a significant parameter in uranium(VI)
sorption. Figure 4.7 shows the speciation diagram of U(VI) as a function of pH (panel
a), and the extent of sorption of U(VI) ions on amidoximated-PAN fiber at different pH
values (panel b). The percent U(VI) uptake increased with increasing pH from 3.0 to
4.0. The amidoximated-PAN fiber sorbent seemed to demonstrate maximum sorption at
pH 4.0. At this pH, UO22+
ion is main (approximately 85% of the U(VI)) species among
other chemical forms. Under lower pH values, uranium is still present in the form of
free UO22+
ions, however competitive sorption with protons occurs, and ion-exchange
interactions are favored (Hudson et al. 1999, Sylwester et al. 2000). Protonation can
occur on the imino group of amidoxime (pKa 5.95) (Koikov et al. 1998), leading to a
decrease in the chealating ability. For solutions adjusted at pH above 4.0, hydrated
uranyl cations like UO2(OH)+, [(UO2)3(OH)5]
+, UO2(OH)2, [UO2(OH)3]
-, and
[UO2(OH)4]2-
seem to be dominant according to the speciation analysis. In high pH
media, carbonate also might contribute as ligands in solutions open to atmosphere. The
change in the chemical form in terms of charge and number of hydroxyl ligands
associated with possible steric limitations might be expected to decrease the extent of
fixation of U(VI) at higher pH values. The major species present in solution at pH of 8.0
is the neutral uranyl cations (UO2(OH)2), the liability of which to complexation is less
than the positively charged U(VI) species, the thing expected to result in lower extent of
sorption.
Page 94
73
Figure 4.7. (a) Speciation diagram of U (VI), and (b) microcolumn study for U (VI) at
different pH values (b). (Reaction conditions: The initial U(VI)
concentration of 100 µg L-1
, 0.15 mL min-1
flow rate, 25.0 mg sorbent)
4.4.3.2. Effect of Initial Concentration
The effect of initial concentration on the extent of removal of uranyl ions by
amidoximated-PAN fiber was investigated. Throughout these experiments, a fixed
amount of sorbent (25.0 mg) was employed, and the initial concentration of U(VI)
solutions varied in the range from 5 µg Lˉ1 to 100 µg Lˉ
1 at a fixed pH of 4.0. Figure 4.8
displays uranyl ion sorption as a function of initial concentration. The amount of
adsorbed uranyl ions increased with increasing the initial uranyl ion concentration, and
at initial uranyl concentration of 100 µg Lˉ1, the sorption approached the saturation
plateau. The observed behavior is probably due to the decrease in hydration effects of
water, increase of entropy effects of ions in solution, and consequently a greater
mobility of the uranyl ions as concentration is increased. In addition, when more U(VI)
ions are present in the solution, higher fraction of available active sites takes part in the
sorption process (Sureshkumar et al. 2010). This could be attributed to the associated
limitation in the number of water molecules available for hydration of the exposed
hydrophilic groups at the fiber surface.
0.0 10.0 20.0 30.0 40.0 50.00
20
40
60
80
pH 8
pH 4
% S
orp
tio
n
Volume (mL)
pH 3
2 4 6 8 10 12 140
2
4
6
8
10
Co
ncen
trati
on
(x
10
-8 m
ol/
L)
pH
UO2
2+
UO2(OH)
2
UO2(OH)
+
[(UO2)
3(OH)
5]
+
[UO2(OH)
3]
-
[UO2(OH)
4]
2-
a) b)
0.0 10.0 20.0 30.0 40.0 50.00
20
40
60
80
pH 8
pH 4
% S
orp
tio
n
Volume (mL)
pH 3
2 4 6 8 10 12 140
2
4
6
8
10
Co
ncen
trati
on
(x
10
-8 m
ol/
L)
pH
UO2
2+
UO2(OH)
2
UO2(OH)
+
[(UO2)
3(OH)
5]
+
[UO2(OH)
3]
-
[UO2(OH)
4]
2-
a) b)
Page 95
74
Figure 4.8. Uranyl ion sorption at various initial concentrations. (Reaction conditions:
3.0 mL sample volume, 0.15 mL·min-1
flow rate, 25.0 mg sorbent, at pH
4.0)
4.4.3.3. Repetitive Usability
To test the repetitive usability of the amidoximated-PAN fiber sorbent, 3 mL
portions of fresh U(VI) solution at the initial concentrations of 100 µg Lˉ1 and 50 µg Lˉ
1
were exposed to fiber samples for 14 successive trials. The results are presented in Fig.
4.9. The amidoximated-PAN fiber sorbent seems to be effective in removal of aqueous
U(VI) ions even after 14 consecutive uses. In the initial trials, more uranyl ions appear
to be removed at higher initial concentration, which is in line with results above. None
the less, at the initial concentration U(VI) initial concentration of 100 µg Lˉ1, the
percent sorption seems to decrease gradually with more applications of the fiber. It is
worth noting that the repetitive loading experiments continued for 80 trials before
saturation of the sorbent was reached. (Figure 4.10) The results showed that more than
85 % uranyl ion was sorbed after one use, and although sorption ability towards uranyl
ions decreased steadily, 46 % removal of uranyl ions can still be achieved even at the
eightieth trial of the same sorbent in the column. The most prominent consequence of
this experiment is the high capacity of the sorbent under continuous flow.
5.0 25.0 45.0 65.0 85.0 105.0
10.0
30.0
50.0
70.0
90.0
% S
orp
tio
n
Initial Concentration (g L-1)
5 ppb
10 ppb
50 ppb100 ppb
Page 96
75
Figure 4.9. Variation of percent sorption of uranyl ion with the number of repetitive
usage of the same fiber sorbent at the initial U(VI) concentrations of 50 µg
Lˉ1
and 100 µg Lˉ1. (Reaction conditions: 3.0 mL sample volume, 0.15 mL
minˉ1 flow rate, 25.0 mg sorbent, at pH 4.0)
Figure 4.10. Variation of percent sorption of uranyl ion for 80 repetitive trials (initial
U(VI) concentration of 100 µg Lˉ1,
0.15 mL minˉ
1 flow rate, 25.0 mg
sorbent, at pH 4.0)
1311
97
53
1 0
20
40
60
80
100
100 g×L -1
% S
orp
tio
n
Number of Uses
50 g×L -1
0 10 20 30 40 50 60 70 800
20
40
60
80
% S
orp
tion
Number of Uses
Page 97
76
The cumulative fixation of uranyl ions after tens of trials is interesting. The first
conclusion to draw from this behavior is that the fibers possess a high density of
sorption sites in comparison with the employed concentration of uranyl ions. The
second conclusion relates with the apparent effectiveness of the hydration forces in
solution. For ions with high charge like U(VI), the chemical potential is largely affected
by the hydration forces in solution, especially in dilute solutions. As long as the
chemical potential of the adsorbate on the surface is less than its chemical potential in
solution, sorption proceeds spontaneously. When the ionic concentration is high, the
ions become more mobile (their chemical potential increases) due to ionic repulsions,
and as a result can reach the surface/compete to sorption sites more readily. This seems
to be achieved when a fresh solution is fed into the column.
4.4.3.4. Desorption Tests
The uranyl ion loaded amidoximated-PAN fiber sorbents were subsequently
treated with different desorbing eluents. NaHCO3, EDTA, and ammonium citrate were
employed as chelating agents for the release of uranyl ions and the regeneration of the
sorbent. Figure 4.11 shows the elution curves which presents almost similar behavior in
each case. Most of the U(VI) ions were desorbed within the first 3.0 mL cycle, and the
amounts of desorbed metal ions were almost unchanged. The desorption percentages of
U(VI) were 80% for 0.5 M NaHCO3, 45% for 0.5 M ammonium citrate, and 34% for
0.1 M EDTA. Therefore, NaHCO3 was selected as desorbing eluent due to its relatively
higher desorption yield. Uranium forms negatively charged or neutral carbonate
complexes, and adsorbed uranyl could be eluted from the sorbent using NaHCO3
through the addition of carbonate ions as ligands to uranyl complexes.
Figure 4.12 displays the reusability of the fiber sorbent in five
sorption/desorption cycles using 0.5 M NaHCO3. After five cycles, the efficiency of
sorption decreased from 86.0% to 59.5% while the recovery of U(VI) decreased from
80.0% to 55.0%. Therefore, NaHCO3 can regenerate the sorbent effectively thus
facilitating the reuse of this new fibrous material.
Page 98
77
Figure 4.11. Uranyl ion desorption as a function of eluted volume. (Reaction conditions:
The initial U(VI) concentration of 100 µg Lˉ1, 0.15 mL minˉ
1 flow rate,
25.0 mg sorbent)
Figure 4.12. Consecutive sorption/desorption cycles of amidoximated-PAN fiber for
100 µg Lˉ1 of U(VI) solution using 0.5 M NaHCO3 as desorbing agent.
0.0 3.0 6.0 9.0 12.0 15.0 18.00.0
20.0
40.0
60.0
80.0
% D
eso
rpti
on
Eluted Volume (mL)
NaHCO3
C6H17N3O7
C10H16N2O8
0 1 2 3 4 5 60.0
20.0
40.0
60.0
80.0
% S
orp
tio
n/d
eso
rpti
on
Number of Cycles
Sorption
Desorption
Page 99
78
4.4.3.5. Brief Comments on Sorption Mechanism
As mentioned previously, the amidoximated-PAN fiber sorbent demonstrated
maximum sorption at pH 4.0. Speciation analysis discussed previously suggests that, at
this pH, approximately 85% of the U(VI) exists in the UO22+
chemical forms. From the
sorbent side, as shown above based on FTIR characterization, the surface of the
functionalized fiber is dominated by hydroxyl, amine, and nitrile groups. In acidic
media these groups would normally be expected to undergo protonation. Thus at pH of
4.0, the chemical forms of the sorbent surface and the sorbate ions does not support an
electrostatic hypothesis of sorption. Thus, the fixation of the UO22+
ions might be
expected to proceed via formation of surface complexes that possess coordinative
nature, with the lone pairs on O and N atoms in the surface groups playing the main role
in interaction with the uranyl species.
The interaction of UO22+
ions with amidoximated-PAN fibers is reflected in a
blue shift in the stretching band of C-N from 1218 cm-1
to 1248 cm-1
, as mentioned
above in section 4.4.2. This result is compatible with previous works. For example,
Pekel and Guven (Pekel and Guven 2003) observed similar type of shift at C-N
streching band for amidoximated poly(acrylonitrile/N-vinylimidazole) complexing
sorbent and was ascribed as proof for the interaction of UO22+
ions with vinylimidazole
ring.
Figure 4.13. Speculative binding mechanism
amidoximated-PAN
fibers
UO2
+2
C = N - OH
H2N
HO - N = C
NH2
amidoximated-PAN
fibers
UO2
+2
C = N - OH
H2N
HO - N = C
NH2
Page 100
79
It is proposed that the sorption of uranyl oxo-cations with amidoximated-PAN fibers is
achieved by virtue of the strong chelating ability of amidoxime groups, which act as
bidentate ligands. Based on the above discussion, a tentative binding mechanism can be
suggested in Figure 4.13. This is in line with previously suggested chelation
mechanisms. For example, Hirotsu et al. (Hirotsu et al. 1986) reported that the sorption
of uranium originated from ligand exchange between carbonate ions and amidoxime
groups accompanied by deprotonation of the amidoxime groups. Similarly, Pekel et al.
(Pekel et al. 2004) proposed that the binding of amidoxime group to UO22+
ions
proceeded by replacement of protons by UO22+
ions.
More spectroscopic and structural investigations are required to make more
precise and detailed comments on the sorption mechanism.
4.5. Conclusion
This study demonstrated that amidoximated-PAN fibers produced by
electrospinning form an effective sorbent for the removal of U(VI) from aqueous media
via column-type operations. In the fabrication process, first, PAN fibers were produced.
Then, a wet chemical process was applied for surface modification of PAN fibers. The
nitrile groups on PAN fibers were converted to amidoxime groups using hydroxylamine
hydrochloride in a neutralized medium. The surface functionalized PAN fiber network
provided higher metal binding ability. The extent of U(VI) sorption on the fibers was
found to depend on the pH of the medium and the initial concentration of the salt. The
optimum pH for U(VI) sorption by amidoximated-PAN fibers was found to be 4.0, at
which UO22+
ion is the main species. The adsorbed amount of U(VI) ions increased with
an increase in initial U(VI) concentration. The ease and applicability of the process we
propose in filtration can offer a convenient method for the removal of U(VI) ions via a
column system. Moreover, the amidoximated-PAN fibrous filter material used in this
study has high mechanical resistance, sorption ability, and efficient reusability which
are in fact desired for filtration applications. Based on our preliminary results, this
material is also capable to uptake various undesirable ions such as Fe(III), Cu(II), and
Cd(II) from aqueous solutions. A detailed study dealing with isotherms and sorption
mechanisms is underway.
Page 101
80
CHAPTER 5
HUMIDITY SENSING PROPERTIES OF ZnO-BASED
FIBERS BY ELECTROSPINNING
5.1. Abstract
Zinc oxide (ZnO) based fibers with a diameter of 80-100 nm were prepared by
electrospinning. Polyvinyl alcohol (PVA) and zinc acetate dihydrate were dissolved in
water and the polymer/salt solution was electrospun at 2.5 kV×cm1
. The resulting
electrospun fibers were subjected to calcination at 500 C for 2 h to obtain ZnO-based
fibers. Humidity sensing properties of the fiber mats were investigated by quartz crystal
microbalance (QCM) method and electrical measurements. The adsorption kinetics
under constant relative humidity (RH) between 10 % and 90 % were explained using
Langmuir adsorption model. Results of the measurements showed that ZnO-based fibers
were found to be promising candidate for humidity sensing applications at room
temperature.
5.2. Introduction
Sensing and controlling humidity are particularly significant for both human life
and various industrial fields. The major domestic applications of humidity sensors have
been the humidity control in heating, ventilating, and air conditioning (HVAC) systems,
food packaging, greenhouse agriculture, the production of electronic devices,
automotive industries and in meteorology stations. In responds to the strong demands
for automatic control systems, reliable, cheap, sensitive humidity sensors operated at
ambient temperatures are of critical importance (Pelino et al. 1994).
Sensing devices based on metal oxide semiconductors with nanostructures have
perfect chemical reactive surfaces that have water adsorbing and desorbing properties,
thermal stabilities, and mechanical durability (Zhang et al. 2005, Park et al. 2010,
Okur, Uzar, et al. 2012, Liu et al. 2009). The considerable attention has been focused on
Page 102
81
the studies of one dimensional (1D) nanostructured metal oxides, i.e. nanorods (Zhang
et al. 2005, Qi et al. 2008), nanowires (Zhang et al. 2005, Okur, Uzar, et al. 2012),
nanoparticles (Erol et al. 2010), nanotetrapods (Qiu and Yang 2007), or nanofibers
(Zhang et al. 2010, Wang, Li, et al. 2009, Wang et al. 2008, Qi et al. 2009, Park et al.
2009, Ding et al. 2009), and their influence on the humidity sensing performance. Many
available techniques such as carbothermal reduction synthesis (Wu et al. 2008),
chemical vapor deposition (CVD) (Wu and Liu 2002), electrospinning (Wang et al.
2008), hydrothermal synthesis (Liu and Zeng 2003), vapor-liquid-solid (VLS) (Xia et
al. 2008), conventional precipitation (Yadav et al. 2009, 2008) have been attempted to
obtain nanostructures. Among them, electrospinning provides a convenient and facile
route for the fabrication of fibrous materials possessing high surface area, uniform
diameters and variety of composition. Electrospinning is a facile and robust method for
the production of not only polymeric (Demir et al. 2002), but also composite (Demir et
al. 2004, Demir et al. 2008) and ceramic fibers (Ramaseshan et al. 2007) with diameters
ranging from several nanometers to few micrometers. Moreover, chemistry tool box of
electrospinning process is very wide. To date, > 200 polymer/solvent systems have been
processed by this method. In addition, electrospun mats have superior feature compared
to the other in terms of mechanical property. It provides mechanical integrity even if it
is subjected to calcination process.
Zinc oxide, which is a wide band gap (3.37 eV) semiconductor with large
exciton binding energy (60 meV) (Demir et al. 2008, Ozgur et al. 2005, Ramaseshan et
al. 2007) is an ideal candidate on the production of sensors (Ding et al. 2010, Hess et al.
2009). Previously, Qiu and Yang (Qiu and Yang 2007) presented that ZnO nanotetrapod
film exhibited much higher sensitivity to humidity than ZnO nanoparticle one and
investigated the response and recovery time as 36 and 17 s, respectively. Hu et al. (Hu
et al. 2008) evaluated response (50 s) and recovery (6 s) behavior of ZnO colloidal
nanocrystal clusters. An efficient humidity sensor based on ZnO nanorods was reported
by Qi and co-workers (Qi et al. 2008). LiCl-doped ZnO nanofiber humidity sensor was
studied by Wang et al. (Wang, Li, et al. 2009) The best result is obtained for 1.2 wt%
LiCl-doped sample, which exhibits high humidity sensitivity, rapid response (3 s) –
recovery (6 s) and good reproducibility. Qi et al. (Qi et al. 2009) suggested 5.7 wt%
KCl-doped ZnO nanofibers as humidity sensor with super-rapid response (2 s) and
recovery (1s). Zhang et al. recently showed a contribution on Na+-doped ZnO nanofiber
membrane for humidity sensor underlying the effect of NaCl doping as 4.6 wt% and
Page 103
82
reported the response (3 s) and recovery (6 s) behaviors. However, the humidity sensing
properties and adsorption-desorption kinetics of pure ZnO nanofibers have not been
reported. In the present study, we demonstrate a simple and effective route for the
synthesis of ZnO nanofibers with rapid response (0.5 s) and recovery (1.5 s) to
humidity. The adsorption kinetics of the fiber sensor was investigated by QCM
technique which is one of a wide branch of surface acoustic wave (SAW) techniques
(Ding et al. 2009). The change in resonance frequency of QCM was observed with
increasing relative humidity up to 90 %. The adsorption kinetic parameters were
examined using Langmuir model.
5.3. Experimental Section
5.3.1. Preparation and Characterization of ZnO Nanofibers
In a typical procedure, a sample of 2.5 g of zinc acetate dihydrate
(Zn(CH3COO)2.2H2O, Sigma-Aldrich) was mixed with 4.0 g of polyvinyl alcohol
solution (18 wt%) (PVA, Sigma-Aldrich, Mw = 30,000-70,000 g molˉ1) stirred for 5 h in
a water bath at 60 ºC. The metal concentration of the composite was increased by
adding zinc acetate dihydrate, and the PVA/Zn(CH3COO)2.2H2O composites with
Zn(CH3COO)2.2H2O concentrations ranging from 10 to 20 wt% were obtained. To
perform the electrospinning process, the prepared solution was loaded into a plastic
syringe and 15 kV potential difference was applied to the tip of a needle of syringe. The
distance between the syringe and the metal collector was 6 cm. The feeding rate was
kept constant at 4.5 mL hˉ1 using a microsyringe pump (LION WZ-50C6). The obtained
electrospun fibers were dried under vacuum at 70 ºC for 8 h and calcined for 5 h at 500
ºC with a heating rate of 4 ºC min in the furnace. Figure 5.1 illustrates the procedure of
manufacturing electrospun PVA/ZnO composite fibers.
The morphology of ZnO nanofibers was observed under scanning electron
microscopy (SEM) using a Philips XL-30S FEG. The diameter of fibers was measured
using an image processing software, ImageJ. The crystalline structure of the samples
was analyzed using an X-ray diffractometer (Philips X’Pert Pro X-Ray Diffractometer)
with Cu Kα radiation.
Page 104
83
Figure 5.1. Schematic representation for preparation of PVA/ZnO composite fibers
5.3.2. Humidity Measurements Using QCM Technique
QCM technique has been used to determine the mass changes due to moist
molecules with a resolution of 1 ng/cm2. QCM consists of a quartz disk with 0.196
cm2 area between two Au coated electrodes on both sides. The mass change (Δm) on
surface of the quartz crystal was calculated from the frequency change (Δf) as shown by
Sauerbrey (Sauerbrey 1959);
(5.1)
where f0 is the resonant frequency of the fundamental mode of the QCM crystal,
A is the area of the gold coated electrodes on the quartz crystal, ρ is the density, and μ is
the shear modulus of quartz substrate. QCM with the model of CHI400A Series from
CH Instruments (Austin, USA) has been used to measure the change in the resonance
frequency due to mass loading of water molecules after exposure of the QCM electrodes
for various humidity levels between 10 % and 90 % relative humidity (RH). QCM is
connected via a USB interface to a computer. QCM electrodes used in our study are
made of AT-cut piezoelectric quartz crystal with oscillation frequencies between 7.995
PVA/Zn(Ac)2 fiber
Calcination
ZnO fiber
PVA/Zn(Ac)2.2H2O
solution
Electrospinning
15 kV-4.5 mL/h-6cm
500 ºC, 5 h
PVA/Zn(Ac)2 fiber
Calcination
ZnO fiber
PVA/Zn(Ac)2.2H2O
solution
PVA/Zn(Ac)2.2H2O
solution
Electrospinning
15 kV-4.5 mL/h-6cm
500 ºC, 5 h
A
mff
2
02
Page 105
84
MHz-7.950 MHz. The density (ρ) of the crystal is 2.684 g cmˉ3, and the shear modulus
(μ) of quartz is 2.947 × 10¹¹
g cmˉ1 sˉ
2. The change of 1 Hz corresponds to the mass of
1.34 ng of materials adsorbed onto the crystal surface of an area of 0.196 cm2. Both
QCM sensor and gold contacts for electrical measurements with 15 μm channel length
and 300 μm channel width fabricated with thermal evaporation technique under vacuum
of 510ˉ6 torr.
Figure 5.2 shows the experimental setup to investigate the adsorption and
desorption kinetics of ZnO nanofiber films under various humidity environments
between 10 % - 90 % RH at room temperature. Relative humidity value inside a test cell
with volume of 100 cc is varied between 10 % - 90 % by controlling the ratio of wet and
dry air flow via MKS flow-meter control system between 0-1000 sccm between 10
steps. The measurements were simultaneously taken using a combined system of QCM
sensor and a commercial Sensirion humidity sensor. The sensor has an EI-1050
selectable digital relative humidity and temperature apparatus with a response time of
4s. The humidity sensor is connected to a PC using a Labview program to collect data
via USB port controlled by U12 ADC system combined with a single chip sensor
module (SHT11) manufactured by Sensirion (Staefa, Switzerland).
Figure 5.2. The experimental QCM setup to measure the adsorption and desorption
kinetics of ZnO nanofiber films under various relative humidity conditions
between 10 % RH and 90 % RH.
Page 106
85
The commercial humidity sensor shows 10 % RH when 1000 sccm of dry air is sent
through the QCM cell, while it shows 90 % RH when 1000 sccm of wet air (obtained by
passing dry air through a bubbler kept at a constant temperature of 25 oC).
5.4. Results and Discussion
5.4.1. Structural Characterization of ZnO Nanofibers
The graphical demonstration of this entire process in given in Figure 5.1.
Aqueous solutions of PVA and zinc acetate dihydrate were mixed and homogeneous
solutions were subjected to electrospinning at 2.5 kV/cm. Figure 5.3. (a-d) shows SEM
micrographs of PVA/Zn(CH3COO)2 fibers (before calcination). They have smooth
surface and average fiber diameter (AFD) was in the range of 100 to 120 nm. The salt
content in electrospinning solution is one of the important parameters to control the
diameter of fibers. The dependence of the AFD on weight percentage of the salt is
shown in Figure 5.4. It exhibits an exponential growth with salt content. The ionic
strength of solution is directly proportional with salt concentration. This reflects an
increase in current during electrospinning process, i.e. solid content transferred from tip
to the grounded collector increases. Thus, thicker fibers are obtained in salty
electrospining solutions. The PVA/ Zn(CH3COO)2 fibers were subjected to calcination
at 500 ºC in air and ZnO-based fibers were obtained. In other words, the integrity of
fibers remains almost unchanged upon calcination process. However, a significant
reduction in diameter was observed approximately 20 % on average for all solutions we
tried. The occurence of shrinkage is due to the removal of PVA from the fiber volume
and crystallization of ZnO phase (Fig. 5.3(e-h)). In calcination process, the temperature
was fixed to 500 C at which nucleation and growth process readily occurs. Particulate
ZnO crystals are evident on the fibers.
Page 107
86
Figure 5.3. SEM micrographs of PVA/ZnO composite fibers and ZnO nanofibers with
respect to increasing amount of Zn(OAc)2.2H2O (a,e) 10 wt%, (b,f) 14 wt%,
(c,g) 17 wt%, (d,h) 20 wt%
Figure 5.4. Average Fiber Diameter (AFD) versus percent weight of Zn(OAc)2·2H2O
XRD pattern of the ZnO fiber mat is displayed in Figure 5.5a. From the
diffractogram, eight diffraction planes corresponding to (100), (002), (101), (102),
(110), (103), (112), (201) are present. They are characteristics signals of the wurzite
type ZnO phase (JCPDS 79-0207). Furthermore, the average crystallite size of the
a) b) c) d)
e) f) g) h)
Aft
er
calc
inati
on
Befo
re
calc
inati
on
a) b) c) d)a) b) c) d)
e) f) g) h)e) f) g) h)
Aft
er
calc
inati
on
Befo
re
calc
inati
on
10 12 14 16 18 20
80
90
100
110
120
Av
era
ge F
iber
Dia
mate
r (n
m)
Zn(Ac)2.2H2O (wt%)
after calcination
before calcination
Page 108
87
product was estimated by Debye-Scherrer equation employing on the maximum intense
reflection (101), it was found to be approximately 15 nm. This size is consistent with
the size of particles we observed in SEM micrographs. Figure 3.4(b) shows the FTIR
spectra of ZnO fibers. Along with the vibrational signal of ZnO at 600 cm-1
, an intense
signal of -CH2 stretching was also observed at around 1450 cm-1
. Moreover, the bands
at about 850 and 750 cm-1
are assigned to the vibrations of C-O, C-C groups,
respectively. This presence of these signals indicates that PVA still remains in the
system and polymeric residue is not removed completely upon calcination. This system
was subjected to thermogravimetric analysis to figure out the mass content of organics
after calcination process. According to this measurement, approximately 10 % organic
residue remains in the fibrous system. This amount of polymeric residue may be argued
about to reduce the humidity efficieny of material. However, this property meets the
requirement of many applications. It must be considered that pure inorganic fibers
cannot provide flexibility due to their brittle nature. The presence of low amount of
organics in the system may prevent the formation of undesirable brittle nature.
Figure 5.5. (a) X-ray diffraction pattern of ZnO nanofibers and the inset is an
enlargement of the ZnO (1 0 1) peaks for the calculation of crystallite size,
(b) FTIR spectra of ZnO nanofibers after calcination.
10 20 30 40 50 60 70 80
(2
01)
(112
)
(103
)
(110
)
(102
)
(101
)(0
02)(100
)
Nor
mal
ized
Int
ensi
ty
2 Theta
35 36 37 380,0
0,2
0,4
Nor
mal
ized
Int
ensi
ty
2 Theta
Crystallite size
15 nm
(a)
4000 3500 3000 2500 2000 1500 1000
% R
Wavenumber (cm-1)
-CH2-
C-O
C-C-O
Zn-O
(b)
10 20 30 40 50 60 70 80
(2
01)
(112
)
(103
)
(110
)
(102
)
(101
)(0
02)(100
)
Nor
mal
ized
Int
ensi
ty
2 Theta
35 36 37 380,0
0,2
0,4
Nor
mal
ized
Int
ensi
ty
2 Theta
Crystallite size
15 nm
(a)
4000 3500 3000 2500 2000 1500 1000
% R
Wavenumber (cm-1)
-CH2-
C-O
C-C-O
Zn-O
(b)
Page 109
88
5.4.2. QCM and Electrical Responses under Varying RH
Figure 5.6 shows both adsorption - desorption responses due to the change in
QCM resonance frequency comparing with simultaneously measured resistance changes
of ZnO nanofiber coated sensors. The RH lies in the range of 10 % and 90 %. The
negative frequency response (blue line) is given on the left side of the plot, while the
corresponding resistance (red circle) is presented on the right side of the plot. Three
types of adsorption and desorption cycles zoomed out in Figure 5.6b-d have been used
to observe reproducibility and sensitivity of ZnO nanofiber coated QCM sensors against
relative humidity changes. Resistance of the ZnO nanofiber sensor is changed on the
order of 4 under 12V applied bias voltage as a result of the possible disassociation of
the adsorbed moist molecules on the oxygen vacancies on the n-type ZnO surface
similar to our previous work (Erol et al. 2010). Figure 5.6b shows three cycles of QCM
and resistance responses when sent only dry and wet air consequently with 200s periods
to observe maximum adsorption and desorption kinetics.
-50
-40
-30
-20
-10
0
10
107
108
109
1010
1011
1012
0 40 80 120 160 200 240 280 320
F (Hz) Resistance (ohm)
F
(H
z)
Re
sis
tance (
ohm
)
Time (min)
90% RH
10% RH(a)
-50
-40
-30
-20
-10
0
10
107
108
109
1010
1011
1012
0 5 10 15 20
F (Hz) Resistance (ohm)
F
(H
z)
Re
sis
tance (
ohm
)
Time (min)
90% RH
10% RH(b)
-50
-40
-30
-20
-10
0
10
107
108
109
1010
1011
1012
20 30 40 50 60 70 80 90
F (Hz) Resistance (ohm)
F
(H
z)
Re
sis
tance (
ohm
)
Time (min)
90%
80%
70%
60%
50%
40%30%
20%15%
80%
70%
60%
50%40%
30%20%
15%10%
10%
(c)
-50
-40
-30
-20
-10
0
10
108
109
1010
1011
1012
160 180 200 220 240 260 280 300 320
F (Hz) Resistance (ohm)
F
(H
z)
Re
sis
tance (
ohm
)
Time (min)
90%
80% 80%
70%
60%
50%
40%30%
20%15%
70%
60%
50%
40%30%
20%15%
10%10%
(d)
Figure 5.6. Adsorption/desorption responses due to QCM resonance frequency changes
comparing with simultaneously measured resistance changes of ZnO
nanofiber coated sensors between 10 % and 90 % RH for 6 hours (320 min)
Page 110
89
QCM frequency counter is set to ‘0’ Hz as the starting point for the minimum
relative humidity at 10 % RH when full of dry air with 1000 sccm is sent through the
test cell. The negative QCM frequency response shows maximum change around - 43
Hz, when wet air with 1000 sccm is sent (at 90 % RH measured with Sensirion
humidity sensor). Resistance of the sensor is decreased from 5×10¹¹
to 7×10⁷ohm.
Figure 5.6c shows the long time (around 1h) stepwise adsorption and desorption
response of ZnO nanofiber loaded QCM and resistive sensors. To create step change in
the relative humidity inside the test cell, the wet/dry air ratio is increased to 1000 sccm
with 200s intervals. Both QCM frequency response and resistance change showed
similar behavior above 60 % RH during adsorption/desorption processes. Similar
responses are observed when short time relative humidity changes are applied. Figure
5.6d shows the short time (200 s) adsorption and desorption response of ZnO nanofiber
loaded QCM and resistive sensors. To create short time relative humidity pulses, the
wet/dry air flow ratio is increased as 100 sccm for each 200s periods, while after each
adsorption process, the maximum desorption process is applied by sending maximum
dry air with 1000 sccm. The results show that the response time against quick relative
humidity changes of ZnO nanofiber sensors are less than 0.5s for adsorption process,
while it is around 1.5s, 3 times larger for desorption process.
Figure 5.7 shows maximum adsorption/desorption responses due to QCM
resonance frequency and resistance changes of ZnO nanofiber sensors comparing with
relative humidity (RH) values simultaneously measured with a Sensirion commercial
RH sensor between 10 % and 90 % RH. There are two distinct behaviors for both QCM
and resistance signals before and after 60 % RH. The QCM resonance frequency
decreases linearly with relatively higher slope ( HzRHm /74.0 ) up to 75 % RH
with increasing relative humidity as shown in Figure 5.7c. Similar trend is observed in
resistance changes in Figure 5.7b. But resistance decreases exponentially with
increasing relative humidity as shown with exponential fit (R=2.14e-0.125xRH
ohm).
The hysteresis-like behavior in both QCM and resistance signals between
adsorption and desorption process for varying relative humidity between 10 % and 90 %
is clearly seen in Figure 5.7c. But the resistance hysteresis is quite larger during
desorption process compare to QCM frequency change. The exponential relationship
between QCM frequency and resistance changes is shown in Figure 5.7d. There is a
Page 111
90
dramatic exponential dependence of resistance change on the amount of absorbed moist
molecules during desorption process at higher relative humidity values due to possible
-50
-40
-30
-20
-10
0
10
0
20
40
60
80
100
0 5 10 15 20
F (Hz) Relative Humidity (%)
F
(H
z)
Re
lative
Hu
mid
ity (
%)
Time (min)
(a)
107
108
109
1010
1011
1012
0
20
40
60
80
100
0 5 10 15 20
Resistance (ohm) Relative Humidity (%)
Re
sis
tance (
ohm
)
Re
lative
Hu
mid
ity (
%)
Time (min)
(b)
-50
-40
-30
-20
-10
0
108
109
1010
1011
1012
0 20 40 60 80 100
F (Hz) Resistance (ohm)
F
(H
z)
Re
sis
tan
ce (
oh
m)
Relative Humidity (%)
adsorption
desorption(c)
y = 8.6284 - 0.73934x R= 0.99661
y = 2.1439e+12 * e^(-0.12482x) R= 0.93937
107
108
109
1010
1011
1012
-40 -30 -20 -10 0
Re
sis
tance (
ohm
)
F (Hz)
90% RH
10% RH75% RHadsorption
desorption
(d)
y = 3.8879e+11 * e^(0.055109x) R= 0.99714
y = 3.2461e+11 * e^(0.089947x) R= 0.98991
y = 1.0686e+100 * e^(5.1206x) R= 0.80846
Figure 5.7. Adsorption/desorption responses due to (a) QCM resonance frequency and
(b) resistance changes of ZnO nanofiber sensors comparing with (c) relative
humidity (RH) values simultaneously measured with a Sensirion commercial
RH sensor between 10 % and 90 % RH. (d) The exponential relationship
between QCM frequency and resistance changes
condensation. This exponential relationship between adsorbed moist molecules and the
increasing conductance of ZnO-based nanofiber sensors under varying relative humidity
was explained by Erol et al. with hopping transport mechanism of electrolytic
conductance (Erol et al. 2010). It is well-known that ZnO is n-type semiconductor due
to localized donor levels in the band gap caused by oxygen vacancies and interstitial Zn
atoms in the lattice. The oxygen vacancies become active sites for dissociation of the
water molecule (Schaub et al. 2001). The dipoles of the first hydroxylated layer of water
meniscus on the surface create an affinity for moisture molecules via Vander Walls
Page 112
91
forces for physisorption process. The electric field applied to the water molecules
between gold electrodes with 15 μm gap and under 12V is close to 0.8×10⁶ V mˉ
1.
Under such a high electric field, hydroxyl groups are formed providing protons as
charge carriers of the hopping transport. Hence electrolytic conduction causes an
exponential decrease in the resistivity of ZnO nanofiber-based humidity sensor.
The mechanism can also be viewed from macroscopic perspective. Interaction of
water molecules with ZnO fiber surface plays an important role in adsorption process.
The surface of ZnO fibers is sensitive to atmospheric moisture due to its high reactivity
with water molecules. The molecules can be adsorbed on metal oxide surface
molecularly either through H bonding or dissociated form of H2O. Therefore; metal
oxide surface is inevitably covered by surface adsorbed water molecules meaning that
there is a skin layer made up of surface adsorbed water molecules. The adsorbed water
on zinc oxide surface can be categorized into two distinctively different water species: i)
chemisorbed water containing rigid water species with restricted mobility near the solid
surface; ii) physisorbed water molecules that are very loosely adsorbed water molecules
which are mobile and can exchange slowly with gaseous water molecules in air (Nagao
1971a, Demir, Koynov, et al. 2007). Mass transfer of water molecules to and from the
interaction region is mainly mediated and facilitated by the latter type of water present
on the outermost surface. Demir et al previously showed the existence of surface-bound
water on ZnO using temperature dependence solid state nuclear magnetic (NMR)
spectroscopy (Demir, Castignolles, et al. 2007). Annealing of ZnO nanoparticles at mild
temperatures < 360 K were performed during NMR measurement. It was clearly
demonstrated that as the annealing process is performed, the proton signal originating
from the water species decreases. This result indicates the dynamic desorption process
taking place at the physisorbed layer of the watery skin of ZnO nanoparticles. We
believe that similar type of adsorption-desorption process takes place in our particular
fibrous ZnO system.
5.4.3. Theoretical Analysis of QCM Results Using Modified Langmuir
Model
The Langmuir adsorption isotherm model was frequently used to analyze
adsorption data to explain the adsorption-desorption kinetics of gas molecules in the
literature (Erol et al. 2010, Okur et al. 2010). Basically, the relationship between the
Page 113
92
surface adsorption and desorption rates and frequency shift ( f ) for QCM can be
expressed as following,
fkCkff
dt
fdda
)( max (5.2)
where maxf is the maximum frequency change at the maximum humidity range, C
is the concentration of the adsorbed gas, ka and kd are the adsorption and desorption
rates, respectively. Integration of the Equation 5.2 leads to the solution of the first order
differential equation as following,
)1(')( max
tkobseKftf
(5.3)
where K is the association constant and obsk is the inverse of the relaxation time.
The change in the mass due to moisture adsorption can be fitted to the Langmuir
adsorption isotherm model since the frequency shift is directly proportional with the
change of the absorbed mass according to the Sauerbrey relation given in Equation 5.1.
The time dependence of the amount of absorbed water molecules on the film surface
tm can be defined as,
/1 t
t emm
(5.4)
where da kmoleculesvapourwaterk ][1 , m is the maximum adsorbed
mass of the moist molecules on the surface, for very long times, when t , is
calculated as 54.75 ng.
Figure 5.8 shows the least square fit (solid line) using the Langmuir adsorption
isotherm model given in Equation 5.4 for the adsorption parts of the data between 10 %
RH and 84 % RH given in Figure 5.7b. The relaxation time is obtained as 0.3 min.
The average values of adsorption and desorption rates (ka and kd) between 10 % RH and
90 % RH were calculated as 3453.6 Mˉ1 sˉ
1 and 0.0147 sˉ
1, respectively.
Page 114
93
The corresponding Gibbs free energy ΔG of adsorption/desorption process at a constant
temperature can be calculated with eqKRTG ln (Qiu et al. 2009), where Keq is
equilibrium constant (daeq kkK / ), R is the universal gas constant and T is the
temperature (298K). The calculated equilibrium constant Keq and Gibbs free energy
0
10
20
30
40
50
60
0 0.5 1 1.5 2 2.5 3 3.5
m
(n
g)
time (min)
/1t
temm
ErrorValue
0.040754.75 ng
0.02060.3 min
NA63.762Chisq
NA0.9989R
m
Figure 5.8. The least square fit (solid line) to the Langmuir adsorption isotherm model
given in equation (4) for the adsorbed water mass between 10 % - 84 % RH.
values are 234939 and -30.64 kJ/mol for the adsorbed water mass between 10 % - 90 %
RH, respectively. The Gibbs free energy with negative sign shows that there is an
energy loss for water molecules on ZnO nanofiber film surface during adsorption
process.
5.5. Conclusion
In this study, Quartz Crystal Microbalance (QCM) technique is used to analyze
the water vapor adsorption and desorption kinetics of ZnO-based fibers synthesized
using electrospinning. The resistance of the fiber sensor decreases by about four orders
of magnitude with increasing relative humidity (RH) from 10 % to 90 % RH. The
response and recovery time of the sensor is around 0.5s and 1.5s, respectively. The
QCM resonance frequency decreases linearly while the resistance decreases
exponentially with the increasing RH. The adsorption and desorption of moisture rates
and Gibbs free energy kinetic parameters were determined by using dynamic Langmuir
Page 115
94
model. The values of adsorption and desorption rates were calculated as 3453.6 Mˉ1 sˉ
1
and 0.0147 sˉ1, respectively. The Gibbs free energy for adsorption cycle is found to be
as -30.64 kJ molˉ1. Thus, QCM results show that the ZnO nanofibers are very sensitive
to relative humidity changes and give reproducible adsorption and desorption kinetic
behaviors for both short and long time periods. The ZnO nanofibers on QCM respond
like a commercial RH sensor and can be used for potential humidity sensor applications.
Page 116
95
CHAPTER 6
VOCs SENSOR BASED ON METAL OXIDE
NANOFIBROUS MEMBRANE/QCM SYSTEM PREPARED
BY ELECTROSPINNING
6.1. Abstract
We report a simple synthetic route to fabricate crystalline ZnO and CeO2/ZnO
nanofibrous mats and their sensing characteristics against volatile organic compounds
(VOCs) such as benzene, propanol, ethanol, and dichloromethane. Precursor fibers were
fabricated by simultaneous electrospinning of poly(vinyl alcohol) and metal salt(s) at
2.5 kV cmˉ1. The fibers were directly deposited on the crystal surface of quartz crystal
microbalance (QCM). The crystal, which was coated by nanostructured PVA/metal
precursor(s) fibers, was subjected to calcination in air at 500 °C for 5 h. The formation
of oxide based nanofiber mat was revealed by scanning electron microscopy and X-ray
diffraction. Upon exposure of the nanofiber mats to the VOCs, the compounds adsorbed
to the surface of oxidic fibers. The physisorption of the compounds was confirmed by
FTIR and QCM. Both systems showed sensitivity to the VOCs and they hold a broad
promise particularly for sensing applications of volatile alcoholic compounds. The
introduction of CeO2 into the ZnO structure reduced the sensitivity of ZnO most
probably due to the change in crystalline structure and decrement of oxygen vacancies.
6.2. Introduction
Volatile organic compounds (VOCs) are major contributors to indoor air
pollution. Involuntary inhalation of VOCs leads to the numerous diseases for children
and elderly people particularly for those having asthma, allergies, or other respiratory
illness and causes special risks. Prolonged exposure to these pollutants can cause
cancer, central nervous system damage, haematological problems, as well as
sensitization involving the skin, eyes, and lungs (Jones 1999, Kampa and Castanas
Page 117
96
2008, Hakim et al. 2012). Because of the importance of indoor air quality for the health
and welfare of people, the utilization of highly efficient sensors for the detection and
monitoring of VOCs became a crucial attempt.
The currently available sensing approaches to detect VOCs are mainly
depending on the identification of output signals of optical, electrochemical,
potentiometric, and quartz crystal microbalance (QCM) measurements (Bevan et al.
1991, Elostua et al. 2006, Mori et al. 2009, Si et al. 2007). Among them, QCM sensors
are stable, sensitive to mass changes even smaller than nanogram scale, as well as are
operated at room temperature. The operation principle of QCM is based on resonance
frequency shift upon adsorption of species on the QCM electrode. The sensing ability of
QCM toward a toxic vapor is indubitably influenced by the characteristics of coating
materials that function as an adsorptive surface. To date, ceramics, metals, polymers,
thin films, lipids, dendrimers, waxes and ionic liquids have been employed as active
coatings on QCM surface (Grate 2000, Ricco et al. 1998, Xu et al. 2008). Wang and
coworkers (Wang et al. 2010) proposed fibrous polyethyleneimine (PEI)/polyvinyl
alcohol (PVA) membranes as sensitive QCM coatings for formaldehyde sensing. The
sensitivity of the fibrous membrane coated sensors was three-fold higher compared to
that of flat membrane coated ones. Especially interesting is the effort in the fabrication
of coating highly sensitive to trimethylamine by the same group of authors (Wang et al.
2011). They deposited nano-nets of polyacrylic acid (PAA) membranes by
electrospinning/electro-netting on a QCM electrode.
Recent attempts to enhance the sensor sensitivity and selectivity for specific
analytes have focused on developing one-dimensional (1D) nanostructural coatings
(Ding et al. 2010, Lee et al. 2009, Wang et al. 2006). Nanofibers are broad class of 1D
nanostructures, which have evoked considerable attention as sensing materials because
of their excellent chemical and physical properties by virtue of gigantic aspect ratios.
Probably the most versatile and practical technique for the fabrication of organic and/or
inorganic nanofibers is electrospinning (Huang et al. 2003, Sigmund et al. 2006). This
technique allows controlling over the diameter, morphology, porosity, alignment, and
composition of the resulting fibers which may lead to enhanced sensing capacity
compared to continuous films.
Page 118
97
Electrospun semiconductor metal oxide (SMO) fibers have been recognized with
perfect chemical reactive surfaces that have excellent sensitivity, fast response and
recovery were used for vapor sensing. For example, Liu et al. have observed toluene
sensing property of NiO-SnO2 composite fiber (Liu et al. 2011). The LaFeO3, (Fan et al.
2011) ZnO and In2O3 (Zhang and Qiao 2012) nanofiber sensors have showed good
reversibility and selectivity to ethanol. However, the optimum sensing properties of the
afore-mentioned materials were achieved at high operating temperature, and
accordingly the applied technique restricts their applicability for the detection of VOCs
in the ambient environment. As a representative example to metal oxide coated QCM
applications for volatile sensing is, by far, TiO2 fibers functionalized with PEI layers.
The efficient formaldehyde sensing responses of PEI-modified TiO2 fibers were
attributed to both high surface area of electrospun TiO2 based fibrous mat and the
interaction between formaldehyde molecules and primary amine groups of PEI (Wang,
Cui, et al. 2012).
Herein, QCM and electrospinnning techniques were merged for the high
performance sensing against VOCs. We focused on the fabrication of simple and binary
metal oxide membranes consisting of electrospun fibers (ZnO and CeO2/ZnO) on quartz
crystals for the detection of benzene, propanol, ethanol, and dichloromethane. The
structural properties of the metal oxide fibers and sensing performances of the resulting
membranes were examined.
6.3. Experimental Section
6.3.1. Chemicals
Poly(vinyl alcohol) (Sigma-Aldrich, 87-90% hydrolyzed), cerium(III) nitrate
hexahydrate (Fluka, ≥99.0%), zinc acetate dihydrate (Sigma-Aldrich, ≥98%),
dichloromethane (Sigma-Aldrich, 99%), benzene (Merck, ≥98%), ethanol (Merck,
96%), 2-propanol (Merck, 99.8%) were all used as received. Deionized water (18.2
MΩ cm) was used throughout the study.
Page 119
98
6.3.2. Fabrication of Electrospun Metal Oxide Nanofibers
The metal salt, Zn(CH3COO)2.2H2O (2.5 g, 11.4 mmol) was added to a 18 wt%
aqueous solution of PVA. For the fabrication of binary metal oxide fibers,
Zn(CH3COO)2.2H2O (2.5 g, 11.4 mmol) and Ce(NO3)3.6H2O (2.0 g, 4.60 mmol) were
added analogously to the polymer solution. The resulting mixtures were stirred for 5 h
in a water bath at 60 ºC.
The fibrous membranes coating on the QCM electrode via electrospinning is
schematically depicted in Figure 6.1. The viscous solutions of PVA/metal salt
precursor(s) were loaded into plastic syringe, and connected to a high voltage generator
(Gamma High Voltage Research, Ormond Beach, FL, U.S.A.). As a counter electrode,
QCM crystal was removed from its electrodes and attached to the grounded aluminium
foil. The feeding rate was fixed at 5.5 mL hˉ1 using a microsyringe pump (LION WZ-
50C6). The electrospinning process was performed through the QCM electrode at a 4
cm tip-to-collector distance for 5 min. A voltage of 10 kV was applied to the needle of
the syringe. The electrospun fibers coated QCM was dried under vacuum at 70 ºC for 8
h and calcined for 5 h at 500 ºC with a heating rate of 4 ºC minˉ1 in a chamber furnace
(Protherm PLF 120/12).
Figure 6.1. Scheme of the preparation of electrospun metal oxide fibers coated QCM
metal oxide
nanofiber
metal salt(s)/PVA
nanofibers
metal salt(s)/PVA
solution
electrospinning
calcination
Al foil
metal oxide
nanofiber
metal salt(s)/PVA
nanofibers
metal salt(s)/PVA
solution
electrospinning
calcination
Al foil
Page 120
99
6.3.3. Characterization Methods
The morphological observations of the nanofibers on QCM crystal were
performed using Scanning Electron Microscope (SEM) in a FEI Quanta 250 FEG. The
average fiber diameter was calculated from SEM micrographs using the Fiji/ImageJ
software. X-Ray diffraction (XRD) patterns were acquired by using a Philips X’pert Pro
diffractometer monochromatized CuKα radiation (λ = 1.540 Å). The sizes of the
crystallites were estimated by using the Scherrer equation (Klug and Alexander 1974b).
Thermogravimetric analysis (TGA) of the composite fibers was studied by a Perkin
Elmer Diamond TG/DTA. The Brunauer-Emmett-Teller (BET) surface area of the
samples was measured by nitrogen adsorption using a Micromeritics Gemini V
instrument. Prior to the measurement, the samples were degassed at 400 °C for 6 h in
vacuum to remove any adsorbed material from the fiber surface. Fourier transform
infrared (FTIR) spectra were registered in a Perkin Elmer Spectrum 100 FTIR
Spectrometer (Shelton, U.S.A.), equipped with Pike Miracle single reflection horizontal
attenuated total reflection (ATR) accessory.
The sensing responses of metal oxide nanofibers were measured by QCM
technique. A schematic representation of the experimental setup was reported elsewhere
(Horzum et al. 2011). A time-resolved QCM (CHI400A Series from CH Instruments
(Austin, USA)) was used to measure the change in the resonance frequency due to the
loading of volatile organic compounds after exposure of the QCM electrodes (AT-cut
piezoelectric quartz crystal). The mass change (Δm) on surface of the quartz crystal was
determined with the Sauerbrey equation (Sauerbrey 1959):
A
mff
2
02 (6.1)
where Δf is the frequency change (Hz) and ƒ0 is the fundamental frequency of the
crystal (7.995 MHz). The density (ρ) of the crystal is 2.684 g/cmˉ3, and the shear
modulus (μ) of quartz is 2.947 × 10¹¹
g cmˉ1
sˉ2. Around oscillation frequency, the net
change of 1 Hz corresponds to 1.34 ng of gas molecules adsorbed onto the crystal
surface of an area of 0.196 cm2. Gas flow into test cell was provided by N2 calibrated
Page 121
100
mass flow meters (MKS,179A Mass-Flo®) and RS232 controlled gas flow control unit
(MKS).
As volatile compounds, dichloromethane, benzene, ethanol, 2-propanol were
used for adsorption process and high-purity nitrogen gas (N2) was used for desorption
process. The change of resonance frequency of QCM was monitored with varying VOC
ratio with changing flow rate of VOC/N2. The saturated vapor pressure of volatiles were
determined with Antoine equation (Lange 1979):
CT
BAP
*log (6.2)
T is the experimental temperature in °C and A, B, C are Antoine coefficients
characteristic to the selected compounds. The concentration of volatile vapor was
calculated with the following equation, assuming that the vapor behaves like an ideal
gas.
RTCP Lmol )/(* (6.3)
The concentration in the unit of ppm was determined with the relation between the
molar mass (M) and the density (d) of the VOCs (Choi et al. 2012).
6
)/()( 10d
MCC Lmolppm (6.4)
6.4. Results and Discussion
The aim of this work was to fabricate fibrous metal oxide deposited directly onto
the QCM electrode for the detection of VOCs such as benzene, propanol, ethanol and
dichloromethane. The properties of sensing material were presented for two metal oxide
systems: electrospun ZnO and CeO2/ZnO composite mats.
Page 122
101
6.4.1. Fabrication and Structural Characterization of the Metal Oxide
Nanofibers
Both ZnO and CeO2/ZnO nanofiber mats were prepared by employing similar
pathway. Initially, poly(vinyl alcohol) (PVA) and a metal salt(s)
[(Zn(CH3COOH)2·2H2O and/or Ce(NO3)3·6H2O)] solution were dissolved in water. The
resulting homogeneous solution was electrospun using horizontal set-up at 2.5 kV cmˉ1.
The fiber mats were detached from the surface of metal substrate as a free standing
polymeric film. Secondly, the resulting composite fibers were converted to metal oxide
fibers by controlled thermal treatment in air. Thermal degradation of the precursor
fibers of PVA/metal salt(s) is presented in Figure 6.2. Three consecutive mass losses are
observed at 70, 225, 425 °C for the PVA/(Zn(CH3COOH)2 fibers. They are attributed to
the elimination of adsorbed water and the dehydration of zinc acetate, degradation of
PVA, and decomposition of anhydrous zinc acetate to zinc oxide, respectively (Yang et
al. 2004). On the other hand, the thermal decomposition of the
PVA/(Zn(CH3COOH)2/Ce(NO3)3 fibers showed four mass losses. In addition to the
mass losses given above, the loss of coordinated water in the hydrate of cerium nitrate
(Shih et al. 2010) and zinc acetate accompained by the degradation of PVA. Further
mass loss was not observed beyond 450 °C indicating the formation of CeO2/ZnO.
Therefore, the calcination temperature was increased and fixed at 500 °C, the condition
under which the removal of polymer is guaranteed.
Page 123
102
Figure 6.2. TGA termograms of PVA/(Zn(CH3COOH)2 and
PVA/(Zn(CH3COOH)2/Ce(NO3)3 fibers
Experimentally measured metal oxide contents were 16 and 25 % for ZnO and
CeO2/ZnO systems, respectively. Theoretical contents of the remaining oxide residues
can be calculated from the initially added metal salt(s) to the electrospinning solution
assuming complete conversion to the corresponding oxide structure. The theoretical
contents were listed in the second column of Table 6.1. Surprisingly, experimentally
measured metal oxide content was found to be higher than the theoretical calculation.
This discrepancy might be due to the formation of carbonaceous species present on the
surface of fibers from thermal treatment of the polymeric component.
Table 6.1. Percent compositions and surface area characteristics of the metal oxide
fibers
Sensing material ZnO+CeO2
a
(wt %)
ZnO+CeO2b
(wt %)
BET surface
area
(m2 gˉ1)
Pore volume
(cm3 gˉ1)
Pore size
(nm)
Crystallite
sizec
(nm)
ZnO fiber 16 14 10 0.05 19 15
CeO2/ZnO fiber 25 20 33 0.11 15 9
aMeasured with TGA. bTheoretical content. c Calculated from the Scherrer equation.
100 200 300 400 500 6000
20
40
60
80
100
Weig
ht
loss
/ %
Temperature / C
PVA/Zn(CH3COO)
2 fiber
PVA/Zn(CH3COO)
2/Ce(NO
3)
3 fiber
Page 124
103
Figure 6.3 shows XRD pattern of the metal oxide fibers obtained after
calcination of PVA/(Zn(CH3COOH)2·2H2O and/or Ce(NO3)3·6H2O. In the presence of
cerium nitrate, the diffractogram confirms the formation of a mixed phase of cubic
fluorite structure of CeO2 (JCPDS card no. 81-0792), along with hexagonal wurtzite
structure of ZnO (JCPDS card no. 79-0207). The size of the crystallites estimated by the
Scherrer equation (Klug and Alexander 1974a) from the (101) reflection was 15 nm for
ZnO and 9 nm for CeO2/ZnO fibers, respectively. The elemental composition of the
calcined fibers was also elucidated using EDX analysis which supported the XRD
results. (Figure 6.4) The composition of the fibers was mainly based on the
corresponding metal and oxygen.
Figure 6.5 presents SEM micrographs and diameter distributions of ZnO and CeO2/ZnO
fibers after calcination. The diameter of the pre-calcined fibers of PVA/zinc acetate and
PVA/zinc acetate/cerium nitrate were 315 ± 95 and 270 ±70 nm, respectively. The
addition of cerium nitrate resulted in reduction of the fiber diameter in comparison to
the PVA/zinc acetate fiber. This can be explained by the increase of charge density
upon addition of the ceria salt. A higher elongation force leads to obtain thinner fibers
due to repulsion of the charges on the jet. Upon calcination at 500 ºC in air, ZnO and
CeO2/ZnO fibers were obtained while the integrity of fibers is preserved. The diameter
of the fibers decreased to 160 ±55 nm for ZnO and 80 ±30 nm for CeO2/ZnO fibers as a
result of removal of the carrier polymer and crystallization of the metal oxide phases.
Page 125
104
Figure 6.3. XRD patterns of CeO2/ZnO and ZnO fibers
Figure 6.4. EDX spectra of electrospun (a) ZnO and (b) CeO2/ZnO fiber
(a)
(b)
(a)(a)
(b)(b)
20 30 40 50 60 70
(201
)(1
12)
(103
)
(110
)
(102
)
(101
)(0
02)(1
00)
Inte
nsi
ty /
a.
u.
2 / degree
(100
)
(103
)
(222
)
(311
)
(110
)
(220
)(1
02)(101
)(0
02)
(200
)
(111
)
ZnO fiber
CeO2/ZnO fiber
Page 126
105
Figure 6.5. SEM micrographs and diameter distributions of (a) ZnO and (b) CeO2/ZnO
fiber
BET analysis provides surface area, pore volume and pore diameter of the calcined
fibers (Table 6.1). The specific surface area was found to be 10 and 33 m2 gˉ
1 for ZnO
and CeO2/ZnO fibers, respectively. ZnO has large pore size, its surface area and pore
volume is small, which indicated that the porosity in this structure is not very high. The
addition of cerium salt reduces the size of ZnO crystallites and pore size. As a result, the
surface area and porosity are relatively increases.
6.4.2. Sensing Properties of Metal Oxide Nanofibers
Here, we examined the sensing feature of both ZnO and CeO2/ZnO systems.
These oxide-based nanofiber mats were readily developed on the surface of QCM
electrode and used as VOCs sensor. We have also investigated the effect of CeO2 on the
sensing activity of the ZnO nanofiber mats toward a representative VOCs, benzene
(a)
(b)
0 30 60 90 120 150 180
Fre
qu
en
cy
Fiber Diameter / nm
0 50 100 150 200 250 300 350
160±55 nm
80±30 nm
(a)
(b)
(a)
(b)
0 30 60 90 120 150 180
Fre
qu
en
cy
Fiber Diameter / nm
0 50 100 150 200 250 300 350
160±55 nm
80±30 nm
Page 127
106
vapor at room temperature. Figure 6.6a shows a typical adsorption/desorption
characteristics of ZnO and CeO2/ZnO fibers. The QCM frequency counter is set to ‘0’
Hz as the starting point when N2 gas is sent through the QCM cell with 1000 sccm. In
order to observe reproducibility and sensitivity of the fibrous membrane coated QCM
sensors, N2 and wet N2 have been sent consecutively in 200 s periods. The change in the
resonance frequency of QCM was found to be proportional to the mass of the analyte
adsorbed onto QCM. This sensor system showed a stable signal with almost no
hystresis after the first two cycles. The QCM frequency signals exhibited maxima at
116 Hz and 147 Hz for CeO2/ZnO and ZnO fibers, respectively.
Panel b and c of Figure 6.6 display the changes in frequency shift of CeO2/ZnO
and ZnO fibers coated QCM crystals measured at different concentrations of benzene
vapor. In Figure 6.6b, the level of wet N2 was increased and subsequently decreased by
200 sccm steps with a time interval of 200s. The response of sensor to benzene vapor
increased gradually with increasing analyte concentrations. For the linear responses of
CeO2/ZnO and ZnO fibers, analogously, the wet N2 level was increased by 20 sccm for
equal time intervals of 5 s. (Figure 6.6c) The frequency shift of the QCM sensor was
dependent on the analyte concentration and exhibited a linear increase with benzene
concentrations. The regression coefficients were 0.984 and 0.998 for CeO2/ZnO and
ZnO fibers, respectively.
Langmuir adsorption isotherm model has been frequently used (Baleanu et al.
2011, Demir et al. 2011, Horzum et al. 2011, Okur, Ceylan, et al. 2012, Okur, Uzar, et
al. 2012) for various gases such as humidity on organic or inorganic films to describe
adsorption kinetics. According to this model, the rate of surface reaction to form a
monolayer on the surface is given with the following equations:
θkCθkt
θda )(1
d
d (6.5)
Page 128
107
Figure 6.6. (a) The two cycles of QCM responses against benzene vapor as a function of
time. (b) The step responses for adsorption and desorption of benzene with
CeO2/ZnO and ZnO nanofiber coated QCM. (c) The linear adsorption
responses as a function of percent ratio of benzene flow
θ is a unitless quantity, which express the fraction of surface coverage, C is the gas
concentration in the air, ka and kd are the adsorption and desorption constants,
respectively. Integration of Equation 6.5 leads to:
)e(1tkadsK'θ(t)
(6.6)
0
50
100
150
200
0 200 400 600 800 1000
ZnO fiberCeO
2/ZnO fiber
Time/sec
-F
(Hz)
0
40
80
120
160
0 500 1000 1500 2000
ZnO fiberCeO
2/ZnO fiber
Time/sec
-F
(Hz)
0
20
40
60
80
100
120
140
0 20 40 60 80 100 120
ZnO fiber
CeO2/ZnO fiber
y = -7,92 + 1,4649x R= 0,99737
y = -8,6437 + 1,0293x R= 0,98351
-F
(H
z)
Percent ratio of benzene
(b)
(c)
(a)
0
50
100
150
200
0 200 400 600 800 1000
ZnO fiberCeO
2/ZnO fiber
Time/sec
-F
(Hz)
0
40
80
120
160
0 500 1000 1500 2000
ZnO fiberCeO
2/ZnO fiber
Time/sec
-F
(Hz)
0
20
40
60
80
100
120
140
0 20 40 60 80 100 120
ZnO fiber
CeO2/ZnO fiber
y = -7,92 + 1,4649x R= 0,99737
y = -8,6437 + 1,0293x R= 0,98351
-F
(H
z)
Percent ratio of benzene
(b)
(c)
(a)
Page 129
108
where kads is the inverse of the relaxation time and Kˈ is the association constant
defined as following:
da
a
kCk
CkK'
and daads kCkk (6.7)
QCM has been used to measure the fractional coverage as a function of time
during the adsorption of VOC molecules by ZnO or CeO2/ZnO fibers, while the
increase in the frequency shift reflects the molecular mass uptake or loss. Thus, the
difference between the oscillation frequency shift (∆F) of coated and uncoated QCM is
directly proportional to the adsorbed mass of VOC molecules. The relationship between
the surface adsorption kinetics and frequency shift (∆F) of QCM can be expressed as
following:
)e(1ΔΔtk
maxadsK'FF(t)
(6.8)
Using Sauerbrey relation, ( Fm Δ)(1.34ng/HzΔ ), the time dependent variation
of mass of the adsorbed VOC molecules on the ZnO or CeO2/ZnO fibers’ surface, ∆mt
can be defined as following:
)e(1ΔΔ τtt mm
(6.9)
da kCkτ moleculesVOC1 (6.10)
∆m∞ is the maximum amount of adsorbed VOC molecules on the surface for
t and τ is the relaxation time. Figure 6.7 shows the least square fit (solid line)
using the Langmuir adsorption isotherm model given in Equation 6.9 for the adsorption
parts of the data for 456 ppm benzene concentration. The values of Langmuir constants
were obtained from the least square fit to the Equation 6.9 and are given in Table 6.2.
The response and recovery time of CeO2/ZnO fibers were found to be 62 s and 18 s, and
they were 55 s and 20 s for ZnO fibers, respectively. A faster response time of ZnO
fibers can be attributed to the surface characteristics correspondingly higher available
active sites for sensing the target analyte.
Page 130
109
Figure 6.7. Least square fit (solid lines) using the Langmuir adsorption isotherm model
for 456 ppm benzene concentration
Table 6.2. The values obtained using the Langmuir adsorption isotherm model for 456
ppm benzene concentration
ZnO fiber CeO2/ZnO fiber
m∞ (ng)
153 115
(s)
23 16
ka (Mˉ1 sˉ1) 93 81
kd (sˉ1) 0.00127 0.00111
Response time (s) 55 62
Recovery time (s) 20 18
Chisq 4299 17170
R 0.999 0.992
The comparatively longer recovery time of ZnO mat can be a consequence of
the higher amount of benzene molecules adsorbed to its available active surface sites.
Although the flux of gas propogation through the mats is fixed, ZnO catches higher
0
20
40
60
80
100
120
140
160
0 50 100 150 200
ZnO fiberCeO
2/ZnO fiber
Time/sec
-F
(Hz) y = m1 + m2*(1- exp(-m3*(x+0...
ErrorValue
0,263540,28255m1
0,25876142,63m2
0,000147430,047195m3
NA8261,5Chisq
NA0,99776R
y = m1 + m2*(1- exp(-m3*(x+0...
ErrorValue
0,356160,60581m1
0,3521113,44m2
0,000316770,061912m3
NA12002Chisq
NA0,99378R
Page 131
110
amount of molecules so that its desorption from the surface accordingly takes longer
time as compared to CeO2/ZnO system.
The possible interactions between benzene vapor and metal oxide fiber surface
were identified by FTIR spectroscopy. Figure 6.8 shows FT-IR spectra of the ZnO and
CeO2/ZnO fibers before and after benzene vapor treatment.
Figure 6.8. FTIR spectra of (a) ZnO fibers and (b) CeO2/ZnO fibers, as prepared (black
curve) and after benzene vapor treatment (red curve)
4000 3500 3000 1500 1000
T
ran
sm
itta
nce
/ a
. u
.
Wavenumber / cm-1
ZnO fiber as prepared
ZnO fiber after benzene sorption
(a)
4000 3500 3000 1500 1000
Tra
nsm
itta
nce
/ a
. u
.
Wavenumber / cm-1
CeO2/ZnO fiber as prepared
CeO2/ZnO fiber after benzene sorption
(b)
4000 3500 3000 1500 1000
T
ran
sm
itta
nce
/ a
. u
.
Wavenumber / cm-1
ZnO fiber as prepared
ZnO fiber after benzene sorption
(a)
4000 3500 3000 1500 1000
Tra
nsm
itta
nce
/ a
. u
.
Wavenumber / cm-1
CeO2/ZnO fiber as prepared
CeO2/ZnO fiber after benzene sorption
(b)
Page 132
111
The broad absorption at around 3460 cmˉ1 is attributed to the presence of surface
hydroxyl groups. The bands in the 3400 cmˉ1 and 1360-1475 cmˉ
1 are assigned to Ce-O
modes (Mokkelbost et al. 2004). (Figure 6.8b) The increase in the intensity of the broad
band between 3000-3800 cmˉ1 originates from the vibration mode of CeO2. After
benzene sorption, both spectra show newly formed absorption signals at 2920 cmˉ1 and
1083 cmˉ1, which may be attributed to the physisorption of benzene onto the fibers’
surface.
The frequency shift of the CeO2/ZnO and ZnO fiber coated QCM sensor upon
exposure to benzene, propanol, ethanol and dichloromethane vapor were measured. The
metal oxide fiber coated QCM sensors showed different response curves for each of the
VOC depending on their concentration. The characteristics of the volatile substances are
listed in Table 6.3.
Table 6.3. Properties of the volatile organic compounds
VOCs
Molar Mass
(g molˉ1)
Density
(g cmˉ3)
Saturated vapor
pressurea
(atm)
Concentration
(ppm)
Benzene 78.11 0.8740 0.125 456
Dichloromethane 84.93 1.3250 0.560 1474
Ethanol 46.07 0.7890 0.078 187
Propanol 60.10 0.7850 0.056 176
aThe vapor pressure at 25 °C was calculated from Antoine equation.
The change of frequency shift depending on unit change of concentration is
defined as sensitivity of the sensor (Islam et al. 2005). To make more accurate
comparison, the sensitivity of the CeO2/ZnO and ZnO fiber coated sensor to benzene,
propanol, ethanol and dichloromethane vapor is presented in Figure 6.9. Both ZnO and
CeO2/ZnO systems showed sensitivity to the VOCs employed; however, ZnO fibers
Page 133
112
were found to be more effective although it provides smaller surface area compared to
CeO2/ZnO. In comparison with the CeO2/ZnO fibers, the better sensing performance of
ZnO fibers could be attributed to the crystal structure of the oxidic systems. ZnO has
hexagonal wurzite structure with zinc ions surrounded by tetrahedra of oxygen ions.
This tetrahedral coordination results in tetrahedral symmetry and accordingly
spontaneous polarity along the hexagonal axis. The polar Zn-O bonds arise charge
contrast between zinc and oxygen planes (Jagadish and Pearton 2006) where Zn atoms
are partially positive. Thus, lone pairs on the alcoholic compounds tend to be attracted
toward the positively charged metal atoms.
Figure 6.9. Sensitivity of the CeO2/ZnO and ZnO fiber coated sensor to benzene,
propanol, ethanol and dichloromethane vapor
On the other hand, CeO2 that has fluorite crystal structure does not have polarity
as much as ZnO does. This is because the addition of CeO2 into ZnO structure does not
seem to be effective in sensing applications although it provides larger surface area
(Table 6.1). The efficiency of these materials in sensing applications was not merely
originated from surface area and porosity, rather, may result from the surface chemical
feature of the metal oxide systems.
The sensing feature of the VOCs to the nanofiber-coated QCM is based on
adsorption/desorption mechanism. This pair of process is a surface phenomenon;
therefore, surface chemistry of the sensing materials must be carefully examined. Since
the metal oxide fibers were obtained by calcination of PVA and metal precursor(s), the
surface of the fibers is covered by different species. For example, carbonaceous species
Benzene Propanol Ethanol Dichloromethane0.00
0.10
0.20
0.30
0.40
0.50
Se
nsitiv
ity [H
z/(
g/m
3)]
CeO2/ZnO fiber
ZnO fiber
Page 134
113
may be present left over from the thermal degradation of PVA. When polymeric
component undergoes degredation at 500 °C, the formation of carbon rich organic
residue on the fiber surface is highly possible. Moreover, the surface of oxides is
inevitably covered with a thick layer of water molecules with different structure and
mobility. The first layer of molecules is strictly bound to the surface of metal oxide
surface. The interaction of the molecules decreases and correspondingly their mobility
increases radially outward from the metal oxide surface (Nagao 1971b, Demir, Koynov,
et al. 2007). Yet, the presence of both surface species (carbonaceous and surface
hydroxyls) speculated here in fact was revealed by vibrational spectroscopy. The
sensitivity of the oxide surfaces to benzene may be explained by the interaction of
surface carbonaceous species with benzene molecules through nonpolar interactions. On
the other hand, the polar oxidic surface feature may better associate with polar organic
compounds for instance alcohols.
The sensing ability of the nanomaterials can also be roughly viewed from
another perspective. The liability of the VOCs toward interaction with surface metal
atoms can be explained based on the Lewis acid-base pairing. Higher oxygen vacant
sites in wurzite crystal structure of ZnO fibers refer to deficiency of negative charge,
therefore; ZnO can be considered as Lewis acid (Hu et al. 2013). The presence of
oxygen vacancy may act as trapping centers. For example, oxygen atoms due to having
two lone pairs with high electron density and the oxygen atom can donate electron pairs,
thus alcohols act as Lewis base. ZnO shows a higher sensitivity compared to CeO2/ZnO
regardless of the compounds. On the other hand, the fibers coated sensor show low
sensitivity to dichloromethane. Because of the electronegative chlorine atoms in
dichloromethane, the molecule acts as weak base making Zn atom difficult to accept an
electron pair from the base.
6.5. Conclusion
CeO2/ZnO and ZnO based nanofibers as sensitive coatings were successfully
positioned on the electrode of QCM via electrospinning and subsequent calcination.
Their sensing abilities based on the VOCs (benzene, propanol, ethanol, and
dichloromethane) adsorption/desorption behaviors were examined using a QCM
technique. Independent of the chemistry of metal oxide, the fiber mats respond to all
Page 135
114
VOCs employed in this study. However, ZnO fibrous mat exhibited better performance
than CeO2/ZnO fibers most probably due to the crystal structure and presence of higher
oxygen vacancies. The sensing properties of CeO2/ZnO and ZnO fibers coated QCM
were particularly demonstrated for the detection of benzene. The response time was
found to be 55 s for ZnO fibers. On the other hand, CeO2/ZnO fibers showed response
within 62 s. The sensitivity of the metal oxide surfaces to benzene can be explained by
hydrophobic interaction with the surface carbonaceous species. Moreover, ZnO fiber
mat seemed to be particulary sensitive to the alcoholic type compounds based on Lewis
acid-base pairing. Taking advantage of various fascinating features of the electrospun
metal oxide nanofibrous mat, the coated QCM sensors offer easy handling, high
sensitivity, as well as good reproducibility. The preparation method of QCM coating is
versatile and can also be used to fabricate several active nanofibrous materials. We
envisaged that this strategy enables efficient design and development of other QCM
coatings toward undesirable volatile organic compounds.
Page 136
CHAPTER 7
HIERARCHICALLY STRUCTURED METAL
OXIDE/SILICA NANOFIBERS BY COLLOID
ELECTROSPINNING
7.1. Abstract
We present herein a new concept for the preparation of nanofibrous metal oxides
based on the simultaneous electrospinning of metal oxide precursors and silica
nanoparticles. Precursor fibers are prepared by electrospinning silica nanoparticles (20
nm in diameter) dispersed in an aqueous solution of poly(acrylic acid) and metal salts.
Upon calcination in air, the poly(acrylic acid) matrix is removed, the silica
nanoparticles are cemented, and nanocrystalline metal oxide particles of 4–14 nm are
nucleated at the surface of the silica nanoparticles. The obtained continuous silica fibers
act as a structural framework for metal oxide nanoparticles and show improved
mechanical integrity compared to the neat metal oxide fibers. The hierarchically
nanostructured materials are promising for catalysis applications, as demonstrated by
the successful degradation of a model dye in the presence of the fibers.
7.2. Introduction
Due to their large ratio of surface area to volume and interconnected porosity,
metal oxide meshes have been proposed for applications in catalysis, energy storage,
and sensors (Choi et al. 2009, Fierro 2006, Kim and Rothschild 2011). Various bottom-
up approaches—such as vapor–liquid–solid (VLS) (Valcarcel et al. 1998), and vapor–
solid (VS) (Chen et al. 2004) growth—and top-down techniques—such as nanocarving
(Yoo et al. 2006) and electrospinning (Li et al. 2003) —have been described. Among
these techniques, electrospinning is probably the most versatile, because it allows the
fabrication of fibrous mats from a wide variety of both organic and/or inorganic
Page 137
116
materials (Huang et al. 2003, Sigmund et al. 2006). Moreover, it allows the control over
the diameter, morphology, porosity, alignment, and composition of the resulting fibers
(Fridrikh et al. 2003, Theron et al. 2004).
Calcination of electrospun mats obtained from metal oxide precursors is a
commonly used approach because of its facility and potential for upscaling. The
calcination process is usually applied to mixtures of polymers/metal oxide precursors
and it is based on an oxidative conversion of the polymeric component by heat
treatment. There are many successful examples in literature for the fabrication of
inorganic fibers by calcination of precursor materials prepared by sol–gel (Choi et al.
2003, Hansen et al. 2011, Ma et al. 2011, Panels and Joo 2006, Sakai et al. 2012, Seol et
al. 2009), polymer-based sol–gel processes (Ding et al. 2003, Kim et al. 2010, Shao et
al. 2002, Shi et al. 2009), or from electrospinning of polymer dispersions in the
presence of ex-situ formed colloids (Chen et al. 2009, Friedemann et al. 2012, Kanehata
et al. 2007, Lim et al. 2006, Zhang et al. 2011). While the polymeric component
undergoes degradation, metal oxide crystals nucleate and grow upon increase of the
temperature (Li, Meyer, et al. 2005, Lu et al. 2006).
In the electrospinning of inorganic precursor, one has to take into account that
the calcination leads almost automatically to a shrinkage of the fibers since the polymer
template is removed. After calcination, the nanofibers are usually more brittle (Horzum
et al. 2011) due to their thinner section and the internal stress generated by the
shrinkage. Therefore, an additional material that is not mechanically or chemically
affected by the calcination process needs to be incorporated in the fibers during the
electrospinning.
The recently reviewed electrospinning of colloids (Crespy et al. 2012) has been
explored for the fabrication of metal or metalloid oxide fibers. For instance, silica
(Friedemann et al. 2012, Lim et al. 2006), and titania (Wesselt et al. 2011) nanoparticles
were embedded in polymer fibers by electrospinning a solution of polymer template in
the presence of a dispersion of the particles. Recently, the electrospinning of a zinc
powder/titanium isopropoxide/poly(vinyl acetate) mixture was reported (Kanjwal et al.
2010). The precursor fibers were calcinated in air and the subsequent hydrothermal
treatment of the resulting fibers in bis(hexamethylene)triamine and a zinc nitrate
hexahydrate solution yielded continuous TiO2 fibers decorated with ZnO branches. The
ZnO particles in the TiO2 fibers seeded the growth of ZnO branches perpendicular to
the TiO2 fibers direction. The same procedure was employed to form ZnO-branched
Page 138
117
Co3O4 (Kanjwal et al. 2011) and ZnO-branched ZnO (Kanjwal et al. 2012) fibers.
Although the synthesis of silica-supported metal oxide nanocomposites has been
previously reported (Zhao et al. 2010, Tang et al. 2011, Strunk et al. 2011), their
fabrication by colloid-electrospinning to obtain nanofibers is a new strategy. Our
concept allows the advantageous combination of interesting properties inherent to both
nanoparticles (high surface area) and meshes (porous structure and facile separation
from the reaction media). Furthermore, the incorporation of silica nanoparticles in the
composite fibers significantly improves the mechanical integrity of the nanofibers. The
generality of the concept is demonstrated by taking two different metal oxides, namely
CeO2 and LiCoO2 as models for simple and binary oxides, respectively. The catalytic
activity of the composite nanofibers was also investigated.
7.3. Experimental Section
7.3.1. Materials
Cerium(III) nitrate hexahydrate (Fluka, ≥99.0%), lithium hydroxide (Aldrich,
98%), cobalt(II) hydroxide (Aldrich, 95%), poly(acrylic acid) (PAA, Mw ≈ 450,000 g
mol−1
, Polysciences Inc.), colloidal silica (average diameter: 20 nm, BET surface area:
140 m2
g−1
, 34 wt% suspension in H2O, Sigma-Aldrich), and rhodamine B (Merck) were
all used as received without any further purification. Demineralized water was used
throughout the study.
7.3.2. Preparation of the Electrospinning Solutions
The metal salt(s), Ce(NO3)3·6H2O (780 mg, 1.8 mmol; and 390 mg, 0.9 mmol)
or LiOH (21.5 mg, 0.9 mmol) and Co(OH)2 (83 mg, 0.90 mmol), were added to a 7.5
wt% solution of PAA (0.870 g), and the mixture was stirred for 2 h at room
temperature.
For the fabrication of metal oxide/silica fibers, the colloidal silica was dispersed
in 4.0 g of the PAA/metal salt solution. The weight ratio of PAA:SiO2 was fixed as 1:1.
Page 139
118
Two different Ce(NO3)3·6H2O concentrations with respect to the amount of silica (mole
ratios Ce:Si) were used: 0.06:1.00 and 0.12:1.00 (mole ratios).
7.3.3. Fabrication of the Nanofibers
The viscous solutions of PAA/metal salt precursor or the dispersions of
PAA/metal salt precursor/SiO2 were loaded in a plastic syringe connected with silicon
rubber tubing. The electrospinning experiments were carried out with a commercial
platform (ES1a, Electrospinz) covered with a polycarbonate box placed for safety and to
avoid disturbances from air convection. The positive electrode was applied to the
spinneret and an aluminum foil was used as counter electrode. The flow rate of the
polymer solution was adjusted by a syringe pump (Bioblock, Kd Scientific). The
optimum electrospinning parameters are presented in Table 7.1. PAA/SiO2,
PAA/SiO2/Ce(NO3)3, PAA/Ce(NO3)3, and PAA/SiO2/LiOH/Co(OH)2 fibers were
calcinated under air in a muffle oven (Nabertherm Controller P330 LT 5/13) at 600 ºC
(room temperature to 600 ºC at a rate of 4 ºC min−1
; plateau of 2 h at 600 ºC).
PAA/LiOH/Co(OH)2 fibers were calcinated at 400 ºC for 5 h with a rate of 4 ºC min−1
.
Table 7.1. Optimized electrospinning parameters (tip-to-collector distance fixed at 14
cm)
Metal oxide Precursor Electric field
[kV cm−1
]
Flow rate
[mL h−1
]
CeO2 PAA/Ce(NO3)3·6H2O 0.71 2
CeO2/SiO2 PAA/Ce(NO3)3·6H2O/SiO2 0.71 2
SiO2 PAA/SiO2 0.36 1
LiCoO2 PAA/LiOH/Co(OH)2 1.43 2
LiCoO2/SiO2 PAA/LiOH/Co(OH)2/SiO2 0.71 1
Page 140
119
7.3.4. Characterization Methods
The fibers were electrospun onto silicon wafers for morphological observations
by scanning electron microscopy (SEM) in a LEO 1530 Gemini microscope (Zeiss). To
localize the metal oxide nanoparticles on the fibers, high-resolution SEM micrographs
were captured using a Hitachi SU8000 microscope. The diameter of fibers and particle
size distributions were calculated from SEM micrographs using the Fiji/ImageJ
software. X-ray diffraction pattern (XRD) were recorded in a Philips PW 1820
diffractometer using CuKα radiation (λ = 1.5418 Å). Thermogravimetric analysis (TGA)
was studied by a Mettler Toledo 851 thermobalance. The specific surface area of the
calcinated fibers was determined from nitrogen adsorption using a Micromeritics
Gemini V instrument. The surface area was calculated according to the Brunauer–
Emmett–Teller (BET) methodology (five point, 0.05<P/P0<0.3). The samples were
degassed at 400 ºC for 6 h in vacuum prior to the measurements.
The photocatalytic degradation of rhodamine B (Merck) in the presence of pure
CeO2, CeO2/SiO2, and SiO2 fibers was carried out in a polystyrene plate (Corning)
under UV light irradiation. For the catalysis experiments, the fiber catalyst (2.0 mg) was
added to an aqueous solution of rhodamine B (1.5 mL, 5 ppm) and stirred continuously.
At certain time intervals, photoluminescence (PL) emission spectra of the dye solution
with the fiber mats were registered in top-mode on a Tecan Infinite M100 plate reader
using an excitation wavelength of 500 nm.
7.4. Results and Discussion
The preparation of silica-supported metal oxide fibers by colloid electrospinning
and subsequent controlled thermal treatment is presented for two systems: CeO2, as a
model for a simple metal oxide, and LiCoO2, as a model for a binary system. Silica
nanoparticles were selected as cheap but robust structural framework for the final
materials. Initially, poly(acrylic acid) (PAA) and a metal salt (either Ce(NO3)3∙6H2O or
LiOH and Co(OH)2) were dissolved in water, and the homogeneous aqueous polymer
solution was electrospun. In a second step, the resulting mats were converted to metal
Page 141
120
oxide fibers by thermal treatment in a controlled environment. A schematic diagram for
the fabrication of metal oxide and metal oxide/silica fibers is depicted in Figure 7.1. In
both systems, PAA was used as polymer template and binder in the fibers. PAA is a
commonly used polyelectrolyte, with most of the carboxyl groups being deprotonated at
neutral pH (pKa 4–4.5) (Pradip et al. 1991), which provide the ability to coordinate
metal cations.
The thermal decomposition of PAA/SiO2 fibers measured by thermogravimetric
analysis (TGA) showed two consecutive mass losses (Figure 7.2a), attributed to the
elimination of adsorbed water, and to the degradation of poly(acrylic acid) (Moharram
and Khafagi 2006). The three weight losses observed for the PAA/Ce(NO3)3 and
PAA/Ce(NO3)3/SiO2 fibers are consecutive to the elimination of adsorbed water, the
dehydration of cerium nitrate and degradation of PAA, and the conversion of
unhydrated Ce(NO3)3 to CeO2 (at increasing temperature) (Shih et al. 2010). Since the
mass of the materials remains unchanged around 600 ºC, the calcination temperature
was fixed at this temperature. After calcination, the majority of the remaining residue is
expected to be composed of CeO2 and/or SiO2. Experimentally measured and
theoretical percentages of remaining residues, calculated from the initially introduced
precursor assuming complete conversion to CeO2, are listed in Table 7.2. In the
presence of SiO2 nanoparticles, the remaining material after calcination of PAA/SiO2
fibers was higher (48%) than that of PAA/Ce(NO3)3 fibers (23%). The thermal stability
of the fibers was slightly increased upon addition of SiO2 nanoparticles with an onset of
degradation temperature shifted to more than 15 ºC in the presence of silica particles.
Similarly, the thermal decomposition of the PAA/LiOH/Co(OH)2 fibers occurs
in three stages in the temperature range of 25–720 ºC (Figure 7.2b). The weight losses
were ascribed to the removal of adsorbed water (10%), the polymer degradation and
the conversion of Co(OH)2 to Co3O4 (56%) (Mahmoud and Al-Agel 2011), and the
reaction of Co3O4 with the lithium salt to form LiCoO2 (Carewska et al. 1995).
Page 142
121
Figure 7.1. Scheme of the preparation of metal oxide (top) and metal oxide/silica
(bottom) fibers. The metal oxide fiber are brittle and yield a powder
material whereas the nanofibrous morphology is conserved by using silica
nanoparticles as structural framework
∆
Metal oxide NP
Polymer
Metal salt
∆
Silica NP
metal oxide nanofibers
metal oxide / silica nanofibers
precursor nanofibers
∆
Metal oxide NP
Polymer
Metal salt
∆
Silica NP
metal oxide nanofibers
metal oxide / silica nanofibers
precursor nanofibers
Page 143
122
Figure 7.2. TGA thermograms of (a) PAA/SiO2/Ce(NO3)3 and PAA/Ce(NO3)3 fibers,
and (b) PAA/LiOH/Co(OH)2, PAA/SiO2/LiOH/Co(OH)2 fibers.
Similar to the aforementioned results obtained for CeO2, the addition of SiO2
nanoparticles shifted the decomposition temperature to higher values. Indeed, the
remaining mass at 600 ºC for the PAA/LiCo hydroxide fibers was 23% versus 45% in
the presence of 6.5 wt % of SiO2. Since the degradation mechanism relies generally on
100 200 300 400 500 6000
20
40
60
80
100
Weig
ht lo
ss / %
Temperature / C
PAA/SiO2 fiber
PAA/SiO2/Ce(NO
3)
3 fiber
PAA/Ce(NO3)
3 fiber
100 200 300 400 500 600 700 8000
20
40
60
80
100
LiCo hydroxides of PAA fiber
LiCo hydroxides of PAA : SiO2 fiber
We
igh
t lo
ss / %
Temperature / C
(b)
(a)
100 200 300 400 500 6000
20
40
60
80
100
Weig
ht lo
ss / %
Temperature / C
PAA/SiO2 fiber
PAA/SiO2/Ce(NO
3)
3 fiber
PAA/Ce(NO3)
3 fiber
100 200 300 400 500 600 700 8000
20
40
60
80
100
LiCo hydroxides of PAA fiber
LiCo hydroxides of PAA : SiO2 fiber
We
igh
t lo
ss / %
Temperature / C
(b)
(a)
Page 144
123
the diffusion of polymer residues formed upon increase of temperature, the
nanoparticles may act as barrier for mass transport, hence improving the thermal
properties of the materials. Such phenomenon was already reported by Mizuno et al.
(Mizuno et al. 2012), who found that the presence of vapor-grown carbon fiber hindered
the decomposition of PVA.
Table 7.2. Diameters of the fibers and percent compositions of the metal oxide/silica
fibers
Fiber dfiber before
calcinationa
[nm]
dfiber after
calcinationa
[nm]
CeO2b
[vol%]
CeO2 + SiO2c
[wt%]
CeO2 + SiO2d
[wt%]
SiO2 540 ± 80 510 ± 80 – 48 50
CeO2/SiO2
(0.06/1.00)
290 ± 50 180 ± 30 6.3 40 48
CeO2/SiO2
(0.12/1.00)
300 ± 40 190 ± 30 12.2 33 47
CeO2 320 ± 50 240 ± 40 100.0 23 19
Fiber dfiber before
calcinationa
[nm]
dfiber after
calcinationa
[nm]
LiCoO2b
[vol%]
LiCoO2 +
SiO2c [wt%]
LiCoO2 + SiO2d
[wt%]
LiCoO2 310 ± 60 190 ± 30 100.0 12 18
LiCoO2/SiO2 350 ± 80 320 ± 100 5.03 41 57
a measured with SEM,
b calculated
from Equation
(7.2),
c measured with TGA,
d
theoretical content.
The obtained electrospun materials were observed by SEM before (Figure 7.3a–
d) and after calcination (Figure 7.3e–h). Fiber mats prepared from PAA solutions with
different Ce/Si mole ratios (0.06 and 0.12) were compared with references prepared
from PAA solutions containing only either Ce(NO3)3 or SiO2.
Page 145
124
Figure 7.3. SEM micrographs of composite fibers as prepared: (a) PAA/SiO2; (b, c)
PAA/Ce(NO3)3/SiO2 with Ce/Si molar ratios of 0.06 and 0.12, respectively,
(d) PAA/Ce(NO3)3; and oxide fibers after calcination at 600 ºC: (e) SiO2, (f)
CeO2/SiO2 (0.06/1.00), (g) CeO2/SiO2 (0.12/1.00), (h) CeO2
Silica nanoparticles were visible on the fibers, creating a rough surface. The
addition of Ce(NO3)3 resulted in reduction of the fiber diameter in comparison to the
PAA/SiO2 fiber (Table 7.2), which can be explained by the increase of charge density
(a)
(c)
(b)
(d)
(e)
(g)
(f)
(h)
(a)
(c)
(b)
(d)
(e)
(g)
(f)
(h)
Page 146
125
upon addition of the metal salt, inducing larger coulombic interactions and, therefore,
higher stretching of the electrospinning jet (Zong et al. 2002). After calcination at 600
ºC, the morphology of the fibers was preserved and the diameter of the fibers decreased
owing to the removal of the polymer template. The incorporation of silica nanoparticles
into the metal oxide fibers increased remarkably the surface area of the electrospun
mats. The specific surface area of neat CeO2 fibers was 38 m2 g
−1, whereas it increased
to 161, 155, and 127 m2 g
−1 for SiO2, CeO2/SiO2(0.12/1.00), and CeO2/SiO2(0.06/1.00),
respectively.
Figure 7.4. SEM micrographs of PAA/LiOH/Co(OH)2 precursor fibers after calcination
(a) at 300 ºC, (b) at 400 ºC and (c) PAA/LiOH/Co(OH)2/ SiO2 precursor fibers
calcinated at 600 ºC
(a)
(b)
(c)
(a)
(b)
(c)
Page 147
126
The hierarchy of size observed in the fibers (metal oxide crystallites < silica
nanoparticles < fibers) is reflected in the hierarchy of porosity in the structure.
Accordingly, there were two levels of porosity: the porosity created by the space
between electrospun fibers, and the porosity of the silica particles, both contributing to
the porosity of the resulting metal oxide fibers.
The morphologies of the LiCoO2 and LiCoO2/SiO2 fibers are shown in Figure
7.4a–c. The PAA/LiOH/Co(OH)2 fibers before calcination were continuous, smooth,
and uniform, with a diameter of 310 ± 60 nm. Similar to the CeO2 fibers, the calcination
caused shrinkage of the average fiber diameter of LiCoO2 to 190 ± 30 nm. LiCoO2/SiO2
fibers were clearly less brittle than neat LiCoO2 fibers. Whereas the LiCoO2 mat was
converted to ultrafine pieces and powder (photograph on the top of Figure 7.1), the mat
of LiCoO2/SiO2 (bottom image) remained intact after calcination. The non-woven could
be therefore handled as single object, which was not the case for the calcinated metal
oxide fibers. We investigated the effect of calcination temperature on the fiber
morphology. At 300 ºC, a phase separation was observed on the surface of fibers
(Figure 7.4a). The components (i.e., polymer chains, residues, and metal oxide/salt)
were separated into distinct domains oriented along the surface of the fibers. This phase
separation occurred uniformly on the surface along the long axis of the fiber wherein
polymer-lean and polymer-rich phases were formed, indicating a spinodal
decomposition. The orientation of the domains is probably a consequence of
elongational electrical forces occuring during electrospinning process. When the
calcination temperature was increased to 400 ºC, the fibers preserved their continuous
structures and the average diameter was reduced by about 40% with narrower
distribution (25%). At the same time, the nucleation and growth of LiCoO2
nanoparticles occurred and the LiCoO2 nanoparticles were visible on the fibers surface
(Figure 7.4b). The PAA aqueous solution composed of lithium/cobalt hydroxides was
basic (pH 9). Under this condition, surface silanols are dissociated into negatively
charged oxide (Si–O−) on the surface. Electrostatic repulsion between negatively
charged particles resulted in stable and non-aggregated silica dispersions. In the
presence of silica nanoparticles of uniform size in the fibers, homogeneously assembled
continuous fibers could be formed (Figure 7.4c).
Page 148
127
The crystallinity of the samples was studied by X-ray diffraction (XRD). Figure
7.5a shows the XRD patterns of fibers prepared with different CeO2/SiO2 ratios (0.06/1
and 0.12/1) after calcination at 600 °C, compared with those of SiO2 and CeO2 fibers.
Figure 7.5. (a) XRD patterns of SiO2 fibers (blank) and CeO2 fibers prepared in the
absence and presence of SiO2 nanoparticles after calcination at 600 ºC; (b)
XRD patterns of lithium cobalt oxide fibers prepared in the absence and
presence of SiO2 nanoparticles after calcination at 400 ºC (the stars indicate
reflections of Co3O4)
0 20 40 60 80 100
2 / degree
Inte
nsity / a
. u.
(511)
(422)
(420)
(331)
(400)
(222)(3
11)
(220)
(200)
(111)
CeO2 fibers
CeO2/SiO
2 (0.12/1.00)fibers
CeO2/SiO
2 (0.06/1.00) fibers
SiO2 fibers
10 20 30 40 50 60 70
Inte
nsity / a
. u
.
2 / degree
(113)
(018)/
(110)
(107)
** (015)
(104)
(006)/
(012)
(101)(0
03)
LiCoO2/SiO
2 fibers
LiCoO2 fibers
(b)
(a)
Page 149
128
Whereas the silica fibers displayed a typical amorphous halo, the samples containing
cerium showed the characteristic reflections for cubic CeO2 (JCPDS card No. 34-394).
The increase of the amount of cerium salt resulted in sharper reflections, which
correlates with the size of the crystalline domains. Under the same experimental
conditions, CeO2 fibers prepared without colloid silica showed much narrower
reflections. The sizes of the crystallites estimated by the Scherrer equation (Langford
and Wilson 1978), from the (111) reflection were 4, 6, and 12 nm for the CeO2/SiO2
(0.06/1.00), CeO2/SiO2 (0.12/1.00) and CeO2 fibers, respectively. These results indicate
that the size of the ceria crystallites was smaller in the presence of amorphous silica and
increased with increasing amount of cerium. The change in the crystallite size can be
associated with the interfacial area between the colloid and the ceria salt. Since colloidal
silica provides large surface area, there may be higher number of nucleation sites
compared to the fibers prepared in the absence of the colloids, so that the resulting
crystallites are smaller. When the amount of cerium nitrate increased, while keeping
constant the amount of the SiO2 nanoparticles, there was no change in nucleation sites
and the diameter of the particles increased.
Figure 7.5b contains the XRD patterns of the binary metal oxide fibers after
calcination of PAA/LiOH/Co(OH)2 in the absence and in the presence of SiO2. In the
absence of SiO2, the diffractogram confirms the formation of LiCoO2 (JCPDS card no.
44-0145), with a minor coexistence of Co3O4 (JCPDS card no. 42-1467). In the fibers
formed in the presence of SiO2 nanoparticles, the Co3O4 phase becomes more
significant, which may be ascribed to the formation of lithiated Co3O4 and/or
nonstoichimetric lithium cobalt oxide. The coexistence of Co3O4 and the formation of
nonstoichiometric lithium cobalt oxides have been often reported in solid-state reaction
methods from metal salts (Antolini 1997, 2004, Rossen et al. 1993). A crystallite size of
14 nm was estimated by the Scherrer equation from the most intense (003) reflection for
the LiCoO2 obtained without SiO2. The crystallite size is consistent with the particle
size estimated statistically from SEM micrographs (21 ± 5 nm, Figure 7.4b).
The backscattered electrons detection mode of the SEM was used to localize
LiCoO2 nanoparticles among the SiO2 (Figure 7.6), thanks to the atomic number
contrast between both type of particles (SiO2, and LiCoO2). LiCoO2 nanoparticles with
a diameter of 12 ± 3 nm could be identified, being uniformly dispersed among the SiO2
particles in the fiber. The experimental and theoretical volume percents of the particles,
Page 150
129
Figure 7.6. (a) SEM micrograph of a LiCoO2/SiO2 fiber obtained by calcination at 600
ºC and (b) schematic representation of the simple geometrical model used to
calculate percent volume of LiCoO2/SiO2 nanoparticles
VMO[exp] and VMO[th], were calculated from statistical measurements of particles sizes in
SEM images using equations 7.1 and 7.2:
100%
2SiO
(MO)p
MO[exp] ×
×
DA
VNV (7.1)
100%
2SiOMO
MO
[th]MO
VV
VV (7.2)
N represents the number of LiCoO2 particles on the surface of a half cylinder
(A), DSiO2 the radius of the SiO2 nanoparticles, and Vp is the volume of one spherical
LiCoO2 particle. The experimental volume percent was found to be 5.0%, which was
SiO2 NPs
LiCoO2 NPs
d
D
(a)
(b)
SiO2 NPs
LiCoO2 NPs
d
D
(a)
(b)
Page 151
130
above the theoretical value of 4.4%. Note that VMO[exp] represents the volume of LiCoO2
that was observed by SEM, that is, located on the surface of the fibers. Therefore, the
small difference between VMO[exp] and VMO[th] suggests that the LiCoO2 nanoparticles are
preferably situated at the fibers surface. Based on Figure 7.6a, we estimated that 18% of
the total amount LiCoO2 nanoparticles were present on the surface of the fibers. The
fact that the surface is enriched with the metal oxide is particularly remarkable, because
the metal oxide is the functional component, whereas silica plays the role of a structural
framework. Such nanocomposites have potential applications as cathodes of lithium-ion
batteries, functional membranes for filtration, and supported catalysts.
Figure 7.7. (a) PL emission spectra of rhodamine B solutions in the presence of
CeO2/SiO2 (0.12/1.00) fibers at different time intervals, and (b) effect of
different fiber catalysts on the photocatalytic degradation of rhodamine B
0 60 120 180 240 300
0.4
0.6
0.8
1.0
CeO2/SiO
2 (0.12/1.00)
CeO2
CeO2/SiO
2 (0.06/1.00)
I/I 0
Time / min
520 560 600 640 6800
3000
6000
9000
Inte
nsity / a
.u.
Wavelength / nm
initial
10 min
60 min
120 min
180 min
240 min
(a)
(b)
0 60 120 180 240 300
0.4
0.6
0.8
1.0
CeO2/SiO
2 (0.12/1.00)
CeO2
CeO2/SiO
2 (0.06/1.00)
I/I 0
Time / min
520 560 600 640 6800
3000
6000
9000
Inte
nsity / a
.u.
Wavelength / nm
initial
10 min
60 min
120 min
180 min
240 min
(a)
(b)
Page 152
131
As a representative example, the photocatalytic activity of the CeO2/SiO2 fibers
for the degradation of rhodamine B was investigated and compared with the SiO2 fibers
and the brittle CeO2 fibers. The evolution of the reaction was monitored by recording
the photoluminescence (PL) emission spectra of the samples at different times (Figure
7.7) The maximum at 580 nm decreased exponentially with respect to the irradiation
time (Figure 7b). As expected, the decay of fluorescence intensity at time t over initial
intensity (I/I0) is slower for silica-supported fibers than for the neat fibers. The absolute
performance of the fibers for the degradation of the dye, which is proportional to
P(%)=100−(I/I0), was found to increase from P = 10% (CeO2/SiO2:0.06/1.00) to P =
61% (CeO2/SiO2:0.12/1.00) when the concentration of ceria in the fibers was increased.
Although P was found to be higher for the neat CeO2 fibers (66%), the performance
related to the amount of ceria in the fibers Pw are much higher for the
CeO2/SiO2:0.12/1.00 (60% per mg CeO2) than for the neat CeO2 fibers (33% per mg).
This comparatively higher activity is explained by the fact that CeO2 was well-
distributed along the fibers surface, being therefore accessible for the molecules to be
degraded. This result is important because the efficient use of metal oxide allows the
reduction of the production costs, taking into account that SiO2 is rather inexpensive
and largely available as resource.
7.5. Conclusion
The simultaneous electrospinning of ceria and lithium cobalt oxide precursors
and silica nanoparticles allows the fabrication of hierarchically structured composite
nanofibers. The metal oxide was found to nucleate predominantly at the surface of the
fibers during the calcination process, forming nanoparticles that were mainly present
among larger silica nanoparticles on the surface of even larger fibers. This hierarchical
structural organization enhanced the available surface area of the catalytically active
metal oxide component and improved accordingly the efficiency of the system for
catalysis, as shown by the successful degradation of a fluorescent dye by ceria fibers.
Moreover, the presence of silica nanoparticles as structural framework for the fibers
improved both thermal and mechanical stability of the nanocomposites. The conjugation
of the latter features with the functionality provided by the metal oxide and the
Page 153
132
versatility of the electrospinning technique make our method extendable to a large
variety of supported metal oxides.
Page 154
133
CHAPTER 8
EVALUATION AND CONCLUDING REMARKS
Electrospinning provides a simple and versatile method for generating ultrathin
fibers from a rich variety of materials that include polymers, composites, and ceramics.
Since electrospun fibers have high specific surface area, high porosity, and small pore
size, the unique fibers have been proposed for wide range of applications. This thesis
has illuminated the production and characterization of functional fibrous materials for
potential applications; particularly we have thematized the concept of filtration by
electrospun fibers.
The removal of undesirable ions by the nanofiber sorbent was demonstrated
through three model analyte-sorbent systems. Firstly, chitosan with inherent amino
groups were used in fabrication of electrospun nanofibrous membranes. The adsorption
efficiency of this chitosan nanofibrous scaffold was checked with a mixture of Cu (II),
Fe (III), Ag(I) and Cd (II) ions at pH = 6. The sorption characteristics for chitosan
flakes and the as-spun nanofibers were compared and higher extent of sorption was
observed for the nanofibers as a result of the increased surface area (more than 20-fold).
In addition, it was found that the selective sorption percentage of Cu(II) reached 99 %,
depending on the ionic size and charge density.
The functionality of the nanofibrous membrane was further controlled through
suitable surface modification to use as a filter. For example, chitosan nanofibrous
membrane was decorated with nanozerovalent iron (nZVI) particles for sequestration of
inorganic arsenic species at neutral pH values. Some experimental evidence suggested
that the arsenic ions seem to be fixed to oxide and oxyhydroxide groups at the outer
shells of nZVI surfaces. While As(V) retains its oxidation state upon fixation by nZVI,
As(III) undergoes oxidation to As(V). Furthermore, chitosan seems to contribute to
arsenite and arsenate complexation mainly via its hydroxyl groups. Yet another surface
modification was applied to poly(acrylonitrile) fibers by transforming nitrile groups in
the chains to amidoxime groups. The surface functionalized PAN fiber network was
used found to be promising in sorption of U(VI) ions by column method. The post-
functionalization remarkably enhanced U(VI) sorption capacity of PAN fibers. The
Page 155
134
extent of U(VI) sorption on the fibers was found to depend on the pH of the medium
and the initial concentration of the salt. The optimum pH for U(VI) sorption by
amidoximated-PAN fibers was found to be 4.0, at which UO22+
ion is the main species.
The adsorbed amount of U(VI) ions increased with an increase in initial U(VI)
concentration.
We concluded that electrospun nanofibrous mats are promising candidates for
filtration, and they possess the additional ability to sequestration of toxic metal ions
through sorption. These smart materials have interconnected pore structure, high
porosity, and high surface area-to-volume ratio characteristics. The combination of high
surface area and tunable surface functionality of the nanofibrous mat can remarkably
enhance the sorption capability of target analytes, comparable to that of commercial
sorbents.
Not only polymeric but also porous ceramic fibers were fabricated by
electrospinning of metal oxide precursors and polymer solutions. ZnO-based fibers
synthesized and used to analyze the water vapor adsorption and desorption kinetics by
Quartz Crystal Microbalance (QCM) technique. The resistance of the fiber sensor
decreases by about four orders of magnitude with increasing relative humidity (RH)
from 10 % to 90 % RH. In addition, electrospinning technique was used as coating
process for deposition of CeO2/ZnO and ZnO based nanofibers on the electrode of
QCM. Independent of the chemistry of metal oxide, the fiber mats respond to the
benzene, propanol, ethanol, and dichloromethane vapors. However, ZnO fibrous mat
exhibited better performance than CeO2/ZnO fibers most probably due to the crystal
structure and presence of higher oxygen vacancies. Moreover, ZnO fiber mat seemed to
be particulary sensitive to the alcoholic type compounds based on Lewis acid-base
pairing.
We highlighted sensing applications associated with the remarkable features of
the electrospun metal oxide nanofibrous mat. The preparation method of QCM coating
is versatile and can also be used to fabricate several active nanofibrous materials. The
electrospun fibers coated QCM sensors offer easy handling, high sensitivity, as well as
good reproducibility. We envisaged that this strategy enables efficient design and
development of other QCM coatings toward toxic gases and vapors.
A further conclusion is that the incorporation of silica nanoparticles in the
composite fibers significantly improves both thermal and mechanical stability of the
nanofibers. This is deduced from the study of the preparation of hierarchically
Page 156
135
structured metal oxide nanofibers based on the simultaneous electrospinning of of ceria
and lithium cobalt oxide precursors and silica nanoparticles. The metal oxide was found
to nucleate mainly at the surface of the fibers in the course of calcination process,
forming nanoparticles that were predominantly present among larger silica
nanoparticles on the surface of even larger fibers. This hierarchical structural
organization enhanced the available surface area of the catalytically active metal oxide
component and improved accordingly the efficiency of the system for catalysis, as
shown by the successful degradation of a fluorescent dye in the presence of the fibers.
Page 157
136
REFERENCES
Addai-Mensah, J., J. Li, M. Zbik, and W. R. Wilmarth. 2005. Uranium sorption on solid
aluminosilicate phases under caustic conditions. Separation Science and
Technology 40 (1-3):267-279.
Agarwal, S., J. H. Wendorff, and A. Greiner. 2010. Chemistry on electrospun polymeric
nanofibers: Merely routine chemistry or a real challenge? Macromolecular
Rapid Communications 31 (15):1317-1331.
Ai, Z. H., Y. Cheng, L. Z. Zhang, and J. R. Qiu. 2008. Efficient removal of Cr(VI) from
aqueous solution with Fe@Fe2O3 core-shell nanowires. Environmental Science
& Technology 42 (18):6955-6960.
An, B., T. R. Steinwinder, and D. Y. Zhao. 2005. Selective removal of arsenate from
drinking water using a polymeric ligand exchanger. Water Research 39
(20):4993-5004.
Antolini, E. 1997. Formation of lithium-cobalt spinel oxide (LixCo3-xO4) by solid-state
reaction of a Li2CO3-Co3O4 powder mixture. Materials Research Bulletin 32
(1):9-14.
Antolini, E. 2004. LiCoO2: formation, structure, lithium and oxygen nonstoichiometry,
electrochemical behaviour and transport properties. Solid State Ionics 170 (3-
4):159-171.
Arnold, P. L., G. M. Jones, S. O. Odoh, G. Schreckenbach, N. Magnani, and J. B. Love.
2012. Strongly coupled binuclear uranium-oxo complexes from uranyl oxo
rearrangement and reductive silylation. Nature Chemistry 4 (3):221-227.
Assaad, E., A. Azzouz, D. Nistor, A. V. Ursu, T. Sajin, D. N. Miron, F. Monette, P.
Niquette, and R. Hausler. 2007. Metal removal through synergic coagulation-
flocculation using an optimized chitosan-montmorillonite system. Applied Clay
Science 37 (3-4):258-274.
Bailey, S. E., T. J. Olin, R. M. Bricka, and D. D. Adrian. 1999. A review of potentially
low-cost sorbents for heavy metals. Water Research 33 (11):2469-2479.
Balasubramanian, N., T. Kojima, and C. Srinivasakannan. 2009. Arsenic removal
through electrocoagulation: Kinetic and statistical modeling. Chemical
Engineering Journal 155 (1-2):76-82.
Baleanu, M. C., R. R. Nigmatullin, S. Okur, and K. Ocakoglu. 2011. New approach for
consideration of adsorption/desorption data. Communications in Nonlinear
Science and Numerical Simulation 16 (12):4643-4648.
Bassi, R., S. O. Prasher, and B. K. Simpson. 2000. Removal of selected metal ions from
aqueous solutions using chitosan flakes. Separation Science and Technology 35
(4):547-560.
Page 158
137
Baumgarten, P. . 1971. Electrostatic spinning of acrylic microfibres. Journal of Colloid
and Interface Science 36 (71-79).
Benguella, B., and H. Benaissa. 2002. Cadmium removal from aqueous solutions by
chitin: kinetic and equilibrium studies. Water Research 36 (10):2463-2474.
Bevan, M. A. J., C. J. Proctor, J. Bakerrogers, and N. D. Warren. 1991. Exposure to
carbon-monoxide, respirable suspended particulates, and volatile organic-
compounds while commuting by bicycle. Environmental Science & Technology
25 (4):788-791.
Bhatia, S. C., and N. Ravi. 2003. A Mossbauer study of the interaction of chitosan and
D-glucosamine with iron and its relevance to other metalloenzymes.
Biomacromolecules 4 (3):723-727.
Bissen, M., and F. H. Frimmel. 2003. Arsenic - a review. Part II: Oxidation of arsenic
and its removal in water treatment. Acta Hydrochimica Et Hydrobiologica 31
(2):97-107.
Boddu, V. M., K. Abburi, J. L. Talbott, E. D. Smith, and R. Haasch. 2008. Removal of
arsenic(III) and arsenic(V) from aqueous medium using chitosan-coated
biosorbent. Water Research 42 (3):633-642.
Bose, G.M. 1745. "Recherches sur la cause et sur la veritable theorie del'electricite " In.
Wittenberg.
Boyaci, E., A. E. Eroglu, and T. Shahwan. 2010. Sorption of As(V) from waters using
chitosan and chitosan-immobilized sodium silicate prior to atomic spectrometric
determination. Talanta 80 (3):1452-1460.
Carewska, M., A. DiBartolomeo, and S. Scaccia. 1995. Thermoanalytical study of
synthesis of mixed lithium cobalt oxides. Thermochimica Acta 269:491-506.
Chen, A. H., S. C. Liu, C. Y. Chen, and C. Y. Chen. 2008. Comparative adsorption of
Cu(II), Zn(II), and Pb(II) ions in aqueous solution on the crosslinked chitosan
with epichlorohydrin. Journal of Hazardous Materials 154 (1-3):184-191.
Chen, B. J., X. W. Sun, C. X. Xu, and B. K. Tay. 2004. Growth and characterization of
zinc oxide nano/micro-fibers by thermal chemical reactions and vapor transport
deposition in air. Physica E-Low-Dimensional Systems & Nanostructures 21
(1):103-107.
Chen, C. C., and Y. C. Chung. 2006. Arsenic removal using a biopolymer chitosan
sorbent. Journal of Environmental Science and Health Part a-Toxic/Hazardous
Substances & Environmental Engineering 41 (4):645-658.
Chen, J. P., G. Y. Chang, and J. K. Chen. 2008. Electrospun collagen/chitosan
nanofibrous membrane as wound dressing. Colloids and Surfaces a-
Physicochemical and Engineering Aspects 313:183-188.
Page 159
138
Chen, Y. Z., Z. P. Zhang, J. Yu, and Z. X. Guo. 2009. Poly(methyl methacrylate)/silica
nanocomposite Fibers by electrospinning. Journal of Polymer Science Part B-
Polymer Physics 47 (12):1211-1218.
Cho, B. Y. 2005. Iron removal using an aerated granular filter. Process Biochemistry 40
(10):3314-3320.
Choi, J., D. W. Park, and S. E. Shim. 2012. Electrospun PEDOT:PSS/carbon
nanotubes/PVP nanofibers as chemiresistors for aromatic volatile organic
compounds. Synthetic Metals 162 (17-18):1513-1518.
Choi, S. S., S. G. Lee, S. S. Im, S. H. Kim, and Y. L. Joo. 2003. Silica nanofibers from
electrospinning/sol-gel process. Journal of Materials Science Letters 22
(12):891-893.
Choi, S. W., J. Y. Park, and S. S. Kim. 2009. Synthesis of SnO2-ZnO core-shell
nanofibers via a novel two-step process and their gas sensing properties.
Nanotechnology 20 (46).
Choong, T. S. Y., T. G. Chuah, Y. Robiah, F. L. G. Koay, and I. Azni. 2007. Arsenic
toxicity, health hazards and removal techniques from water: an overview.
Desalination 217 (1-3):139-166.
Chutia, P., S. Kato, T. Kojima, and S. Satokawa. 2009. Adsorption of As(V) on
surfactant-modified natural zeolites. Journal of Hazardous Materials 162
(1):204-211.
Cloupeau, M., and B. Prunetfoch. 1989. Electrostatic Spraying of Liquids in Cone-Jet
Mode Journal of Electrostatics 22 (2):135-159.
Comarmond, M. J., T. E. Payne, J. J. Harrison, S. Thiruvoth, H. K. Wong, R. D.
Aughterson, G. R. Lumpkin, K. Muller, and H. Foerstendorf. 2011. Uranium
Sorption on Various Forms of Titanium Dioxide - Influence of Surface Area,
Surface Charge, and Impurities. Environmental Science & Technology 45
(13):5536-5542.
Cooley, J. F. 1902. Apparatus for electrically dispersing fluids.
Cooley, J. F. 1903. Electrical Method of Dispersing Fluids
Crespy, D., K. Friedemann, and A. M. Popa. 2012. Colloid-Electrospinning: Fabrication
of Multicompartment Nanofibers by the Electrospinning of Organic or/and
Inorganic Dispersions and Emulsions. Macromolecular Rapid Communications
33 (23):1978-1995.
Crini, G. 2005. Recent developments in polysaccharide-based materials used as
adsorbents in wastewater treatment. Progress in Polymer Science 30 (1):38-70.
Page 160
139
Cumbal, L., and A. K. Sengupta. 2005. Arsenic removal using polymer-supported
hydrated iron(III) oxide nanoparticles: Role of Donnan membrane effect.
Environmental Science & Technology 39 (17):6508-6515.
Dai, Y. Q., W. Y. Liu, E. Formo, Y. M. Sun, and Y. N. Xia. 2011. Ceramic nanofibers
fabricated by electrospinning and their applications in catalysis, environmental
science, and energy technology. Polymers for Advanced Technologies 22
(3):326-338.
Dambies, L., E. Guibal, and A. Roze. 2000. Arsenic(V) sorption on molybdate-
impregnated chitosan beads. Colloids and Surfaces a-Physicochemical and
Engineering Aspects 170 (1):19-31.
Daus, B., R. Wennrich, and H. Weiss. 2004. Sorption materials for arsenic removal
from water: A comparative study. Water Research 38 (12):2948-2954.
DeMarco, M. J., A. K. Sengupta, and J. E. Greenleaf. 2003. Arsenic removal using a
polymeric/inorganic hybrid sorbent. Water Research 37 (1):164-176.
Demir, M. M., P. Castignolles, U. Akbey, and G. Wegner. 2007. In-situ bulk
polymerization of dilute Particle/MMA dispersions. Macromolecules 40
(12):4190-4198.
Demir, M. M., M. A. Gulgun, Y. Z. Menceloglu, B. Erman, S. S. Abramchuk, E. E.
Makhaeva, A. R. Khokhlov, V. G. Matveeva, and M. G. Sulman. 2004.
Palladium nanoparticles by electrospinning from poly(acrylonitrile-co-acrylic
acid)-PdCl2 solutions. Relations between preparation conditions, particle size,
and catalytic activity. Macromolecules 37 (5):1787-1792.
Demir, M. M., K. Koynov, U. Akbey, C. Bubeck, I. Park, I. Lieberwirth, and G.
Wegner. 2007. Optical properties of composites of PMMA and surface-modified
zincite nanoparticles. Macromolecules 40 (4):1089-1100.
Demir, M. M., G. Ugur, M. A. Gulgun, and Y. Z. Menceloglu. 2008. Glycidyl-
methacrylate-based electrospun mats and catalytic silver nanoparticles.
Macromolecular Chemistry and Physics 209 (5):508-515.
Demir, M. M., I. Yilgor, E. Yilgor, and B. Erman. 2002. Electrospinning of
polyurethane fibers. Polymer 43 (11):3303-3309.
Demir, R., S. Okur, M. Seker, and M. Zor. 2011. Humidity Sensing Properties of CdS
Nanoparticles Synthesized by Chemical Bath Deposition Method. Industrial &
Engineering Chemistry Research 50 (9):5606-5610.
Desai, K., K. Kit, J. J. Li, P. M. Davidson, S. Zivanovic, and H. Meyer. 2009.
Nanofibrous chitosan non-wovens for filtration applications. Polymer 50
(15):3661-3669.
Desai, K., K. Kit, J. Li, and S. Zivanovic. 2008. Morphological and surface properties
of electrospun chitosan nanofibers. Biomacromolecules 9 (3):1000-1006.
Page 161
140
Deschamps, E., V. S. T. Ciminelli, and W. H. Holl. 2005. Removal of As(III) and
As(V) from water using a natural Fe and Mn enriched sample. Water Research
39 (20):5212-5220.
Ding, B., H. Kim, C. Kim, M. Khil, and S. Park. 2003. Morphology and crystalline
phase study of electrospun TiO2-SiO2 nanofibres. Nanotechnology 14 (5):532-
537.
Ding, B., M. R. Wang, X. F. Wang, J. Y. Yu, and G. Sun. 2010. Electrospun
nanomaterials for ultrasensitive sensors. Materials Today 13 (11):16-27.
Ding, B., M. R. Wang, J. Y. Yu, and G. Sun. 2009. Gas sensors based on electrospun
nanofibers. Sensors 9 (3):1609-1624.
Donat, R., K. Esen, H. Cetisli, and S. Aytas. 2009. Adsorption of uranium(VI) onto
Ulva sp.-sepiolite composite. Journal of Radioanalytical and Nuclear Chemistry
279 (1):253-261.
Dong, H., E. Fey, A. Gandelman, and W. E. Jones. 2006. Synthesis and assembly of
metal nanoparticles on electrospun poly(4-vinylpyridine) fibers and poly(4-
vinylpyridine) composite fibers. Chemistry of Materials 18 (8):2008-2011.
Doshi, J., and D. H. Reneker. 1995. Electrospinning Process and applications of
electrospun fibers Journal of Electrostatics 35 (2-3):151-160.
Dousova, B., V. Machovic, D. Kolousek, F. Kovanda, and V. Dornicak. 2003. Sorption
of As(V) species from aqueous systems. Water Air and Soil Pollution 149 (1-
4):251-267.
Drexler, K. E. 1986. "Engines of Creation: The Coming Era of Nanotechnology." In.
New York: Anchor Books.
Elostua, C., U. Bariain, J. R. Matias, F. J. Arregui, A. Luquin, and M. Laguna. 2006.
Volatile alcoholic compounds fibre optic nanosensor. Sensors and Actuators B-
Chemical 115 (1):444-449.
EPA. 2000. Chemical Precipitation. edited by U.S. Environmental Protection Agency.
Washington, DC.
Erol, A., S. Okur, B. Comba, O. Mermer, and M. C. Arikan. 2010. Humidity sensing
properties of ZnO nanoparticles synthesized by sol-gel process. Sensors and
Actuators B-Chemical 145 (1):174-180.
Fan, H. T., X. J. Xu, X. K. Ma, and T. Zhang. 2011. Preparation of LaFeO3 nanofibers
by electrospinning for gas sensors with fast response and recovery.
Nanotechnology 22 (11).
Fang, D. F., C. Chang, B. S. Hsiao, and B. Chu. 2006. "Development of multiple-jet
electrospinning technology." In Polymeric Nanofibers, edited by D. H. Reneker
and H. Fong, 91-+.
Page 162
141
Fang, X., and D. H. Reneker. 1997. DNA fibers by electrospinning. Journal of
Macromolecular Science-Physics B36 (2):169-173.
Feynmann, R.P. 1959. There's Plenty of Room at the Bottom.
http://www.zyvex.com/nanotech/feynman.html.
Fierro, J. L. G. 2006. "Metal Oxides: Chemistry and Applications." In. Boca Raton, FL:
Taylor and Francis.
Formhals, A. 1934. Process and Apparatus for Preparing Artificial Threads.
Frey, M. W., A. J. Baeumner, D. Li, and P. Kakad. 2009. Electrospun nanofiber-based
biosensor assemblies.
Fridrikh, S. V., J. H. Yu, M. P. Brenner, and G. C. Rutledge. 2003. Controlling the fiber
diameter during electrospinning. Physical Review Letters 90 (14).
Friedemann, K., T. Corrales, M. Kappl, K. Landfester, and D. Crespy. 2012. Facile and
Large-Scale Fabrication of Anisometric Particles from Fibers Synthesized by
Colloid-Electrospinning. Small 8 (1):144-153.
Gamage, A., and F. Shahidi. 2007. Use of chitosan for the removal of metal ion
contaminants and proteins from water. Food Chemistry 104 (3):989-996.
Geng, B., Z. H. Jin, T. L. Li, and X. H. Qi. 2009. Preparation of chitosan-stabilized Fe-0
nanoparticles for removal of hexavalent chromium in water. Science of the Total
Environment 407 (18):4994-5000.
Ghurye, G. L., D. A. Clifford, and A. R. Tripp. 1999. Combined arsenic and nitrate
removal by ion exchange. Journal American Water Works Association 91
(10):85-96.
Gibson, P., H. Schreuder-Gibson, and D. Rivin. 2001. Transport properties of porous
membranes based on electrospun nanofibers. Colloids and Surfaces a-
Physicochemical and Engineering Aspects 187:469-481.
Gihring, T. M., G. K. Druschel, R. B. McCleskey, R. J. Hamers, and J. F. Banfield.
2001. Rapid arsenite oxidation by Thermus aquaticus and Thermus
thermophilus: Field and laboratory investigations. Environmental Science &
Technology 35 (19):3857-3862.
Gimenez, J., M. Martinez, J. de Pablo, M. Rovira, and L. Duro. 2007. Arsenic sorption
onto natural hematite, magnetite, and goethite. Journal of Hazardous Materials
141 (3):575-580.
Graham, K., M. Gogins, and H. Schreuder-Gibson. 2004. Incorporation of electrospun
nanofibers into functional structures. 13:21-27.
Grate, J. W. 2000. Acoustic wave microsensor arrays for vapor sensing. Chemical
Reviews 100 (7):2627-2647.
Page 163
142
Greathouse, J. A., and R. T. Cygan. 2006. Water structure and aqueous uranyl(VI)
adsorption equilibria onto external surfaces of beidellite, montmorillonite, and
pyrophyllite: Results from molecular simulations. Environmental Science &
Technology 40 (12):3865-3871.
Greiner, A., and J. H. Wendorff. 2007. Electrospinning: A fascinating method for the
preparation of ultrathin fibres. Angewandte Chemie-International Edition 46
(30):5670-5703.
Grosvenor, A. P., B. A. Kobe, M. C. Biesinger, and N. S. McIntyre. 2004. Investigation
of multiplet splitting of Fe 2p XPS spectra and bonding in iron compounds.
Surface and Interface Analysis 36 (12):1564-1574.
Guibal, E. 2004. Interactions of metal ions with chitosan-based sorbents: a review.
Separation and Purification Technology 38 (1):43-74.
Guibal, E., A. Larkin, T. Vincent, and J. M. Tobin. 1999. Chitosan sorbents for
platinum sorption from dilute solutions. Industrial & Engineering Chemistry
Research 38 (10):4011-4022.
Gupta, A., M. Yunus, and N. Sankararamakrishnan. 2012. Zerovalent iron encapsulated
chitosan nanospheres - A novel adsorbent for the removal of total inorganic
Arsenic from aqueous systems. Chemosphere 86 (2):150-155.
Hagiwaba, K., O. Oji-Machi, and K. Ku. 1929. Process for manufacturing artificial silk
and other filaments by applying electric current.
Haider, S., and S. Y. Park. 2009. Preparation of the electrospun chitosan nanofibers and
their applications to the adsorption of Cu(II) and Pb(II) ions from an aqueous
solution. Journal of Membrane Science 328 (1-2):90-96.
Hajra, M. G., K. Mehta, and G. G. Chase. 2003. Effects of humidity, temperature, and
nanofibers on drop coalescence in glass fiber media. Separation and Purification
Technology 30 (1):79-88.
Hakim, M., Y. Y. Broza, O. Barash, N. Peled, M. Phillips, A. Amann, and H. Haick.
2012. Volatile organic compounds of lung cancer and possible biochemical
pathways. Chemical Reviews 112 (11):5949-5966.
Hansen, N. S., T. E. Ferguson, J. E. Panels, A. H. A. Park, and Y. L. Joo. 2011.
Inorganic nanofibers with tailored placement of nanocatalysts for hydrogen
production via alkaline hydrolysis of glucose. Nanotechnology 22 (32).
Hess, S., M. M. Demir, V. Yakutkin, S. Baluschev, and G. Wegner. 2009. Investigation
of oxygen permeation through composites of PMMA and surface-modified ZnO
nanoparticles. Macromolecular Rapid Communications 30 (4-5):394-401.
Hirotsu, T., S. Katoh, K. Sugasaka, M. Seno, and T. Itagaki. 1986. Adsorption
equilibrium of uranium from aqueous UO2(CO3)3 4- Solutions on a polymer
Page 164
143
bearing amidoxime groups. Journal of the Chemical Society-Dalton
Transactions (9):1983-1986.
Hohman, M. M., M. Shin, G. Rutledge, and M. P. Brenner. 2001a. Electrospinning and
electrically forced jets. I. Stability theory. Physics of Fluids 13 (8):2201-2220.
Hohman, M. M., M. Shin, G. Rutledge, and M. P. Brenner. 2001b. Electrospinning and
electrically forced jets. II. Applications. Physics of Fluids 13 (8):2221-2236.
Horzum, N., E. Boyaci, A. E. Eroglu, T. Shahwan, and M. M. Demir. 2010. Sorption
efficiency of chitosan nanofibers toward metal ions at low concentrations.
Biomacromolecules 11 (12):3301-3308.
Horzum, N., R. Munoz-Espi, G. Glasser, M. M. Demir, K. Landfester, and D. Crespy.
2012. Hierarchically structured metal oxide/silica nanofibers by colloid
electrospinning. Acs Applied Materials & Interfaces 4 (11):6338-6345.
Horzum, N., D. Tascioglu, S. Okur, and M. M. Demir. 2011. Humidity sensing
properties of ZnO-based fibers by electrospinning. Talanta 85 (2):1105-1111.
Hu, J. Y., X. Y. Liu, Y. Q. Fan, S. H. Xie, Y. Pei, M. H. Qiao, K. N. Fan, X. X. Zhang,
and B. N. Zong. 2013. Physically mixed ZnO and skeletal NiMo for one-pot
reforming-hydrogenolysis of glycerol to 1,2-propanediol. Chinese Journal of
Catalysis 34 (5):1020-1026.
Hu, X. L., J. M. Gong, L. Z. Zhang, and J. C. Yu. 2008. Continuous size tuning of
monodisperse ZnO colloidal nanocrystal clusters by a microwave-polyol process
and their application for humidity sensing. Advanced Materials 20 (24):4845-+.
Huang, Z. M., Y. Z. Zhang, M. Kotaki, and S. Ramakrishna. 2003. A review on
polymer nanofibers by electrospinning and their applications in nanocomposites.
Composites Science and Technology 63 (15):2223-2253.
Hudson, E. A., L. J. Terminello, B. E. Viani, M. Denecke, T. Reich, P. G. Allen, J. J.
Bucher, D. K. Shuh, and N. M. Edelstein. 1999. The structure of U6+ sorption
complexes on vermiculite and hydrobiotite. Clays and Clay Minerals 47
(4):439-457.
Iqbal, J., H. J. Kim, J. S. Yang, K. Baek, and J. W. Yang. 2007. Removal of arsenic
from groundwater by micellar-enhanced ultrafiltration (MEUF). Chemosphere
66 (5):970-976.
Islam, Akms, Z. Ismail, M. N. Ahmad, B. Saad, A. R. Othman, A. Y. M. Shakaff, A.
Daud, and Z. Ishak. 2005. Transient parameters of a coated quartz-crystal
microbalance sensor for the detection of volatile organic compounds (VOCs).
Sensors and Actuators B-Chemical 109 (2):238-243.
Jagadish, Chennupati, and Stephen J. Pearton. 2006. Zinc oxide bulk, thin films and
nanostructures: Processing, properties, and applications. Hong Kong: Elsevier.
Page 165
144
Jia, H. F., G. Y. Zhu, B. Vugrinovich, W. Kataphinan, D. H. Reneker, and P. Wang.
2002. Enzyme-carrying polymeric nanofibers prepared via electrospinning for
use as unique biocatalysts. Biotechnology Progress 18 (5):1027-1032.
Jiang, H. L., D. F. Fang, B. S. Hsiao, B. Chu, and W. L. Chen. 2004. Optimization and
characterization of dextran membranes prepared by electrospinning.
Biomacromolecules 5 (2):326-333.
Jones, A. P. 1999. Indoor air quality and health. Atmospheric Environment 33
(28):4535-4564.
Juang, R. S., and R. C. Shiau. 2000. Metal removal from aqueous solutions using
chitosan-enhanced membrane filtration. Journal of Membrane Science 165
(2):159-167.
Justi, K. C., V. T. Favere, M. C. M. Laranjeira, A. Neves, and R. A. Peralta. 2005.
Kinetics and equilibrium adsorption of Cu(II), Cd(II), and Ni(II) ions by
chitosan functionalized with 2 -bis-(pyridylmethyl)aminomethyl -4-methyl-6-
formylphenol. Journal of Colloid and Interface Science 291 (2):369-374.
Kalin, M., W. N. Wheeler, and G. Meinrath. 2005. The removal of uranium from
mining waste water using algal/microbial biomass. Journal of Environmental
Radioactivity 78 (2):151-177.
Kameoka, J., R. Orth, Y. N. Yang, D. Czaplewski, R. Mathers, G. W. Coates, and H. G.
Craighead. 2003. A scanning tip electrospinning source for deposition of
oriented nanofibres. Nanotechnology 14 (10):1124-1129.
Kampa, M., and E. Castanas. 2008. Human health effects of air pollution.
Environmental Pollution 151 (2):362-367.
Kanehata, M., B. Ding, and S. Shiratori. 2007. Nanoporous ultra-high specific surface
inorganic fibres. Nanotechnology 18 (31).
Kanel, S. R., J. M. Greneche, and H. Choi. 2006. Arsenic(V) removal kom groundwater
using nano scale zero-valent iron as a colloidal reactive barrier material.
Environmental Science & Technology 40 (6):2045-2050.
Kanel, S. R., B. Manning, L. Charlet, and H. Choi. 2005. Removal of arsenic(III) from
groundwater by nanoscale zero-valent iron. Environmental Science &
Technology 39 (5):1291-1298.
Kanjwal, M. A., N. A. M. Barakat, F. A. Sheikh, S. J. Park, and H. Y. Kim. 2010.
Photocatalytic activity of ZnO-TiO2 hierarchical nanostructure prepared by
combined electrospinning and hydrothermal techniques. Macromolecular
Research 18 (3):233-240.
Kanjwal, M. A., F. A. Sheikh, N. A. M. Barakat, I. S. Chronakis, and H. Y. Kim. 2011.
Co3O4-ZnO hierarchical nanostructures by electrospinning and hydrothermal
methods. Applied Surface Science 257 (18):7975-7981.
Page 166
145
Kanjwal, M. A., F. A. Sheikh, N. A. M. Barakat, X. Q. Li, H. Y. Kim, and I. S.
Chronakis. 2012. Zinc oxide's hierarchical nanostructure and its photocatalytic
properties. Applied Surface Science 258 (8):3695-3702.
Karabelli, D., S. Unal, T. Shahwan, and A. E. Eroglu. 2011. Preparation and
characterization of alumina-supported iron nanoparticles and its application for
the removal of aqueous Cu2+ ions. Chemical Engineering Journal 168 (2):979-
984.
Karatapanis, A. E., D. E. Petrakis, and C. D. Stalikas. 2012. A layered magnetic
iron/iron oxide nanoscavenger for the analytical enrichment of ng-L-1
concentration levels of heavy metals from water. Analytica Chimica Acta
726:22-27.
Kasaai, M. R. 2007. Calculation of Mark-Houwink-Sakurada (MHS) equation
viscometric constants for chitosan in any solvent-temperature system using
experimental reported viscometric constants data. Carbohydrate Polymers 68
(3):477-488.
Kasaai, M. R., J. Arul, and C. Charlet. 2000. Intrinsic viscosity-molecular weight
relationship for chitosan. Journal of Polymer Science Part B-Polymer Physics
38 (19):2591-2598.
Khani, M. H. 2011. Statistical analysis and isotherm study of uranium biosorption by
Padina sp algae biomass. Environmental Science and Pollution Research 18
(5):790-799.
Kilincarslan, A., and S. Akyil. 2005. Uranium adsorption characteristic and
thermodynamic behavior of clinoptilolite zeolite. Journal of Radioanalytical and
Nuclear Chemistry 264 (3):541-548.
Kim, I. D., and A. Rothschild. 2011. Nanostructured metal oxide gas sensors prepared
by electrospinning. Polymers for Advanced Technologies 22 (3):318-325.
Kim, J., and M. M. Benjamin. 2004. Modeling a novel ion exchange process for arsenic
and nitrate removal. Water Research 38 (8):2053-2062.
Kim, J. S., and D. H. Reneker. 1999. Polybenzimidazole nanofiber produced by
electrospinning. Polymer Engineering and Science 39 (5):849-854.
Kim, Y. J., C. H. Ahn, and M. O. Choi. 2010. Effect of thermal treatment on the
characteristics of electrospun PVDF-silica composite nanofibrous membrane.
European Polymer Journal 46 (10):1957-1965.
Klimov, E., V. Raman, R. Venkatesh, W. Heckmann, and R. Stark. 2010. Designing
Nanofibers via Electrospinning from Aqueous Colloidal Dispersions: Effect of
Cross-Linking and Template Polymer. Macromolecules 43 (14):6152-6155.
Klug, H. P., and L. E. Alexander. 1974a. "X-Ray Diffraction procedures for
polycrystalline and amorphous materials." In. New York: John Wiley.
Page 167
146
Klug, Harold P. , and Leroy E. Alexander. 1974b. X-Ray Diffraction procedures: For
polycrystalline and amorphous materials. 2nd Edition ed. New York: John
Wiley.
Koikov, L. N., N. V. Alexeeva, E. A. Lisitza, E. S. Krichevsky, N. B. Grigoryev, A. V.
Danilov, I. S. Severina, N. V. Pyatakova, and V. G. Granik. 1998. Oximes,
amidoximes and hydroxamic acids as nitric oxide donors. Mendeleev
Communications (4):165-168.
Kowal-Fouchard, A., R. Drot, E. Simoni, and J. J. Ehrhardt. 2004. Use of spectroscopic
techniques for uranium (VI)/montmorillonite interaction modeling.
Environmental Science & Technology 38 (5):1399-1407.
Lacasa, E., P. Canizares, C. Saez, F. J. Fernandez, and M. A. Rodrigo. 2011. Removal
of arsenic by iron and aluminium electrochemically assisted coagulation.
Separation and Purification Technology 79 (1):15-19.
Lakshmanan, D., D. A. Clifford, and G. Samanta. 2010. Comparative study of arsenic
removal by iron using electrocoagulation and chemical coagulation. Water
Research 44 (19):5641-5652.
Lakshmanan, D., D. Clifford, and G. Samanta. 2008. Arsenic removal by coagulation -
With aluminum, iron, titanium, and zirconium. Journal American Water Works
Association 100 (2):76-+.
Lange, Norbert Adolph. 1979. "Lange's Handbook of Chemistry." In, ed John A. Dean:
McGraw-Hill Inc.,US.
Langford, J. I., and A. J. C. Wilson. 1978. Scherrer after 60 years - Survey and some
new results in determination of crystallite size. Journal of Applied
Crystallography 11 (APR):102-113.
Larrondo, L., and R. S. J. Manley. 1981. Electrostatic fiber spinning from polymer
melts. 1. Experimental observations on fiber formation and properties. Journal
of Polymer Science Part B-Polymer Physics 19 (6):909-920.
Lee, D., M. Yoo, H. Seo, Y. Tak, W. G. Kim, K. Yong, S. W. Rhee, and S. Jeon. 2009.
Enhanced mass sensitivity of ZnO nanorod-grown quartz crystal microbalances.
Sensors and Actuators B-Chemical 135 (2):444-448.
Lee, M. Y., K. J. Hong, T. Kajiuchi, and J. W. Yang. 2005. Synthesis of chitosan-based
polymeric surfactants and their adsorption properties for heavy metals and fatty
acids. International Journal of Biological Macromolecules 36 (3):152-158.
Lee, S. T., F. L. Mi, Y. J. Shen, and S. S. Shyu. 2001. Equilibrium and kinetic studies of
copper(II) ion uptake by chitosan-tripolyphosphate chelating resin. Polymer 42
(5):1879-1892.
Page 168
147
Lenoble, V., O. Bouras, V. Deluchat, B. Serpaud, and J. C. Bollinger. 2002. Arsenic
adsorption onto pillared clays and iron oxides. Journal of Colloid and Interface
Science 255 (1):52-58.
Leupin, O. X., and S. J. Hug. 2005. Oxidation and removal of arsenic (III) from aerated
groundwater by filtration through sand and zero-valent iron. Water Research 39
(9):1729-1740.
Li, D., Y. L. Wang, and Y. N. Xia. 2003. Electrospinning of polymeric and ceramic
nanofibers as uniaxially aligned arrays. Nano Letters 3 (8):1167-1171.
Li, D., and Y. N. Xia. 2004. Electrospinning of nanofibers: Reinventing the wheel?
Advanced Materials 16 (14):1151-1170.
Li, J. S., X. Y. Miao, Y. X. Hao, J. Y. Zhao, X. Y. Sun, and L. J. Wang. 2008.
Synthesis, amino-functionalization of mesoporous silica and its adsorption of
Cr(VI). Journal of Colloid and Interface Science 318 (2):309-314.
Li, L., W. H. Meyer, G. Wegner, and M. Wohlfahrt-Mehrens. 2005. Synthesis of
submicrometer-sized electrochemically active lithium cobalt oxide via a
polymer precursor. Advanced Materials 17 (8):984-+.
Li, N., and R. B. Bai. 2005. Copper adsorption on chitosan-cellulose hydrogel beads:
behaviors and mechanisms. Separation and Purification Technology 42 (3):237-
247.
Li, N., R. B. Bai, and C. K. Liu. 2005. Enhanced and selective adsorption of mercury
ions on chitosan beads grafted with polyacrylamide via surface-initiated atom
transfer radical polymerization. Langmuir 21 (25):11780-11787.
Li, X. Q., D. W. Elliott, and W. X. Zhang. 2006. Zero-valent iron nanoparticles for
abatement of environmental pollutants: Materials and engineering aspects.
Critical Reviews in Solid State and Materials Sciences 31 (4):111-122.
Lim, J. M., J. H. Moon, G. R. Yi, C. J. Heo, and S. M. Yang. 2006. Fabrication of one-
dimensional colloidal assemblies from electrospun nanofibers. Langmuir 22
(8):3445-3449.
Lin, W. P., Y. Lu, and H. M. Zeng. 1993. Studies of the preparation, structure, and
properties of an acrylic chelating fiber containiıng amidoxime groups. Journal of
Applied Polymer Science 47 (1):45-52.
Lindner, J. P., C. Roben, A. Studer, M. Stasiak, R. Ronge, A. Greiner, and H. J.
Wendorff. 2009. Reusable catalysts based on dendrimers trapped in poly(p-
xylylene) nanotubes. Angewandte Chemie-International Edition 48 (47):8874-
8877.
Liu, B., and H. C. Zeng. 2003. Hydrothermal synthesis of ZnO nanorods in the diameter
regime of 50 nm. Journal of the American Chemical Society 125 (15):4430-
4431.
Page 169
148
Liu, F. T., S. F. Gao, S. K. Pei, S. C. Tseng, and C. H. J. Liu. 2009. ZnO nanorod gas
sensor for NO2 detection. Journal of the Taiwan Institute of Chemical Engineers
40 (5):528-532.
Liu, H. Q., J. Kameoka, D. A. Czaplewski, and H. G. Craighead. 2004. Polymeric
nanowire chemical sensor. Nano Letters 4 (4):671-675.
Liu, L., Y. Zhang, G. G. Wang, S. C. Li, L. Y. Wang, Y. Han, X. X. Jiang, and A. G.
Wei. 2011. High toluene sensing properties of NiO-SnO2 composite nanofiber
sensors operating at 330 degrees C. Sensors and Actuators B-Chemical 160
(1):448-454.
Liu, T. Y., L. Zhao, and Z. L. Wang. 2012. Removal of hexavalent chromium from
wastewater by Fe-0-nanoparticles-chitosan composite beads: characterization,
kinetics and thermodynamics. Water Science and Technology 66 (5):1044-1051.
Lu, G. Q., I. Lieberwirth, and G. Wegner. 2006. A general polymer-based process to
prepare mixed metal oxides: The case of Zn1-xMgxO nanoparticles. Journal of
the American Chemical Society 128 (48):15445-15450.
Ma, H., Y. P. Huang, M. W. Shen, R. Guo, X. Y. Cao, and X. Y. Shi. 2012. Enhanced
dechlorination of trichloroethylene using electrospun polymer nanofibrous mats
immobilized with iron/palladium bimetallic nanoparticles. Journal of Hazardous
Materials 211:349-356.
Ma, H. Y., C. Burger, B. S. Hsiao, and B. Chu. 2012. Nanofibrous microfiltration
membrane based on cellulose nanowhiskers. Biomacromolecules 13 (1):180-
186.
Ma, H. Y., B. S. Hsiao, and B. Chu. 2013. Electrospun nanofibrous membrane for
heavy metal ion adsorption. Current Organic Chemistry 17 (13):1361-1370.
Ma, Z. J., H. J. Ji, Y. Teng, G. P. Dong, J. J. Zhou, D. Z. Tan, and J. R. Qiu. 2011.
Engineering and optimization of nano- and mesoporous silica fibers using sol-
gel and electrospinning techniques for sorption of heavy metal ions. Journal of
Colloid and Interface Science 358 (2):547-553.
Mahmoud, W. E., and F. A. Al-Agel. 2011. A novel strategy to synthesize cobalt
hydroxide and Co3O4 nanowires. Journal of Physics and Chemistry of Solids 72
(7):904-907.
Mandal, B. K., and K. T. Suzuki. 2002. Arsenic round the world: a review. Talanta 58
(1):201-235.
Mayer, E., and J. Warren. 1998. Evaluating filtration media: A comparison of polymeric
membranes and nonwovens. Filtration & Separation 35 (10):912-914.
McKinley, J. P., J. M. Zachara, S. C. Smith, and G. D. Turner. 1995. The influence of
uranyl hydrolysis and multiple site-binding reactions on adsorption of U(VI) to
montmorillonite. Clays and Clay Minerals 43 (5):586-598.
Page 170
149
Milot, C., J. McBrien, S. Allen, and E. Guibal. 1998. Influence of physicochemical and
structural characteristics of chitosan flakes on molybdate sorption. Journal of
Applied Polymer Science 68 (4):571-580.
Miretzky, P., and A. F. Cirelli. 2009. Hg(II) removal from water by chitosan and
chitosan derivatives: A review. Journal of Hazardous Materials 167 (1-3):10-
23.
Mizuno, Y., E. Hosono, T. Saito, M. Okubo, D. Nishio-Hamane, K. Oh-ishi, T. Kudo,
and H. S. Zhou. 2012. Electrospinning synthesis of wire-structured LiCoO2 for
electrode materials of high-power Li-Ion batteries. Journal of Physical
Chemistry C 116 (19):10774-10780.
Mohan, D., and C. U. Pittman. 2007. Arsenic removal from water/wastewater using
adsorbents - A critical review. Journal of Hazardous Materials 142 (1-2):1-53.
Moharram, M. A., and M. G. Khafagi. 2006. Thermal behavior of poly(acrylic acid)-
poly(vinyl pyrrolidone) and poly(acrylic acid)-metal-poly(vinyl pyrrolidone)
complexes. Journal of Applied Polymer Science 102 (4):4049-4057.
Mokkelbost, T., I. Kaus, T. Grande, and M. A. Einarsrud. 2004. Combustion synthesis
and characterization of nanocrystalline CeO2-based powders. Chemistry of
Materials 16 (25):5489-5494.
Mondal, B. C., and A. K. Das. 2003. Use of 6-mercapto purinylazo resin in chromium
speciation. Bulletin of the Chemical Society of Japan 76 (1):111-114.
Monteiro, O. A. C., and C. Airoldi. 1999. Some thermodynamic data on copper-chitin
and copper-chitosan biopolymer interactions. Journal of Colloid and Interface
Science 212 (2):212-219.
Mori, M., H. Nishimura, Y. Itagaki, Y. Sadaoka, and E. Traversa. 2009. Detection of
sub-ppm level of VOCs based on a Pt/YSZ/Pt potentiometric oxygen sensor
with reference air. Sensors and Actuators B-Chemical 143 (1):56-61.
Morton, W. J. 1902. Method of Dispersing Fluids.
Mun, G. A., Z. S. Nurkeeva, G. S. Irmukhametova, and O. Guven. 2007. Synthesis,
characterization and adsorption study of the uranyl ions by hydrogels based on
polyethylene glycol and methacrylic acid copolymers. Nuclear Instruments &
Methods in Physics Research Section B-Beam Interactions with Materials and
Atoms 265 (1):379-384.
Nagao, M. 1971a. The Journal of Physical Chemistry 76:3822–3828.
Nagao, M. 1971b. Physisorption of water on zinc oxide surface Journal of Physical
Chemistry 75 (25):3822-&.
Nakajima, A., T. Horikoshi, and T. Sakaguchi. 1982. Studies on the accumulation of
heavy-metal elements in biological-systems .21. Recovery of uranium by
Page 171
150
immobilized mıcroorganısms. European Journal of Applied Microbiology and
Biotechnology 16 (2-3):88-91.
Nam, Y. S., W. H. Park, D. Ihm, and S. M. Hudson. 2010. Effect of the degree of
deacetylation on the thermal decomposition of chitin and chitosan nanofibers.
Carbohydrate Polymers 80 (1):291-295.
Ng, J. C. Y., W. H. Cheung, and G. McKay. 2002. Equilibrium studies of the sorption
of Cu(II) ions onto chitosan. Journal of Colloid and Interface Science 255
(1):64-74.
Ngah, W. S. W., S. Ab Ghani, and A. Kamari. 2005. Adsorption behaviour of Fe(II) and
Fe(III) ions in aqueous solution on chitosan and cross-linked chitosan beads.
Bioresource Technology 96 (4):443-450.
Ngah, W. S. W., C. S. Endud, and R. Mayanar. 2002. Removal of copper(II) ions from
aqueous solution onto chitosan and cross-linked chitosan beads. Reactive &
Functional Polymers 50 (2):181-190.
Ngah, W. S. W., and S. Fatinathan. 2008. Adsorption of Cu(II) ions in aqueous solution
using chitosan beads, chitosan-GLA beads and chitosan-alginate beads.
Chemical Engineering Journal 143 (1-3):62-72.
Ngah, W. S. W., and S. Fatinathan. 2010. Pb(II) biosorption using chitosan and chitosan
derivatives beads: Equilibrium, ion exchange and mechanism studies. Journal of
Environmental Sciences-China 22 (3):338-346.
Nilchi, A., A. A. Babalou, R. Raflee, and H. S. Kalal. 2008. Adsorption properties of
amidoxime resins for separation of metal ions from aqueous systems. Reactive
& Functional Polymers 68 (12):1665-1670.
Ning, R. Y. 2002. Arsenic removal by reverse osmosis. Desalination 143 (3):237-241.
Ohkawa, K., D. I. Cha, H. Kim, A. Nishida, and H. Yamamoto. 2004. Electrospinning
of chitosan. Macromolecular Rapid Communications 25 (18):1600-1605.
Okamoto, H., S. Nishida, H. Todo, Y. Sakakura, K. Iida, and K. Danjo. 2003.
Pulmonary gene delivery by chitosan-pDNA complex powder prepared by a
supercritical carbon dioxide process. Journal of Pharmaceutical Sciences 92
(2):371-380.
Oku, M., and K. Hirokawa. 1979. XPS observation of Fe1-XO at temperatures between
25 and 800-degrees-C. Journal of Applied Physics 50 (10):6303-6308.
Okur, S., C. Ceylan, and E. Culcular. 2012. Humidity adsorption kinetics of a trypsin
gel film. Journal of Colloid and Interface Science 368:470-473.
Okur, S., M. Kus, F. Ozel, V. Aybek, and M. Yilmaz. 2010. Humidity adsorption
kinetics of calix 4 arene derivatives measured using QCM technique. Talanta 81
(1-2):248-251.
Page 172
151
Okur, S., N. Uzar, N. Tekguzel, A. Erol, and M. C. Arikan. 2012. Synthesis and
humidity sensing analysis of ZnS nanowires. Physica E-Low-Dimensional
Systems & Nanostructures 44 (6):1103-1107.
Ozgur, U., Y. I. Alivov, C. Liu, A. Teke, M. A. Reshchikov, S. Dogan, V. Avrutin, S. J.
Cho, and H. Morkoc. 2005. A comprehensive review of ZnO materials and
devices. Journal of Applied Physics 98 (4).
Pagana, A. E., S. D. Sklari, E. S. Kikkinides, and V. T. Zaspalis. 2008. Microporous
ceramic membrane technology for the removal of arsenic and chromium ions
from contaminated water. Microporous and Mesoporous Materials 110 (1):150-
156.
Panels, J. E., and Y. L. Joo. 2006. Incorporation of vanadium oxide in silica nanofiber
mats via electrospinning and sol-gel synthesis. Journal of Nanomaterials.
Park, J. A., J. Moon, S. J. Lee, S. H. Kim, H. Y. Chu, and T. Zyung. 2010. SnO2-ZnO
hybrid nanofibers-based highly sensitive nitrogen dioxides sensor. Sensors and
Actuators B-Chemical 145 (1):592-595.
Park, J. A., J. Moon, S. J. Lee, S. C. Lim, and T. Zyung. 2009. Fabrication and
characterization of ZnO nanofibers by electrospinning. Current Applied Physics
9:S210-S212.
Paulsen, F. G., S. S. Shojaie, and W. B. Krantz. 1994. Effect of evaporation step on
macrovoid formation in wet-cast polymeric membranes Journal of Membrane
Science 91 (3):265-282.
Pekel, N., and O. Guven. 2003. Separation of uranyl ions with amidoximated
poly(acrylonitrile/N-vinylimidazole) complexing sorbents. Colloids and
Surfaces a-Physicochemical and Engineering Aspects 212 (2-3):155-161.
Pekel, N., N. Sahiner, and O. Guven. 2000. Development of new chelating hydrogels
based on N-vinyl imidazole and acrylonitrile. Radiation Physics and Chemistry
59 (5-6):485-491.
Pekel, N., N. Sahiner, and O. Guven. 2004. Thermodynamics of adsorption of uranyl
ions onto amidoximated poly(acrylonitrile)/poly(N-vinyl 2-pyrrolidone)
interpenetrating polymer networks. Journal of Polymer Science Part B-Polymer
Physics 42 (6):986-993.
Pelino, M. , C. Cantalini, and M. Faccio. 1994. Principles and applications of ceramic
Humidity Sensors. Active and Passive Electronic Components 16 (2):69-87.
Piron, E., and A. Domard. 1998. Interaction between chitosan and uranyl ions. Part 2.
Mechanism of interaction. International Journal of Biological Macromolecules
22 (1):33-40.
Planas, M. R. 2002. Ph.D. Thesis, Universitat Polytecnica de Catalunya.
Page 173
152
Pontoni, L., and M. Fabbricino. 2012. Use of chitosan and chitosan-derivatives to
remove arsenic from aqueous solutions-a mini review. Carbohydrate Research
356:86-92.
Pradip, C. Maltesh, P. Somasundaran, R. A. Kulkarni, and S. Gundiah. 1991. Polymer-
polymer complexation in dilute aqueous-solutions - poly(acrylic acid)-
poly(ethylene oxide) and poly(acrylic acid)-poly(vinylpyrrolidone). Langmuir 7
(10):2108-2111.
Puziy, A. M., O. I. Poddubnaya, V. N. Zaitsev, and O. P. Konoplitska. 2004. Modeling
of heavy metal ion binding by phosphoric acid activated carbon. Applied Surface
Science 221 (1-4):421-429.
Qi, Q., T. Zhang, S. J. Wang, and X. J. Zheng. 2009. Humidity sensing properties of
KCl-doped ZnO nanofibers with super-rapid response and recovery. Sensors and
Actuators B-Chemical 137 (2):649-655.
Qi, Q., T. Zhang, Q. J. Yu, R. Wang, Y. Zeng, L. Liu, and H. B. Yang. 2008. Properties
of humidity sensing ZnO nanorods-base sensor fabricated by screen-printing.
Sensors and Actuators B-Chemical 133 (2):638-643.
Qiu, S. J., L. X. Sun, H. L. Chu, Y. J. Zou, F. Xu, and N. Matsuda. 2009. Study of
adsorption behaviors of meso-tetrakis (4-N-Methylpyridyl) porphine p-
Toluenesulfonate at indium-tin-oxide electrode/solution interface by in-situ
internal reflection spectroscopy and cyclic voltammetry. Thin Solid Films 517
(9):2905-2911.
Qiu, Y. F., and S. H. Yang. 2007. ZnO nanotetrapods: Controlled vapor-phase synthesis
and application for humidity sensing. Advanced Functional Materials 17
(8):1345-1352.
Ramaseshan, R., S. Sundarrajan, R. Jose, and S. Ramakrishna. 2007. Nanostructured
ceramics by electrospinning. Journal of Applied Physics 102 (11).
Ramos, M. A. V., W. Yan, X. Q. Li, B. E. Koel, and W. X. Zhang. 2009. Simultaneous
oxidation and reduction of arsenic by zero-valent iron nanoparticles:
Understanding the significance of the core-shell structure. Journal of Physical
Chemistry C 113 (33):14591-14594.
Public domain software to be downloaded from National Institute of Health ImageJ
1.44p.
Rayleigh, L. . 1882. On the equilibrium of liquid conducting masses charged with
electricity. Philosophical Magazine, 184-186.
Ren, T., Y. Si, J. M. Yang, B. Ding, X. X. Yang, F. Hong, and J. Y. Yu. 2012.
Polyacrylonitrile/polybenzoxazine-based Fe3O4@carbon nanofibers:
hierarchical porous structure and magnetic adsorption property. Journal of
Materials Chemistry 22 (31):15919-15927.
Page 174
153
Reneker, D. H., and I. Chun. 1996. Nanometre diameter fibres of polymer, produced by
electrospinning. Nanotechnology 7 (3):216-223.
Reneker, D. H., and A. L. Yarin. 2008. Electrospinning jets and polymer nanofibers.
Polymer 49 (10):2387-2425.
Reneker, D. H., A. L. Yarin, H. Fong, and S. Koombhongse. 2000. Bending instability
of electrically charged liquid jets of polymer solutions in electrospinning.
Journal of Applied Physics 87 (9):4531-4547.
Rhazi, M., J. Desbrieres, A. Tolaimate, M. Rinaudo, P. Vottero, A. Alagui, and M. El
Meray. 2002. Influence of the nature of the metal ions on the complexation with
chitosan. Application to the treatment of liquid waste. European Polymer
Journal 38 (8):1523-1530.
Ricco, A. J., R. M. Crooks, and G. C. Osbourn. 1998. Surface acoustic wave chemical
sensor arrays: New chemically sensitive interfaces combined with novel cluster
analysis to detect volatile organic compounds and mixtures. Accounts of
Chemical Research 31 (5):289-296.
Rivas, B. L., and A. Maureira. 2008. Water-soluble polyelectrolytes contaning sulfonic
acid groups with metal ion binding ability by using the liquid phase polymer
based retention technique. Macromolecular Symposia 270:143-152.
Rodrigues, A. E. . 1986. Ion Exchange Science and Technology. Leiden, Netherlands:
Martinus Nijhoff Publishers.
Rossen, E., J. N. Reimers, and J. R. Dahn. 1993. Synthesis and electrochemistry of
spinel Lt-LiCOO2. Solid State Ionics 62 (1-2):53-60.
Sadeghi, S., H. Azhdari, H. Arabi, and A. Z. Moghaddam. 2012. Surface modified
magnetic Fe3O4 nanoparticles as a selective sorbent for solid phase extraction of
uranyl ions from water samples. Journal of Hazardous Materials 215:208-216.
Saeed, K., S. Haider, T. J. Oh, and S. Y. Park. 2008. Preparation of amidoxime-
modified polyacrylonitrile (PAN-oxime) nanofibers and their applications to
metal ions adsorption. Journal of Membrane Science 322 (2):400-405.
Saha, J. C., A. K. Dikshit, M. Bandyopadhyay, and K. C. Saha. 1999. A review of
arsenic poisoning and its effects on human health. Critical Reviews in
Environmental Science and Technology 29 (3):281-313.
Sahiner, N., N. Pekel, and O. Guven. 1999. Radiation synthesis, characterization and
amidoximation of N-vinyl-2-pyrrolidone/acrylonitrile interpenetrating polymer
networks. Reactive & Functional Polymers 39 (2):139-146.
Sakai, S., T. Yamaguchi, R. A. Putra, R. Watanabe, M. Kawabe, M. Taya, and K.
Kawakami. 2012. Controlling apatite microparticles formation by calcining
electrospun sol-gel derived ultrafine silica fibers. Journal of Sol-Gel Science and
Technology 61 (2):374-380.
Page 175
154
Sang, Y. M., F. S. Li, Q. B. Gu, C. Z. Liang, and J. Q. Chen. 2008. Heavy metal-
contaminated groundwater treatment by a novel nanofiber membrane.
Desalination 223 (1-3):349-360.
Sangsanoh, P., and P. Supaphol. 2006. Stability improvement of electrospun chitosan
nanofibrous membranes in neutral or weak basic aqueous solutions.
Biomacromolecules 7 (10):2710-2714.
Sauerbrey, G. 1959. Verwendung von Schwingquarzen zur Wägung dünner Schichten
und zur Mikrowägung. Zeitschrift für Physik A Hadrons and Nuclei 155:206-
222.
Schaub, R., P. Thostrup, N. Lopez, E. Laegsgaard, I. Stensgaard, J. K. Norskov, and F.
Besenbacher. 2001. Oxygen vacancies as active sites for water dissociation on
rutile TiO2(110). Physical Review Letters 87 (26).
Schiffman, J. D., L. A. Stulga, and C. L. Schauer. 2009. Chitin and chitosan:
Transformations due to the electrospinning process. Polymer Engineering and
Science 49 (10):1918-1928.
Schreuder-Gibson, H., P. Gibson, K. Senecal, M. Sennett, J. Walker, W. Yeomans, D.
Ziegler, and P. P. Tsai. 2002. Protective textile materials based on electrospun
nanofibers. Journal of Advanced Materials 34 (3):44-55.
Seferis, J.C. . 1999. Polymer Handbook. New York: Wiley & Sons.
Seol, Y. J., K. H. Kim, Y. M. Kang, I. A. Kim, and S. H. Rhee. 2009. Bioactivity, pre-
osteoblastic cell responses, and osteoconductivity evaluations of the electrospun
non-woven SiO(2)-CaO gel fabrics. Journal of Biomedical Materials Research
Part B-Applied Biomaterials 90B (2):679-687.
Shahwan, T., H. N. Erten, and S. Unugur. 2006. A characterization study of some
aspects of the adsorption of aqueous Co2+ ions on a natural bentonite clay.
Journal of Colloid and Interface Science 300 (2):447-452.
Shahwan, T., C. Uzum, A. E. Eroglu, and I. Lieberwirth. 2010. Synthesis and
characterization of bentonite/iron nanoparticles and their application as
adsorbent of cobalt ions. Applied Clay Science 47 (3-4):257-262.
Shao, C. L., H. Kim, J. Gong, and D. Lee. 2002. A novel method for making silica
nanofibres by using electrospun fibres of polyvinylalcohol/silica composite as
precursor. Nanotechnology 13 (5):635-637.
Sharma, Y. C., V. Srivastava, V. K. Singh, S. N. Kaul, and C. H. Weng. 2009. Nano-
adsorbents for the removal of metallic pollutants from water and wastewater.
Environmental Technology 30 (6):583-609.
Page 176
155
Shi, L. N., X. Zhang, and Z. L. Chen. 2011. Removal of Chromium (VI) from
wastewater using bentonite-supported nanoscale zero-valent iron. Water
Research 45 (2):886-892.
Shi, W., W. S. Lu, and L. Jiang. 2009. The fabrication of photosensitive self-assembly
Au nanoparticles embedded in silica nanofibers by electrospinning. Journal of
Colloid and Interface Science 340 (2):291-297.
Shih, M. C. 2005. An overview of arsenic removal by pressure-driven membrane
processes. Desalination 172 (1):85-97.
Shih, S. J., K. B. Borisenko, L. J. Liu, and C. Y. Chen. 2010. Multiporous ceria
nanoparticles prepared by spray pyrolysis. Journal of Nanoparticle Research 12
(5):1553-1559.
Si, P., J. Mortensen, A. Kornolov, J. Denborg, and P. J. Moller. 2007. Polymer coated
quartz crystal microbalance sensors for detection of volatile organic compounds
in gas mixtures. Analytica Chimica Acta 597 (2):223-230.
Si, Y., T. Ren, B. Ding, J. Y. Yu, and G. Sun. 2012. Synthesis of mesoporous magnetic
Fe3O4@carbon nanofibers utilizing in situ polymerized polybenzoxazine for
water purification. Journal of Materials Chemistry 22 (11):4619-4622.
Sigmund, W., J. Yuh, H. Park, V. Maneeratana, G. Pyrgiotakis, A. Daga, J. Taylor, and
J. C. Nino. 2006. Processing and structure relationships in electrospinning of
ceramic fiber systems. Journal of the American Ceramic Society 89 (2):395-407.
Simm, W. , K. Gosling, R. Bonart, and B. von Falkai. 1972.
Smorada, R. 1996. Nonwoven fabrics, spunbonded. In Kirk-Othmer Encyclopedia of
Chemical Technology. New York: Wiley.
Song, S., A. Lopez-Valdivieso, D. J. Hernandez-Campos, C. Peng, M. G. Monroy-
Fernandez, and I. Razo-Soto. 2006. Arsenic removal from high-arsenic water by
enhanced coagulation with ferric ions and coarse calcite. Water Research 40
(2):364-372.
Srinivasan, G., and D. H. Reneker. 1995. Structure and Morphology of Small-Diameter
Electrospun Aramid Fibers Polymer International 36 (2):195-201.
Stasiak, M., A. Studer, A. Greiner, and J. H. Wendorff. 2007. Polymer fibers as carriers
for homogeneous catalysts. Chemistry-a European Journal 13 (21):6150-6156.
Strunk, J., W. C. Vining, and A. T. Bell. 2011. Synthesis of different CeO2 structures
on mesoporous silica and characterization of their reduction properties. Journal
of Physical Chemistry C 115 (10):4114-4126.
Sun, L. H., R. P. Liu, S. J. Xia, Y. L. Yang, and G. B. Li. 2009. Enhanced As(III)
removal with permanganate oxidation, ferric chloride precipitation and sand
filtration as pretreatment of ultrafiltration. Desalination 243 (1-3):122-131.
Page 177
156
Sun, L., L. D. Zhang, C. H. Liang, Z. G. Yuan, Y. Zhang, W. Xu, J. X. Zhang, and Y. Z.
Chen. 2011. Chitosan modified Fe-0 nanowires in porous anodic alumina and
their application for the removal of hexavalent chromium from water. Journal of
Materials Chemistry 21 (16):5877-5880.
Sureshkumar, M. K., D. Das, M. B. Mallia, and P. C. Gupta. 2010. Adsorption of
uranium from aqueous solution using chitosan-tripolyphosphate (CTPP) beads.
Journal of Hazardous Materials 184 (1-3):65-72.
Sylwester, E. R., E. A. Hudson, and P. G. Allen. 2000. The structure of uranium (VI)
sorption complexes on silica, alumina, and montmorillonite. Geochimica Et
Cosmochimica Acta 64 (14):2431-2438.
Taghizadeh, S. M., and G. Davari. 2006. Preparation, characterization, and swelling
behavior of N-acetylated and deacetylated chitosans. Carbohydrate Polymers 64
(1):9-15.
Takeda, T., K. Saito, K. Uezu, S. Furusaki, T. Sugo, and J. Okamoto. 1991. Adsorption
and elution in hollow-fiber-packed bed for recovery of uranium from seawater.
Industrial & Engineering Chemistry Research 30 (1):185-190.
Tang, C. J., H. L. Zhang, C. Z. Sun, J. C. Li, L. Qi, Y. J. Quan, F. Gao, and L. Dong.
2011. An efficient strategy for highly loaded, well dispersed and thermally
stable metal oxide catalysts. Catalysis Communications 12 (12):1075-1078.
Taniguchi, N. 1974. On the basic concept of 'Nano-Technology'. Paper read at The
International Conference on Production Engineering, at Tokyo.
Tao, S. Y., G. T. Li, and J. X. Yin. 2007. Fluorescent nanofibrous membranes for trace
detection of TNT vapor. Journal of Materials Chemistry 17 (26):2730-2736.
Taylor, G. 1969. Electrically driven jets. Proceedings of the Royal Society A:
Mathematical, Physical and Engineering Sciences 313 (1515):453-475.
Taylor, G. . 1966. The force exerted by an electric field on a long cylindrical conductor.
Proceedings of the Royal Society A: Mathematical, Physical and Engineering
Sciences 291 (1425):145-158.
Theron, S. A., E. Zussman, and A. L. Yarin. 2004. Experimental investigation of the
governing parameters in the electrospinning of polymer solutions. Polymer 45
(6):2017-2030.
Tolaimate, A., J. Desbrieres, M. Rhazi, A. Alagui, M. Vincendon, and P. Vottero. 2000.
On the influence of deacetylation process on the physicochemical characteristics
of chitosan from squid chitin. Polymer 41 (7):2463-2469.
Tucker, N., J. J. Stanger, M. P. Staiger, H. Razzaq, and K. Hofman. 2012. The history
of the science and technology of electrospinning from 1600 to 1995. Journal of
Engineered Fibers and Fabrics:63-73.
Page 178
157
Twu, Y. K., H. I. Huang, S. Y. Chang, and S. L. Wang. 2003. Preparation and sorption
activity of chitosan/cellulose blend beads. Carbohydrate Polymers 54 (4):425-
430.
Uzum, C., T. Shahwan, A. E. Eroglu, K. R. Hallam, T. B. Scott, and I. Lieberwirth.
2009. Synthesis and characterization of kaolinite-supported zero-valent iron
nanoparticles and their application for the removal of aqueous Cu2+ and Co2+
ions. Applied Clay Science 43 (2):172-181.
Valcarcel, V., A. Souto, and F. Guitian. 1998. Development of single-crystal alpha-
Al2O3 fibers by vapor-liquid-solid deposition (VLS) from aluminum and
powdered silica. Advanced Materials 10 (2):138-+.
Valentin, R., K. Molvinger, F. Quignard, and D. Brunel. 2003. Supercritical CO2 dried
chitosan: an efficient intrinsic heterogeneous catalyst in fine chemistry. New
Journal of Chemistry 27 (12):1690-1692.
Varma, A. J., S. V. Deshpande, and J. F. Kennedy. 2004. Metal complexation by
chitosan and its derivatives: a review. Carbohydrate Polymers 55 (1):77-93.
Venugopal, J., and S. Ramakrishna. 2005. Applications of polymer nanofibers in
biomedicine and biotechnology. Applied Biochemistry and Biotechnology 125
(3):147-157.
Vieira, R. S., and M. M. Beppu. 2006a. Dynamic and static adsorption and desorption
of Hg(II) ions on chitosan membranes and spheres. Water Research 40 (8):1726-
1734.
Vieira, R. S., and M. M. Beppu. 2006b. Interaction of natural and crosslinked chitosan
membranes with Hg(II) ions. Colloids and Surfaces a-Physicochemical and
Engineering Aspects 279 (1-3):196-207.
Wagner, C.D., W.M. Riggs, L.E. Davis, J.F. Moulder, and G.E. Muilenberg. 1979.
Handbook of X-ray photoelectron spectroscopy, Physical Electronics Division.
Eden Prairie, Minnesota: Perkin-Elmer Corporation.
Wang, R., Y. Liu, B. Li, B. S. Hsiao, and B. Chu. 2012. Electrospun nanofibrous
membranes for high flux microfiltration. Journal of Membrane Science 392:167-
174.
Wang, W., H. M. Huang, Z. Y. Li, H. N. Zhang, Y. Wang, W. Zheng, and C. Wang.
2008. Zinc oxide nanofiber gas sensors via electrospinning. Journal of the
American Ceramic Society 91 (11):3817-3819.
Wang, W., Z. Y. Li, L. Liu, H. N. Zhang, W. Zheng, Y. Wang, H. M. Huang, Z. J.
Wang, and C. Wang. 2009. Humidity sensor based on LiCl-doped ZnO
electrospun nanofibers. Sensors and Actuators B-Chemical 141 (2):404-409.
Page 179
158
Wang, X. F., F. H. Cui, J. Y. Lin, B. Ding, J. Y. Yu, and S. S. Al-Deyab. 2012.
Functionalized nanoporous TiO2 fibers on quartz crystal microbalance platform
for formaldehyde sensor. Sensors and Actuators B-Chemical 171:658-665.
Wang, X. F., B. Ding, M. Sun, J. Y. Yu, and G. Sun. 2010. Nanofibrous
polyethyleneimine membranes as sensitive coatings for quartz crystal
microbalance-based formaldehyde sensors. Sensors and Actuators B-Chemical
144 (1):11-17.
Wang, X. F., B. Ding, J. Y. Yu, Y. Si, S. B. Yang, and G. Sun. 2011. Electro-netting:
Fabrication of two-dimensional nano-nets for highly sensitive trimethylamine
sensing. Nanoscale 3 (3):911-915.
Wang, X. H., J. Zhang, and Z. Q. Zhu. 2006. Ammonia sensing characteristics of ZnO
nanowires studied by quartz crystal microbalance. Applied Surface Science 252
(6):2404-2411.
Wang, X. Y., C. Drew, S. H. Lee, K. J. Senecal, J. Kumar, and L. A. Sarnuelson. 2002.
Electrospun nanofibrous membranes for highly sensitive optical sensors. Nano
Letters 2 (11):1273-1275.
Wang, Z. G., L. S. Wan, Z. M. Liu, X. J. Huang, and Z. K. Xu. 2009. Enzyme
immobilization on electrospun polymer nanofibers: An overview. Journal of
Molecular Catalysis B-Enzymatic 56 (4):189-195.
Wesselt, C., R. Ostermann, R. Dersch, and B. M. Smarsly. 2011. Formation of
inorganic nanofibers from preformed TiO2 nanoparticles via electrospinning.
Journal of Physical Chemistry C 115 (2):362-372.
WHO. 2004. Guidelines for drinking-water quality, Recommendations. Geneva: World
Health Organization.
Wickramasinghe, S. R., B. B. Han, J. Zimbron, Z. Shen, and M. N. Karim. 2004.
Arsenic removal by coagulation and filtration: comparison of groundwaters from
the United States and Bangladesh. Desalination 169 (3):231-244.
Wong, K. K., C. K. Lee, K. S. Low, and M. J. Haron. 2003. Removal of Cu and Pb by
tartaric acid modified rice husk from aqueous solutions. Chemosphere 50 (1):23-
28.
Wrasidlo, W. J. , and K. J. Mysels. 1984. The structure and some properties of graded
highly asymmetrical porous membranes. Journal of Parenteral Science and
Technology 38:24-31.
Wu, F. C., R. L. Tseng, and R. S. Juang. 2010. A review and experimental verification
of using chitosan and its derivatives as adsorbents for selected heavy metals.
Journal of Environmental Management 91 (4):798-806.
Page 180
159
Wu, H., D. Lin, R. Zhang, and W. Pan. 2008. ZnO nanofiber field-effect transistor
assembled by electrospinning. Journal of the American Ceramic Society 91
(2):656-659.
Wu, J. J., and S. C. Liu. 2002. Low-temperature growth of well-aligned ZnO nanorods
by chemical vapor deposition. Advanced Materials 14 (3):215-+.
Xia, H. J., Y. Wang, F. H. Kong, S. R. Wang, B. L. Zhu, X. Z. Guo, J. Zhang, Y. M.
Wang, and S. H. Wu. 2008. Au-doped WO3-based sensor for NO2 detection at
low operating temperature. Sensors and Actuators B-Chemical 134 (1):133-139.
Xiao, S. L., H. Ma, M. W. Shen, S. Y. Wang, Q. G. Huang, and X. Y. Shi. 2011.
Excellent copper(II) removal using zero-valent iron nanoparticle-immobilized
hybrid electrospun polymer nanofibrous mats. Colloids and Surfaces a-
Physicochemical and Engineering Aspects 381 (1-3):48-54.
Xiao, S. L., M. W. Shen, R. Guo, Q. G. Huang, S. Y. Wang, and X. Y. Shi. 2010.
Fabrication of multiwalled carbon nanotube-reinforced electrospun polymer
nanofibers containing zero-valent iron nanoparticles for environmental
applications. Journal of Materials Chemistry 20 (27):5700-5708.
Xiao, S. L., M. W. Shen, R. Guo, S. Y. Wang, and X. Y. Shi. 2009. Immobilization of
zerovalent iron nanoparticles into electrospun polymer nanofibers: Synthesis,
characterization, and potential environmental applications. Journal of Physical
Chemistry C 113 (42):18062-18068.
Xu, X. M., C. Z. Li, K. M. Pei, K. Zhao, Z. B. K. Zhao, and H. Y. Li. 2008. Ionic
liquids used as QCM coating materials for the detection of alcohols. Sensors and
Actuators B-Chemical 134 (1):258-265.
Yadav, B. C., R. Srivastava, C. D. Dwivedi, and P. Pramanik. 2008. Moisture sensor
based on ZnO nanomaterial synthesized through oxalate route. Sensors and
Actuators B-Chemical 131 (1):216-222.
Yadav, B. C., R. Srivastava, C. D. Dwivedi, and P. Pramanik. 2009. Synthesis of nano-
sized ZnO using drop wise method and its performance as moisture sensor.
Sensors and Actuators a-Physical 153 (2):137-141.
Yan, W. L., M. A. V. Ramos, B. E. Koel, and W. X. Zhang. 2010. Multi-tiered
distributions of arsenic in iron nanoparticles: Observation of dual redox
functionality enabled by a core-shell structure. Chemical Communications 46
(37):6995-6997.
Yan, W., R. Vasic, A. I. Frenkel, and B. E. Koel. 2012. Intraparticle reduction of
arsenite (As(III)) by nanoscale zerovalent iron (nZVI) investigated with in situ
X-ray absorption spectroscopy. Environmental Science & Technology 46
(13):7018-7026.
Yang, T., and R. R. Zall. 1984. Chitosan membranes for reverse-osmosis application.
Journal of Food Science 49 (1):91-93.
Page 181
160
Yang, X. H., C. L. Shao, H. Y. Guan, X. L. Li, and H. Gong. 2004. Preparation and
characterization of ZnO nanofibers by using electrospun PVA/zinc acetate
composite fiber as precursor. Inorganic Chemistry Communications 7 (2):176-
178.
Yarin, A. L., S. Koombhongse, and D. H. Reneker. 2001. Bending instability in
electrospinning of nanofibers. Journal of Applied Physics 89 (5):3018-3026.
Yarin, A. L., and E. Zussman. 2004a. Upward needleless electrospinning of multiple
nanofibers. Polymer 45 (9):2977-2980.
Yarin, A. L., and E. Zussman. 2004b. Complex and smart fluids. Paper read at XXI
International Congress of Theoretical and Applied Mechanics, at Warsaw,
Poland.
Yoo, S., S. A. Dregia, and S. A. Akbar. 2006. Kinetic mechanism of TiO2 nanocarving
via reaction with hydrogen gas. Journal of Materials Research 21 (7):1822-
1829.
Zeleny, J. 1917. Instability of electrified liquid surfaces. Physical Review Letters 10
(1):1-6.
Zeman, L. J., and Zydney A.L. 1996. "Microfiltration and ultrafiltration: Principles and
Applications." In. New York: Marcel Dekker, Inc.
Zhan, S. H., D. R. Chen, X. L. Jiao, and Y. Song. 2007. Mesoporous TiO2/SiO2
composite nanofibers with selective photocatalytic properties. Chemical
Communications (20):2043-2045.
Zhang, H. N., Z. Y. Li, W. Wang, C. Wang, and L. Liu. 2010. Na+-doped zinc oxide
nanofiber membrane for high speed humidity sensor. Journal of the American
Ceramic Society 93 (1):142-146.
Zhang, X. C., Y. Z. Chen, J. Yu, and Z. X. Guo. 2011. Thermoplastic
polyurethane/silica nanocomposite fibers by electrospinning. Journal of Polymer
Science Part B-Polymer Physics 49 (23):1683-1689.
Zhang, X. J., and G. J. Qiao. 2012. High performance ethanol sensing films fabricated
from ZnO and In2O3 nanofibers with a double-layer structure. Applied Surface
Science 258 (17):6643-6647.
Zhang, Y. S., K. Yu, D. S. Jiang, Z. Q. Zhu, H. R. Geng, and L. Q. Luo. 2005. Zinc
oxide nanorod and nanowire for humidity sensor. Applied Surface Science 242
(1-2):212-217.
Zhao, X. B., R. W. Long, Y. Chen, and Z. G. Chen. 2010. Synthesis, characterization of
CeO(2)@SiO(2) nanoparticles and their oxide CMP behavior. Microelectronic
Engineering 87 (9):1716-1720.
Page 182
161
Zhou, L. M., J. H. Liu, and Z. R. Liu. 2009. Adsorption of platinum(IV) and
palladium(II) from aqueous solution by thiourea-modified chitosan
microspheres. Journal of Hazardous Materials 172 (1):439-446.
Zhou, Y. S., D. Z. Yang, X. M. Chen, Q. Xu, F. M. Lu, and J. Nie. 2008. Electrospun
water-soluble carboxyethyl chitosan/poly(vinyl alcohol) nanofibrous membrane
as potential wound dressing for skin regeneration. Biomacromolecules 9
(1):349-354.
Zong, X. H., K. Kim, D. F. Fang, S. F. Ran, B. S. Hsiao, and B. Chu. 2002. Structure
and process relationship of electrospun bioabsorbable nanofiber membranes.
Polymer 43 (16):4403-4412.
Zou, W. H., H. J. Bai, L. Zhao, K. Li, and R. P. Han. 2011. Characterization and
properties of zeolite as adsorbent for removal of uranium(VI) from solution in
fixed bed column. Journal of Radioanalytical and Nuclear Chemistry 288
(3):779-788.
Zou, W. H., L. Zhao, and R. P. Han. 2009. Removal of uranium (VI) by fixed bed ion-
exchange column using natural zeolite coated with manganese oxide. Chinese
Journal of Chemical Engineering 17 (4):585-593.
Zou, W. H., L. Zhao, and R. P. Han. 2011. Adsorption characteristics of uranyl ions by
manganese oxide coated sand in batch mode. Journal of Radioanalytical and
Nuclear Chemistry 288 (1):239-249.
Page 183
VITA
PERSONAL INFORMATION
Surname, Name: HORZUM POLAT NESRİN
Nationality: Turkish (TC)
Date and Place of Birth: 17.01.1983, Ödemiş/İZMİR
Marital Status: Married
Phone: +90 (542) 761 67 75
E-mail: [email protected]
EDUCATION
Degree Institution Year of Graduation
MSc İzmir Institute of Technology 2008
BSc Pamukkale University 2004
WORK EXPERIENCE
Year Place Enrollment
2006-2013 İzmir Institute of Technology, Research Assistant
2011-2012 Max-Planck Institute for Polymer Research, Research Scholar 2003 İzmir Refik Saydam National Public Health Agency, Trainee
PUBLICATIONS
Horzum, N., Mari, M., Crespy, D., Wagner, M., Demir, M. M., Landfester, K., Muňoz-
Espí, R. 2013. In Progress.
Horzum. N., Tascioglu, D., Özbek, C., Okur, S. Demir, M. M. 2013 Submitted to
Sensors and Actuators B: Chemical.
Boyaci, E., Horzum, N., Cagir, A., Demir, M. M., Eroglu, A. E. 2013. Submitted to RSC
Advances.
Demir M. M., Horzum N., Ozen B., Ozcelik S. 2013. Accepted in The Journal of
Physical Chemistry B.
Horzum, N., Demir, M. M., Nairat, M., Shahwan, T. 2013. RSC Advances, 3, 7828-
7837.
Horzum, N., Shahwan, T., Parlak, O., Demir, M. M. 2012. Chemical Engineering
Journal, 213, 41-49.
Horzum, N., Muňoz-Espí, R., Glasser, G., Demir, M.M., Landfester, K., Crespy, D.
2012. ACS Applied Materials & Interfaces 4(11) 6338-6345.
Horzum, N., Tascioglu, D., Demir, M. M., Okur, S. 2011. Talanta 85(2) 1105-1111.
Horzum, N. Boyaci, E., Eroglu, A. E., Shahwan, T., Demir, M. M. 2010.
Biomacromolecules 11(12) 3301-3308.
Divrikli, U., Horzum, N., Soylak, M., Elci, Latif. 2006. Journal of Food Science and
Technology 41(6) 712-716.