36
September 2019 Volume 34 Number s9 www.spectroscopyonline.com APPLICATIONS OF ICP-OES & ICP-MS for Today’s Spectroscopists ® ®

September 2019 Volume 34 Number s9 www.spectroscopyonline.com
APPLICATIONS OF
ICP-OES & ICP-MSfor Today’s Spectroscopists
®®
Key benefi ts include:
&MFNFOUBM�"OBMZTJT�t�&OWJSPONFOUBM�t�'PPE���"HSJDVMUVSF�t�1IBSNBDFVUJDBM
Order consumables and accessories on-line at http://store.shimadzu.comShimadzu Scientific Instruments Inc., 7102 Riverwood Dr., Columbia, MD 21046, USA
Inductively Coupled Plasma Mass Spectrometer*$1.4�����Powered by its vast LC-MS/MS and GC-MS/MS experience, Shimadzu has
released the ICPMS-2030, offering an exceptional combination of ease of use,
high sensitivity, and low running costs. Simplify your ICP-MS analysis, and obtain
reliable trace-level results with confidence. Choose the ICPMS-2030.
X 'BTU �FBTZ�NFUIPE�EFWFMPQNFOU�BOE�BDRVJTJUJPO�PG�SFMJBCMF�SFTVMUT
X )JHI�TFOTJUJWJUZ�XJUI�OP�QPMZBUPNJD�JOUFSGFSFODFT
X -PXFTU�PQFSBUJPO�DPTUT�PG�BOZ�*$1�.4�PO�UIF�NBSLFU
Learn more about Shimadzu’s ICPMS-2030.Call (800) 477-1227 or visit us online atXXX�TTJ�TIJNBE[V�DPN�*$1.4
Accelerating
Reliable Performance

Numbers Don’t LieWith over a thousand units installed globally, Milestone’s Single Reaction
Chamber (SRC) technology has revolutionized how industrial and research
laboratories around the world prep samples for analysis.
Our ultraWAVE transcends traditional closed and open vessel digestion,
offering faster digestions, maximum throughput and lower cost of
ownership.
High-performance stainless steel construction allows for higher pressures
and temperatures and any combination of acids to be used, while
disposable vessels eliminate the need to assemble, disassemble or
clean between processing. Just as important, dissimilar samples can be
processed simultaneously, saving time and resources. The bottom line?
The Milestone ultraWAVE is the superior solution to handle all your sample
prep challenges.
See what the ultraWAVE can do for your lab.
Visit us at www.milestonesci.com/ultrawave to schedule an onsite demonstration.
Improved workflow
Maximum throughput
No batching required
Lower operating costs
reduction in
cycle time
the
throughput
lower
labor costs
powered by
milestonesci.com | 866.995.5100Microwave Digestion Extraction | Mercury | Ashing | Determination | Synthesis | Clean Chemistry
MILESTONE
ultraWAVE ultraCLAVEETHOS UP

®®®®
4 Applications of ICP-OES & ICP-MS for Today’s Spectroscopists September 2019
485F US Highway One South, Suite 210Iselin, NJ 08830(732) 596-0276
Fax: (732) 647-1235
Michael J. TessaloneGroup Vice President/[email protected]
Stephanie ShafferPublisher/[email protected]
Edward Fantuzzi Associate Publisher/[email protected]
Michael KushnerSenior Director, Digital Media/[email protected]
Laura Bush Editorial Director/[email protected]
John Chasse Managing Editor/[email protected]
Jerome Workman, Jr. Senior Technical Editor/[email protected]
Cindy Delonas Associate Editor/[email protected]
Allissa MarrapodiCustom Content Writer/[email protected]
Kristen MooreWebcast Operations Manager/[email protected]
Vania OliveiraProject Manager/[email protected]
Sabina AdvaniDigital Production Manager [email protected]
Kaylynn Chiarello-EbnerManaging Editor, Special Projects/ [email protected]
Dan Ward Art Director/[email protected]
Brianne Pangaro Marketing Associate/[email protected]
Melissa Stillwell C.A.S.T. Data and List Information/[email protected]
Alexa Rockenstein Permissions/[email protected]
Jesse Singer Production Manager/[email protected]
Kelly KemperAudience Development Manager/[email protected]
Janet (Koehne) RobertsAudience Support Analyst/[email protected]
CORPORATEMike Hennessy, Sr.
Chairman and CEO/[email protected]
Jack LeppingVice Chairman/[email protected]
Mike Hennessy, Jr.President/[email protected]
George GlatczChief Operations Officer/[email protected]
Neil Glasser, CPA/CFEChief Financial Officer/[email protected]
Dave EsolaVP of Sales, Pharm Science/[email protected]
MANUSCRIPTS: To discuss possible article topics or obtain manuscript preparation guidelines, contact the editorial director at: (732) 346-3020, e-mail: [email protected]. Publishers assume no responsibility for safety of artwork, photographs, or manuscripts. Every caution is taken to ensure accuracy, but publishers cannot accept responsibility for the information supplied herein or for any opinion expressed.
SUBSCRIPTIONS: For subscription information: Spectroscopy, P.O. Box 6196, Duluth, MN 55806-6196; (888) 527-7008, 7:00 a.m. to 6:00 p.m. CST. Outside the U.S., +1-218-740-6477. Delivery of Spectroscopy outside the U.S. is 3–14 days after printing. Single-copy price: U.S., $10.00 + $7.00 postage and handling ($17.00 total); Canada and Mexico, $12.00 + $7.00 postage and handling ($19.00 total); Other international, $15.00 + $7.00 postage and handling ($22.00 total).
CHANGE OF ADDRESS: Send change of address to Spectroscopy, P.O. Box 6196, Duluth, MN 55806-6196; provide old mailing label as well as new address; include ZIP or postal code. Allow 4–6 weeks for change. Alternately, go to the following URL for address changes or subscription renewal: http://ubmsubs.ubm.com/?pubid=SPEC
RETURN ALL UNDELIVERABLE CANADIAN ADDRESSES TO: IMEX Global Solutions, P.O. Box 25542, London, ON N6C 6B2, CANADA. PUBLICATIONS MAIL AGREEMENT No.40612608.
REPRINT SERVICES: Reprints of all articles in this issue and past issues are available (500 minimum). Licensing and Reuse of Content: Contact our official partner, Wright’s Media, about available usages, license fees, and award seal artwork at [email protected] for more information. Please note that Wright’s Media is the only authorized company that we’ve partnered with for MultiMedia Healthcare materials.
C.A.S.T. DATA AND LIST INFORMATION: Contact Melissa Stillwell, (218) 740-6831; e-mail: [email protected]
INTERNATIONAL LICENSING: Alexa Rockenstein, e-mail: [email protected]
© 2019 MultiMedia Healthcare LLC. All rights reserved. No part of this publication may be reproduced or transmitted in any form or by any means, electronic or mechanical including by photocopy, recording, or information storage and retrieval without permission in writing from the publisher. Authorization to photocopy items for internal/educational or personal use, or the internal/educational or personal use of specific clients is granted by MultiMedia Healthcare LLC for libraries and other users registered with the Copyright Clearance Center, 222 Rosewood Dr. Danvers, MA 01923, 978-750-8400 fax 978-646-8700 or visit http://www.copyright.com online. For uses beyond those listed above, please direct your written request to Permission Dept. or email: [email protected].
MultiMedia Healthcare LLC provides certain customer con-tact data (such as customers’ names, addresses, phone numbers, and e-mail addresses) to third parties who wish to promote rel-evant products, services, and other opportunities that may be of interest to you. If you do not want MultiMedia Healthcare LLC to make your contact information available to third parties for marketing purposes, simply call toll-free 866-529-2922 be-tween the hours of 7:30 a.m. and 5 p.m. CST and a customer service representative will assist you in removing your name from MultiMedia Healthcare LLC lists. Outside the U.S., please phone 218-740-6477.
Spectroscopy does not verify any claims or other information appearing in any of the advertisements contained in the pub-lication, and cannot take responsibility for any losses or other damages incurred by readers in reliance of such content.
Spectroscopy welcomes unsolicited articles, manuscripts, photographs, illustrations and other materials but cannot be held responsible for their safekeeping or return.
To subscribe, call toll-free 888-527-7008. Outside the U.S. call 218-740-6477.

Engineered for Excellence
PlasmaQuant
PlasmaQuant MS I PlasmaQuant PQ 9000 Leading in ICP-MS and ICP-OES technology.
For more information, contact us:
PlasmaQuant®
Engineered for Excellence

®September 2019 Volume 34 Number s9 www.spectroscopyonline.com
APPLICATIONS OF
ICP-OES & ICP-MSfor Today’s Spectroscopists
®®®®®®®®®®®®®®®®®®®®®®®®®®®®®®®®®
6 Applications of ICP-OES & ICP-MS for Today’s Spectroscopists September 2019
Articles
8 Arsenic Speciation in Krill and Other Marine Oils by Liquid Chromatography−Inductively Coupled Plasma-Mass SpectrometryKatarzyna Banaszewski, Anna Plocicka-Okladlo, and Aaron Secrist
An arsenic speciation method using LA–ICP-MS was developed to provide a more accurate procedure for the determination of arsenic species in marine oils. It was validated for the analysis of five arsenic species in krill oil, and should also prove useful when quantitating inorganic arsenic species in other marine oils.
20 Method Development with ICP-MS/MS: Tools and Techniques to Ensure Accurate Results in Reaction ModeEd McCurdy, Glenn Woods, and Naoki Sugiyama
Method setup and optimization steps are explored to illustrate how an ICP-MS/MS method can be defined and tested to ensure consistent performance. Users can benefit from improved interference removal performance without the complex method development inherent in the use of ion-molecule reaction chemistry.
28 Development of an Analytical Method to Determine Chromium, Iron, Nickel, and Zinc in Mouthwash by ICP-OES and Assessment of Possible Metal Migration from Stainless Steel P.M.F. Camargo Filho, J.F.S. Joca, and I. Gaubeur
A simple analytical method, requiring no sample pretreatment, was developed for determination of chromium, iron, nickel, and zinc in mouthwash by inductively coupled plasma‒optical emission spectrometry (ICP-OES). This method allowed the study of potential migration by iron, chromium, and nickel from stainless steel containers.
Cover image courtesy of lisa_16/Adobe Stock; Maryia/Adobe Stock; LanaPo/Adobe Stock.
a��������� icp-oes & icp-ms � t���’� s����������s������� 2019 "�#�� 34 �#���� �9

Osmium presents wicked problems because it can be dangerous
and even deadly. It has a volatile personality, can change
shapes, and even disappear and reappear during testing.
It’s easy to understand how even an experienced chemist can
feel cowardly when working with Osmium.
For more information download our free white paper at
inorganicventures.com/osmium.
300 TECHNOLOGY DR. | CHRISTIANSBURG, VA 24073 USA | 800.669.6799
inorganicventures.com

8 Applications of ICP-OES & ICP-MS for Today’s Spectroscopists September 2019
K ri l l (Euphausia superba) is a sma l l c r u s t a c e a n c om-monly found in ocean waters
around the world. It mainly serves as a food source for other aquatic creatures such as f ish, penguins,
and whales (1). In recent years, kril l has gained more popularity in the natural product industry, and the krill oil became a promis-ing dietary supplement, due to its high content of eicosapentaenoic
Arsenic Speciation in Krill and Other Marine Oils by Liquid Chromatography−Inductively Coupled Plasma-Mass Spectrometry
The content of total and inorganic arsenic was determined in krill oil, and the newly developed speciation method was carried out through a single laboratory validation. Krill oil samples were prepared by microwave digestion with the use of diluted nitric acid and hydrogen peroxide. Chromatographic separation of five arsenic species—arseno-betaine (AsB), dimethylarsinic acid (DMA), arsenite (AsIII), mono-methylarsonic acid (MMA), and arsenate (AsV)—was achieved by high performance liquid chromatography (HPLC) using an anion exchange column and strongly basic carbonate eluent. Detection of the arsenic species was performed by inductively coupled plasma‒mass spectrom-etry (ICP-MS). Signal drift was corrected by post column addition of an internal standard. Method performance was evaluated using percent mass balance of speciated arsenic versus total arsenic, and recovery of a fortified analytical portion (FAP). The average percent mass balance from replicate preparations of krill oil samples was 95%, and the recov-ery of FAP of all five species met the acceptance criteria of 95–105%. This procedure should prove useful when quantitating inorganic arsenic species in marine oils.
Katarzyna Banaszewski, Anna Plocicka-Okladlo, and Aaron Secrist

www.savillex.comLearn More at
Acid Productionfully automated high purity
DST-4000 Acid Purification System
High Purity, High Throughput Convert trace metal grade acid into high purity acid
Purifies up to 4 L of HNO3, HCl or HF per run
Produces 1 L of 10 ppt grade acid in 12 hours
Simple Operation with Cost SavingsAdd acid, hit start and walk away
Pays for itself in months, or even weeks
Operates Unattended Safe to operate unattended and overnight
Acid level sensor switches power off when the run is completed
10 Applications of ICP-OES & ICP-MS for Today’s Spectroscopists September 2019
acid (EPA), docosahexaenoic acid (DHA), and other health promot-ing compounds, such as astaxan-thin (2). Although similar to fish oil, the omega-3 fatty acids in krill oil are structurally different. The omega-3 fatty acids in fish oil are t r ig lycer ide bound, whereas in kri l l oi l they are in the form of phospholipids, which can impact the way they are being absorbed by the body. (3) Although supported by limited research, the potential
krill oil health benefits include im-provement of heart health, reduc-tion of inf lammation and arthritic pain, decreased incidences of obe-sity, and cancer prevention, as well as treatment for diabetes (4–6).
A lt houg h k r i l l oi l i s r ich i n hea lth promoting biomolecules, marine organisms tend to accumu-late elements such as arsenic from the water. Arsenic is a ubiquitous element present in the environ-ment, and its toxicity depends not
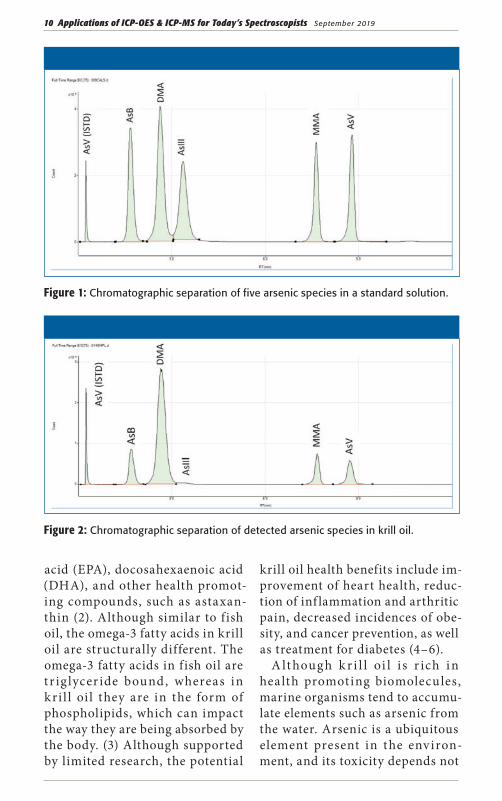
Figure 1: Chromatographic separation of five arsenic species in a standard solution.
Figure 2: Chromatographic separation of detected arsenic species in krill oil.

September 2019 Applications of ICP-OES & ICP-MS for Today’s Spectroscopists 11
only on total concentration, but more important ly on the chemi-ca l form of the element. In gen-eral, the inorganic arsenic species (AsIII and AsV) are considered to be the most toxic, whereas other organically bound species are con-sidered to have lower or no toxicity in humans (7,8). There are many organic forms of arsenic, includ-ing methylarsonic acid (MMA) and dimethylarsinic acid (DMA), and the more complex arsenobeta-ine (AsB). Even though methylated arsenic species have been known to be less toxic than the inorganic species, to conduct a proper risk assessment a l l a rsenic species present in the evaluated material should be ident i f ied. Although extensive literature has been pub-lished on the topic (9–11), arsenic speciation remains a challenging task, and requires thorough under-
standing of the species present in the analyzed matrix (12).
In recent years, the global de-mand for krill oil has been on the rise. The increasing popularity of this dietary ingredient has led to increased scrutiny by standard- set t ing bodies and government regulations around the world. In December 2017, the Food Chemi-cals Codex (FCC), a collection of international ly recognized stan-dards for the purity and identity of food ingredients , released a monographed standard for kri l l oil. The aim of the monograph was to help promote quality kri l l oi l identif ication and purity testing to strengthen the position of krill in the marketplace (13). Included in the requirements for krill oil are standards for EPA, DHA, phos-pholipids, and astaxanthin. The monograph also included a limit
Figure 3: Reproducibility data of arsenic species determined in replicate preparations of krill oil.

12 Applications of ICP-OES & ICP-MS for Today’s Spectroscopists September 2019
for inorganic arsenic at NMT 0.1 mg/kg (14). The method defined in the monograph, which is not able
to accurately differentiate between the chemica l species of arsenic, cannot be compared with higher
Table I: Instrument operating conditions
ICP-MS Operating Parameters for Arsenic Speciation
ICP-MS Operating Pa-rameters for Total Arsenic
HPLC Operating Parameters for Arsenic Speciation
RF power 1550 W 1550 W
Column
Agilent anion exchange speciation
column (4.6 mm x 150 mm)
Plasma gas fl ow
15 L/min 15 L/min
Makeup gas fl ow
0.1 L/min ~0.2 L/minGuard
columnHamilton PRP-X100
Nebulizer (carrier) gas fl ow
1.08 L/min 0.7–0.9 L/minMobile phase
A: 2.5 mM ammonium carbonate:0.2 mM EDTA:1% ethanol,
pH 11.0B: 100 mM ammonium
carbonate:0.2 mM EDTA:1% ethanol,
pH 11.0
Nebulyzer type
Glass concentric
Glass concentric
Mobile phase fl ow
rate1.0 mL/min
Peristaltic pump speed
0.3 rps 0.1 rpsInjection volume
100 μL
Spray chamber temp.
2 °C 2 °CColumn
temperatureAmbient
Collision cell HEHe @
10.0 mL/min
He @ ~4.3 mL/min
Acquisition time
12 min
Data acquisition mode
Time-resolved, m/z 75 for 75As+, and m/z 35 for
35Cl+
Spectrum Gradient
Dwell time0.8 s (m/z 75), 0.2 s (m/z 35)
0.51 s (m/z 75), 0.21 s (m/z 89)
Post Run 1 min
Replicates per ion
1 3Switching
valve time table
Energy dis-criminator
7.0 volts 5.0 volts
Time (min)
Mobile Phase A
Mobile Phase B
0 100% 0%
4 100% 0%
10 0% 100%
12 100% 0%
Time (min)
Column Position
0 1
0.2 2
0.7 1

September 2019 Applications of ICP-OES & ICP-MS for Today’s Spectroscopists 13
sensitivity and specif icity specia-tion methods, such as HPLC−ICP-MS. Additionally, the complexity of the k ri l l oi l matr ix requires suitable sample preparation able to l iberate arsenic species , and al low for precise quantitation of inorganic arsenic. The aim of this study was to develop and validate a method for arsenic speciation and determination of inorganic arse-nic in krill oil samples, and thus contribute to a more accurate risk assessment analysis regarding con-sumption of krill oil supplements.
ExperimentalSamplesSamples of krill oil dietary supple-ments were purchased and found to be representative of the various
kri l l oi l suppliers present in the marketplace today.
Reagents All reagents and solut ions were prepared using u ltrapure water purchased from EMD Millipore. Trace meta l grade hydrochloric acid (HCl), nitric acid (HNO3) and hydrogen peroxide (H2O2, 30%) were sourced from VWR Chemi-cals BDH. Ammonium carbonate (CH8N2O3) was sourced from Alfa Aesar. Sodium hydroxide (50% in water), 200 proof ethanol, ethyl-enediaminetetraacetic acid diso-dium salt dehydrate (EDTA), and Triton X-100 were purchased from MilliporeSigma. Ultrahigh purity argon and helium were supplied by Airgas.
Table II: Method detection and quantitation limits
SpeciesRetention Time (min)
Sensitivity (Peak Area/
ppb)
ASDL (ng/g)
ASQL (ng/g)
Method LOD
(ng/g)
Method LOQ
(ng/g)
AsB 1.69 ± 0.2 58237 0.08 0.5 16 100
DMA 2.63 ± 0.2 67785 0.08 0.5 16 100
AsIII 3.36 ± 0.2 49392 0.08 0.5 16 100
MMA 7.63 ± 0.3 59377 0.08 0.5 16 100
AsV 8.79 ± 0.4 101064 0.08 0.5 16 100
Table III: Summary of the precision data from the analysis of krill oil samples
SampleAsB
(ng/g)DMA (ng/g)
AsIII (ng/g)
MMA (ng/g)
AsV (ng/g)
iAs (AsIII+AsV)
(ng/g)
Total As
% Mass Balance
Krill Oil 1 927.7 2977.6 0 359.9 667.0 667.0 5145.0 96
Krill Oil 2 915.9 2894.8 0 314.5 710.0 710.0 5145.0 94
Krill Oil 3 866.3 2941.5 0 330.3 649.4 649.4 5145.0 94
Average 903.3 2938.0 0 334.9 675.5 675.5 5145 94.7
Stdev 32.6 41.5 NA 23.1 31.2 31.2 NA NA
%RSD 3.6 1.4 NA 6.9 4.6 4.6 NA NA

14 Applications of ICP-OES & ICP-MS for Today’s Spectroscopists September 2019
Determination ofTotal Arsenic by ICP-MSThe content of total arsenic in the krill oil was determined by ICP-MS. Brief ly, samples of approximately 250 mg of homogenized krill oil were digested with 5 mL of HNO3 and 0.5 mL of HCl in PTFE high pressure vessels using a microwave (Mars 6, CEM Corporation). After completion of the cycle, samples were cooled to room temperature, transferred into DigiTubes (SCP Science), and diluted to 50 mL with ultrapure water. Fol-lowing additional 5x dilution with 2% HNO3:0.5%HCl:0.01% Triton X-100, the total arsenic content in krill oil was determined using an Agilent 7700 ICP-MS instrument (Agilent Technol-ogies). The instrument conditions are outlined in Table I. For total arsenic determination, a multielemental stan-dard was used (SPEX Certiprep), and prepared in 2% HNO3:0.5%HCl:0.01% Triton X-100 solution at concentra-tions ranging from 0 to 200 ng/g.
Determination of Inorganic Arsenic by HPLC-ICP-MSFor the determination of inorganic ar-senic, approximately 250 mg of sam-ple was weighed directly into a PTFE digestion vessel. Using a calibrated volumetric spigot, 5 mL of 0.28M HNO3 was added to each sample, fol-lowed by 2.5 mL of hydrogen peroxide. Samples were digested using a pro-gressive microwave program (Mars 6, CEM Corporation). The progressive power ramp from 290–1800 W was executed over 25 min, after which the samples were held for additional 25 min while heated at 210 oC. The use of microwave and hydrogen per-oxide in preparation of krill oil sam-
ple resulted in a cleaner digestate and more efficient extraction of arsenic from the matrix. Additionally, the quantitative oxidation of AsIII to AsV allowed the determination of total inorganic arsenic as a sum of AsIII and AsV. It has been previously verified that no conversion of organic species to inorganic arsenic occurs (15). Prior to analysis, the samples were transferred into a single use calibrated polypropylene DigiTubes (SCP Science), and diluted to 50 mL with 2.5 mM ammonium carbon-ate:0.2 mM EDTA:1% ethanol pH 11.0. Samples were filtered through PTFE syringe filters into polypropyl-ene HPLC vials, capped, and submit-ted for HPLC-ICP-MS analysis.
Five standards were used for the speciation analysis: arsenite (AsIII) and arsenate (AsV) (1000 mg/L, Spex Certiprep), dimethylarsinic acid (DMA) (Alfa Aesar), monomethyl-arsonic acid (MMA) (ChemService, Inc.), and arsenobetaine (AsB) (Hon-eywell Fluka Chemicals) (Figure 1).
All stock solutions were prepared at 1000 μg/g, and their concentra-tions were based on elemental arse-nic, rather than the molecular weight of the arseno compounds. All arse-nic stock standards, except for As III and As V, which are traceable to NIST SRM, needed to be analyzed for total arsenic content to confirm the stock concentration. An intermedi-ate solution was prepared at 200 ng/g, and used in preparation of working standards at concentrations ranging from 0.25–20 ng/g. Working arsenic standards were prepared in a solution of 2.5 mM ammonium carbonate:0.2 mM EDTA:1% ethanol pH 11.0. The analysis was performed using an

September 2019 Applications of ICP-OES & ICP-MS for Today’s Spectroscopists 15
Agilent 1260 HPLC system (Agilent Technologies), consisting of a qua-ternary pump, autosampler, and a column compartment equipped with a six port switching valve. The chromatographic separation was achieved on an Agilent anion ex-change speciation column (Agilent Technologies) (Figure 2).
An isocratic pump (Agilent Tech-nologies) was used as an auxiliary pump for the introduction of an in-ternal standard during the analysis. The internal standard (50 ng/g AsV in mobile phase A) was delivered to the switching valve using the isocratic pump post column through pro-grammed column switching, using a 50 μL injection loop, which allows for signal drift monitoring and peak response correction. The speciated ar-senic was determined with the use of Agilent 7700 ICP-MS (Agilent Tech-nologies). The ICP-MS and HPLC conditions are shown in Table I.
Results and DiscussionMethod Validation and Quality Control The method was carried out through a single laboratory validation according to the ICH Analytical Method Valida-tion Guidelines (16), following criteria for arsenic speciation described in El-emental Analysis Manual (EAM) 4.11 (17). Evaluated parameters included linearity, repeatability, intermediate precision, specificity, system suitabil-ity, limit of detection (LOD), and limit of quantitation (LOQ). In addition, the accuracy of a fortified analytical portion (FAP) was determined. As a part of quality control procedures, the percent mass balance was calculated between the sum of all arsenic species
detected and the total arsenic deter-mined in each sample.
An analytical solution detection limit (ASDL) and analytical solution quantitation limit (ASQL) was estab-lished for each analyzed arsenic spe-cies following the FDA’s EAM, section 3.2 (18), and were based on standard deviation of replicate analyses of a low level mixed standard. The method limit of detection (LOD) and limit of quantitation (LOQ) were calculated using the ASDL and ASQL multiplied by the dilution factor. A summary of the method’s detection and quantita-tion limits are summarized in Table II.
Calibration curves consisting of five points were established for all analyzed arsenic species, and were linear over the entire concentration range with R2 > 0.999. Precision of replicate preparations of the krill oil sample (n = 3) was performed. The RSD limit for detected arsenic spe-cies in replicate preparations was set at <10%. The results from replicate preparations of the krill oil sample are summarized in Table III.
Intermediate precision data was obtained to demonstrate the meth-od’s performance over time. The RSD limit of all replicates (n = 6) was set at <15%, and met the criteria. Repro-ducibility data of arsenic species de-termined in replicate preparations of krill oil is shown in Figure 3.
The fortification (spike) recovery and precision was established for each of the arsenic species deter-mined in the krill oil (n = 3). The sample was spiked with a mixed standard at 50% of the concentra-tion determined for each arsenic species. The determination of FAP recoveries was performed through

16 Applications of ICP-OES & ICP-MS for Today’s Spectroscopists September 2019
standard addition, and the mean recoveries of spiked arsenic was within 94–105% for AsB, DMA, and MMA. Inorganic arsenic was deter-mined as a sum of AsIII and AsV, and the recovery for total iAs was within 98–102%.
Mass balance was calculated be-tween the sum of all arsenic spe-cies detected and the total arsenic determined in the krill oil sample. The percent mass balance was de-termined for each sample analyzed, and serves as a quality control mea-sure to ensure that most of the arse-nic is accounted for in the speciation analysis.
Due to lack of a certified refer-ence material (CRM) for arsenic speciation in matrix similar to krill oil, trueness of the method perfor-mance could not be verified.
A large body of published litera-ture reports arsenobetaine as the predominant organic arsenic form present in marine organisms (19–21); nonetheless, the most abundant arse-nic species identified in krill oil sam-ples appeared to be DMA. It was ob-served previously that the microwave digestion of samples in the presence of H2O2 oxidizes AsIII to the more stable AsV; however, a conversion of AsB to DMA has not been reported. To determine the native arsenic spe-cies present in krill oil, an alternate sample preparation was adapted to preserve the arsenic species.
Krill oil samples were prepared as described in EAM 4.11, and digested without the use of hydrogen perox-ide in a heating block. Although the recovery of arsenic from the krill oil sample following another prepara-tion was poor, the chromatographic
separation of arsenic species con-firmed the predominance of AsB. The mechanism of conversion of AsB to DMA under oxidative conditions is not clear; nevertheless, arsenobeta-ine degradation by microorganisms has been previously described by Ha-noka and associates (1989) (22). Al-though the AsB to DMA conversion does not affect the iAs result or the determination of percent mass bal-ance, it is worth mentioning that it changes the expected arsenic profile in material of marine origin.
ConclusionAn arsenic speciation method was developed and validated to provide a more accurate procedure for the determination of arsenic species in marine oils. The results obtained from this study demonstrated the method’s applicability for determi-nation of arsenic species in krill oil; however, it should be noted that the level of iAs detected in the analyzed krill oil exceeded the limit set by the FCC. The specificity of our method allows for more accurate iAs deter-mination in such matrices compared to other published methods, and highlights the importance of using methods fit for purpose when estab-lishing regulatory limits.
References(1) J.M. Kwantes and O. Grundmann, J.
Diet. Suppl.12(1), 23–35 (2015). doi:
10.3109/19390211.2014.902000
(2) J.C. Tou, J. Jaczynski, and Y.C. Chen,
Nutr. Rev., 65(2), 63–77 (2007). doi.
org/10.1111/j.1753-4887.2007.tb00283.x
(3) S. Ulven and K.B. Holven, Vasc. Health
Risk Manag. 11, 511–524 (2015).
doi:10.2147/VHRM.S85165

September 2019 Applications of ICP-OES & ICP-MS for Today’s Spectroscopists 17
(4) K. Yurko-Maur, J. Kralovec, E. Bailey-Hall, V.
Smeberg, J. G. Star, and N. Salem, Lipids
Health Dis. 14, 99 (2015).
(5) N.F. Vigerust, B. Bjørndal, P. Bohov, and
T. Brattelid, TNF-α. Eur J Nutr 52, 1315
(2013).
(6) L. Deutsch, J. Am. Coll. Nutr. 26(1), 39–48
(2007). doi:10.1080/07315724.2007.10
719584
(7) K. Cheyns, H. Demaegdt, N. Waegeneers,
A. Ruttens, “Arsenic Speciation Analysis
Elucidates the Risk Assesment of Food
Supplements with Ingredients of Marine
Origin.” 9th Nordic Conference on Plasma
Spectrochemistry, Sciensano (2017)
(8) V. Sele, J.J. Sloth, A.K. Lundebye, E.H.
Larsen, M.H.G. Berntssen, and H. Amlund,
Food Chem. 133, 618–630 (2012).
(9) J.J. Sloth, Abstract for the presentation at
the EU-RL-ISS Workshop, October 7-8,
2013.
(10) A.A. Ammann, Am. J. Anal. Chem. 2,
27–45 (2011).
(11) Z. Gong, X. Lu, M. Ma, C. Watt, and X.C. Le,
Talanta 58, 77–96 (2002).
(12) National Research Council (US)
Subcommittee on Arsenic in Drinking
Water. Arsenic in Drinking Water (National
Academies Press, Washington, D.C.,
1999), pp. 27–82.
(13) S. Daniels, Supplier, (2013) https://
w w w.nut ra ing redient s -usa .com/
Article/2013/12/11/USP-monograph-
strengthens-kr ill -s-posit ion-in-the-
marketplace-Suppliers
(14) 2018 USPC-Kr i l l Oi l -FCC Forum,
December 2017
(15) E. H. Larsen, I. Rokkjaer, and T. Christensen,
in The Determination of Chemical
Elements in Food: Applications for Atomic
and Mass Spectrometry, S. Caroli, Ed.
(John Wiley & Sons, Hoboken, New Jersey,
2007), pp. 297–332.
(16) I n t e r na t i o na l C o n fe r e n c e o n
Harmonisation of Technical Requirements
for Registration of Pharmaceuticals for
Human Use, ICH Harmonised Tripartite
Guideline, Validation of Analytical
Procedures: Text and Methodology Q2
(R1), Incorporated in November 2005.
(17) K. M. Kubachka, N. V. Shockey, T. A. Hanley,
S. D. Conklin, and D. T. Heitkemper,
Arsenic Speciation in Rice and Rice
Products Using High Performance
Liquid Chromatography- Inductively
Coupled Plasma-Mass Spectrometric
Determination: FDA U.S. Food and Drug
Administration Elemental Analysis Manual
for Food and Related Products (Food
and Drug Administration, Silver Spring,
Maryland, 2012)
(18) W. C. Cunningham, W. R. Mindak, S.
G. Capar, Elemental Analysis Manual
(Section 3.2 Terminology) (Food and
Drug Administration, Silver Spring,
Maryland, 2014)
(19) R . V. Hedegaard and J. J . Sloth,
Biothechnol. Agron. Soc. Environ. 15(S1),
45–51 (2011)
(20) R.V. Hedegaard, I. Rokkjaer, and J.J. Sloth,
Anal. Bioanal. Chem. 405(13), 4429–
4435 (2013)
(21) P. Piras, R. Orletti, G. Chessa, C. Carloni, F.
Griffoni, P. Palombo, and F. Velieri, Ital. J.
Food Saf. 4(1), 4577 (2015)
(22) K. Hanoka, K. Kazuhiko Ueno, S. Tagawa,
and T. Kaise, Comp. Biochem. 94(2),
379–382 (1989).
Katarzyna Banaszewski, Anna Plocicka-Okladlo, and Aaron Secrist are with NOW Foods, in Bloomingdale, Illinois. Direct correspondence to: [email protected]
For more information on this topic, please visit our homepage at: www.spectroscopyonline.com

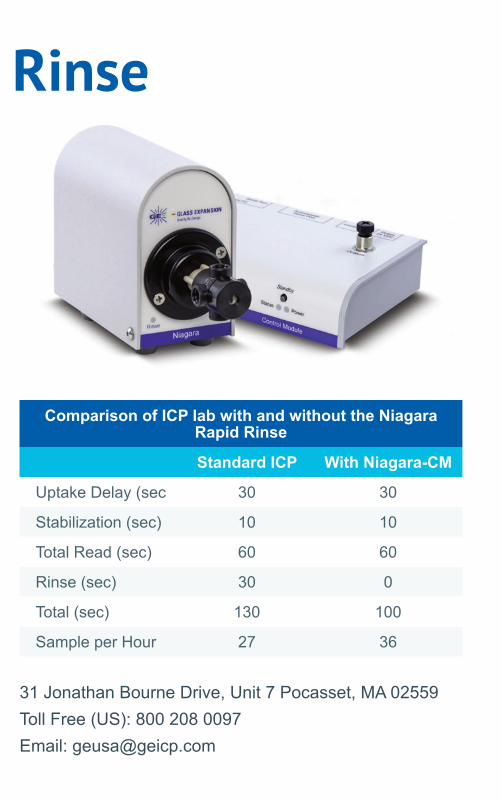
Niagara CM Rapid
Saves Time & MoneyThe Niagara CM Rapid Rinse is the simplest, lowest-
cost method of improving throughput on an existing
ICP-OES or ICP-MS system. Increased throughput is
achieved by rinsing the nebulizer and spray chamber
the instant the sample measurement is completed
and continuing to rinse until the next sample has
reached the nebulizer.
• Faster sample turn around (~ 30%)
• Reduced operating costs
• Inert sample path, minimum carryover
• Easily interfaces to most ICP and autosampler
models
• Faster washout
• Ability to handle complex samples
Rinse
Comparison of ICP lab with and without the Niagara Rapid Rinse
Standard ICP With Niagara-CM
Uptake Delay (sec 30 30
Stabilization (sec) 10 10
Total Read (sec) 60 60
Rinse (sec) 30 0
Total (sec) 130 100
Sample per Hour 27 36
31 Jonathan Bourne Drive, Unit 7 Pocasset, MA 02559
Toll Free (US): 800 208 0097
Email: [email protected]

20 Applications of ICP-OES & ICP-MS for Today’s Spectroscopists September 2019
S ingle-quadrupole inductively coupled plasma–mass spec-trometry (ICP-MS) provides
performance that meets the needs of most inorganic (metals) analy-sis laboratories, and exceeds the method requirements for many. The technique of fers a u nique combination of fast multielement analysis, good elemental coverage, very low detection limits, and the ability to measure major and trace elements in a single acquisit ion. The development of collision−re-action cel ls (CRCs) operating in helium collision mode addressed many of the polyatomic interfer-ences that previously hampered accurate analysis of several criti-
ca l trace elements (1). However, helium mode cannot resolve inter-ferences such as isobaric and dou-bly charged overlaps. Also, some combinations of analyte and inter-ference require more effective at-tenuation of the overlap than can be achieved using collision mode and kinetic energy discrimination (KED). For these cases, ion-mol-ecule reaction chemistry using a reactive cell gas may offer a better solution.
Reactive cell gas methods have been investigated since CRCs were first developed for single-quadru-pole ICP-MS in the late 1990s (2). Early work presented the benefits of reaction chemistry for histori-
Method Development with ICP-MS/MS: Tools and Techniques to Ensure Accurate Results in Reaction ModeSince the launch of the first commercial triple-quadrupole ICP-MS (ICP-MS/MS) instrument in 2012, the technique has become well established in both research and academic institutes, as well as in industrial and commercial laboratories. Users in routine applications wish to benefit from the improved interference removal performance of ICP-MS/MS, without facing the more complex method development inherent in the use of ion-molecule reaction chemistry. In this article, we follow method setup and optimization steps to illustrate how an ICP-MS/MS method can be defined and tested to ensure consistent performance.
Ed McCurdy, Glenn Woods, and Naoki Sugiyama
September 2019 Applications of ICP-OES & ICP-MS for Today’s Spectroscopists 21
cally problematic analytes that suf-fer intense spectral overlap (such as selenium, arsenic, iron, calcium, and so on). However, these early applications were often based on the theoretica l ef f iciency of the reaction chemistry to resolve one specific interference, and were il-lustrated using simple, consistent samples or sy nthet ic solut ions. Often, when these methods were applied to more complex and vari-able natural samples, it became ap-parent that the reaction processes
cou ld be adversely a f fec ted by other components in the sample (3,4). An unexpected matrix ele-ment or co-existing analyte could react with the cell gas, forming un-wanted overlaps on the analyte ion (or product ion). Consequently, a reaction gas method developed for one sample matrix or interference might give erroneous results for a different sample type or combina-tion of analytes.
The development of triple quad-rupole ICP-MS (ICP-MS/MS) in
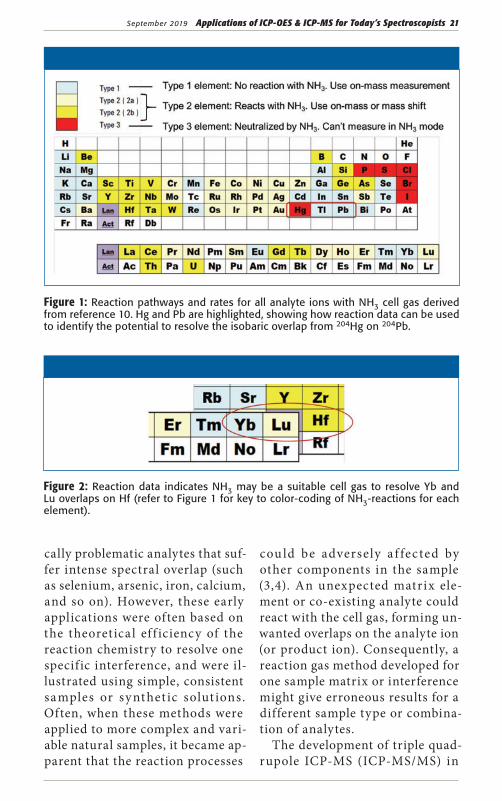
Figure 1: Reaction pathways and rates for all analyte ions with NH3 cell gas derived from reference 10. Hg and Pb are highlighted, showing how reaction data can be used to identify the potential to resolve the isobaric overlap from 204Hg on 204Pb.
Figure 2: Reaction data indicates NH3 may be a suitable cell gas to resolve Yb and Lu overlaps on Hf (refer to Figure 1 for key to color-coding of NH3-reactions for each element).

22 Applications of ICP-OES & ICP-MS for Today’s Spectroscopists September 2019
2012 offered a solution to the inac-curate results observed when using reactive cell gases on single quad-rupole instruments (5). ICP-MS/MS has an additional quadrupole mass filter (Q1) before the CRC, in a tandem mass spectrometer (MS/MS) conf iguration. When Q1 is operated as a true mass f i lter (1 u mass window), it controls the ions passed to the cel l, rejecting all nontarget masses. This means the reaction processes and product ions formed are predictable and consistent, and are unaffected by other analytes or matrix elements in the sample (6).
In addition to improving data qua l ity, the control of react ion chemistry provided by ICP-MS/MS means that method sett ings can be applied consistently, even for variable samples. This makes reaction mode method setup easier than on a single quadrupole in-strument or a configuration with a bandpass filter (mass window >1 u) before the cell. In this article, we illustrate the information and tools available for ICP-MS/MS to support development and perfor-mance testing of a new reaction mode method.
Reference Methods for Reactive Cell Gas Operation with ICP-MS/MSSince the f irst commercia l ICP-MS/MS instrument was released in 2012, many applications have been developed, optimized, and published. In addit ion to manu-facturers’ applicat ion notes (7), many hundreds of peer-reviewed journal articles detail method set-
tings for both typical and unusual applications.
The ICP-MS/MS instrument’s built-in methods can predefine the typical cell gas mode, analyte and product ion masses, and integra-tion times for common analytes. Where an analyte does not have an established setting predefined in a preset method, the user can eas-ily set up one or more mass pairs for the chosen reaction gas. The choice of reaction gas used to re-solve a specific interference can be informed by the literature. Theo-retical ion-molecule reaction ther-modynamics show which reactions are favored (8,9), while ICP-MS/MS manufacturer’s publications show experimental results for vari-ous product ion formation rates. Hydrogen (H2) oxygen (O2) and ammonia (NH3) are among the most widely-used reaction gases. For each gas, several common re-action transitions are def ined in the literature, and have been con-firmed experimentally (10).
With oxygen cell gas, for exam-ple, analytes may be measured on mass (Q2 is set to the same mass as Q1) or mass shifted as the oxide ion (Q2 is set to Q1 + 16 u) or di-oxide ion (Q2 is set to Q1 + 32 u). These mass shif t transit ions, to-gether with equivalent transitions for other reaction gases, are avail-able as preset values in the method setup software, al lowing easy se-lection of the preferred mass shift. Mult iple mass shi f ts can be se-lected if the user wants to compare results for several product ions or cell gases, and custom mass shifts can be defined, if appropriate.

September 2019 Applications of ICP-OES & ICP-MS for Today’s Spectroscopists 23
In the case of NH3 cell gas, reac-tions are usually fast and are often sequential, so multiple cluster ions can form from both the analy te ions and any other ions present in the cell. Typical reactions and product ions formed with NH3 cell gas are shown in Table I. MS/MS mode controls the precursor ions that can enter the cel l and react, so product ions can only form from ions at the mass of the target analyte ion. However, optimized methods must stil l be verif ied to confirm that the chosen reaction product ion is free from overlap by product ions from other sample components present at the same mass as the analyte precursor ion.
Product Ion ScanningProduct ion scanning, which is u n ique to MS/MS, i s a usef u l method development tool for un-familiar sample types and unusual combinations of analyte interfer-ences. This mode enables users to check and verify the best product ion(s) to use by identifying product ions that are free from overlap in a given sample type or matrix. This is particularly useful for complex and variable sample matrices, and for the large number of product
ions produced when a highly reac-tive cell gas such as NH3 is used.
In a product ion scan, Q1 is set to the mass of the target ana-ly te isotope, and Q2 is scanned across the mass range where use-ful product ions could appear. It is essential that Q1 is operated at 1 u resolution, so only ions at the target analyte isotope mass enter the cell. A product ion scan is ac-quired while aspirating a single-element standard of the target ana-lyte, allowing product ions formed from the analyte isotope alone to be identif ied. A second product ion scan is then acquired whi le aspirating the unknown sample or synthet ic matr i x to ident i f y product ions formed from other (nontarget) precursor ions at the target analy te mass. By compar-ing the spectra from the two scans, analyte product ions that are free from overlap by matrix product ions can easily be identif ied (11).
ExperimentalInstrumentation and ReagentsAn Agilent 8900 ICP-MS/MS in-strument (model #100, Advanced Applications conf iguration) was used for a l l measurements. The instrument was f it ted with the
Table I: Typical reactions of elemental cations with NH3 cell gas
Chemical Reactions of Cations (M+) with NH3 Cell Gas
Charge transfer* M+ + NH3 ¨ M + NH3+
RecombinationM+ + NH3 ¨ MNH+ + H2
or M+ + NH3 ¨ MNH2+ + H
Clustering M+ + NH3 ¨ MNH3+, M(NH3)2
+… M(NH3)n+
*Charge transfer is useful for removing an isobaric overlap on a target analyte ion. It is not used for analyte measurement because the elemental ion is neutralized
24 Applications of ICP-OES & ICP-MS for Today’s Spectroscopists September 2019
standard glass concentric nebu-lizer, quartz spray chamber, quartz torch with 2.5 mm injector, and s ta nda rd n ickel sa mpl i ng a nd skimmer cones. Samples were in-troduced via a perista lt ic pump with 1.02-mm i.d. pump tubing. Operating conditions are shown in Table II.
The hafnium standard was pre-pared from a single element stock solution, and the rare earth matrix was prepared from a mixed 14-el-ement stock sta ndard (Agi lent Technologies). Ultrapure water was prepared in the laborator y using a Mil li-Q Element system, and nitric and hydrochloric acids used for sample stabilization were U lt rapure NOR M ATOM g rade (VWR Chemicals).
Hf and mi xed rare ear t h ele-ments (REE) standards were pre-pared at 10 ppb and 1 ppm, re-spectively, in a final diluent of 2% HNO3 and 1% HCl. A spike solu-
tion of 10 ppb Hf in 1 ppm REE mix was also prepared.
Results and DiscussionChoosing Reaction Gas Modes to Resolve Known InterferencesTheoretical ion-molecule reaction rates can be used to identify potential approaches to resolve a given interfer-ence, based on differences in the reac-tions for the analyte and interfering ion. Figure 1 shows the reactions of all elemental ions with ammonia cell gas (10), displayed in a color-coded periodic table layout. To illustrate how this information can be used, the dif-ferent reactions of Hg+ and Pb+ with NH3 are highlighted in the table. Mer-cury (a Type 3 element) reacts with NH3 cell gas via a charge-transfer re-action leading to the neutralization of the Hg+ ion. In contrast, Pb (a Type 1 element) does not react with NH3, so it can be measured on mass. The dif-ference in reactions of Hg and Pb ions indicates that NH3 could be a suitable
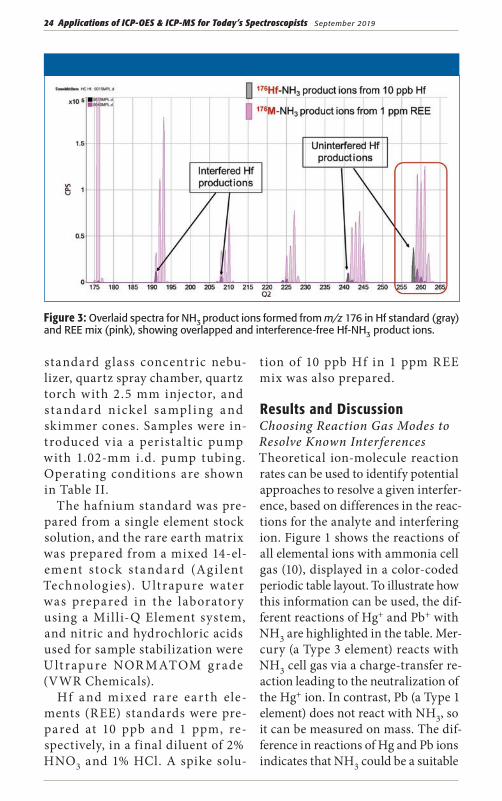
Figure 3: Overlaid spectra for NH3 product ions formed from m/z 176 in Hf standard (gray) and REE mix (pink), showing overlapped and interference-free Hf-NH3 product ions.

September 2019 Applications of ICP-OES & ICP-MS for Today’s Spectroscopists 25
cell gas to resolve the 204Hg overlap on 204Pb, allowing accurate analysis of 204Pb on mass at m/z 204.
In the case of hafnium analysis in a rare earth element matrix, the reaction data presented in Figure 1 suggests that NH3 cell gas might be able to resolve the Yb and Lu over-laps on Hf. The 178Hf isotope is the preferred isotope for quantitative analysis, but 176Hf is required for some applications such as Hf/Lu and Hf/Hf isotope geochronology. The 176Hf isotope could be consid-ered the worst case in terms of in-terferences in sample matrices that contain REEs. As wel l as direct isobaric interferences from 176Yb and 176Lu,176Hf is also overlapped by oxide ions of 160Gd and 160Dy. Figure 2 shows that Hf (a Type 2b
element) reacts with NH3 cell gas, whereas Yb (a Type 1 element) does not. Hafnium will therefore form Hf-NH3 product ions that cannot be overlapped by corresponding NH3 product ions formed from Yb.
The sa me pr inciple does not necessarily apply to resolving the 176Lu isobaric overlap on 176Hf. Lu is a Type 2a element, so it does react wit h NH3, and may form product ions that can overlap the Hf-NH3 product ions. Also, ion-molecule reaction data does not give specif ic information about the potential for a given cell gas to resolve polyatomic overlaps , such as the 160Gd16O and 160Dy16O interferences on 176Hf. The solu-tion to confirming the suitability of a given reaction gas to resolve
Table II: ICP-MS/MS operating conditions and acquisition parameters for 176Hf product ion scanning with NH3 cell gas
Parameter Instrument Conditions
Forward RF power (W) 1500
Nebulizer gas fl ow (L/min) 0.7
Makeup gas fl ow (L/min) 0.5
Sampling depth (mm) 8
Extraction lens 1 (V) -2
Extraction lens 2 (V) -200
Octopole bias (V) -4
KED (V) -8
Axial acceleration (V) 0.5
Cell gas mode NH3
Cell gas fl ow (mL/min)(MFC setting in brackets)
He: 1.0; NH3: 2.0 (20%);
Acquisition conditions
Q1 Mode MS/MS Bandpass
Q1 mass range (m/z) 176 175 to 177
Q2 Mass range (m/z) 175 ¨ 265

26 Applications of ICP-OES & ICP-MS for Today’s Spectroscopists September 2019
such interferences is to verify the per-formance experimentally by using a product ion scan.
Identifying Interference-free Hf-NH3 Product Ions in REE Matrix Using Product Ion Scanning For analytes, interferences, and sam-ple types that are not defined in preset methods or available from reference publications, product ion scanning can identify the best product ion(s) for the application. Product ion spectra were acquired for a 10 ppb Hf standard and a 1 ppm 14-element REE mix. An overlay of the two product ion spectra covering the mass range from m/z 175 to 265 is shown in Figure 3. The spec-
trum comparison facilitates identifica-tion of product ions formed from m/z 176 precursor ions in the Hf standard but not the REE mix. The most intense interference-free 176Hf product ion identified was 176HfN(NH3)4
+, which appears at m/z 258. This Hf product ion is free from any REE-based over-lap—that is, no overlapping NH3 prod-uct ions are formed from Lu and GdO/DyO precursor ions present at m/z 176.
In this example, the REE-based overlaps being investigated were known in advance, so a synthetic stan-dard solution could be prepared, en-suring the creation of the interfering REE-NH3 product ions. For complex sample matrices, which might give rise
Figure 4: Detail showing NH3 product ions in the mass range around the preferred 176Hf product ion at m/z 258. In (a) MS-MS mode, 176HfN(NH3)4 is free from any REE product ion overlap. (b) In simulated 3 u bandpass mode, 175Lu is not excluded from the cell, so 175LuNH(NH3)4 is formed, overlapping 176HfN(NH3)4 at m/z 258.

September 2019 Applications of ICP-OES & ICP-MS for Today’s Spectroscopists 27
to unknown product ions, the product ion scan can be performed for a real sample matrix. In this way, potential overlaps from all sample components can be checked and accounted for dur-ing method development.
Controlling Product IonFormation with MS/MSvs. Single Quadrupole or Bandpass Product ion scanning—and the MS/MS methods developed using it —rely on Q1 operating at unit mass resolution (1 u mass window). The necessity for this is illustrated in Figure 4, where normal Agilent 8900 MS/MS operation is compared to de-liberately “detuned” operation where Q1 has been set to pass a 3 u mass range. This simulates ICP-MS op-eration with a bandpass filter rather than a unit mass filter before the cell.
The top spectrum in Figure 4 shows the mass range from m/z 250 to 270 extracted from the full mass product ion spectra in MS/MS mode shown in Figure 3. This includes the preferred, interference-free 176Hf N(NH3)4
+ product ion at m/z 258. The lower spectrum shows the same mass range for the same product ion scans for the 10 ppb Hf and 1 ppm REE solutions, acquired with 3 u bandpass mode. With a bandpass filter before the cell, adjacent precursor ions are not rejected, so they enter the cell and react. In this example, with Q1 pass-ing a 3 u range of masses around the set mass, 175Lu can enter the cell when the precursor ion mass is set to m/z 176. 175Lu reacts with NH3 cell gas to form a product ion 175LuNH(NH3)4
+, which appears at m/z 258, overlapping the preferred 176HfH(NH3)4
+ product ion used for 176Hf analysis.
The example of interferences on Hf product ions in a REE matrix il-lustrates a general limitation of in-complete rejection of adjacent masses before the cell when using highly re-active cell gases. Any nontarget ions that enter the cell may react to form overlapping product ions, giving errors on the target analyte product ion mass.
ConclusionsTriple-quadrupole ICP-MS is often perceived as being more complicated and difficult to setup than single-quadrupole ICP-MS. However, the main benefit of the MS/MS tandem mass spectrometer configuration is the superior control it offers with reactive cell gas methods for interference re-moval. For these reaction gas methods, the ability of MS/MS to select the spe-cific mass that is passed to the cell pro-vides much greater control of the re-action chemistry. Rejecting nontarget, off-mass elements and isotopes using Q1 means these ions cannot enter the cell and affect the reaction processes. As a result, reaction gas methods on ICP-MS/MS are more consistent, more reliable, less matrix dependent, and therefore easier to setup than on single quadrupole ICP-MS.
References(1) E. McCurdy and G. Woods, J. Anal. At.
Spectrom. 19, 607–615 (2004).
(2) S.D. Tanner and V.I. Baranov, J. Am.
Soc. Mass Spectrom. 10, 1083–1094
(1999).
(3) L . J . Moens , F.F. Vanhaecke, D.R .
Bandura , V. I . Baranov, and S .D.
Tanner, J . Anal. At . Spectrom. 16 ,
991–994 (2001).
Continued on page 34

28 Applications of ICP-OES & ICP-MS for Today’s Spectroscopists September 2019
T he use of mouthwash for oral care is a common pract ice. E a se of u se , coupled w it h
their effectiveness in preventing and control ling common mouth diseases, generates great demand for these products (1).
Mouthwashes containing zinc salts (such as chloride, citrate, and lactate), mainly associated with other act ives such as chlorhexi-dine and cetylpyridinium chloride, have been shown to be effective in combating halitosis (2−4). In addi-
Development of an Analytical Method to Determine Chromium, Iron, Nickel, and Zinc in Mouthwash by ICP-OES and Assessment of Possible Metal Migration from Stainless Steel Mouthwash is a commonly used oral care product. Because of its compo-sition, it is considered a complex matrix for elemental analysis. This work describes a simple analytical method, requiring no sample pretreatment, for determination of chromium, iron, nickel, and zinc in mouthwash by inductively coupled plasma‒optical emission spectrometry (ICP-OES). To study the possible matrix effect on the calibration, a comparison was made between calibrations by matrix-matched and external standards. Excellent detection limits were obtained for chromium, iron, nickel, and zinc (16.0, 23.0, 5.0, and 7.0 μg/L, respectively). In all of the strategies that were used, the linear range of the calibration curve was 30.0 μg/L to 9.0 mg/L (a wide linear range) with a coefficient of determination (R2) > 0.9900. The pro-posed method was employed both in the determination of zinc, present as an ingredient in certain mouthwashes, and in the evaluation of possible migration by iron, chromium, and nickel from the stainless steel.
P.M.F. Camargo Filho, J.F.S. Joca, and I. Gaubeur

September 2019 Applications of ICP-OES & ICP-MS for Today’s Spectroscopists 29
tion, zinc has low toxicity and does not stain teeth (5).
Metal migration to mouthwashes is reported in the literature (6,7), focus-ing on the corrosion studies of orth-odontic appliances (also produced in stainless steel). Elemental analysis is
usually performed by graphite fur-nace atomic absorption spectrometry (GF-AAS) (6,7) or inductively coupled plasma mass spectrometry (ICP-MS) (8). In spite of the use of inductively coupled plasma-optical emission spectrometry (ICP-OES) (9) having
Cm
eta
l (m
g/L
)
Cm
eta
l (m
g/L
)
(a) (b)
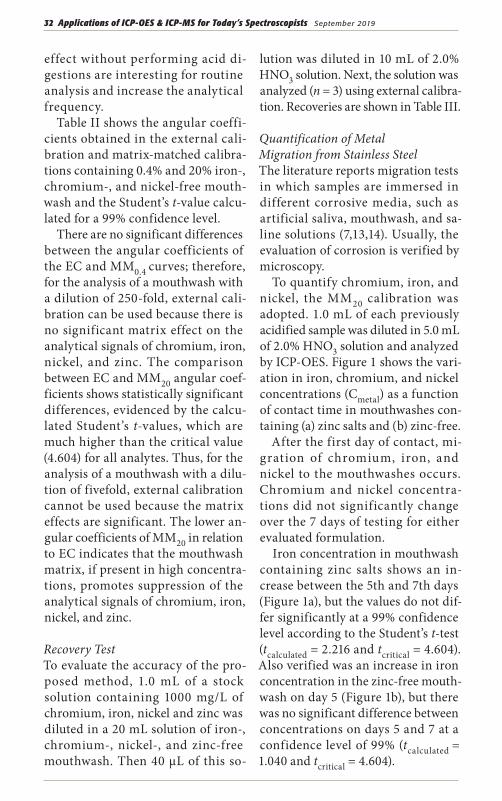
Figure 1: Fe, Cr, and Ni concentrations (Cmetal) as a function of contact time in mouthwash samples containing (a) zinc salts, and (b) zinc-free.
Table I: Instrument and method parameters
Experimental Parameter Value
RF generator power 1000 W
Plasma gas fl ow rate 15 L/min
Auxiliary gas fl ow rate 1.5 L/min
Nebulyzer type Concentric glass
Spray chamber Double pass cyclonic spray
Nebulizer gas fl ow 0.75 mL/min
Sample fl ow rate 0.5 mL/min
Sample uptake delay 10 s
Fast pump during the sample uptake Yes
Pump speed 5 rpm
Stabilization time 5 s
Replicates 3
Read time 5 s
Analytical lines
Cr (II) – 267.716 nm
Fe (II) – 238.204 nm
Ni (II) – 231.604 nm
Zn (I) – 213.857 nm
30 Applications of ICP-OES & ICP-MS for Today’s Spectroscopists September 2019
been demonstrated, there is a lack of studies that carefully evaluate the matrix effects of mouthwashes on the analytical signals in spectro-scopic techniques.
Here, we propose a simple ana-ly tical procedure based on dilu-tion or matrix-matched calibration, which allows the quantification of chromium, iron, nickel, and zinc in mouthwash without needing com-plex sample preparation or extrac-tion. The procedure is aimed at quan-tification of zinc in these products as an ingredient and at chromium, iron, and nickel after migration test from the stainless steel.
ExperimentalICP-OES System All measurements were performed using a Varian 710-ES ICP-OES instrument, in axial view. Instru-mental and operating parameters are shown in Table I.
Calibration StandardsCalibration standards were prepared at concentrations from 30.0 μg/L to 9.0 mg/L by diluting 1000 mg/L stock standards (SpecSol). After matrix ef-fect evaluation for zinc quantification in four commercial samples, the stan-dards were diluted in 2.0% HNO3 so-lution, produced with deionized water with resistivity ≥18.2 MΩ cm (obtained from a Millipore Milli-Q system), for dilution of 65% HNO3 obtained from Sigma Aldrich. Quantification of chro-mium, iron, and nickel in metal migra-tion studies was performed by “matrix-matched” calibration, and the standards were diluted in a solution containing 20% of a chromium-, iron-, nickel- and zinc-free mouthwash and 2.0% HNO3, prepared as described above.
Calibration Strategies and Matrix Effect EvaluationCalibration curves were constructed in three ways: 1) external calibra-
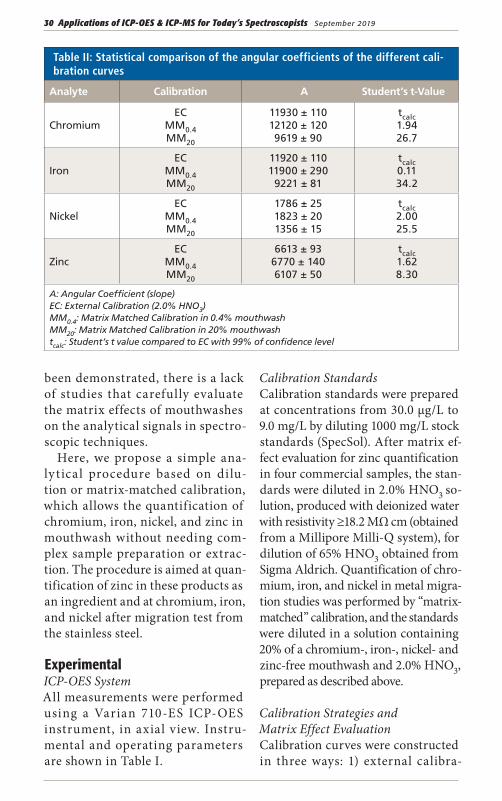
Table II: Statistical comparison of the angular coefficients of the different cali-bration curves
Analyte Calibration A Student’s t-Value
ChromiumEC
MM0.4
MM20
11930 ± 11012120 ± 1209619 ± 90
tcalc
1.9426.7
IronEC
MM0.4
MM20
11920 ± 11011900 ± 290
9221 ± 81
tcalc
0.1134.2
NickelEC
MM0.4
MM20
1786 ± 251823 ± 201356 ± 15
tcalc
2.0025.5
ZincEC
MM0.4
MM20
6613 ± 936770 ± 1406107 ± 50
tcalc
1.628.30
A: Angular Coeffi cient (slope)
EC: External Calibration (2.0% HNO3)
MM0.4
: Matrix Matched Calibration in 0.4% mouthwash
MM20
: Matrix Matched Calibration in 20% mouthwash
tcalc
: Student’s t value compared to EC with 99% of confi dence level
September 2019 Applications of ICP-OES & ICP-MS for Today’s Spectroscopists 31
tion (2.0% HNO3 media); 2) matrix-matched calibration in 20% chro-mium-, iron-, nickel- and zinc-free mouthwash (standards contain mouthwash diluted fivefold); and 3) matrix-matched calibration in 0.4% rinse chromium-, iron-, nickel-, and zinc-free mouthwash (standards con-tain mouthwash diluted 250-fold). Angular coefficients of the calibration curves (n = 3 for each curve) were sta-tistically compared by Student’s t-test, at a 99% confidence level, to detect significant differences in their angu-lar coefficients and the consequent matrix effect. The mouthwash used to prepare the standards was previ-ously diluted fivefold in 2.0% HNO3
solution, and the analytical signals obtained for the elements of interest were comparable to the analytical blank (2.0% HNO3).
Studies on Metal Migration from Stainless SteelStainless steel 316L samples 1.0 mm thick and 5.0 mm wide were im-mersed in hexane for 5 min to remove oils and greases. Next, the samples were rinsed with water, then rinsed with absolute ethanol. Finally, sam-ples were dried at room temperature.
To evaluate the possible migration of iron, chromium, and nickel from stainless steel to the mouthwash, ap-proximately 0.350 g stainless steel
segments were added to 24 polypro-pylene tubes (one segment per tube), which were divided into 2 groups of 12 tubes. To the first group was added 3.0 mL of a mouthwash containing zinc salts in its composition, and to the second group was added 3.0 mL of a similar mouthwash, but zinc-free.
Tubes with mouthwashes and stainless steel segments were stored at room temperature, and were manually shaken for 5 min every 12 h for a total of 7 days. After 1, 3, 5, and 7 days of contact with stainless steel, 1.50 mL aliquots (n = 3 for each contact time) were removed from the tubes, acidified with 0.50 mL of 2.0% HNO3 and refrigerated for subse-quent ICP-OES analysis.
Results and DiscussionMatrix Effect EvaluationIt is usual to perform acid digestion for elemental determinations by spec-troscopic techniques in pharmaceu-tical and cosmetic samples (10,11). Mouthwash contains substances (such as surfactants, preservatives, and sa-line compounds) that change the sam-ple’s surface tension, viscosity, and, consequently, transport efficiency in the ICP-OES nebulization system (12), besides conferring high carbon levels in the matrix, which is undesirable in ICP-OES analysis. Methods that cir-cumvent the difficulties of the matrix
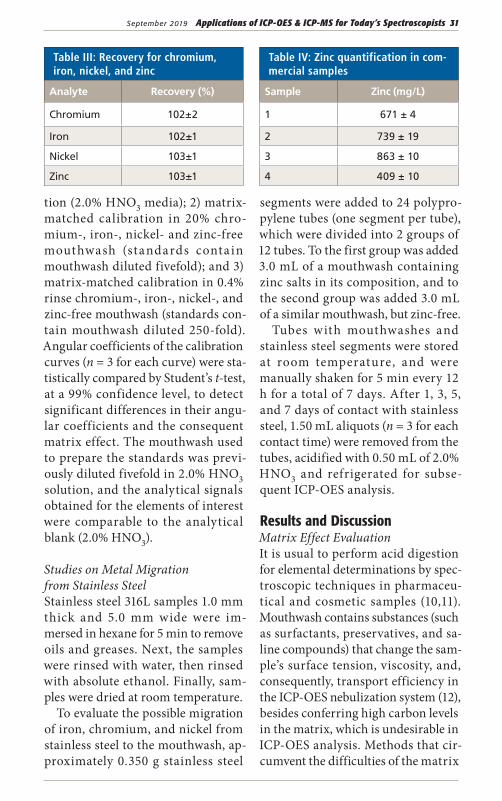
Table III: Recovery for chromium, iron, nickel, and zinc
Analyte Recovery (%)
Chromium 102±2
Iron 102±1
Nickel 103±1
Zinc 103±1
Table IV: Zinc quantification in com-mercial samples
Sample Zinc (mg/L)
1 671 ± 4
2 739 ± 19
3 863 ± 10
4 409 ± 10
32 Applications of ICP-OES & ICP-MS for Today’s Spectroscopists September 2019
effect without performing acid di-gestions are interesting for routine analysis and increase the analytical frequency.
Table II shows the angular coeffi-cients obtained in the external cali-bration and matrix-matched calibra-tions containing 0.4% and 20% iron-, chromium-, and nickel-free mouth-wash and the Student’s t-value calcu-lated for a 99% confidence level.
There are no significant differences between the angular coefficients of the EC and MM0.4 curves; therefore, for the analysis of a mouthwash with a dilution of 250-fold, external cali-bration can be used because there is no significant matrix effect on the analytical signals of chromium, iron, nickel, and zinc. The comparison between EC and MM20 angular coef-ficients shows statistically significant differences, evidenced by the calcu-lated Student’s t-values, which are much higher than the critical value (4.604) for all analytes. Thus, for the analysis of a mouthwash with a dilu-tion of fivefold, external calibration cannot be used because the matrix effects are significant. The lower an-gular coefficients of MM20 in relation to EC indicates that the mouthwash matrix, if present in high concentra-tions, promotes suppression of the analytical signals of chromium, iron, nickel, and zinc.
Recovery TestTo evaluate the accuracy of the pro-posed method, 1.0 mL of a stock solution containing 1000 mg/L of chromium, iron, nickel and zinc was diluted in a 20 mL solution of iron-, chromium-, nickel-, and zinc-free mouthwash. Then 40 μL of this so-
lution was diluted in 10 mL of 2.0% HNO3 solution. Next, the solution was analyzed (n = 3) using external calibra-tion. Recoveries are shown in Table III.
Quantification of Metal Migration from Stainless SteelThe literature reports migration tests in which samples are immersed in different corrosive media, such as artificial saliva, mouthwash, and sa-line solutions (7,13,14). Usually, the evaluation of corrosion is verified by microscopy.
To quantify chromium, iron, and nickel, the MM20 calibration was adopted. 1.0 mL of each previously acidified sample was diluted in 5.0 mL of 2.0% HNO3 solution and analyzed by ICP-OES. Figure 1 shows the vari-ation in iron, chromium, and nickel concentrations (Cmetal) as a function of contact time in mouthwashes con-taining (a) zinc salts and (b) zinc-free.
After the first day of contact, mi-gration of chromium, iron, and nickel to the mouthwashes occurs. Chromium and nickel concentra-tions did not significantly change over the 7 days of testing for either evaluated formulation.
Iron concentration in mouthwash containing zinc salts shows an in-crease between the 5th and 7th days (Figure 1a), but the values do not dif-fer significantly at a 99% confidence level according to the Student’s t-test (tcalculated = 2.216 and tcritical = 4.604). Also verified was an increase in iron concentration in the zinc-free mouth-wash on day 5 (Figure 1b), but there was no significant difference between concentrations on days 5 and 7 at a confidence level of 99% (tcalculated = 1.040 and tcritical = 4.604).

September 2019 Applications of ICP-OES & ICP-MS for Today’s Spectroscopists 33
Limits of detection (LODs) for chromium, iron, and nickel were 16.0, 23.0 and 5.0 μg/L, respectively, calculated according to the expres-sion LOD = 3s/a, where “a” is the an-gular coefficient of the curve MM20 and “s” is the standard deviation of 10 measurements of an analytical blank. The LOQ of 30.0 μg/L for all evaluated elements was estimated as the lower linearity limit of the respective calibration curves. The mouthwash used in the migration test was previously diluted fivefold in 2.0% HNO3 solution, and the analytical signals obtained for chro-mium, iron, and nickel were compa-rable to the blank (2.0% HNO3). The results shown in Figure 1 cannot be used to affirm any contamination of the mouthwash by these metals. As a result, a more rigorous migration test would be necessary.
Zinc Quantification in Commercial SamplesFour mouthwash samples contain-ing zinc salts in their formulations were purchased in the local market, and zinc quantif ication was per-formed using external calibration. 40 μL of each sample was diluted in 10 mL of 2.0% HNO3 solution and analyzed by ICP-OES (n = 3). Results are shown in Table IV.
Detect ion and quant i f icat ion limits for zinc were 5.0 μg/L and 30 μg/L, respectively, a lso calcu-lated as described in the previous section “Quantif ication of Metal Migrat ion from Stainless Steel,” using the angular coef f icient of the external calibration.
The amount of Zn2+ or zinc salts is not declared in most of the product
labels, so it is not possible to make a comparison. The European Council (Regulation EC 1223/2009) sets 1.0% (by mass) as the maximum zinc con-tent allowed in cosmetic products.
ConclusionStatistical evaluation of the angu-lar coefficients of calibration curves based on the Student’s t-test allowed us to evaluate the matrix effects in the elemental analysis of mouth-wash and guided the strategies to minimize these effects. The simple 250-fold di lut ion of the mouth-wash samples was suf f icient for zinc determination in commercial samples using external calibration, and matrix-matched calibration made it possible to quantify chro-mium, iron, and nickel at low con-centrations while eliminating the matrix effect, simply and quickly, highlighting the small dilution fac-tor. Excellent recovery percentages, low LODs and LOQs, and a wide calibration range for all evaluated elements show that simple strate-gies can be employed for elemental analysis in complex matrices, using ICP-OES.
AcknowledgmentsThe authors are grateful to the Mul-tiuser Central Facilities (UFABC) for experimental support.
References(1) P. Boyle, A. Koechlin, and P. Autier, Oral Dis.
20(Suppl. I), 1‒68 (2014).
(2) A. Young, G. Jonski, and G. Rölla, Int. Dent.
J. 53, 237‒242 (2003).
(3) E.G. Winkel, S. Roldan, A.J. Winkelhoff, D.
Herrera, and M. Sanz, J. Clin. Periodontol.
30, 300‒306 (2003).

34 Applications of ICP-OES & ICP-MS for Today’s Spectroscopists September 2019
(4) S. Saad, J. Greenman, and H. Shaw, Oral
Dis. 17, 180‒186 (2011).
(5) J.R. Cortelli, M.D.S. Barbosa, and M.A.
Westphal, Braz. Oral Res. 22(Spec. Iss. 1),
44‒54 (2008).
(6) H. Kerosuo, G. Moe, and E. Kleve, Angle
Orthod. 65, 111‒116 (1995).
(7) G.S. Dolci, L.M. Menezes, R.M. Souza, and
B.A. Dedavid, R. Dental Press. Ortodon.
Ortop. Facial. 13, 77‒84 (2008).
(8) A.T. Erdogan, D. Nalbangtil, F. Ulkur, and F.
Sahin, Angle Orthod. 85, 665‒672 (2015).
(9) W.B. Jones, G.L. Donati, C.P. Calloway
Jr., and B.T. Jones, Anal. Chem. 87, 2321‒2327 (2015).
(10) G. A. Zachariadis, and E. Sahanidou, Cent.
Eur. J. Chem. 9, 213‒217 (2011).
(11) F. C. Pinheiro, A.I. Barros, and J.A.A Nóbrega,
Anal. Chim Acta 1065, 1‒11 (2019).
(12) J.L. Todolí, L. Gras, V. Hernandis, and J. Mora,
J. Anal. At. Spectrom. 17, 142‒169 (2002).
(13) J. Porcayo-Calderon, M. Casales-Diaz, V.M.
Salinas-Bravo, and L. Martinez-Gomez,
Bioinorg. Chem. Appl. 2015, 1‒14 (2015).
(14) D. Nalbantgil, F.Ulkur, G. Kardas, and M.
Culha, Bio-Med. Mater. Eng. 27, 539‒549
(2016).
P. M. F. Camargo Filho, J. F. S. Joca, and I. Gaubeur are with the Molecular and Atomic Spectroscopy Laboratory at the Universidade Federal do ABC (UFABC), in Santo André, Brazil. Direct correspondence to: [email protected]
For more information on this topic, please visit our homepage at: www.spectroscopyonline.com
For more information on this topic, please visit our homepage at: www.spectroscopyonline.com
Continued from page 27
(4) F. Vanhaecke, L. Balcaen, I. Deconinck,
I. De Schrijver, C. Marisa Almeida, and
L. Moens, J. Anal. At. Spectrom. 18,
1060–1065 (2003).
(5) S.D. Fernandez, N Sugishama, J.R.
Encinar, and A. Sanz-Medel, Anal.
Chem. 84, 5851–5857 (2012).
(6) N . S u g i y a m a , “ T h e a c c u r a t e
measurement of selenium in twelve
diverse reference materials using on-
line isotope dilution with the 8800
Triple Quadrupole ICP-MS in MS/
MS mode” (Agilent publication 5991-
0259EN, 2012).
(7) Handbook of ICP-QQQ Applications
using the Agilent 8800 and 8900,
(Agilent publication 5991-2802EN,
2019).
(8) V.G. Anicich, Astrophys. J., Suppl. Ser.
84, 215–315 (1993).
(9) V.V. Lavrov, V. Blagojevic, G.K. Koyanagi,
G. Orlova, and D. K. Bohme, J. Phys.
Chem. A. 108, 26, 5610–5624 (2004).
(10) N. Sugiyama and K. Nakano, “Reaction
data for 70 elements using O2, NH3
and H2 gases with the Agilent 8800
Triple Quadrupole ICP-MS” (Agilent
publication 5991-4585EN, 2014).
(11) L. Balcaen, E. Bolea-Fernandez, M.
Resano, and F. Vanhaecke, Anal. Chim.
Acta 809, 1–8 (2014).
Ed McCurdy and Glenn Woods are with Agilent Technologies in Stockport, United Kingdom. Naoki Sugiyama is with Agilent Technologies International, in Tokyo, Japan. Direct correspondence to: [email protected]

Follow us on social media
SpectroscopyOnline.com
Join your colleagues in conversation and stay up-to-date
on breaking news, research, and trends associated with
the spectroscopy industry.
“Like” and follow us on Facebook,
LinkedIn, and Twitter today!
cem.com/MARS6
MARS 6Microwave Digestion System
iLink®
Remote system operation
iPrep™
The world’s most robust vessel
iWave™
Accurate, contactless temperature control
One Touch™
It’s like having a chemist in a box
The leader in microwave digestionBetter digestions. Better analyses.


