Page 1
University of South FloridaScholar Commons
Graduate Theses and Dissertations Graduate School
6-30-2016
Applications of Molecular Modelling and StructureBased Drug Design in Drug DiscoverySreya MukherjeeUniversity of South Florida, [email protected]
Follow this and additional works at: http://scholarcommons.usf.edu/etd
Part of the Chemistry Commons
This Thesis is brought to you for free and open access by the Graduate School at Scholar Commons. It has been accepted for inclusion in GraduateTheses and Dissertations by an authorized administrator of Scholar Commons. For more information, please contact [email protected] .
Scholar Commons CitationMukherjee, Sreya, "Applications of Molecular Modelling and Structure Based Drug Design in Drug Discovery" (2016). GraduateTheses and Dissertations.http://scholarcommons.usf.edu/etd/6331
Page 2
Applications of Molecular Modelling and Structure Based
Drug Design in Drug Discovery
by
Sreya Mukherjee
A dissertation submitted in partial fulfillment
of the requirements for the degree of
Doctor of Philosophy
Department of Chemistry
College of Arts and Sciences
University of South Florida
Major Professor: Wayne Guida, Ph.D.
Abdul Malik, Ph.D.
Kenyon Daniel, Ph.D.
Jianfeng Cai, Ph.D.
Wesley Brooks, Ph.D.
Date of Approval:
June 10, 2016
Keywords: STIM1, Cruzain, Proteasome, ApoE4, cocrystals.
Copyright © 2016, Sreya Mukherjee
Page 3
DEDICATION
To my parents, husband and brother.
Page 4
ACKNOWLEDGEMENTS
I would like to express my sincere gratitude to my professor, Dr. Wayne Guida for giving me the
opportunity to conduct research under his guidance and supervision. I am sure that this will help
me achieve much more in the future.
I would also like to thank my committee members, Dr. Wesley Brooks, Dr. Abdul Malik, Dr. Mark
McLaughlin and Dr. Kenyon Daniel for their valuable time, feedback, suggestions and help.
I thank Department of Chemistry, University of South Florida for giving me the opportunity for
this education. My lab mates were always a constant support and their role demands a big thanks
from me too.
I also thank my parents and family for their support. Without them, this would not be possible.
And last but not the least, a huge thanks to my husband, Biplob, without whose constant love and
support this would not be complete and my daughter Atyaani , who helped me find myself which
lead to finding my passion towards drug discovery.
Page 5
i
TABLE OF CONTENTS
LIST OF FIGURES ....................................................................................................................... iv
LIST OF TABLES ...........................................................................................................................x
LIST OF SCHEMES...................................................................................................................... xi
ABBREVIATIONS ...................................................................................................................... xii
ABSTRACT ................................................................................................................................. xiii
CHAPTER ONE: INTRODUCTION ..............................................................................................1
1.1. Introduction ...................................................................................................................1
1.1.1 Structure Based Drug Design. .........................................................................1
1.1.2. Protein and Peptide mimics.. ..........................................................................4
1.2. References .....................................................................................................................9
CHAPTER TWO: CHAPTER TWO: STROMAL INTERACTION MOLECULES AS
IMPORTANT THERAPEUTIC TARGETS IN DISEASES WITH DYSREGULATED
CALCIUM FLUX ....................................................................................................................11
2.1 .Introduction .................................................................................................................11
2.2. Calcium flux................................................................................................................12
2.2.1. Calcium dependent processes ......................................................................12
2.2.2. Calcium storage and release.........................................................................12
2.2.3. Entry of extracellular Ca2+ ...........................................................................16
2.3. STIM/ORAI Interactions ............................................................................................18
2.3.1. CRAC channel activation ............................................................................18
2.3.2. STIM1 and STIM2 .......................................................................................19
2.4. STIM involvement in diseases with calcium dysregulation .......................................22
2.4.1. Alzheimer’s Disease ....................................................................................23
2.4.2. Cancers .........................................................................................................24
2.4.2.1. Colorectal cancer. .........................................................................24
2.4.2.2. Hepatocellular carcinoma .............................................................25
2.4.2.3. Cervical cancer..............................................................................25
2.4.2.4. Glioblastoma multiforme ..............................................................26
2.4.3. Immunology .................................................................................................26
2.4.4. Other diseases and abnormal states..............................................................29
2.5. Conclusions .................................................................................................................30
2.6. References ...................................................................................................................32
Page 6
ii
CHAPTER THREE: MOLECULAR DYNAMICS SIMULATIONS OF MEMBRANE
BOUND STIM1 TO INVESTIGATE CONFORMATIONAL CHANGES DURING
STIM1 ACTIVATION UPON CALCIUM RELEASE ..........................................................46
3.1. Introduction .................................................................................................................46
3.2. Methods.......................................................................................................................50
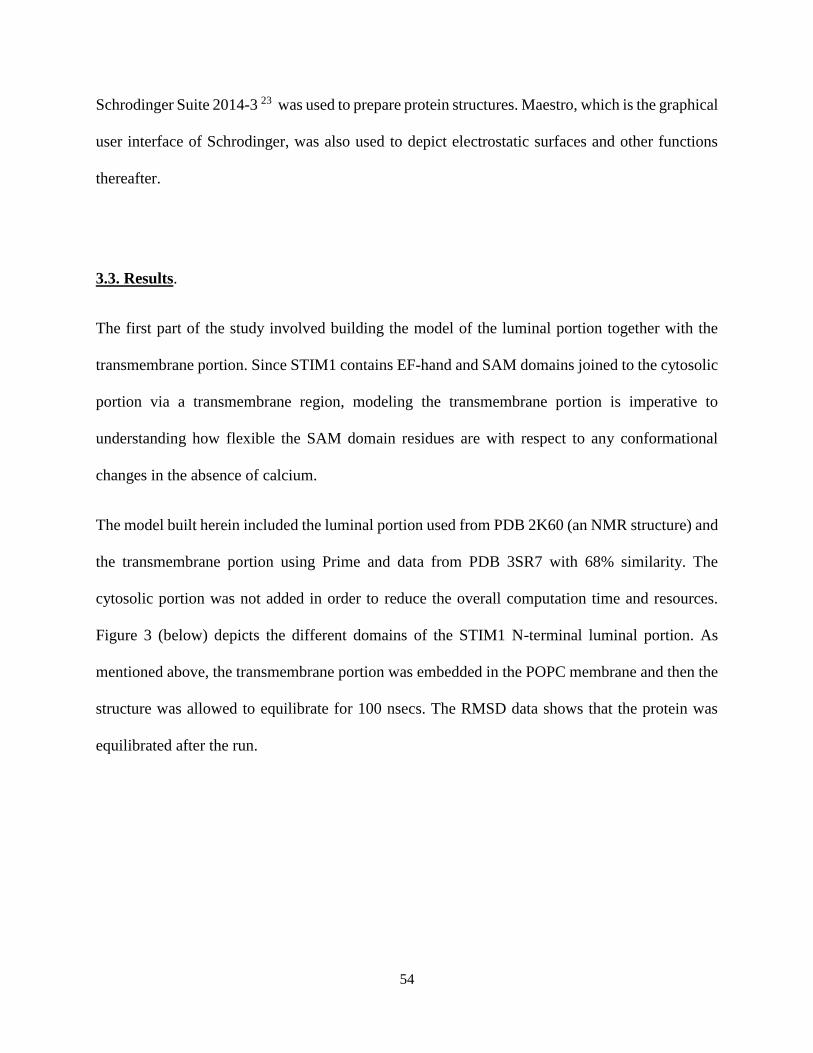
3.3. Results .........................................................................................................................54
3.4. Discussion ...................................................................................................................60
3.5. Conclusions .................................................................................................................64
3.6. References ...................................................................................................................65
CHAPTER FOUR: MUTATION IN EF-SAM DOMAIN OF STIM1 DEREGULATES
CA2+ SIGNALING CONTRIBUTING TO CHRONIC PANCREATITIS ...........................69
4.1. Introduction .................................................................................................................69
4.2. Experimental studies performed on characterization of the mutation. .......................71
4.3. Computational Modeling of the STIM1 wild type and E152K mutant. .....................73
4.3.1. Methods........................................................................................................75
4.3.2. Results and Discussion. ...............................................................................79
4.3.4. Protein stability analysis. .............................................................................86
4.4. Conclusion ..................................................................................................................86
4.5. References ...................................................................................................................87
CHAPTER FIVE: CUPRIPHILIC COMPOUNDS TO AID IN PROTEASOME
INHIBITION............................................................................................................................91
5.1. Introduction .................................................................................................................91
5.2. Methods.......................................................................................................................95
5.3. Results and Discussion ...............................................................................................97
5.4. Conclusions ...............................................................................................................101
5.5. References .................................................................................................................101
CHAPTER SIX: DETERMINATION OF NOVEL INHIBITORS OF CRUZAIN USING
STRUCTURE BASES DRUG DESIGN ...............................................................................104
6.1. Introduction ...............................................................................................................104
6.1.1. Cysteine Protease .......................................................................................106
6.2. Methods.....................................................................................................................111
6.2.1. Conformational Search performed on the peptoid .....................................117
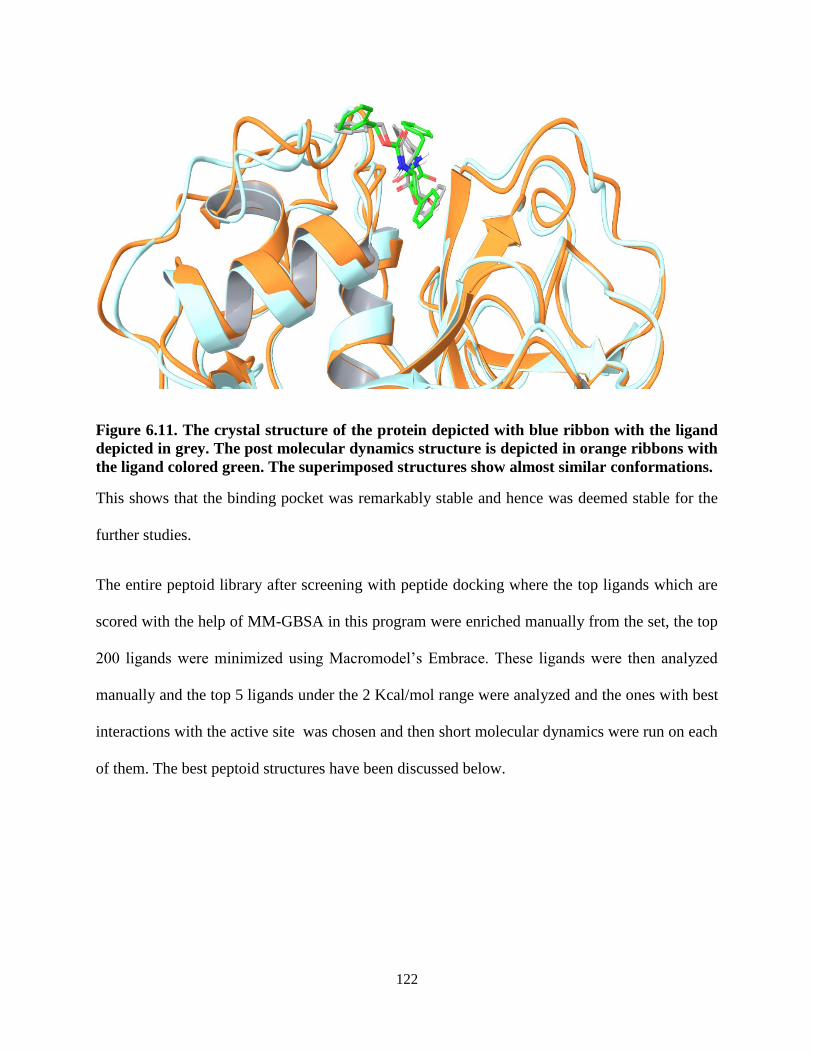
6.3. Results .......................................................................................................................121
6.3.1. [2-(4-fluorophenyl)-propylamine] containing peptoid ...............................123
6.3.2. [3-Chloro-4fluorobenzylamine containing peptoid....................................125
6.3.3. 4-Methoxyphenethylamine containing peptoid .........................................128
6.4. Conclusions ...............................................................................................................130
6.5. References .................................................................................................................131
CHAPTER SEVEN: STRUCTURE MODIFICATION OF APOLIPOPROTEIN E4 TO
DIMINISH CHARACTERISTIC STRUCTURAL DOMAIN INTERACTION AND
RESTORE FUNCTION NORMALITY................................................................................134
7.1. Introduction ...............................................................................................................134
Page 7
iii
7.2. Methods.....................................................................................................................137
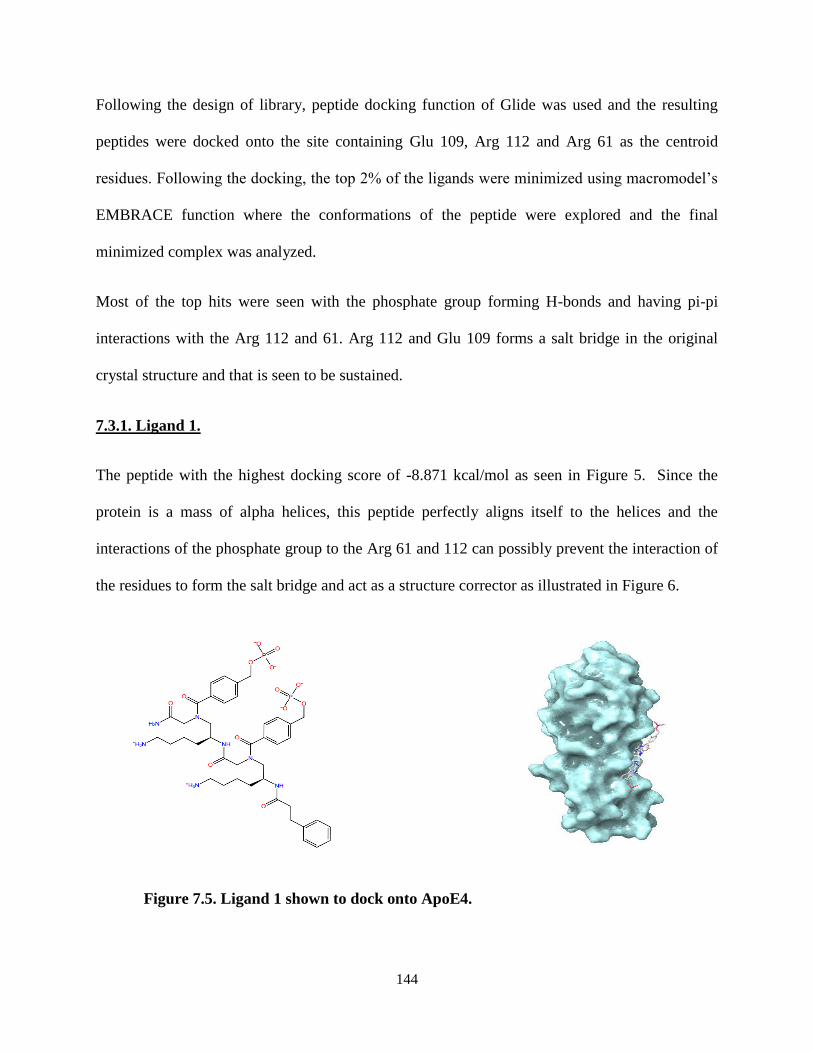
7.3. Results .......................................................................................................................142
7.3.1. Ligand 1 .....................................................................................................144
7.3.2. Ligand 2 .....................................................................................................145
7.3.3. Ligand 3 .....................................................................................................147
7.4. Conclusions ...............................................................................................................148
7.5. References .................................................................................................................149
CHAPTER EIGHT: COMPARATIVE STUDY OF COCRYSTAL SCREENING
METHODOLOGIES: SLURRY VS SOLUTION EVAPORATION VS
MECHANOCHEMISTRY ....................................................................................................151
8.1. Introduction ...............................................................................................................151
8.2. Experimental Section ................................................................................................154
8.2.1. Materials. ...................................................................................................154
8.2.2. Synthesis of Cocrystals. .............................................................................154
8.2.3. Preparation of cocrystals via slurrying ......................................................156
8.2.4. Preparation of cocrystals via liquid assisted grinding. ...............................158
8.2.5. Preparation of cocrystals via neat grinding ................................................158
8.2.6. Solution crystallization ..............................................................................158
8.2.7. Characterization of Crystal Forms .............................................................165
8.2.7.1. Differential scanning calorimetry (DSC) ....................................165
8.2.7.2. Thermogravimetric analysis (TGA). ...........................................166
8.2.7.3. Infrared spectroscopy (FT-IR) ....................................................166
8.2.7.4. Powder X-ray diffraction (PXRD. ..............................................166
8.2.7.5. Single-Crystal X-ray Data Collection and Structure
Determinations ...........................................................................166
8.3. Results and Discussion .............................................................................................167
8.3.1. Crystal Engineering ...................................................................................167
8.3.2. Crystal forms of gallic, ferulic , caffeic , coumaric and ellagic acid .........169
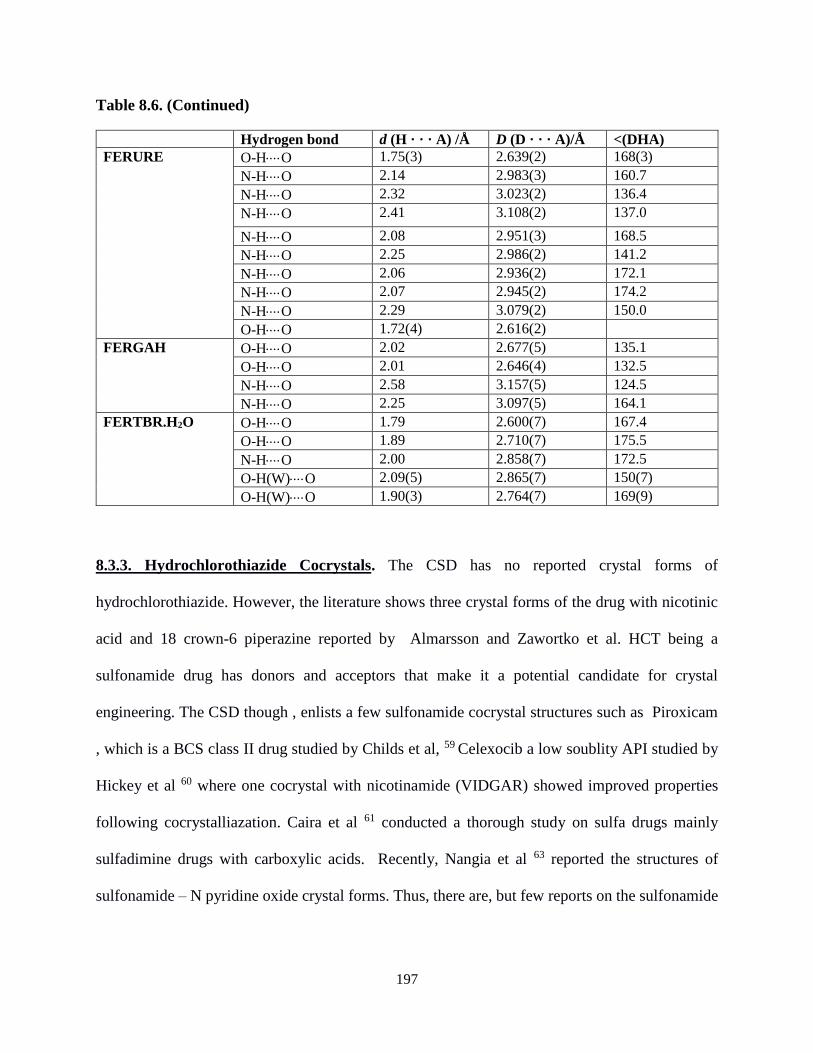
8.3.3. Hydrochlorothiazide crystals .....................................................................197
8.3.3.1. CSD statistics ........................................................................... 198
8.3.4. Mechanochemistry .....................................................................................204
8.3.5. Trends amongst Cocrystal formers for grinding experiments ...................209
8.3.6. Slurry experiments .....................................................................................210
8.4. Conclusion ................................................................................................................212
8.5. References .................................................................................................................212
APPENDIX A: JOURNAL PERMISSIONS ..............................................................................222
Page 8
iv
LIST OF FIGURES
Figure 1.1. ß Hairpin structure ..................................................................................................6
Figure 1.2. AApeptide a new class of peptidomimetics which was used as ligands
against ApoE4 ........................................................................................................ 8
Figure 2.1. Peptidyl Arginine Deiminase 4 ............................................................................ 15
Figure 2.2. Deimination Reaction of PAD4. ........................................................................ 16
Figure 2.3. STIM1 Activation Schematic .............................................................................. 20
Figure 2.4. StoreOperatedCalciumEntry ................................................................................ 22
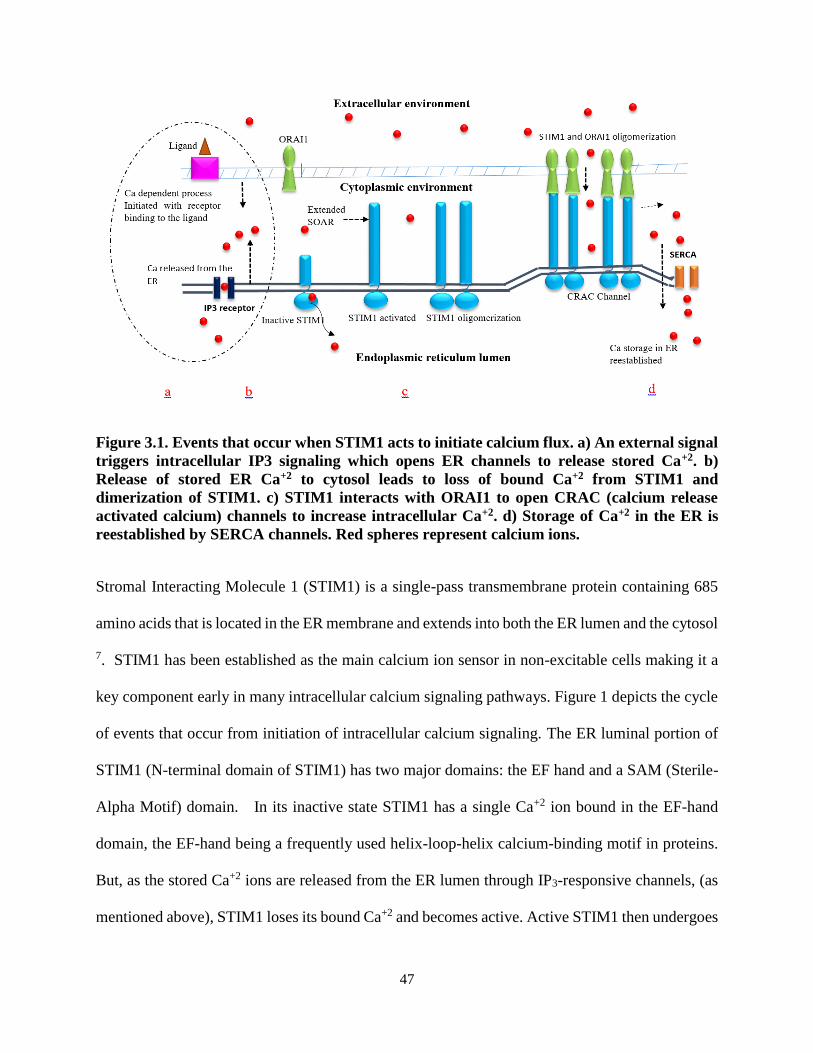
Figure 3.1. Events that occur when STIM1 acts to initiate calcium flux ............................... 47
Figure 3.2. The structure built prior to insertion into membrane showing the N-terminal
of STIM1 positioned in the ER luminal portion .................................................. 52
Figure 3.3. The luminal part of the protein (in purple) with the transmembrane part
embedded in the POPC membrane ...................................................................... 53
Figure 3.4. Different domains of STIM1 N-terminal luminal portion present inside the
Endoplasmic reticulum ........................................................................................ 55
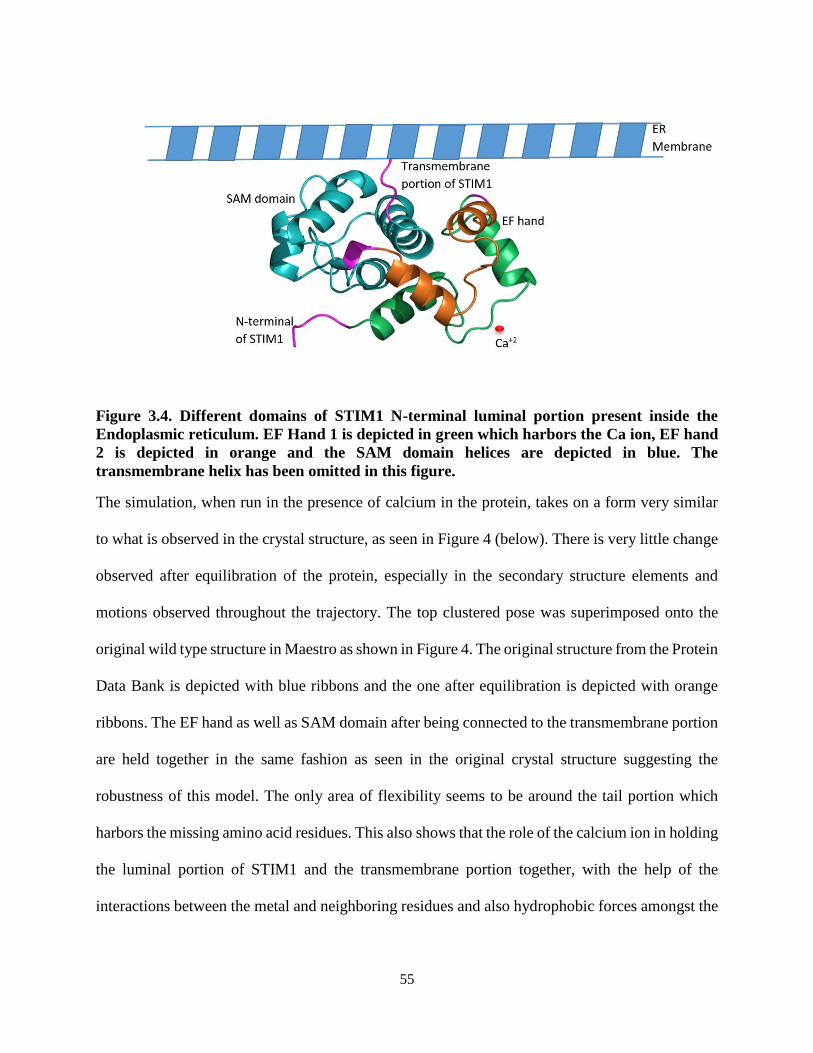
Figure 3.5. Superimposition of the crystal structure (depicted in blue ribbons) with the
simulated model in the presence of calcium (depicted with orange ribbons)
shows almost exact similarities in the structure after dynamics .......................... 56
Figure 3.6. STIM1 with calcium ion bound to the negatively charged residues. For
clarity purposes, Asp 77 and Glu 87 have been shown here ............................... 57
Figure 3.7. Graph showing trajectory frames (X-axis vs Distance in Å (Y-axis) .................. 58
Figure 3.8. Calcium ion held together by a few negatively charged residues which rest
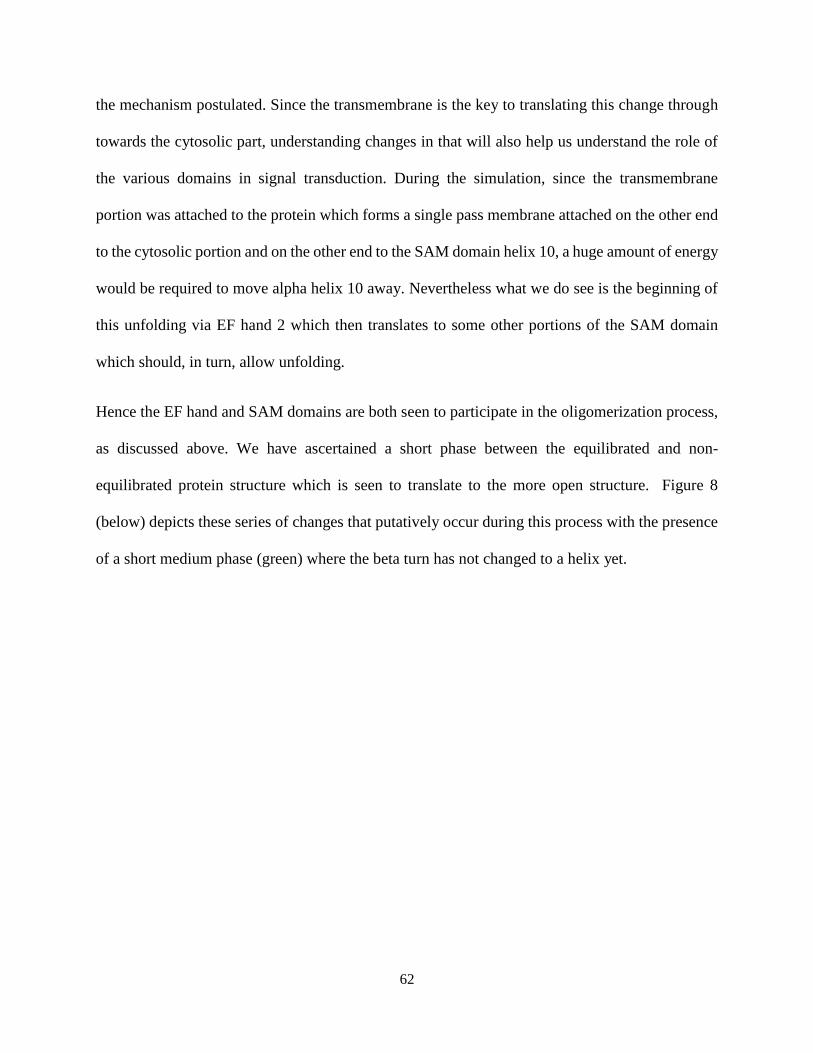
in between alpha helices and beta turn in EF hand 1 depicted in orange. ........... 61
Figure 3.9. Cascade of events occurring during oligomerization. .......................................... 63
Page 9
v
Figure 4.1. Luminal portion of STIM1, EF hand is colored in magenta and SAM
domain in cyan ..................................................................................................... 74
Figure 4.2. ER luminal portion of STIM1 embedded in a POPC membrane......................... 76
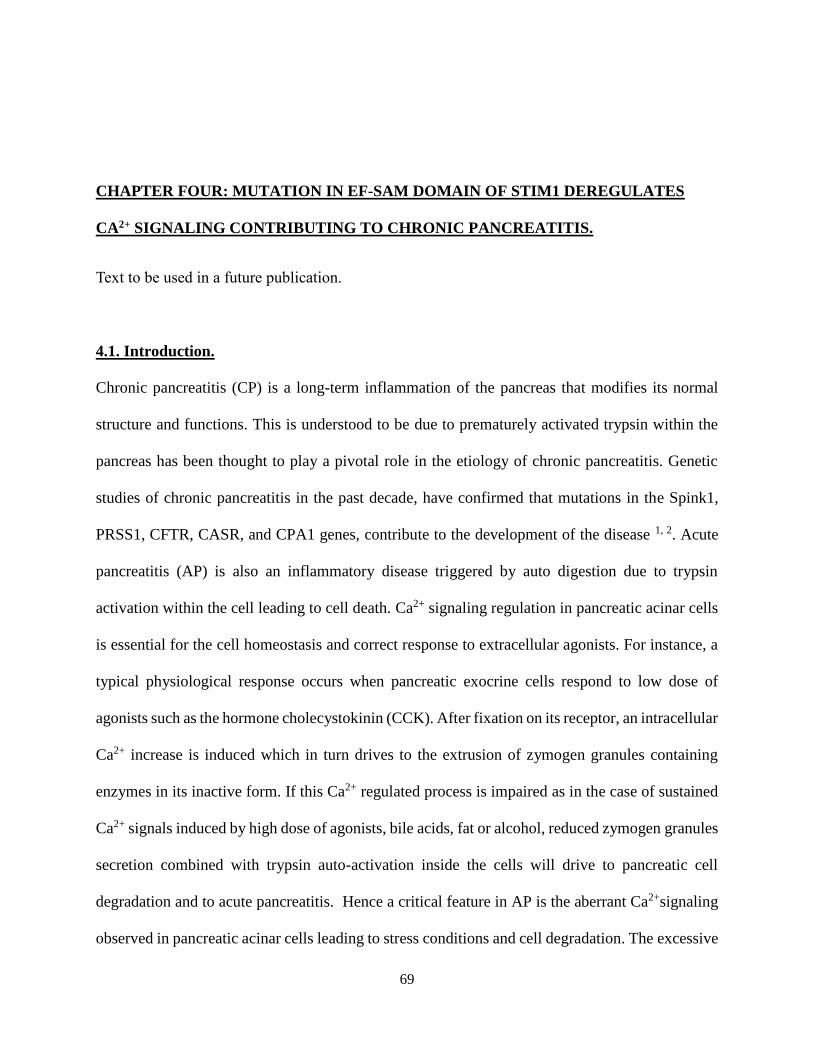
Figure 4.3. ER lumenal portion of STIM1 embedded in a POPC membrane viewed at
an angle to show the lumenal surface of the membrane. ..................................... 77
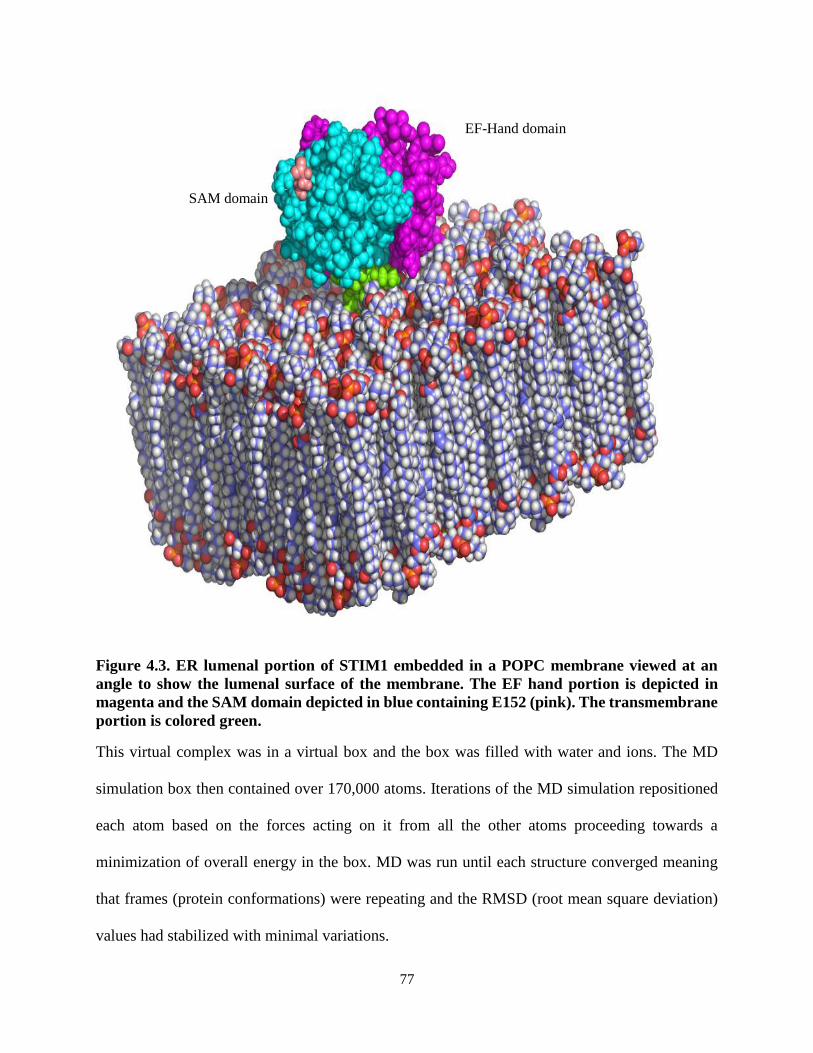
Figure 4.4. RMSD (Å) shown for (a) non-mutated protein containing E152 and (b)
mutated protein containing K152........................................................................ 79
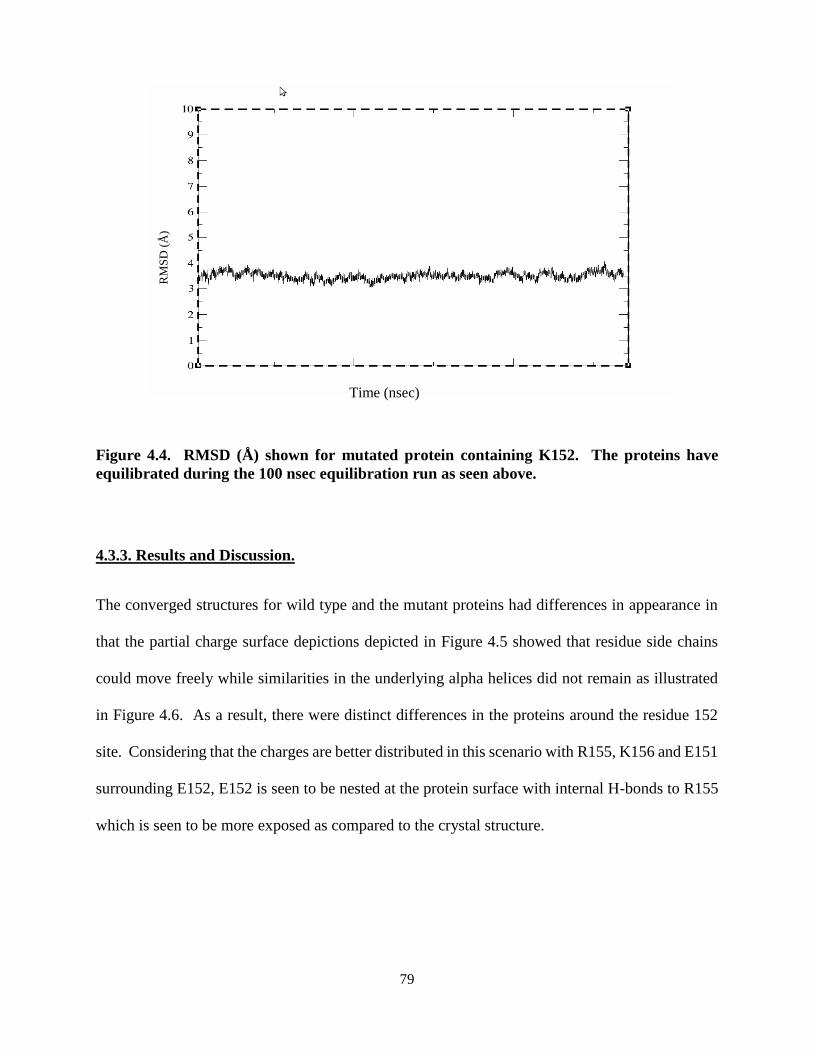
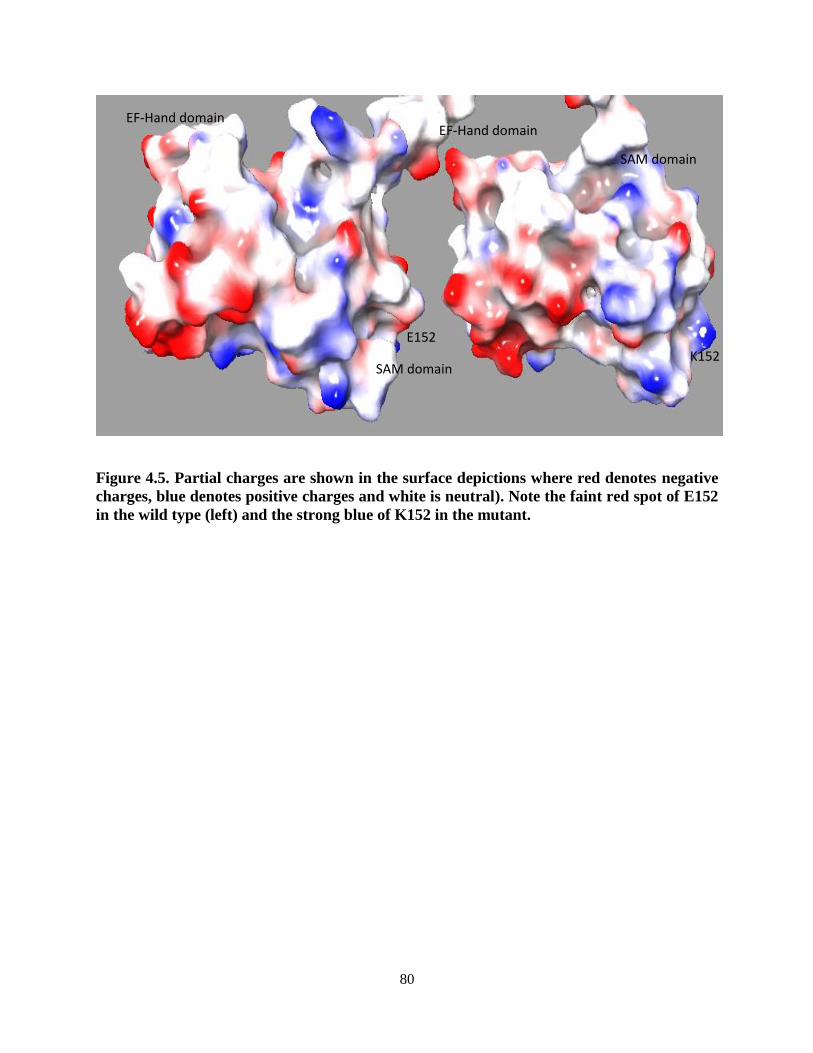
Figure 4.5. Partial charges are shown in the surface depictions where red denotes
negative charges, blue denotes positive charges and white is neutral) ................ 80
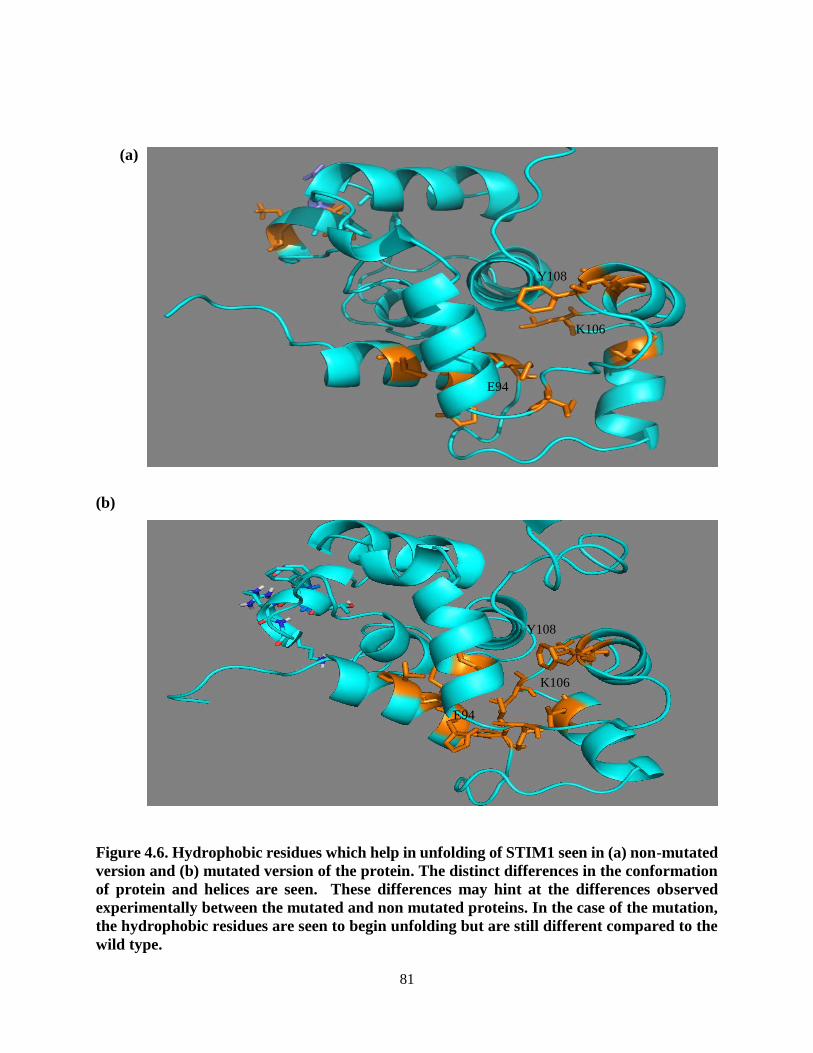
Figure 4.6. Hydrophobic residues which help in unfolding of STIM1 seen in
(a) non-mutated version and (b) mutated version of the protein. ........................ 81
Figure 4.7. (a) E152 colored in pink in the wild type human STIM1 shows consistent
hydrogen bonding with neighboring R155 in the helix and extends to
interactions between R155 and D153. (b) K152 colored in blue in the
mutant human STIM1 extends independently outward from the protein
and E151 interacts with R155 thereby providing a flexible cationic
site in the SAM domain. ...................................................................................... 82
Figure 4.8. Rg computed for the whole trajectory shows that the non-mutant protein
(a) has a lower Rg than the mutated protein (b) ................................................... 83
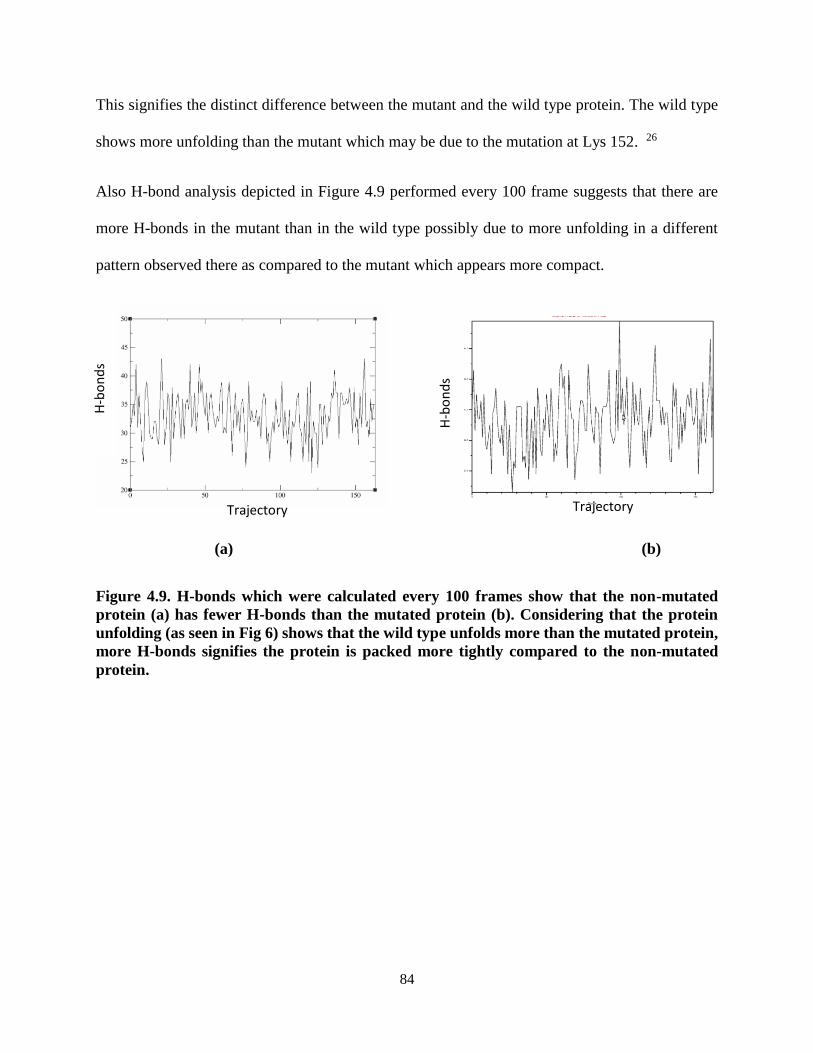
Figure 4.9. H-bonds which were calculated every 100 frames show that the
non-mutated protein (a) has fewer H-bonds than the mutated protein (b) ........... 84
Figure 4.10. Propka run on MD trajectory showcases deprotonation of Glu152 and
protonation pka of Lys 152 at around 6.5 and 8.5 respectively ........................... 85
Figure 5.1. β4 (green), β5 (magenta) and β6 (blue) subunits of 20S proteasome .................. 93
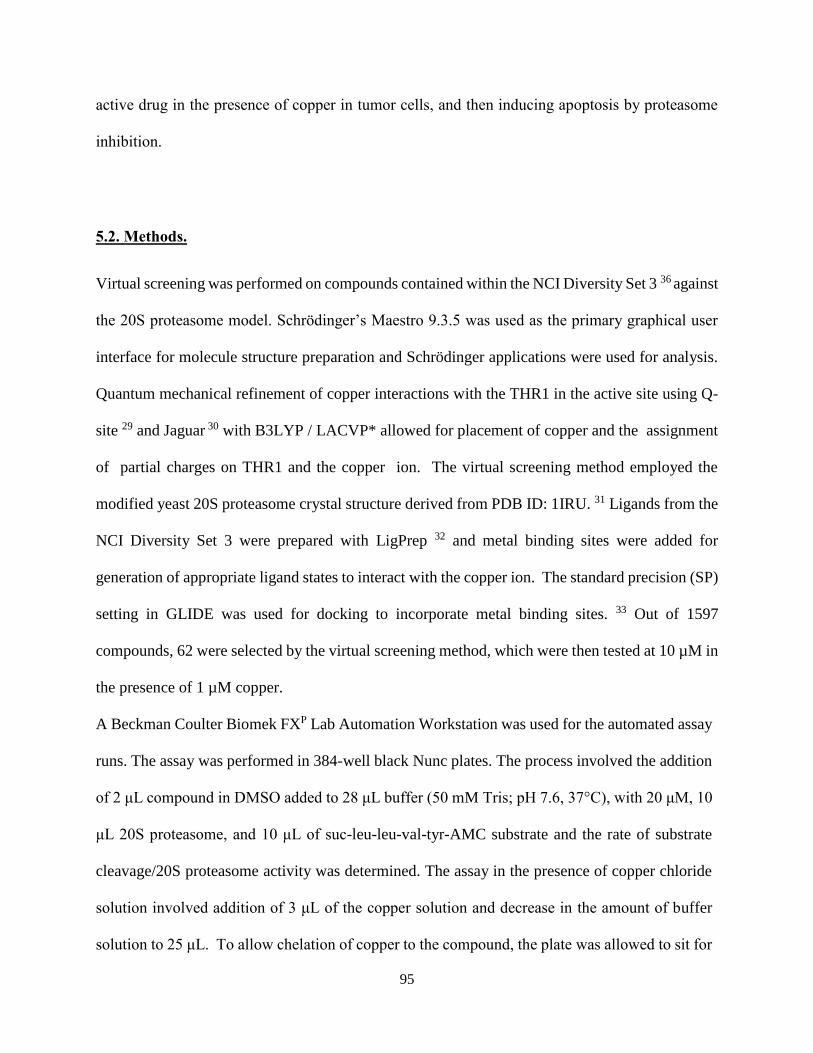
Figure 5.2. Compounds that show proteasome inhibition ...................................................... 97
Figure 5.3. The purified protein dose response curve for NSC 34708 showing copper
alone (blue), compound alone (black), and compound with copper (red)
depicts a dramatic improvement of percent inhibition by the compound in
the presence of sub-micromolar copper ............................................................... 98
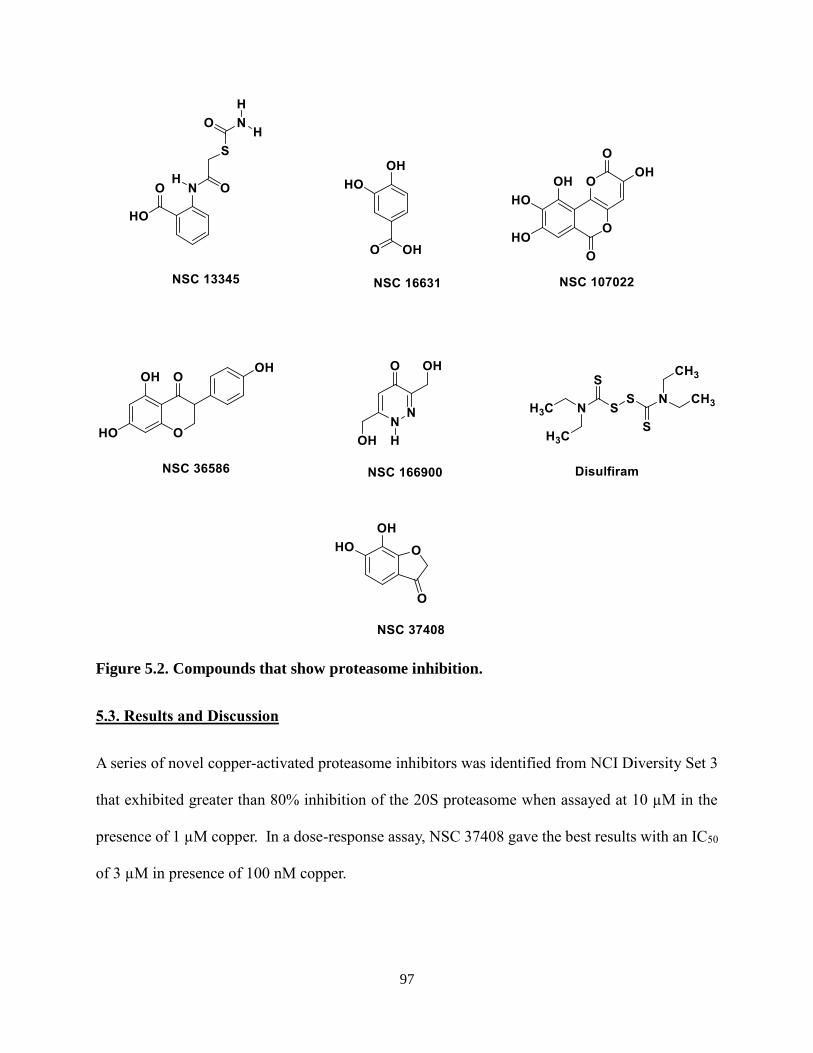
Figure 5.4. GLIDE SP-docking pose of NSC 37408 (shown as green tubes) bound to
copper (shown in cyan) in the active of site ...................................................... 100
Page 10
vi
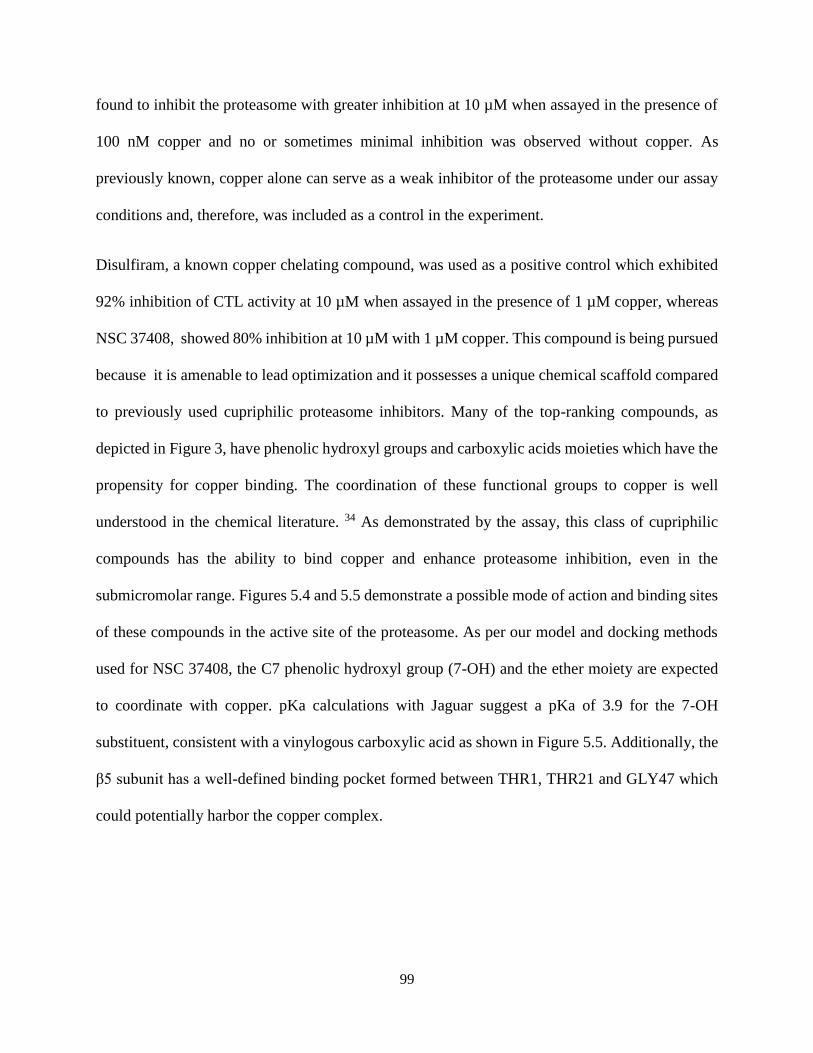
Figure 5.5. NSC 37408 (shown in green) bound to copper (shown in cyan) fits
into a well-defined pocket between the residues THR21 , THR1
and GLY47 in the β5 subunit of the catalytic site of the proteasome ................ 100
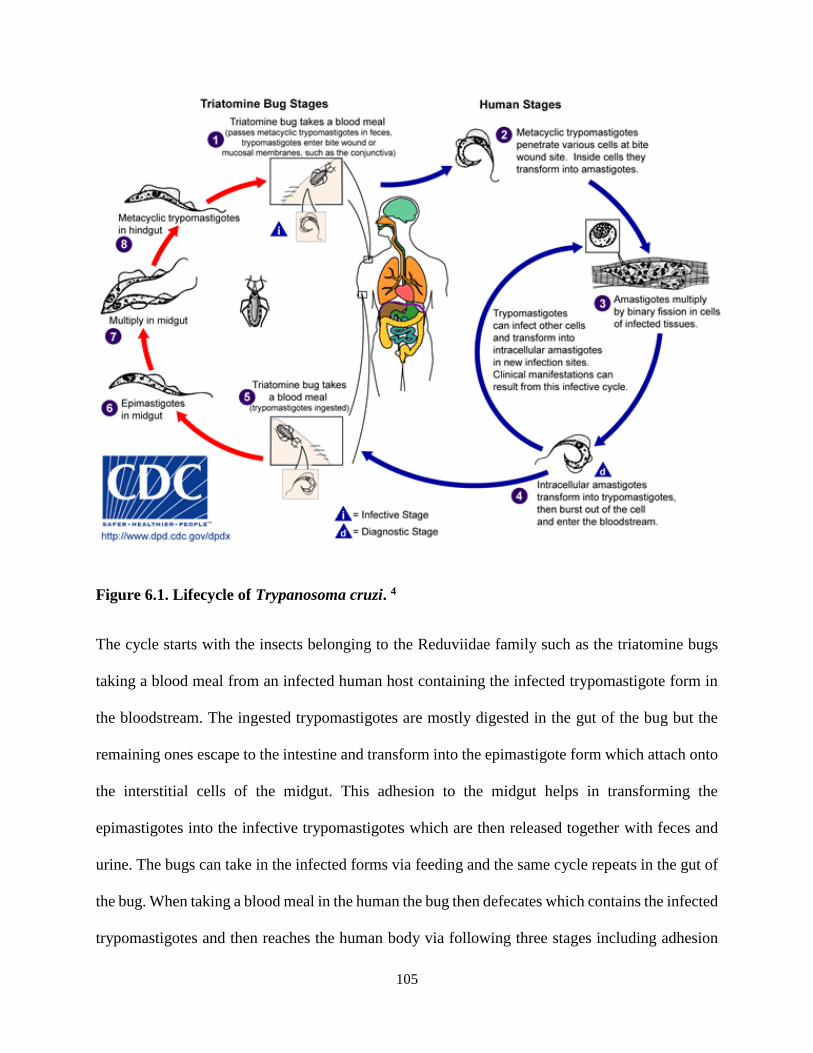
Figure 6.1. Lifecycle of Trypanosoma cruzi ........................................................................ 105
Figure 6.2. Chemical structures of drugs for Chagas disease. ............................................. 106
Figure 6.3. Crystal structure of cruzain showcasing some of the important residues
required for the enzymatic activity. ................................................................... 109
Figure 6.4. Surface view of cruzain, depicting the active site of cruzain containing
Cys 25 (blue), Asn 182 and His 152 (in green ) ................................................ 110
Figure 6.5. Peptoid structure to be used as the inhibitor for cruzain .................................... 115
Figure 6.6. Hydroxymethyl ketones: Reversible inhibitors for Cruzain .............................. 115
Figure 6.7. Compounds to be used as warheads onto the peptoid scaffold. ......................... 116
Figure 6.8. a) Initial conformations before any macromodel search was conducted.
b) Stable conformations taken by the beta hairpin structure following
constraints show that peptoid retains this conformation only after the
constraints are placed. ........................................................................................ 119
Figure 6.9. Cyclic peptide-peptoid hybrid scaffold containing the hydromethyl ketone
warhead. ............................................................................................................. 120
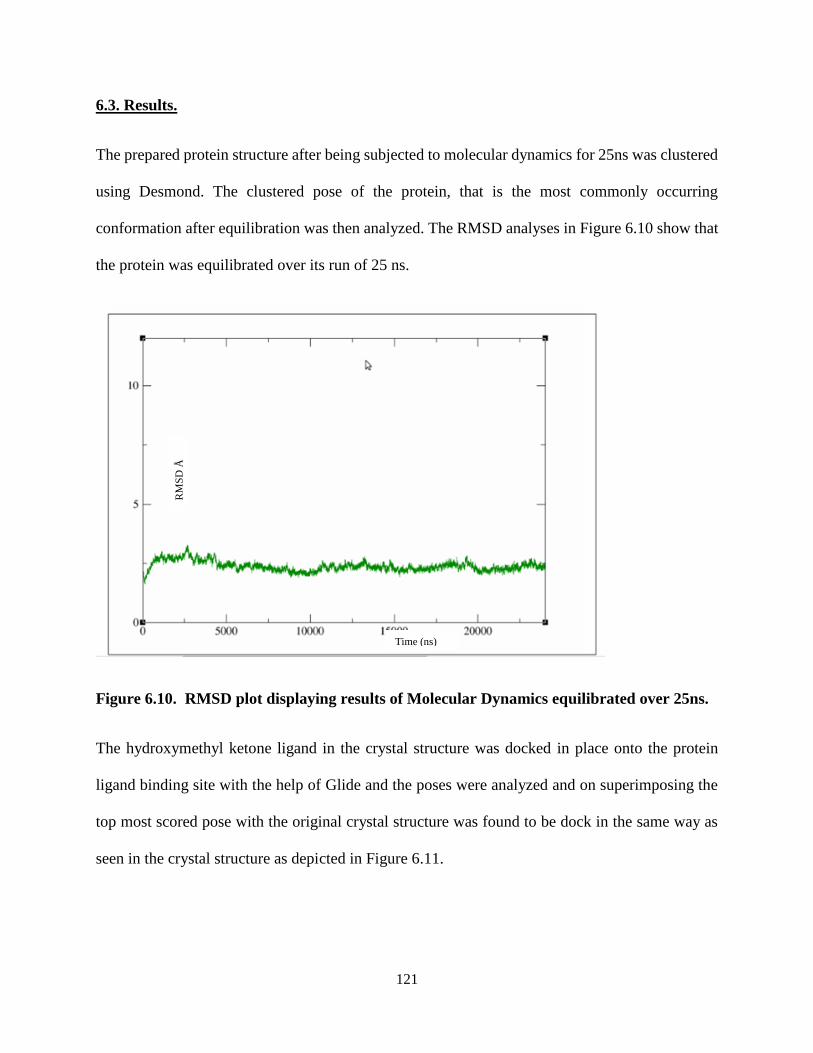
Figure 6.10. RMSD plot displaying results of Molecular Dynamics equilibrated over
25ns. ................................................................................................................... 121
Figure 6.11. The crystal structure of the protein depicted with blue ribbon with the
ligand depicted in grey ....................................................................................... 122
Figure 6.12. (a) [2-(4-fluorophenyl)-propylamine] containing peptoid containing the
warhead. (b) The surface view of peptoid positioned after moleculat
dynamics; bound to the important residue, Cys 25 depicted in cyan ................. 123
Figure 6.13. The interactions of the peptoid with the neighboring residues in the
binding site ......................................................................................................... 124
Figure 6.14. The comparative alignment of the peptoid (left) as compared to the ligand
(right) show that the effective binding of the peptoid onto the protein ............. 124
Figure 6.15. RMSD plot displaying results of Molecular Dynamics equilibrated over
25ns .................................................................................................................... 125
Page 11
vii
Figure 6.16. (a) [2-(4-fluorophenyl)-propylamine] containing peptoid containing the
warhead. (b) The surface view of peptoid positioned after moleculat
dynamics; bound to the important residue, Cys 25 depicted in cyan. ................ 126
Figure 6.17. The interactions of the peptoid with the neighboring residues in the
binding site ......................................................................................................... 126
Figure 6.18. The comparative alignment of the peptoid (left) as compared to the
ligand (right) show that the effective binding of the peptoid onto the
protein. ............................................................................................................... 127
Figure 6.19. RMSD plot of the peptoid shows that the structure attained equilibration
with the 15 ns of its run...................................................................................... 127
Figure 6.20. (a) 4-Methoxyphenethylamine containing peptoid containing the warhead.
(b) The surface view of peptoid positioned after moleculat dynamics;
bound to the important residue, Cys 25 depicted in cyan. ................................. 128
Figure 6.21. The interactions of the peptoid with the neighboring residues in the
binding site ......................................................................................................... 129
Figure 6.22. RMSD plot displaying results of Molecular Dynamics equilibrated
over .................................................................................................................... 129
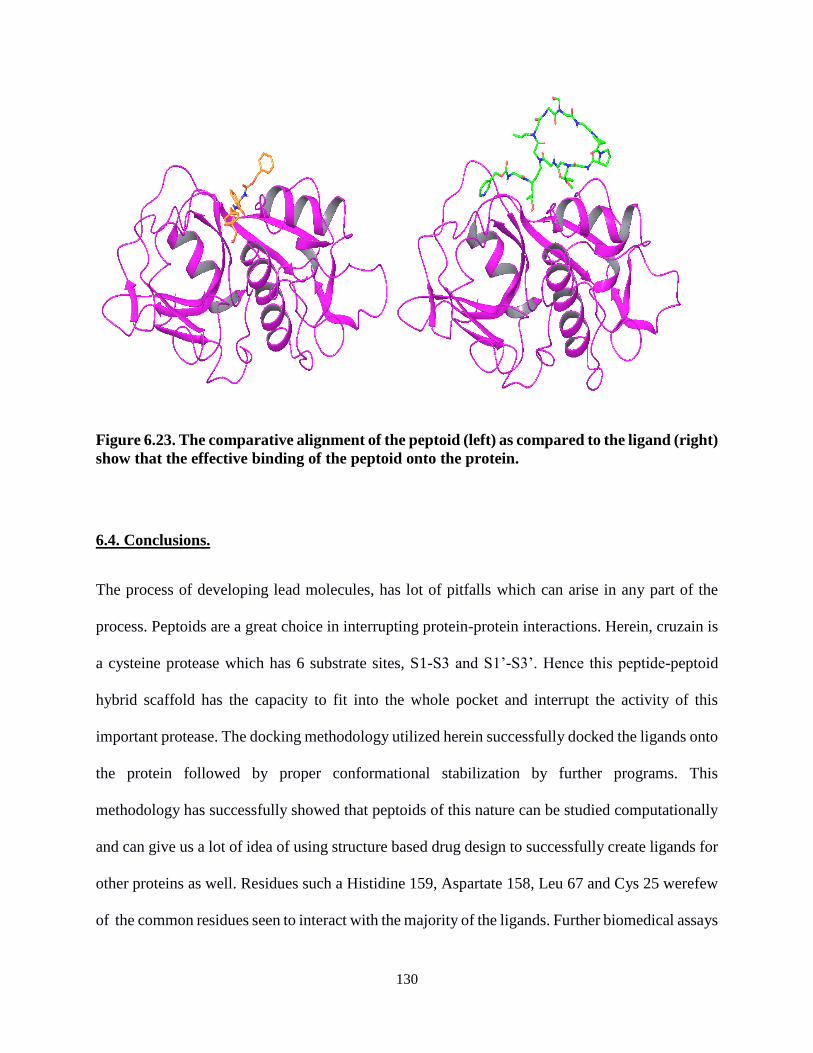
Figure 6.23. The comparative alignment of the peptoid (left) as compared to the
ligand (right) show that the effective binding of the peptoid onto the
protein ................................................................................................................ 130
Figure 7.1. The structures of apoE3 and apoE4 differ in the significance of the
structure domain interaction .............................................................................. 136
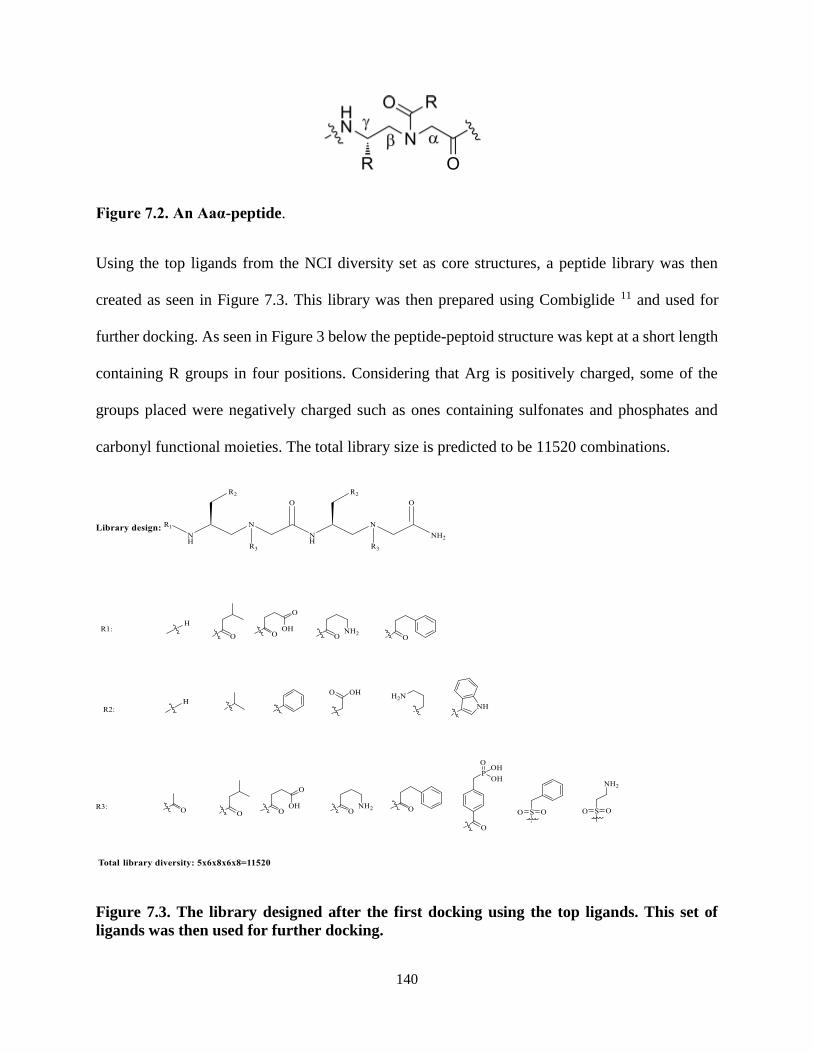
Figure 7.2. An Aaα-peptide .................................................................................................. 140
Figure 7.3. The library designed after the first docking using the top ligands. ................... 140
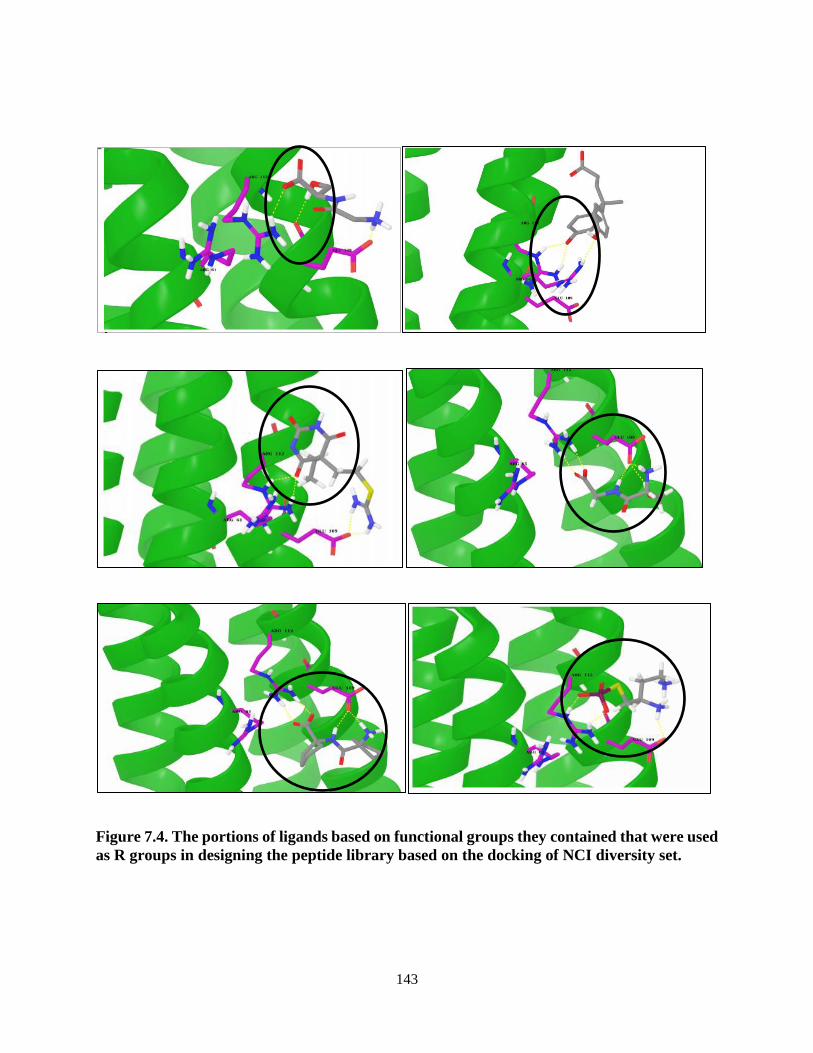
Figure 7.4. The portions of ligands based on functional groups they contained that
were used as R groups in designing the peptide library based on the
docking of NCI diversity set .............................................................................. 143
Figure 7.5. Ligand 1 shown to dock onto ApoE4 ................................................................ 144
Figure 7.6. The phosphate group interacts via H-bonds and pi interactions with
the Arg 112 and 61 ............................................................................................. 145
Figure 7.7. Ligand 2 shown to dock onto ApoE4 ................................................................ 146
Page 12
viii
Figure 7.8. The phosphate group interacts via H-bonds and pi interactions with
the Arg 112 and 61. The peptide vertically aligns with the helices ................... 146
Figure 7.9. Ligand 3 shown to dock onto ApoE4 ................................................................ 147
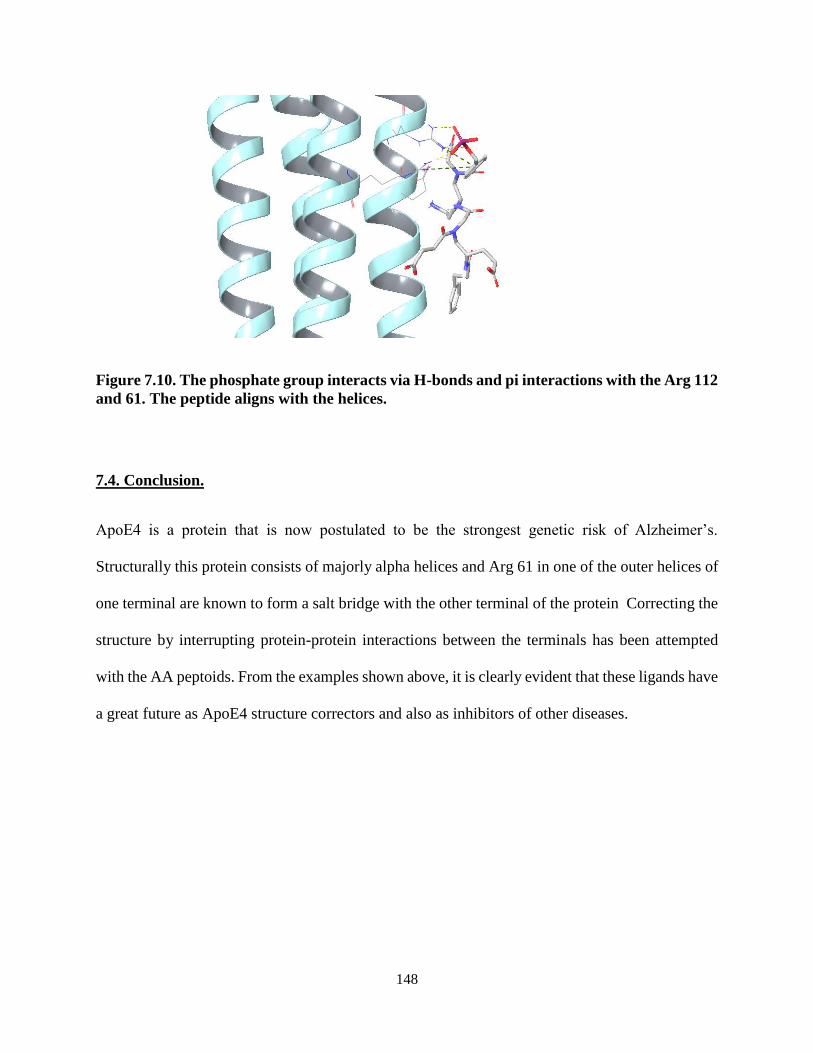
Figure 7.10. The phosphate group interacts via H-bonds and pi interactions with the
Arg 112 and 61................................................................................................... 148
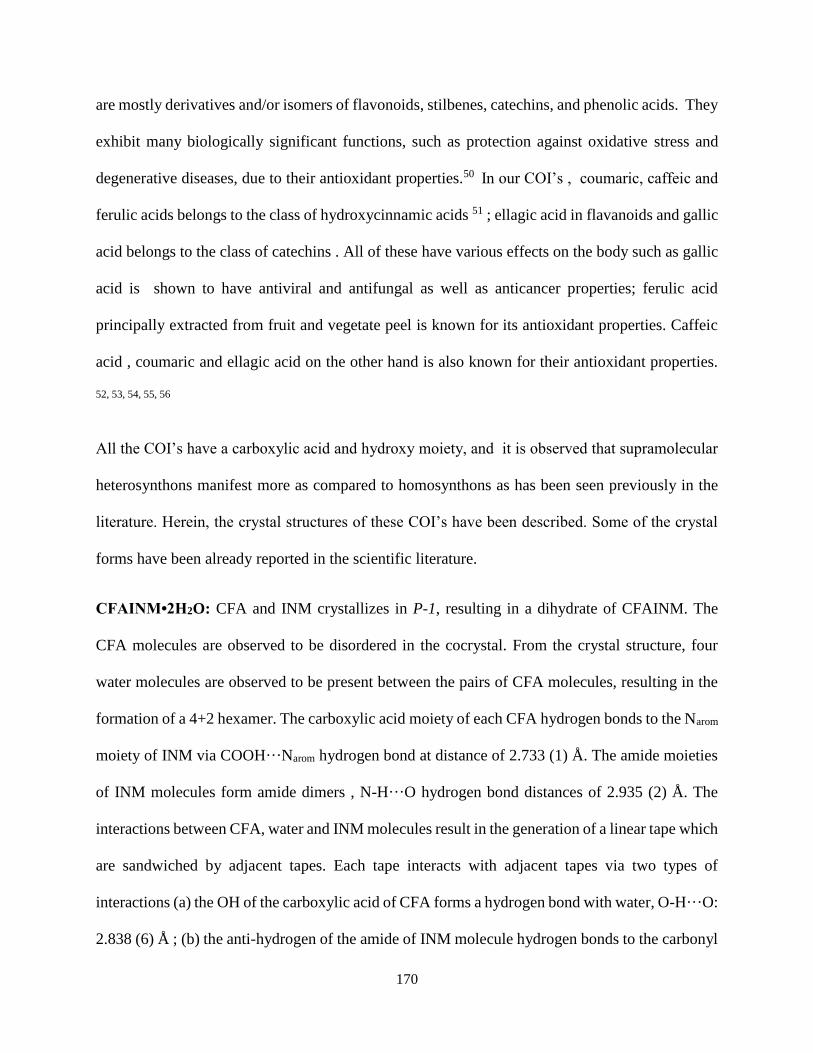
Figure 8.1. Illustration of intermolecular hydrogen bonding in CFAINM•2H2O ............... 171
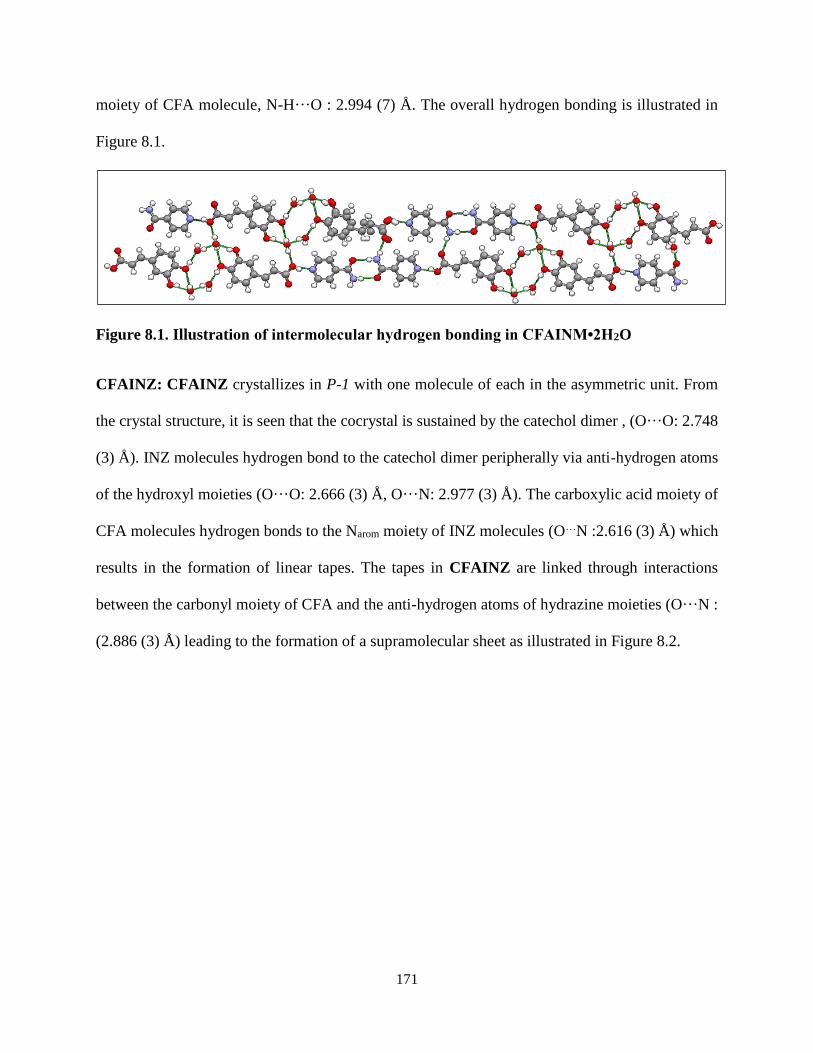
Figure 8.2. Illustration of the supramolecular sheet generated by intermolecular
interactions between adjacent hydrogen bonded tapes in CFAINZ ................... 172
Figure 8.3. (a) Crystal packing in GALINZ reveals form H-bonded tapes that are
sustained by COOH…Narom supramolecular heterosynthons
(b) Illustration of bilayers of GALINZ sheets ................................................... 173
Figure 8.4. (a) Phenolic homodimers of GAL molecules acts as a donor and an
acceptor to DMP molecules (b) trimeric motif involving two GAL
molecules and a DMP molecule (c) Crystal packing in GALDMP reveals
a 2D network of GAL and DMP molecules....................................................... 174
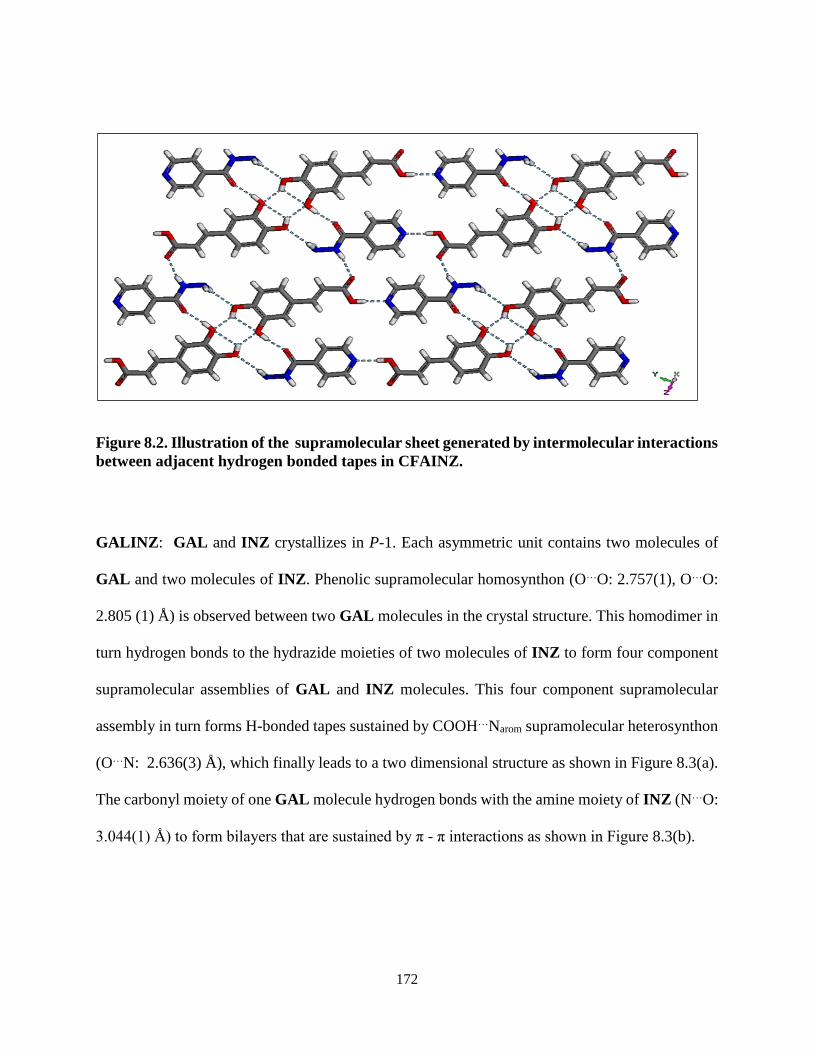
Figure 8.5. Crystal packing in GALADN reveals form H-bonded interactions between
the carboxylic acid moiety of GAL molecules and the aminopyridine
moiety of ADN molecules ................................................................................. 175
Figure 8.6. (a) Crystal packing in GALGAH reveals undulating tapes sustained by
dimers of GAL molecules linked by GAH molecules to form sheets
(b) Illustration of sheets interconnected by homodimers of GAH
molecules ........................................................................................................... 176
Figure 8.7. (a) Crystal packing in GALGAH reveals undulating tapes sustained by
dimers of GAL molecules linked by GAH molecules to form sheets
(b) Illustration of sheets interconnected by homodimers of
GAH molecules .................................................................................................. 177
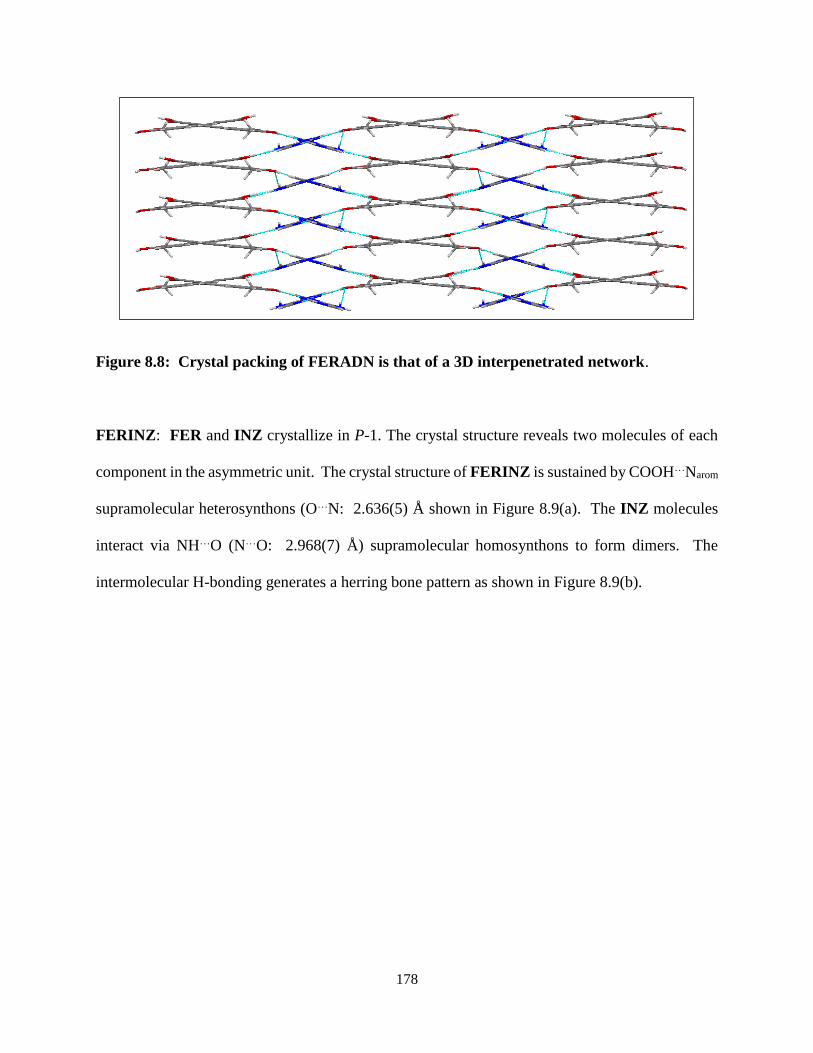
Figure 8.8. Crystal packing of FERADN is that of a 3D interpenetrated network .............. 178
Figure 8.9. (a) Crystal packing in FERINZ sustained by COOH…Narom
supramolecular heterosynthons (b) Herring bone pattern of FERINZ .............. 179
Figure 8.10. Crystal packing in FERURE reveals amide-amide supramolecular
homosynthons between URE molecules to generate tapes that are
interconnected by FER molecules ..................................................................... 180
Page 13
ix
Figure 8.11. Crystal packing in FERGAH reveals molecular tapes of amide-amide
supramolecular homosynthons between GAH molecules interconnected
by FER molecules .............................................................................................. 181
Figure 8.12. Crystal packing of FERTBR. H2O reveals that FERTBR
heterodimers are connected by water molecules ............................................... 182
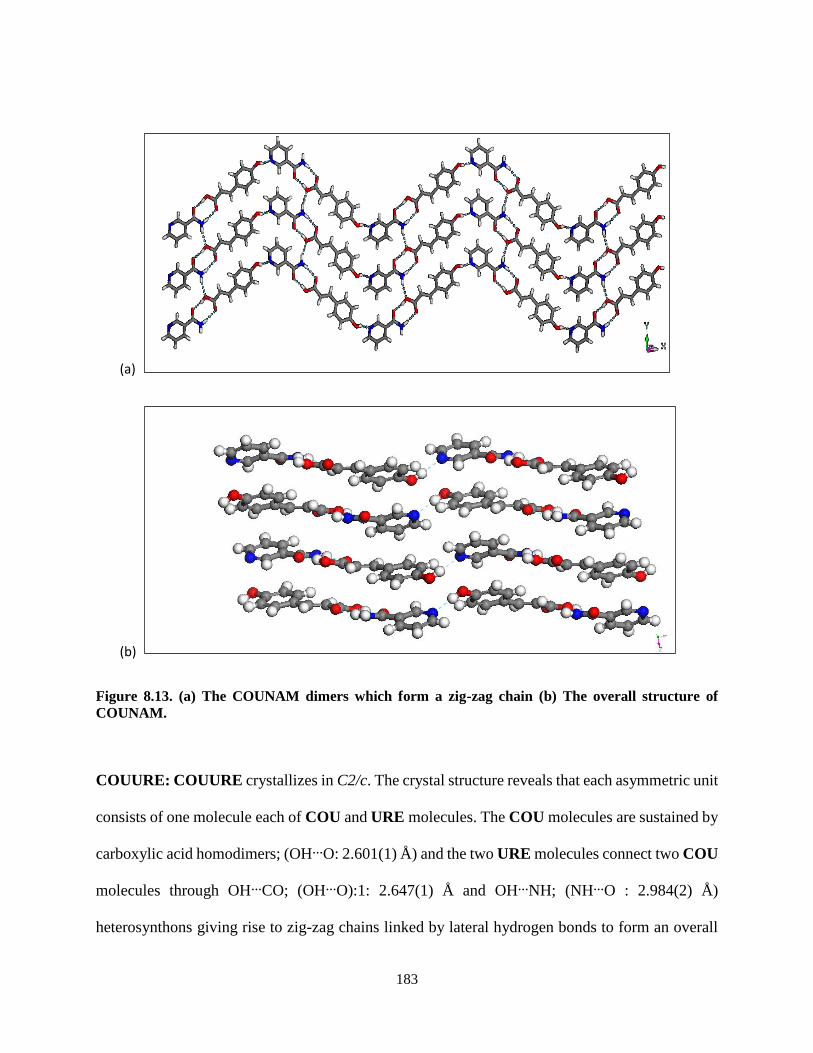
Figure 8.13. (a) The COUNAM dimers which form a zig-zag chain (b) The overall
structure of COUNAM ...................................................................................... 183
Figure 8.14. The overall crystal structure of COUURE ......................................................... 184
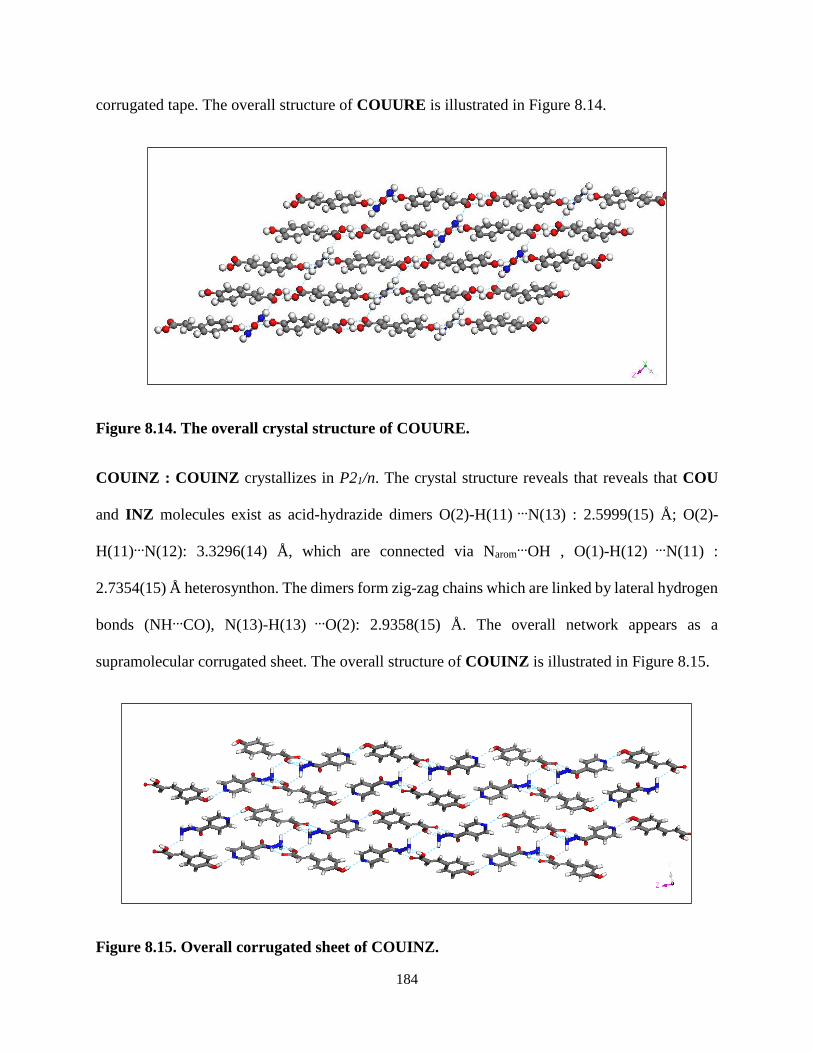
Figure 8.15. Overall corrugated sheet of COUINZ ................................................................ 184
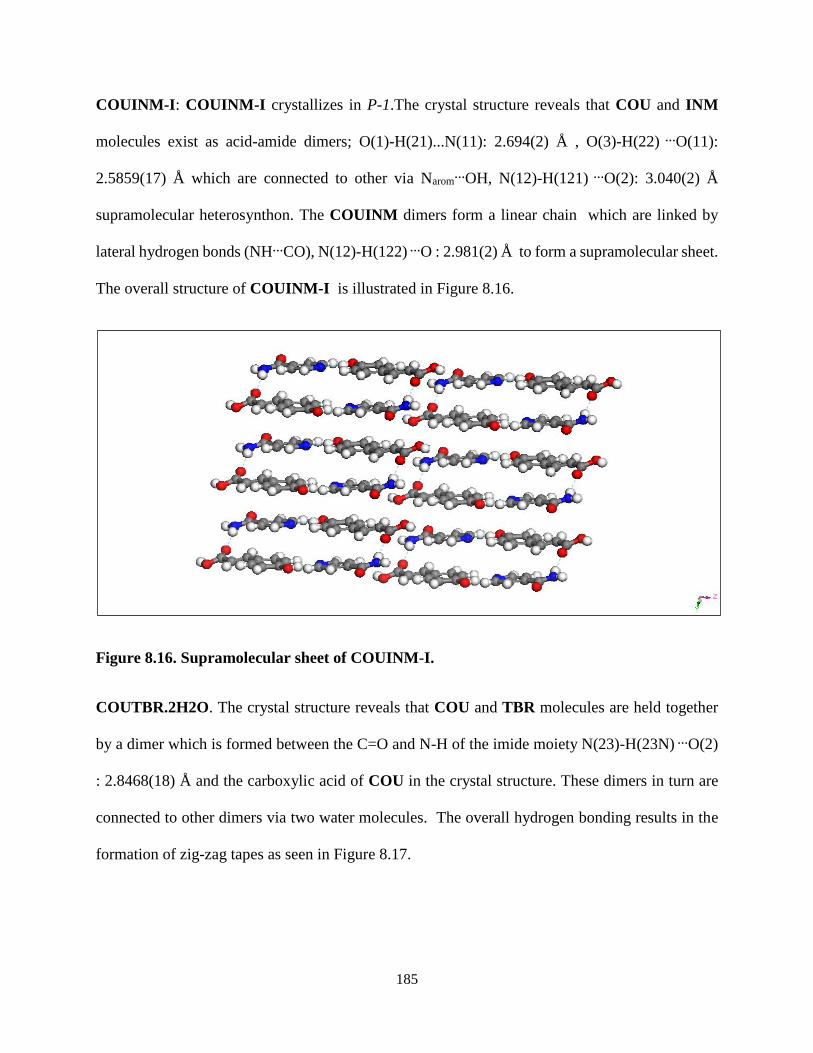
Figure 8.16. Supramolecular sheet of COUINM-I ................................................................. 185
Figure 8.17. The overall hydrogen bonding resulting in the formation of zig-zag
tapes in COUTBR .............................................................................................. 186
Figure 8.18. Supramolecular heterocatemers of ELACAP .................................................... 186
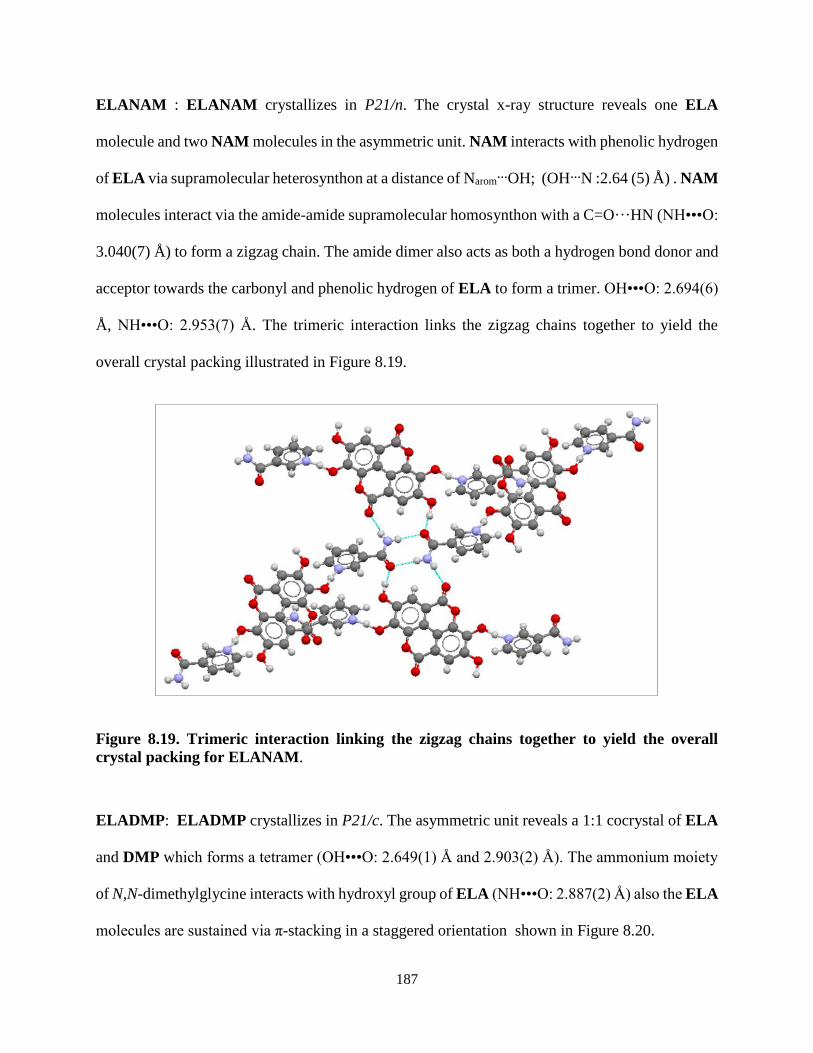
Figure 8.19. Trimeric interaction linking the zigzag chains together to yield the
overall crystal packing for ELANAM ............................................................... 187
Figure 8.20. Interactions between ELA and DMP ................................................................. 188
Figure 8.21. Intermolecular interactions between ELA and THP .......................................... 188
Figure 8.22. (a) Intermolecular hydrogen bonds in HCTNAM (b) Overall H-
bonding in HCTNAM ........................................................................................ 202
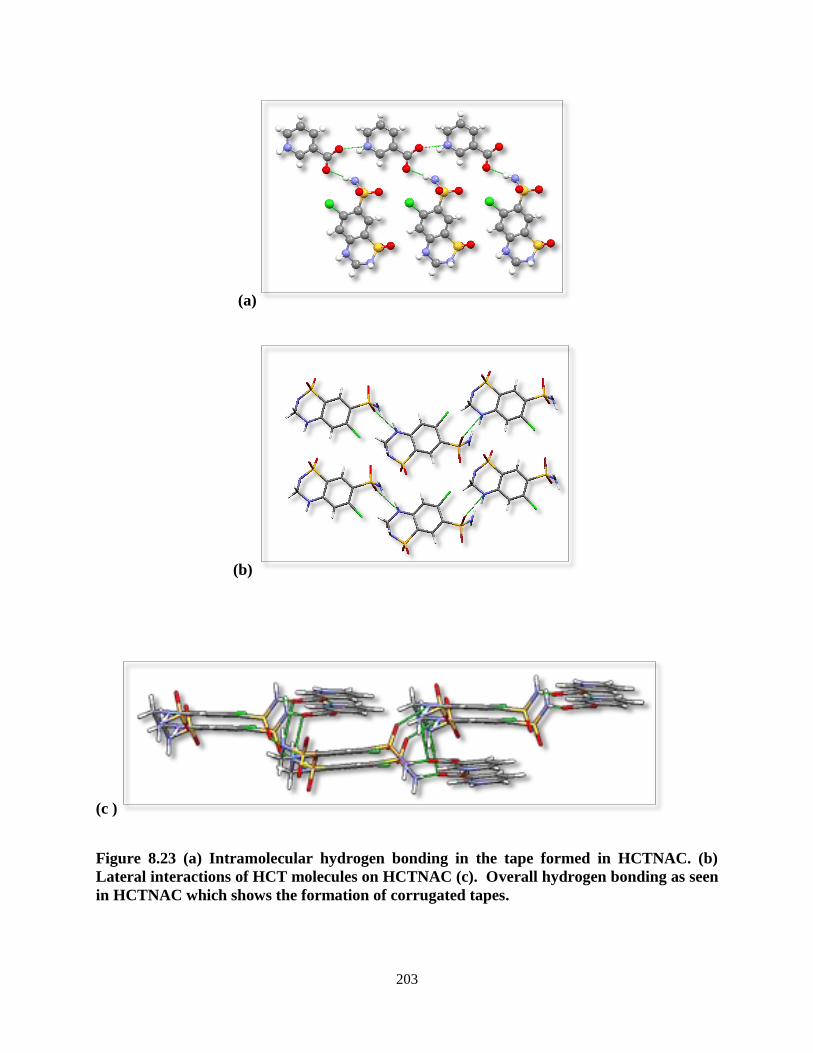
Figure 8.23. (a) Intramolecular hydrogen bonding in the tape formed in HCTNAC.
(b) Lateral interactions of HCT molecules on HCTNAC (c). Overall
hydrogen bonding as seen in HCTNAC which shows the formation of
corrugated tapes ................................................................................................. 203
Figure 8.24. (a) Hydrogen bonding between HCT and DMG in HCTDMG. (b)
Overall H-bonding in HCTDMG. HCT molecules are colored in green,
while two independent DMG molecules are colored in magenta and red ......... 205
Page 14
x
LIST OF TABLES
Table 2.1. Some Diseases with Possible STIM Involvement. ................................................31
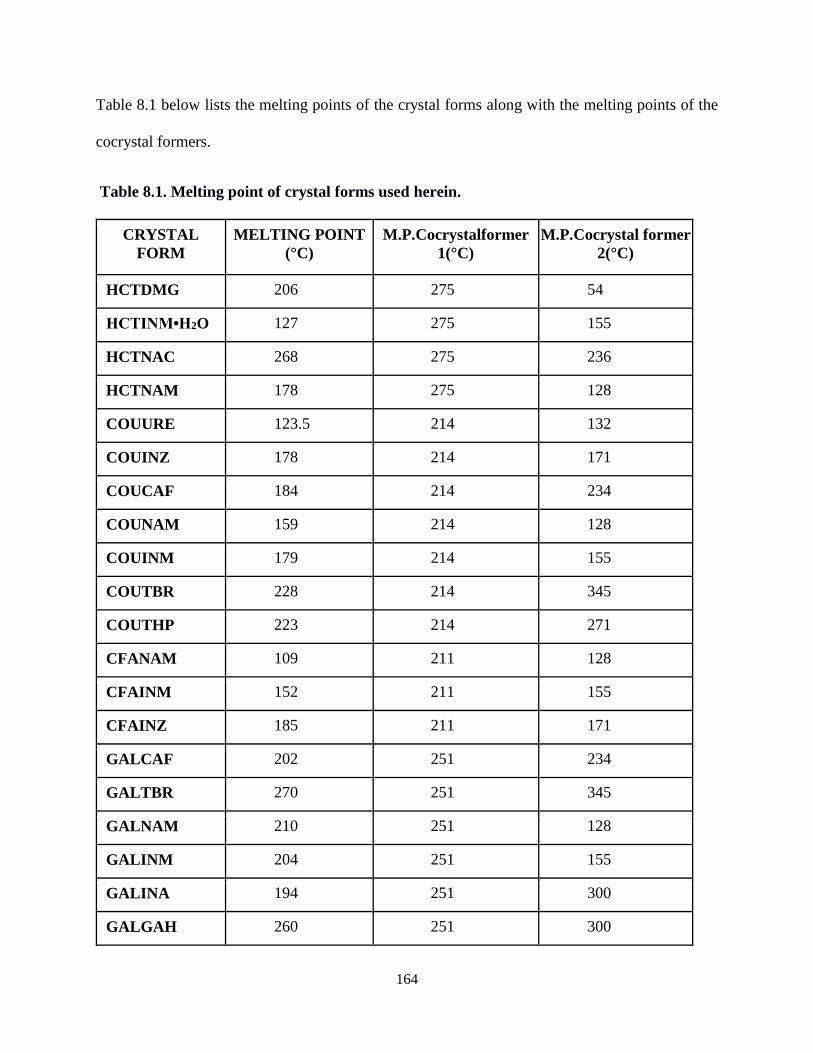
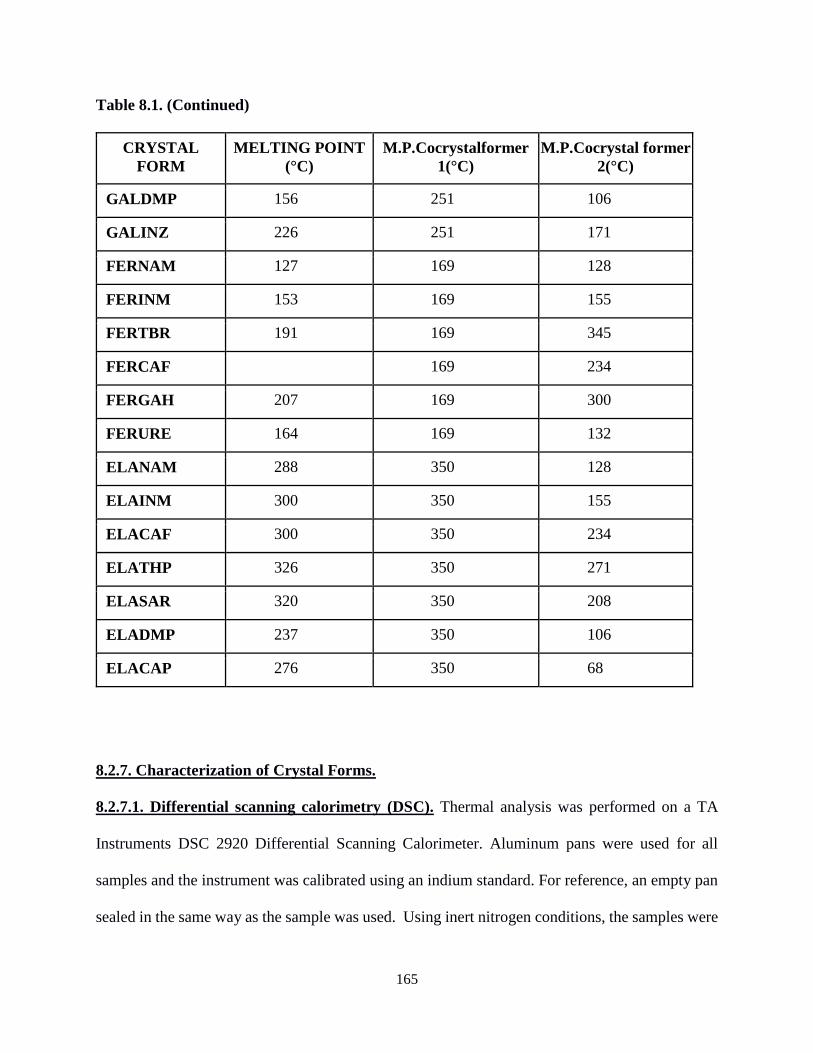
Table 8.1. Melting point of crystal forms used herein. .........................................................164
Table 8.2. CSD statistics of supramolecular synthons in the literature. ...............................168
Table 8.3. Crystallographic data and structure refinement parameters for the
cocrystals..............................................................................................................189
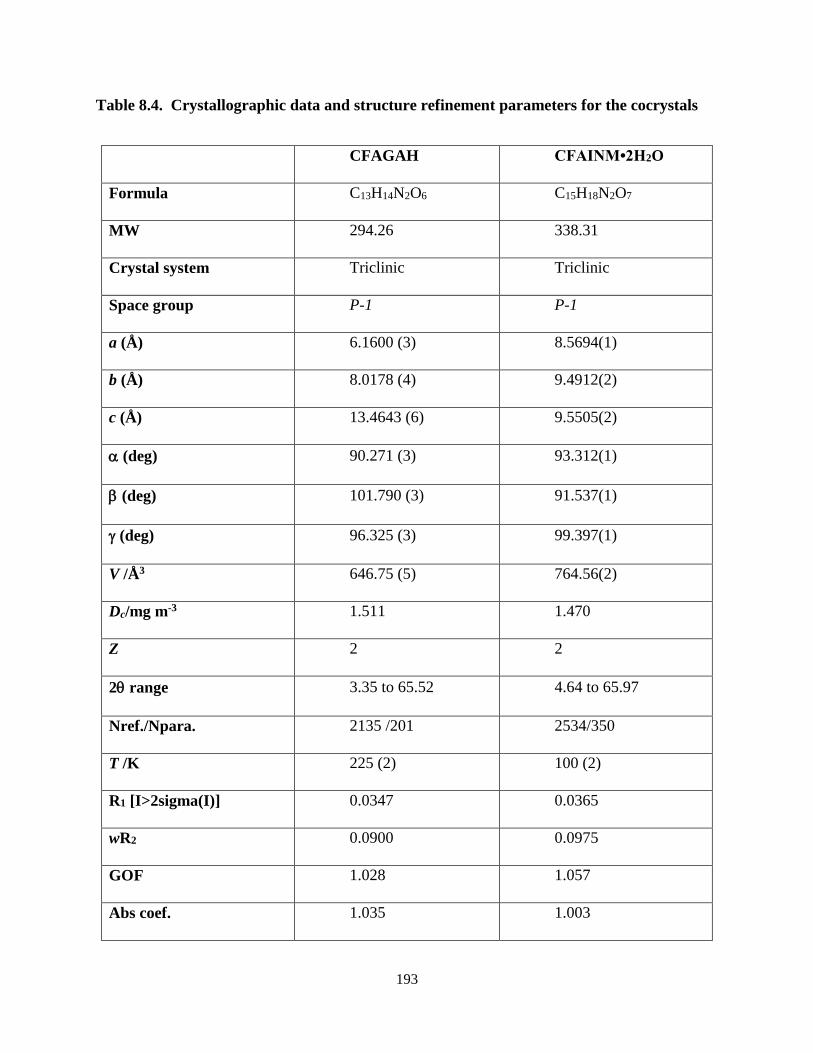
Table 8.4. Crystallographic data and structure refinement parameters for the
cocrystals .............................................................................................................193
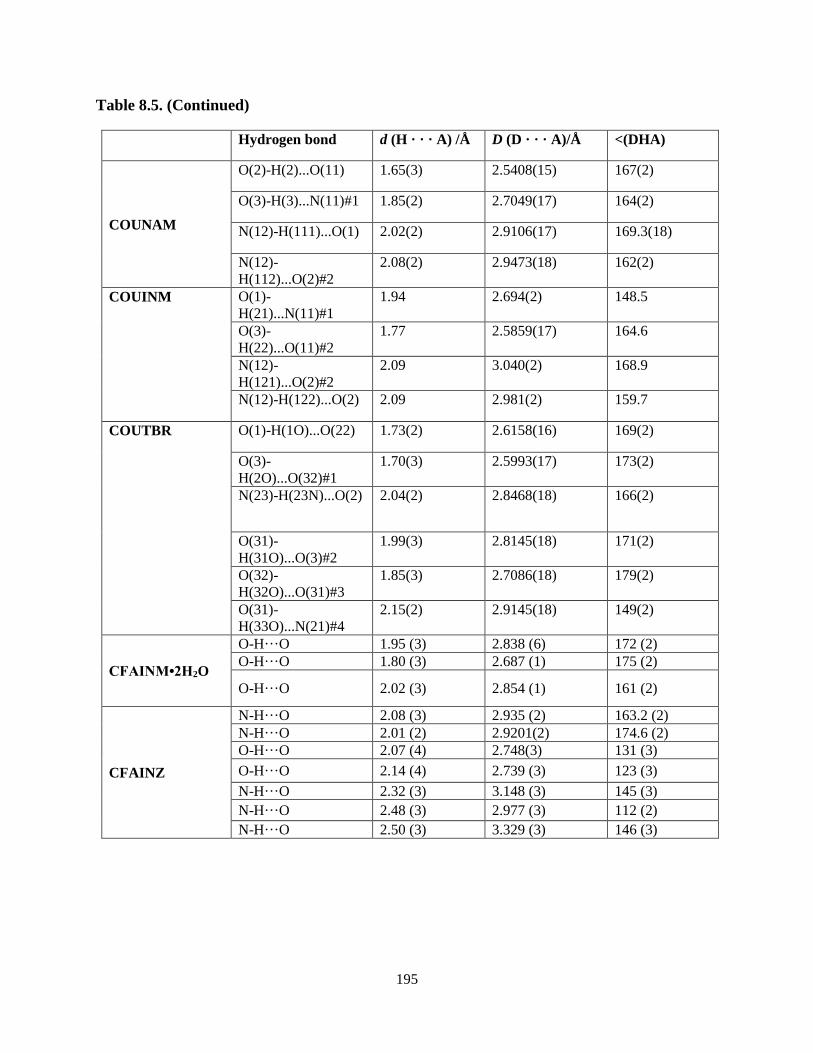
Table 8.5. Crystallographic data and structure refinement parameters for the
cocrystals .............................................................................................................194
Table 8.6. Crystallographic data and structure refinement parameters for the
cocrystals..............................................................................................................196
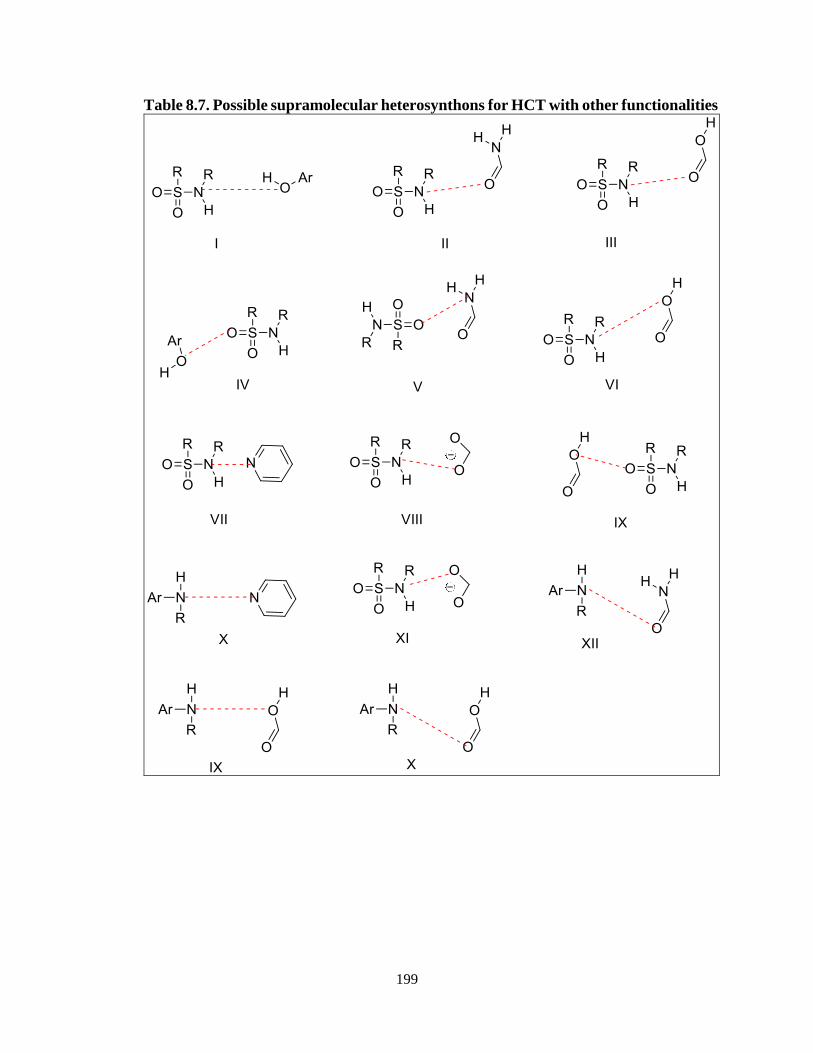
Table 8.7. Possible supramolecular heterosynthons for HCT with other
functionalities .......................................................................................................199
Table 8.8. CSD statistics of supramolecular synthons in HCT with different
functionalities .......................................................................................................200
Table 8.9. Crystallographic data and structure refinement parameters for the
cocrystals..............................................................................................................200
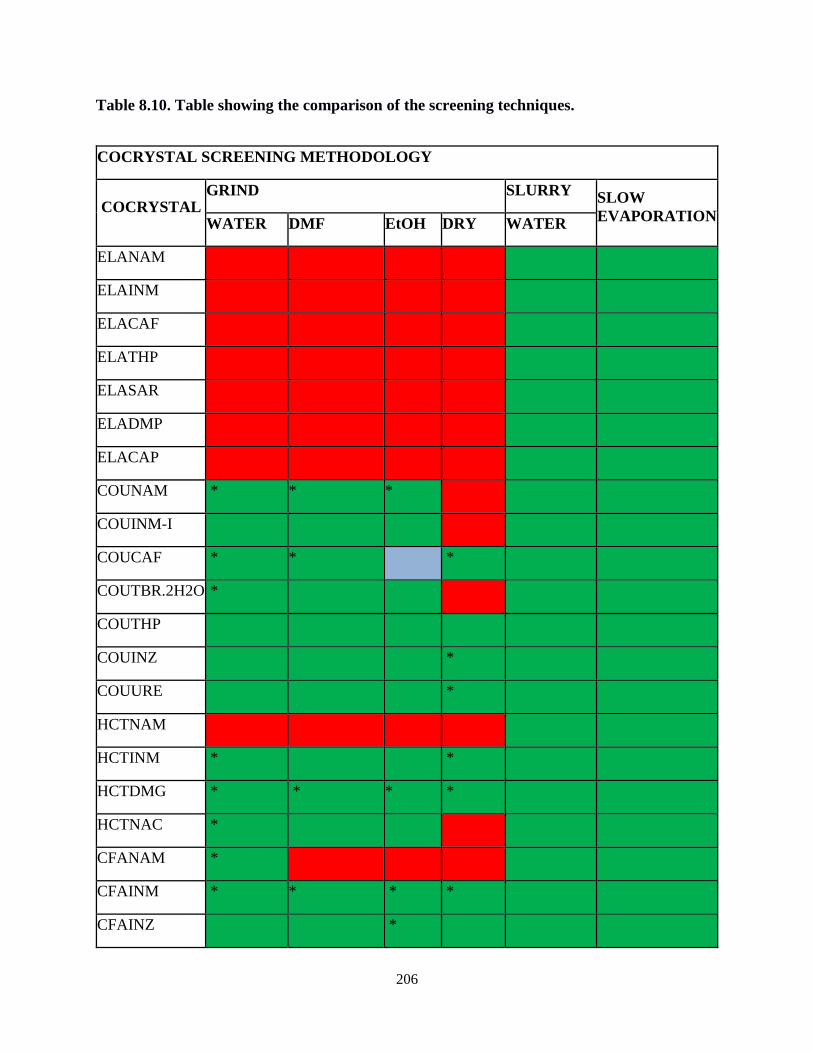
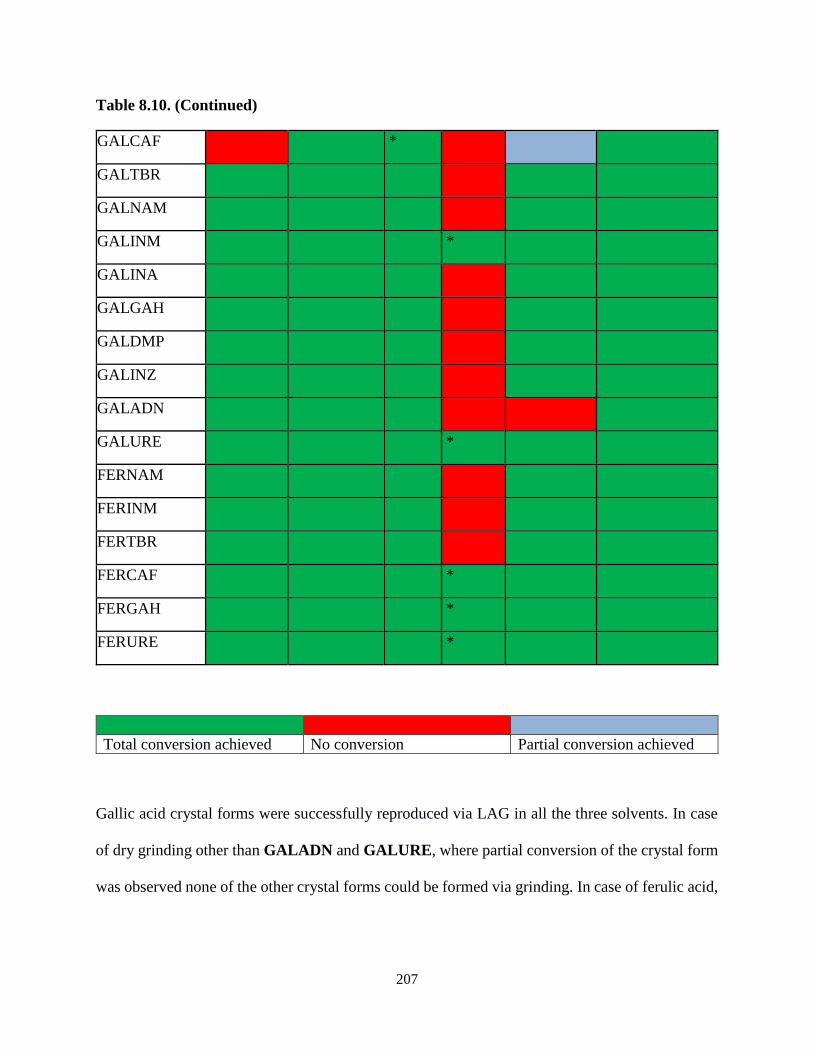
Table 8.10. Table showing the comparison of the screening techniques ................................206
Page 15
xi
LIST OF SCHEMES
Scheme 8.1. Chemical structures of compounds used herein...................................................157
Scheme 8.2. The principle synthons observed by the phenolic compounds ............................169
Scheme 8.3. Moieties used during CSD searches for HCT. .....................................................198
Page 16
xii
ABBREVIATIONS
STIM1- Stromal Interaction Molecule 1
PAD - Peptidyl Arginine Deiminase
SOCE- store-operated calcium entry
ER- Endoplasmic Reticulum
SAM- Sterile-Alpha Motif
CTL- Chymotrypsin-Like
VS- Virtual Screening
MD- Molecular Dynamics
Page 17
xiii
ABSTRACT
Calcium ions have important roles in cellular processes including intracellular signaling, protein
folding, enzyme activation and initiation of programmed cell death. Cells maintain low levels of
calcium in their cytosol in order to regulate these processes. When activation of calcium-dependent
processes is needed, cells can release calcium stored in the endoplasmic reticulum (ER) into the
cytosol to initiate the processes. This can also initiate formation of plasma membrane channels
that allow entry of additional calcium from the extracellular milieu. The change in calcium levels
is referred to as calcium flux. A key protein involved in initiation of calcium flux is Stromal
Interaction Molecule 1 (STIM1), which has recently been identified as a sensor of ER calcium
levels. STIM1 is an ER transmembrane protein that is activated by a drop in ER calcium levels.
Upon activation, STIM1 oligomerizes with a plasma membrane protein, ORA1, to form calcium-
selective plasma membrane channels. Dysregulation of calcium flux has been reported in cancers,
autoimmune diseases and other diseases. STIM1 is a promising target in drug discovery due to its
key role early in calcium flux. Here we review the involvement and importance of STIM1 in
diseases and we discuss STIM1 as a viable target for drug discovery using computational
chemistry methods to rapidly identify new molecules to target STIM1. Herein, computational
techniques were used to understand the mechanistic role of STIM1 and virtual screening is in
process to discover potential inhibitors of STIM1 activity. Also mutational analysis on STIM1
was performed computationally to see the effect it had on the protein computationally.
Page 18
xiv
It has been found that tumor cells and tissues, compared to normal cells, have higher levels of
copper and possibly other metal ions. This presents a potential vulnerability of tumor cells that can
serve as a physiological difference between cancer cells and normal cells and allows design of
compounds that selectively target tumor cells while sparing normal cells. Recently we have
identified compounds that have potential to inhibit the proteasome in tumor cells and induce cell
death by mobilizing endogenous tumor copper resulting in in cellulo activation of the compound.
These compounds hence act as pro-drugs, becoming active drugs in tumor cells with high copper
content but remaining essentially inactive in normal cells, thereby greatly reducing adverse effects
in patients. Such use would be of significant benefit in early detection and treatment of cancers, in
particular, aggressive cancers such as pancreatic cancer which is usually not detected until it has
reached an advanced stage. Six compounds were identified following virtual screening of the NCI
Diversity Set with our proteasome computer model followed by confirmation with a biochemical
assay that showed significant inhibition of the proteasome by the compounds in the presence of
copper ions. In a dose response assay, NSC 37408 (6, 7-dihydroxy-1-benzofuran-3-one), our best
compound, exhibited an IC50 of 3µM in the presence of 100 nM copper.
Chagas’ Disease, a parasitic disease caused by the parasite Trypanosma Cruzi, is endemic to Latin
America. The disease manifests itself in a short acute phase and a long chronic phase. Current
treatments are effective only in the acute phase and are not used in the chronic phase due to toxicity
of the drugs. Hence a new drug discovery approach was chosen for this disease. Cruzain is the
major etiologic enzyme involved in the disease and is only present in the parasite. It is also an
enzyme expressed by the parasite in both phases. Herein, a novel peptoid library containing
hydromethylketones was constructed and screened against a virtual structure of cruzain. The
peptoids thus found through this drug discovery effort can be used as potential drug candidates
Page 19
xv
against cruzain. Computational techniques will help achieve a high degree of specificity and aid
in proposing assays for determining compounds with high activity
Alzheimer disease is the most common form of dementia. Its pathogenesis incorporates many
potential targets for treatment. Among the targets identified, Apolipoprotein E4 (apoE4) is
especially interesting due to its catalytic role in the degradation and clearance of amyloid beta
(Aβ), a risk factor for Alzheimer disease. ApoE exists in 3 isoforms which directly impact its
functionality in the body. There are characteristic structural differences between them. In ApoE4
ionic interactions exist between Arg-61 and Glu-255 residues, unlike the other isoforms. Hence
interruption of this interaction by inhibitors may change the structure of apoE4 to a more linear
structure as observed in the other isoforms. Virtual screening of the NCI diversity set on an energy
minimized protein virtual structure was performed to identify potential small molecule inhibitors
and to gain further understanding of interactions that can be targeted to inhibit this protein. From
the top ligands in the NCI diversity set, a peptide library was designed to target the protein.
Previous research has indicated that liquid assisted grinding (LAG) is efficient and reliable for
cocrystal formation when compared to solvent crystallization and dimethyl formamide is the best
solvent for grinding. Herein, we report the comparison of four screening processes: Slurry, solvent
crystallization, LAG and dry grinding. Thirty-eight crystal forms containing the Narom··· COOH,
Narom···OH supramolecular heterosynthons were screened in the process, and it was observed that
slurry methodology is as efficient and reliable in forming cocrystals as solution crystallization.
Twenty-four new crystal forms were also isolated herein. LAG was found to be more efficient as
compared to dry grinding and was successful in the formation of twenty-five crystal forms of the
thirty-eight screened. Dimethyl formamide still remains the best solvent for LAG. All our slurry
experiments were performed in water and it was found that water can be used reliably for this
Page 20
xvi
method for compounds within a wide range of solubility, thereby increasing the versatility and
usability of this method for future screening procedures.
Page 21
1
CHAPTER ONE: INTRODUCTION.
1.1.Introduction.
1.1.1. Structure Based Drug Design.
Structure-based drug design is an important part of industrial drug discovery and is also the major
subject of research for many academic laboratories. This ability to rationally design drugs using
protein structures was unfathomable in the 1980’s. 1 And now with the advent of technology and
programming, with the completion of the human genome project and advent of newer fields such
as bioinformatics helped fuel structure-based drug design to aid in the discovery of new drug leads.
Advances in high-throughput crystallography, and structure determination using nuclear magnetic
resonance (NMR) has also seen a number of advances in the past years leading to the progress in
this field. 2, 3
Structure-based drug design is powerful when part of an entire drug discovery process. The
combination of combinatorial chemistry and structure-based design can lead to the synthesis of
enriched libraries which can be used as leads for a particular disease. 4 This process is iterative and
proceeds through multiple cycles before an optimized lead goes into phase I clinical trials.
One of the foremost steps in this process is the choice of a drug target which is governed by the
disease in question. Drug targets are usually proteins with defined binding pockets and sometimes
not. These proteins could be membrane associated. They could also be receptors such as G-protein
Page 22
2
coupled receptors or others. Small molecules can modulate the function of ion channels, proteases,
and kinases etc as drug targets. Small molecules are also designed to act as competitive or non
competitive inhibitors to modulate protein activity. 6 The goal is finally to modulate the function
of the human protein. For parasitic targets, enzymes are often excellent drug targets because
compounds can be designed to fit within the protein active site pocket. If the protein is unique to
the microbe or parasite then that offers a great hope of achieving not only specificity but likelihood
to not interfering with the human proteins. Cruzain, a cysteine protease found in the body of
Trypanosoma cruzi, which is the causal agent of a neglected disease called Chagas disease is such
a unique enzyme. Drug discovery on this protein has been described in a subsequent chapter herein.
Once a target has been identified, it is necessary to experimentally obtain crystal structures or
search the PDB databank, which are the most common source of structural information for drug
design. Incase of the absence of experimentally determined structure is available, a homology
model can be used for drug design.
Using the structural information obtained through the above techniques, the structure is then
prepared for drug design programs such as Protein Prep Wizard in Schrodinger by first adding
hydrogen atoms, usually absent in crystal structures determined with data at a resolution lower
than 1.0 Å. 6
Next process in this cycle continues with the identification of a potential ligand binding site on the
target molecule. Ideally, the target site is a pocket with potential hydrogen bond donors and
acceptors, hydrophobic characteristics, and sizes of molecular surfaces. The ligand binding site
can be the active site, as in an enzyme, an assembly site with another macromolecule, or an
important site necessary in the mechanism of the molecule.
Page 23
3
This is followed by use of computer-aided methods such as visual inspection, virtual screening,
and drug design to create and screen a library of compounds. In virtual screening, databases of
available small molecules are docked into the region of interest and scored based on predicted
interactions with the site. Finally, for drug design, small fragments of molecules, which could be
functional groups or bioisoteres are positioned in the site, scored, and linked in silico based on the
screenings. The final compounds, found are then to be synthesized in the laboratory. 6
For docking, many programs that allow protein flexibility and many do not. Docking also does not
take solvent effects in question nevertheless solvent plays an important role in ligand binding. A
few things that are done to model the effect of water include making the assumption that the
molecules are in a vacuum, i.e., no solvent modeling; using a fixed dielectric constant in estimating
electrostatic contributions; and using actual explicit solvation models to see how the protein
interacts in a water box. In general, increased accuracy comes with increased computational cost.
Sometimes, in the process of drug discovery, it becomes imperative to understand the mechanism
of action of the protein before understanding which area would be a good place for targeting.
Herein , chapters 1-3 focus on a calcium sensor protein , STIM1 which undergoes oligomerization
upon unfolding. Molecular dynamics has been used to study how the process of unfolding begins.
Structural changes observed in the beginning of unfolding helps understand which residues play
an important role in the process.
Once a small molecule has been identified as potentially binding to the target molecule, it must be
evaluated before proceeding with it. Screening scores are usually not indicative of a true binding
constant, but can give a very good idea of how well the ligand binds. Both the solvent effect and
the effects of target and ligand flexibility are usually imprecisely described and can be accounted
for by molecular dynamics which can help understand how the ligand protein complex stabilizes
Page 24
4
in an aqueous condition as in the human body. The Lipinski’s rule of five also helps determine and
reject lead, which states that good leads generally have less than five hydrogen bond donors and
less than ten hydrogen bond acceptors, a molecular weight less than 500, and a calculated log of
the partition coefficient (clogP) less than 5.6 Another approach in modifying ligands includes
rigidifying the lead which imparts a lower binding constant by decreasing the conformational
entropy.
The following step after ligand determination, is biochemical evaluation, which helps evaluate
which ligands actually have good binding affinities towards the protein. Determination of lead
molecules via biochemical assays were performed herein on the proteasome, a cancer target and a
few lead compounds with greater than 80% inhibition were found. This has been discussed in
details in chapter 5 with the proteasome.
Promising leads reenter the structural determination process to find the exact binding mode and
physico-chemical properties and to evaluate any further optimization before processing to clinical
trials. Different kinds of compounds such as small molecules under 500 D molecular mass or
peptidic compounds or peptoidic compounds, or natural compounds can act as inhibitors of a
protein.
1.1.2. Protein and Peptide mimics.
Proteins are the most abundant biological molecules in the body. Most of the biological functions
in the cells and effects on the biological pathways and genetic expressions are controlled by
proteins. Proteins are built from a set of 20 different amino acids with different side chains. Every
amino acid is a -amino acid which has carboxylic acid, amino group, and its side chain. The
presence of carboxylic acid and amino group makes amino acids act as zwitterions. A peptide bond
Page 25
5
is formed by removal of water from carboxylic acid of one amino acid and amino group of another
amino acid and helps in formation of a dipeptide. When many amino acids bond together, they
start forming polypeptides which then result in protein formation. Hence, the primary structure of
a protein is the linkage of individual amino acids via peptide bonds. The secondary structure of
protein forms when the primary structure starts folding in three different patterns: the -helix, the
-pleated sheet, and the -turn. The tertiary structure of proteins is the three-dimensional formation
of these secondary structures to form stable and ordered forms which fold into domains and create
binding pockets. The quaternary structure of proteins refers to the arrangement of these subunits
in three-dimensional complexes. 7, 8
The protein-protein interactions (PPIs) plays a key role in aspects of biological processes. Hence,
abilities of controlling or inhibiting PPIs can give us advantages like better understanding of
biological systems, development of new diagnostic approaches for health or disease, and
establishment of novel molecular therapeutics which can efficiently interrupt these interactions. In
various proteins, -helices which are present in 30 % of all proteins mediate protein-protein
interactions. Hence, mimicking -helical templates is viable target for drug design. And over the
years different types of alpha helix mimetics such as short oligomers, non peptidic molecules and
scaffolds have been developed to interact with alpha helices in the body. Nevertheless, peptides
are not therapeutically appropriate forms because of their poor transport properties and easy
proteolytic cleavage. 5, 6, 7
-hairpins like alpha helices are another important secondary structure element and also occur in
native polypeptides and proteins like oxytocin and vasopressin and. Based on this, the first -
hairpin model system was built in 1993 as shown in Figure 1. 12
Page 26
6
Figure 1.1. ß Hairpin structure.
This resulted in the development of recent well-defined - -secondary structures. To prevent
proteolytic degradation, peptoids or peptidomimentics, new class of compounds which contain
modified side chain positioning from the alpha carbon to the amide nitrogen or repetition of N-
substituted glycine units were made in the 1980’s. Nevertheless, due to poor pharmacokinetic
properties, developing peptidomimetics close to poly peptide structure with the chemical diversity,
spacing of side chains, a polar backbone, and the resistance to proteolysis is one of crucial tasks in
drug discovery. This slight change of structures leads to the loss of a hydrogen bond donor (the
NH group) and chiral center at the -carbon and the gain of flexibility. Also, it prevents peptoids
from proteolysis. Peptoid mimetics play an important role in drug discovery because of the fast
synthesis and structural similarity to polypeptides. Many researchers already have worked on the
design and application of peptoid mimics of bioactive molecules and will continue to pursue the
same goal.
In late 1990s, the Gellman group introduced the field of foldamers which are unnatural oligomers
which can fold in a certain fashion and copy the behaviors like biopolymers. Hybrid peptoid-
peptide ligands are examples of peptoids which were first reported in 1994. The research of
Page 27
7
peptoid-peptide hybrid structures has been thrived in development of peptidomimetics and will
provide more ligands with interesting bioactivities in the future. 13
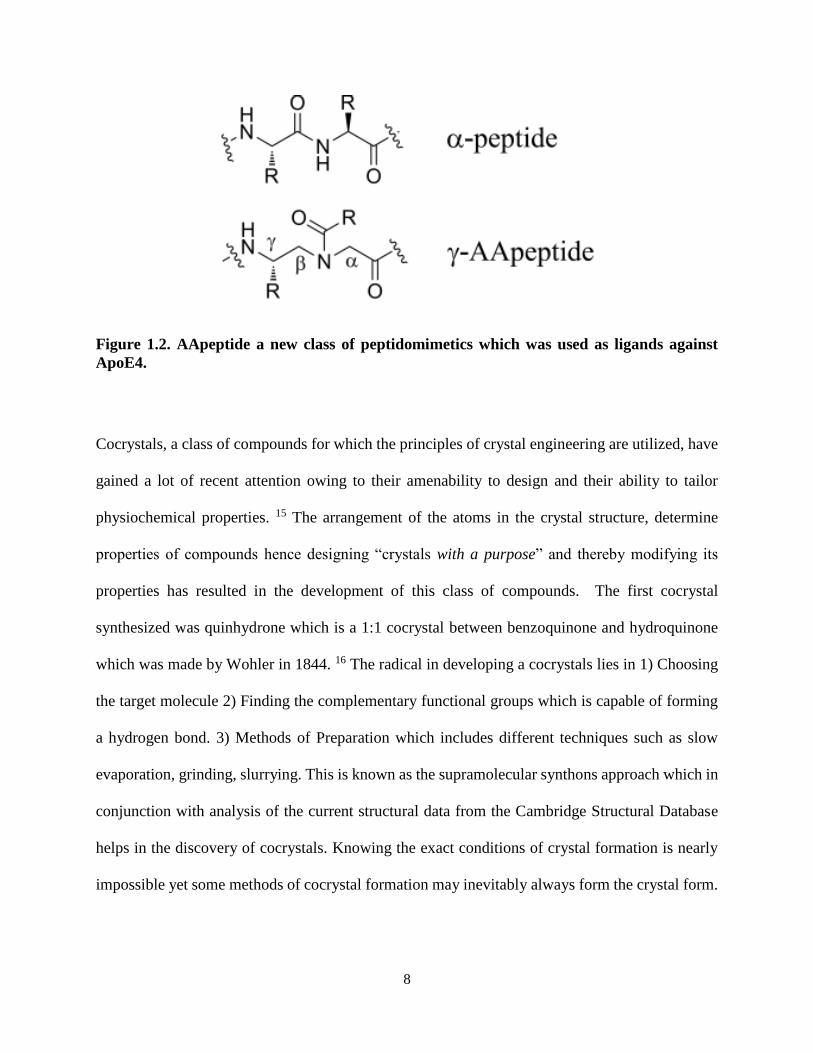
In pursuing the development of new peptidomimetics and related enabling synthetic technologies,
another new class of peptide mimics termed “γ-AApeptides” containing N-acylated Naminoethyl
amino acid units derived from γ- PNAs is shown in Figure 2. In each unit (building block), the
chiral side chain is from a α-amino acid, and the other side chain can be got through acylation of
the backbone nitrogen with various carboxylic acids or acyl chlorides. That is to say, γ-AApeptides
essentially project an identical number of functional groups as α-peptides of the same length. γ-
AApeptides are highly resistant to proteolytic degradation making them promising candidates for
modulation and perturbation of biological processes. For instance, some γ-AApeptides can
permeate mammalian cell membranes, modulate p53/ MDM2 protein-protein interactions, and can
also selectively disrupt bacterial membranes by mimicking the behavior of natural host-defense
peptides. Herein structure based drug design was used on a protein ApoE4 , an Alzheimer’s target
to create and screen a library of these peptides to find a suitable ligand to inhibit PPI’ s the protein
forms.
Page 28
8
Figure 1.2. AApeptide a new class of peptidomimetics which was used as ligands against
ApoE4.
Cocrystals, a class of compounds for which the principles of crystal engineering are utilized, have
gained a lot of recent attention owing to their amenability to design and their ability to tailor
physiochemical properties. 15 The arrangement of the atoms in the crystal structure, determine
properties of compounds hence designing “crystals with a purpose” and thereby modifying its
properties has resulted in the development of this class of compounds. The first cocrystal
synthesized was quinhydrone which is a 1:1 cocrystal between benzoquinone and hydroquinone
which was made by Wohler in 1844. 16 The radical in developing a cocrystals lies in 1) Choosing
the target molecule 2) Finding the complementary functional groups which is capable of forming
a hydrogen bond. 3) Methods of Preparation which includes different techniques such as slow
evaporation, grinding, slurrying. This is known as the supramolecular synthons approach which in
conjunction with analysis of the current structural data from the Cambridge Structural Database
helps in the discovery of cocrystals. Knowing the exact conditions of crystal formation is nearly
impossible yet some methods of cocrystal formation may inevitably always form the crystal form.
Page 29
9
Herein, chapter 8 discusses the significance of such a technique, slurrying in water which has been
seen to form cocrystals crystallized in various conditions.
1.2. References.
(1) Mountain, V. Chem. Biol., 2003, 10, 95–98.
(2) Zheng, D.; Huang, Y.; Moseley, H.; Xiao, R.; Aramini, J.; Swapna, G.; Montelione,G.
Protein Sci., 2003, 12 , 1232–1246.
(3) Bailey-Kellogg, C.; Widge, A.; Kelley, J.; Berardi, M.; Bushweller, J.; Donald, B. J.
Comput. Biol. 2000, 7 , 537–558.
(4) Antel, J. Curr. Opin. Drug Discov. Dev., 1999, 2, 224–233
(5) Anderson, A.C. Chemistry & Biology, 10, 2003, 787–797.
(6) Lipinski, F. Lombardo, B. Dominy, P. Feeney. Adv. Drug Deliv. Rev., 23 1997, 3–25
(7) Nelson D. L., Cox M. M. 4 th Edition. W. H. Freeman and company, New York. 2005; 75-
85.
(8) Patrick G. L. 2nd Edition. Oxford university press. New York. 2005; 24-32.
(9) Fairlie D. P., West M. L., Wong A. K. Curr. Med. Chem. 1998; 5: 29-62.
(10) Bullock B. N., Jochim A. L., Arora P. S. J. Am. Chem. Soc. 2011; 133: 14220-
14223.
(11) Edwards T., Wilson A. Amino Acids. 2011; 41: 743-754.
(12) Kritzer J. A., Lear J. D., Hodsdon M., Schepartz A. J. Am. Chem. Soc. 2004; 126:
9468-9469.
(13) Hyun Joo Kill , USF dissertation. 2014.
(14) Wu, H.; Teng, P.; Cai, J . Eur. J. Org. Chem. 2014, 1760–1765
Page 30
10
(15) (a) Etter, M. C. J. Am. Chem. Soc. 1982, 104, 1095-1096.(b) Desiraju, G. R. Crystal
Engineering: The Design of Organic Solids; Elsevier: Amsterdam, 1989.
(16) Wöhler F. Annalen.1844, 51, 153.
Page 31
11
CHAPTER TWO: STROMAL INTERACTION MOLECULES AS IMPORTANT
THERAPEUTIC TARGETS IN DISEASES WITH DYSREGULATED CALCIUM FLUX.
From “Stromal interaction molecules as important therapeutic targets in diseases with dysregulated
calcium flux," Sreya Mukherjee, Wesley Brooks 2014, BBA, 1843, 10, 2307-2314. Copyright
2014 by Sreya Mukherjee. (Elsevier Journal)
2.1. Introduction.
Calcium (Ca2+) and magnesium (Mg2+) ions are useful ubiquitous ions in biology. They both have
an oxidation state of +2 which gives them greater strength in interacting with anionic complexes
compared to sodium, potassium or other monocations. Therefore, Ca2+ and Mg2+ fill important
roles in processes that require control of larger molecules such as protein folding (Ca2+) and
coordinating ATP (Mg2+). Ca2+ and Mg2+ have evolved into different functions in cells, sometimes
countering each other. Mg2+ is the eleventh most abundant element in the body and interacts with
phosphates in DNA, RNA, ATP and other phosphate-containing molecules, enhancing the mobility
and flexibility of the molecules by countering their anionic charges. Therefore, Mg2+ is routinely
more ubiquitous in the cell. Ca2+, on the other hand, is the fifth most abundant element in the body
but 99% of it is sequestered in bone. Among the roles for Ca2+, a major role is acting as a secondary
signal to convert signals from the extracellular environment into specific intracellular responses.
Also, Ca2+ is involved in the rapid depolarization of cells in neurons and muscle cells. These
actions need to be tightly controlled. Therefore, Ca2+ is kept at low levels in the cell’s cytosol until
needed. However, in order to rapidly respond when Ca2+ is needed, Ca2+ is stored in the
Page 32
12
endoplasmic reticulum (ER) and mitochondria for quick release that initiates Ca2+ dependent
actions.
2.2. Calcium flux.
2.2.1. Calcium dependent processes.
Calcium ions play vital roles in a variety of important physiological functions of the cell, including
control of cell cycle progression, cell differentiation, mitosis, apoptosis, ETosis, cell mobility,
macrophage activation, chromatin packaging & modifications, protein folding and control of
potassium & calcium channels. Often Ca2+ is serving as a secondary messenger, conveying an
external signal received through ligand/receptor binding, into specific responses within the cell.
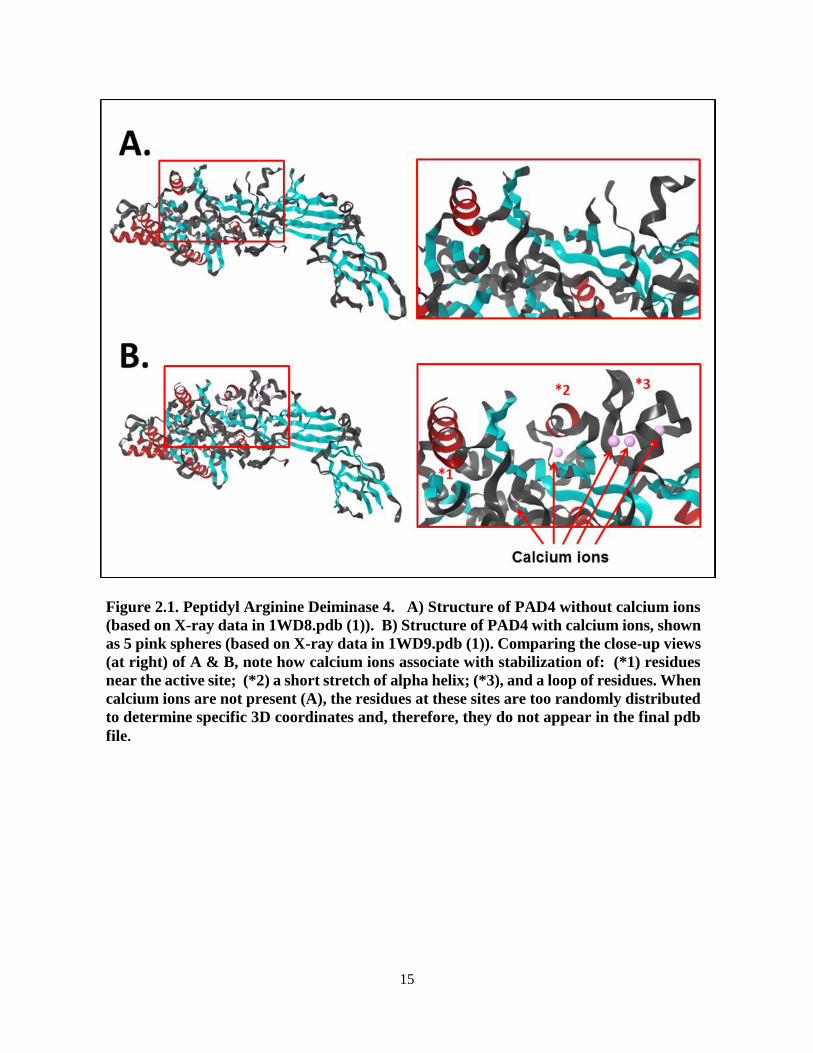
Several of these roles of Ca2+ can be exemplified by human peptidyl arginine deiminase 4 (PAD4),
a calcium-dependent enzyme. PAD4 is inactive until it binds Ca2+ (enzyme activation). The
structures of inactive PAD4 and active PAD4 have been published (shown in Figure 1).
1Comparison of inactive PAD4 and active PAD4 shows stabilization of residues including around
the active site (protein folding) (Figure 1). When active, PAD4 can convert arginine residues to
citrulline, such as in histones (Figure 2). 2 This reduces the histone-DNA interactions and alters
chromatin for gene activation or permanently alters chromatin as part of calcium-dependent
programmed cell death (apoptosis and ETosis). 3, 4
2.2.2. Calcium storage and release.
PAD4 involvement in apoptosis demonstrates a critical need for control of intracellular Ca2+ in
order to prevent inappropriate activation of calcium-dependent processes. To prevent such aberrant
events, the available Ca2+ is kept at approximately 100 nM in the cytosol, whereas in the
Page 33
13
extracellular environment, Ca2+ is typically at 1 mM or greater. Regulation of intracellular Ca2+
involves: 1) Ca2+ release from intracellular organelles, such as the ER and mitochondria, 2) Ca2+
entry from the extracellular environment, and 3) reestablishment of stored Ca2+ levels and lower
cytosolic Ca2+. These processes are referred to as calcium flux. One process that can connect stored
Ca2+ release and extracellular Ca2+ entry is called store-operated calcium entry (SOCE). 5 In SOCE
an initial event, such as a ligand binding to a receptor, triggers release of stored Ca2+ from the ER.
One example is when a G protein-coupled receptor (GPCR) binds its ligand which activates
phospholipase C (PLC) to convert phosphatidyl inositol 4,5-bisphosphate (PIP2) to inositol 1,4,5-
trisphosphate (IP3). IP3 then traverses through the cytosol to the ER membrane surface where it
activates the IP3 receptor (IP3R). The IP3R receptor is a family of ER transmembrane proteins
(IP3R types I, II and III) that, upon activation, can open as a channel to release Ca2+ into the cytosol
6, 7. Another family of ER transmembrane proteins, the ryanodine receptor (RyR-1, RyR-2), are
also Ca2+ channels for release of ER stored Ca2+ 8, 9. Both IP3R and RyR are strongly biased towards
Ca2+ release as opposed to monocations. IP3R is the dominant responder when ER Ca2+ release is
needed. The PLC activation that results in IP3 which activates IP3R can begin from a number of
different plasma membrane receptors but GPCRs, with their great variety of sequences and ligands,
are very frequently the initiators. RyRs, on the other hand, respond to Ca2+, such as inflow of
extracellular Ca2+, which activates RyR opening to release ER stored Ca2+. The actual activation
of the IP3R and RyR channels is dependent on spatial and temporal differences in the Ca2+ flow
and concentrations. For example, within the ER lumen, Ca2+ aids in the folding of nascent proteins
that are destined for extracellular exposure and, therefore, there is a focus of Ca2+ in the ER lumen
at those sites where signal recognition particle (SRP) receptors are docked with actively translating
ribosomes. The spatial and temporal differences in Ca2+ are often referred to as waves or
Page 34
14
oscillations and the intensity and persistence of the wave can impact the strength and duration of
the activity of ER Ca2+ channels which then impacts the cytosolic and nuclear Ca2+-dependent
activities. Cytosolic Ca2+ can affect the ER Ca2+ release channels but, as research continues, we
are learning that some proteins can also influence the channels, giving further complexity to the
secondary messenger activity of Ca2+ . 10 Another purported ER Ca2+ release channel is presenilin
(PS). This is a family (PS-1, PS-2) of multi-pass ER transmembrane proteins that is purported to
coordinate the expression, induction and activity of IP3R and RyR channels in order to control Ca2+
homeostasis. 11. PS may also work to control the IP3 available that could trigger IP3R activation.
In addition, PS has been proposed as a means of controlling the activity of the smooth ER calcium
ATPase (SERCA) channel that pumps Ca2+ into the ER in an energy-dependent process that
restores the ER Ca2+ levels in preparation for the next round of Ca2+ release. And so PS may control
and coordinate the activities of IP3R, RyR and SERCA to maintain Ca2+ homeostasis in the ER.
PS is referred to as a slow leak Ca2+ channel since it can allow some Ca2+ movement as it
continually fine-tunes Ca2+ in the ER.
Page 35
15
Figure 2.1. Peptidyl Arginine Deiminase 4. A) Structure of PAD4 without calcium ions
(based on X-ray data in 1WD8.pdb (1)). B) Structure of PAD4 with calcium ions, shown
as 5 pink spheres (based on X-ray data in 1WD9.pdb (1)). Comparing the close-up views
(at right) of A & B, note how calcium ions associate with stabilization of: (*1) residues
near the active site; (*2) a short stretch of alpha helix; (*3), and a loop of residues. When
calcium ions are not present (A), the residues at these sites are too randomly distributed
to determine specific 3D coordinates and, therefore, they do not appear in the final pdb
file.
Page 36
16
2.2.3 Entry of extracellular Ca2+
Cells have several types of channels that are Ca2+ permeable and, in some cases, Ca2+ selective.
Among these channels are: voltage gated channels, transient receptor potential (TRP) channels,
and the ORAI channels. The voltage-gated Ca2+ channels are a diverse group of multi-subunit
transmembrane proteins that react to cell membrane depolarization and facilitate calcium influx 12.
Figure 2.2. Deimination Reaction of PAD4. PAD4 can convert peptidyl arginine residues
to citrulline in proteins, such as histones. Deimination, also referred to as citrullination,
reduces the positive charge of arginine to a neutral citrulline. In the case of histones, this
can loosen their interactions with DNA. PAD4 can also convert methylated arginine
residues and PAD4 can undergo self-deimination, potentially inactivating itself. (2)
Page 37
17
These are primarily found in excitable cells such as neurons. Much of the difference in activity of
these channels relates to the combinations of subunits incorporated into a particular voltage-gated
Ca2+ channel. For example, the transmembrane α1 subunit has at least 10 different analogs. These
subunits can dictate the selectivity and rate of Ca2+ entry. The cytosolic β subunits can affect the
duration of channel opening. Both the α1 and β subunits can be regulated by phosphorylation.
The TRP channels are members of the super family of transient receptor potential channels
(subfamilies: TRPC, TRPV, TRPM, TRPA, TRPP, TRPML) that are, in general, Ca2+ permeable
but they can also facilitate movement of Na+ 13. Similar TRPs are found across many species and
mammals have TRPs from each of the subfamilies except TRPN. These channels can react to a
broad range of stimuli including, in the case of the TRPV subfamily, thermal changes. The stimuli
can act directly by ligand activation from binding of small molecules (ex. capsacin) or indirectly
by PLC that has been activated by receptor tyrosine kinases 13. As an example of the TRP
subfamilies, in the TRPV channels, TRPV5 (found primarily in kidney cells) and TRPV6 (found
primarily in the small intestines and to a lesser extent in the esophagus, colon, prostate, and
placenta) are the most Ca2+ selective members of the TRPV family. Expression of TRPV5 and
TRPV6 is upregulated by vitamin D 14. There are multiple means of regulating TRPV5 and TRPV6
by both extracellular calcitropic factors (such as increased TRPV5 activity due to Klotho, tissue
kallikrein and/or changes in pH in pro-urine) and intracellular factors (such as endosomal recycling
to the cell surface of sequestered TRPV5 to increase active TRPV5) 15, 16.
The ORAI channels are highly selective for Ca2+ entry and bring a different approach to initiation
of calcium flux. Activation of ORAI channels by STIM requires localization of STIM to the
puncta, the region of the ER closest to the plasma membrane, and interaction of STIM with ORAI
molecules. The activated ORAI channels consist of two main components: 1) the stromal
Page 38
18
interaction molecules (STIM) which are found primarily in the ER membrane as single pass
transmembrane proteins and 2) the ORAI molecules which are found in the plasma membrane as
multi-pass transmembrane proteins.
2.3. STIM/ORAI Interactions.
2.3.1. CRAC channel activation.
The STIM molecules are most important in the activation of ORAI channels since STIM senses
decreases in Ca2+ in the ER lumen. Whereas PAD4 (mentioned above and Figure 1) becomes active
when it binds five calcium ions, STIM is in an inactive state with a bound calcium ion, and
becomes active when ER stored Ca2+ drops, resulting in loss of the bound calcium ion in STIM.
This change to active STIM (described in Figure 2.3) allows for conformational changes that
facilitate STIM dimerization and lateral migration in the ER membrane to the puncta, close to the
plasma membrane. During this process, STIM interacts with ORAI molecules and, with this
formation of interactions between STIM and ORAI, the ORAI pore-forming molecules are able to
become an active open channel selective for Ca2+ entry from the extracellular milieu (Figure 2.4).
This channel complex is called a calcium release activated calcium (CRAC) channel and
demonstrates the basic concept in SOCE. We now know that SOCE activity can be initiated by
three mechanisms: 1) activation of IP3 receptors in the ER membrane, 2) blocking SERCA pumps
in the ER membrane (ex. thapsigargin is a SERCA inhibitor) or 3) Ca2+ ionophores that
permeabilize the ER membrane.
Page 39
19
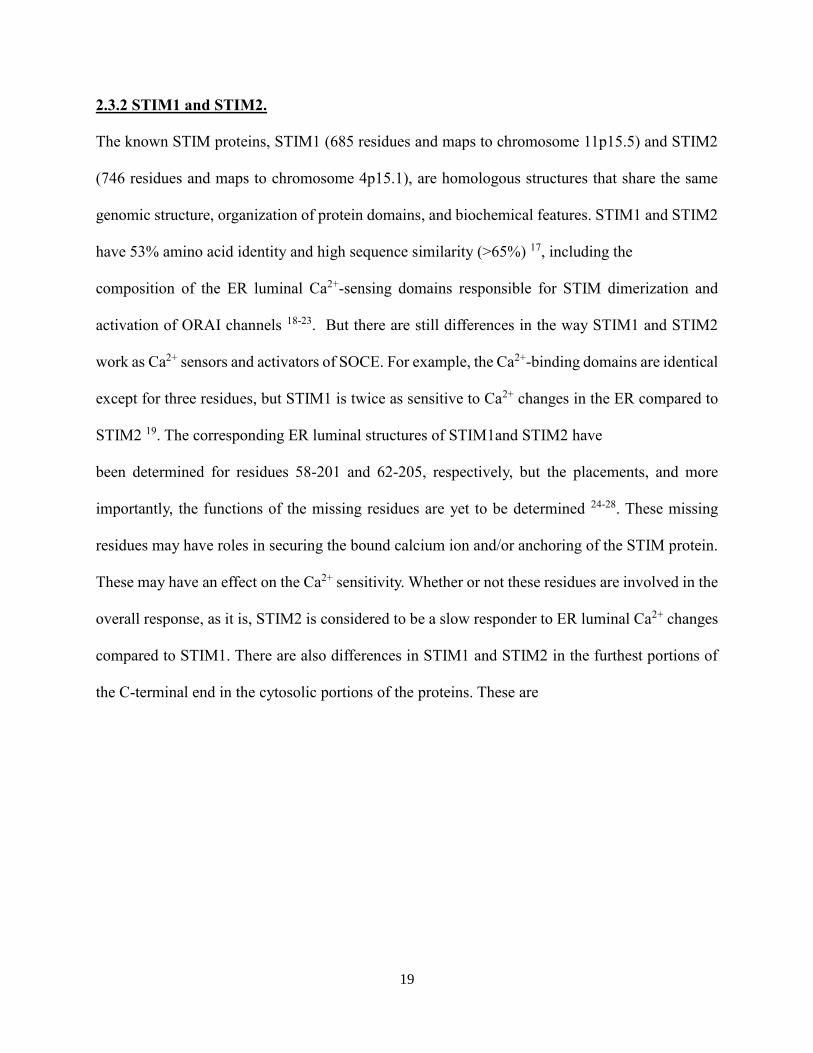
2.3.2 STIM1 and STIM2.
The known STIM proteins, STIM1 (685 residues and maps to chromosome 11p15.5) and STIM2
(746 residues and maps to chromosome 4p15.1), are homologous structures that share the same
genomic structure, organization of protein domains, and biochemical features. STIM1 and STIM2
have 53% amino acid identity and high sequence similarity (>65%) 17, including the
composition of the ER luminal Ca2+-sensing domains responsible for STIM dimerization and
activation of ORAI channels 18-23. But there are still differences in the way STIM1 and STIM2
work as Ca2+ sensors and activators of SOCE. For example, the Ca2+-binding domains are identical
except for three residues, but STIM1 is twice as sensitive to Ca2+ changes in the ER compared to
STIM2 19. The corresponding ER luminal structures of STIM1and STIM2 have
been determined for residues 58-201 and 62-205, respectively, but the placements, and more
importantly, the functions of the missing residues are yet to be determined 24-28. These missing
residues may have roles in securing the bound calcium ion and/or anchoring of the STIM protein.
These may have an effect on the Ca2+ sensitivity. Whether or not these residues are involved in the
overall response, as it is, STIM2 is considered to be a slow responder to ER luminal Ca2+ changes
compared to STIM1. There are also differences in STIM1 and STIM2 in the furthest portions of
the C-terminal end in the cytosolic portions of the proteins. These are
Page 40
20
Figure 2.3. STIM1 Activation Schematic. Human STIM1 is a single pass transmembrane
protein resident in the ER membrane STIM1 has an ER luminal portion containing the
EF-hand and SAM (sterile α motif) domains. STIM1 also has a cytosolic portion, SOAR
(STIM1-ORAI1 activation region) also referred to as CAD (CRAC channel activation
domain). The EF-hand domain is a calcium-binding motif frequently found in calcium
binding proteins, such as calmodulin with four such sites. Loss of the bound calcium ion
leads to conformational changes that are conveyed into the SAM domain, a motif
frequently found in protein-protein interactions. The active STIM can then homodimerize
with other STIM molecules with interactions primarily in the ER luminal portions. Loss
of the calcium ion also leads to conformational changes in the cytosolic portion of STIM.
This opens the SOAR to expose the coiled-coil regions (C1, C2, C3) and extends the
proline/serine-rich and lysine-rich regions out into the cytosol where interactions with
ORAI molecules can occur. This cartoon depicts how STIM1 may change when activated,
based roughly on (25) the published structures of inactive STIM1 SOAR (3TEQ.pdb) (26)
and ER lumen domains (2K60.pdb) (27).
Page 41
21
sites containing much of the STIM/ORAI interactions and these differences could influence the
speed and strength of ORAI channel activation. In most cells, STIM1 is predominant in mediating
activation of SOCE, believed to be due in part to STIM1’s greater Ca2+ sensitivity whereas STIM2
blocks SOCE if overexpressed, possibly due to STIM1/STIM2 interactions that compete with
STIM1 homodimerization upon activation 17. Knockdown of STIM2 in most cell types has little
to no effect on SOCE but, in neurons and dendritic cells, STIM2 appears to be the predominant
mediator of SOCE 17. Spatial and temporal differences in STIM1 and STIM2 activation suggest
that STIM2 is the weaker activator of ORAI channels. Further knowledge of STIM2 is needed to
understand its involvement but, as it is, STIM1 has been deemed more important in activation of
SOCE and as a partner of ORAI proteins in non-excitable cells. The full extent of STIM effects on
calcium flux are still under intense research since their influence goes beyond ORAI channels.
Among the Ca2+ channels, STIM1 has been most closely associated with ORAI channels.
However, STIM1 also influences some of the TRPC channels and, thereby, bring the TRPC
channels into the realm of SOCE or suggesting roles for STIM1 independent of SOCE 29. It is
these multiple roles for STIM (STIM1 and STIM2) in calcium flux, along with the fact that STIM
activation is one of the early and focal points in SOCE initiation that makes STIM important as a
potential therapeutic target in calcium dysregulation diseases. Indeed, there have been a number
of calcium dysregulation diseases identified in which STIM1 is a suspect due to under expression,
over expression or mutations of STIM1. We will next discuss some of the major diseases that have
shown calcium dysregulation and possible STIM involvement. Other recent reviews provide
additional insights into the involvement of SOCE, STIMs and ORAI channels in diseases and
abnormal states as well as current understanding of the mechanisms and interactions 30-33.
Page 42
22
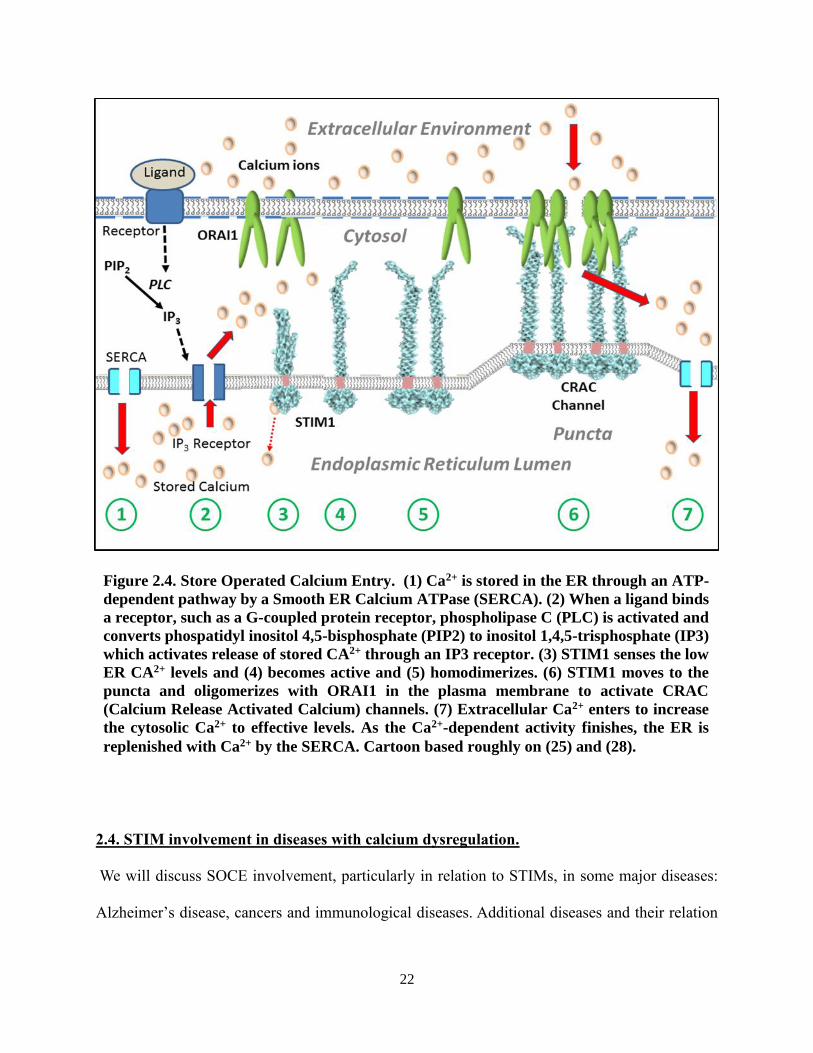
2.4. STIM involvement in diseases with calcium dysregulation.
We will discuss SOCE involvement, particularly in relation to STIMs, in some major diseases:
Alzheimer’s disease, cancers and immunological diseases. Additional diseases and their relation
Figure 2.4. Store Operated Calcium Entry. (1) Ca2+ is stored in the ER through an ATP-
dependent pathway by a Smooth ER Calcium ATPase (SERCA). (2) When a ligand binds
a receptor, such as a G-coupled protein receptor, phospholipase C (PLC) is activated and
converts phospatidyl inositol 4,5-bisphosphate (PIP2) to inositol 1,4,5-trisphosphate (IP3)
which activates release of stored CA2+ through an IP3 receptor. (3) STIM1 senses the low
ER CA2+ levels and (4) becomes active and (5) homodimerizes. (6) STIM1 moves to the
puncta and oligomerizes with ORAI1 in the plasma membrane to activate CRAC
(Calcium Release Activated Calcium) channels. (7) Extracellular Ca2+ enters to increase
the cytosolic Ca2+ to effective levels. As the Ca2+-dependent activity finishes, the ER is
replenished with Ca2+ by the SERCA. Cartoon based roughly on (25) and (28).
Page 43
23
to STIMs are listed in Table 2.1, but it is not an exhaustive list. We can expect that other diseases
will be found in the future to have Ca2+ dysregulation that involves STIMs and SOCE.
2.4.1. Alzheimer’s Disease.
Alzheimer’s disease (AD) is a chronic neurodegenerative disorder that destroys neurons and
causes synapse loss in the hippocampus and cortex which can result in cognitive disorders and
dementia. The events leading to AD involve an accumulation of β-amyloid peptide (Aβ) in plaques
which leads to neuron perturbations and eventually degeneration. The Aβ is generated by cleavage
of a membrane protein, β-amyloid precursor protein (APP), by β-secretase and γ-secretase.
Accumulation of Aβ on neurons can induce oxidative stress which then disrupts intracellular Ca2+
homeostasis 34. The role of Ca2+ in AD pathogenesis has been discussed previously 35-39. Since
we are continually gaining more knowledge of STIMs in normal calcium flux, we can now
consider how STIMs could be useful targets in AD therapeutics. Neuron degeneration in AD is
affected by disturbances in the Ca2+ homeostasis in the ER. This is attributed to mutations in the
presenilin-1 (PS1) gene in some cases of early onset inherited AD (familial AD, FAD) 34. More
than 100 different mutations have been identified in PS1 in relation to FAD. Besides regulating
ER Ca2+, PS1 is an aspartyl protease that, as part of the γ-secretase complex, cleaves the APP to
produce Aβ. The excessive activity of mutated PS1 in APP cleavage, its impact on IP3R and RyR
channels in ER Ca2+ release and the resulting oxidative stress from neuron dysregulation can lead
to disruption of intracellular Ca2+ homeostasis. In fact, increased intracellular Ca2+ and increased
duration of IP3R opening has been reported for mutated PS1 in FAD 40. And as was noted
previously, PS1 can increase expression of STIM1 and STIM2. STIMs would be involved by
sensing the ER Ca2+ changes and initiating ORAI and TRP channel activity. In addition, in neurons
Page 44
24
there are the voltage-dependent Ca2+ channels (VDCC) and NMDA-type glutamate receptors
(NMDAR) that have a role in Ca2+ entry. The effect of mutant PS1 is to generate ‘sparks’ of
intracellular Ca2+ that disturb normal Ca2+ dependent processes 34. Elevated intracellular Ca2+ in
presynaptic axons can increase glutamate release which then can increase Ca2+ entry in
postsynaptic dendritic cells by stimulating glutamate receptors and NMDARs in the dendritic cells.
Therefore, STIM, as an ER Ca2+ sensor in both the presynaptic axons and postsynaptic dendritic
cells, is a potential target for amelioration of AD. We should remember that, as mentioned
previously, in neurons STIM2 appears to have a dominant role whereas STIM1 is dominant in
other cell types.
2.4.2. Cancers.
Recent reviews of STIM involvement in cancers along with other diseases are available 35,36. Here
we will touch on a few cancer types as examples. In cancers, the disruption of Ca2+ homeostasis
can be particularly important in induction of transcription, cell metastasis and cell
migration/motility.
2.4.2.1. Colorectal cancer.
Chronic inflammation is a driving force in development and progression of colorectal cancer.
EGF has an important roles in the metastasis that can occur. EGF-mediated signals induce SOCE
which, in turn, activates transcription factors (such as CREB/NFAT) that invoke increased
transcription of genes 37. In cases of colorectal cancer, allelic imbalances at chromosome 4p15
have been associated with tumor growth but no genes were identified. STIM2 is located at locus
4p15.2 and previously it has been proposed as a candidate gene in glioblastoma multiforme. Using
xenograft analysis, STIM2 overexpression in colorectal cancer was found to be a frequent trait in
Page 45
25
colorectal cancer that results in suppression of cell growth 38. It has been proposed that increased
STIM2 may interfere with the tumor suppressor effect of STIM1-mediated induction of apoptosis
and, as a result, tumor progression and metastasis occur.
2.4.2.2. Hepatocellular carcinoma.
In Hepatocellular carcinoma (HCC) cells, Ca2+ influx was demonstrated to be involved in liver
oncogenesis. STIM1 has been found to have a higher expression in hepatoma tissues compared to
precancerous tissues of the same patients and compared to a normal hepatocyte cell line. HCC-
LM3 cells, which have a higher migration ability, expressed STIM1 at a level five times higher
than other HCC cell lines 42.
2.4.2.3. Cervical cancer.
STIM1-dependent signaling plays a vital role in cervical cancer cell proliferation, migration, and
angiogenesis. Overexpression of STIM1 in tumor tissue is seen in 71% of cases with early-stage
cervical cancer. Cancer cell migration stimulated by EGF involves expression of STIM1 and EGF
increases the interactions between STIM1 and ORAI1 in the puncta, thereby inducing Ca2+ influx
43. Another study used SOCE inhibitors, SKF96365, 2-APB and YM-58483, and found that they
inhibited cervical cancer cell migration akin to STIM1 silencing and STIM1 overexpression
significantly enhanced cervical cancer cell migration. STIM1 was found to play a role in
controlling cell migration by regulating actomyosin 44.
Page 46
26
2.4.2.4. Glioblastoma multiforme
The prognosis of glioblastoma multiforme (GBM) is poor and new therapeutics are drastically
needed. GBM (World Health Organization classification (WHO) grade IV astrocytoma) is the
most frequent type of brain tumor in adults. The median survival rarely exceeds 12 months (48).
One study used real time PCR for gene expression analysis and found 18 overexpressed proteins
one of which was STIM1 49. Ca2+ entry in GBM tumor cell proliferation and survival was studied
in glioblastoma cell lines, C6 (rat) and U251 (human). It was seen that ORAI1 and STIM1
expressions using siRNA significantly inhibited C6 cell proliferation and SOCE compared to
control cells, more significantly in cells with ORAI1 siRNA knockdown than in STIM1-treated
cells showing that Ca2+ entry via ORAI1 and CRAC channels is important for GBM proliferation
and survival. Gene silencing techniques deduced that STIM1 and ORAI1 play a vital role in GBM
and down regulation of both proteins decreased the invasiveness of the cancer cells as compared
to the control 50. Another study used three glioblastoma cell lines (U251, U87 and U373). STIM1
function was lost in U251 cells and it was seen that cell cycle arrest occurred in the GO/G1 phase
confirming the role of STIM1 in GBM 51.
2.4.3 Immunology.
Reviews of SOCE mediation of a variety of immune responses have been published previously
52-56. Here, we will discuss some of the recent discoveries in this area. Needless to say, the immune
system has some of the most complicated Ca2+ signaling and functions since immune cells need:
to be activated into rapid proliferation without slipping into a cancerous state; to be motile on
occasions to move to sites of inflammation; to act as suppressors such as suppressor T cells; to
enter apoptosis or NETosis when necessary for protection of the host against pathogens or
Page 47
27
autoimmune reactions.
SOCE is the main Ca2+ flux pathway in immune cells following any antigen stimulation. One of
the most important roles of the STIM proteins in immune cells is the regulation of gene expression
via transcription factors like NFAT. Table 1 shows a few of the diseases that are caused by immune
cells due to abnormalities associated with SOCE. Calcium ions function as second messengers in
immune cells for e.g. T cells, B cells, mast cells, NK cells, dendritic cells. Patients with inherited
defects in SOCE due to mutations in genes of the ORAI channel complex suffer from a severe
form of immunodeficiency due to defects in its function, but not the development of the cells. Ca2+
ions also regulate lymphocyte activation and differentiation among other functions. It is seen that
various protein tyrosine kinases, such as Lck, Syk or zeta-chain-associated protein kinase70 (ZAP-
70), are activated by antigen binding in T and B cells which results in the phosphorylation of
proteins such as LAT, SLP-76, B cell linker protein (BLNK) and Tec kinases IL-2–inducible T cell
kinase (ITK) and Bruton’s tyrosine kinase (BTK). These can, in turn, result in the activation of
PLC (in T cells) or PLC 2(in B cells) and hence the generation of inositol 1,4,5-triphosphate (IP3)
which triggers Ca2+ release from the ER and subsequent SOCE 57. STIM1 and STIM2 are both
required for SOCE in T cells and loss of function or null mutations in the human STIM1 gene stops
Ca2+ influx in T cells and causes immunodeficiencies in affected patients. STIM1 and STIM2
deficiencies have been found in a variety of immune system-related diseases. STIM1 deficiency
was studied in two patients with a homozygous R429C point mutation in STIM1 which completely
abolished SOCE in T cells. But it was found that SOCE is not limiting for many aspects of these
immune functions but the combination of partially impaired T cell activation and other effector
functions with defects in other lymphocyte populations causes immunodeficiency with immune
dysregulation 58. T cells and B cells have differences in expression of STIM1 proteins. T cells have
Page 48
28
been found to express up to 4 times the amount of STIM1 compared to B cells 80. Dendritic cells
(DCs) are the antigen-presenting cells linking innate and adaptive immunity whose maturation and
migration depend on alterations of cytosolic Ca2+ concentrations. Ca2+ entry, which is in part
accomplished by SOCE, is found to be partially mediated through SGK3-dependent up-regulation
of STIM2 expression 59.
Phagocytosis, which is one of the most important innate immune responses to eliminate invading
pathogenic agents, is accompanied by the activation of antimicrobial enzymes, to allow for the
production of reactive oxygen species (ROS), leading to the destruction of ingested
microorganisms including granulocytes, dendritic cells, and macrophages, and possess specific
receptors which, on triggering, engulf pathogenic material and secrete proinflammatory mediators
involved in the adaptive immune response. SOCE is required for phagocytosis via STIM/ORAI1
with the help of S100A8–A9 as a Ca2+sensor 60. SOCE deficient patients with mutations in STIM1
or ORAI1 genes are found to be susceptible to recurrent viral infections, potentially due to
impaired CD8 þ T cell function and elimination of virus infected cells such as Epstein Barr virus
(EBV) positive B cell lymphoma and Human herpes virus (HHV) 8 associated Kaposi sarcoma 46.
Cerebral vasospasm (CVS) which is a component of subarachnoid hemorrhage (SAH), can be
reduced by endothelin receptor antagonists. Development of cerebral vasoplasm takes 5-7 days
and elevated mRNA and protein expressions of ORAI1 and STIM1 were detected after SAH and
peaked on days 5 and 7 suggesting their role in the disease progression 63. Kaposi sarcoma (KS),
is exceedingly rare in children from the Mediterranean Basin, despite high prevalence of human
herpesvirus-8 (HHV-8) infection in this region. Whole-exome sequencing revealed a homozygous
splice-site mutation in STIM1, which led to the development of lethal KS upon infection with
HHV-8 64.
Page 49
29
Primary Sjögren's syndrome (pSS) is an autoimmune disease that involves glands, tissue damage,
and secretory defects in salivary and exocrine glands. Mice with T-cells that have deleted STIM1
and STIM2 developed spontaneous and severe pSS-like autoimmune disease. Sjögren's syndrome
autoantibodies were also detected in the serum, showing that deficiency of STIM1 and STIM2
proteins in T cells are associated with salivary gland autoimmunopathy in pSS patients 65. STIM1
and STIM2 have also shown roles in multiple sclerosis (MS). T-cell-specific deletion of STIM1 or
STIM2 in mice did not develop experimental autoimmune encephalomyelitis (EAE), a mouse
model of MS, as they failed to produce the proinflammatory cytokines IL-17 and IFN-gamma 66.
Similarly, in another study, in which T cell function was assessed in mice that lacked STIM1 or
STIM2 in a model of myelin-oligodendrocyte glycoprotein (MOG) involvement in MS, there was
less induction of EAE. STIM1 deficiency has been found to significantly impair generation of
neuroantigen-specific T cell responses with reduced Th1/Th17 responses, which resulted in no
EAE in the mice. Mice lacking STIM2 developed EAE, but to a lesser extent 17.
2.4.4. Other diseases and abnormal states.
SOCE via STIM1 can also play a role in diseases such as hypertension, obesity, diabetes,
thrombosis, stroke, fibrosing diseases, infertility and tumor growth due to its activation depending
on the expression of serum-and-glucocorticoid-inducible kinase-1 (SGK1) which, though in a low
concentration at most times, is found to be elevated during these pathological conditions and is
known to mediate a variety of functions including SOCE control 67.
SOCE may also be playing a role in acute lung injury which occurs during sepsis and results from
activation of innate immune cells and endothelial cells by endotoxins, leading to systemic
inflammation 68.
Page 50
30
2.5. Conclusions.
It is hoped that the reader has gained an appreciation for the importance of calcium dysregulation
in a broad range of diseases. The importance, in particular, of STIM1 and STIM2 in calcium flux
cannot be overstated since they are key early participants in SOCE as well as affecting other routes
than just the ORAI channels. With this importance in diseases, STIM1 and STIM2 are excellent
targets for new therapeutics with the caveat that there is still much to learn about these proteins
and their interactions. The 3D coordinates are available for the important SOAR, EF hand and
SAM domains so this can aid in computational studies and virtual screening for drug candidates.
There are numerous questions to be answered but, foremost, would be: 1) What other interactions
do these proteins have? 2) What functions are served by the N-terminal residues that have not been
crystallized? Do those residues participate in reinforcing calcium binding? Do those residues help
anchor STIM at some point? 3) What actions could be occurring with the noted extracellular
exposure of STIM1? Is this a means of rebinding Ca2+ to inactivate STIM and then recycle it to
the ER or does it provide other functions for STIM1? We look forward to further developments in
this exciting area.
Page 51
31
Table 2.1. Some Diseases with Possible STIM Involvement.
Disease Issue Reference
Alzheimer’s
Alzheimer's disease SOCE affects major enzymes (36) (38) (69) (70) (71)
Cancer related diseases
Melanoma Mutation of STIM1 /ORAI1 (45)
Melanogenesis Overexpression of STIM2 (47)
Glioblastoma STIM1/ORAI1 overexpression (49) (50) (51) (72)
Colorectal cancer Overexpression of STIM1 (74)
Neuroblastoma Overexpression of STIM1 (73)
Breast cancer Orai/STIM2 expression, STIM1
overexpression.
(39) (40) (41)
Cervical cancer Overexpression of STIM2 (43) (44)
Non-small cell lung cancer Overexpression of STIM1 (75)
Hepatocellular carcinoma Overexpression of STIM1 (42)
Prostate cancer Overexpression of STIM1 (76) (77)
Renal cell cancer Overexpression of STIM1 (78)
Immunity related diseases
Severe immunodeficiency STIM1, STIM2 , ORAI1
deficiencies.
(56) (57) (58) (46)
Kaposi Sarcoma Mutation of STIM1 (64)
Thalassemia STIM1 presence (61)
Systemic lupus erythematous STIM1 expression (62) (79)
Cerebral vasospasm Higher levels of STIM1/ORAI1 (63)
Sjögen’s Syndrome Depressed levels of STIM1, STIM2. (65)
Multiple sclerosis STIM1/STIM2 deletion/depression. (66)
Other diseases and abnormal states
Hypertension, obesity, diabetes Overexpression of SGK1/STIM1 (67)
Acute lung injury/sepsis STIM1 expression (68)
Page 52
32
2.6. References
(1) K. Arita, H. Hashimoto, T. Shimizu., K. Nakashima, M.Yamada, M. Sato. ‘Structural basis
for Ca2+-induced activation of human PAD4’ Nat. Struct. Mol. Biol. 11 (2004) 777–783.
(2) E.R. Vossenaar, A.J.W. Zendman, W.J. van Venrooji, G.J.M. Pruijn. ‘PAD, a growing family
of citrullinating enzymes: genes, features and involvement in disease’ BioEssays 25 (2003)
1106-1118.
(3) B. Zhivotovsky, S. Orrenius. ‘Calcium and cell death mechanisms: A perspective from the
cell death community’ Cell Calcium 50 (2011) 211-221.
(4) Q. Remijsen, T.W. Kuijpers, E. Wirawan, S. Lippens, P. Vandenabeele, T. Vanden Berghe.
‘Dying for a cause: NETosis, mechanisms behind an antimicrobial cell death modality’ Cell
Death Diff. 18 (2011) 581-588.
(5) S.J. Roberts-Thomson, A.A. Peters, D.M. Grice, G.R. Monteith. ‘ORAI-mediated calcium
entry: mechanism and roles, diseases and pharmacology’ Pharmacol. Therapeut. 127 (2010)
121-130.
(6) S.K. Joseph, G. Hajnoczky. ‘IP3 receptors in cell survival and apoptosis: Ca2+ release
and beyond’ Apoptosis 12 (2007) 951–968.
(7) Y. Yoshida, S. Imai. ‘Structure and function of inositol 1,4,5-trisphosphate receptor’ Jpn. J.
Pharmacol. 74 (1997) 125-37.
Page 53
33
(8) N. Ikemoto, T. Yamamoto. ‘Regulation of calcium release by interdomain interaction within
ryanodine receptors’ Front. Biosci. 7 (2002) d671-83.
(9) F. Van Petgem. ‘Ryanodine receptors: Structure and function’ J. Biol. Chem. 287 (2012)
31624-31632.
(10) M.D. Bootman, M.J. Berridge, H.L. Roderick. ‘Calcium Signalling: More Messengers,
More Channels, More Complexity’ Curr. Biol. 12 (2002) R563-R565.
(11) K. Honarnejad, J. Herms. ‘Presenilins: Role in calcium homeostasis’ Intl. J. Biochem. Cell
Biol. 44 (2012) 1983-1986.
(12) W.A. Catterall. ‘Structure and regulation of voltage-gated Ca2+ channels’ Annu. Rev. Cell
Dev. Biol. 16 (2000) 521-555.
(13) I.S. Ramsey, M. Delling, D.E. Clapham. ‘An introduction to TRP channels’ Annu. Rev.
Physiol. 68 (2006) 619-647.
(14) J-B Peng. ‘TRPV5 and TRPV6 in Transcellular Ca2+ Transport: Regulation, Gene
Duplication, and Polymorphisms in African Populations’ Advances Exp. Med. Biol. 704
(2011) 239-275.
(15) C.N. Topala, R.J.M. Bindels, J.G.J. Hoenderop. ‘Regulation of the epithelial calcium
channel TRPV5 by extracellular factors’ Curr. Op. Nephrol. Hypertens. 16 (2007) 319-324.
(16) T. de Groot, R.J.M. Bindels, J.G.J. Hoenderop. ‘TRPV5: An ingeniously controlled calcium
channel’ Kidney Intl. 74 (2008) 1241-1246.
Page 54
34
(17) M.K. Schuhmann, D. Stegner, A. Berna-Erro, S. Bittner, A. Braun, C. Kleinschnitz, G. Stoll,
H. Wiendl, S.G. Meuth, B. Nieswandt. ‘Stromal Interaction Molecules 1 and 2 Are Key
Regulators of Autoreactive T Cell Activation in Murine Autoimmune Central Nervous
System Inflammation’ J. Immunol. 184 (2010) 1536-1542.
(18) I. Frischauf, R. Schindl, I. Derler, J. Bergsmann, M. Fahrner, C. Romanin. ‘The STIM/Orai
coupling machinery’ Channels (Austin) 2 (2008) 261-268.
(19) R. Hooper, E. Samakai, J. Kedra, J. Soboloff. ‘Multifaceted roles of STIM proteins’ Eur. J.
Physiol. Eur J Physiol. 465 (2013) 1383-1396.
(20) J.W. Putney. ‘The physiological function of store-operated calcium entry’ Neurochem. Res.
36 (2011) 1157–1165.
(21) J.W. Putney. ‘Recent breakthroughs in the molecular mechanism of capacitative calcium
entry (with thoughts on how we got here)’ Cell Calcium 42 (2007) 103–110.
(22) M. Hoth, B.A. Niemeyer. ‘The neglected CRAC proteins : ORAI2, ORAI3 and STIM2’
Curr. Topics Membranes 71 (2013) 237- 251.
(23) P.B Stathopulos, M. Ikura. ‘Structure and Function of Endoplasmic Reticulum STIM
Calcium Sensors’ Curr. Topics Membranes 71 (2013) 60-87.
Page 55
35
(24) S. Mancarella, S. Potireddy, Y. Wang, H. Gao, R.K. Gandhirajan, M. Autieri, R. Scalia, Z.
Cheng, H. Wang, M. Madesh, S.R. Houser, D.L. Gill. ‘Targeted STIM deletion impairs
calcium homeostasis, NFAT activation, and growth of smooth muscle’ FASEB J. 27 (2013)
893-906.
(25) S. Feske, M. Prakriya. ‘Conformational dynamics of STIM1 activation’ Nature Struct. Mol.
Biol. 20 (2013) 918-919.
(26) X. Yang, H. Jin, X. Cai, S. Li, Y. Shen. ‘Structural and mechanistic insights into the
activation of stromal interaction molecule 1 (STIM1)’ Proc. Natl. Acad. Sci. USA 109
(2012) 5657-5662.
(27) P.B. Stathopulos, L. Zheng, G.Y. Li, M.J. Plevin, M. Ikura. ‘Structural and mechanistic
insights into STIM1-mediated initiation of store-operated calcium entry’ Cell 135 (2008)
110-122.
(28) L. Zheng, P.B. Stathopulos, R. Schindl, G-Y. Li, C. Romanin, M. Ikura. ‘Auto-inhibitory
role of the EF-SAM domain of STIM proteins in store-operated calcium entry’ Proc. Natl.
Acad. Sci. USA 108 (2011) 1337-1342.
(29) J.P. Yuan, W. Zeng, G.N. Huang, P.F. Worley, S. Muallem. ‘STIM1 heteromultimerizes
TRPC channels to determine their function as store-operated channels’ Nature Cell Biol. 9
(2007) 636-645.
Page 56
36
(30) P.J. Shaw, S. Feske. ‘Physiological and pathophysiological functions of SOCE in the
immune system’ Front. Biosci. 4 (2012) 2253-2268.
(31) S. Srikanth, Y. Gwack. ‘Orai1, STIM1 and their associating partners’ J. Physiol. 590 (2012)
4169-4177.
(32) A. Berna-Erro, G.E. Woodard, J.A. Rosado. ‘Orais and STIMs: physiological mechanisms
and disease’ J. Cell. Mol. Med. 16 (2012) 407-424.
(33) M. Prakriya. ‘Store-Operated Orai Channels: Structure and Function’ Store-Operated
Calcium Channels 71 (2013) 1-32.
(34) M. Mattson. ‘ER calcium and Alzheimer’s disease: In a state of flux’ Sci. Signal. 3
(2010) pe10.
(35) D.J. Selkoe. ‘Alzheimer's disease is a synaptic failure’ Science 298 (2002) 789–791.
(36) L. Bojarski, J. Herms, J. Kuznicki. ‘Calcium dysregulation in Alzheimer's disease’
Neurochem. Intl. 52 (2008) 621-633.
(37) F.M. LaFerla. ‘Calcium dyshomeostasis and intracellular signalling in Alzheimer's disease’
Nat. Rev. Neurosci. 3 (2002) 862–872.
(38) C. Zekanowski, D. Religa, C. Graff, S. Filipek, J. Kuznicki. ‘Genetic aspects of Alzheimer's
disease’ Acta Neurobiol. Exp. (Warsz.) 64 (2004) 19–31.
(39) M.P. Mattson. ‘Pathways towards and away from Alzheimer's disease’ Nature, 430 (2004)
631–639.
Page 57
37
(40) K.H. Cheung, L. Mei, D.D. Mak, I. Hayashi, T. Iwatsubo, D.E. Kang, J.K. Foskett. ‘Gain-
of-function enhancement of IP3 receptor modal gating by familial Alzheimer’s disease–
linked presenilin mutants in human cells and mouse neurons. Sci. Signal. 3, (2010) ra22.
(35) L.S. Johnstone, S.J.L. Graham, M.A. Dziadek. ‘STIM proteins: integrators of signaling
pathways in development, differentiation and disease’ J. Cell. Mol. Med. 14 (2010) 1890-
1903.
(36) F. Lang, A. Eyelenstein, E. Shumilina. ‘Regulation of Orai1/STIM1 by the kinases SGK1
and AMPK’ Cell Calcium. 52 (2012) 347-354.
(37) J.Y. Wang, B.K. Chen, Y.S. Wang, Y.T. Tsai, W.C. Chen, W.C. Chang, M.F. Hou, Y.C. Wu,
W.C. Chang. ‘Involvement of store-operated calcium signaling in EGF-mediated COX-2
gene activation in cancer cells’ Cell Signal. 24 (2012) 162-9.
(38) A. Aytes, D.G. Mollevi, M. Martinez-Iniesta, M. Nadal, A. Vidal, A. Morales, R. Salazar,
G. Capella, A. Villaneuva. ‘Stromal interaction molecule 2 (STIM2) is frequently
overexpressed in colorectal tumors and confers a tumor cell growth suppressor phenotype’
Mol. Carcinogenesis 51 (2012) 746-753.
(39) J. Hu, K. Qin, Y. Zhang, J. Gong, N. Li, D. Lv, R. Xiang, X. Tan. ‘Downregulation of
transcription factor Oct4 induces an epithelial-to-mesenchymal transition via enhancement
of Ca2+ influx in breast cancer cells’ Biochem. Biophys. Res. Commun. 411 (2011) 786-91.
Page 58
38
(40) S. Yang, J.J. Zhang, X.Y. Huang.’Orai1 and STIM1 are critical for breast tumor cell
migration and metastasis’ Cancer Cell 15 (2009) 124-134.
(41) R.K. Motiani,I.F. Abdullaev,M. Trebak. ‘A novel native store-operated calcium channel
encoded by Orai3: selective requirement of Orai3 versus Orai1 in estrogen receptor-positive
versus estrogen receptor-negative breast cancer cells’ J. Biol. Chem. 285 (2010) 19173-
19183.
(42) N. Yang, Y. Tang, F. Wang, H. Zhang, D. Xu, Y. Shen, S. Sun, G. Yang. ‘Blockade of store-
operated Ca2+ entry inhibits hepatocarcinoma cell migration and invasion by regulating
focal adhesion turnover’ Cancer Letters 330 (2013) 163-169.
(43) Y-F. Chen, W-T. Chiu, Y-T. Chen, P-Y. Lin, H-J. Huang, C-Y. Chou, H-C. Chang, M-J.
Tang, M-R. Shen. ‘Calcium store sensor stromal-interaction molecule 1-dependent signaling
plays an important role in cervical cancer growth, migration, and angiogenesis’ Proc. Natl.
Acad. Sci. USA 108 (2011) 15225-15230.
(44) Y-T. Chen, Y-F. Chen, W-T. Chiu, Y-K. Yang, H-C Chang, M-R. Shen. ‘The ER Ca²⁺ sensor
STIM1 regulates actomyosin contractility of migratory cells’ J. Cell Sci. 126 (2013) 1260-
1267.
Page 59
39
(45) S. Fedida-Metula, B. Feldman, V. Koshelev, U. Levin-Gromiko, E. Voronov, D. Fishman.
‘Lipid rafts couple store-operated Ca2+ entry to constitutive activation of PKB/Akt in a
Ca2+/calmodulin-, Src- and PP2A-mediated pathway and promote melanoma tumor growth.
Carcinogenesis. 33 (2012) 740-750.
(46) C. Weidinger, P.J. Shaw, S. Feske. ‘STIM1 and STIM2-mediated Ca(2+) influx regulates
antitumor immunity by CD8(+) T cells’ EMBO Mol. Med. 5 (2013) 1311-1321.
(47) H. Stanisz, A. Stark, T. Kilch, E.C. Schwarz, C.S. Müller, C. Peinelt, M. Hoth, B.A.
Niemeyer, T. Vogt, I.J. Bogeski. ‘ORAI1 Ca(2+) channels control endothelin-1-induced
mitogenesis and melanogenesis in primary human melanocytes’ Invest. Dermatol. 132
(2012) 1443-1451.
(48) R.K. Motiani, M.C. Hyzinski-Garcia, X. Zhang, M.M. Henkel, I.F. Abdullaev, Y. Kuo, K.
Matrougui, A.A. Mongin, M. Trebak. ‘STIM1 and Orai1 mediate CRAC channel activity
and are essential for human glioblastoma invasion’ Eur. J. Physiol. 465 (2013)1249-1260.
(49) C.A.Scrideli C.G.Carlotti, O.K. Okamoto, V.S. Andrade, M.A. Cortez, F.J. Motta, A.K.
Lucio-Eterovic, L. Neder, S. Rosemberg, S.M. Oba-Shinjo, S.K. Marie, L.G. Tone. ‘Gene
expression profile analysis of primary glioblastomas and non-neoplastic brain tissue:
identification of potential target genes by oligonucleotide microarray and real-time
quantitative PCR’ J. Neurooncol. 88 (2008) 281-291.
Page 60
40
(50) H. Liu, J.D. Hughes, S. Rollins, B. Chen, E. Perkins. ‘Calcium entry via ORAI1 regulates
glioblastoma cell proliferation and apoptosis’ Exp. Mol. Pathol. 91 (2011) 753-760.
(51) G. Li, Z. Zhang, R. Wang, W. MA, Y. Yang, J. Wei, Y. Wei. ‘Suppression of STIM1 inhibits
human glioblastoma cell proliferation and induces G0/G1 phase arrest’ J. Exp. Clin. Cancer
Res. 32 (2013) 20.
(52) L.D. Notarangela.’ Functional T Cell Immunodeficiencies’ Annu. Rev. Immunol. 31 (2013)
195-225.
(53) V. Robert, E. Triffaux, M. Savignac, L. Pelletier. ‘Calcium signaling in T-lymphocytes’
Biochimie 93 (2011) 2087 -2094.
(54) Y. Baba, T. Kurosaki. ‘. Impact of Ca2+ signaling on B cell function’ Trends in Immunology
32 (2011) 589- 594
(55) T. Kurosaki, H. Shinohara, Y. Baba. ‘B Cell signaling and Fate Decision’ Annu. Rev.
Immunol. 28 (2010)21-55.
(56) S. Feske. ‘ORAI1 and STIM1 deficiency in human and mice : roles of store-operated Ca2+
entry in the immune system and beyond’ Immunol. Rev. 231 (2009) 189- 209.
(57) S. Feske. ‘Immunodeficiency due to defects in store-operated calcium entry’ Annals N.Y.
Acad. Sci. 1238 (2011) 74-90.
Page 61
41
(58) S. Fuchs, A. Rensing-Ehl, C. Speckmann, B. Bengsch, A. Schmitt-Graeff, I. Bondzio, A.
Maul-Pavicic, T. Bass, T. Vraetz,B. Strahm, T. Ankermann, M. Benson, A. Caliebe, R.
Fölster-Holst, P. Kaiser, R. Thimme, W.W. Schamel, K. Schwarz, S.Feske, S. Ehl.
‘Antiviral and regulatory T cell immunity in a patient with stromal interaction molecule 1
deficiency’ J. Immunol. 188 (2012) 1523-1533.
(59) E. Schmid, M. Bhandaru, M.K. Nurbaeva, W. Yang, K. Szteyn, A. Russo, C. Leibrock,
L. Tyan, D. Pearce, E. Shumilina, F. Lang. ‘SGK3 regulates Ca(2+) entry and migration of
dendritic cells’ Cell Physiol. Biochem. 30 (2012) 1423-1435.
(60) N. Steinckwich, V. Schenten, C. Melchior, S. Bréchard, E.J. Tschirhart. ‘An essential role of
STIM1, Orai1, and S100A8-A9 proteins for Ca2+ signaling and FcγR-mediated
phagosomal oxidative activity’ J. Immunol. 186 (2011) 2182-2191.
(61) M.A. Altinoz, G. Gedikoglu, G. Deniz. ‘β-Thalassemia trait association with autoimmune
diseases: β-globin locus proximity to the immunity genes or role of hemorphins?’
Immunopharmacol. Immunotoxicol. 34 (2012) 181-190.
Page 62
42
(62) A. Belot, P.R. Kasher, E.W. Trotter, A.P. Foray, A.L. Debaud, G.I. Rice, M. Szynkiewicz,
M.T. Zabot, I. Rouvet, S.S. Bhaskar, S.B. Daly, J.E. Dickerson, J. Mayer, J. O'Sullivan, L.
Juillard, J.E. Urquhart, S. Fawdar, A.A. Marusiak,N. Stephenson, B. Waszkowycz, M.
Beresford, L.G. Biesecker, G. Black, C. René, J.F. Eliaou, N. Fabien, B. Ranchin, P. Cochat,
P.M. Gaffney, F. Rozenberg, P. Lebon, C. Malcus, Y.J. Crow, J. Brognard, N. Bonnefoy.
‘Protein kinase cδ deficiency causes mendelian systemic lupus erythematosus with B cell-
defective apoptosis and hyperproliferation’ Arthritis Rheum. 65 (2013) 2161-2171.
(63) N.J. Song, W.T. Yan, J.Y. An, G.S. Hao, X.Y. Guo, M. Zhang,Y. Li, D.D. Li, P. Sun.
‘Potential contribution of SOCC to cerebral vasospasm after experimental subarachnoid
hemorrhage in rats’ Brain Res. 1517 (2013) 93-103.
(64) M. Byun, A. Abhyankar, V. Lelarge, S. Plancoulaine, A. Palanduz, L. Telhan, B. Boisson, C.
Picard, S. Dewell, C. Zhao, E. Jouanguy, S. Feske, L. Abel, J.L. Casanova. ‘Whole-exome
sequencing-based discovery of STIM1 deficiency in a child with fatal classic Kaposi sarcoma’
J. Exp. Med. 207 (2010) 2307-2312.
(65) K.T. Cheng, I. Alevizos, X. Liu, W.D. Swaim, H. Yin, S. Feske, M. Oh-hora, I.S. Ambudkar.
‘STIM1 and STIM2 protein deficiency in T lymphocytes underlies development of the
exocrine gland autoimmune disease, Sjögren's syndrome’ Proc. Natl. Acad. Sci. USA 109
(2012) 14544-14549.
Page 63
43
(66) J. Ma, C.A. McCarl, S. Khalil, K. Lüthy, S. Feske. ‘T-cell-specific deletion of STIM1 and
STIM2 protects mice from EAE by impairing the effector functions of Th1 and Th17 cells’
Eur. J. Immunol. 40 (2010) 3028-3042.
(67) F. Lang, J. Voelkl. ‘Therapeutic potential of serum and glucocorticoid inducible kinase
inhibition’ Expert Opin. Investig. Drugs. 22 (2013) 701-714.
(68) R.K. Gandhirajan, S. Meng, H.C. Chandramoorthy, K. Mallilankaraman, S. Mancarella, H.
Gao, R. Razmpour, X.F. Yang, S.R. Houser, J. Chen, W.J. Koch, H. Wang, J. Soboloff, D.L.
Gill, M. Madesh. ‘Blockade of NOX2 and STIM1 signaling limits lipopolysaccharide-
induced vascular inflammation’ J. Clin. Invest. 123 (2013) 887-902.
(69) L. Bojarski , P. Pomorski , A. Szybinska , M. Drab , A S. Kijek , J. Gruszczynska-Biegala ,
J. Kuznicki. 'Presenilin-dependent expression of STIM proteins and dysregulation of
capacitative Ca2+ entry in familial Alzheimer's disease' Biochim. Biophys. Acta 1793 (2009)
1050–1057.
(70) M. Ryazantseva, K. Skobeleva, E. Kaznacheyeva. ' Familial Alzheimer’s disease-linked
presenilin-1 mutation M146V affects store-operated calcium entry: Does gain look like
loss?' Biochimie 95 (2013) 1506-1509.
(71) C.R. Shideman, J.L. Reinardy, S.A. Thayer.’ γ-Secretase Activity Modulates Store-Operated
Ca2+ Entry into Rat Sensory Neurons' Neurosci. Lett. 451 (2009) 124–128.
Page 64
44
(72) M.F. Ritchie, Y. Zhou, J. Soboloff. ‘WT1/EGR1-mediated control of STIM1 expression and
function in cancer cells’ Front. Biosci. (Landmark Ed). 16 (2011) 2402-2415.
(73) N. Bell, V. Hann, C.P. Redfern, T.R. Cheek. ‘Store-operated Ca(2+) entry in proliferating
and retinoic acid-differentiated N- and S-type neuroblastoma cells‘ Biochim. Biophys. Acta
1833 (2013) 643-651.
(74) D.McAndrew, D.M. Grice, A.A. Peters, F.M. Davis, T. Stewart, M. Rice, C.E. Smart, M.A.
Brown, P.A. Kenny, S.J. Roberts-Thomson, G.R. Monteith. ‘ORAI1-mediated calcium influx
in lactation and in breast cancer’ Mol. Cancer Ther. 10 (2011) 448-460.
(75) W. Li, M. Zhang, L. Xu, D. Lin, S. Cai, F. Zou. ‘The apoptosis of non-small cell lung cancer
induced by cisplatin through modulation of STIM1’ Exp. Toxicol. Pathol. 65 (2013) 1073-
1081.
(76) K. Vanoverberghe, V. Lehen'kyi, S. Thébault, M. Raphaël, F. van den Abeele, C. Slomianny,
P. Mariot, N. Prevarskaya. ‘Cytoskeleton reorganization as an alternative mechanism of
store-operated calcium entry control in neuroendocrine-differentiated cells’ PLoS One. 7
(2012) e45615.
(77) P.A. Berry, R. Birnie, A.P. Droop, N.J. Maitland, A.T. Collins. ‘The calcium sensor STIM1
is regulated by androgens in prostate stromal cells’ Prostate 71 (2011) 1646-1655.
Page 65
45
(78) F. Lodola, U. Laforenza, E. Bonetti, S. Lim, A. Dragoni, C. Bottino, H.L. Ong, G. Guerra,
C. Ganini, M. Massa, M. Manzoni, I.S. Ambudkar, A.A. Genazzani, V. Rosti, P. Pedrazzoli,
F. Tanzi, F. Moccia, C. Porta. ‘Store-operated Ca2+ entry is remodelled and controls in vitro
angiogenesis in endothelial progenitor cells isolated from tumoral patient’ PLoS One. 7
(2012) e42541.
(79) Y. Renaudineau, O. Mignen, T. Fali, M. Burgos, D. Cornec, S. Joussel, A. Saraux, J.O. Pers.
‘Abnormal calcium influx in T and B lymphocytes from systemic lupus erythematosus
patients is related to STIM-1 over-expression’ Ann. Rheum. Dis. 72 (2013) A30.
(80) Y. Yarkoni, J.C. Cambier. ‘Differential STIM1 expression in T and B cell subsets suggests a
role in determining antigen receptor signal amplitude’ Mol. Immunol. 48 (2011) 1851-1858.
Page 66
46
CHAPTER THREE: MOLECULAR DYNAMICS SIMULATIONS OF MEMBRANE
BOUND STIM1 TO INVESTIGATE CONFORMATIONAL CHANGES DURING STIM1
ACTIVATION UPON CALCIUM RELEASE.
To be used in publication for Journal of Chem Informatics and Modelling. (ACS Journal)
3.1. Introduction.
Calcium ions (Ca+2) play an important role in many cellular functions including major involvement
of Ca+2 as a secondary signal in intracellular signaling pathways and as cofactors in enzyme
activation. Some of the many events controlled by Ca+2 include: cell replication and cell division
via calcium/calmodulin-stimulated protein kinases I and II 1; cell death (such as apoptosis and
NETosis) 2; activation of T cells 3; activation of mast cells 4; and protein folding 5. In order to
prevent inappropriate calcium-dependent enzyme activation and signaling due to its role in such
important cellular processes, Ca+2 is kept at low concentrations (~100-200 nM) in the cytosol and
nucleus. Nevertheless there is Ca+2 stored in the endoplasmic reticulum (ER) at ~800 nM available
for rapid release into the cytosol to trigger calcium-dependent actions This release can be initiated
by cell membrane receptors that convert an external stimulus to an intracellular signal by, for
example, receptor-associated phospholipase C activation that generates inositol triphosphate (IP3).
IP3 then induces opening of inositol triphosphate (IP3)-responsive calcium channels in the ER
membrane. 6
Page 67
47
Figure 3.1. Events that occur when STIM1 acts to initiate calcium flux. a) An external signal
triggers intracellular IP3 signaling which opens ER channels to release stored Ca+2. b)
Release of stored ER Ca+2 to cytosol leads to loss of bound Ca+2 from STIM1 and
dimerization of STIM1. c) STIM1 interacts with ORAI1 to open CRAC (calcium release
activated calcium) channels to increase intracellular Ca+2. d) Storage of Ca+2 in the ER is
reestablished by SERCA channels. Red spheres represent calcium ions.
Stromal Interacting Molecule 1 (STIM1) is a single-pass transmembrane protein containing 685
amino acids that is located in the ER membrane and extends into both the ER lumen and the cytosol
7. STIM1 has been established as the main calcium ion sensor in non-excitable cells making it a
key component early in many intracellular calcium signaling pathways. Figure 1 depicts the cycle
of events that occur from initiation of intracellular calcium signaling. The ER luminal portion of
STIM1 (N-terminal domain of STIM1) has two major domains: the EF hand and a SAM (Sterile-
Alpha Motif) domain. In its inactive state STIM1 has a single Ca+2 ion bound in the EF-hand
domain, the EF-hand being a frequently used helix-loop-helix calcium-binding motif in proteins.
But, as the stored Ca+2 ions are released from the ER lumen through IP3-responsive channels, (as
mentioned above), STIM1 loses its bound Ca+2 and becomes active. Active STIM1 then undergoes
Page 68
48
conformational changes both in the cytosolic portion and in the ER lumen portion. In the cytosol
(C-terminal of STIM1), the STIM1-ORAI1 Activating Region (SOAR), a section of STIM1 that
was folded in inactive STIM1, extends outward towards the cell’s plasma membrane (PM) upon
STIM1 activation. At the end of the SOAR is a lysine-rich sequence which, when SOAR is
extended, can interact with cytosolic and cell membrane proteins, such as the ORAI1
transmembrane protein. ORAI1 forms calcium channels in the cell membrane to facilitate entry
of extracellular Ca+2 into the cell when STIM1 and ORAI1 interact. The cell will then use ATP to
pump the Ca+2 back into the ER through SERCA channels to reestablish the stored Ca+2 levels in
preparation for the next round. STIM1 is reported to have an association with SERCA in
modulating the rate of this replenishment of ER Ca+2 levels.8, 9 Variations in the strength of the
stimulation, the receptors receiving the ligand stimulation, the intracellular signal pathway (ex.
IP3), the STIM1 partners, the persistence of the signals, the ATP levels, and other factors help
determine the actual intracellular targets and the resulting effect of the calcium flux.
The underlying mechanism by which active STIM1 effects calcium flux originates in the
conformational changes in its EF-hand (calcium binding) domain and its Sterile-Alpha Motif
(SAM) domain. SAM domains are protein-protein interaction motifs in general. The EF-hand and
SAM domains (EF-SAM) are vital to storage operated calcium entry (SOCE) regulation, since
Ca+2-binding mutants (i.e. EF hand alteration) form punctae (sites where the cell membrane and
ER membrane are in close proximity) and activate SOCE independent of Ca+2 and SAM deletion
mutants lack the ability to form inducible punctae. Loss of the bound Ca+2 ion allows
conformational changes in the STIM1 lumen portion and an, as yet unknown, transduction through
the ER membrane invoking cytosolic conformational changes in STIM1 including extension of
the SOAR portion of STIM1. 6
Page 69
49
Aberrant calcium activity has been associated with lupus, such as overly sensitive T cell activation.
10 Also, association of over-expression of STIM1 with abnormal calcium flux in T and B cells in
lupus has also been reported. 11 Such abnormal activity could potentially lead to loss of tolerance
of endogenous material due to dysregulation of T and B cells. In addition, NETosis, an innate
immune response process which involves calcium-activation of chromatin modifying enzymes in
neutrophils, is believed to be dysregulated in lupus. 12 In NETosis, neutrophils that are drawn to
infection sites are induced to modify their chromatin by deimination of positive arginine residues,
converting them to neutral citrulline, and the modified chromatin is expelled from the neutrophil
to act as neutrophil extracellular traps (NETs) that bind up pathogens and debris, making it easier
for macrophages to clear the infection. We have proposed previously that NETosis is a means by
which endogenous intracellular molecules can be exposed to the immune system, potentially
invoking an autoimmune response. 13-16 In addition, abnormal STIM1 activity, such as over-
expression of STIM1, can cause abnormalities in intracellular Ca+2 levels and calcium flux that
lead to, among other things, aberrant T and/or B cell activation and possible increase in NETosis
in neutrophils or ETosis in other cell types (ex. mast cells). The facts: that STIM1 has a key role
in calcium flux; that STIM1 abnormalities have been associated with numerous diseases 17 ; and
that STIM1 over-expression appears to be involved in abnormal T and B cell activation in lupus,
suggest that STIM1 is a promising target for drug discovery to develop new therapeutics for lupus
and possibly other diseases. In order to understand the mechanism of STIM1 unfolding, creating
an in vivo-like model of STIM1 with which we can follow STIM1 structural changes during
activation is very important. The luminal portion of STIM1 contains two EF-hand’s. The first EF
hand (hEF1) holds the calcium ion and the “hidden” EF-hand (hEF2) stabilizes the canonical EF-
hand via hydrogen bonding by forming a small antiparallel β sheet between the helices. The
Page 70
50
interaction between the EF and SAM domains is chiefly hydrophobic in nature, holding EF-SAM
as a single entity. The hypothesis, that the collective solvent exposure of EF-hand 2 and also the
α10 helix of the SAM domain leads to an unstable state of STIM1, can be confirmed via molecular
dynamics. 6, 31
Molecular dynamics (MD) is a powerful tool that can model the motion of atoms of a molecular
system and provide computational depictions of phenomena that are difficult to view
experimentally. There are a variety of MD programs that are used such as CHARMM, AMBER,
NAMD, DESMOND and GROMACS. 18-20 Interpretation of experimental data and validating such
with the help of MD improves the quality of data and can assure a robust structure that can be used
for further parallel studies and can improve computational drug discovery efforts. 21 Since
conditions required for successful crystallization of a protein can vary from the actual in vivo
conditions, such as dense protein stacking and high salt concentrations, and some of the resulting
data may be incomplete, such as missing or distorted amino acid side chains, computational
methods are needed to refine the models towards more in vivo-like states. Here we report
development of refined computational models of STIM1 followed by MD simulations to model
STIM1 such that it is closer to putative in vivo states through relaxation of the model. This will
assist us in understanding the mechanisms by which STIM1 unfolds upon calcium loss which can
then be key in determining the most probable sites to target on the protein for drug discovery.
3.2. Methods.
The luminal portion of human STIM1 (containing residues 58 to 201, includes the EF-hand
calcium binding domain and the SAM domain) as determined from NMR data by Stathopulos, et
Page 71
51
al. 6 is available as PDB entry 2K60 from the Protein Data Bank. 22 This partial STIM1 structure
is the bulk of the ER luminal portion of STIM1 but it is missing the N-terminal 57 residues for
which structure could not be discerned from the NMR data due to either random positioning during
NMR or loss of the residues during preparation. These missing residues may, in fact, have
importance in STIM1 functions, interactions and structure but that will remain to be determined
from future analysis when sufficient experimental and structural data are available to define the
missing residues. MD simulations were performed on this structure in the presence and absence of
calcium to relax them into more in vivo-like conformations. This was expected to give relaxed
protein conformations that accommodate the residues while minimizing the overall energy of the
protein in simulated physiological conditions. Schrodinger Suite 2014-3 was used to prepare the
protein structures initially. 23 Since STIM1 is a transmembrane protein which spans through the
ER membrane to the cytosol, residues 202-236 were added to provide the transmembrane residues
modelled as an alpha helix using Schrodinger’s Prime 24 as shown in Figure 2 so that the structure
could be placed in a simulated membrane which, in the in vivo environment, anchors the protein
and restricts the direction and extent of protein structural fluctuations. An initial simulated
membrane was created and the protein was inserted into it as a single pass transmembrane protein
as depicted in Figure 3. This virtual complex was in a virtual box and the box was filled with water
and ions. The MD simulation box then contained over 170,000 atoms. Iterations of the MD
simulation repositioned each atom based on the forces acting on it from all the other atoms
proceeding towards a minimization of overall energy in the box. MD was run until each structure
converged meaning that frames (protein conformations) were repeating and the RMSD (root mean
square deviation, shown in Appendix 3.1) values had stabilized with minimal variations.
Page 72
52
Figure 3.2. The structure built prior to insertion into membrane showing the N-terminal of
STIM1 positioned in the ER luminal portion. It consists of the EF hand harboring the
calcium ion and the SAM domain connected to the transmembrane portion. The cytosolic
part is not shown here.
MD simulations were run using the NAMD package 2.7 and were used with the Charmm++
parallel programming model. 25 The protein was prepared for MD using Visual Molecular
Dynamics (VMD). 26 The VMD membrane plugin tool was used to setup a POPC (1-palmitoyl-
2-oleoyl-sn-glycero-3-phosphocholine) membrane 27 and the protein was embedded into it with
VMD as well. Periodic boundary conditions were set with TIP3 water, and sodium and chlorine
ions were added to neutralize and ionize the system to a final concentration of 0.2 mol/L.
Page 73
53
Figure 3.3. The luminal part of the protein (in purple) with the transmembrane part
embedded in the POPC membrane.
107 iterations of step energy minimization were carried out to minimize the system’s energy
following which the system was equilibrated for 5x10⁷ psec and the integration time was set to 2
fsec. A partial-mesh Ewald algorithm was used to treat long range electrostatics with a grid spacing
of 0.8 for Van der Waals and short range electrostatic interactions. The simulation was run at a
temperature of 310 K in the NPT (constant number of particles, pressure, and temperature). RMSD
(Root mean square deviation), RMSF (Root mean square fluctuations) and Rg (Radius of gyration)
were analyzed on the whole trajectory using Wordom. 28 Intramolecular H-bonds were studied on
every 100 frames using the VMD timeline tool. All graphs were made using the GRACE program.
29 On convergence, depicted by RMSD in Figure 1(Appendix 3.1), the simulations were clustered
30 using Wordom to find the most common protein conformations. The top 3 clustered
conformations were used for structural analysis. VMD Tooline, 27 was used for secondary
structure assessment of the trajectory.
Page 74
54
Schrodinger Suite 2014-3 23 was used to prepare protein structures. Maestro, which is the graphical
user interface of Schrodinger, was also used to depict electrostatic surfaces and other functions
thereafter.
3.3. Results.
The first part of the study involved building the model of the luminal portion together with the
transmembrane portion. Since STIM1 contains EF-hand and SAM domains joined to the cytosolic
portion via a transmembrane region, modeling the transmembrane portion is imperative to
understanding how flexible the SAM domain residues are with respect to any conformational
changes in the absence of calcium.
The model built herein included the luminal portion used from PDB 2K60 (an NMR structure) and
the transmembrane portion using Prime and data from PDB 3SR7 with 68% similarity. The
cytosolic portion was not added in order to reduce the overall computation time and resources.
Figure 3 (below) depicts the different domains of the STIM1 N-terminal luminal portion. As
mentioned above, the transmembrane portion was embedded in the POPC membrane and then the
structure was allowed to equilibrate for 100 nsecs. The RMSD data shows that the protein was
equilibrated after the run.
Page 75
55
Figure 3.4. Different domains of STIM1 N-terminal luminal portion present inside the
Endoplasmic reticulum. EF Hand 1 is depicted in green which harbors the Ca ion, EF hand
2 is depicted in orange and the SAM domain helices are depicted in blue. The
transmembrane helix has been omitted in this figure.
The simulation, when run in the presence of calcium in the protein, takes on a form very similar
to what is observed in the crystal structure, as seen in Figure 4 (below). There is very little change
observed after equilibration of the protein, especially in the secondary structure elements and
motions observed throughout the trajectory. The top clustered pose was superimposed onto the
original wild type structure in Maestro as shown in Figure 4. The original structure from the Protein
Data Bank is depicted with blue ribbons and the one after equilibration is depicted with orange
ribbons. The EF hand as well as SAM domain after being connected to the transmembrane portion
are held together in the same fashion as seen in the original crystal structure suggesting the
robustness of this model. The only area of flexibility seems to be around the tail portion which
harbors the missing amino acid residues. This also shows that the role of the calcium ion in holding
the luminal portion of STIM1 and the transmembrane portion together, with the help of the
interactions between the metal and neighboring residues and also hydrophobic forces amongst the
Page 76
56
residues of closely situated domains, is vital. The key for maintaining STIM1 in its inactive state
in vivo definitely involves these interactions in the flexible domains of the structure.
Figure 3.5. Superimposition of the crystal structure (depicted in blue ribbons) with the
simulated model in the presence of calcium (depicted with orange ribbons) shows almost
exact similarities in the structure after dynamics. The helices and interactions are sustained
through the trajectory showing robustness of the model.
The simulations of STIM1 in the absence of calcium depict the process of unfolding of STIM1 via
a few important conformational changes which can be important in therapeutic targeting of the
protein. The canonical EF hand1, which is in the form of a helix-beta-loop-helix motif, holds the
calcium ion with the help of six negatively charged amino acid residues which are on the beta loop.
Upon removal of the calcium ion, that negatively charged patch is now available for interaction
with residues in the neighboring helices and does so. The residues involved in interacting with
calcium due to increased flexibility and concurrent hydrogen bonding now start to deviate from
Page 77
57
the beta strand (ß1 and β2) to an organized complete alpha helix (α2) and loop variation. Referring
to STIM1 structural geometry in Stapleton et al, 6 the α2 helix seemingly becomes a much longer
and ordered helix using residues from the beta turn (residue number 82-83), which is also discerned
by distance calculations run throughout the trajectory. The small α2 helix holding residues 89-97
forms a much more stable helix through the trajectory. Secondary structure assessment shows that
residues 83- 97 change from turns and coils to a helix. On monitoring the size of the alpha helix,
it is seen to change from 33 Å to an average of 60 Å stabilized over the trajectory as depicted in
Figure 5(a) and (b). All the distances between these helices have been quantified by Wordom
throughout the trajectory.
Figure 3.6. (a) STIM1 with calcium ion bound to the negatively charged residues. For clarity
purposes, Asp 77 and Glu 87 have been shown here. Val 117, Phe 108, Glu 94 and a few of
the hydrophobic residues on EF hand 2 are seen to form the packed conformation. (b) STIM1
in the absence of calcium. The negatively charged residues Asp 77 and Glu 87 are further
apart.
The α2 helix changes from 33 to 60Å. The next change occurs when α3 and 4, which form part of
the EF hand 2, are seen to fall apart. Residues making up those helices show a lot of movement;
some up to 7 Å or more. We observed movement of EF hand 2 away from EF hand 1 helices, in
Page 78
58
turn, exposing the hydrophobic residues. Residues Phe 108 in α3 and Glu 94 in α2 move from
almost 38 Å to 64 Å, around 26 Å away following the stability of the α2. Movement between ß3
and α3, quantified by the distance between Val 117 and Phe 108 is around 7 Å. The graphs in
Figure 6 clearly suggest the movement of the above mentioned helices with respect to each other
and showcase the beginning of the structural change.
Figure 3.7. Graph showing trajectory frames (X-axis vs Distance in Å (Y-axis). (a) Distance
graph between Asp 95 and 85 sustaining the helix (b) Distance graph between Val 117 and
Phe 108. (c) Distance graph between Glu 94 and Phe 108. (d) Distance between alpha helix 7
and 6 in the SAM domain stabilizes . These graphs demonstrate that the helices in the
luminal portion show significant motion which stabilizes through the trajectory.
Page 79
59
The opening of STIM1 in the absence of calcium is thereby seen to be mediated through EF hand
2. Due to the connectivity of the protein this change should then translate to the next portion of the
protein; the SAM domain. The SAM domain in STIM1 consists of five helices. The SAM domain
helices in STIM1, although playing a part in oligomerization, nevertheless are attached on the
other side through the transmembrane portion to the cytosolic part of STIM1. What is clearly
evident in the simulations is that α10 residues, which are a part of the SAM domain, seem to move
away, around 7 Å, from the EF hand zone by interacting with the other helices of the SAM domain
as depicted in Figure 5. Also alpha helix 9, is seen to have uncoiled in the process and secondary
structure analysis shows that helix 9 residues and part of helix 10 unfold from a helix to a beta
turn. α10 of SAM domain, which is most closely associated to the EF hand 2’s secondary structure
change to a beta turn, could help in its uncoiling and aid in oligomerization. What we did not
observe is the complete movement of helix 10 away from the protein but understanding that EF
hand 2 shows direct movement due to hydrophobic exposure, the SAM domain’s movement
through alpha 10 can be fairly well predicted if oligomerization has to take place.
Different analytical studies on these specific motions across the domains have been taken into
consideration. Our simulations depict clearly the start of the process of STIM1 unfolding and
oligomerization. Two places of major structural change are the EF hand 2 and α10 SAM domain
helix. Postulating how this oligomerization is driven in the absence of calcium hence becomes
clearer. One of the sites is prominent in the EF hand 1 zone and the other is in the SAM domain
between helices 6 and 7.
Page 80
60
3.4. Discussion.
Understanding the mechanism by which any protein may work can be key to understanding how
to target it for drug discovery. 32 Proteins are able to form intrinsically disordered conformations
to allow coupling of distant domains for cooperativity. 33-34 STIM1 and other proteins such as
adenovirus protein E1A, and other EF hand containing proteins are seen to do this. 33, 35 By binding
to a ligand or Ca+2 ion in the case of EF hand containing proteins, domain interactions are
established which leads to an ordered state and hence various functions are achieved. Another
example of this is a neuronal calcium sensor, the NCS1 protein, which is activated by binding three
Ca+2 ions which induces restructuring of the domains to form a pocket where binding of neuronal
receptors occurs. 36 In STIM1, disordering of the structure allows STIM1 molecules to oligomerize
which cascades into other actions along the entire length of STIM1 for puncta formation and
reestablishing stored calcium in the ER. To target such a complicated cascade of events, the MD
simulations provide us a very detailed idea of the process. To our knowledge this is the first time
the luminal portion with the transmembrane portion were modelled together to study the
mechanism of action in absence/presence of calcium.
The results hint at the conformational changes which occur in the absence of the calcium ion
binding that could lead to an unstable disordered state. Major changes observed are centered on
EF hands and followed by SAM α10 helices. The negatively charged residues ; Asp 78, Asn 80,
Asp 76 , Gly 87, Asp 82 present on EF hand 1 that form a hexagonal chelate around calcium, in
its absence are seen to move towards an alpha helical form as demonstrated through the secondary
structure assessment (Appendix 3.2).
Page 81
61
Figure 3.8. Calcium ion held together by a few negatively charged residues which rest in
between alpha helices and beta turn in EF hand 1 depicted in orange.
This drive of secondary structure change allows for the helices which form EF hand 2; α3 (103-
108) and α4 (117-126), along with the beta turn loop ß2, changes into a coil and start moving apart
from EF hand 1 due to increased flexibility in the absence of the electrostatic charges from calcium.
From the simulations, it is evident that the EF hand 2 change is most likely the start of the
oligomerization process. The hydrophobic residues buried inside EF hand 2, which in the wild
type simulation are tightly packed and not exposed to the outer side of the protein; such as Phe
108, Ile 115, Leu 120, Leu 74, Ile 71, Lys 104, Val 68, as shown in Figure 5, are seen to become
more solvent exposed and the residues are now much further apart than when in the presence of
calcium. The amount of solvent accessible surface area for this form is increased to 6888.041 Å as
opposed to 6381.440 Å as deduced from SASA calculations performed with Maestro. 37
The transmembrane portion may be the reason why some parts of the SAM domain are not very
flexible but the transmembrane itself is also seen to change during the simulation. In the presence
of calcium, the transmembrane is seen to be in the same form as the model prepared but the absence
of calcium makes the residues in it interact with the membrane more and few residues are seen to
contort from the helix which signifies that signal transduction occurs in the absence of calcium via
Page 82
62
the mechanism postulated. Since the transmembrane is the key to translating this change through
towards the cytosolic part, understanding changes in that will also help us understand the role of
the various domains in signal transduction. During the simulation, since the transmembrane
portion was attached to the protein which forms a single pass membrane attached on the other end
to the cytosolic portion and on the other end to the SAM domain helix 10, a huge amount of energy
would be required to move alpha helix 10 away. Nevertheless what we do see is the beginning of
this unfolding via EF hand 2 which then translates to some other portions of the SAM domain
which should, in turn, allow unfolding.
Hence the EF hand and SAM domains are both seen to participate in the oligomerization process,
as discussed above. We have ascertained a short phase between the equilibrated and non-
equilibrated protein structure which is seen to translate to the more open structure. Figure 8
(below) depicts these series of changes that putatively occur during this process with the presence
of a short medium phase (green) where the beta turn has not changed to a helix yet.
Page 83
63
Figure 3.9. Cascade of events occurring during oligomerization. The process starts with the
loss of calcium followed by movement around the EF hand 1 to change into a proper helix
which pulls the other domains in a way such that the hydrophobic residues are exposed.
STIM1’s EF hand most closely resembles C-CAM 38 and the SAM domain that of the EphB2
receptor 39. Usually opening of the EF hand exposes hydrophobic surfaces which help in binding
of target ligands or sequences. Here, the exposure of the residues helps unfold the protein. SAM
domains are known to unfold for oligomerization in three different ways. 40 As predicted earlier,
and as seen from the simulations, the oligomerization could occur via the non-polar surfaces of the
helix close to the C-terminal and the mid loop.6
Page 84
64
From our modelling and dynamics study, we have unraveled the secondary structure change from
a beta strand to an alpha helix that could potentially lead to the opening of the hydrophobic residues
of the STIM1 luminal portion which precedes the oligomerization. These observed changes also
bring into focus the importance of the transmembrane portion of STIM1 since the activation must
be conveyed to the cytosolic part of STIM1. Our simulations show only the ER luminal portion of
STIM1. The luminal portion starts unpacking and then the cytosolic part begins to unravel as well.
Our future work will focus on determining how the entire protein structure changes upon
activation.
As mentioned above, understanding mechanisms by which proteins unfold helps in figuring out
potential sites to be targeted for drug discovery. We now understand that the calcium binding zone
and some portions of the SAM domain are key to mediating the oligomerization, hence this is the
best area which can be optimized for screening potential drugs to prevent the oligomerization
occurring after activation of STIM1 in cells overly expressing STIM1 in lupus patients.
3.5. Conclusions.
From this MD study, exposure of hydrophobic residues in the EF-hand domain, which we believe
are important in dimerization along with neighboring conformational changes that allow such
exposure, were seen. This study was done with inclusion of the transmembrane portion of STIM1
which helped in discovering these conformation changes. The change from a beta turn towards an
alpha helix appears to be the key trigger to the conformational changes occurring allowing the EF
hand and the SAM domain, which are close together, to start exposing the hydrophobic residues
to begin oligomerization. Understanding these changes has been helpful in identifying potential
Page 85
65
druggable sites for drug discovery targeting STIM1. Future work will involve MD simulations of
two STIM1 molecules in close proximity to study their binding during homodimerization. We will
also incorporate the cytosolic portion of STIM1 when there is sufficient experimental data to assist
in the computational modeling of the cytosolic changes in STIM1 during activation.
3.6. References.
(1) Skelding K.A., Rostas J.A.P., Verrills N.M. Cell Cycle, 2011 10 :631-639.
(2) Orrenius S., Zhivotovsky B., and Nicotera P. Nature Rev. Mol. Cell Biol. 2003, 4, 552-
565.
(3) Oh-hora M., Yamashita M., Hogan P.G., et al. Nature Immunol. 2008, 9, 432-443.
(4) Baba Y., Nishida K., Fujii Y., et al. (2008) Nature Immunol, 9, 81-88.
(5) Coe H., Michalak M. Gen. Physiol. Biophys. 2009, 28, F96-F103.
(6) Stathopulos P.B., Zheng L, Li G.Y., Plevin M.J., Ikura M. Cell, 2008, 135, 110-22.
(7) Park C.Y., Hoover P.J., Mullins F.M., et al. Cell 2009, 136, 876-890.
(8) Wu M.M., Buchanan J., Luik R.M., Lewis R.S. J. Cell Biol., 2006, 174, 803-813.
(9) Liou, J., M.L. Kim, W.D. Heo, J.T. Jones, J.W. Myers, J.E. Ferrell, Jr., and T. Meyer. Curr.
Biol. , 2005 , 15,1235-1241.
(10) Kyttaris V.C., Zhang Z., Kampagianni O., Tsokos G.C. Arthritis Rheum. 2011, 63 , 2058-
2066.
(11) Renaudineau Y., Mignen O., Fali T., et al. Ann. Rheum. Dis. 2013, 72, A30.
(12) Knight J.S., Kaplan M.J. Lupus neutrophils : Curr. Op. Rheumatol. 2012, 24 : 441–450.
(13) Su K.Y., Pisetsky D.S. Scand. J. Immunol. 2009, 70, 175-183.
Page 86
66
(14) Darrah E., Andrade F. Front. Immunol. 2013, 3, 428.
(15) Knight J.S., Kaplan M.J. Curr. Opin. Rheumatol. 2012, 24, 441-450.
(16) Brooks W. Front. Immunol. 2013, 4, 91.
(17) Mukherjee S., Brooks W.H. Biochem. Biophys. Acta Mol Cell. Res. 2014 , 1843, 2307–
2314.
(18) D.A. Case, J.T. Berryman, R.M. Betz, D.S. Cerutti, T.E. Cheatham, III, T.A. Darden, R.E.
Duke, T.J. Giese, H. Gohlke, A.W. Goetz, N. Homeyer, S. Izadi, P. Janowski, J. Kaus, A.
Kovalenko, T.S. Lee, S. LeGrand, P. Li, T. Luchko, R. Luo, B. Madej, K.M. Merz, G.
Monard, P. Needham, H. Nguyen, H.T. Nguyen, I. Omelyan, A. Onufriev, D.R. Roe, A.
Roitberg, R. Salomon-Ferrer, C.L. Simmerling, W. Smith, J. Swails, R.C. Walker, J. Wang,
R.M. Wolf, X. Wu, D.M. York and P.A. Kollman AMBER 2015, University of California,
San Francisco.
(19) Shivakumar, D.; Williams, J.; Wu, Y.; Damm, W.; Shelley, J.; Sherman, W., J. Chem.
Theory Comput., 2010, 6, 1509–1519
(20) B. R. Brooks, R. E. Bruccoleri, B. D. Olafson, D. J. States, S. Swaminathan, and M.
Karplus. J. Comp. Chem. 1983, 4, 187-217
(21) Wilfred, W.E. ; Gunsteren, E.V.;. Berendsen, H. J.C.. Angewandte Chemie. International.
1990 , 29 ,992 -1023.
(22) www.rcsb.org H.M. Berman, J. Westbrook, Z. Feng, G. Gilliland, T.N. Bhat, H. Weissig,
I.N. Shindyalov, P.E. Bourne The Protein Data Bank
Nucleic Acids Research, 2000 , 28: 235-242.
(23) Schrödinger Release 2014-3: Maestro, version 9.9, Schrödinger, LLC, New York, NY,
2014.
Page 87
67
(24) Andrec, M.; Harano, Y.; Jacobson, M. P.; Friesner, R. A; Levy, R. M. J. of Structural and
Functional Genomics, 2002, 2, 103-111
(25) James C. Phillips, Rosemary Braun, Wei Wang, James Gumbart, Emad Tajkhorshid,
Elizabeth Villa, Christophe Chipot, Robert D. Skeel, Laxmikant Kale, and Klaus
Schulten. Journal of Computational Chemistry, 2005, 26, 1781-1802,
(26) Humphrey, W., Dalke, A. and Schulten, K., "VMD - Visual Molecular Dynamics", J.
Molec. Graphics, 1996, 14, 33-38. http://www.ks.uiuc.edu/Research/vmd/
(27) B Jójárt, TA Martinek - Journal of computational chemistry. 2007, 28, 2051–2058.
(28) Seeber, M ; Cecchini, M; Rao,F; Settanni, G ; Caflisch , A; Bioinformatics, 2007, 19,
2625-2627
(29) http://plasma-gate.weizmann.ac.il/Grace/doc/UsersGuide.html
(30) Seeber M, Felline A, Raimondi F, et al. Journal of Computational Chemistry. 2011, 6,
1183-1194. doi:10.1002/jcc.21688.
(31) Furukawa, Y.; Teraguchi, S.; Ikegami, T.; Dagliyan, O.; Jin, L.; Hall, D.; Dokholyan, N.V.;
Namba, K.; Akira, S.; Kurosaki, T.; Baba, Y.; Standley, D.M. J.Mol.Biol. 2014, 426, 2082-
2097.
(32) Araujo, R.P.; Liotta, L.A.; Petricoin, E.F. Nature Reviews Drug Discovery. 2007, 6, 871-
880.
(33) A.C. Ferreon, J.C. Ferreon, P.E. Wright, A.A. Deniz. Nature, 2013, 498, 390–394
(34) S.E. Reichheld, Z. Yu, A.R. Davidson. Proc Natl Acad Sci U S A, 2009, 106, 22263–
22268.
(35) V.J. Hilser, E.B. Thompson. Proc Natl Acad Sci U S A, 2007, 104 , 8311–8315
Page 88
68
(36) Heidarsson, P.O., Otazo, M. R., Bellucci, L, Mossa, A, Imparato,A.; Paci, E. , Corni, S,
Felice, R.D, Kragelund, B; Cecconi, C. Structure. 2013, 21, 1812–1821.
(37) Durham, E; Dorr, B, Woetzel, D.; Staritzbichler, R.; Meiler, J. J Mol Model. 2009.
(38) Chin, D. Means, A..R. Trends Cell Biol. 2000, 10, 322-328.
(39) Stapleton, D.; Balan, I .; Pawson, T.; Sicheri, F. Nature astructural boil. 1999, 6, 44-49.
(40) Kim, C,A.; Bowie, J.U. Trends in Biochem. Sci , 2003 , 28, 625 -628.
Page 89
69
CHAPTER FOUR: MUTATION IN EF-SAM DOMAIN OF STIM1 DEREGULATES
CA2+ SIGNALING CONTRIBUTING TO CHRONIC PANCREATITIS.
Text to be used in a future publication.
4.1. Introduction.
Chronic pancreatitis (CP) is a long-term inflammation of the pancreas that modifies its normal
structure and functions. This is understood to be due to prematurely activated trypsin within the
pancreas has been thought to play a pivotal role in the etiology of chronic pancreatitis. Genetic
studies of chronic pancreatitis in the past decade, have confirmed that mutations in the Spink1,
PRSS1, CFTR, CASR, and CPA1 genes, contribute to the development of the disease 1, 2. Acute
pancreatitis (AP) is also an inflammatory disease triggered by auto digestion due to trypsin
activation within the cell leading to cell death. Ca2+ signaling regulation in pancreatic acinar cells
is essential for the cell homeostasis and correct response to extracellular agonists. For instance, a
typical physiological response occurs when pancreatic exocrine cells respond to low dose of
agonists such as the hormone cholecystokinin (CCK). After fixation on its receptor, an intracellular
Ca2+ increase is induced which in turn drives to the extrusion of zymogen granules containing
enzymes in its inactive form. If this Ca2+ regulated process is impaired as in the case of sustained
Ca2+ signals induced by high dose of agonists, bile acids, fat or alcohol, reduced zymogen granules
secretion combined with trypsin auto-activation inside the cells will drive to pancreatic cell
degradation and to acute pancreatitis. Hence a critical feature in AP is the aberrant Ca2+signaling
observed in pancreatic acinar cells leading to stress conditions and cell degradation. The excessive
Page 90
70
intracellular Ca2+ signals elicited by combinations of fat and alcohol or bile acids can be due to an
excessive release of endoplasmic reticulum (ER) stores or to an increase in extracellular Ca2+
influx such as SOCE (Store Operated Calcium Entry). These aberrant Ca2+ signals initiate
intracellular protease activation that causes auto digestion and appears to be totally dependent on
a sustained Ca2+ increase. 3, 4
In most non-excitable cells, SOCE supported by STIM1 and Ca2+ channels encoded by Orai and
TRPC proteins is the main activated pathway after agonist activation of the IP3-R (Inositol
Triphosphate Receptor) leading to pronounced and sustained ER calcium store release. 5 STIM1
which is the single-pass transmembrane protein and is mainly localized in the ER membrane has
been established as the main ER Ca2+ sensor in non-excitable cells, controlling the opening of
calcium channels formed by Orai or TRPC proteins. The EF-hand domain of STIM1 which is
located in the luminal region of the ER acts as a sensor of Ca2+ changes to initiate SOCE. After
ER Ca2+ store depletion, STIM1 oligomerizes and subsequently translocates from a homogenous
distribution in the ER membrane to sites that are in close apposition to the PM (ER–PM junctions)
6, 7. At ER–PM junctions, the oligomerized STIM1 interacts with Ca2+ channels to allow channel
opening and Ca2+ influx (SOCE).8, 9
It has been now clearly established in pancreatic acinar cells that SOC channels, encoded by Orais
and TRPC and STIM1, are involved in sustained Ca2+ signals elicited by such a profound store
depletion. Pharmacological SOCE blockade is able to effectively prevent toxic intracellular Ca2+
elevation, trypsin/protease activity and pancreatic acinar cell necrosis occurring after severe store
depletion by thapsigargin or palmitoleic acid ethyl ester. 10
Herein the study focused onto link a STIM1 mutation found in chronic pancreatitis patients with
specific changes in Ca2+ homeostasis leading to enhanced trypsin intracellular activation and cell
Page 91
71
death. A number of mutations in the STIM1 protein were identified. Two of these mutations are
located in the EF-SAM domain (EF hand / Sterile Alpha Motif). The major mutation observed was
E152K or Glu from Lys at position 152 which has been enunciated via experimental studies
elsewhere and computational techniques herein.
4.2. Experimental studies performed on characterization of the mutation.
These studies have been performed by our research collaborators.
STIM1 gene polymorphism in a pancreatitis was tested in French cohorts to test the hypothesis
that the gain of function mutations of STIM1 may induce Ca2+ signaling modification and therefore
potentially contribute to CP. Several missense mutations were discovered in different domains of
the STIM1 protein among which most variations were situated in the ER luminal portion of
STIM1. The main portion of the ER STIM1 luminal domains folds into a primarily α-helical
protein and consists of a canonical EF hand motif (α1-β1-α2 secondary structures) followed by a
non-canonical EF-hand (α3-β2-α4 components) and a Sterile Alfa motif (SAM) domain (α5 to
α10).11 Different mutations in the EF hand domain were previously reported and linked to Tubular-
Aggregate Myopathy. 12, 13 Moreover, the EF-hand (residues 63–200) together with SAM domain
(i.e., EF–SAM) is highly conserved from lower to higher order eukaryotes and the importance of
EF–SAM oligomerization to the function of STIM1 has been clearly demonstrated.14 Amino acids
changes which challenge the EF-hand-SAM domain interface also induce constitutive STIM1
oligomerization and SOCE activation without affecting Ca2+-binding properties of EF–SAM. In
view of all these findings, the first focus of the exploration was on the functional consequences of
the observed STIM1 mutations in CP cohort, on variations located in the EF–SAM domain of this
protein. Two contiguous variations in this domain, E152K and T153I, both clustered inside the 7th
Page 92
72
α-helix of the SAM domain affecting highly conserved amino acids. Two families affected by ICP
and with individuals carrying the E152K mutation at the heterozygous state. This mutation was
present in all CP affected members and absent in the unaffected members, confirming autosomal-
dominant inheritance.
As this E152K mutation is located in the EF-SAM domain, oligomerization properties of mutated
STIM1 were next explored using a FRET approach between constructs carrying the WT (Wild
type), E152K and T153I STIM1 proteins. Expression of the T153I STIM1 along with WT STIM1
does not induce any modification of FRET signals compared to WT confirming once more that
this mutation does not change STIM1 function. However a significant decrease in STIM1
multimerization is observed when E152K YFP STIM1 is expressed with WT CFP STIM1
suggesting a defect of STIM1 multimerisation. However a significantly higher interaction level
between E152K CFP/E152K YFP was detected in comparison with the WT CFP/WT YFP. This
latter result suggests that E152K mutation leads to a higher efficiency of STIM1 oligomerization.
Analysis of conformational stability of the STIM1 EF-SAM domains was assessed by monitoring
the WT or mutated domains thermal melts by far-UV- circular dichroism (CD) at 225 nm. In the
presence of Ca2+, E152K EF-SAM domain is markedly destabilized compared to WT, suggesting
a higher potency to form multimers. In the absence of Ca2+, the E152K EF-SAM domain thermal
melt curve exhibits less cooperativity in the unfolding compared to WT. To further characterize
the possible differences in biophysical properties between WT and mutated STIM1 EF–SAM
domains, the far-UV-CD spectra of these different domains at different Ca2+ concentrations was
measured. E152K mutant appears to undergo a smaller structural transformation upon Ca2+ binding
than WT suggesting that E152K may display a slower reversibility in the oligomerization
compared to WT. As reported in different studies 15, EF–SAM oligomerization is an important
Page 93
73
initiation mechanism for STIM1 full-length physiological function of STIM1 activation, and SAM
domain is a key determinant of EF-SAM oligomerization propensity.
All together these data suggest that E152K EF-SAM mutant displays wild-type-like Ca2+
characteristics in term of secondary structure and oligomerization both in the presence and absence
of Ca2+. However, differences in stability of mutated STIM1 oligomers have been observed.
4.3. Computational Modeling of the STIM1 wild type and E152K mutant.
These experimental findings were corroborated with computational modeling of WT human
STIM1 and the E152K mutant to visualize possible changes in the structure that may occur with
the mutation. Since the E152K mutation site is in the STIM1 Sterile Alpha Motif (SAM) domain,
and SAM is a protein-protein interaction motif, it is conceivable that the mutation alters STIM1
interactions with putative STIM1 partners such as SERCA, STIM2 and/or other STIM1 proteins.
We used the structure of wild type human STIM1 determined from NMR data by Stathopulos, et
al. 11 available as PDB entry 2K60 from the Protein Data Bank. 16 This entry, containing residues
58 to 201, includes the EF-hand calcium binding domain and the SAM domain. This partial
STIM1 structure is the bulk of the ER lumenal portion of STIM1 but it is missing the N-terminal
57 residues for which structure could not be discerned from the NMR data due to either random
positioning during NMR or loss of the residues during preparation. These missing residues may,
in fact, have importance in STIM1 functions, interactions and structure but that will remain to be
determined from future analysis when sufficient experimental and structural data are available. We
created the virtual mutant structure by converting the E152 residue to a lysine using Schrödinger’s
Maestro. Figure 4.1 depicts the wild type and mutant protein.
Page 94
74
(a)
(b)
Figure 4.1. Luminal portion of STIM1, EF hand is colored in magenta and SAM domain in
cyan. E152/K152 is depicted as tube sidechain in cyan as seen in (a) non-mutated and (top)
mutated protein. The calcium binding site in EF hand is the residues depicted with tube
sidechains and colored in magenta as seen in both mutant and wild type.
K152
E152
Calcium binding zone
Calcium binding zone
Page 95
75
Crystallographic conditions used in structure determination can vary from the actual in vivo
conditions. Molecular dynamics (MD) is a powerful tool that can model the motion of atoms of a
molecular system and provide computational depictions of phenomena that are difficult to view
experimentally. There are a variety of MD programs that are used such as CHARMM, AMBER,
NAMD, DESMOND and GROMACS. 17 Interpretations of experimental data and validating such
with the help of MD improves the quality of data and can assure a robust structure that can be used
for further parallel studies. 18 Therefore, we performed MD simulations on the wild type and
mutant structures to relax them into more in vivo-like conformations. This is expected to give
relaxed protein conformations that accommodate the residues while minimizing the overall energy
of the protein in simulated physiological conditions.
4.3.2. Methods.
We added residues 202-236 to provide the transmembrane residues modelled as an alpha helix
using Schrodinger’s Prime 19 so that the structure could be placed in a simulated membrane which,
in the in vivo environment, anchors the protein and restricts the direction and extent of protein
structural fluctuations. An initial simulated membrane was created (Figure 4.2 and 4.3) and the
protein was inserted into it as a single pass transmembrane protein. 11
Page 96
76
Figure 4.2. ER luminal portion of STIM1 embedded in a POPC membrane. The EF hand
portion is depicted in magenta and the SAM domain depicted in blue containing E152 in
pink. The transmembrane portion is colored green.
E152
EF-Hand domain SAM domain
Page 97
77
Figure 4.3. ER lumenal portion of STIM1 embedded in a POPC membrane viewed at an
angle to show the lumenal surface of the membrane. The EF hand portion is depicted in
magenta and the SAM domain depicted in blue containing E152 (pink). The transmembrane
portion is colored green.
This virtual complex was in a virtual box and the box was filled with water and ions. The MD
simulation box then contained over 170,000 atoms. Iterations of the MD simulation repositioned
each atom based on the forces acting on it from all the other atoms proceeding towards a
minimization of overall energy in the box. MD was run until each structure converged meaning
that frames (protein conformations) were repeating and the RMSD (root mean square deviation)
values had stabilized with minimal variations.
EF-Hand domain
SAM domain
Page 98
78
MD simulation was done using the NAMD package 2.7 and was used with the Charmm++ parallel
programming model.20 The protein was prepared for MD using Visual Molecular Dynamics
(VMD). 21 The VMD membrane plugin tool was used to setup a POPC membrane 22 and the protein
was embedded into it with VMD as well. Periodic boundary conditions were set with TIP3 water
and sodium and chlorine ions added to neutralize and ionize the system to a final concentration of
0.2 mol/L. 10,000,000 steps of step energy minimization were carried out to minimize the
system’s energy following which the system was equilibrated for 50,000,000 psec and integration
time was set to 2 fsec. A partial-mesh Ewald algorithm was used to treat long range electrostatics
with a grid spacing of 0.8 for Van der Waals and short range electrostatic interactions. The
simulation was run at a temperature of 310 K in the NVT (constant number of particles, volume,
and temperature) RMSD, RMSF and Rg were analyzed on the whole trajectory using Wordom. 23
Intramolecular H-bonds were studied on every 100 frames using the VMD timeline tool. All graphs
were made using the GRACE program. 24
On convergence, depicted by root mean square deviations (rmsd) in Figure 4.4, the simulations
were clustered 25 using Wordom to find the most common protein conformations. The top 3
clustered conformations were used for structural analysis. To ensure and understand the pka
environment of the point mutation site, Propka 26, which is an empirical tool for pka analysis
obtained from the propka server, was used. Initially 28 Å of water was allowed around the residue
and then Python 3.2 was used to run Propka on the entire trajectory to ensure suitable solvation of
the residue.
Page 99
79
Figure 4.4. RMSD (Å) shown for mutated protein containing K152. The proteins have
equilibrated during the 100 nsec equilibration run as seen above.
4.3.3. Results and Discussion.
The converged structures for wild type and the mutant proteins had differences in appearance in
that the partial charge surface depictions depicted in Figure 4.5 showed that residue side chains
could move freely while similarities in the underlying alpha helices did not remain as illustrated
in Figure 4.6. As a result, there were distinct differences in the proteins around the residue 152
site. Considering that the charges are better distributed in this scenario with R155, K156 and E151
surrounding E152, E152 is seen to be nested at the protein surface with internal H-bonds to R155
which is seen to be more exposed as compared to the crystal structure.
Time (nsec)
RM
SD
(Å
)(Å
)
Page 100
80
Figure 4.5. Partial charges are shown in the surface depictions where red denotes negative
charges, blue denotes positive charges and white is neutral). Note the faint red spot of E152
in the wild type (left) and the strong blue of K152 in the mutant.
E152
K152
EF-Hand domain EF-Hand domain
SAM domain
SAM domain
Page 101
81
(a)
(a)
(b)
Figure 4.6. Hydrophobic residues which help in unfolding of STIM1 seen in (a) non-mutated
version and (b) mutated version of the protein. The distinct differences in the conformation
of protein and helices are seen. These differences may hint at the differences observed
experimentally between the mutated and non mutated proteins. In the case of the mutation,
the hydrophobic residues are seen to begin unfolding but are still different compared to the
wild type.
Y108
Y108
K106
E94
K106
E94
Page 102
82
R155 interacts more with the second helix especially D153 , and Y150 is seen to point inwards
into the helix while the E152 remains just at or below the protein surface (the cationic K152 residue
in the mutant STIM1 did not show hydrogen bonding and stuck out from the protein surface as did
the K156 residue). R155 was sticking out towards the environment between E151 and
participating in an H-bond with it and K152 giving an additional cationic side chain exposed to
the environment. This gives a distinct visible difference in the local partial charges. Y150 here is
seen to point outwards and is solvent exposed. As a result, the mutant STIM1 shows a strong
cationic surface around the K152 site while the wild type E152 site is neutral to slightly anionic.
This difference in local charges and the accessibility of the K152, K156 and sometimes R155 could
affect protein-protein interactions of the SAM domain as shown in Figure 4.7.
Figure 4.7. (a) E152 colored in pink in the wild type human STIM1 shows consistent
hydrogen bonding with neighboring R155 in the helix and extends to interactions between
R155 and D153. (b) K152 colored in blue in the mutant human STIM1 extends
independently outward from the protein and E151 interacts with R155 thereby providing a
flexible cationic site in the SAM domain.
Page 103
83
Radius of gyration (Rg) indicates the level of compaction in a protein structure. From Figure 4.8,
the Rg is higher in the non-mutant suggesting the structure is more unfolded as compared to the
wild type protein.
(a)
(b)
Figure 4.8. Rg computed for the whole trajectory shows that the non-mutant protein (a) has
a lower Rg than the mutated protein (b). This indicates that the protein unfolding is much
less for the mutated protein than the wild type signifying defects in protein folding with the
mutation.
R
g
Trajectory
Trajectory
R
g
Page 104
84
This signifies the distinct difference between the mutant and the wild type protein. The wild type
shows more unfolding than the mutant which may be due to the mutation at Lys 152. 26
Also H-bond analysis depicted in Figure 4.9 performed every 100 frame suggests that there are
more H-bonds in the mutant than in the wild type possibly due to more unfolding in a different
pattern observed there as compared to the mutant which appears more compact.
(a) (b)
Figure 4.9. H-bonds which were calculated every 100 frames show that the non-mutated
protein (a) has fewer H-bonds than the mutated protein (b). Considering that the protein
unfolding (as seen in Fig 6) shows that the wild type unfolds more than the mutated protein,
more H-bonds signifies the protein is packed more tightly compared to the non-mutated
protein.
H
-bo
nd
s
H
-bo
nd
s
Trajectory Trajectory
Page 105
85
Figure 4.10. Propka run on MD trajectory showcases deprotonation of Glu152 and
protonation pka of Lys 152 at around 6.5 and 8.5 respectively.
Propka was run on the entire trajectory which showed that the E152 is indeed deprotonated and
K152 is protonated as would be expected when these residues are solvent exposed depicted in
Figure 4.10. 27
Protein structural stability analysis was also done using two different approaches. We started with
SDM (Site Directed Mutator) a statistical potential energy function which predicts the effect of a
mutation on the stability of the protein using conformationally constrained specific substitution
tables (ESST’s) to find differences in folded and unfolded states for wild and mutant types.28
Secondly, the Cologne University Protein Stability Analysis Tool (CUPSAT), which uses coarse
grained atom potentials and angles to predict stability of a protein on mutation, was used. 29 And
finally MuPro, which predicts protein stability using support vector machines (SVM) and neural
networks using both sequence and structural information for stability changes, was used.30 All the
methods used above have shown that the mutation will be destabilizing and hence not beneficial
in vivo.
0123456789
10LYS 152 or K152
0
1
2
3
4
5
6
7
8GLU152 or E152
Frames
Page 106
86
4.3.4. Protein stability analysis.
Stability of the protein upon mutation was tested using SDM, CUPSAT and MuPro. SDM predicts
if the mutation has a stabilizing effect on the protein and calculates free energy value changes or
pseudo delta delta G (∆∆G) values. Herein, the ∆∆G value calculated corresponds to -3.27
kcal/mole signifying destabilization. MuPro, on the other hand, predicts the increase or decrease
of stability with a confidence score. If the confidence score is <0 then the mutation is destabilizing
and vice versa. Both SVM and neural network methods give negative confidence scores of -0.528
and -0.798 % showing that the mutation is not stable. Also CUPSTAT, which gives free energy
change values, depicts that, upon mutation to lysine, there will be a destabilizing effect with a
negative predicted ∆∆G. The stability analysis hypothetically signifies that the mutation would
have deleterious effects on the protein conformation and activity.
4.4. Conclusion.
A number of previous experimental studies suggested that auto-activation of tryspin inside
pancreatic acinar cells is the main cause of cell degradation and death. Here the effect of CCK
stimulation on cell degradation in cells expressing a WT or E152K mutated STIM1 by measuring
cytotoxicity at different time points after treatment was investigated. In all experiments, basal level
of toxicity was always significantly higher in cells expressing E152K STIM1 compared to cells
transfected with an empty vector, WT STIM1 or T1531 STIM1. Stimulation with CCK induced
an increase in toxicity in all experiment conditions. All together, the data suggest that deregulation
in Ca2+ signaling induced by the expression of E152K STIM1 leads to an increase in trypsin auto-
activation inside the cells, even with a physiological stimulation, which can lead to cell death and
Page 107
87
contributes to the pancreatitis in patients carrying the E152K STIM1 mutation both experimentally
and computationally.
4.5. References.
(1) Masson, E., J.M. Chen, M.P. Audrezet, D.N. Cooper, and C. Ferec. 2013. PloS one. 8 , e73522.
(2) Etemad, B., and D.C. Whitcomb. 2001. Gastroenterology. 120:682-707.
(3) Gerasimenko, J.V., O. Gryshchenko, P.E. Ferdek, E. Stapleton, T.O. Hebert, S. Bychkova, S.
Peng, M. Begg, O.V. Gerasimenko, and O.H. Petersen. 2013. Proceedings of the National
Academy of Sciences of the United States of America. 110:13186-13191.
(4) Raraty, M., J. Ward, G. Erdemli, C. Vaillant, J.P. Neoptolemos, R. Sutton, and O.H. Petersen.
2000. Proceedings of the National Academy of Sciences of the United States of America.
97:13126-13131
(5) Feske, S. 2010. CRAC channelopathies. Pflugers Archiv : European journal of physiology.
460:417-435.
(6) Liou, J., M.L. Kim, W.D. Heo, J.T. Jones, J.W. Myers, J.E. Ferrell, Jr., and T. Meyer. Current
biology, CB. 2005. 15,1235-1241.
(7) Roos, J., P.J. DiGregorio, A.V. Yeromin, K. Ohlsen, M. Lioudyno, S. Zhang, O. Safrina, J.A.
Kozak, S.L. Wagner, M.D. Cahalan, G. Velicelebi, and K.A. Stauderman. The Journal of cell
biology. 2005.169, 435-445
(8) , C.Y., P.J. Hoover, F.M. Mullins, P. Bachhawat, E.D. Covington, S. Raunser, T. Walz, K.C.
Garcia, R.E. Dolmetsch, and R.S. Lewis. Cell. 2009. 136, 876-890
Page 108
88
(9) Wu, M.M., J. Buchanan, R.M. Luik, and R.S. Lewis. The Journal of cell biology. 2006.174,
803-813.
(10) Gerasimenko, J.V., G. Lur, M.W. Sherwood, E. Ebisui, A.V. Tepikin, K. Mikoshiba, O.V.
Gerasimenko, and O.H. Petersen. Proceedings of the National Academy of Sciences of the
United States of America. 2009, 106,10758-10763
(11) Stathopulos, P.B., L. Zheng, G.Y. Li, M.J. Plevin, and M. Ikura. Cell. 2008.135, 110-122.
(12) Bohm, J., F. Chevessier, A. Maues De Paula, C. Koch, S. Attarian, C. Feger, D. Hantai, P.
Laforet, K. Ghorab, J.M. Vallat, M. Fardeau, D. Figarella-Branger, J. Pouget, N.B. Romero,
M. Koch, C. Ebel, N. Levy, M. Krahn, B. Eymard, M. Bartoli, and J. Laporte. American journal
of human genetics. 2013. 92, 271-278.
(13) Hedberg, C., M. Niceta, F. Fattori, B. Lindvall, A. Ciolfi, A. D'Amico, G. Tasca, S. Petrini,
M. Tulinius, M. Tartaglia, A. Oldfors, and E. Bertini. Journal of neurology. 2014. 261, 870-
876.
(14) Stathopulos, P.B., G.Y. Li, M.J. Plevin, J.B. Ames, and M. Ikura. The Journal of biological
chemistry. 2006. 281, 35855-35862
(15) Luik, R.M., B. Wang, M. Prakriya, M.M. Wu, and R.S. Lewis. 2008. Oligomerization of
STIM1 couples ER calcium depletion to CRAC channel activation.
(16) Berman H.M., Westbrook J., Feng Z., Gilliland G, Bhat T.N., Weissig H., Shindyalov I.N.,
Bourne P.E. ‘The Protein Data Bank’ Nucl. Acids Res. 2000, 28 (1): 235-242. The Protein
Data Bank (http://www.rcsb.org/pdb/ )
Page 109
89
(17) (a) D.A. Case, J.T. Berryman, R.M. Betz, D.S. Cerutti, T.E. Cheatham, III, T.A. Darden,
R.E. Duke, T.J. Giese, H. Gohlke, A.W. Goetz, N. Homeyer, S. Izadi, P. Janowski, J. Kaus, A.
Kovalenko, T.S. Lee, S. LeGrand, P. Li, T. Luchko, R. Luo, B. Madej, K.M. Merz, G. Monard,
P. Needham, H. Nguyen, H.T. Nguyen, I. Omelyan, A. Onufriev, D.R. Roe, A. Roitberg, R.
Salomon-Ferrer, C.L. Simmerling, W. Smith, J. Swails, R.C. Walker, J. Wang, R.M. Wolf, X.
Wu, D.M. York and P.A. Kollman (2015), AMBER 2015, University of California, San
Francisco.
(b)Shivakumar, D.; Williams, J.; Wu, Y.; Damm, W.; Shelley, J.; Sherman, W., J. Chem.
Theory Comput., 2010, 6, 1509–1519
(c)B. R. Brooks, R. E. Bruccoleri, B. D. Olafson, D. J. States, S. Swaminathan, and M. Karplus.
CHARMM: A Program for Macromolecular Energy, Minimization, and Dynamics Calculations,
J. Comp. Chem. 1983. 4, 187-217,
(18) Wilfred,E van Gunsteren and Herman J. C. Berendsen. Angewandte Chemie. International.
1990 , 29 ,992 -1023.
(19) Andrec, M.; Harano, Y.; Jacobson, M. P.; Friesner, R. A; Levy, R. M. J. of Structural and
Functional Genomics, 2002, 2, 103-111
(20) James C. Phillips, Rosemary Braun, Wei Wang, James Gumbart, Emad Tajkhorshid,
Elizabeth Villa, Christophe Chipot, Robert D. Skeel, Laxmikant Kale, and Klaus
Schulten. Journal of Computational Chemistry, 26:1781-1802, 2005.
(21) Humphrey, W., Dalke, A. and Schulten, K., "VMD - Visual Molecular Dynamics", J.
Molec. Graphics, 1996, vol. 14, pp. 33-38. http://www.ks.uiuc.edu/Research/vmd/
(22) B Jójárt, TA Martinek - Journal of computational chemistry. Volume 28, Issue 12, pages
2051–2058, September 2007.
Page 110
90
(23) Michele Seeber, Marco Cecchini, Francesco Rao, Giovanni Settanni and Amedeo Caflisch.
Bioinformatics, 2007, 23(19):2625-2627.
(24) http://plasma-gate.weizmann.ac.il/Grace/doc/UsersGuide.html..
(25) Seeber M, Felline A, Raimondi F, et al. 2011.32(6):1183-1194. doi:10.1002/jcc.21688.
(26) Sondergaard, Chresten R., Mats HM Olsson, Michal Rostkowski, and Jan H. Jensen.
(2011.7, 2284-2295.
(27) M.Yu. Lobanov, N.S. Bogatyreva, O.V. Galzitskaya, 2008, published in Molekulyarnaya
Biologiya, 2008, Vol. 42, No. 4, pp. 701–706.
http://www.sigmaaldrich.com/life-science/metabolomics/learning-center/amino-acid-
reference-chart.html.
(28) Worth CL1, Preissner R, Blundell TL. Nucleic Acids Res. 2011 Jul;39 (Web Server
issue):W215-22.
(29) Parthiban V, Gromiha MM, Schomburg D. Nucleic Acids Res. 2006 Jul 1;34(Web Server
issue):W239-42.
(30) J. Cheng, A. Randall, and P. Baldi. In press, 2005.
Page 111
91
CHAPTER 5: CUPRIPHILIC COMPOUNDS TO AID IN PROTEASOME INHIBITION.
From “Cupriphilic compounds to aid in proteasome inhibition," Sreya Mukherjee, Robert Sparks
· Rainer Metcalf · Wesley Brooks · Kenyon Daniel · Wayne Guida. 2016, BMCL, Available
online. Copyright 2016 by Sreya Mukherjee. (Elsevier Journal)
5.1. Introduction.
In cancer, therapy can be as debilitating as the disease itself considering that current treatments are
often accompanied by severe toxicities in patients. These toxicities prompt continuing
investigation into new therapies with reduced, or preferably, no toxic effects. Whereas treating
cancer cells without toxicity in normal cells is the ultimate goal of drug discovery, this task has
met with limited success due in large part to the difficulty of finding therapeutics that can
distinguish cancer cells from normal cells.
Copper, which has the ability to adopt both oxidized (Cu2+) and reduced (Cu1+) states, is an
essential trace element for various metabolic processes in living organisms. 1 There are several
enzymes that use copper for processes necessary for carcinogenesis such as extracellular matrix
degradation, endothelial cell proliferation, and migration mediated by integrins. 2, 3 Due to its role
in important physiologic processes, including metabolism, the concentration of copper in
organisms is tightly regulated. 4, 5 Copper is an element that plays an essential role in tumor
development, angiogenesis, and metastasis 6-10. Experimental evidence exists that shows tumor
Page 112
92
tissues possess both elevated copper and altered copper/zinc ratios in a stage dependent manner
across multiple types of carcinomas. 11 However, these studies of the disposition of trace metals
within cancer patients comparing normal tissues to cancerous tissues have been limited. In most
of the studies focusing on copper, zinc, iron, and selenium, it has been observed that the copper
concentrations, as opposed to other metals, were almost always found to be elevated compared to
age matched samples from normal tissue. 12-15 For example, elevated serum copper levels in cancer
patients have been reported in a wide variety of tumors in the following tissues: breast, cervical,
ovarian, lung, prostate, and stomach. 16-19
The biomolecular target of the present study, the proteasome, contains a 700 kDa barrel-shaped
core particle formed by four axially stacked heptameric rings. These rings include the β subunits
that possess six proteases whose active sites face an interior lumen where proteolysis occurs. These
active sites further possess a catalytic region (S1) which includes the catalytic THR1 residue and
recognition region (S3). The 20S proteasome, which is the proteolytic core of the 26S proteasome
complex, contains multiple peptidase activities including the chymotrypsin-like (CTL), trypsin-
like (TL), and peptidylglutamyl peptide hydrolyzing (PGPH) or caspase-like activities. The
proteasome is involved in oncogenic events such as up-regulation of cellular proliferation,
angiogenesis, down regulation of apoptosis, and drug resistance. 20-24 Pursuing proteasome
inhibition is a clinically validated therapeutic strategy .25, 35 For example, proteasome inhibition is
believed to result in buildup of abnormal or damaged proteins that triggers apoptosis. Figure 5.1
depicts the 20S proteasome containing β subunits 4, 5, and 6 which are important in mediating the
CTL activity of the proteasome. Copper is placed here in cyan based on quantum calculations
discussed later.
Page 113
93
Figure 5.1. β4 (green), β5 (magenta) and β6 (blue) subunits of 20S proteasome. Copper is
depicted in cyan. The three subunits play an important role in mediating the CTL activity in
the proteasome.
Experiments performed by Daniel et al. have shown that addition of copper complexing
compounds (independent of the salt form) to copper, had similar potency to inorganic copper salts
in purified protein assays. 26 However, these compounds displayed substantially increased potency
on human leukemia cancer cell lines. Thus, treatment of Jurkat T-cells with an 8-hydroxyquinoline
copper mixture induced loss of viability in cell cultures. This effect was not observed upon
treatment of Jurkat T-cells with 8-hydroxyquinoline alone or copper alone.
We also performed experiments on immortalized MCF-10A, premalignant MCF10AT1K.cl2,
malignant MCF10DCIS.com and normal MDA-MB-231 breast cell lines, which were treated with
copper complexing compounds clioquinol or pyrrolidine dithiocarbamate, in the presence and
absence of copper, followed by measurement of cell survival rate. CTL activity of proteasome
Page 114
94
inhibition and apoptosis were also determined by levels of the ubiquitinated proteins in protein
extracts of the treated cells and showed that clioquinol or pyrrolidine dithiocarbamate become
active proteasome inhibitors and breast cancer cell killers in the presence of copper. These prior
literature and experimental facts have brought to light the possibility of targeting tumor growth,
angiogenesis, and metastasis with cupriphilic compounds. 27 In an attempt to do so, our lab is using
small molecules with a propensity to bind copper, cost effective synthesis, and a high potential for
rational synthesis of analogues.
With elevated copper levels as a marker, we hypothesize that our compounds can be used
specifically against tumor cells with minimal impact on normal cells and may alleviate toxicities
seen in current chemotherapeutic treatments.
Previous studies show that in cellulo assembled copper-activated proteasome inhibitors have
apoptosis-inducing effects on a wide array of solid tumors and no measurable effect on normal
cells. 27 Yet, the field of copper-activated proteasome inhibitors has stalled due to lack of
therapeutically suitable compounds. Only a very small number of organic scaffolds have been
studied with respect to complexation with copper for proteasome inhibition in cancer cells,
including: pyrrolidine dithiocarbamate , 27 8-hydroxyquinoline (8-HQ), 27 clioquinol (CQ), 26 and
disulfiram. 28 Prior studies have shown that these compounds have differential effects in
immortalized, pre-malignant, and malignant breast cancer cells. 27
In the present study, our lab has utilized computational screening followed by experimental testing
in an in vitro biochemical assay to discover a new set of compounds that, according to the
hypothesized mode of action, should be selective for induction of apoptosis in tumor cells via
proteasome inhibition. The compounds identified presumably could act as pro-drugs, becoming an
Page 115
95
active drug in the presence of copper in tumor cells, and then inducing apoptosis by proteasome
inhibition.
5.2. Methods.
Virtual screening was performed on compounds contained within the NCI Diversity Set 3 36 against
the 20S proteasome model. Schrödinger’s Maestro 9.3.5 was used as the primary graphical user
interface for molecule structure preparation and Schrödinger applications were used for analysis.
Quantum mechanical refinement of copper interactions with the THR1 in the active site using Q-
site 29 and Jaguar 30 with B3LYP / LACVP* allowed for placement of copper and the assignment
of partial charges on THR1 and the copper ion. The virtual screening method employed the
modified yeast 20S proteasome crystal structure derived from PDB ID: 1IRU. 31 Ligands from the
NCI Diversity Set 3 were prepared with LigPrep 32 and metal binding sites were added for
generation of appropriate ligand states to interact with the copper ion. The standard precision (SP)
setting in GLIDE was used for docking to incorporate metal binding sites. 33 Out of 1597
compounds, 62 were selected by the virtual screening method, which were then tested at 10 µM in
the presence of 1 µM copper.
A Beckman Coulter Biomek FXP Lab Automation Workstation was used for the automated assay
runs. The assay was performed in 384-well black Nunc plates. The process involved the addition
of 2 μL compound in DMSO added to 28 μL buffer (50 mM Tris; pH 7.6, 37°C), with 20 μM, 10
μL 20S proteasome, and 10 μL of suc-leu-leu-val-tyr-AMC substrate and the rate of substrate
cleavage/20S proteasome activity was determined. The assay in the presence of copper chloride
solution involved addition of 3 μL of the copper solution and decrease in the amount of buffer
solution to 25 μL. To allow chelation of copper to the compound, the plate was allowed to sit for
Page 116
96
40 minutes with gentle shaking. The overall volume per well was kept constant at 50 μL. The
compounds and substrate were initially dissolved in 100% DMSO, but the final concentration of
DMSO per well plate was brought down to below 2% following subsequent dilutions. Plates were
incubated at 37°C for 2 hours. A Perkin Elmer 2102 multi-label plate reader was used for
fluorescence measurement. The plates were read using 340 nm excitation and 460 nm emission
filters. All liquid transfers to the plates were performed using the Biomek workstation. Six lead
compounds, depicted in Figure 5.2, exhibited greater than 80% proteasome inhibition in the
presence of 1μM copper. Disulfiram, a well-known copper chelating compound, and copper
alone were used as controls in the experiment. For dose-response curves, the concentrations of
copper chloride and compound were varied to find the greatest percent inhibition and results have
been reported herein.
To understand whether other metals were interacting with the compound, a solution of metals
such as nickel, calcium, iron, zinc and copper chloride were taken and tested in the same way as
mentioned above with the compound. The inhibition of proteasome was to the same order as that
for copper chloride for the same conditions suggesting that this is a copper specific phenomenon.
Hence prior literature of compound complexing and inhibiting the CTL activity of the proteasome
as well as experiments confirm that these molecules bind to copper only.
Page 117
97
Figure 5.2. Compounds that show proteasome inhibition.
5.3. Results and Discussion
A series of novel copper-activated proteasome inhibitors was identified from NCI Diversity Set 3
that exhibited greater than 80% inhibition of the 20S proteasome when assayed at 10 µM in the
presence of 1 µM copper. In a dose-response assay, NSC 37408 gave the best results with an IC50
of 3 µM in presence of 100 nM copper.
Page 118
98
-4 -2 0 2 4 6
0
2 5
5 0
7 5
1 0 0
lo g (M )
% i
nh
ibit
ion
c o m p o u n d a lo n e
0 .1 u m C u C l2 + c o m p o u n d
C u C l2 a lo n e
Figure 5.3. The purified protein dose response curve for NSC 34708 showing copper alone
(blue), compound alone (black), and compound with copper (red) depicts a dramatic
improvement of percent inhibition by the compound in the presence of sub-micromolar
copper. Copper alone at that concentration exhibits little to no observable inhibitory activity
(each experiment was done in triplicate, relative error < 10% for all 3 experiments).
Figure 5.3 depicts the dose-response curves for proteasome inhibition with copper alone,
compound alone, and compound with 100 nM copper. This shows a dramatic improvement with
the compound in the presence of 100 nM copper, while copper alone or compound alone at that
concentration exhibits nominal activity.
The hypothesis considered for building the proteasome model is that Cu (II) coordinates to the
NH2 and OH groups of THR1 in the active site, followed by binding of our compounds to this
complex. Assuming coordination of Cu (II) with THR1, quantum mechanical modeling of Cu (II)
interactions with THR1 was done using Q-Site, which assisted in the placement of copper into the
β5 active site and the assignment of appropriate partial charges on THR1 and copper. Virtual
screening conducted on the ligands from NCI Diversity Set 3 allowed the selection of top-ranking
compounds that were then assayed for inhibition of the CTL activity against purified 20S
proteasome. Each compound was tested in the presence and absence of copper chloride; 6 were
Page 119
99
found to inhibit the proteasome with greater inhibition at 10 µM when assayed in the presence of
100 nM copper and no or sometimes minimal inhibition was observed without copper. As
previously known, copper alone can serve as a weak inhibitor of the proteasome under our assay
conditions and, therefore, was included as a control in the experiment.
Disulfiram, a known copper chelating compound, was used as a positive control which exhibited
92% inhibition of CTL activity at 10 µM when assayed in the presence of 1 µM copper, whereas
NSC 37408, showed 80% inhibition at 10 µM with 1 µM copper. This compound is being pursued
because it is amenable to lead optimization and it possesses a unique chemical scaffold compared
to previously used cupriphilic proteasome inhibitors. Many of the top-ranking compounds, as
depicted in Figure 3, have phenolic hydroxyl groups and carboxylic acids moieties which have the
propensity for copper binding. The coordination of these functional groups to copper is well
understood in the chemical literature. 34 As demonstrated by the assay, this class of cupriphilic
compounds has the ability to bind copper and enhance proteasome inhibition, even in the
submicromolar range. Figures 5.4 and 5.5 demonstrate a possible mode of action and binding sites
of these compounds in the active site of the proteasome. As per our model and docking methods
used for NSC 37408, the C7 phenolic hydroxyl group (7-OH) and the ether moiety are expected
to coordinate with copper. pKa calculations with Jaguar suggest a pKa of 3.9 for the 7-OH
substituent, consistent with a vinylogous carboxylic acid as shown in Figure 5.5. Additionally, the
β5 subunit has a well-defined binding pocket formed between THR1, THR21 and GLY47 which
could potentially harbor the copper complex.
Page 120
100
Figure 5.4. GLIDE SP-docking pose of NSC 37408 (shown as green tubes) bound to copper
(shown in cyan) in the active of site. The β5 subunit of the proteasome is shown in magenta.
Figure 5.5. NSC 37408 (shown in green) bound to copper (shown in cyan) fits into a well-
defined pocket between the residues THR21 , THR1 and GLY47 in the β5 subunit of the
catalytic site of the proteasome.
Page 121
101
5.4. Conclusions.
In conclusion, rational drug discovery methods resulted in the successful identification of
compounds that inhibit the CTL activity of the proteasome following their coordination to copper
as suggested by the computational and biochemical assay results. The computational methods
helped remove 96% of the compounds (only 62 compounds out of 1597 were tested) and the
biochemical assay was able to detect decoys and further remove 90% of false positives from the
virtual screen (6 true positives out of 62). The compound pursued (NSC 37408) exhibited a 3 µM
IC50 against the proteasome in the presence of 100 nM copper (with nominal inhibition in the
absence of copper), and further SAR studies on this compound are planned to showcase its
amenability to design of analogues with better in vitro and in vivo properties. Determination of
inhibition of other subunits of the proteasome will be pursued with further experiments.
5.5. References.
(1) Labbe, S.; Thiele , D.J. Trends Microbiol. 1999, 7, 500–505
(2) Guptea, A.; Mumper, R.J. Cancer Treatment Reviews . 2009, 35, 32–46.
(3) Turski, M.L.; Thiele , D.J. The Journal Of Biological Chemistry. 2009 , 2, 717–721.
(4) Tapiero, H.; Townsend, D.M. ; Tew , K.D . Biomed Pharmacother. 2003, 57, 386-98.
(5) Linder, M. Plenum Press, New York , 1991.
(6) Gullino, P. M. Anticancer Res. 1986, 6, 153-8.
(7) Brewer, G.J. Exp Biol Med (Maywood), 2001, 7, 665-73.
(8) Eatock, M.M.; A. Schatzlein ; S.B. Kaye. 2000, 26, 191-204.
Page 122
102
(9) Fox, S.B.; Gasparini, G.; Harris, A.L. Lancet Oncol. 2001, 5 , 278-89.
(10) Theophanides, T.; Anastassopoulou, J. 2002, 42 , 57.
(11) Neslund-Dudas, C., et al. Biol Trace Elem Res. 2014, 157 , 107-12.
(12) Brem, S. 1999, 5, 436-458.
(13) Brewer, G.J. Exp Biol Med (Maywood), 2001, 226, 665-73.
(14) Chan, A.; Wong, F.; Arumanayagam, M. Ann Clin Biochem, 1993 ,30, 545-9.
(15) Scanni, A., et al. Tumori, 1977, 2, 175-80.
(16) Turecky, L., et al. Klin Wochenschr, 1984, 4, 187-9.
(17) Zowczak, M., et al. J Trace Elem Med Biol, 2001, 15, 193-6.
(18) Zowczak, M., et al. Biol Trace Elem Res, 2001, 82 , 1-8.
(19) Arooj, B., et al. J Ayub Med Coll Abbottabad, 2012, 24, 62-4.
(20) Adams, J. Oncologist, 2002. 7 : p. 9-16.
(21) Almond, J.B.; Cohen , G.M.. Leukemia, 2002, 16, 433-43.
(22) Dou, Q.P.; Goldfarb , R.H. IDrugs, 2002, 5, 828-834.
(23) Dou, Q.P.; Li, B. Drug Resist Updat, 1999, 4, 215-223.
(24) Tsvetkov, L.; et al. Expert Opinion on Drug Discovery, 2010, 12, 1221-1236.
(25) Rosen , P. J. ; Lee, M.G.; Sausville , E.; Papadopoulos, K. P.; Wong , A. F.; Vallone, M.;
Kunkel, L.; Infante ,J. ; Burris , H. A. III. Journal of Clinical Oncology, 2009 ASCO Annual
Meeting Proceedings (Post-Meeting Edition). 2009, 27, 15S, 3515.
Page 123
103
(26) Daniel, K.G., et al. Biochem Pharmacol, 2004, 67, 1139-51.
(27) Daniel, K.G., et al. Breast Cancer Res. 2007, 7 , R897-908.
(28) Chen, D., Cui Q.C, Yang, H., Dou Q.P. Cancer Res, 2006, 21, 10425-33.
(29) Murphy, R.B.; D.M. Philipp.; R.A. Friesner. Journal of Computational Chemistry,
2000,21, 1442-1457.
(30) Bochevarov, A.D., et al. Int. J. Quantum Chem, 2013. 113, 2110-2142.
(31) Groll, M.; Ditzel, L.; Löwe, J.; Stock, D.; Bochtler, M.; Bartunik, H.D.; Huber, R. Nature.
1997, 386, 463-71.
(32) Schrödinger Release 2014-1: LigPrep, version 2.9, Schrödinger, LLC, New York, NY,
2014.
(33) Halgren, T.A.M.; Friesner, R. B.; Beard, R. A.; Frye, H. S.; Pollard, L. L.; Banks, W. T. J
Med Chem. 2004 , 47,1750–1759.
(34) Timberlake, C.F. J.A.C.S. 1959, 2795-98.
(35) Chen, D.; Frezza,M.; Schmitt, S.; Kanwar J.; Dou, Q.P. Curr Cancer Drug Targets. 2011,
11, 239-253.
(36) http://dtp.nci.nih.gov/branches/dscb/diversity_explanation.html
Page 124
104
CHAPTER SIX: DETERMINATION OF NOVEL INHIBITORS OF CRUZAIN USING
STRUCTURE BASES DRUG DESIGN.
6.1. Introduction.
Chagas Disease (American Trypanosomiasis), is a life threatening disease categorized as a
neglected disease by the WHO, that is endemic to Latin America but also found in parts of North
America, Europe and Western Pacific countries. Presently, estimated to infect 7-8 million people
in the world, 1 this disease is caused by the protozoan parasite, Trypanosoma cruzi with the
triatomine bug serving as the vector for spreading the disease and being the causal agent of
infection. Chagas disease is spread to different parts of the world mainly due to the migration of
patients with the disease. There are other trypanosomids such as Trypanosoma brucei which causes
African sleeping sickness disease, and others causing disease in animals in cattle’s, horses etc.
Trypanosomids are characterized by them being unicellular and flagellates with various hosts in
the life cycle.
T. cruzi has one of the most complex life cycles involving various developmental stages found in
vertebrates and invertebrates hosts and also bloodstream of the hosts. The lifecycle is depicted in
Figure 6.1 below.
Page 125
105
Figure 6.1. Lifecycle of Trypanosoma cruzi. 4
The cycle starts with the insects belonging to the Reduviidae family such as the triatomine bugs
taking a blood meal from an infected human host containing the infected trypomastigote form in
the bloodstream. The ingested trypomastigotes are mostly digested in the gut of the bug but the
remaining ones escape to the intestine and transform into the epimastigote form which attach onto
the interstitial cells of the midgut. This adhesion to the midgut helps in transforming the
epimastigotes into the infective trypomastigotes which are then released together with feces and
urine. The bugs can take in the infected forms via feeding and the same cycle repeats in the gut of
the bug. When taking a blood meal in the human the bug then defecates which contains the infected
trypomastigotes and then reaches the human body via following three stages including adhesion
Page 126
106
and recognition of the molecules on the human cells, signaling and finally invasion into the body.
Once into the body, the macrophages form a parasitophorous vacuole around the infective form
which inside the vacuole differentiates into an amastigote form which differentiates via binary
fission rapidly. Finally it releases enzymes to release the trypomastigotes which rapidly invade the
other organelles in the body. 5
Two major drugs approved by the WHO for use in the acute phase of the disease are Benznidazole
and Nifurtimox, chemical structures of which are shown in Figure 6.2. 1 The acute phase usually
is the shortest phase of the disease and is known to not be very symptomatic. The usual symptoms
are fever, mild rash, cold etc ones that are easily mistaken to be not crucial. The phase lasts for
two months and then the parasites move onto a undefined indeterminate phase which can last for
some time and then moves onto the chronic phase lasting sometimes up to 10-20 years. 1
Figure 6.2. Chemical structures of drugs for Chagas disease
6.1.1. Cysteine protease.
Cysteine proteases are divided into 20 families and grouped into 3 clans. The first clan or the
‘papain like proteases’ comprises of C1, C2 and C10 families. Cathepsins B, F, K, and L belonging
Page 127
107
to this clan are involved in rheumatoid arthritis, cancer, osteoporosis, and atherosclerosis while
falciparin, cruzain and rhodesain are targets against malaria, chagas and sleeping sickness. Various
studies over the years have focused on finding the most important etiologic agent in the progression
of the disease. Cruzain or Cruzipain a cathepsin L –type cysteine protease found only in the
Trypanosoma cruzi, is involved in essential functions of the growth and is indeed important for its
survival by helping in the growth of extracellular epimastigotes, the intracellular amastigotes and
also the transformation of epimastigotes to trypomastigotes . 8 Cruzain is the major etiologic agent
against Chagas disease and is required by the parasite for its survival. Thus targeting this enzyme
illustrated in Figure 3, provides a means for controlling the disease. 3 Cruzain is a GP 57/51 which
is the most abundant member of the papain C1 family.
Also cruzain is homologous to cathepsin-L, an enzyme which is located deep into the lysosomes,
an area which is not accessible to drugs making cruzain an excellent target. 9 Some of the important
residues have been highlighted in Figure 6.3. Considering the importance of this enzyme, various
research groups have focused on finding an inhibitor for this enzyme to be used for the acute phase
of the disease.
Page 128
108
The Cruzain active site contains a catalytic triad Cys25, His162 and Asn182 depicted in Figure 6.4
(in green). The mechanism of the triad is as follows: The Asn182 hydrogen bonds with the His
162 enabling the formation of an imidazole-thiolate ion pair between Cys25 and His162. Another
amino acid Gln19 stabilizes the acyl-enzyme intermediate by forming a hydrogen bond between
amine group in Gln 19 and the substrate. The mechanism of the enzymatic activity has 3 main
postulates. The first is that the serine-protease like mechanism where the first step is the
nucleophilic attack on the substrate by the thiolate followed by its stabilization of the transition
state of the reaction via hydrogen bond between substrate and backbone NH of Cys25 and finally
stabilization of the tetrahedral intermediate via hydrogen bonding between Gln 19 and the ligand.3
The second mechanism is a proton transfer from the imidazole to the amide to form acyl-enzyme
complex followed by attack of water which deacylates the complex yielding the final product.
A third proposed mechanism entails the protonation of oxygen or nitrogen in substrate via proton
transfer between His 162 prior to or in concretion to the nucleophilic attack. 3
Thereby, it is understood that electrophilic groups in ligands can aid in formation of the covalent
bond that needs to form initially for the triad mechanism. Vinyl sulfones, aziridines, nitriles ketone
based etc. have shown good activity against cruzain.6, 7 but inhibition of cruzain via different
classes of compounds contained in a peptoid have not been studied theoretically or experimentally.
Page 129
109
Figure 6.3. Crystal structure of cruzain showcasing some of the important residues required
for the enzymatic activity.
Page 130
110
Figure 6.4. Surface view of cruzain, depicting the active site of cruzain containing Cys 25
(blue), Asn 182 and His 152 (in green )
Considering the importance of this enzyme, various research groups have focused on finding an
inhibitor for this enzyme to be used for the acute phase of the disease. Considering that protein-
protein interactions 18 are difficult to interrupt , various cysteine protease small molecule inhibitors
have been designed to block the activity of cruzain (PDB id. 1ME4, res. 1.10 Aº) and are still not
effectively helping in cure of the disease. Peptidomimetics can play a vital role to overcome issues
that small molecules cannot effectively counter. Building modified peptide structures or peptoids
can not only prevent recognition and proteolysis of these molecules but also provide metabolic
stability, better bioavailability and long duration of action along with specificity. 17 In terms of
Page 131
111
inhibitors various classes of small molecules have been discovered but not with very good activity.
9,11 Peptidic inhibitors containing sulfones, ketones and diazomethane (irreversible) and also aryl
urea, ketone based, nitrile based ones (reversible) have been made. But none have been studied
clinically. Herein it has been shown that peptoids containing ketones can be suitable candidates
for drug discovery of cruzain via the development of a reversible inhibitor for this enzyme that
will help in control of the disease considering that irreversible inhibitors have their own share of
toxicity and side effects associated with them. 11
6.2. Methods.
Development of a drug molecule is an extensive process and is getting tougher by the day due to
cost, time and efficacy issues. A drug molecule is one that forms a complex with a biomolecule in
order to conduct a specific purpose as a substrates or signal transmitters. They can be noncovalent
or covalent in mature. Covalent inhibitors react with the active site of the target protein in order
to form a covalent complex that impedes protein function, though it can be reversible or
irreversible, depending on the reverse reaction rate. The most notable adverse reactions associated
with metabolic reactions that result in the formation of chemically reactive intermediates, such as
free radicals, that may alter and covalently bind to host cell DNA or proteins. The need for new
drugs is always there and thus advances have been seen in the field of medicinal chemistry in the
arena of combinatorial chemistry, high throughput screening and virtual screening. Compared to
traditional screening which may take a very long time and involves long hours of synthesis by a
chemist followed by assays to determine efficacy, and also HTS experiments which are
tremendously costly, Virtual Screening (‘VS’, a.k.a. in silico or computer-based screening) used
here as a starting point and is also maturing as the hit identification strategy. 12 VS is a process
Page 132
112
where a large number of compounds usually termed as the virtual library is reduced to a smaller
number of enriched compounds via computer algorithms which are further tested experimentally.
Via the computer program compounds are scored or prioritized based on their predicted activity
and then finally manual selection of compounds leads to proposal of compounds for experiments.
Virtual Screening has been incorporated into drug discovery campaigns as a means of reducing
costs.
Knowledge of the receptor protein is critical for a good VS and can be obtained from X-ray, NMR,
homology modeling etc. Molecular dynamics is a powerful tool that can model the motion of atoms
of a molecular system and serve as a computational microscope to view phenomena that are
difficult to view experimentally. There are various MD program that are used such as CHARMM,
AMBER, NAMD, DESMOND and GROMACS. In this case our studies were done using
Desmond developed by D.E Shaw research. Interpretations of experimental data and validating
such with the help of MD improves the quality of data and can assure a robust structure that can
be used for further parallel studies. A structure which is in agreement with an MD relaxed protein
can be considered a good starting point. But there are reports in the literature where these data
sometimes have been false positives, and MD studies have been shown to be incorporated can give
rise to more reliable protein-ligand complexes. 13 The drawbacks in the docking programs are the
lack of flexibility of the protein in question which in vivo is typically very flexible. Thus, by not
permitting it to move can result in conformation of ligand binding which may not be reliable. In
our case, cruzain was equilibrated for 25ns using Schrodinger’s DESMOND in a water containing
ions environment to reach its stable form and that structure which was then further used for docking
studies. The published 3D structures available from the protein data bank has 91,761 structures as
of June 25, 2013 and resolutions of ≤2.0 å are preferred so the position of individual atoms are
Page 133
113
discernible.
The scaffold for computational use has been shown in Figure 6.5. This peptoid structure would be
synthesized using primary amines. The R2, R3 groups as seen would be part of the R groups on
the primary amines and would be prepared computationally manually and with Combiglide 14, a
Schrodinger Suite program was used to build the combinatorial library. 180 primary amines were
chosen from Scifinder with H2N-CH-C restraints and the primary amines which contained extra
nucleophilic groups such as amides, acids and anilines were rejected. The R4 group was used to
increase the solubility of the peptoid.
Following this, LigPrep 15 was used to generate the different tautomers, stereoisomers, and ionic
states of these groups. These prepared structures, were then used for the docking studies. As
mentioned before molecular dynamics was performed on the 1ME4 cruzain structure prior to
docking to equilibrate the protein for 25ns till equilibration was achieved. All-atom structures of
the cruzain were constructed using the Maestro Protonation states were assigned to ionizable
residues according to the pKa based on pH = 5.5 using the Protein Preparation workflow in
Maestro and the Epik module considering that cruzain is contained in a reservosome which stores
cruzain is at that pH.
The protein was then placed in a cubic cell, with size adjusted to maintain a minimum distance of
10Å to the cell boundary, and soaked with a pre-equilibrated box of water using the System Builder
module of the Desmond 16 package. All overlapping solvent molecules were removed and an
appropriate number of counter ions were added to maintain charge neutrality and the final
concentration was increased to 0.2 mol/L (in vivo condition). All molecular dynamics (MD)
simulations were performed using the Desmond package. The OPLS 2005 force field was used to
model all peptide interactions, and the TIP3P model was used for water. The particle-mesh Ewald
Page 134
114
method (PME) was used to calculate long-range electrostatic interactions with a grid spacing of
0.8. Van der Waals and short range electrostatic interactions was smoothly truncated at 13.0.
Nose–Hoover thermostats was utilized to maintain the constant simulation temperature and the
Martina–Tobias–Klein method was used to control the pressure. The equations of motion was
integrated using an inner time step of 2fs for bonded interactions and non-bonded interactions
within the short range cutoff. The system was equilibrated with the default protocol provided in
Desmond, which consists of a series of restrained minimizations and molecular dynamics
simulations designed to slowly relax the system, while not deviating substantially from the initial
protein co-ordinates. The simulation was run at a temperature of 310 K in the NVT (constant
number of particles, volume, and temperature) ensemble with solute heavy atoms restrained with
force constant of 50 kcal⁄ mol. The relaxed protein was then used for further docking. Here, the
peptide docking program was used for docking the ligands. As standard, Glide docking studies use
a rigid receptor, which in reality is not the case, hence, to accommodate the altering of the receptor
binding site to conform to the shape and binding mode of the peptoid ligand peptide docking was
used. Glide uses a Monte Carlo algorithm. For peptide docking, Glide scores the ligands based on
their MM-GBSA scores which it translates to a G-score parameter. Following VS, visual analysis
of the top ranking ‘hits’ (~top 10%) was done to proceed towards further minimization and
simulations discussed later.
Page 135
115
Figure 6.5. Peptoid structure to be used as the inhibitor for cruzain.
For virtual screening, Glide limits molecules to ≤ 50 rotatable atoms, and due to the time required
for screening very large libraries, development of the large entries were a definite concern. To
keep the Glide docking fast and effective, the size of the underlying scaffold to a workable scaffold
subunit and restrict its flexibility to control the range of poses tested for each entry. Combiglide
was used to complete the entire peptoid structure. As mentioned, the ketone based group which
will be used onto the peptoid as R1 group. Herein a few inhibitors (reversible) warheads were
taken from the literature which would be added on to the peptoid mainly because, there is already
evidence that these compounds are potential small molecule inhibitors. Hydromethylketones
which is a class of compounds that were synthesized as potent reversible inhibitors of cruzain was
used as warheads. 24 The structures chosen herein are depicted in Figure 6.6.
Figure 6.6. Hydroxymethyl ketones : Reversible inhibitors for Cruzain.
Page 136
116
The compounds in Figure 6.6.would act as the R1 and R2 groups as they are potent inhibitors of
cruzain. The other groups attached in the X position as seen in Figure 6.7, were also found to be
contributors to cruzain inhibition as per literature. Thus these compounds were to be used as
warheads as well on the peptoid scaffold as shown in the Figure 6.7.
Figure 6.7. Compounds to be used as warheads onto the peptoid scaffold.
R7
R1 R2 R3
R4 R5 R6
R10
R8 R9
X
R11
Page 137
117
As mentioned previously, Glide docking keeps the receptor rigid and docks the different
conformations of the ligand docked and when this library was screened, the peptoid was seen to
dock without maintaining the structure as expected. The beta peptoid structure was too flexible
and was not forming the entire beta peptoid with the intramolecular hydrogen bonds as shown in
Figure 6.5. Hence a conformational search was conducted using Schrodinger Macromodel to
conclude on the secondary structure formation of the peptoid.
6.2.1. Conformational Search performed on the peptoid.
The word ergodic is a mixture of two Greek words: ergon which means work and odos which
means path. The ergodic theory states that“ it is the study of the long term average behavior of
systems evolving in time. The collection of all states of the system form a space X, “ 25 hence the
importance of sampling cannot be stressed enough. To ensure that ergodicity of a molecule is well
explored, a variety of sampling procedures were used. Schrodinger’s MacroModel conformational
searches typically cycle through the process of generating a new structure, minimizing it, and then
determining if the structure should be retained. A few types of searches included Monte Carlo
Multiple Minimum (MCMM) which is great in performing global searching and exploring close
as well as distant areas of the potential energy surface. 26
Low-Mode Conformational Search Methods (LCMS) is a great method if there is little or no prior
knowledge of the system to be searched. And the Mixed MCMM/Low-Mode Conformational
Search Methods combines both MCMM and LMCS methods to perform the search.26
The peptoid herein is a beta peptoid structure as discussed in chapter one 27 where intramolecular
hydrogen bonds are expected to hold the structure together. To explore this, a conformational
search with two approaches were looked into. In the first stance, the peptoid was subjected to an
Page 138
118
unconstrained macromodel minimization and followed by unconstrained and constrained
conformational search respectively on the unconstrained peptoid structure with the constraints
being 2.1 Å intramolecular distance and H-bond angle of 120 +_ 10°; and then followed by
assessing the structures to find the lowest energy structure from the resulting searches. In the
second stance, the peptoid was subjected to a constrained macromodel minimization with same
constraints as discussed above and then followed by both constrained and unconstrained searches.
The energy windows varied here ranged from 15KJ , 21 KJ and 100KJ. The lowest energy
structures generated from these were checked to understand what the stable conformation could
possibly be. Low mode and also Mixed MCMM/Lowmode searches were performed. From all the
different variations of searches performed, it was observed that most of the conformations did
not retain the beta hairpin structure. Only when the structure was constrained for minimization and
then constrained during the conformational sampling using distance of 2.1 Å H-bond distance and
H-bond angle of 120 +_ 10 ° with lowmode search gave the beta form as the lowest energy
structures , a few of which are depicted in Figure 6.8 below.
Page 139
119
a)
Figure 6.8. a) Initial conformations before any macromodel search was conducted. b) Stable
conformations taken by the beta hairpin structure following constraints show that peptoid
retains this conformation only after the constraints are placed.
It was concluded that the peptoid scaffold possibly does not take the beta hairpin conformation
which was also shown experimentally via NMR studies. Hence a second hybrid-cyclic peptoid
structure 28 was considered instead of the previous non cyclic peptoid. The hybrid peptide –peptoid
cyclic structure is depicted in Figure 6.9 below. This cyclic peptoid still contained the
hydroxymethyl ketone warhead and instead of two other R groups, it had only one position for the
R group which would contain side chain of the primary amines. And to increase the solubility of
the peptoid, a serine moiety was added onto the other end.
b)
Page 140
120
Figure 6.9. Cyclic peptide-peptoid hybrid scaffold containing the hydromethyl ketone
warhead.
Combiglide was used to prepare the library of peptoids with the different R groups from the
primary amines selected earlier attached, to the nitrogen group on the chain. This library was then
prepared with Ligprep to include tautomer’s and different protonation states of the ligands. The
peptide docking function of Glide was used for docking the compounds and then the top 200
compounds were then minimized using Macromodel’s embrace function. 26
Macromodel’s Embrace (MBAE) or Multi-ligand Bimolecular Association with Energetics is a
method for automatically minimizing or performing conformational searches on prepositioned
ligands in the active site of a protein and obtaining energetic information related to the association
of the ligands with the protein and was used for minimizing the protein after the peptide docking
29 was completed. This program was used for further minimization of the ligand in the receptor.
Page 141
121
6.3. Results.
The prepared protein structure after being subjected to molecular dynamics for 25ns was clustered
using Desmond. The clustered pose of the protein, that is the most commonly occurring
conformation after equilibration was then analyzed. The RMSD analyses in Figure 6.10 show that
the protein was equilibrated over its run of 25 ns.
Figure 6.10. RMSD plot displaying results of Molecular Dynamics equilibrated over 25ns.
The hydroxymethyl ketone ligand in the crystal structure was docked in place onto the protein
ligand binding site with the help of Glide and the poses were analyzed and on superimposing the
top most scored pose with the original crystal structure was found to be dock in the same way as
seen in the crystal structure as depicted in Figure 6.11.
Time (ns)
RM
SD
Å
Page 142
122
Figure 6.11. The crystal structure of the protein depicted with blue ribbon with the ligand
depicted in grey. The post molecular dynamics structure is depicted in orange ribbons with
the ligand colored green. The superimposed structures show almost similar conformations.
This shows that the binding pocket was remarkably stable and hence was deemed stable for the
further studies.
The entire peptoid library after screening with peptide docking where the top ligands which are
scored with the help of MM-GBSA in this program were enriched manually from the set, the top
200 ligands were minimized using Macromodel’s Embrace. These ligands were then analyzed
manually and the top 5 ligands under the 2 Kcal/mol range were analyzed and the ones with best
interactions with the active site was chosen and then short molecular dynamics were run on each
of them. The best peptoid structures have been discussed below.
Page 143
123
6.3.1. [2-(4-fluorophenyl)-propylamine] containing peptoid.
The cyclic peptoid containing 2-(4-flurophenyl)-propylamine as depicted in Figure 6.12 (a) when
docked with a docking score of -8.88 kcal/mol and finally minimized and equilibrated for 15ns is
seen to occupy the active site completely. The ketone warhead is seen to fit into the S1 site
containing the catalytic triad and interact with Cys 25 and His 159. Also interactions are seen with
Leu 67 and 70 as well as Asp 158. The detailed interactions are shown in Figure 6.13. On
superimposing the peptoid containing protein onto the equilibrated crystal structure it is seen that
the pocket harboring S1 site doesn’t seem to have opened up immensely. Rather the pocket is still
stable and the peptoid is seen to anchor on the site and will probably hold its own and prevent
enzymatic action of the peptoid, depicted in Figure 6.14. The residues that play a major role in
substrate recognition and specificity are seen to be interacting with the multiple parts of the
peptoid. The RMSD of the equilibration is shown in Figure 6.15.
Figure 6.12 (a) [2-(4-fluorophenyl)-propylamine] containing peptoid containing the
warhead. (b) The surface view of peptoid positioned after moleculat dynamics; bound to the
important residue, Cys 25 depicted in cyan.
a b
Page 144
124
Figure 6.13. The interactions of the peptoid with the neighboring residues in the binding site.
Interactions with His 159 in the S1 site, Leu 67 in the S3 site show promising binding.
Figure 6.14. The comparative alignment of the peptoid (left) as compared to the ligand (right)
show that the effective binding of the peptoid onto the protein.
Leu 67
Asp 158
Page 145
125
Figure 6.15. RMSD plot of the peptoid shows that the structure attained equilibration with
the 15 ns of its run.
6.3.2. [3-Chloro-4fluorobenzylamine containing peptoid.
The cyclic peptoid containing 3-Chloro-4fluorobenzylamine as depicted in Figure 6.16 when
docked with a docking score of -8.62 kcal/mol and finally minimized and equilibrated for 15ns is
seen to occupy the active site completely. The ketone warhead is seen to fit into the S1 site
containing the catalytic triad and interact with Cys 22 and Asp 158. The detailed interactions are
shown in Figure 6.17. On superimposing the peptoid containing protein onto the equilibrated
crystal structure it is seen that the pocket harboring S1 site doesn’t seem to have opened up
immensely. Rather the pocket is still stable and the peptoid is seen to anchor on the site and will
probably hold its own and prevent enzymatic action of the peptoid as seen in Figure 6.17. The
RMSD of the equilibration is shown in Figure 6.18.
Page 146
126
Figure 6.16 (a) [2-(4-fluorophenyl)-propylamine] containing peptoid containing the
warhead. (b) The surface view of peptoid positioned after moleculat dynamics; bound to the
important residue, Cys 25 depicted in cyan.
Figure 6.17. The interactions of the peptoid with the neighboring residues in the binding site.
Interactions with Asp 158 in the S2 site, Cys25 in the S1 site show promising binding.
Cys 22 Asp 158
a b
Page 147
127
Figure 6.18. The comparative alignment of the peptoid (left) as compared to the ligand (right)
show that the effective binding of the peptoid onto the protein.
Figure 6.19. RMSD plot of the peptoid shows that the structure attained equilibration with
the 15 ns of its run.
Page 148
128
6.3.3. 4-Methoxyphenethylamine containing peptoid.
The cyclic peptoid containing 4-Methoxyphenethylamine as depicted in Figure 6.20 when docked
with a docking score of -8.62 kcal/mol and finally minimized and equilibrated for 15ns is seen to
occupy the active site completely. The ketone warhead is seen to fit into the S1 site containing the
catalytic triad and interact with Asp 158 and Asn 70 among few residues. The detailed interactions
are shown in Figure 6.21. On superimposing the peptoid containing protein onto the equilibrated
crystal structure it is seen that the pocket harboring S1 site doesn’t seem to have opened up
immensely. Rather the pocket is still stable and the peptoid is seen to anchor on the site and will
probably hold its own and prevent enzymatic action of the peptoid as seen in Figure 6.23. The
residues that play a major role in substrate recognition and specificity are seen to be interacting
with the multiple parts of the peptoid. The RMSD of the equilibration is shown in Figure 6.22.
Figure 6.20 (a) 4-Methoxyphenethylamine containing peptoid containing the warhead. (b)
The surface view of peptoid positioned after moleculat dynamics; bound to the important
residue, Cys 25 depicted in cyan.
a b
Page 149
129
Figure 6.21. The interactions of the peptoid with the neighboring residues in the binding site.
Interactions with Leu 67 in the S3 site and Asn 70 show promising binding.
Figure 6.22. RMSD plot of the peptoid shows that the structure attained equilibration with
the 15 ns of its run.
Asn 70
Page 150
130
Figure 6.23. The comparative alignment of the peptoid (left) as compared to the ligand (right)
show that the effective binding of the peptoid onto the protein.
6.4. Conclusions.
The process of developing lead molecules, has lot of pitfalls which can arise in any part of the
process. Peptoids are a great choice in interrupting protein-protein interactions. Herein, cruzain is
a cysteine protease which has 6 substrate sites, S1-S3 and S1’-S3’. Hence this peptide-peptoid
hybrid scaffold has the capacity to fit into the whole pocket and interrupt the activity of this
important protease. The docking methodology utilized herein successfully docked the ligands onto
the protein followed by proper conformational stabilization by further programs. This
methodology has successfully showed that peptoids of this nature can be studied computationally
and can give us a lot of idea of using structure based drug design to successfully create ligands for
other proteins as well. Residues such a Histidine 159, Aspartate 158, Leu 67 and Cys 25 werefew
of the common residues seen to interact with the majority of the ligands. Further biomedical assays
Page 151
131
will need to be conducted on the ligands both computationally and in the laboratory in order to
further discover and optimize its binding affinity and specificity to cruzain.
6.5. References.
1. World Health Organization
<http://www.who.int/neglected_diseases/diseases/chagas/en/index.html>.
2. Center for Food security and Public Health
<http://www.cfsph.iastate.edu/Factsheets/pdfs/trypanosomiasis_american.pdf>.
3. Lucio, O.; Mancillas, A.; Franco, J.; Castillo, R. J. Mol. Graphics Modell...2012, 35, 28-
35.
4. Center for Disease Control & Prevention, 2009. 0.
<http://www.dpd.cdc.gov/dpdx/HTML/TrypanosomiasisAmerican.htm>.
5. Souza, W.; Carvalho, T.M.; Barrias, E.S. Int. J Cell Biol. 2010.
6. Brak, K.; Doyle, P.S.; McKerrow, J.H. ; Ellman, J,A. J.A.C.S. 2008, 130, 6404-6410.
7. Gillmor, S.A.; Craik, C.S.; Fletterick, R.J. Prot. Sci. 1997, 6, 1603-1611.
8. Engel, J.C.; Doyle, P.S.; Palmer, J.; Hsieh, I.; Bainton, D.F.; Mckerrow, J.H. J. Cell Sci.
1998, 11, 597-606.
9. Engel, J.C.; Doyle, P.S.; Palmer, J.; Hsieh, I.; Mckerrow, J.H. J. Exp. Med. 1998, 188,
725-734.
10. Bartel ,L.C.;Mecca, M.; Fanelli, S.L.; Castro, C. R.; Diaz, E.G.; Castro, J.A. Hum. Exper.
Toxicol. 2007, 26, 781-788.
11. Engel, J.C. ; Doyle, P.S. ; Hseih, I.; McKerrow, J.H. J. Exp. Med., 188 (1998), 725.
Page 152
132
12. Douglas B.; Kitchen1; Hélène Decornez1; John R. ;Furr1; Jürgen Bajorath. Nature
Reviews Drug Discovery 3, 2004, 935-949
13. Wilfred,E van Gunsteren and Herman J. C. Berendsen. Angewandte Chemie.
International. 1990 , 29 ,992 -1023.
14. Suite 2012: CombiGlide, version 2.8, Schrödinger, LLC, New York, NY, 2012.
15. Schrödinger Release 2013-2: LigPrep, version 2.7, Schrödinger, LLC, New York, NY,
2013.
16. Friesner, R. A.; Murphy, R. B.; Repasky, M. P.; Frye, L. L.; Greenwood, J. R.;
Halgren,T. A.; Sanschagrin, P. C.; Mainz, D. T., J. Med. Chem., 2006, 49, 6177–6196
17. Giannis, A.; Kolter, T. Angew. Chemie. 1993, 32, 1244-1267.
18. Zhong, S.; Macias, A.T. MacKerell Jr A. Current Topics in Medicinal Chemistry, 2007,
7, 63-82
19. Scheidt KA, Roush WR, McKerrow JH, Selzer PM, Hansell E, Rosenthal PJ. Bioorg
Med Chem. 1998, (12), 2477-94.
20. Lea, W.A.; Simeonov, A. Expert opin Drug Discov. 2011, 6, 17-32.
21. Eakin AE, Mills AA, Harth G, McKerrow JH, Craik CS (1992) The sequence,
organization, and expression of the major cysteine protease (cruzain) from Trypanosoma
cruzi. Journal of Biological Chemistry 267: 7411–7420.
22. Barrett AJ, Kembhavi AA, Brown MA (1982) L-trans-Epoxysuccinyl-leucylamido(4-
guanidino)butane(E-64) and its analogues as inhibitors of cysteine proteinases including
cathepsins, B, H and L. Biochemical Journal 201: 189–198.
23. Wiggers HJ, Rocha JR, Fernandes WB, Sesti-Costa R, Carneiro ZA, Cheleski J, da Silva
Page 153
133
AB, Juliano L, Cezari MH, Silva JS, McKerrow JH, Montanari CA. PLoS Negl Trop Dis.
8, 2013. e2370.
24. Huang, L.; Brinen, L.S.; Ellman, J.A. Bioorganic & Medicinal Chemistry 11 , 2003, 21–
29.
25. Dajani,K.;Dirksin,S.http://www.staff.science.uu.nl/~kraai101/lecturenotes2009.pdf.
2008.
26. Mohamadi,F.; Richards,N.G.J. ; Guida, W.C.; Liskamp, R.; Lipton, M.; Caufield, C.;
Chang, G.; Hendrickson, T.; Still;, W.C. J. Comput.Chem. 1990, 11, 440-467.
27. Toniolo C. Macromolecules. 1978; 11: 437-438.
28. Kil, H.J. USF dissertation , 2014.
29. Tubert-Brohman, I.; Sherman, W.; Repasky, M.; Beuming, T J. Chem. Inf.
Model., 2013, 53 , 1689–1699
Page 154
134
CHAPTER SEVEN: STRUCTURE MODIFICATION OF APOLIPOPROTEIN E4 TO
DIMINISH CHARACTERISTIC STRUCTURAL DOMAIN INTERACTION AND
RESTORE FUNCTION NORMALITY
7.1. Introduction.
Apolipoprotein E (apoE) is an apoprotein on lipoproteins that functions in many diverse biological
roles. ApoE primarily transports cholesterol and other molecules throughout the body including
the brain, linking it to many neurological pathways as an important lipid transporter in the central
nervous system. One key aspect of ApoE function is that it is isoform-dependent. There are three
variants of apoE: ε2, ε3, ε4. ApoE2 functions properly and is protective against Alzheimer disease.
ApoE3 is also protective against the disease, although to a lesser extent than apoE2. The ε4 variant
is an important risk factor for late-onset Alzheimer disease because of its interaction with the
peptide amyloid beta.1-2
Alzheimer disease (AD) is the most common form of dementia and without a cure it worsens as
the disease progresses until death. AD is characterized by an imbalance in the production and
clearance of amyloid beta (Aβ) which causes an abnormal accumulation of this peptide in the brain.
Aβ are peptides produced from the amyloid precursor protein (APP) and they aggregate to form
oligomers which can form the plaques associated with Alzheimer disease.
Page 155
135
Early onset AD is most commonly due to an overproduction of Aβ which is due to a mutated APP
gene which leads to abnormalities in the amyloid precursor protein (APP). More relevant to apoE,
however, is late-onset AD. Late-onset AD is due to general impairment of Aβ clearance which can
also contribute and add to the progression of early onset AD. 7
Apolipoprotein E typically catalyzes the break-down of Aβ which facilitates the clearance and
elimination of Aβ from the brain. ApoE degradation of Aβ is dependent on which isoform of the
protein is present. The ε4 variant is not as effective at degrading Aβ peptides and therefore
accumulation is more common in people with the ε4 allele. The presence of the ε4 allele has been
shown to expedite the progression of AD so that symptoms are observed at a younger age.
ApoE4 plays other roles in the Alzheimer disease pathogenesis via mechanisms that are
independent of amyloid beta. ApoE4 causes loss of synaptic function, glucose metabolism,
neurogenesis, vascular function, mitochondrial function, and lipid/cholesterol metabolism. ApoE4
also causes gain of toxic function such as an increase in brain atrophy, neuronal toxicity, tangle
formation, and aberrant brain activity.
The role of apoE4 in the progression of Alzheimer disease makes it a good target for inhibition as
well as structure correcting. It has been shown that certain small molecule structure correctors can
change the structure of apoE4 to resemble the other isoforms of the apolipoprotein which could
help to diminish the negative effects of apoE4 on the body.
ApoE4 function directly affects the amyloid beta-peptide pathway in two ways: decreased
clearance of Aβ and increased production of Aβ. Many pathways and variable factors impact
amyloid beta aggregation but one possible pathway which is explored here has Aβ clearance across
the blood-brain barrier (BBB).3 The specific apoE Aβ interaction and pathway of clearance is
Page 156
136
unclear as well and the apoE/ Aβ complex is a topic of ongoing study. One explanation is that the
apoE4 is less lipidated than the other isoforms which means that the apoE/Aβ complex is less
stable which reduces the clearance of the peptide.4
The structural differences between the apoE isoforms can explain their functional differences.
Specifically, apoE4 has an interaction between its two major structural domains. ApoE3 does
demonstrate some structural domain interaction, but this interaction in negligible when compared
to the same interaction in ApoE4. The two major domains that are interacting are the amino-
terminal domain (residues 1-191) and the carbozyl-terminal domain (residues 244-272).
Figure 7.1. The structures of apoE3 and apoE4 differ in the significance of the structure
domain interaction. The isoforms also have a different amino acid at the 112 position as seen
in the figure.
The important residues on the apoE4 include Arg-61, Glu-255 and Arg-112. Among these, apoE3
differs only in the 112-position where a cysteine is present instead of arginine. The amino terminal
of the protein interacts with the LDL receptor and the carboxy terminal with the rest of the
lipoprotein binding determinants. The role of Arg 61 in determining the affinity of ApoE4 for
VLDL preference has been shown already.5-6 And the presence of Arg 112 instead of Cys 112 as
in ApoE3 allows for rapid association with the Aß peptide. 5 The domain interaction is caused by
Page 157
137
ionic interaction between Arg-61 and Glu-255. This domain interaction can be interrupted to
mimic a apoE3-like structure. Mutation of either residue that is important to the interaction can
create a molecule that is more like apoE3, diminishing the toxic function of the apoE4 isoform. 9
ApoE4 is essentially a protein consisting of 4 alpha helices in the amino terminal with another
long helix as the carboxy terminal. Since protein-protein interactions are difficult to interrupt, and
considering the mass of alpha helices, a helical AAα- peptoid was designed which is linear and
would have negatively charged groups on it to counter the positive charge on the arginine’s present
on the helices containing Arg 61 and 112.
Structure based drug design was performed to design a library of peptoids that could be
successfully synthesized and used as structure modifiers of ApoE4. 8
7.2. Methods.
As discussed in previous chapters, finding the right ligand for a protein with the aid of
computational programs was done in a similar way. The x-ray crystal structure of the ApoE4 (PDB
identification code: 1GS9) was selected from the protein data bank which contained residues of
the amino terminal of the protein and was prepared using Protein Prep Wizard program of
Schrödinger. Protein prep adds hydrogen to the protein, fix the structure, delete unwanted water
molecules, to name a few things it does. This structure has been used before and includes all the
important sites with a resolution of 1.7 Å which is sufficient for these purposes. ApoE3 and apoE2
were also protein prepped using the PDB IDs 1NFN and 1NFO, respectively. Molecular dynamics
simulation was run on this protein structure for 30 ns in a water box containing ions at 0.2. mol/L
concentration, to achieve equilibration and the final structure was then used for further work. As
Page 158
138
mentioned before molecular dynamics was done prior to docking to equilibrate the protein for 30ns
initially and checked to see if equilibration was achieved. All-atom structures of the protein was
constructed using the Maestro Protonation states were assigned to ionizable residues according to
the pKa based on pH = 7.0 using the Protein Preparation workflow in Maestro and the Epik
module. Each peptide will then be placed in a cubic cell, with size adjusted to maintain a minimum
distance of 10Å to the cell boundary, and soaked with a pre-equilibrated box of water using the
System Builder module of the Desmond 16 package. All overlapping solvent molecules removed
and an appropriate number of counter ions were added to maintain charge neutrality. All molecular
dynamics (MD) simulations will be performed using the Desmond package. The OPLS 2005 force
field will be used to model all peptide interactions, and the TIP3P model will be used for water.
The particle-mesh Ewald method (PME) will be used to calculate long-range electrostatic
interactions with a grid spacing of 0.8. Van der Waals and short range electrostatic interactions
will be smoothly truncated at 13.0. Nose–Hoover thermostats will be utilized to maintain the
constant simulation temperature and the Martina–Tobias–Klein method was used to control the
pressure. The equations of motion was integrated using an inner time step of 30ns for bonded
interactions and non-bonded interactions within the short range cutoff. The system will be
equilibrated with the default protocol provided in Desmond, which consists of a series of restrained
minimizations and molecular dynamics simulations designed to slowly relax the system, while not
deviating substantially from the initial protein co-ordinates. The simulation were rub at a
temperature of 310 K in the NPT (constant number of particles, pressure, and temperature)
ensemble with solute heavy atoms restrained with force constant of 50 kcal⁄ mol. The relaxed
protein was used for docking.
Page 159
139
Initially, apoE4 was screened against NCI Diversity Set IV, the National Cancer Institute library
containing around 1500 compounds of different functionalities using GLIDE (grid-based ligand
docking from Schrödinger). The important residues identified previously were the target of this
docking procedure with the goal of modifying the structure of apoE4 to mimic apoE3 via
conformation changes especially less structure domain interaction via the Arg-61 and Glu-255
ionic interactions.
While the molecules must bind to the active site of apoE4, they should not interfere with the
function of the other apoE isoforms and so the top structures were also docked to the apoE2 and
apoE3 to observe how these structures are affected by the identified structures. The best structures
for apoE4 are those with high docking scores and selectivity for the E4 isomer, meaning they do
not exhibit significant interaction with E2 or E3.
For the docking procedure, SP (Standard Precision) docking was followed by the more rigorous
XP (Extra Precision) docking and the scores were recorded and the structures studied. The top
structures were identified from the docking.
Peptidomimetics are considered as replacements for peptides as therapeutic agents, due to the fact
that they have greatly enhanced invivo stability and unlimited structural diversity and have been
extensively investigated, yielding many valuable bioactive agents. Recently, Cai and group
developed a new class of peptidomimetics, termed as γ- AApeptides. 10 They contain N-acylated-
N-aminoethyl amino acid units derived from chiral γ-PNA as shown in Figure 2 below. Previous
studies have demonstrated that γ-AApeptides are not only highly resistant to proteolysis, but can
mimic bioactive peptides. 3 and can be ideal candidates for the identification and development of
novel molecular probes and drug candidates.
Page 160
140
Figure 7.2. An Aaα-peptide.
Using the top ligands from the NCI diversity set as core structures, a peptide library was then
created as seen in Figure 7.3. This library was then prepared using Combiglide 11 and used for
further docking. As seen in Figure 3 below the peptide-peptoid structure was kept at a short length
containing R groups in four positions. Considering that Arg is positively charged, some of the
groups placed were negatively charged such as ones containing sulfonates and phosphates and
carbonyl functional moieties. The total library size is predicted to be 11520 combinations.
Figure 7.3. The library designed after the first docking using the top ligands. This set of
ligands was then used for further docking.
Page 161
141
The NCI Diversity Set II showed some selective interaction with the apolipoprotein E4. The
interaction with the docking site suggests that the structure of apoE4 may be modified to mimic
the linear structure of apoE3 via conformation changes. Combiglide was used to prepare the library
followed by Ligprep 12 to generate tautomer’s and different protonation states of the ligands. This
library was then seen to increase to around 10,000 structures. To aid in efficiently and quickly
screen compounds, the HTVS or high throughput virtual screening method of GLIDE was used to
screen the best fitting compounds. HTVS is less stringent as compared to SP or XP docking. The
top 300 compounds were then subjected to peptide docking function of GLIDE. Peptide docking
13 is a new addition of glide and takes the rotation of peptide backbone into account before docking
onto the protein. The top 100 compounds, based on the Glide G-Scores were then subjected to
Macromodel Embrace 14 which minimizes the energy of the protein-ligand complex after searching
different conformations and allowing both to move flexibly to an extent to get the most feasible
minimized pose for the complex. The top most compounds with best fit and top G-Scores were
then subjected to Prime’s MM-GBSA 15 which helped in determining binding energy of the ligand
to the protein in an environment containing water (VSGB solvent model). MM-GBSA is used to
estimate relative binding affinity for a list of ligands (reported in kcal/mol). Prime MMGBSA DG
bind", the binding free energy, is calculated with the equation:
ΔG(bind) = E_complex(minimized) - ( E_ligand (minimized) + E_receptor(minimized) )
Using MM-GBSA methods, relative binding affinities for a set of ligands to a given target can
often be reproduced with good accuracy and considerable less computational effort compared to
full-scale molecular dynamics simulations. Hence for these peptoids, binding energy were
computed.
Page 162
142
7.3. Results
The crystal structure, 1GS9 was simulated in a water box at 0.2. mol/L. After 30 ns, the structure
was analyzed and equilibrium had been attained as seen from the rmsd variations. The most stable
form of the protein following clustering was used for docking studies. Also following initial
docking, the ligands with the most negative Glide scores ( highest ranking ) were looked into. In
ApoE4, Arg 61 is the residue that forms the salt bridge with the Glu 255 on the carboxy terminal,
hence moieties that interact or have the propensity of interaction with the group were considered
in the library design of the peptoid. Figure7.4 below shows few of the ligands docked onto ApoE4.
The propensity of the phosphate groups to form H-bonds with the Arg 61 was observed hence
included in the library of R groups.
Page 163
143
Figure 7.4. The portions of ligands based on functional groups they contained that were used
as R groups in designing the peptide library based on the docking of NCI diversity set.
Page 164
144
Following the design of library, peptide docking function of Glide was used and the resulting
peptides were docked onto the site containing Glu 109, Arg 112 and Arg 61 as the centroid
residues. Following the docking, the top 2% of the ligands were minimized using macromodel’s
EMBRACE function where the conformations of the peptide were explored and the final
minimized complex was analyzed.
Most of the top hits were seen with the phosphate group forming H-bonds and having pi-pi
interactions with the Arg 112 and 61. Arg 112 and Glu 109 forms a salt bridge in the original
crystal structure and that is seen to be sustained.
7.3.1. Ligand 1.
The peptide with the highest docking score of -8.871 kcal/mol as seen in Figure 5. Since the
protein is a mass of alpha helices, this peptide perfectly aligns itself to the helices and the
interactions of the phosphate group to the Arg 61 and 112 can possibly prevent the interaction of
the residues to form the salt bridge and act as a structure corrector as illustrated in Figure 6.
Figure 7.5. Ligand 1 shown to dock onto ApoE4.
Page 165
145
Figure 7.6. The phosphate group interacts via H-bonds and pi interactions with the Arg 112
and 61. The peptide completely linearly aligns with the helices.
7.3.2. Ligand 2.
The peptide has a docking score of -8.092 Kcal/mol as seen in Figure 7. Since the protein is a
mass of alpha helices, this peptide takes on a slightly different conformation. The phosphate group
interacts with the Arg 61 but the peptide itself is seen to be horizontal instead of vertically aligned
but the interactions it forms can possibly prevent the interaction of the residues to form the salt
bridge and act as a structure corrector as illustrated in Figure 8.
Page 166
146
Figure 7.7. Ligand 2 shown to dock onto ApoE4.
Figure 7.8. The phosphate group interacts via H-bonds and pi interactions with the Arg 112
and 61. The peptide vertically aligns with the helices.
Page 167
147
7.3.3. Ligand 3:
The peptide with the highest docking score of -8.082 kcal/mol as seen in Figure 9. Since the
protein is a mass of alpha helices, this peptide is again seen to perfectly align itself to the helices
and the interactions of the phosphate group to the Arg 61 and 112 can possibly prevent the
interaction of the residues to form the salt bridge and act as a structure corrector as shown in Figure
10.
Figure 7.9. Ligand 3 shown to dock onto ApoE4.
Page 168
148
Figure 7.10. The phosphate group interacts via H-bonds and pi interactions with the Arg 112
and 61. The peptide aligns with the helices.
7.4. Conclusion.
ApoE4 is a protein that is now postulated to be the strongest genetic risk of Alzheimer’s.
Structurally this protein consists of majorly alpha helices and Arg 61 in one of the outer helices of
one terminal are known to form a salt bridge with the other terminal of the protein Correcting the
structure by interrupting protein-protein interactions between the terminals has been attempted
with the AA peptoids. From the examples shown above, it is clearly evident that these ligands have
a great future as ApoE4 structure correctors and also as inhibitors of other diseases.
Page 169
149
7.5. References
(1) Mahley, R.W and Huang, Y. J Med. Chem. 2012, 55, 8997-9008.
(2) Sadowski, M,; Pankiewicz, J.; Scholtzoca, H.; Ripellino, J. A,; Li, Y,; Schmidt, S. D.;
Mathews, P. M.; Fryer, J. D.; Holtzman, D. M.; Sigurdsson, E. M.; Wisniewski, T. AJP. 2004,
165, 937-947.
(3) Bates, K.A.; Verdile, G.; Li, Q-X,; Ames, D.; Hudson, P.; Masters, C.L.; Martins, R.N.
Molecular Psychiatry. 2009, 14, 469–486.
(4) Tai et al. Molecular Neurodegeneration 2014 9:2.
(5) Dong, L,; Wilson, C.; Wardell, M.; Simmons, T.; Mahley, R.; Weisgraber, K,; Agard, D.
The Journal of Biological Chemistry. 1994, 269, 35, 22358-22365.
(6) Ye, S.; Huang, Y.; Mullendorff, K.; Dong, L.; Giedt, G.; Meng, E.; Cohen, F.; Kuntz, I.;
Weisgraber, K.; Mahley, R.W. PNAS. 2005, 102, 51, 18700-18705.
(7) Vales, K.R. Neuropharmacology. 59: 295-302.
(8) Singh, Kh.D.; Karthikeyan, M.; Kirubakaran, P.; Sathya, V.; Nagamani, S. \ Med Chem Res.
2011: 825-833.
(9) Liu, C.-C. et al. Nat. Rev. Neurol. 2013. 9, 106-118
(10) Wu, H.; Teng, P.; Cai, J . Eur. J. Org. Chem. 2014, 1760–1765.
(11) Schrödinger Release 2014-3: CombiGlide, version 3.4, Schrödinger, LLC, New York, NY,
2014.
Page 170
150
(12) Schrödinger Release 2014-3: LigPrep, version 3.1, Schrödinger, LLC, New York, NY, 2014.
(13) Tubert-Brohman, I.; Sherman, W.; Repasky, M.; Beuming, T J. Chem. Inf. Model., 2013, 53 ,
1689–1699
(14) Schrödinger Release 2014-3: MacroModel, version 10.5, Schrödinger, LLC, New York, NY,
2014.
Page 171
151
CHAPTER EIGHT: COMPARATIVE STUDY OF COCRYSTAL SCREENING
METHODOLOGIES: SLURRY VS SOLUTION EVAPORATION VS
MECHANOCHEMISTRY.
8.1. Introduction.
The early 1900’s, saw the advent of the field of crystal engineering, 1, 2, 3 resulting in better and
wider understanding of the design of viable crystalline forms. 4 Crystal engineering, first defined
by Desiraju utilizes the understanding of intermolecular interactions and crystal packing for the
design of new crystalline forms.5 Overtime, crystal form screening of APIs has constituted an
essential part of the pharmaceutical industry 5 owing to the inherent stable nature of crystalline
forms over amorphous forms. Various crystal forms that can be made include salts, 6 hydrates, 7
solvates, and cocrystals. 9(e), 8 Cocrystals, 8, 9 a class of compounds for which the principles of
crystal engineering are utilized, have gained a lot of recent attention owing to their amenability to
design, their ability to tailor physiochemical properties. 10,11, and also utility in the fields of
materials and organic chemistry 12. The supramolecular synthon approach 13.14, 8(c) can be used to
successfully discover cocrystals by choosing cocrystal formers by specifically targeting certain
functionality on the molecule in conjunction with analysis of currently available structural data
from the Cambridge Structural Database (CSD).15
Pharmaceutical cocrystals, 10, 11,16 one of the most highly studied subset of cocrystals, affords new
crystal forms of APIs and can be defined as, “a multiple component crystal in which at least one
Page 172
152
component is molecular and a solid at room temperature and forms a supramolecular synthons
with a molecular or ionic API.” 16(a) Pharmaceutical cocrystals have been studied in the context of
improving physicochemical properties such as modifying the solubility, dissolution rate, stability
and bioavailability of the parent API. 11
Causative, the need for efficient screening methods for this class of compounds becomes
imperative considering the wide range of applications of these compounds inadvertently bring in.
To date the first report of a cocrystal dates back to the 1800’s with Wohler’s 1:1 quinhydrone
experiment 17. This experiment also entrails the first use of grinding 18 or mechanochemistry in the
scientific literature. Over the years, various methods have been used and developed for the
synthesis of cocrystals which include neat or dry grinding techniques, solution crystallization,
sublimation, melt crystallization, slurry crystallization, antisolvent addition and reaction
crystallization 19. Development of various new techniques such as the use of ultrasound 29(f) and
twin screw extrusion technique 20 using shear forces showcase the importance and also need for a
efficient screening process.
Following quinhydrone synthesis, Etter and Curtin’s efforts 21, 22 saw the rise in the scope of this
method. Grinding today represents to be a technique superior to the traditional solution
crystallization technique as it omits the effects of various solvents and the effects hereafter and
showcases production of cocrystals which may have not been afforded by solution crystallization.
23 The mechanism for grinding have been studied in details over the last couple of years and
extrapolated to three mechanisms: molecular diffusion, eutectic formation and cocrystallization
via an amorphous phase that either by themselves or in complementarity aid in formation of
cocrystals. 23 One of the utilities of this technique lies in the arena of C3S3 (Cocrystal controlled
solid state chemistry) which garners the transition product which is a cocrystal before the
Page 173
153
production of the end product.24 Improvement of the grinding method was achieved via addition
of a small amount of solvent (LAG, Liquid Assisted Grinding) during the grinding process and it
was seen that this addition catalytically helped in improvement of kinetics of the reaction via
exposure of interfaces which helped in exposing additional degrees of orientational and
conformational freedom, thereby leading to faster reactions. The use of solvent in this approach
is minimal such that solubility does not affect crystallization as with solution crystallization.18, 25
Solution mediated phase transformation or slurry 30 is another technique that has garnered a lot of
attention due to its ability for scale up, wherein saturated amounts of the cocrystal components are
taken in solvent and stirred for a time period starting from one day up until a week or more to
achieve the desired crystal form. This method has previously been used with single component
systems to achieve phase transition 26, polymorphisms 27. Zhang 30 et al tested various cocrystal
systems to showcase that if a cocrystal phase exists for a system, saturation of the individual
components in the solvent can afford a high critical activity owing to the final formation of a
cocrystal phase. Various cocrystals have been prepared via the slurry technique. 28, 29 Various
solvents have also been used in this process. This method is envisaged as one of the most efficient
methods for future scale-up procedures of cocrystals in an industrial setup. Also this technique has
showcased its utility in various other fronts such as studying the stability of a hydrate or anhydrate
form 31 and understand the thermodynamic stability relationship among polymorphs 27. Recently,
this technique was also reported to be done in a small scale vial to address the scale up factor.30(j)
High throughput slurry was also studied using Indomethacin as the API and thereby establishing
the utility of this methodology. 30(h)
In 2009, we investigated the effectiveness of LAG against solution cocrystallization by
investigating 17 cocrystals which demonstrated the COOH-Narom supramolecular heterosynthon
Page 174
154
and found that the results were comparable and dimethyl formamide (DMF) should be the solvent
of choice for LAG as it achieved the formation of maximum number of cocrystals.
Herein, we have continued to look into the effectiveness of the screening methodologies by
comparing four techniques : slurry, solution crystallization, neat and liquid assisted grinding for a
set of polyphenol and flavanoid compounds with nutraceutical cocrystal formers(CCF). The
grinding experiments compare three solvents water, ethanol and DMF. DMF still remains to be
the best solvent for LAG. Dry grinding was found to be less effective than LAG and solution
crystallization afforded all the crystal forms. For the slurry experiments, water was used as the
solvent. Considering the use of the technique for future scale up procedures, showcasing the utility
of water as a solvent will help in not only making the procedure easier in terms of usability but
also the process ability of the compounds in the manufacturing front with lower costs of solvent.
We have herein reported thirty-eight cocrystals screened via the four techniques and shown that
slurry experiments in water for compounds over a wide range of solubility is indeed possible.
8.2. Experimental Section.
8.2.1. Materials. All the chemicals were purchased from commercial suppliers and used without
further purification.
8.2.2. Synthesis of Cocrystals. For our studies, polyphenolic acids and flavanoids were targeted
with cocrystal formers of various complementary functional groups considering that the
supramolecular interactions of the phenolic hydroxyl group have been widely studied in the
Page 175
155
literature. Phenols have the capacity to form inherent supramolecular homosynthons to form rings
or chains or helices via hydrogen bonding. They also have the capacity to form robust and reliable
supramolecular heterosynthons with complementary functional groups such as aromatic nitrogen,
amides, carbonyls, carboxylates etc. The compounds of interest (COI) for our study include ellagic
acid, gallic acid, coumaric acid, caffeic acid and ferulic acid. All these compounds have phenolic
hydroxyl groups along with carboxylic acid moieties. Carboxylic acids represent another set of
functional group of predominant nature with the capacity to form supramolecular homosynthons
to give rise to catemers or dimers and also supramolecular heterosynthons with aromatic nitrogen,
amides, carbonyls etc. 33, 34, 35, 36, 37, 38
In order to validate our study, hydrochlorothiazide, a BCS Class IV drug which contains a
sulfonamide and amine moiety, was used. Hydrochlorothiazide is a diuretic drug which has poor
aqueous solubility and permeability. The low solubility of the drug gives rise to low overall
bioavailability of the drug. The drug belongs to the thiazide class of diuretics and is often
prescribed along with losartan.57 Various formulation techniques have been employed to increase
the solubility of this drug. 58 In this paper we have reported three new crystal forms of this drug.
The various cocrystal formers for this study include amides such as nicotinamide, isonicotinamide,
urea, caprolactam; amino acids such as sarcosine, glycine anhydride, dimethyl glycine ; purines
such as adenine, caffeine, theobromine and theophylline; carboxylic acids such as nicotinic and
isonicotinic acid; API’s such as carbamazepine and isoniazid and also 3,5 dimethyl pyrazole .
Scheme 1 illustrates the chemical structures of all the compounds used in this study. All the
cocrystal formers used were either Generally Regarded as Safe compounds (GRAS) listed 39 or
included in the Every Added to Food in United States (EAFUS) 40 list which establishes their safe
usability. The results cocrystallization with the cocrystal formers mentioned via multiple synthetic
Page 176
156
methods such as slow evaporation, liquid assisted and neat grinding and also slurrying techniques
has been shown in Table 14. Single crystals suitable for X ray diffraction studies were also made
for the reported crystal forms. Some of the crystal forms though have been previously reported by
us. 38, 41
8.2.3. Preparation of cocrystals via slurrying. Stoichiometric saturated amounts of starting
materials were stirred in water (1 mL) overnight. The undissolved solid was isolated by filtration
and characterized using PXRD, DSC and FT-IR. This method yielded crystal forms for all of the
COI's except ellagic acid and hydrochlorothiazide. Further experiments were hence conducted
considering the low solubility of both the compounds. It was observed that the ellagic acid crystal
forms could be successfully reproduced in water overnight, by conducting the experiment at
ambient temperatures of 85° C. In case of Hydrochlorothiazide, the same was observed at a
temperature of 75 ° C.
Page 177
157
Scheme 8.1. Chemical structures of compounds used herein.
Page 178
158
8.2.4. Preparation of cocrystals via liquid assisted grinding. Stoichiometric amounts of the
starting materials were ground in a ball mill following addition of solvent (10μL of solvent per 50
mg of starting materials). The resulting powders were analyzed by diffuse reflectance IR
spectroscopy and X-ray powder diffraction.
8.2.5. Preparation of cocrystals via neat grinding. Stoichiometric amounts of the starting
materials were ground in a ballmill for 15 minutes following addition of solvent (10μL of solvent
per 50 mg of starting materials). The resulting powders were analyzed by diffuse reflectance IR
spectroscopy and X-ray powder diffraction.
8.2.6. Solution crystallization. As depicted in Table 8.14, all of the crystal forms were also made
from solution crystallization. The details of the methods used are discussed below.
HCTNAM: 15 mg (0.1000 mmol) of hydrochlorothiazide and 61 mg (0.5000 mmol) of
nicotinamide was added to 4 mL of ethyl acetate and heated on a hotplate. The resulting solution
was filtered using filter paper and left for slow evaporation which yielded colorless crystals of
HCTNAM after two days.
HCTNAC: 15mg (0.050 mmol) of hydrochlorothiazide and 12.1 mg nicotinic acid, (0.100 mmol)
were added to 4 mL of 50:50 methanol/water mixture and heated on a hotplate. The resulting
solution was left for slow evaporation and colorless crystals of HCTNAC were harvested after
two days.
Page 179
159
HCTDMG: 300 mg (1.01 mmol) of hydrochlorothiazide and 500 mg (4.85mmol) of dimethyl
glycine were added to 7 mL of ethanol and heated on a hotplate until a clear solution was obtained.
The resulting solution left for slow evaporation which yielded colorless crystals of HCTDMG
after two days
HCTINM: The synthesis and the structure description of the cocrystal of HCT with
isonicotinamide (HCTINM) has been reported elsewhere.41
GALINZ: 17.0 mg (0.100 mmol) of gallic acid and 13.8 mg (0.100 mmol) of iso-nicotinic acid
hydrazide was dissolved in 2mL of methanol and heated on a hotplate until a clear solution was
obtained. The resulting solution left for slow evaporation which yielded light brown prisms of
GALINZ after five days.
GALDMP: 59.2 mg (0.348 mmol) of gallic acid and 35.4 mg, (0.368 mmol) of 3,5-
dimethylpyrazole were dissolved in 5mL of methanol until a clear solution was obtained. The
solution was left for slow evaporation at 5oC which yielded colorless prisms of GALDMP after
fourteen days.
GALADN: 17.0 mg (0.100 mmol) of gallic acid and 13.7 mg (0.100 mmol) of adenine were
dissolved in a 4 mL water/ethanol mixture in a 1:3 ratio and left for evaporation. Colorless needles
of GALADN were harvested after three days.
GALURE: 17.1 mg (0.100 mmol) of gallic acid was dissolved in 1 mL of ethanol. This solution
was then added to a 1 mL saturated solution of urea and left for slow evaporation at room
temperature which yielded colorless needles of GALURE after eight days.
Page 180
160
GALGAH: 17.0 mg (0.100 mmol) of gallic acid and 12.0 mg (0.105 mmol) glycine
anhydride was dissolved in 2mL of 50:50 mixture of water and acetone solution. The solution was
left for slow evaporation at 5oC. Colorless needles of GALGAH were harvested after seven days.
GALCAF: The synthesis and the structure description of the cocrystal of gallic acid with caffeine
( GALCAF) has been reported elsewhere.41
GALINA : The synthesis and the structure description of the cocrystal of gallic acid with
isonicotinic acid ( GALINA) has been reported elsewhere. 38
GALNAM: The synthesis and the structure description of the cocrystal of gallic acid with
nicotinamide (GALNAM) has been reported elsewhere. 41
GALINM : The synthesis and the structure description of the cocrystal of gallic acid with iso-
nicotinamide ( GALINM) has been reported elsewhere. 41
GALTBR: The synthesis and the structure description of the cocrystal of gallic acid with
theobromine (GALTBR) has been reported elsewhere. 41
FERINZ: 19.0 mg of ferulic acid (0.100 mmol) and 13.7 mg of isoniazid (0.100 mmol) were
dissolved in 2mL of ethanol and left for slow evaporation at 5oC which yielded colorless needles
of FERINZ after three days.
FERDMP: 19.4 mg of ferulic acid (0.100 mmol) and 9.6 mg of 3, 5-dimethylpyrazole (0.100
mmol) were dissolved in 5mL of methanol until a clear solution was obtained. The solution was
left for slow evaporation at 5oC. Yellow plates of FERDMP were harvested after fourteen days.
Page 181
161
FERURE: 19.2 mg, (0.100 mmol) of ferulic acid was dissolved in 2 mL of ethanol. This solution
was then added to a 1 mL saturated solution of urea and allowed to slowly evaporate at room
temperature resulting in colorless needles of FERURE which were harvested after eight days.
FERGAH: 19.0 mg of ferulic acid (0.1 mmol) and 79.0 mg of glycine anhydride (0.693 mmol)
were dissolved in 2mL of 50:50 mixture of water and acetone solution. The solution was left for
slow evaporation at 5oC to yield colorless needles of FERGAH after ten days.
FERTBR: 19.0 mg of ferulic acid (0.100 mmol) and 19.0 mg of theobromine (0.693 mmol) were
dissolved in 4mL of 50:50 mixture of water and ethanol solution. The solution was left for slow
evaporation at room temperature. Colorless needles of FERTBR were harvested after fourteen
days.
FERNAM: The synthesis and the structure description of the cocrystal of ferulic acid with
nicotinamide (FERNAM) has been reported elsewhere.41
CFAINZ: 18.0 mg (0.099 mmol) of caffeic acid and 28 mg (0.204 mmol) of isoniazid was
dissolved in 3 mL of 50:50 acetone/water mixture and allowed to slowly evaporate in a fume hood
to yield light yellow crystals of CFAINZ after two days.
CFAINM: 9 mg (0.100 mmol) of caffeic acid, and 30 mg (0.500 mmol) of isonicotinamide, were
dissolved in 3 mL of 50:50 methanol/water by heating on a hotplate. The resulting solution allowed
to slowly evaporate yielding yellow needle-like crystals after two days.
CFANAM: The synthesis and the structure description of the cocrystal of caffeic acid with
nicotinamide (CFANAM) has been reported elsewhere.41
ELANAM: 20.0 mg (0.0662 mmol) of ellagic acid and 324.0 mg (2.65 mmol ) of nicotinamide
were dissolved in 0.5 mL of 1-methyl-2-pyrrolidinone (NMP). Yellow plate-like crystals of
Page 182
162
ELANAM were harvested after one week.
ELATHP: 10.0 mg (0.0296 mmol) ellagic acid dihydrate and 27.0 mg (0.149 mmol) anhydrous
theophylline were added to 5.00 mL of ethanol and heated on a hotplate. The contents were then
cooled to room temperature and filtered to obtain an orange solution, which was allowed to slowly
evaporate at room temperature to yield yellow plate-like crystals of ELATHP the next day.
ELADMP: 5.0 mg (0.015 mmol) of ellagic acid was dissolved in 5 mL of hot propylene glycol.
143.0 mg (15 mmol) of 3,5-dimethylpyrazole was added to it and the solution was left for slow
evaporation to yield yellow needle-like crystals of ELADMP after two days.
ELACAP: 10.0 mg (0.0296 mmol) of ellagic acid and 268.0 mg (2.37 mmol) of caprolactam was
added to 5.00 mL of isopropanol and heated on a hotplate. The contents were cooled to room
temperature and filtered to obtain a yellow solution, which on slow evaporation lead to the
formation of yellow triangular plate-like crystals after a month.
ELACAF: The synthesis and the structure description of the cocrystal of ellagic acid with caffeine
(ELACAF) has been reported elsewhere.41
ELASAR: The synthesis and the structure description of the cocrystal of ellagic acid with
sarcosine (ELASAR) has been reported elsewhere.38
ELAINM: The synthesis and the structure description of the cocrystal of ellagic acid with
isonicotinamide (ELAINM) has been reported elsewhere.41
COUNAM: 228.1mg (1.380mmol) of p-coumaric acid and 170.2 mg (1.390mmol) of
nicotinamide were mixed in 3mL of ethanol and slurried overnight. The resulting solution was
Page 183
163
filtered by using a filter paper and on leaving the resulting filtrate for slow evaporation in the hood,
colorless crystals of COUNAM were harvested after two days.
COUINM-I: 228.1mg (1.380mmol) of p-coumaric acid and 170.2 mg (1.39 mmol) of
isonicotinamide, were mixed in 3mL of ethanol and slurried overnight . The resulting solution was
filtered by using a filter paper and on leaving the resulting filtrate for slow evaporation in the hood,
colorless crystals of COUINM were harvested after two days.
COUTBR.2H2O: 16.4 mg (0.100 mmol) of p-coumaric acid and 17.0 mg (0.100 mmol) of
theobromine were mixed in 3mL of 50:50 ethanol/water mixture. The resulting solution was left
for slow evaporation in the hood and colorless crystals of COUTHB.2H2O were harvested after
two days.
COUINZ: 16.41 mg (0.1000mmol) of p-coumaric acid and 13.71 mg (0.1000mmol) of isoniazid
were dissolved in 3mL of ethanol while heating. The resulting solution was left for slow
evaporation. Yellow plate like crystals of COUINZ were harvested after two days.
COUURE: 16.41 mg (0.1000mmol) of p-coumaric acid was dissolved with a saturated solution
of urea, in ethanol. The resulting solution was heated on a hotplate and was left at room
temperature for slow evaporation to yield colorless crystals of COUURE after two days.
COUTHP: The synthesis and the structure description of the cocrystal of coumaric acid with
theophylline (COUTHP) has been reported elsewhere.64
COUCAF: The synthesis and the structure description of the cocrystal of coumaric acid with
caffeine (COUCAF) has been reported elsewhere.64
Page 184
164
Table 8.1 below lists the melting points of the crystal forms along with the melting points of the
cocrystal formers.
Table 8.1. Melting point of crystal forms used herein.
CRYSTAL
FORM
MELTING POINT
(°C)
M.P.Cocrystalformer
1(°C)
M.P.Cocrystal former
2(°C)
HCTDMG 206 275 54
HCTINM•H2O 127 275 155
HCTNAC 268 275 236
HCTNAM 178 275 128
COUURE 123.5 214 132
COUINZ 178 214 171
COUCAF 184 214 234
COUNAM 159 214 128
COUINM 179 214 155
COUTBR 228 214 345
COUTHP 223 214 271
CFANAM 109 211 128
CFAINM 152 211 155
CFAINZ 185 211 171
GALCAF 202 251 234
GALTBR 270 251 345
GALNAM 210 251 128
GALINM 204 251 155
GALINA 194 251 300
GALGAH 260 251 300
Page 185
165
Table 8.1. (Continued)
CRYSTAL
FORM
MELTING POINT
(°C)
M.P.Cocrystalformer
1(°C)
M.P.Cocrystal former
2(°C)
GALDMP 156 251 106
GALINZ 226 251 171
FERNAM 127 169 128
FERINM 153 169 155
FERTBR 191 169 345
FERCAF 169 234
FERGAH 207 169 300
FERURE 164 169 132
ELANAM 288 350 128
ELAINM 300 350 155
ELACAF 300 350 234
ELATHP 326 350 271
ELASAR 320 350 208
ELADMP 237 350 106
ELACAP 276 350 68
8.2.7. Characterization of Crystal Forms.
8.2.7.1. Differential scanning calorimetry (DSC). Thermal analysis was performed on a TA
Instruments DSC 2920 Differential Scanning Calorimeter. Aluminum pans were used for all
samples and the instrument was calibrated using an indium standard. For reference, an empty pan
sealed in the same way as the sample was used. Using inert nitrogen conditions, the samples were
Page 186
166
heated in the DSC cell from 30°C to the required temperature (melting point of the cocrystal) at a
rate of 10°C/min.
8.2.7.2. Thermogravimetric analysis (TGA). A Perkin Elmer STA 6000 Simultaneous
Thermal Analyzer was used to conduct thermogravimetric analysis. Open alumina crucible
is used to heat the sample from 30°C to the required temperature at 10 °C/min scanning
rate under nitrogen stream.
8.2.7.3. Infrared spectroscopy (FT-IR). To characterize the cocrystals by infrared
spectroscopy a Nicolet Avatar 320 FT-IR instrument was used. Sample amounts of 1-2 mg
were used and spectra were measured over the range of 4000 – 400cm-1 and analyzed
using EZ Omnic software.
8.2.7.4. Powder X-ray diffraction (PXRD). A Bruker AXS D8 powder diffractometer
was used for all PXRD measurements with experimental parameters as follows: Cu Kα
radiation (λ = 1.54056 Ǻ); 40 kV and 30 mA. Scanning interval: 3–40° 2θ; time per step:
0.5 sec. The experimental PXRD patterns and calculated PXRD patterns from single crystal
structures were compared to confirm the composition of bulk materials.
8.2.7.5. Single-Crystal X-ray Data Collection and Structure Determinations. Crystalline
products were examined under a microscope and suitable crystals were selected for single crystal
X-ray diffraction. Data were collected on single crystals on a Bruker-AXS SMART APEX 2 CCD
diffractometer with monochromatized Cu Kα radiation (λ = 1.54178 Å). The diffractometer was
Page 187
167
connected to a KRYO-FLEX low temperature device. Data was collected at 100K .Indexing was
performed using SMART v5.625 or using APEX 2008v1-0. Frames were integrated with SaintPlus
7.51 software package. Absorption corrections were performed by multi-scan method
implemented in SADABS. The structures were solved using SHELXS-97 and refined using
SHELXL-97 (Matrix Non-Linear Least- Squares) contained in SHELXTL v6.10 and WinGX
v1.70.01 program packages. All non-hydrogen atoms were refined anisotropically. Hydrogen
atoms were placed in geometrically calculated positions or found in the Fourier difference map
and included in the refinement process using riding model or without constraints. Table 3-10 , 13
and 14 contains the crystallographic data and structure refinement parameters for the cocrystals
isolated in the present study. 43, 44,45,46,47
8.3. Results and Discussion.
8.3.1. Crystal Engineering. Previously, studies discussing the hierarchy of supramolecular
synthons pertaining to carboxylic acids, hydroxyl groups with pyridine nitrogen’s, amides,
carbonyl moieties and carboxylates with hydroxyl groups have been done by our research group.
These studies which constituted of an independent CSD study followed by experimental
validation, have helped conclude that the respective heterosynthons have precedence over the
homosynthons. The CSD statistics for the studied supramolecular synthons of current relevance
have been tabulated below in Table 2.
Page 188
168
Table 8.2. CSD statistics of supramolecular synthons in the literature. 35(a), 38
Supramolecular Synthon Raw data(in presence of
competing functional groups)
Refined data(absence of competing
functional groups)
COOH··· Narom 77% 98%
COOH··· COOH Dimer: 31%
Catemer: 3%
Dimer : 93%
Catemer : 9%
COOH··· CONH2 57% 84%
COOH ···C=O 27% 48%
COOH··· OH 46% 69%
OH··· Narom 53% 78%
OH ···CONH2 50% 90%
OH··· C=O 43% 65%
OH··· OH 26% 76%
COOH, OH··· N arom COOH··· Narom 60%
OH··· Narom 38%
COOH··· Narom 73%
OH··· Narom 53%
COOH, OH··· CONH2 COOH ···CONH2 50%
OH··· CONH2 32%
COOH, OH··· C=O COOH··· C=O 14%
OH ···C=O 25%
COOH··· C=O 19%
OH··· C=O 30%
COO···OH 56%
Our current study, comprises of the COI's that majorly contain hydroxyl, carboxylic acid, amide
moieties and thus our discussion here majorly focuses on whether the COI’s behave according to
the above mentioned statistics. Hydrochlorothiazide, on the other hand displays sulfonamide and
Page 189
169
amine moieties and has been discussed in detail later on. The principle synthons observed by the
phenolic compounds have been depicted below in Scheme 2.
Scheme 8.2. The principle synthons observed by the phenolic compounds.
8.3.2. Crystal forms of gallic , ferulic , caffeic , coumaric and ellagic acid. These COI’s are
broadly classified as nutraceuticals 48, 49 which includes amino acids, vitamins and dietary
polyphenols. Dietary polyphenols which are principally secondary plant metabolites, represent a
wide variety of compounds that occur in fruits, vegetables, wine, tea, and cocoa products. They
Page 190
170
are mostly derivatives and/or isomers of flavonoids, stilbenes, catechins, and phenolic acids. They
exhibit many biologically significant functions, such as protection against oxidative stress and
degenerative diseases, due to their antioxidant properties.50 In our COI’s , coumaric, caffeic and
ferulic acids belongs to the class of hydroxycinnamic acids 51 ; ellagic acid in flavanoids and gallic
acid belongs to the class of catechins . All of these have various effects on the body such as gallic
acid is shown to have antiviral and antifungal as well as anticancer properties; ferulic acid
principally extracted from fruit and vegetate peel is known for its antioxidant properties. Caffeic
acid , coumaric and ellagic acid on the other hand is also known for their antioxidant properties.
52, 53, 54, 55, 56
All the COI’s have a carboxylic acid and hydroxy moiety, and it is observed that supramolecular
heterosynthons manifest more as compared to homosynthons as has been seen previously in the
literature. Herein, the crystal structures of these COI’s have been described. Some of the crystal
forms have been already reported in the scientific literature.
CFAINM•2H2O: CFA and INM crystallizes in P-1, resulting in a dihydrate of CFAINM. The
CFA molecules are observed to be disordered in the cocrystal. From the crystal structure, four
water molecules are observed to be present between the pairs of CFA molecules, resulting in the
formation of a 4+2 hexamer. The carboxylic acid moiety of each CFA hydrogen bonds to the Narom
moiety of INM via COOH···Narom hydrogen bond at distance of 2.733 (1) Å. The amide moieties
of INM molecules form amide dimers , N-H···O hydrogen bond distances of 2.935 (2) Å. The
interactions between CFA, water and INM molecules result in the generation of a linear tape which
are sandwiched by adjacent tapes. Each tape interacts with adjacent tapes via two types of
interactions (a) the OH of the carboxylic acid of CFA forms a hydrogen bond with water, O-H···O:
2.838 (6) Å ; (b) the anti-hydrogen of the amide of INM molecule hydrogen bonds to the carbonyl
Page 191
171
moiety of CFA molecule, N-H···O : 2.994 (7) Å. The overall hydrogen bonding is illustrated in
Figure 8.1.
Figure 8.1. Illustration of intermolecular hydrogen bonding in CFAINM•2H2O
CFAINZ: CFAINZ crystallizes in P-1 with one molecule of each in the asymmetric unit. From
the crystal structure, it is seen that the cocrystal is sustained by the catechol dimer , (O···O: 2.748
(3) Å). INZ molecules hydrogen bond to the catechol dimer peripherally via anti-hydrogen atoms
of the hydroxyl moieties (O···O: 2.666 (3) Å, O···N: 2.977 (3) Å). The carboxylic acid moiety of
CFA molecules hydrogen bonds to the Narom moiety of INZ molecules (O…N :2.616 (3) Å) which
results in the formation of linear tapes. The tapes in CFAINZ are linked through interactions
between the carbonyl moiety of CFA and the anti-hydrogen atoms of hydrazine moieties (O···N :
(2.886 (3) Å) leading to the formation of a supramolecular sheet as illustrated in Figure 8.2.
Page 192
172
Figure 8.2. Illustration of the supramolecular sheet generated by intermolecular interactions
between adjacent hydrogen bonded tapes in CFAINZ.
GALINZ: GAL and INZ crystallizes in P-1. Each asymmetric unit contains two molecules of
GAL and two molecules of INZ. Phenolic supramolecular homosynthon (O…O: 2.757(1), O…O:
2.805 (1) Å) is observed between two GAL molecules in the crystal structure. This homodimer in
turn hydrogen bonds to the hydrazide moieties of two molecules of INZ to form four component
supramolecular assemblies of GAL and INZ molecules. This four component supramolecular
assembly in turn forms H-bonded tapes sustained by COOH…Narom supramolecular heterosynthon
(O…N: 2.636(3) Å), which finally leads to a two dimensional structure as shown in Figure 8.3(a).
The carbonyl moiety of one GAL molecule hydrogen bonds with the amine moiety of INZ (N…O:
3.044(1) Å) to form bilayers that are sustained by π - π interactions as shown in Figure 8.3(b).
Page 193
173
(a)
(b)
Figure 8.3. (a) Crystal packing in GALINZ reveals form H-bonded tapes that are sustained
by COOH…Narom supramolecular heterosynthons (b) Illustration of bilayers of GALINZ
sheets.
GALDMP: GALDMP crystallizes in P-1. Each asymmetric unit consists of one molecule of
GAL and two molecules of DMP. The crystal structure of GALDMP reveals that GAL molecules
form phenolic supramolecular homosynthons (O…O: 2.741(7) Å) that self-assemble to form tapes
along the b axis. The homodimers further hydrogen bond to DMP as shown in Figure 8.4(a). The
third hydroxyl moiety of the gallic acid molecule interacts with the aromatic nitrogen of the second
DMP molecule and the phenolic moiety of a GAL molecule to generate a trimeric ring motif, as
Page 194
174
shown in Figure 4(b) giving rise to a two dimensional network as shown in Figure 8.4(c).
(a) (b)
(c)
Figure 8.4. (a) Phenolic homodimers of GAL molecules acts as a donor and an acceptor to
DMP molecules (b) trimeric motif involving two GAL molecules and a DMP molecule (c)
Crystal packing in GALDMP reveals a 2D network of GAL and DMP molecules.
GALADN: GALADN crystallizes in monoclinic space group P21/c. The crystal structure reveals
the formation of supramolecular heterosynthons (N…O: 2.880(17) Å; O…O: 2.644(78) Å) between
carboxylic acid moieties of GAL molecules and the aminopyridine moieties of ADN to generate
chains. These chains are further interconnected via the formation of phenolic homodimers of GAL
molecules (O…O: 2.701(11) Å). In addition, the exterior H-bond donor and acceptor sites of the
Page 195
175
phenolic homodimers are exploited by ADN molecules of adjacent chains to generate a 3D
network illustrated in Figure 8.5.
Figure 8.5. Crystal packing in GALADN reveals form H-bonded interactions between the
carboxylic acid moiety of GAL molecules and the aminopyridine moiety of ADN molecules.
GALURE: GAL and URE molecules crystallize in the monoclinic space group P21/c. Each
asymmetric unit consists of one molecule of each. The crystal structure reveals that GAL and
URE molecules form carboxylic acid-amide supramolecular heterosynthons (O…O 2.528(1)Å,
N…O: 2.996(1) Å). These heterodimers are cross linked by NH…OH hydrogen bonds (N…O:
3.005(1) Å) to form tapes. The heterodimers are linked to adjacent tapes perpendicularly by via
hydrogen bond between the amine and phenolic moieties (O…O: 2.701(1) Å; N…O: 2.826(1) Å).
Additionally, the phenolic moiety of the GAL molecule from the adjacent tape accepts a bifurcated
hydrogen bond from the phenolic moiety of the GAL molecule and the amine moiety of the URE
molecule (O…O: 2.835(1) Å; N…O: 2.984(1) Å ) as shown in Figure 8.6.
Page 196
176
Figure 8.6. Crystal packing in GALURE reveals molecular tapes of heterodimers of GAL
and URE molecules.
GALGAH: From the crystal structure of GALGAH is it seen that there are two molecules of
GAH molecules and one molecule of GAL in the unit cell. The GAL molecules form undulating
chains sustained by carboxylic acid supramolecular homosynthons (O…O: 2.610(1) Å) and
phenolic supramolecular homosynthons (O…O: 2.723(1) Å). This undulating chain of
homodimers is absent in both the anhydrous and hydrated forms of GAL. GAH molecule
hydrogen bonds with the phenolic homodimers by forming a tetrameric assembly (NH…OH:
2.935(1) Å, OH…O: 2.635(1) Å,) which in turn connects each chain, forming a sheet as shown in
Figure 8.7(a). The other GAH molecule interacts with the GAL chains via OH…O hydrogen bonds
(O…O: 2.748(1) Å) and further connect the sheets above and below through amide-amide
supramolecular homosynthons (N…O: 2.854(1) Å as shown in Figure 8.7(b).
Page 197
177
(a)
(b)
Figure 8.7: (a) Crystal packing in GALGAH reveals undulating tapes sustained by dimers
of GAL molecules linked by GAH molecules to form sheets (b) Illustration of sheets
interconnected by homodimers of GAH molecules.
FERADN: The crystal structure of FERADN reveals one molecule each of FER and ADN in the
unit cell. FER and ADN molecules form two point supramolecular heterosynthons between the
acid moiety of FER and the amine and basic nitrogen of the ADN molecule to form 1-D chains
(NH…O: 2.839 (1)Å; OH…O: 2.692(1) Å. Adjacent chains are cross linked by hydrogen bonding
interactions between one FER molecule and two ADN molecules to result in an interpenetrated
three dimensional network as shown in Figure 8.8.
Page 198
178
Figure 8.8: Crystal packing of FERADN is that of a 3D interpenetrated network.
FERINZ: FER and INZ crystallize in P-1. The crystal structure reveals two molecules of each
component in the asymmetric unit. The crystal structure of FERINZ is sustained by COOH…Narom
supramolecular heterosynthons (O…N: 2.636(5) Å shown in Figure 8.9(a). The INZ molecules
interact via NH…O (N…O: 2.968(7) Å) supramolecular homosynthons to form dimers. The
intermolecular H-bonding generates a herring bone pattern as shown in Figure 8.9(b).
Page 199
179
(a)
(b)
Figure 8.9. (a) Crystal packing in FERINZ sustained by COOH…Narom supramolecular
heterosynthons (b) Herring bone pattern of FERINZ.
FERURE: FERURE crystallizes in P21/c. The crystal structure reveals that FER and URE
molecules form a 1:2 adduct. Both URE molecules form the amide-amide supramolecular
homosynthons that generate tapes along the b axis. The NH…O bond distances are 2.945(3)Å and
2.936(3)Å for the first URE molecule and 2.982(3) Å and 2.951(3)Å for the second URE
molecule. The homodimers are further interconnected through a two point hydrogen bond between
the amine moieties of URE and the hydroxyl and methoxyl moieties of FER ((N…O: 2.986(2)Å,
Page 200
180
N…O: 3.023(2)Å. In addition, the carbonyl moiety of the URE molecule accepts a hydrogen bond
from the carboxylic acid moiety of FER as shown in Figure 8.10.
Figure 8.10. Crystal packing in FERURE reveals amide-amide supramolecular
homosynthons between URE molecules to generate tapes that are interconnected by FER
molecules.
FERGAH: FERGAH crystallizes in Pc. The crystal structure reveals a 2:2 cocrystal of FER and
GAH which is sustained by chains of GAH molecules formed via amide-amide supramolecular
homosynthons (N…O: 2.987(1) Å; N…O: 2.225(1) Å). The chains of GAH molecules are
interconnected by FER molecules through OH…O hydrogen bonding (O…O: 2.615(1) Å) resulting
in the formation of a sheet as illustrated in Figure 8.11.
Page 201
181
Figure 8.11. Crystal packing in FERGAH reveals molecular tapes of amide-amide
supramolecular homosynthons between GAH molecules interconnected by FER molecules.
FERTBR: The crystal structure of FERTBR . H2O reveals a 1:1 cocrystal monohydrate which
crystallizes in the C2/c. The crystal structure consists of FER and TBR molecules that form acid-
imide supramolecular heterosynthons (N…O: 2.858(3) Å, O…O: 2.602(3) Å) interconnected by
water molecules to form discrete 6-component supramolecular assemblies as seen in Figure 8.12.
Page 202
182
Figure 8.12. Crystal packing of FERTBR . H2O reveals that FERTBR heterodimers are connected
by water molecules.
COUNAM : COUNAM crystallizes in P21/c. The crystal structure reveals that COU and NAM
molecules form acid-amide dimers, (O…O: 2.5408(15) Å) which are connected to other via
Narom…OH; (O…N(11) 2.7049(17) Å ) supramolecular heterosynthon. The COUNAM dimers
form a zig-zag chain which are linked via lateral hydrogen bonds (NH…CO); (N…O: 2.9106(17)
Å) as illustrated in Figure 8.13 (a) and therefore form a corrugated sheet. The overall structure of
COUNAM is illustrated in Figure 8.13(b).
Page 203
183
(a)
(b)
Figure 8.13. (a) The COUNAM dimers which form a zig-zag chain (b) The overall structure of
COUNAM.
COUURE: COUURE crystallizes in C2/c. The crystal structure reveals that each asymmetric unit
consists of one molecule each of COU and URE molecules. The COU molecules are sustained by
carboxylic acid homodimers; (OH…O: 2.601(1) Å) and the two URE molecules connect two COU
molecules through OH…CO; (OH…O):1: 2.647(1) Å and OH…NH; (NH…O : 2.984(2) Å)
heterosynthons giving rise to zig-zag chains linked by lateral hydrogen bonds to form an overall
Page 204
184
corrugated tape. The overall structure of COUURE is illustrated in Figure 8.14.
Figure 8.14. The overall crystal structure of COUURE.
COUINZ : COUINZ crystallizes in P21/n. The crystal structure reveals that reveals that COU
and INZ molecules exist as acid-hydrazide dimers O(2)-H(11) …N(13) : 2.5999(15) Å; O(2)-
H(11)…N(12): 3.3296(14) Å, which are connected via Narom…OH , O(1)-H(12) …N(11) :
2.7354(15) Å heterosynthon. The dimers form zig-zag chains which are linked by lateral hydrogen
bonds (NH…CO), N(13)-H(13) …O(2): 2.9358(15) Å. The overall network appears as a
supramolecular corrugated sheet. The overall structure of COUINZ is illustrated in Figure 8.15.
Figure 8.15. Overall corrugated sheet of COUINZ.
Page 205
185
COUINM-I: COUINM-I crystallizes in P-1.The crystal structure reveals that COU and INM
molecules exist as acid-amide dimers; O(1)-H(21)...N(11): 2.694(2) Å , O(3)-H(22) …O(11):
2.5859(17) Å which are connected to other via Narom…OH, N(12)-H(121) …O(2): 3.040(2) Å
supramolecular heterosynthon. The COUINM dimers form a linear chain which are linked by
lateral hydrogen bonds (NH…CO), N(12)-H(122) …O : 2.981(2) Å to form a supramolecular sheet.
The overall structure of COUINM-I is illustrated in Figure 8.16.
Figure 8.16. Supramolecular sheet of COUINM-I.
COUTBR.2H2O. The crystal structure reveals that COU and TBR molecules are held together
by a dimer which is formed between the C=O and N-H of the imide moiety N(23)-H(23N) …O(2)
: 2.8468(18) Å and the carboxylic acid of COU in the crystal structure. These dimers in turn are
connected to other dimers via two water molecules. The overall hydrogen bonding results in the
formation of zig-zag tapes as seen in Figure 8.17.
Page 206
186
Figure 8.17. The overall hydrogen bonding resulting in the formation of zig-zag tapes in
COUTBR.
ELACAP: ELACAP crystallizes in P21/n. The single crystal data reveals that ELACAP consists
of two ELA and two CAP molecules in the unit cell. The phenolic hydroxyls hydrogen bonds to
the carbonyls of CAP at (O…CO : 2.696(9) Å and 2.724(9) Å.) The carbonyl moiety of ellagic acid
hydrogen bonds to the NH ( O…NH : 2.90(10) Å) of CAP. Overall it gives rise to a series of
heterocatemers as seen in Figure 8.18.
Figure 8.18. Supramolecular heterocatemers of ELACAP.
Page 207
187
ELANAM : ELANAM crystallizes in P21/n. The crystal x-ray structure reveals one ELA
molecule and two NAM molecules in the asymmetric unit. NAM interacts with phenolic hydrogen
of ELA via supramolecular heterosynthon at a distance of Narom…OH; (OH…N :2.64 (5) Å) . NAM
molecules interact via the amide-amide supramolecular homosynthon with a C=O···HN (NH•••O:
3.040(7) Å) to form a zigzag chain. The amide dimer also acts as both a hydrogen bond donor and
acceptor towards the carbonyl and phenolic hydrogen of ELA to form a trimer. OH•••O: 2.694(6)
Å, NH•••O: 2.953(7) Å. The trimeric interaction links the zigzag chains together to yield the
overall crystal packing illustrated in Figure 8.19.
Figure 8.19. Trimeric interaction linking the zigzag chains together to yield the overall
crystal packing for ELANAM.
ELADMP: ELADMP crystallizes in P21/c. The asymmetric unit reveals a 1:1 cocrystal of ELA
and DMP which forms a tetramer (OH•••O: 2.649(1) Å and 2.903(2) Å). The ammonium moiety
of N,N-dimethylglycine interacts with hydroxyl group of ELA (NH•••O: 2.887(2) Å) also the ELA
molecules are sustained via π-stacking in a staggered orientation shown in Figure 8.20.
Page 208
188
Figure 8.20. Interactions between ELA and DMP.
ELATHP. The single crystal x-ray structural analysis reveals that ELATHP contains two ELA
molecules, four THP molecules and water in the asymmetric unit. THP molecules form dimers
via C=O···HN interactions (N-H•••O: 2.714(2) Å). Other carbonyls from the dimer interact with
the hydroxyl moieties of ELA (OH•••O: 2.757(2) Å) to form a straight chain which interacts with
adjacent straight chains via bifurcated hydrogen bonding between the hydroxyl moieties of ELA
(OH•••O: 2.757(2) Å) and pyridine of THP (N-H•••O: 2.711(2) Å). The water molecules interact
with the carbonyls of ELA (OH•••O: 2.611 Å) and THP (OH•••O: 2.785Å). The overall crystal
packing resembles crossed ribbons as illustrated in Figure 8.21.
Figure 8.21. Intermolecular interactions between ELA and THP.
Page 209
189
Table 8.3. Crystallographic data and structure refinement parameters for the cocrystals.
COUURE COUINZ COUNAM COUINM COUTBR.2H2
O
Formula C19 H20 N2
O7
C20H20N4O5
.33
C15 H14 N2 O4
C15 H14 N2 O4 C16 H20 N4 O7
MW 224 401.73 286.28
286.28 380.36
Crystal
system
Monoclinic
Monoclinic, Monoclinic Triclinic Monoclinic
Space
group C2/c P21/n P21/c P-1 P-1
a (Å) 16.0219(3)
Å 7.3854(2) 15.5635(5) 6.9663(3) 15.3236(4)
b (Å) 6.11800(10)
Å 5.70390(10) 6.3162(2) Å 7.3890(5) 8.8959(2)
c (Å) 19.9780(3)Å 32.6563(6) 14.1472(5) 14.6499(7) 12.9598(4)
α (deg) 90 90 90 91.135(4) 90
β (deg) 110.9110(10
) 92.7760(10)
106.043(2)°
99.602(3) 102.781(2)
γ (deg) 90 90 90 118.103(3) 90
V / A3 1829.3(5) 1374.05(5) 1336.54(8) 651.65(6) 1722.87(8)
Dc/g cm-3 1.410 1.456 1.423 1.459 1.466
Z 4
4 4 2 4
2θ range 4.74 to 67.38 5.42 to
68.37 5.92 to 67.80 3.08 to 66.77 2.96 to 67.38
Nref./Npar
a 1592 / 136 2359 / 260 2366/ 214 5435 / 2165 14352 / 3033
T /K 100(2) 100(2) 100(2) 100(2) 100(2)
R1 [I>2σ
(I)] 0.0340 0.0343 0.0361 0.0408 0.0362
wR2 0.0848 0.0978 0.0903 0.1034 0.0911
GOF 1.014 1.011 1.040
1.017 1.024
Abs coef 0.917 0.900 0.874 0.896 0.992
Page 210
190
Table 8.3. (Continued)
GALINZ GALDMP GALADN GALURE GALGAH
Formula C13H13N3O6 C17H22N4O5 C12H11N5O5 C8H10N2O6 C11H12N2O7
MW 307.26 362.39 305.25 230.18 284.23
Crystal
system
Triclinic Triclinic Monoclinic Monoclinic Triclinic
Space group P-1 P-1 P21/c P21/c P-1
a (Å) 8.6337(3) 8.074(2) 7.96634(14) 9.7502(3) 6.0418(2)
b (Å) 11.9056(5) 8.149(2) 6.33221(23) 9.8774(3) 7.9997(2)
c (Å) 13.3621(5) 15.091(4) 24.8483(4) 10.2927(3) 13.0244(3)
α (deg) 94.353(2) 95.811(5) 90 90 103.309(2)
β (deg) 99.401(2) 93.004(5) 96.2093(16) 109.204(2) 91.082(2)
γ (deg) 108.929(2) 117.408(4) 90 90 109.7880(10)
V / A3 1269.47(8) 871.4(4) 1246.11(4) 936.09(5) 573.19(3)
Dc/g cm-3 1.608 1.381 1.589 1.633 1.647
Z 4 2 4 4 2
2θ range 3.38 to 65.97
2.73 to
25.03
3 to 40 4.80 to 67.95 3.51 to 66.04
Nref./Npara 4165/420 3031/265 - 1677/166 1914/196
T /K 100(2) 100(2) 300 100(2) 100(2)
R1 [I>2σ (I)] 0.0444 0.0406 - 0.0323 0.0369
wR2 0.1130 0.1060 - 0.0853 0.0925
GOF 0.999 1.039 1.523 1.084 1.095
Abs coef 1.109 0.103 0.123 1.237 1.211
Page 211
191
Table 8.3. (Continued)
FERINZ FERADN FERURE FERGAH FERTBR
Formula C16H17N3O5 C15H15N5O4 C14H18N4O6 C14H16N2O6 C17H20N4O7
MW 331.33 329.32 314.30 308.29 392.37
Crystal
system
Monoclinic Orthorhombic Monoclinic Monoclinic Monoclinic
Space group P21/c Pca21 P21/c Pc C2/c
a (Å) 13.681(4) 13.2739(4) 19.950(1) 10.9682(3) 30.546(4)
b (Å) 3.798(12) 16.2621(5) 10.2970(5) 12.7359(3) 6.8895(9)
c (Å) 29.843(10) 6.9427(3) 7.2349(4) 10.2315(3) 17.209(2)
α (deg) 90 90 90 90 90
β (deg) 101.914(5) 90 94.914(3) 97.599(2) 93.725(6)
γ (deg) 90 90 90 90 90
V / A3 1517(5) 1498.66(9) 1480.77(13) 1416.69(7) 3619.9(8)
Dc/g cm-3 1.451 1.460 1.410 1.445 1.442
Z 4 4 4 4 8
2θ range 3.30 to 44.48 2.72 to 67.07 2.22 to 65.82 3.47 to 65.98 2.90 to 52.63
Nref./Npara 1206/229 2421/226 2497/208 4124/403 2042/259
T /K 293(2) 100(2) 100(2) 225(2) 298(2)
R1 [I>2σ (I)] 0.0762 0.0354 0.0445 0.0537 0.0742
wR2 0.1734 0.0827 0.1062 0.1413 0.1965
GOF 0.994 1.065 1.081 1.004 1.016
Abs coef 0.920 0.918 0.974 0.971 0.965
Page 212
192
Table 8.3. (Continued)
ELANAM ELADMP ELADMG ELACAP
Formula C26H18ClN4O10 C24H22N4O8 C18H15N4O10 C26H28N2O10
MW 546.44 494.46 405.31 528.51
Crystal
system Monoclinic Monoclinic Monoclinic Monoclinic
Space group P21/n P21/c C2/c P21/n
a (Å) 7.035 (3) 4.9393 (6) 20.7781 (4) 12.452 (3)
b (Å) 22.963 (6) 18.155 (2) 12.4012 (2) 6.0627 (15)
c (Å) 7.290 (2) 12.1795 (12) 13.0557 (2) 15.624 (4)
(deg) 90 90 90 90
(deg) 106.50 (2) 93.451 (7) 107.333 (1) 91.562 (10)
(deg) 90 90 90 90
V /Å3 1129.2 (6) 1090.2 (2) 3211.34 (9) 1179.1 (5)
Dc/g cm-3 1.607 1.506 1.677 1.489
Z 2 2 8 2
2 range 3.85 to 39.04 4.38 to 68.13 4.20 to 65.08 4.48 to 42.87
Nref./Npara
. 623/172 1916/178 2695/285 753/212
T /K 100 (2) 100 (2) 100 (2) 100 (2)
R1
[I>2sigma(I)
]
0.0375 0.0636 0.0313 0.0515
wR2 0.0771 0.1404 0.0844 0.1346
GOF 1.011 1.002 1.030 1.065
Abs coef. 1.077 0.972 1.206 0.974
Page 213
193
Table 8.4. Crystallographic data and structure refinement parameters for the cocrystals
CFAGAH CFAINM•2H2O
Formula C13H14N2O6 C15H18N2O7
MW 294.26 338.31
Crystal system Triclinic Triclinic
Space group P-1 P-1
a (Å) 6.1600 (3) 8.5694(1)
b (Å) 8.0178 (4) 9.4912(2)
c (Å) 13.4643 (6) 9.5505(2)
(deg) 90.271 (3) 93.312(1)
(deg) 101.790 (3) 91.537(1)
(deg) 96.325 (3) 99.397(1)
V /Å3 646.75 (5) 764.56(2)
Dc/mg m-3 1.511 1.470
Z 2 2
2 range 3.35 to 65.52 4.64 to 65.97
Nref./Npara. 2135 /201 2534/350
T /K 225 (2) 100 (2)
R1 [I>2sigma(I)] 0.0347 0.0365
wR2 0.0900 0.0975
GOF 1.028 1.057
Abs coef. 1.035 1.003
Page 214
194
Table 8.5. Selected Hydrogen bonds distances and parameters for cocrystals.
Hydrogen bond d (H · · · A) /Å D (D · · · A)/Å <(DHA)
ELANAM N(7)-H(7)O(7)#2 2.17 3.044(7) 176.5
N(7)-H(72)O(15) 2.07 2.939(7) 169(1)
N(17)-
H(17)O(1)#3
1.59(6) 2634(5) 174(5)
N(11)-
H(11)O(7)#2
1.85 2.694(6) 179(3)
ELADMP N(2)-H(2)O(1)#3 1.58(5) 2.588(4) 163(4)
N(2)-H(1)O(4)#2 1.90(5) 2.973(4)) 173(4)
ELADMG
O(5)-H(3)O(10)#1 1.72(2) 2.649(1) 174(2)
O(6)-H(4)O(9)#2 1.86(2) 2.682(1) 157(2)
O(1)-H(1)O(9)#3 2.17(2) 2903(2) 149(2)
O(2)-H(2)O(10)#4 2.63(2) 2587(1) 170(2)
N(1)-H(5)O(5)#5 2.09(2) 2.887(2) 144(2)
ELACAP O(11)-H(11)O(1) 1.96(11) 2.724(9) 160(11)
N(1)-
H(1N)O(17)#2
2.15(11) 2.903(10) 130(8)
O(12)-
H(12)O(1)#4
1.98(8) 2.696(9) 171(9)
COUURE O(1) H(1)...O(21) 1.70(2) 2.601(1) 167(2)
O(2) H(2A)...O(3)#1 1.71(3) 2.647(1) 177(2)
N(21)-
H(21A)...O(3)#2
2.12 2.984(2) 168.0
N(21)
H(21B)...O(1)#3
2.22 2.963(2) 141.3
COUINZ O(2)-
H(11)...N(13)#1
1.61(3) 2.5999(15) 178(2)
O(2)-
H(11)...N(12)#1
2.46(2) 3.3296(14) 146.0(19)
O(1)-
H(12)...N(11)#2
1.89(2) 2.7354(15) 158(2)
N(13)-
H(13)...O(2)#3
2.370(16) 2.9358(15) 119.5(12)
N(13)-
H(14)...O(3)#4
2.09(2) 2.9848(16) 169.4(16)
N(12)-
H(15)...O(3)#5
2.166(18) 2.8865(15) 143.2(15)
Page 215
195
Table 8.5. (Continued)
Hydrogen bond d (H · · · A) /Å D (D · · · A)/Å <(DHA)
COUNAM
O(2)-H(2)...O(11) 1.65(3) 2.5408(15) 167(2)
O(3)-H(3)...N(11)#1 1.85(2) 2.7049(17) 164(2)
N(12)-H(111)...O(1) 2.02(2) 2.9106(17) 169.3(18)
N(12)-
H(112)...O(2)#2
2.08(2) 2.9473(18) 162(2)
COUINM O(1)-
H(21)...N(11)#1
1.94 2.694(2) 148.5
O(3)-
H(22)...O(11)#2
1.77 2.5859(17) 164.6
N(12)-
H(121)...O(2)#2
2.09 3.040(2) 168.9
N(12)-H(122)...O(2) 2.09 2.981(2) 159.7
COUTBR O(1)-H(1O)...O(22) 1.73(2) 2.6158(16) 169(2)
O(3)-
H(2O)...O(32)#1
1.70(3) 2.5993(17) 173(2)
N(23)-H(23N)...O(2) 2.04(2) 2.8468(18) 166(2)
O(31)-
H(31O)...O(3)#2
1.99(3) 2.8145(18) 171(2)
O(32)-
H(32O)...O(31)#3
1.85(3) 2.7086(18) 179(2)
O(31)-
H(33O)...N(21)#4
2.15(2) 2.9145(18) 149(2)
CFAINM•2H2O
O-H···O 1.95 (3) 2.838 (6) 172 (2)
O-H···O 1.80 (3) 2.687 (1) 175 (2)
O-H···O 2.02 (3) 2.854 (1) 161 (2)
CFAINZ
N-H···O 2.08 (3) 2.935 (2) 163.2 (2)
N-H···O 2.01 (2) 2.9201(2) 174.6 (2)
O-H···O 2.07 (4) 2.748(3) 131 (3)
O-H···O 2.14 (4) 2.739 (3) 123 (3)
N-H···O 2.32 (3) 3.148 (3) 145 (3)
N-H···O 2.48 (3) 2.977 (3) 112 (2)
N-H···O 2.50 (3) 3.329 (3) 146 (3)
Page 216
196
Table 8.6. Selected hydrogen bond distances and parameters of cocrystals.
Hydrogen bond d (H · · · A) /Å D (D · · · A)/Å <(DHA)
GALINZ N-HO 2.20 2.942(2) 142.2
N-HO 2.56(3) 3.427(3) 169(2)
N-HO 2.24 2.913(2) 132.8
N-HO 2.18(3) 3.044(3) 162(2)
O-HO 2.07 2.802(2) 145.3
O-HO 2.04 2.755(2) 142.8
O-HN 1.80 2.636(2) 174.8
O-HN 1.89 2.717(2) 167.6
O-HN 1.84 2.675(2) 173.9
O-HN 1.87 2.699(2) 167.6
GALDMP N-HO 2.14(2) 2.9314(19) 151.7(17)
N-HO 1.95(2) 2.8092(19) 162(2)
O-HN 1.67(3) 2.6190(18) 167(2)
O-HN 2.51(2) 3.3135(19) 140.6(18)
O-HO 1.97(2) 2.7410(16) 144.9(19)
O-HO 2.27(2) 2.7283(16) 112.0(17)
O-HO 1.84(3) 2.6800(17) 160(2)
O-HN 1.658(18) 2.5891(17) 169(3)
GALURE
O-HO 1.73 2.5282(14) 158.5
O-HO 1.89 2.7012(14) 162.4
O-HO 2.04 2.8346(14) 156.5
O-HO 2.10 2.8263(14) 144.7
N-HO 2.37(2) 3.2347(17) 159.9(16)
N-HO 2.542(19) 3.0048(17) 112.2(15)
N-HO 2.31(2) 2.8264(17) 120.0(16)
N-HO 2.12(2) 2.9961(18) 168.5(18)
GALGAH O-HO 1.80 2.6382(14) 178.6
O-HO 2.06 2.7229(15) 135.2
O-HO 1.91 2.7480(15) 175.7
O-HO 1.78 2.6102(15) 169.1
N-HO 1.94(2) 2.8537(17) 165.7(18)
N-HO 2.08(2) 2.9349(17) 166.7(19)
FERINZ O-HO 2.19 2.647(8) 115.8
O-HO 2.37 3.000(8) 134.4
O-HN 1.82 2.634(9) 174.6
N-HO 2.06(2) 2.91(1) 176(8)
N-HO 2.32(4) 3.17(1) 159(8)
N-HO 2.25(7) 2.96(1) 137(8)
FERADN O-HN 1.98 2.715(2) 146
N-HN 2.00 2.826(2) 155
N-HO 2.09(2) 2.964(3) 164(2)
Page 217
197
Table 8.6. (Continued)
Hydrogen bond d (H · · · A) /Å D (D · · · A)/Å <(DHA)
FERURE
O-HO 1.75(3) 2.639(2) 168(3)
N-HO 2.14 2.983(3) 160.7
N-HO 2.32 3.023(2) 136.4
N-HO 2.41 3.108(2) 137.0
N-HO 2.08 2.951(3) 168.5
N-HO 2.25 2.986(2) 141.2
N-HO 2.06 2.936(2) 172.1
N-HO 2.07 2.945(2) 174.2
N-HO 2.29 3.079(2) 150.0
O-HO 1.72(4) 2.616(2)
FERGAH O-HO 2.02 2.677(5) 135.1
O-HO 2.01 2.646(4) 132.5
N-HO 2.58 3.157(5) 124.5
N-HO 2.25 3.097(5) 164.1
FERTBR.H2O O-HO 1.79 2.600(7) 167.4
O-HO 1.89 2.710(7) 175.5
N-HO 2.00 2.858(7) 172.5
O-H(W)O 2.09(5) 2.865(7) 150(7)
O-H(W)O 1.90(3) 2.764(7) 169(9)
8.3.3. Hydrochlorothiazide Cocrystals. The CSD has no reported crystal forms of
hydrochlorothiazide. However, the literature shows three crystal forms of the drug with nicotinic
acid and 18 crown-6 piperazine reported by Almarsson and Zawortko et al. HCT being a
sulfonamide drug has donors and acceptors that make it a potential candidate for crystal
engineering. The CSD though , enlists a few sulfonamide cocrystal structures such as Piroxicam
, which is a BCS class II drug studied by Childs et al, 59 Celexocib a low soublity API studied by
Hickey et al 60 where one cocrystal with nicotinamide (VIDGAR) showed improved properties
following cocrystalliazation. Caira et al 61 conducted a thorough study on sulfa drugs mainly
sulfadimine drugs with carboxylic acids. Recently, Nangia et al 63 reported the structures of
sulfonamide – N pyridine oxide crystal forms. Thus, there are, but few reports on the sulfonamide
Page 218
198
class of compounds. 63 For HCT, a CSD search revealed that there are two polymorphic forms (Ref
code: HCSBTZ, HCSBTZ01) and nine solvates.
8.3.3.1. CSD statistics. For this CSD search, HCT was divided into two parts, the first
part containing the 1o and 2o sulfonamide moiety and the second part containing the 2o
amine (Scheme 3). Chloride was not included in the search due to it being a weak acceptor.
Table 11 shows the possible supramolecular combinations possible for sulfonamides. The
functional groups included in the search are carboxylic acids, phenols, aromatic nitrogen,
amides and carboxylates. Table 12 enlists the CSD statistics.
HCT (A) (B)
Scheme 8.3. Moieties used during CSD searches for HCT.
The CSD statistics reveal functionalities such as amides (71%), Narom (65%) and carboxylates
(50%) showcase higher precedence of occurrence, thereby showcasing there suitability for crystal
form synthesis. The first two are widely studied synthons, but the underexplored carboxylate
functional group have been studied by Zaworotko et al with 2-aminopyridiniumi and weakly acidic
hydroxyl moieties and it is seen that 2-aminopyridinium-carboxylate supramolecular
heterosynthon 62 occurs at 97% and weakly acid hydroxyl-carboxylate supramolecular
heterosynthon 38 occurs at 56%, showcasing that carboxylate moieties are versatile cocrystal
forming group which is still not explored to a great extent. Here HCT has been cocrystallized with
NAM, NAC and DMG and described herein. The cocrystal of HCT with isonicotinamide (INM)
is published elsewhere but included in here for screening studies.
SNH
NH
O O
Cl
SO O
NH2
SO
O
R
N
R
H
Ar NH
R
+
Page 219
199
Table 8.7. Possible supramolecular heterosynthons for HCT with other functionalities
Page 220
200
Table 8.8: CSD statistics of supramolecular synthons in HCT with different functionalities.
Supramolecular synthon Total Hits Percentage occurance of
synthons
Sulfonamide and carboxylic
acid
132 III=39 (30%),
VI =4 (3%),
IX=10 (8%)
Sulfonamide and
carboxylate
2 VIII=1 (50%)
Sulfonamide and amide 17 II=12 (71%),
V=12 (71%)
Sulfonamide and phenol 60 I=9 (15%),
IV=16 (27%)
Sulfonamide and N arom 104 VII=68 (65%)
2 o amine and amide 100 XII=26 (26%)
2 o amine and carboxylate 70 XI=17 (24%)
2o amine and N arom 1070 X=298 (28%)
Table 8.9: Crystallographic data and structure refinement parameters for the cocrystals.
HCTNAM HCTNAC HCTDMG
Formula C13H14ClN5O5S2 C13H13ClN4O6S2
MW 419.86 420.84
Crystal system Orthorhombic Orthorhombic Triclinic
Space group P212121 P212121 P-1
a (Å) 7.6392 (2) 7.3412 (3) 10.3649 (7)
b (Å) 13.2595 (4) 12.9934 (6) 10.7143 (8)
c (Å) 16.1215 (5) 16.1869 (7) 11.5908 (8)
(deg) 90 90 78.513 (4)
(deg) 90 90 68.481 (4)
(deg) 90 90 67.970 (4)
V /Å3 1632.98 (8) 1544.02 (12) 1107.21
Page 221
201
Table 8.9 (Continued)
HCTNAM HCTNAC HCTDMG
Dc/g cm-3 1.708 1.810
Z 4 4
2 range 4.32 to 67.92 4.36 to 67.14
Nref./Npara. 2871 / 245 2629 / 229
T /K 100 (2) 100 (2)
R1 [I>2sigma(I)] 0.0283 0.0514
wR2 0.0682 0.1160
GOF 1.051 0.972
Abs coef. 4.836 5.148
HCTNAM: HCTNAM crystallizes in P2121. Each asymmetric unit consists of one HCT and one
NAM molecule. The carbonyl moiety of the amide group in NAM molecule hydrogen bonds with
the sulfonamide moiety of a HCT molecule (O···N, 3.041 (3) Å) as depicted in Figure 8.4. The
NAM molecules are involved in hydrogen bonding in a head-to-tail fashion, giving rise to the
formation of parallel tapes of NAM (N···Narom: 2.873 (3) Å). Also, HCTNAM forms ribbons that
interacts with other ribbons above and below the plane, via N···O (2.901 (3) Å) hydrogen bonding.
The HCT molecules in one tape interacts with other HCT molecules in the adjacent tapes via N-
H···S=O interactions (2.901 Å). The overall hydrogen bonding is depicted in Figure 8.22.
Page 222
202
(a)
(b)
Figure 8.22. (a) Intermolecular hydrogen bonds in HCTNAM (b) Overall H-bonding in
HCTNAM.
HCTNAC: HCTNAC crystallizes in P2121. Each asymmetric unit consists of one HCT and one
NAC molecule. The NAC molecules exist in their zwitterionic form with C-O bonds (1.252 and
1.261 Å). The NAC molecules form head-to-tail chains via O···Narom hydrogen bonds 2.639 (2) Å)
. The HCT molecules form linear tapes adjacent to the NAC chains which are H-bonded to each
other via charge assisted O···N bonds (2.943 (2) Å) as illustrated in Figure 8.23 (a). Each tape
interacts with HCT molecules on either sides via N-H···S=O interactions (2.921 Å) as presented
in Figure 23 (b). The H-bonding in HCTNAC resembles to that of HCTNAM. Figure 8.23 (c)
represents the overall hydrogen bonding as seen in HCTNAC which shows the formation of
corrugated tapes , sustained by π- π stacking.
Page 223
203
(a)
(b)
(c )
Figure 8.23 (a) Intramolecular hydrogen bonding in the tape formed in HCTNAC. (b)
Lateral interactions of HCT molecules on HCTNAC (c). Overall hydrogen bonding as seen
in HCTNAC which shows the formation of corrugated tapes.
Page 224
204
HCTDMG: HCT and DMG crystallizes in P-1. Each asymmetric unit consists of with two DMG
molecules and one HCT molecule. In this crystal, two neighboring HCT molecules do not interact
with each other directly instead the carboxylate moiety of a DMG molecule connects HCT
molecules via N-H···COO- (N···O : 2.860 Å) as illustrated in Figure 8.24 (a). Two tapes as seen
above are connected to each other via bifurcated H-bonds formed by the carboxylate moiety in the
first layer with the 1o amine, N···O :2.894 Å and the other with the 2o sulfonamide group N···O
:2.827 Å present in the second layer. Similarly, the carboxylate of the DMG molecule in the second
layer forms bifurcated H-bonds with HCT present in the first layer. However, the DMG molecules
also form a dimer which connects the HCT molecules in one tape and to another DMG molecule
present in the adjacent tape , N-H···O- ( 2.761 Å) as shown in Figure 8.24(b).
8.3.4. Mechanochemistry. The results for the screening experiments have been summarized in
Table 14. Both LAG and dry/neat grinding were attempted on all the cocrystals. The solvents used
include ethanol, water and DMF. Previously, DMF was found to be solvent of choice for LAG as
it afforded the maximum number of crystal forms. The observations of the grinding experiments
have been discussed in the following paragraphs.
Page 225
205
(a)
(b)
Figure 8.24. (a) Hydrogen bonding between HCT and DMG in HCTDMG. (b) Overall H-
bonding in HCTDMG. HCT molecules are colored in green, while two independent DMG
molecules are colored in magenta and red.
Page 226
206
Table 8.10. Table showing the comparison of the screening techniques.
COCRYSTAL SCREENING METHODOLOGY
COCRYSTAL GRIND SLURRY
SLOW
EVAPORATION WATER DMF EtOH DRY WATER
ELANAM
ELAINM
ELACAF
ELATHP
ELASAR
ELADMP
ELACAP
COUNAM * * *
COUINM-I
COUCAF * * *
COUTBR.2H2O *
COUTHP
COUINZ *
COUURE *
HCTNAM
HCTINM * *
HCTDMG * * * *
HCTNAC *
CFANAM *
CFAINM * * * *
CFAINZ *
Page 227
207
Table 8.10. (Continued)
GALCAF *
GALTBR
GALNAM
GALINM *
GALINA
GALGAH
GALDMP
GALINZ
GALADN
GALURE *
FERNAM
FERINM
FERTBR
FERCAF *
FERGAH *
FERURE *
Total conversion achieved No conversion Partial conversion achieved
Gallic acid crystal forms were successfully reproduced via LAG in all the three solvents. In case
of dry grinding other than GALADN and GALURE, where partial conversion of the crystal form
was observed none of the other crystal forms could be formed via grinding. In case of ferulic acid,
Page 228
208
all the crystal forms successfully formed by LAG, whereas neat grinding could not afford all the
forms other than in FERCAF, FERGAH and FERURE.
In the case of caffeic acid, other than CFAINZ, the only crystal form amongst all others where
dry grinding worked, grinding overall didn’t look like the best method of synthesis.
In case of coumaric acid, dry grinding did not work out for any crystal form. Partial conversion
was observed in case of COUCAF,COUINZ and COUURE. Some crystal forms were formed
via LAG.
And finally, ellagic acid crystal forms could not be produced by LAG or dry grinding. And in case
of the hydrochlorothiazide crystal forms, HCTNAM could not be made by either LAG or dry
grind. And for HCTDMG, total conversion was not observed with any solvent.
Overall, out of the thirty-eight crystal forms studied herein, dry grinding was successful in
formation of only two of them. Overall it was seen that LAG was more effective in forming the
crystal forms as compared to dry grinding. This can be understood from the fact that the solvent
plays a vital role in the kinetics of the reaction as well as formation of intermediate phases and or
the dissolution of the cocrystal components to aid in crystal form formation. 18(a) Twenty-five
crystal forms were formed by using DMF as a solvent which was higher than what water (twenty
forms) or ethanol (twenty-two) had achieved.
The results of our grindings can also be corroborated to the findings of Jones et al’s 23, wherein,
upon investigation of the effect of solubility on LAG and sonic slurry, it was understood that
solubility of the cocrystal components may have an impact on the final crystal form formation.
The equilibrium for crystal form formation for incongruently soluble components can be properly
Page 229
209
achieved if both the components remain saturated. Any change to this system results in formation
of either the cocrystal and the deposition of the low soluble component or no cocrystal at all.
In this case the COI’s belong to a wide range of solubility : very slightly soluble; coumaric acid
, hydrochlorothiazide, ferulic acid and caffeic acid ~ 0.7 mg/mL. ; practically insoluble ; ellagic
acid and slightly soluble in case of gallic acid~ 11mg/mL in water. Most of their solubility
improves but to a slight extent in organic solvents. Also the cocrystal formers in this case are in
the fairly soluble, freely soluble or soluble categories in water 42. But the crystal forms could not
be successfully made via grinding. One of the reasons could be that the more soluble components
may not be entirely saturated in the solvent and hence the crystal form conversion does not occur.
It can also be postulated that the very high difference in solubilities , result in the incongruency
thereby not allowing reaction equilibrium to set in which might mean that the experiment might
have required more time than was given.
In conclusion, from the results, it is clearly understood that DMF still remains to be the solvent of
choice for grinding which means that the individual components must be able to attain saturation
in the solvent due to congruencies in solubilities of the components by DMF successfully lowering
the solubility difference between them to an extent that the conversion to the crystal forms occurs
successfully .
8.3.5. Trends amongst Cocrystal formers for grinding experiments.
It has been observed that caffeine cocrystals with the COI’s were not formed via grinding in almost
all the cases except in case of ferulic acid. This was puzzling considering that the solubility of the
phenolic acids are almost in the same order and difference was still observed. Also it has been
Page 230
210
observed that nicotinamide which forms cocrystal with all our MOI’s, does not show formation in
any case via dry grinding. Also, Other than gallic and ferulic acid, nicotinamide cocrystals with
other MOI’s do not form cocrystals via LAG too. In some cases, partial conversion is observed.
Considering the variability in the results, we analyzed the crystal structures of the crystal forms.
Which resulted in nothing evident. On looking into the synthons, it was found that as principally
hypothesized, the crystal forms do form the necessary synthons. COOH··· N arom heterosynthon
predominantly as compared to the OH··· N arom heterosynthons. On studying the melting points of
the crystal forms with the analogous formers, it is observed that in all cases, either the melting
point of the crystal form was lower or in between the either cocrystal formers, which did not
suggest anything significant , thereby not leading us into any new trends.
8.3.6. Slurry experiments.
For the slurry experiments, as mentioned before, we employed a couple of variations in our
standard experimental protocol to ensure that all the cocrystals could be formed by this method.
As observed most of the cocrystals could be reproduced via the slurry method in water in 24 hours
of experimentation. In all cases, both the components were in saturation in water. But the
hydrochlorothiazide and ellagic acid cocrystals could not be reproduced via slurrying in 24 hours.
In case of all these cocrystals we attempted to try the slurries at various concentrations for various
amounts of time. But the crystal forms could not be reproduced. Some experiments as in case of
ELASAR the experiments were done for even four weeks with no result. Invariably, some other
factors were varied to achieve nucleation and finally cocrystallization in slurry. As seen from
literature that slurry techniques in general can be affected by temperature change. 31 Thus these
Page 231
211
experiments were attempted at elevated temperatures of 75 and 85 °C. It was seen that the
hydrochlorothiazide cocrystals on exposure to 75 ° C converted rapidly to the cocrystal and the
ellagic acid cocrystals were formed at 85 °C. This promotes the idea that even when the two
components of variable solubilities are saturated in the solution, due to factors such as relative
low solubility of one component, other factors may be required to initiate the process of cocrystal
formation. In this case it was seen that varying the temperature for the non forming crystal forms
was enough to initiate the nucleation and finally form a stable crystal form in equilibrium state.
The same could be extended for the grinding experiments. All the cocrystals could hence be made
from the slurry technique and even with slight modifications in the procedure, successful crystal
form formation ensures and thus verifies the versatility of this technique in not only cocrystal
screening procedure but also in future scale-up experiments.
In conclusion, it was understood that saturation is necessary for cocrystal formation, and also that
even if not in stoichiometric amounts but the amount of cocrystal components in solution should
be in order, to help reach the critical activity value which allows for cocrystal formation. And
finally it is seen that temperature can play a vital role in this technique. Via our experiments,
water’s versatility as a solvent for this procedure, has been established and it has been shown that
even within a wide range of solubility, water slurry can be deemed to be useful. This showcases
the practicality that can be achieved for large scale procedures with minimal cost of production
considering that water is indeed cheap, easily available and versatile.
Page 232
212
8.4. Conclusion.
From the above seen screening experiments of thirty eight crystal forms via the slurry, solution
and grinding techniques it is definite that solvent evaporation still remains the technique of choice
for all the crystal forms even though the method has its problems in relation to the various
incongruencies in terms of solubility of components in solvents. But formation of good crystals
are usually done via this method and herein too this method was suitably used to produce all our
crystal forms. In case of grinding though, DMF still remains our solvent of choice considering that
formed the most number of cocrystals. LAG is a better alternative to the dry grinding method and
well suited for screening. And in case of aqueous slurry we have established that it is indeed a
versatile method and can be used along with subtle changes such as temperature to form cocrystals
which will help in lowering production costs for scale up purposes.
Acknowledgements. I would like to acknowledge and thank Dr. Padmini Kavuru, Dr. Heather
Clarke and Dr.Tien Tong for their valuable combined contributions for this work during their Ph.D.
dissertations, which has been incorporated herein.
8.5. References
(1) Pepinsky, R. Phys. Rev. 1955, 100, 971.
(2) (a) Schmidt, G. M. J. Pure Appl. Chem. 1971, 27, 647-678.
(3) (a) Etter, M. C. J. Am. Chem. Soc. 1982, 104, 1095-1096.(b) Desiraju, G. R. Crystal
Engineering: The Design of Organic Solids; Elsevier: Amsterdam, 1989.
(4) (a) Desiraju, G. R. Angew. Chem., Int. Ed. Engl. 1995, 34, 2311.
Page 233
213
(5) Allen, L. V.; Popovich, N. G.; Ansel, H. C. Ansel’s Pharmaceutical Dosage Forms and
Drug Delivery Systems, Lippincott Williams and Wilkins: New York, 2005.
(6) (a) Stahl, P. H.; Wermuth, C. G. Handbook of Pharmaceutical Salts: Properties, Selection,
and Use. Weily-VCH: Zurich, 1-7, 2002. (b) Gould, P. J. Int. J. Pharm. 1986, 33, 201-217.
(c) Brittain, H. G. Polymorphism in Pharmaceutical Solids. Marcel Dekker Inc. 2002. (d)
Berge, S. M.; Bighley, L. D.; Monkhouse, D. C. J. Pharm. Sci. 1977, 66, 1-19.
(7) Khankari, R.K.; Grant, D.J. W. Thermochi Acta. 1995, 248, 61.
(8) (a) Etter, M. C. J. Phys. Chem. 1991, 95, 4601-4610 (b) Bis, J. A.; Vishweshwar, P.;
Weyna, D.; Zaworotko, M. J. Molecular Pharmaceutics. 2007, 4, 401-416. (c) Shattock, T.
R.; Arora, K. K.; Vishweshwar, P.; Zaworotko. M. J. Cryst. Growth Des. 2008, 8, 4533-
4545. (d) Aakeroy C.B.; Salmon D.J. Cryst Eng Comm. 2005, 72, 439–448. (d) Zaworotko,
M. J. Cryst. Growth Des. 2007, 7, 4-9. (e) Friscic, T; Jones, W. J. of Pharmacology &
Pharmacy. 2010, 62, 1547-1559.
(9) (a) Vishweshwar, P.; McMahon, J. A.; Bis, J. A.; Zaworotko, M. J. J. Pharm. Sci. 2006,
95, 499-516. (b) Bond, A. S. Cryst. Eng. Commun. 2007, 9, 33-834. (c) Dunitz, J. D. Cryst
Eng Comm 2003, 5, 506. (d) Meanwell, N. A. Ann. Rep. Med. Chem. 2008, 43, 373-404
(e) Zaworotko, M.; Arora, K. Pharmaceutical co-crystals : A new opportunity in
pharmaceutical sciences for a long-known but little studied class of compounds. In
Polymorphism in Pharmaceutical Solids, 2nd ed.; Brittain, H.G.,Ed.; Informa Healthcare:
London 2009.
Page 234
214
(10) (a) Hickey, M. B.; Peterson, M. L.; Scoppettuolo, L. A.; Morrisette, S. L.; Vetter,
A.; Guzman, H.; Remenar, J. F.; Zhang, Z.; Tawa, M. D.; Haley, S.; Zaworotko, M. J.;
Almarsson, Ö. Eur. J. Pharm. Biopharm. 2007, 67, 112. (b) Schultheiss, N; Newman, A.
Cryst.Growth Des. 2009, 9, 2950–2967 (c) ) Blagden, N.; de Matas, M.; Gavan, P. T.;
York, P. Adv. Drug Del. Rev. 2007, 59, 617-630. (C) Peterson, M.L.; Hickey, M. B
Zaworotko, M. J.; Almarsson, Ö. J Pharm Pharmaceut Sci. 2006 , 9 , 317-326 (d) Trask,
A. V. Molecular Pharmaceutics. 2007, 4, 301–309. (e) Morissette, S. L.; Almarsson, Ö.;
Peterson, M. L.; Remenar, J. F.; Read, M. J.; Lemmo, A. V.; Ellis, S.; Cima, M. J.; Gardner,
C. R. Adv. Drug Del. Rev. 2004, 56, 275-300.
(11) (a) McNamara, D. P.; Childs, S. L.; Giordano, J.; Iarriccio, A.; Cassidy, J.; Shet,
M. S.; Mannion, R.; O’Donnell, E.; Park, A. Pharm. Res. 2006, 23, 1888–1897. (b) Childs,
S.L.; Chyall, L.J.; Dunlap, J.T.; Smolenskaya, V.N.; Stahly, B.C.; Stahly, G.P. J Am Chem
Soc, 2004, 126, 13335-13342. (c) Bak, A.; Gore, A.; Yanez, E.; Stanton, M. Tufekcic, S.;
Syed, R.; Akrami, A.; Rose, M.; Surapaneni, S.; Bostick, T; King, A.; Neervannan, S.;
Ostovic, D.; Koparkar, A. J Pharm Sci, 2008 , 97, 3942-3956. (d) ) Remenar, J. F.;
Peterson, M.L.; Stephens, P.W.; Zhang, Z. ;Zimenkov, Y.; Hickey, M. B. Mol Pharm,
(12) 2007, 4, 386-400. (e) Cheney, M. L.; Shan, N. ; Healey, E. R.; Hanna, M.; Wojitas,
L.; Zaworotko, M. J ; Sava,V; Song ,S. ; Ramos, J.R.S. Cryst. Growth Des. 2010, 10, 394-
(13) 405. (f) Junk, M-S.; Kim, J-S.; Kim, M-S.; Alhalaweh, A.; Cho, W.; Hwang, S-H.;
Velaga, S.P. Journal of Pharmacy and Pharmacology. 2010, 62, 1560-1568.
(14) Desiraju G.R.; Vittal, J.J.; Ramanan, A. Crystal Engineering: A Textbook. World
Scientific Publishing Company, 2012.
(15) Aakeroy, C. B.; Hussain, I.; Desper, J. Cryst. Growth Des. 2006, 6, 474-480.
Page 235
215
(16) Aakeroy , C.B.; Desper, J.; Leonard, B.; Urbina, J.F. Cryst. Growth Des. 2005, 5,
865-873.
(17) (a) Allen, F. H.; Kennard, O. Chem. Des. Automat. News. 1993, 8, 31–37. (b)
Allen, F. H. Acta Crystallogr. 2002, B58, 380–388.
(18) (a) Almarsson, Ö.; Zaworotko, M. J. Chem. Commun. 2004, 1889. (b) Shan, N.;
Zaworotko, M. J. Drug Disc. Today. 2008, 13, 440. (c) Walsh, R. D.; Bradner, M. W.;
Fleischman, S.; Morales, L. A.; Moulton, B.; Rodríguez-Hornedo, N.; Zaworotko, M. J.
(19) Chem. Commun. 2003, 186. (d) Stanton, M.K.; Tufekcic, S.; Morgan C.; Bak, A.;
Cryst. Growth Des. 2009, 9, 1344-1352. (e) Stanton, M.K.; Bak, A. Cryst. Growth Des.
2008, 8, 3856-3862. (f) Rodríguez-Spong, B.; Price, C. P.; Jayasankar, A.; Matzger, A. J.;
Rodríguez-Hornedo, N. Adv. Drug Delivery Rev. 2004, 56, 241-74.
(20) Wöhler F. Justus Liebigs Ann. Chem. 1844, 51, 153.
(21) (a) Shan, N.; Toda, F.; Jones, W. Chem. Comm. 2002, 2372-2373. (b) Trask, A. V.;
Jones, W. Top. Curr. Chem. 2005, 254, 41-70.
(22) (a) Nehm, S. J.; Rodriguez-Spong, B.; Rodriguez-Hornedo, N. Cryst. Growth Des.
2006, 600, 6592 (b) Rodriguez-Hornedo, N.; Nehm, S. J.; Seefeldt, K. F.; Pagán-Torres,
Y.; Falkiewicz, C. J. Mol. Pharmaceutics 2006, 3, 362-367.
(23) Kelly, A.L.; Gough, T.; Dhumal, R.S.; Halsey, S.A.; Paradkar, A. International
Journal of Pharmaceutics. 2012, 426, 15- 20.
(24) Patil, A.O.; Curtin, D. Y.; Paul, I.C. J. Am. Chem. Soc. 1984, 106, 348-353.
(25) Etter,M.C.; Adsmond, D.A. Chem Commun. 1990, 589-591.
(26) Frisic, T.; Jones, W. Cryst. Growth Des. 2009, 3, 1621-1637.
Page 236
216
(27) (a) Cheney, M.L.;McManus, G.J.; Perman, J.A. Wang, Z.Q. Cryst. Growth Des.
2007, 4, 616-617. (b) Cheney, M.L.; Zaworotko, M.J. Beaton, S.; Singer, R.D. J. Chem.
Educ,2008, 85, 1649-1651.(c) Perman, J.A.; Dubois, K.; Nouar, F.; Zoccali, S. Wojitas, L.
; Eddaoudi, M.; Larsen, R.W.; Zaworotko, M.J. . Growth Des. 2009, 9, 5021-5023. (d)
Perman, J.A. ; Cairns, A.J. ; Wojitas, L. ; Eddaoudi, M.; Larsen, R.W.; Zaworotko, M.J.
Cryst.Eng.Comm. . 2011, 3, 3130-3133.
(28) Karki, S.; Friscic, T.; Jones, W.; Motherwell W.D.S. Mol. Pharmaceutics. 2007, 4,
347-354.
(29) (a) Rodríguez-Hornedo, N.; Lechuga-Ballesteros D.; Wu H. Int. J. Pharm. 1992,
85, 149–162. (b) Kolar, Z.I. ;Binsma , J. J. M.; Subotic , B. J. Cryst. Growth. 1992, 116
473–482. (c) Murphy, D.; Rodriguez-Cintrón, F.; Langevin, B.; Kelly R.C.; Rodriguez-
Hornedo, N. Int. J. Pharm, 2002, 246, 121–134. (D) Wang, Z. ; Wang, J.; Dang, L.D.;
Meijing,Z.; Ind. Eng. Chem.Res. 2007 , 46 , 1851 -1858. (e) Kee, N. C. S.; Arendt, P. D.;
Goh, L. M. Cryst. Eng. Comm, 2011, 13, 1197-1209.
(30) 27. (a) Vrcelj, R. M. ; Gallagher, H.G. ; Sherwood, J.N. J. Am. Chem. Soc..
2001, 123 , 2291-2295. (b) Davey, R.J.; Blagden, N.; Righini, S. J. Phy. Chem B , 2002,
106 ,1954-1959 (c) Yamanobe, M. ; Takiyama, H.; Matsuoka, M. J. Cryst. Growth. 2002,
237, 2221-2226 . (d) Mirmehrabi, M. ; Rohani, S.; Murthy, K.S.K. ; Radustus, B. Int. J.
Pharm. 2004. 282 , 73-85 . (e) Gong, Y. ; Collman, B. M.; Mehrens, S. M., Enxian L.;
Miller J. M., Blackburn, A.; Grant ,D. J.W. J.Pharm.Sci . 2008, 97, 2130-2144. (f)
Srinivasan, K. J. Cryst. Growth. 2008, 311, 156-162. (g) Rusin, M. ; Ewan, B.C.R. ; Ristic,
R.I. Cryst. Eng. Comm. 2013, 15, 2192-2196 . (h) Maher, A. ; Croker, D.M. ; Rasmuson,
A.C. ; Hodnett, B. K. Cryst. Growth Des. 2012, 12, 6151-6157.
Page 237
217
(31) 28. (a) ter Horst, Joop H.; Cains, Peter W. Cryst. Growth Des. 2008, 8, 2537-
2542. (b) Bucar, Dejan-Kresimir; Henry, Rodger F.; Lou, Xiaochun . (c) Croker, D.M. ;
Davey, R.J.; Rasmuson, A.C.; ; Seaton,C.C. Cryst. Eng. Comm. 2013, 15, 2044-2047. (d)
Zhang, S. ; Rasmuson, A.C. Cryst. Growth Des. 2013, 13, 1153-1161 (e ) Braga, D ;
Chelazzi, L ; Ciabatti, I ; Grepioni, F . New J. Chem. 2013 ,37 , 97-104 (f) Sanphui, P.
; Kumar, S.S. ; Nangia, A. Cryst. Growth Des. 2012, 9, 4588-4599. (g) Thakuria, R ;
Cherukuvada, S ; Nangia, A. Cryst. Growth Des. 2012, 12, 3944-3953.
(32) 29. a) Weyna, D.R. ; Cheney, M.L. ; Shan, N. ; Hanna, M. ; Zaworotko, M.J. ;
Sava, V. ;Song, S.J. ; Sanchez-Ramos, J.R.. Mol. Pharm. 2012, 9, 2094-2102. (b) Goud,
N.R. ; Gangavaram, S. ; Suresh, K. ; Pal, S. ; Manjunatha, S.G. ; Nambiar, S. ; Nangia,A.
J .Pharm.Sci . 2012, 101, 664-680. (c) Aitipamula,S. ; Wong, A.B.H. ; Chow, P.S. ;
Tan,R.B.H.Cryst.Eng.Comm. 2012,14,8193-8198.(d)Ueto,T. ; Takata, N. ; Muroyama, N.
; Nedu, A. ; Sasaki, A. ; Tanida, S. ; Terada, K. Cryst. Growth Des. 2012, 12, 485-494.(e)
Peterson,M.L., Stanton, M.K.. Kelly, R.C.; Staples, R.; Cheng, A. Cryst. Eng. Comm.
2011, 13, 1170-1180/ (f) Aher, S.; Dhumal,R.; Mahadik, K.; Paradkar, A. York, P.
Eur.J.Pharm.Sci. 2010, 41, 597-6012. (g) Bucar, D.K.;Henry,R.F. Duerst,R.W. Lou, X.C.;
McGillivray,L.R. Zhang, G.G.Z. J.Chem. Crystallogr. 2010, 40, 933-939. (h) Kojima,T.;
Tsutsumi,S.; Yamamoto,L. Ikeda,Y.Moriwaki,T. Int. J.Pharm. 2010,399, 52-59. (i)
Shiraki, K.;Takata,N.;Hayashi, Y. Tereda,K. Pharm Res. 2008, 11, 2581-2592. (j)
Takata,N.; Shiraki, K.;Takano, R.; Hayashi, Y. Cryst.Growth.Des. 2008, 8, 3032-3037.
(33) 30. Zhang, G. G. Z.; Henry, R. F.; Borchardt, T. B.; Lou, X. J. Pharm. Sci. 2007.
96 990995.
(34) 31. Ticehurst, M.D.; Storey, R.A.; Watt, C. Int.J.Pharm. 2002, 2471, 1-10.
Page 238
218
(35) Weyna, D.; Shattock, T. R.; Vishweshwar, P.; Zaworotko, M. J. Cryst. Growth Des.
2009, 9, 1106-1123.
(36) Cate, A. T. T.; Kooijman, H.; Spek, A. L.; Sijbesma, R. P.; Meijer, E. W. J. Am.
Chem. Soc. 2004, 126, 3801.
(37) McMahon, J. A.; Bis, J. A.; Vishweshwar, P.; Shattock, T. R.; McLaughlin, O. L.;
Zaworotko, M. J. Zeit. Kristallogr. 2005, 220, 340.
(38) (a) Shattock, T. R.; Arora, K. K.; Vishweshwar, P.; Zaworotko, M. J. Cryst. Growth
Des. 2008, 8, 4533 (b) Aakeröy, C. B.; Beatty, A. M.; Helfrich, B. A. J. Am. Chem. Soc.
2002, 124, 14425–14432. (h) Bhogala, B. R.; Vishweshwar, P.; Nangia, A. Cryst. Growth
Des. 2002, 2, 325–328.
(39) Aakeröy, C. B.; Beatty, A. M.; Helfrich, B. A.; Nieuwenhuyzen, M. Cryst. Growth
Des. 2003, 3, 159. (b) Aakeröy, C. B.; Beatty, A. M.; Helfrich, B. A. Angew. Chem. Int.
Ed. 2001, 40, 3240.
(40) (a) Bis, J.A.; Vishweshwar, P.; Weyna, D.; Zaworotko, M.J. Mol. Pharm., 2007, 4,
401-416 (b) Papaefstathiou, G.S.; MacGillivray, L.R. Org. Lett.,2001, 3, 3835−3838001).
(c) Vishweshwar, P.; Nangia, A.; Lynch, V.M. CrystEngComm, 2003, 5, 164-168.
(41) Kavuru, P.; Aboarayes, D.; Arora, K. K.; Clarke, H. D.; Kennedy, A.; Marshall, L.;
Ong, T.; Perman, J.; Pujari, T.; Wojtas, y.; Zaworotko, M. J. Cryst. Growth Des. 2010, 10,
3568.
(42) Generally Regarded As Safe,
http://www.accessdata.fda.gov/scripts/fcn/fcnNavigation.cfm?rpt=scogsListing
(43) Everything Added to Food Stuff in United States,
(44) http://www.accessdata.fda.gov/scripts/fcn/fcnNavigation.cfm?rpt=eafusListing.
Page 239
219
(45) Clarke, H.;, Arora,K.K .; Bass,H.; Kavuru,P.; Ong,T.T.; Pujari T.; Wojtas L.;
Zaworotko, M.J. Cryst. Growth Des. 2010, 10, 2152-2167.
(46) Amidon, G.L.; Lennernas, H.; Shah, V.P.; Crison, J.R. Pharm Res. 1995, 12, 413-
420.
(47) (a) Bruker-AXS (2001). SMART-V5.625. Data Collection Software. Madison,
Wisconsin, USA. (b) Bruker (2008). APEX2 (Version 2008.1-0). Madison, Wisconsin,
USA.
(48) Bruker-AXS (2008). SAINT-V7.51A. Data Reduction Software. Madison,
Wisconsin, USA.
(49) Sheldrick, G. M. SADABS. Program for Empirical Absorption Correction.
University of Gottingen, Germany, 1996.
(50) Sheldrick, G. M. SHELXTL, v. 6.10; Bruker-AXS Madison, Wisconsin, USA.
2000.
(51) Farrugia L. J. J. Appl. Cryst. 1999, 32, 837-838.
(52) (a) Dillard, C.J.; German, J.B. Journal of the Science of Food and Agriculture.
2000, 80, 1744-1756.(b) Goldberg, I. Functional Foods: Designer Foods, Pharmafoods,
Neutraceuticals . Aspen Publications: Gaithersburg, Maryland, 1999.(c) ) Brian Lockwood,
Pharmaceutical Press: London, UK, 2007
(53) (a) Brian Lockwood. Nutraceuticals. Pharmaceutical Press: London, UK, 2007.
(54) Han, X.; Shen, T.; Lou, H. Int. J. Mol. Sci. 2007, 8, 950.
(55) Shahidi, F.; Naczk, M. Food Phenolics: Sources, Chemistry, Effects and
Applications, Technomic Publishing Company Inc., Lancaster, PA, 1995.
Page 240
220
(56) (a) Mattila, P.; Hellstrom, J.; Torronen, R. J. Agric Food Chem, 2006, 54, 7193.
(b) Mattila, P., Hellstrom, J. J. Food Comp. Anal., 2007, 20, 152. (c) Kroon, P. A.;
Williamson, G. J. Sci. Food Agric., 1999, 79, 355.
(57) Graf, E. Rad. Biol. Med.; 1992, 13, 435.
(58) Elvira, G. M.; Chandra, S.; MarcoVinicio, R. M.; Wenyi, W. Food Chem. Toxicol.
2006, 44, 1191.
(59) Misao, U.; Hisashi, Y.; Yukiko, K.; Masanori, H.; Tomihiko, H.; Koyama, A.
AntiViral Res. 2007, 73, 85.
(60) Müller Kratz, J.; Andrighetti-Fröhner, C. R.; Kolling, D. J.; Leal, P. C.; Cirne-
Santos, C. C.; Yunes, R. A.; Nunes, R. J.; Trybala, E.; Bergström, T.; Frugulhetti5, I.;
Barardi, C. R. M,; Simões, C. M. O.; Mem Inst Oswaldo Cruz, 2008, 103, 437.
(61) Soffer, B.A.; Wright, J.T.; Pratt, J.H. ;Wiens, B.; Goldberg, A.I. ; Sweet, C.S.
Hypertension. 1995, 26, 112-117.
(62) (a) Corveleyn , S.; Remon, J.P. Int. J. Pharm. 1998. 166 , 65-74 . (b) (a) Corveleyn
, S.; Remon, J.P. Int. J. Pharm. 1998. 173 , 149-155 .
(63) Childs, S. L.; Hardcastle, K. I. Cryst.Growth Des. 2007, 7, 1291.
(64) Remenar, J. F.; Peterson, M.L.; Stephens, P.W.; Zhang, Z.; Zimenkov, Y.; Hickey,
M. B. Mol Pharmaceutics. 2007, 4 386.
(65) (a) Caira, M. R. J. Crystallogr. Spectrosc. Res. 1991, 21, 641-648. (b) Caira, M. R.
Page 241
221
(66) J. Crystallogr. Spectrosc. Res. 1992, 22, 193-200. (c) Caira, M. R. J. Chem.
Crystallogr. 1994, 24, 695-701. (d) Caira, M. R.; Nassimbeni, L. R.; Wildervanck, A. F.
J. Chem. Soc., Perkin Trans. 2. 1995, 2213-2216. (e) Caira, M. R.; Bettinetti, G.; Sorrenti,
M.; Catenacci.; L. J. Pharm. Sci. 2003, 92, 2164-2176. (f) Caira, M. R. Mol. Pharmaceutics.
2007, 4 (3), 310-316.
(67) Bis, J. A.; Zaworotko, M. J. Cryst. Growth Des. 2005, 5, 1169-1179.
(68) 63. (a) Goud, N. R. ; Babu, N. J. ; Nangia, A. Cryst. Growth Des. 2011, 11, 1930-
1939. (b) Adsmond, D.A.; Grant, D.J.W. J.Pharm.Sci. 2001, 90, 2058-2077. (c) Croker,
D. M.; Foreman, M.E. ; Hogan, B.N. Maguire, N.M. ; Elcoate, C.J. ; Hodnett, B. K;
Maguire, A. R; Rasmuson, A. C., Lawrence, S.E. Cryst. Growth Des. 2012, 12, 869-875.
(d) Lu, J. ; Wang, J. ; Li, Z.; Rohani, S.; Ching, C.B. J.Cryst. Growth. 2011, 335, 110-114
.
(69) Schultheiss, N.; Roe, M.; Boerrigter S.X.M. CrystEngComm. 2011, 13, 611-619.
Page 242
222
APPENDIX A: JOURNAL PERMISSIONS
ACS JOURNAL AUTHOR RIGHTS
ELSEVIER JOURNAL AUTHOR RIGHTS