APPLICATIONS OF NASTRAN IN GUST RESPONSE ANALYSIS AT NORTHROP Ashok K. Singh SUMMARY A comprehensive gust response analysis _has been performed on a complete model of an airplane using the NASTRAN aeroelastic package by the Advanced Structural Computer Methods (ASCM) group at Northrop. Earlier the same model was used to perform subsonic flutter analysis of the airpl_ne using the computer program. Both the random and discrete gust response analyses have been performed including the control system dynamics in the problem. On a large aircraft gust response analysis including the flexible modes of the vehicles is a major design task. On a light weight fighter aircraft the analysis is p _marily performed in order to study the ride quality and to provide the frequency of exceedance curves for the control surface hinge moments and some selected dynamic loads for static and fatigue analysis. INTRODUCTION The NASTRAN finite element program has been used at Northrop since 1972. The ASCM group has been actively evaluating and exercising the various NASTRAN dynamics analysis features and the aeroelastic package for several months. Integrated NASTRAN structural analysis combining static and dynamic analysis, e.g., flutter and gust, is the planned goal at Northrop. In order to achieve this end, a common structural model throughout an engineering project must be used. This practice is also expected to minimize the use of inconsistent struc- tural data and unnecessary data handling among the various engineering disci- plines. Symmetric response analysis is evaluated in two applications to the complete airplane aeroelastic model. The analyses are random response to atmospheric turbulence and transient response to a discrete gust. The structural and aero- dynamic models are the same as that used in the flutter analysis as presented in Reference i. The gust response analysis by NASTRAN can only be performed with the aero- dynmnic forces computed by the Doublet-Lattice Method. Supersonic gust response capability has not been provided. Spacewise variation of the gust velocity is not allowed in the present NASTRAN formulation but should be considered for future development. The gust velocity normal to the free stream velocity is taken as an additional source of downwash in the computation of the aerodynamic forces. The standard forms of power spectrum of the atmospheric turbulence available in NASTRAN are Von Karman and Dryden. However, provision is made to use any other form of spectrum by the means of tabular input. In the case of the random gust analysis, the frequency response, power spectral density, root 165 brought to you by CORE View metadata, citation and similar papers at core.ac.uk provided by NASA Technical Reports Server
Transcript
APPLICATIONS OF NASTRAN IN GUST RESPONSE ANALYSIS
AT NORTHROP
Ashok K. Singh
SUMMARY
A comprehensive gust response analysis _has been performed on a complete
model of an airplane using the NASTRAN aeroelastic package by the Advanced
Structural Computer Methods (ASCM) group at Northrop. Earlier the same model
was used to perform subsonic flutter analysis of the airpl_ne using the
computer program. Both the random and discrete gust response analyses have
been performed including the control system dynamics in the problem. On a
large aircraft gust response analysis including the flexible modes of the
vehicles is a major design task. On a light weight fighter aircraft the
analysis is p _marily performed in order to study the ride quality and to
provide the frequency of exceedance curves for the control surface hingemoments and some selected dynamic loads for static and fatigue analysis.
INTRODUCTION
The NASTRAN finite element program has been used at Northrop since 1972.
The ASCM group has been actively evaluating and exercising the various NASTRAN
dynamics analysis features and the aeroelastic package for several months.
Integrated NASTRAN structural analysis combining static and dynamic analysis,
e.g., flutter and gust, is the planned goal at Northrop. In order to achieve
this end, a common structural model throughout an engineering project must be
used. This practice is also expected to minimize the use of inconsistent struc-
tural data and unnecessary data handling among the various engineering disci-plines.
Symmetric response analysis is evaluated in two applications to the complete
airplane aeroelastic model. The analyses are random response to atmosphericturbulence and transient response to a discrete gust. The structural and aero-
dynamic models are the same as that used in the flutter analysis as presentedin Reference i.
The gust response analysis by NASTRAN can only be performed with the aero-
dynmnic forces computed by the Doublet-Lattice Method. Supersonic gust response
capability has not been provided. Spacewise variation of the gust velocity isnot allowed in the present NASTRAN formulation but should be considered for
future development. The gust velocity normal to the free stream velocity is
taken as an additional source of downwash in the computation of the aerodynamic
forces. The standard forms of power spectrum of the atmospheric turbulence
available in NASTRAN are Von Karman and Dryden. However, provision is made to
use any other form of spectrum by the means of tabular input. In the case of
the random gust analysis, the frequency response, power spectral density, root
165
https://ntrs.nasa.gov/search.jsp?R=19800016165 2020-03-21T19:00:46+00:00Zbrought to you by COREView metadata, citation and similar papers at core.ac.uk
mean square value and the frequency of zero crossing, N , of the response areooutput. A post processor can be easily written in order to compute the A and
frequency of exceedance N(y) of the response. A procedure of weighting the
aerodynamic forces _o match measured data on each panel must be developed.
The discrete gust analysis is performed by the Fourier method. First, the
time varying loads are transformed into the frequency domain by Fourier series
or Fourier integrals. Second, the responses computed in the frequency domainare converted into the time domain by inverse Feurier transform methods_Three approximate methods are available in order to evaluate the inverse.
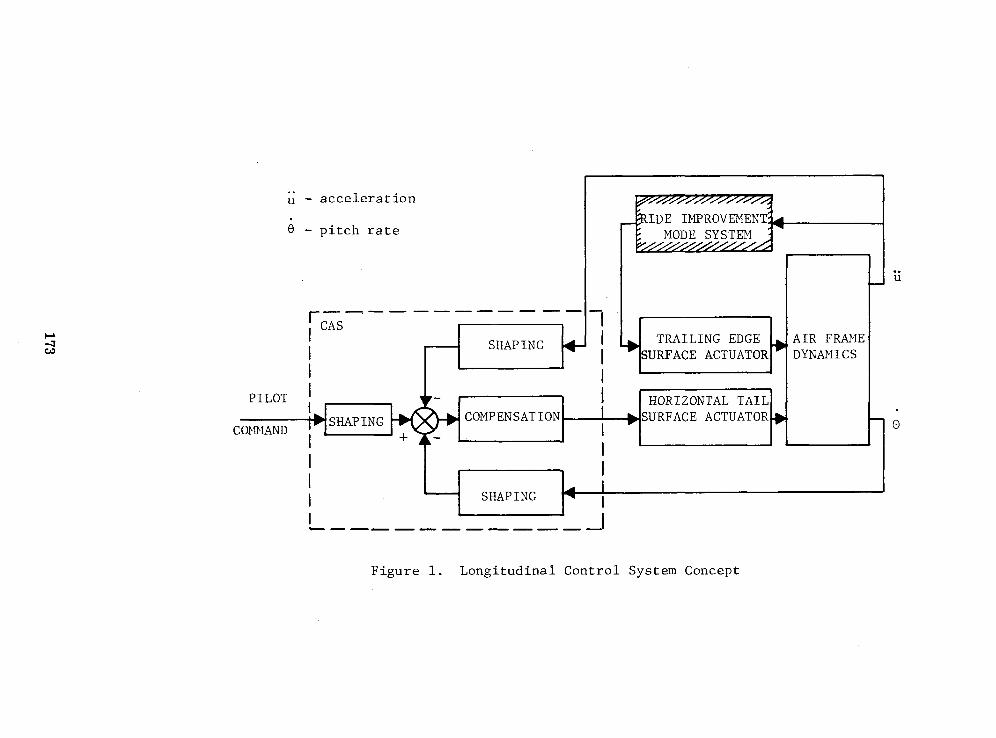
A flight control system is incorporated in the NASTRAN model that utilizes
a Ride Improvement Mode System (RIMS) and pitch Control Augmentation System
(CAS). A dedicated accelerometer and pitch rate gyro near the pilot stationare chosen to measure acceleration and pitch rate which are fedback as the
control signal in order to actuate the flaperon and stabilator (Figure i).
To obtain satisfactory ride qualities during low altitude high speed
flight, extensive effort has been expended in the development of a ride improve-
ment system. The system tries to maintain a constant value of lift for changes
in angle-of-attack due to turbulence. This is performed by sensing the load
factor at the pilot station and using that as a control signal to command thehigh rate flaperons, so that the flaperons can minimize the turb_ulence-induced
incremental load factor at the pilot station.
Operating in parallel with the ride mode is the CAS which uses a blend of
load factor and pitch rate to maintain aircraft stability while trying tominimize uncommanded pitch rate and load factor.
With the advent of the control donfigured vehicle, today's control systemengineer must have a thorough knowledge of aeroservoelastic behavior of the
flying machine. The design of the filters in the feedback loop cannot becompleted without the knowledge of elastic and aeroelastic characteristics of
the modern aircaraft. A new engineering discipline of aeroservoelasticity
is emerging which will play a prominent role in the early design phases of anintegrated control system.
SYMBOLS
A Ratio of root-mean-square value of load to root-mean-squarevalue of gust velocity
bI b2 Intensity parameters in the expression for probability of oa
Hja(_ ) Frequency response due to the gust excitation
N Average number of zero crossings with positive slope,oper unit time
166
N(y) Number of exceedances of the indicated value of y per unit time
PI,P2 Fractions of total flight time in non-storm and storm turbulencerespectively
Sa(_ ) Power spectral density of gust velocity
Sj(_) Power spectral density of response
Or Root-mean-square value of response quantity
oa Root-mean-square value of gust velocity
Circular frequency
Cutoff frequency beyond which aeroelastic responses arec no longer significant in turbulence
NASTRAN GUST RESPONSE ANALYSIS
The gust response analysis is performed on a complete aircraft in thefollowing steps:
o Random response to Von Karman gust spectrum withoutcontrol system interact$on
o Random response to Von Karman gust spectrum withcontrol system interaction
o Transient response to a discrete gust with control systeminteraction
RANDOM RESPONSE ANALYSIS
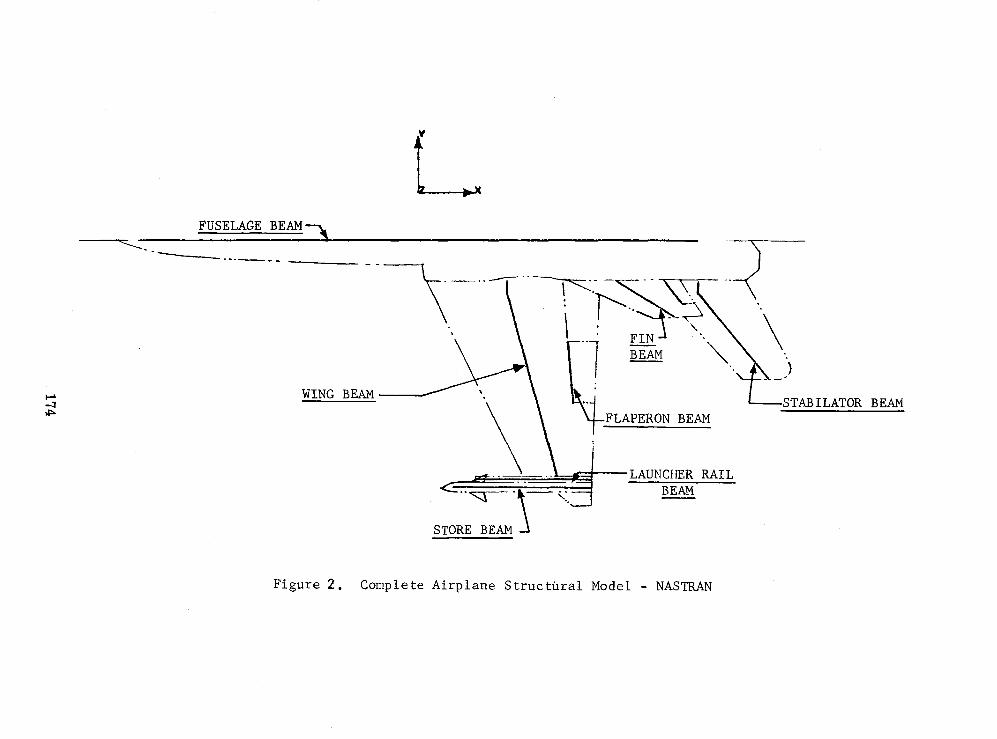
A NASTRAN beam element model of a complete airplane was used to perform
the gust response analysis. The airplane with a tip store, launcher rail,wing, flaperon, fuselage, fin with rudder and horizontal stabilizer was modeled
as finite beam elements as shown in Figure 2. The store and launcher railassembly was tied to the wing tip by rigid elements which may be modified topossess elastic properties. The wing root and fin root flexibilities were
modeled by lumped springs, which may be made more complex as the finite elementmodel of the airplane is developed. The horizontal stabilizer root stiffness
is a general dement accounting for the spindle and the actuator assembly
flexibilities. Mass properties were input on lumped mass element cards.
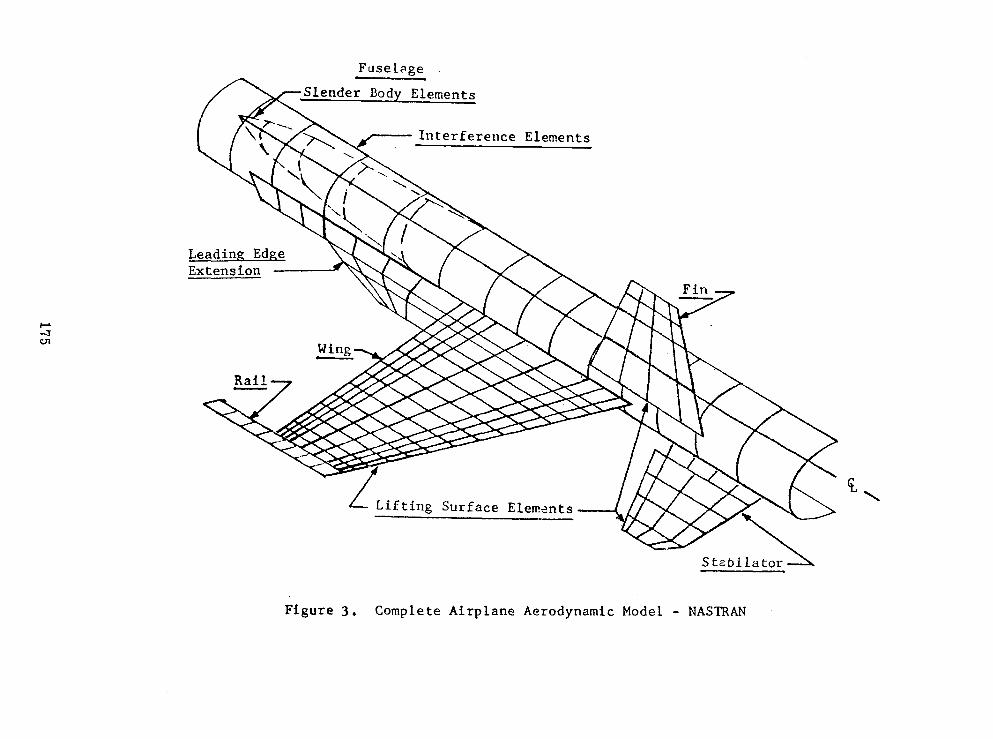
A doublet-lattice finite element program was used to represent the aero-
dynamics of the vehicle as shown in Figure 3. The wing with the launcher rail,
fin with the rudder and horizontal stabilizer are represented as lifting sur-
face elements. The fuselage is represented as slender body and interference
elements. In the present analysis, the aerodynamic induction effect among allthe elements is considered. The wing, horizontal stabilizer and fin are
167
divided into 145, 20 and 20 micro lifting surface elements, respectively. The
fuselage is divided into 14 slender body elements. There are ii interference
elements on the fuselage.
A complicated network of linear spline funct$o_s is used to relate the
modal deflections to each of the aerodynamic element deflections. Five
distinct splines were used for the wing, rail and flaperon panels, two for the
horizontal stabilizer, three for the fin with rudder, two for the fuselageand one for the store.
The flight control system is represented in the model as 9 extra points
and 2 scalar points with their coefficients in the mass, damping and stiffness
matrices in order to represent the filters in the feedback loop. The twoscalar points are the relative rotations of the flaperon and the stabilator.
Constraint forces in the equations of motion due to the control laws are
introduced by the Lagrange multiplier technique. An accelerometer and a
pitch rate gyro are located near the pilot station in order to measure the
airplane responses. The measured data are fedback in order to activate RIMS
and CAS laws, which control the aircraft response.
The unsteady aerodynamics for Mach0_8 and sea level is generated for eightreduced frequencies using the Doublet-Lattice Method available in NASTRAN.
Symmetric flight condition is considered in the analysis. Three symmetric
rigid body modes and twenty-two elastic modes are selected to generalize the
aerodynamic forces. Only the modal method of aeroelastic response computationis available in the program. Generalized aerodynamic forces at other inter-
mediate reduced frequencies are computed by means of a linear spline interpo-lation routine.
The gust response analysis of a light weight fighter considered in this
problem is primarily performed in order to study the ride quality of the vehicle.In,order to increase the survivability of modern fighter aircraft, new emphasis
is being given to the capability of low-altitude high-speed penetration. For
such an aircraft, the low-wing loading/high-lift curve slope which maximizes
turn rate capability and maneuverability essential for survival in air combat
also tends to deteriorate the ride quality during high-speed penetration, This
can lead to reduced mission success in attacking heavily defended groundtargets, or in the worst case even mission failure.
For the evaluation of ride quality through turbulence, A is used. A is
the root-mean-square (rms) of the response divided by the rms gust level in
feet per second (fps) as defined in Equation i.
_:c Hj a(w) 2 Sa(00)dl½ Or= . ....... (i)
I f JSa(W)d_ %
168
To simulate turbulence the Gaussian Von Karman model was used with an rmsgust intensity level of one fps (References 2 & 3)_ The scale of turbulence
used in the analysis is 500 feet. In order to compute the A of the pilotacceleration response a cutoff frequency of 30 Hz was used.
The characteristic frequency, N is the radius of gyration of theO'
response power-spectral density curve with respect to zero frequency (E_qua-tion 2),
(foC_(w/2_)eSj(_)d_)Ne =
NASTRAN computes o and N by the solutio_ of the airplane equations ofr omotion. A post processor may be written in order to compute A and load
exceedances N(y). Frequency of exceedance, N(y), is the number of exceedances
of y per unit time or distance flown, where y is any response quantity (Equa-tion 3).
NyNI lexplYl IY)Io " _ + Pe exp - _-_ (3)
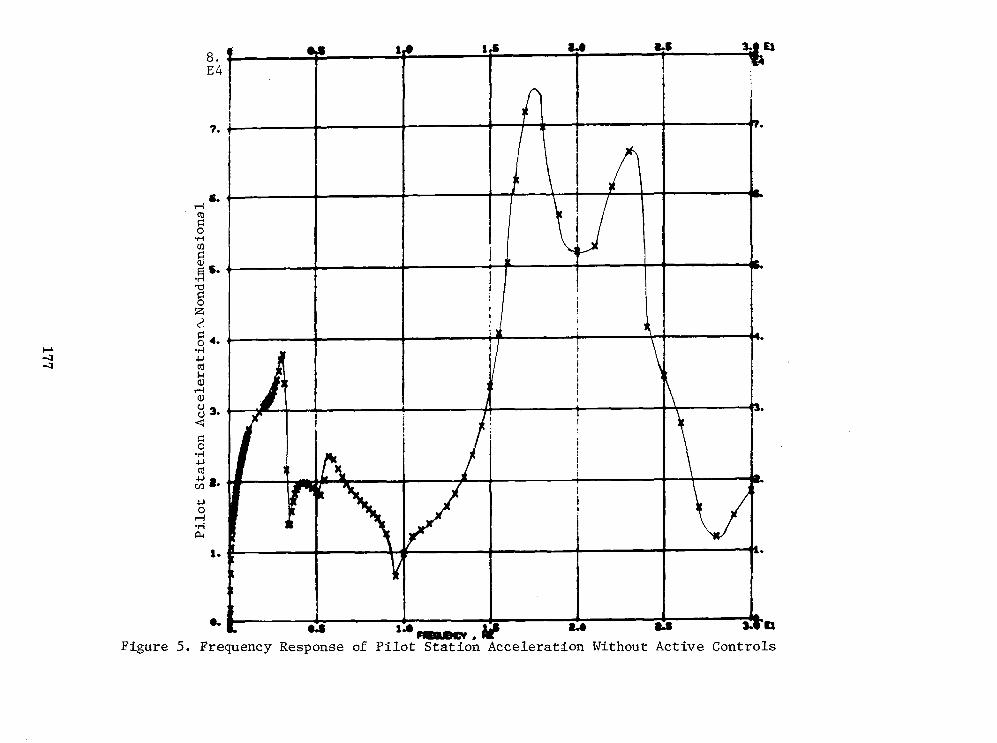
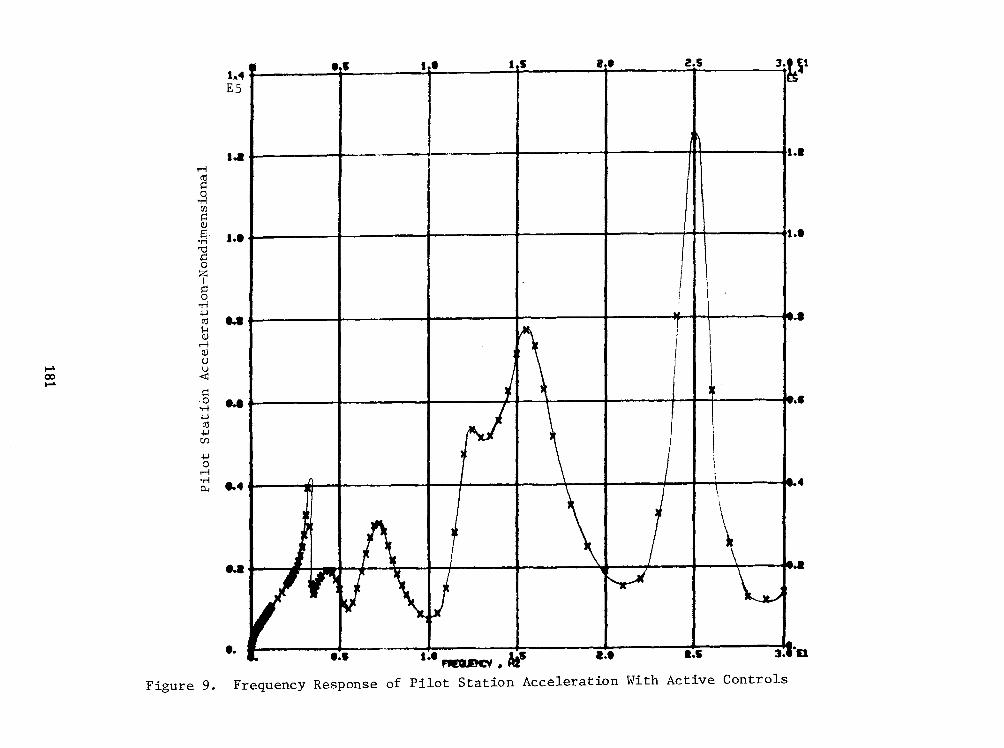
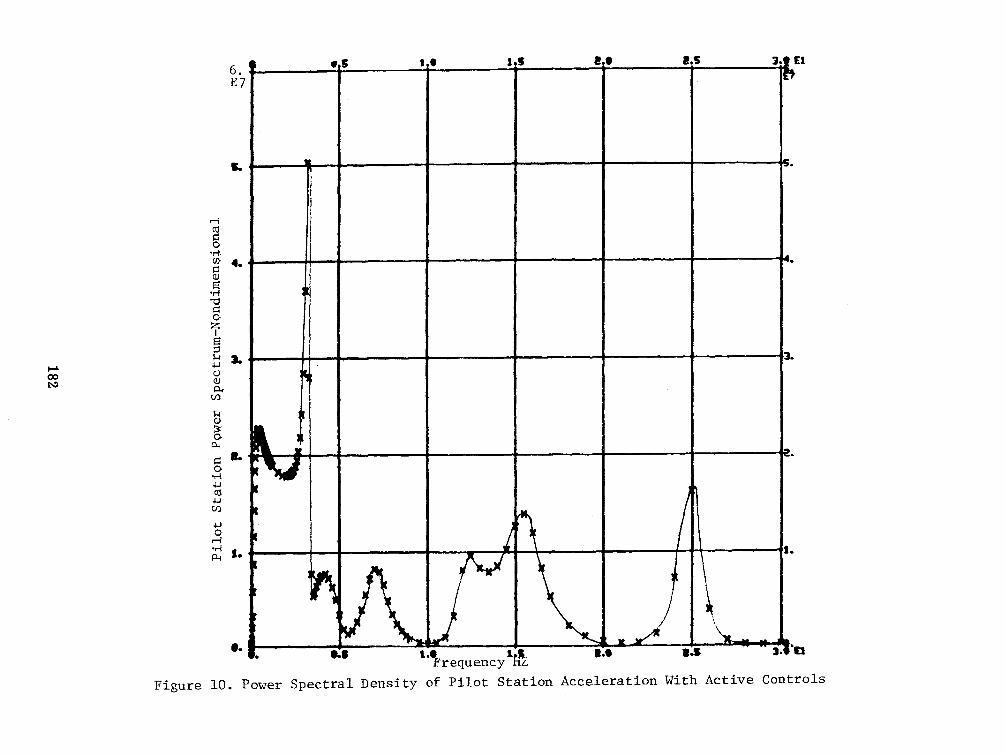
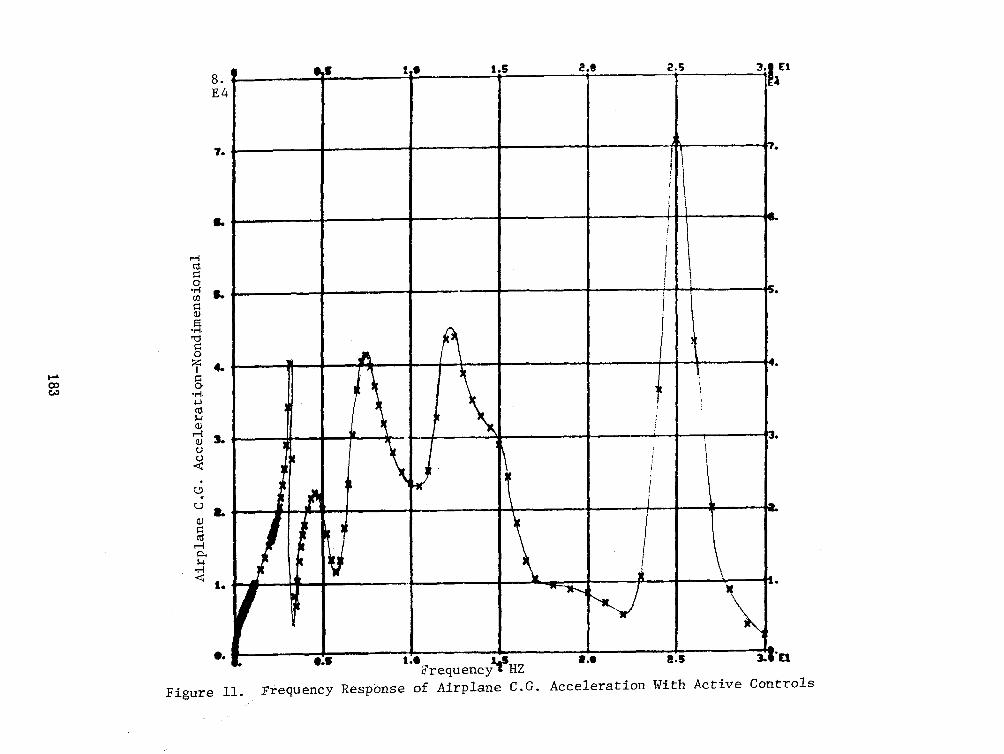
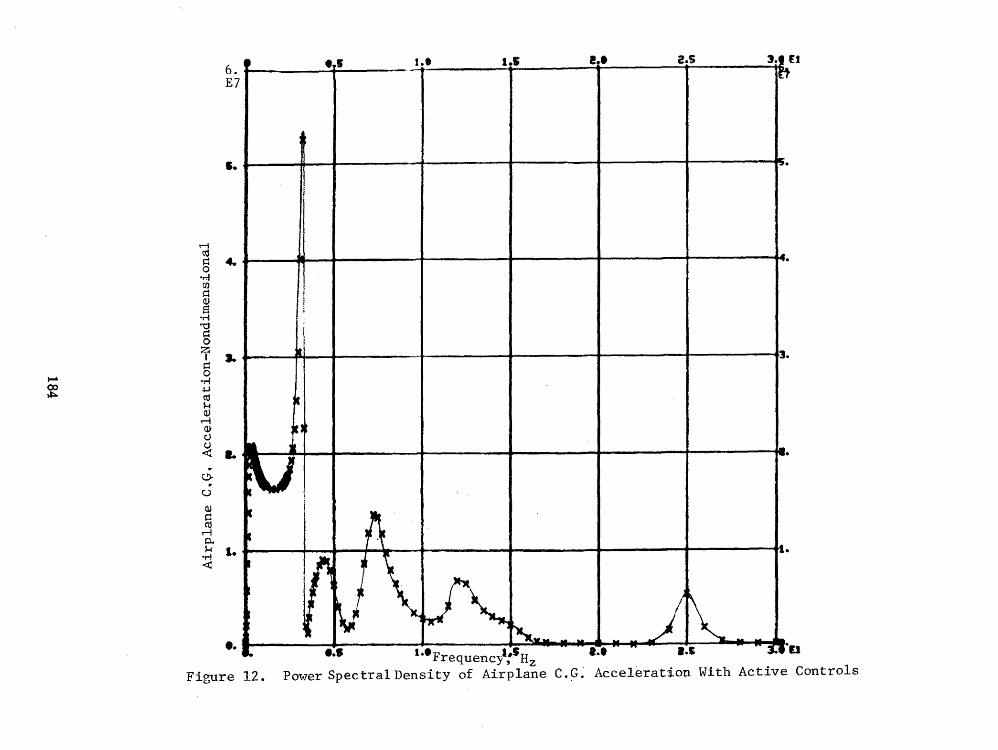
The first fuselage bending mode, whose frequency is 9.5 Hz, is shown in
Figure 4. Note that the pilot station coincides with the forward node point.
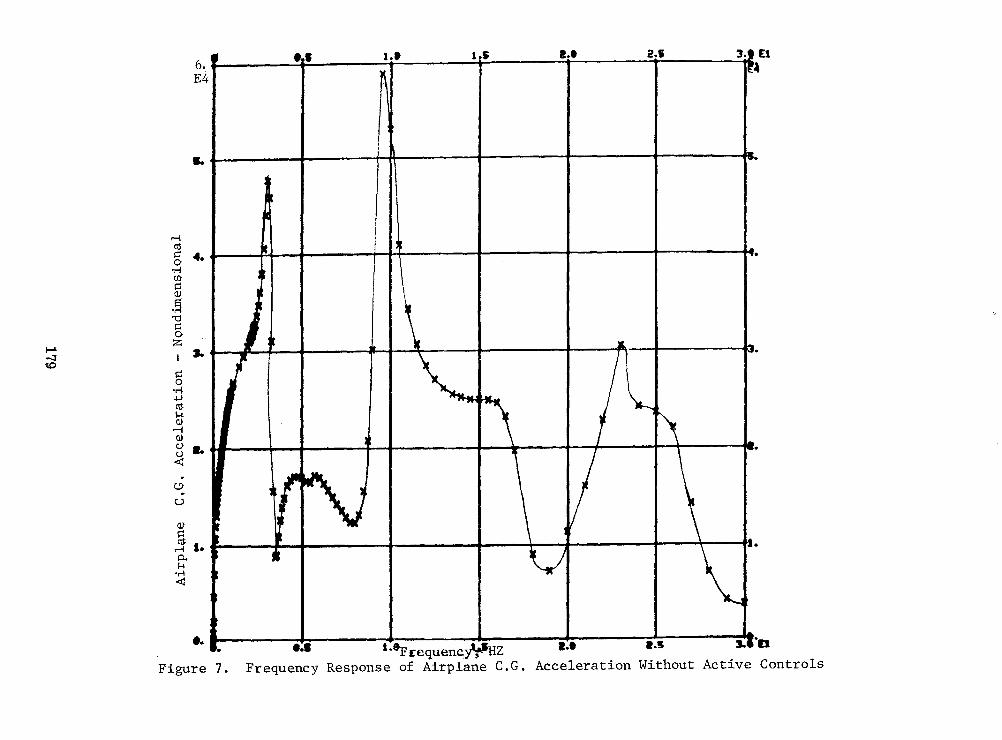
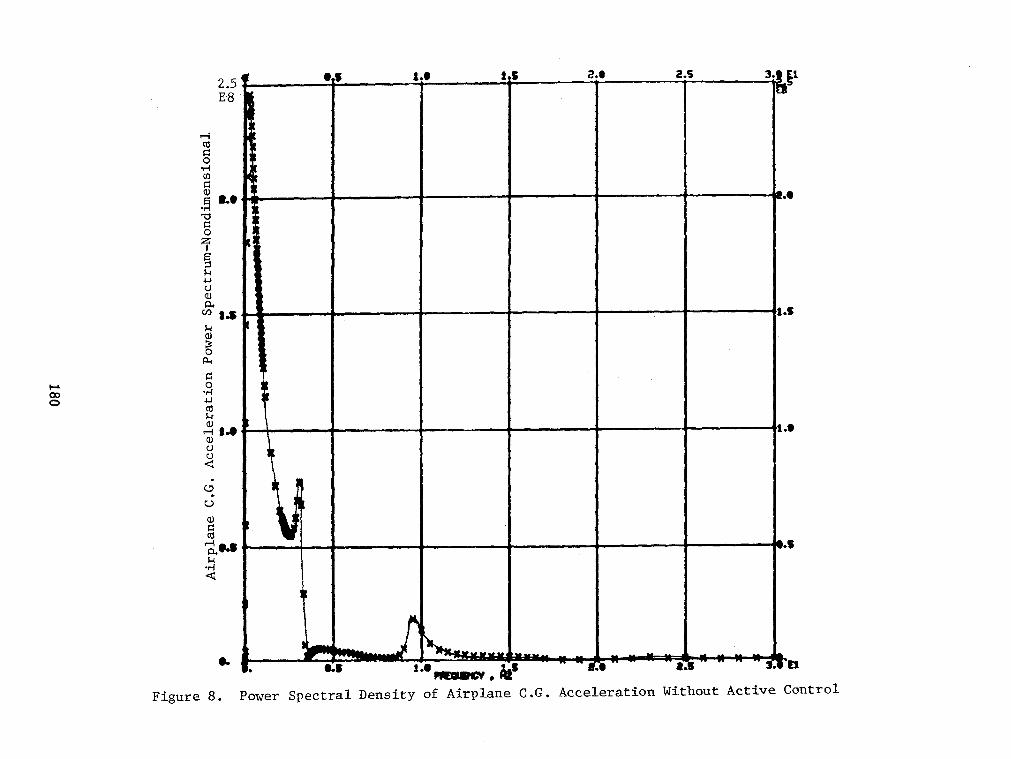
Transfer functions and power spectral densities of the aircraft with and with-
out the active controls are given in Figures 5 thru 12. Most of the response
at the pilot station without the active controls is due to the short period
and the first wing bending modes. When the RIMS and CAS are incorporated in
the equations of motion, the response due to the short period mode is markedlylowered_but some of the high frequency responses are amplified. The net result
in the A of the pilot station acceleration is a 37% reduction due to the controlsystem dynamics, while the N values are higher. If the visceral response of
the pilot is only frequency _ependent, the ride quality is significantly
improved by the RIMS and CAS system used in the analysis. Most of the improve-ment in the ride quality is due to the RIMS interaction alone.
The restart capability of NASTRAN has been used to study the ride quality
by varying the gains in the feedback loops. Similar restarts may be made to
vary the scale of turbulence or the gust spectrum at a fraction of the costof the parent analysis.
TRANSIENT RESPONSE ANALYSIS
Due to the poor ride quality of the modern fighter aircraft a greatinterest has been generated in time domain analysis in parallel with the
169
frequency domain analysis in order to evaluate the handling quality. Transientanalysis by a Fourier method is available in NASTRAN. The loads defined as a
function of time are transformed into the frequency domain by Fourier transformmethods.
In the present analysis a (1-Cosine) gust profile with a critical gradient
of 12.5 chord is used. The maximum gust velocity in the profile is 50 ft/sec.
The NASTRAN restart capability was used to tune the gust response by varyingthe critical gradient.
Using the Fourier method, the single gust profile is replaced by a series
of pulses with a period of 20 seconds. The forcing function is zero for some
time interval to allow _or the decay of the responses. In order to evaluate
the inverse transform equal frequency intervals, method O, is used.
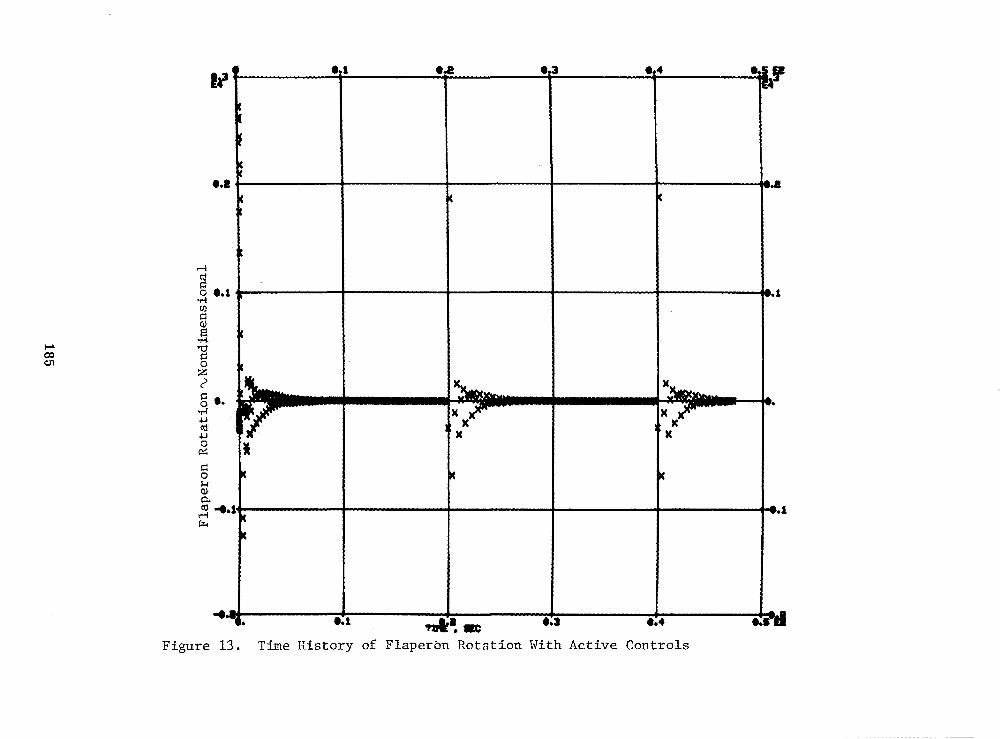
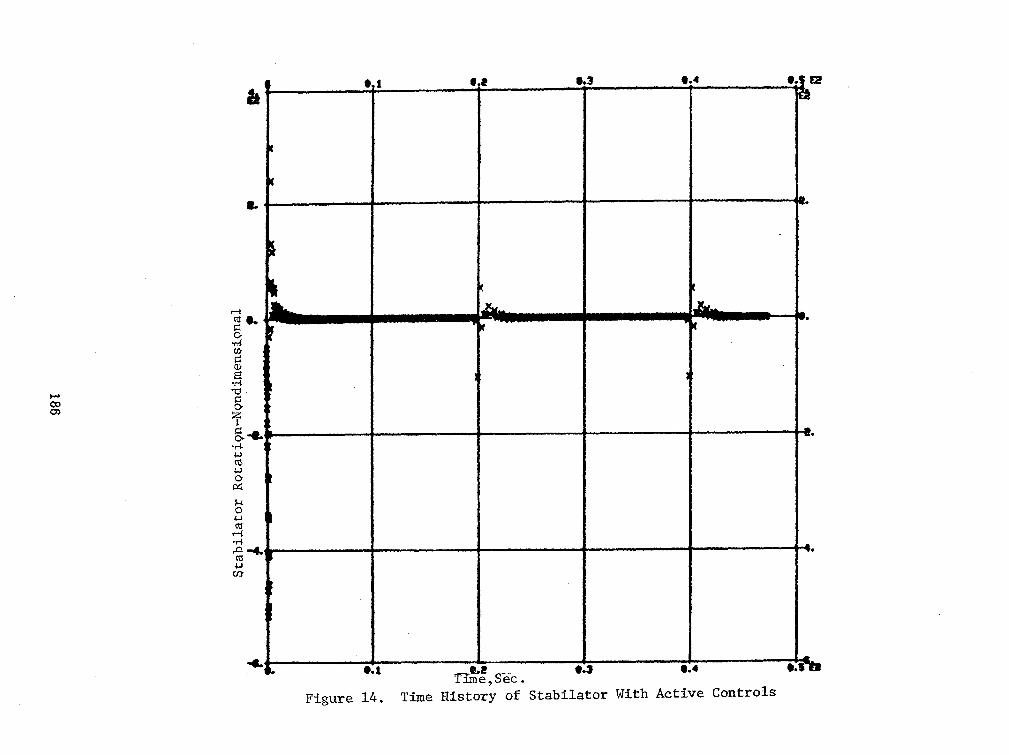
The time histories of the relative rotations of the flaperon and the
stabilator are presented in Figures 13 and 14, respectively. The time history
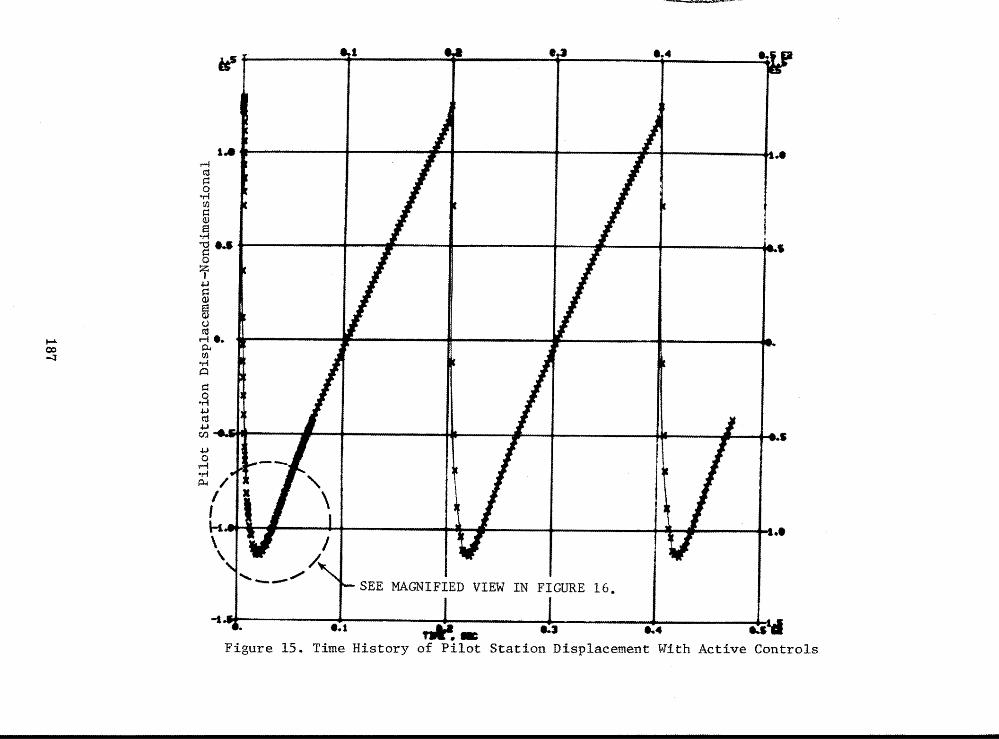
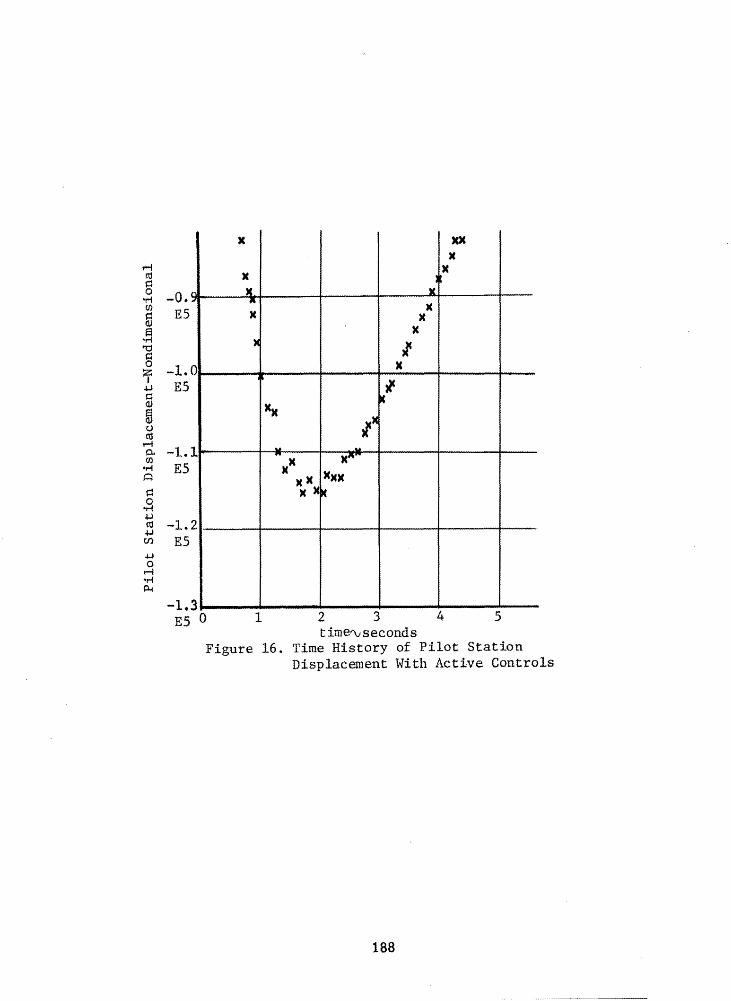
of the pilot station displacement is shown in Figure 15. Most of the pilot
station response is due to the short period mode with a first wing bending
mode contribution superimposed upon it, as shown by the magnified view in
Figure 16. The responses are well decayed before the next gust pulse hitsthe aircraft.
CONCLUSIONS
This paper shows that NASTRAN is an extremely effective tool for aero-
elastic analysis.
A subsonic gust response analysis has been performed in order to evaluate
its usefulness in the flight vehicle system design. In an earlier evaluation,
NASTRAN flutter analysis capability has been found to be very satisfactoryas it provides several state-of-the-art methods and also saves considerable
amount of man-hours by avoiding duplication of the structural model by the
static and dynamics group(Reference i). In the pre-NASTRAN era it has been
a normal practice in many aircraft companies to model the vehicle structure
separately in the stress, flutter and gust response groups. The aerodynamic
model is also duplicated within the groups. A consistent and systematic method
of incorporating control system dynamics in the various engineering disciplinesis also lacking. With the advent of the control configured vehicle, a new
engineering discipline of aeroservoelasticity is emerging in a dominant
engineering role in the early design phases of the aircraft structure and
integrated control system. NASTRAN aeroelastic package with its integrated
stress, flutter, gust response, and control systems interact_o_ is a very
powerful structural analysis tool. It is well tailored for interactive graphics
environments with data base management Systems. With the emphasis on aero-
elastic tailoring and structural optimization in the aircraft design, NASTRAN isamply ready to play a central role.
The gust response analysis performed in this paper on a light weight
fighter has given a great insight in the active control system design. Theuse of RIMS and CAS systems reduce the _ of the pilot station acceleration
responses by 37%. The random gust response due to the short period mode is
170
significantly lowered. However,the response due to the structural modes eitherremains unchanged or some of the higher frequency modes are sttenuated. This
means that the present RIMS and CAS feedback loop gains and filters have to be
modified to suppress the high frequency structural responses. This is an impor-
tant revelation, which would have gone unnoticed in a customary rigid airplane
control system analysis. Use of the active control system aggravates the
dynamic loads on the flaperon, stabilator, etc.,structures.
The transient response analysis of a fighter aircraft is also performed
by NASTRAN to satisfy a point of view, which wants to look at the time historyof the pilot response in addition to the frequency related behavior studied
by the random gust analysis. It is quite possible that the pilot's discomforts
are related to the jerks he feels while flying over the discrete impulses of
the gust rather than a visceral response based on the frequency contents of
the gust induced excitation. More work has to be done in this area in which
NASTRAN can be used as a major design tool.
In all aeroelastic analyses,the checkpoint and restart capability should
be used in order to study the influence of changing the scale of turbulence,
gust spectrum, structural damping, feedback loop gains and filters,etc.,on theresponses. Restart procedure is very cost effective and should be further
improved.
Generation of aerodynamic influence coefficients and a procedure to weight
the aerodynamic forces and_moments on each of the panels should be provided
in order to match the test data. Additional plot capability should be provided
to plot all the aerodynamic elements, spline fitted modes and aerodynamic
pressure distributions. For the design of large aircraft,spacewise variation
of the gust spectrum should be incorporated and coherency, cross-correlation and
cross-spectral density should be calculated as gust response analysis. Mode
acceleration method of response computation should be provided in the rigid
format. A method of computing shear,bending moment and torque at wing statlo_s
or fuselage stations_tc., and plotting them as response quantities is also needed.
171
REFERENCES
i. Singh, A. K., "Applications of NASTRAN in Aeroelastic
Analyses at Northrop," Proceedings of the MSC/NASTRAN
User's Conference, March 15-16, 1979; and FiniteElement News, July 1979.
2. Rodden, W. P., Harder, R. L., and Bellinger, E. D.,
"Aeroelastic Addition to NASTRAN," NASA ContractorReport 3094, March 1979.


![CFD-Based Gust Response Analysis of Free Elastic … Gust Response Analysis of Free Elastic Aircraft Daniella E. Raveh1 ... Comparison with gust responses computed by ZAERO[18] linear](https://static.documents.pub/doc/80x56/5aa2c2c17f8b9a436d8d5b78/cfd-based-gust-response-analysis-of-free-elastic-gust-response-analysis-of-free.jpg)


