33
Applications of Tomographic Imaging in Nuclear Medicine Iván Valastyán Licenciate Thesis Stockholm, Sweden 2006
Applications of Tomographic Imaging in Nuclear Medicine
Iván Valastyán
Licenciate Thesis Stockholm, Sweden 2006
-2-
Abstract Functional imaging is an important field of medical research and diagnostics. Different types of nuclear imaging modalities with emphasis on image reconstructions are presented in this Thesis: a gamma camera demonstrator for the KTH medical imaging laboratory, a small animal PET device, called miniPET, for instrument development and research, and the Cardiotom for myocardial heart studies at the Karolinska University Hospital. The high performance 3D ML-EM iterative image reconstruction method is implemented to the miniPET. As a result the spatial resolution of the miniPET is comparable to other small animal PET cameras. A similar iterative reconstruction method is used in the updated Cardiotom systems. The in-slice resolution of the updated Cardiotom is close to the formerly used filtered backprojection, however the in-depth resolution is considerably increased by using the iterative image reconstruction method. Another improvement is the time required for data acquisition and image reconstruction. The new electronics with the newly developed software ensure images for medical diagnosis approximately within 15 minutes after the start of the examination.
-3-
Table of contents
Abstract ...................................................................................................................................... 2
Glossary ..................................................................................................................................... 4
List of papers ............................................................................................................................. 5
Introduction & history............................................................................................................... 7
Photon detection ........................................................................................................................ 7
Gamma Camera......................................................................................................................... 8
Planar Imaging.................................................................................................................................. 8
3D imaging with a gamma camera ................................................................................................ 10 Single Photon Emission Computed Tomography, SPECT.......................................................................... 10
Ectomography ................................................................................................................................. 11
Positron Emission Tomography, PET.................................................................................... 12
Image reconstruction in nuclear medicine............................................................................. 14
Filtered Backprojection.................................................................................................................. 14
Iterative methods ............................................................................................................................ 14 ML-EM iterative method............................................................................................................................. 15
Results - devices and methods in nuclear imaging ................................................................ 17
Paper I. A Gamma camera demonstrator for medical imaging and design of a SPECT phantom ........................................................................................................................................... 17
Papers II and III: The miniPET: a small animal PET camera................................................... 20 The miniPET hardware................................................................................................................................ 20 Event processing.......................................................................................................................................... 20 Image reconstruction ................................................................................................................................... 22 Test and performance measurements........................................................................................................... 24
Paper IV: Cardiotom, a dedicated gamma camera for myocardial heart studies .................... 26 Segmented collimators ................................................................................................................................ 26 The new hardware ....................................................................................................................................... 27 The data acquisition and reconstruction software........................................................................................ 28
Description of my own contribution to the papers included in this Licenciate Thesis......... 30
References ............................................................................................................................ 31
Acknowledgment ..................................................................................................................... 33
-4-
Glossary
ADC - Analog to Digital Converter
CT - Computer Tomography
DSP - Digital Signal Processing
FBP - Filtered BackProjection
FDG - FluDeoxyGlucose
fMRI - functional Magnetic Resonance Imaging
FOV - Field Of View
FPGA - Field Programmable Gate Array
GUI - Graphical User Interface
HLA - Horizontal Long Axis
IP - Internet Protocol
LOR - Line Of Response
ML-EM - Maximum Likelihood Expectation Maximization
MRI - Magnetic Resonance Imaging
PET - Positron Emission Tomography
PMT - PhotoMultiplier Tube
PSPMT - Position Sensitive PhotoMultiplier Tube
SPECT - Single Photon Emission Tomography
ToF-PET - Time of Flight PET
UDP - User Datagram Protocol
VHDL - Very high speed integrated circuit Hardware Description Language
VLA - Vertical Long Axis
-5-
List of papers
The Thesis includes the first four papers, which are referred to in the text by their Roman numerals:
I. A SPECT demonstrator – revival of a gamma camera, I. Valastyán, A. Kerek, J.
Molnár, D. Novák, J. Végh, M. Emri, L. Trón, Nuclear Instruments and Methods, 563A (2006) 274-277
II. Ethernet based distributed data acquisition system for a small animal PET scanner,
Gy. Hegyesi, J. Imrek, G. Kalinka, J. Molnár, D. Novák, J. Végh, L. Balkay, M. Emri, S.A. Kis, I. Valastyán, G. Molnár, I. Bagaméry, T. Bükki, S. Rózsa, Zs. Szabó, A. Kerek, L. Trón, IEEE Trans. Nucl. Sci., Vol 53. No. 4 (2006) 2112-2117.
III. Full 3D cluster based iterative image reconstruction tool for a small animal PET
camera, I. Valastyán, J. Imrek, S. A. Kis, J. Molnár, D. Novák, L. Balkay, M. Emri, L. Trón, T. Bükki, A. Kerek, Submitted to: Nuclear Instruments and Methods A
IV. Validation of an iterative reconstruction for a mobile tomographic gamma camera
system - the Cardiotom, I. Valastyán, D. Bone, L-Å Brodin, H. Elmqvist, J. Lagerlöf, A. Kerek, J. Molnár, D. Novák, To be published in Nuclear Instruments and Methods A
Other publications:
V. Visualization of heavy ion-induced charge production in a CMOS image sensor, J. Végh, A. Kerek, W. Klamra, J. Molnár, L.-O. Norlin, D. Novák, A. Sanchez-Crespo, J. Van der Marel, A. Fenyvesi, I. Valastyán, A. Sipos, Nuclear Instruments and Methods 525A (2004) 229-235
Conference contributions:
VI. S.A. Kis, L. Balkay, M. Emri, T. Bükki, Gy. Hegyesi, J. Imrek, G. Kalinka, J. Molnár, D. Novák, I. Valastyán, J. Végh, G. Molnár, I. Bagaméry, S. Rózsa, Zs. Szabó, A. Kerek, L. Trón: Comparison of Monte Carlo simulated and measured performance parameters of miniPET scanner, European Conference on Molecular Imaging Technology, 9-12 May, 2006, Marseilles, France
VII. S.A. Kis, I. Valastyán, Gy. Hegyesi, J. Imrek, G. Kalinka, J. Molnár, D. Novák, J.
Végh, L. Balkay, M. Emri, G. Molnár, I. Bagaméry, T. Bükki, S. Rózsa, Zs. Szabó, A. Kerek, L. Trón: Performance Characteristics of a miniPET Scanner Dedicated to Small Animal Imaging. IEEE NSS-MIC Conference, 23-29 Oct. 2005, Puerto Rico

-6-
VIII. A new nonlinear analytical regression model for parameter map generation in Positron Emission Tomography, I. Valastyán, L. Balkay, M. Emri, L. Trón, A. Kerek, Academy of Molecular Imaging Annual Conference, 18-23 March, 2005, Orlando, USA
IX. Kinetic model based analytical PET simulator, I. Valastyán, L. Balkay, M. Emri, L. Trón, A. Kerek, Human Brain Mapping Conference, 13-17 June, 2004, Budapest, Hungary
-7-
Introduction & history
Medical imaging is one of the fundamental clinical methods for diagnosis of early
stages of many diseases. The wide range of modalities enable examinations of different organs in a non-invasive way. The early detection ensures a better prognosis with more therapeutic options and results in greater rates of cure or survival.
A necessary prerequisite for the non-invasive medical imaging is radiation that can carry the information from or through the body for creating the image. The first and still the most commonly used “information carrier” is the electromagnetic radiation. The discovery of producing and detecting this radiation was the single event that revolutionized the medical science. Wilhelm Konrad Röntgen discovered the X-rays in 1895 and only a year later Henry Bequerel was the first to observe the natural radioactivity. The use of X-rays in a few decades becomes a clinical routine in medical diagnostics and also in therapy. These years were the dawn of medical imaging.
The history of nuclear imaging by using different radioactive sources goes back to the 1920-30s. George de Hevesy, a Hungarian chemist, was responsible for pioneering work in the use of radioactive indicators in life sciences and was involved in the first clinical use of isotopes. For the work he was awarded the Nobel Prize in year 1943. In same year he settled in Sweden to continue his research at the University of Stockholm.
The first organ depicted with the nuclear medicine technique was the thyroid using radioactive iodine and a rectilinear scanner detector. The two next milestones originate from Berkeley, namely the invention of the cyclotron for production of radioactivity in the 1930s
and the discovery of the 99m
Tc isotope in 1938. The isotope 99m
Tc has a short half-life, which gives low radiation dose and is chemically reactive and makes it ideal for human imaging. Today this radionuclide is still the most widely used in nuclear medical examinations. Another improvement in radiochemistry was introduction of radioactive isotope labeled glucose (FDG) that enabled to follow molecules in organs.
A major step in new detection techniques comes again from Berkeley in 1950s with Hal O. Anger’s work with the development of the gamma camera for medical imaging. In 1952, Anger first announced a gamma camera with a scintillaton crystal acting as an image intensifier for film [1]. The first electronic gamma camera with multiple photomultiplier tubes was reported in 1957 and presented by Anger in 1958 [2]. The development of the gamma camera made it possible to show in real-time the blood-flow in a patient, watch the kidneys function, examine the liver as it generates the bile etc. The combination of the development of
the 99m
Tc generator and the use of the gamma camera started a new era in nuclear medicine. This Thesis focuses on data acquisition and image reconstruction algorithms for
nuclear imaging systems. These are a Gamma camera used as a demonstrator in education, a small animal PET camera and a dedicated SPECT for acute heart studies.
Photon detection
Nuclear imaging techniques are based on detection of photons from the organ to be studied and the establishment of the coordinates of the point of gamma emission. It is therefore necessary to determine the energy of each photon detected, to be able to distinguish
-8-
between primary (true) and Compton scattered (false) events. As a consequence, large part of a medical examination is determined by the single photon detection technique.
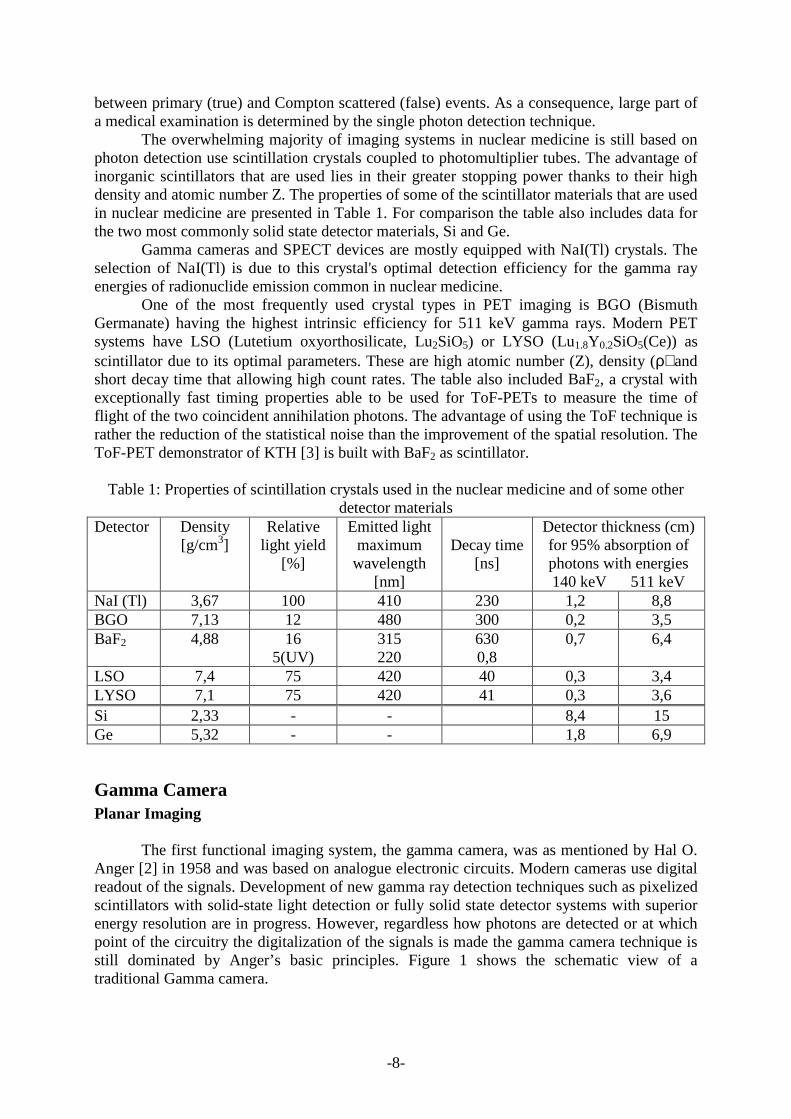
The overwhelming majority of imaging systems in nuclear medicine is still based on photon detection use scintillation crystals coupled to photomultiplier tubes. The advantage of inorganic scintillators that are used lies in their greater stopping power thanks to their high density and atomic number Z. The properties of some of the scintillator materials that are used in nuclear medicine are presented in Table 1. For comparison the table also includes data for the two most commonly solid state detector materials, Si and Ge.
Gamma cameras and SPECT devices are mostly equipped with NaI(Tl) crystals. The selection of NaI(Tl) is due to this crystal's optimal detection efficiency for the gamma ray energies of radionuclide emission common in nuclear medicine.
One of the most frequently used crystal types in PET imaging is BGO (Bismuth Germanate) having the highest intrinsic efficiency for 511 keV gamma rays. Modern PET systems have LSO (Lutetium oxyorthosilicate, Lu2SiO5) or LYSO (Lu1.8Y0.2SiO5(Ce)) as scintillator due to its optimal parameters. These are high atomic number (Z), density (ρ) and short decay time that allowing high count rates. The table also included BaF2, a crystal with exceptionally fast timing properties able to be used for ToF-PETs to measure the time of flight of the two coincident annihilation photons. The advantage of using the ToF technique is rather the reduction of the statistical noise than the improvement of the spatial resolution. The ToF-PET demonstrator of KTH [3] is built with BaF2 as scintillator.
Table 1: Properties of scintillation crystals used in the nuclear medicine and of some other detector materials
Detector Density [g/cm3]
Relative light yield
[%]
Emitted light maximum wavelength
[nm]
Decay time
[ns]
Detector thickness (cm) for 95% absorption of photons with energies 140 keV 511 keV
NaI (Tl) 3,67 100 410 230 1,2 8,8 BGO 7,13 12 480 300 0,2 3,5 BaF2 4,88 16
5(UV) 315 220
630 0,8
0,7 6,4
LSO 7,4 75 420 40 0,3 3,4 LYSO 7,1 75 420 41 0,3 3,6 Si 2,33 - - 8,4 15 Ge 5,32 - - 1,8 6,9
Gamma Camera Planar Imaging
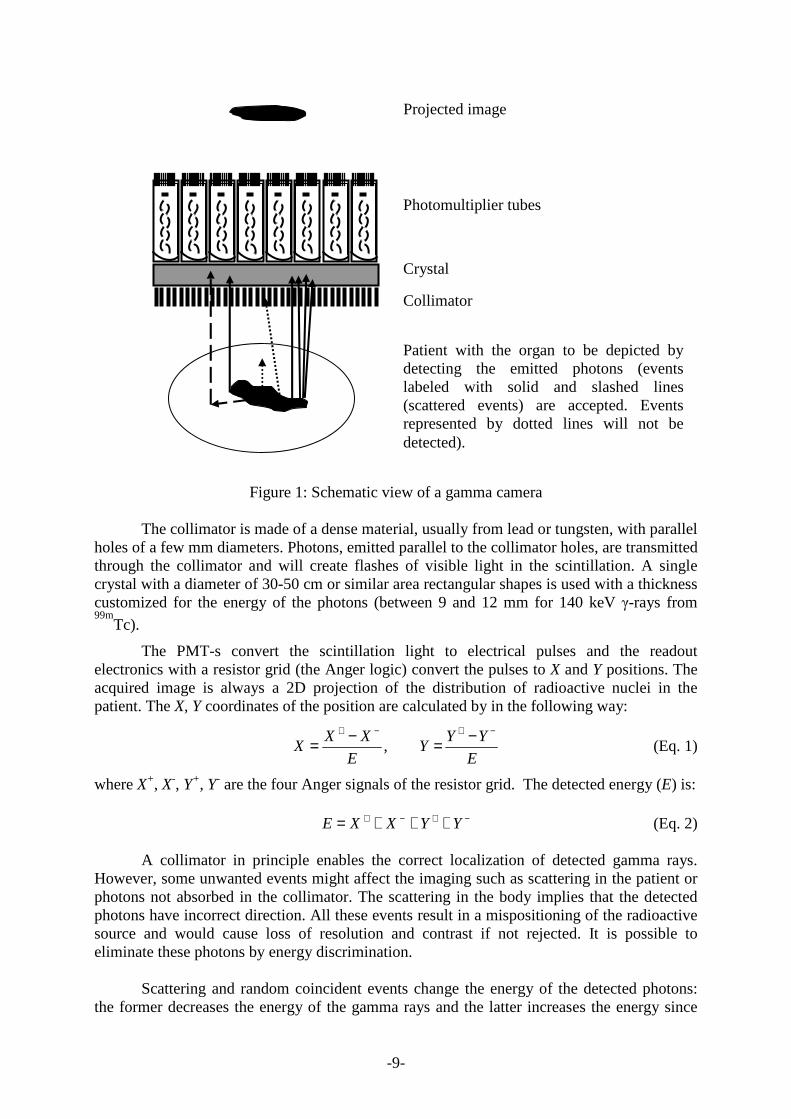
The first functional imaging system, the gamma camera, was as mentioned by Hal O. Anger [2] in 1958 and was based on analogue electronic circuits. Modern cameras use digital readout of the signals. Development of new gamma ray detection techniques such as pixelized scintillators with solid-state light detection or fully solid state detector systems with superior energy resolution are in progress. However, regardless how photons are detected or at which point of the circuitry the digitalization of the signals is made the gamma camera technique is still dominated by Anger’s basic principles. Figure 1 shows the schematic view of a traditional Gamma camera.
-9-
Figure 1: Schematic view of a gamma camera
The collimator is made of a dense material, usually from lead or tungsten, with parallel holes of a few mm diameters. Photons, emitted parallel to the collimator holes, are transmitted through the collimator and will create flashes of visible light in the scintillation. A single crystal with a diameter of 30-50 cm or similar area rectangular shapes is used with a thickness customized for the energy of the photons (between 9 and 12 mm for 140 keV γ-rays from
99mTc).
The PMT-s convert the scintillation light to electrical pulses and the readout electronics with a resistor grid (the Anger logic) convert the pulses to X and Y positions. The acquired image is always a 2D projection of the distribution of radioactive nuclei in the patient. The X, Y coordinates of the position are calculated by in the following way:
E
YYY
E
XXX
−+−+ −=−= , (Eq. 1)
where X+, X-, Y+, Y- are the four Anger signals of the resistor grid. The detected energy (E) is: −+−+ +++= YYXXE (Eq. 2)
A collimator in principle enables the correct localization of detected gamma rays.
However, some unwanted events might affect the imaging such as scattering in the patient or photons not absorbed in the collimator. The scattering in the body implies that the detected photons have incorrect direction. All these events result in a mispositioning of the radioactive source and would cause loss of resolution and contrast if not rejected. It is possible to eliminate these photons by energy discrimination.
Scattering and random coincident events change the energy of the detected photons:
the former decreases the energy of the gamma rays and the latter increases the energy since
Projected image
Photomultiplier tubes
Crystal Collimator
Patient with the organ to be depicted by detecting the emitted photons (events labeled with solid and slashed lines (scattered events) are accepted. Events represented by dotted lines will not be detected).
-10-
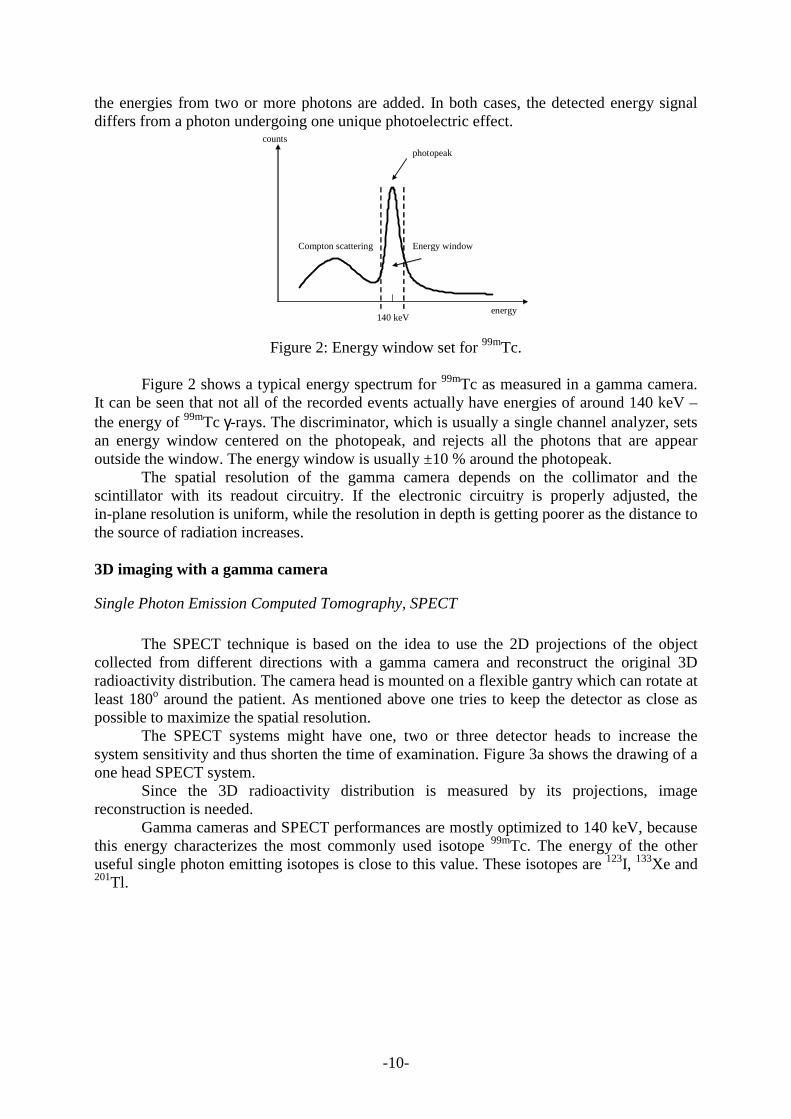
the energies from two or more photons are added. In both cases, the detected energy signal differs from a photon undergoing one unique photoelectric effect.
energy
counts
photopeak
Energy window Compton scattering
140 keV
Figure 2: Energy window set for 99mTc.
Figure 2 shows a typical energy spectrum for 99mTc as measured in a gamma camera.
It can be seen that not all of the recorded events actually have energies of around 140 keV – the energy of 99mTc γ-rays. The discriminator, which is usually a single channel analyzer, sets an energy window centered on the photopeak, and rejects all the photons that are appear outside the window. The energy window is usually ±10 % around the photopeak.
The spatial resolution of the gamma camera depends on the collimator and the scintillator with its readout circuitry. If the electronic circuitry is properly adjusted, the in-plane resolution is uniform, while the resolution in depth is getting poorer as the distance to the source of radiation increases.
3D imaging with a gamma camera
Single Photon Emission Computed Tomography, SPECT
The SPECT technique is based on the idea to use the 2D projections of the object
collected from different directions with a gamma camera and reconstruct the original 3D radioactivity distribution. The camera head is mounted on a flexible gantry which can rotate at least 180o around the patient. As mentioned above one tries to keep the detector as close as possible to maximize the spatial resolution.
The SPECT systems might have one, two or three detector heads to increase the system sensitivity and thus shorten the time of examination. Figure 3a shows the drawing of a one head SPECT system.
Since the 3D radioactivity distribution is measured by its projections, image reconstruction is needed.
Gamma cameras and SPECT performances are mostly optimized to 140 keV, because this energy characterizes the most commonly used isotope 99mTc. The energy of the other useful single photon emitting isotopes is close to this value. These isotopes are 123I, 133Xe and 201Tl.
-11-
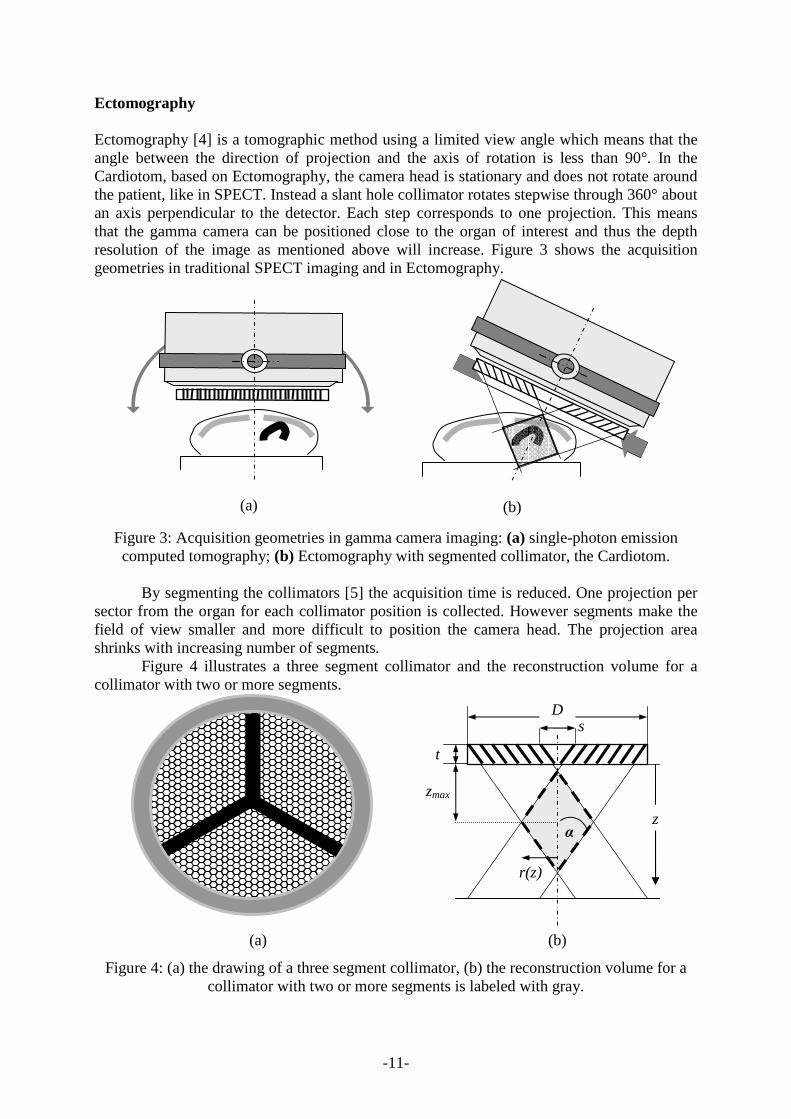
Ectomography Ectomography [4] is a tomographic method using a limited view angle which means that the angle between the direction of projection and the axis of rotation is less than 90°. In the Cardiotom, based on Ectomography, the camera head is stationary and does not rotate around the patient, like in SPECT. Instead a slant hole collimator rotates stepwise through 360° about an axis perpendicular to the detector. Each step corresponds to one projection. This means that the gamma camera can be positioned close to the organ of interest and thus the depth resolution of the image as mentioned above will increase. Figure 3 shows the acquisition geometries in traditional SPECT imaging and in Ectomography.
Figure 3: Acquisition geometries in gamma camera imaging: (a) single-photon emission computed tomography; (b) Ectomography with segmented collimator, the Cardiotom.
By segmenting the collimators [5] the acquisition time is reduced. One projection per
sector from the organ for each collimator position is collected. However segments make the field of view smaller and more difficult to position the camera head. The projection area shrinks with increasing number of segments.
Figure 4 illustrates a three segment collimator and the reconstruction volume for a collimator with two or more segments.
Figure 4: (a) the drawing of a three segment collimator, (b) the reconstruction volume for a collimator with two or more segments is labeled with gray.
(b) (a)
(a) (b)
zmax
t
r(z)
α
s D
z
-12-
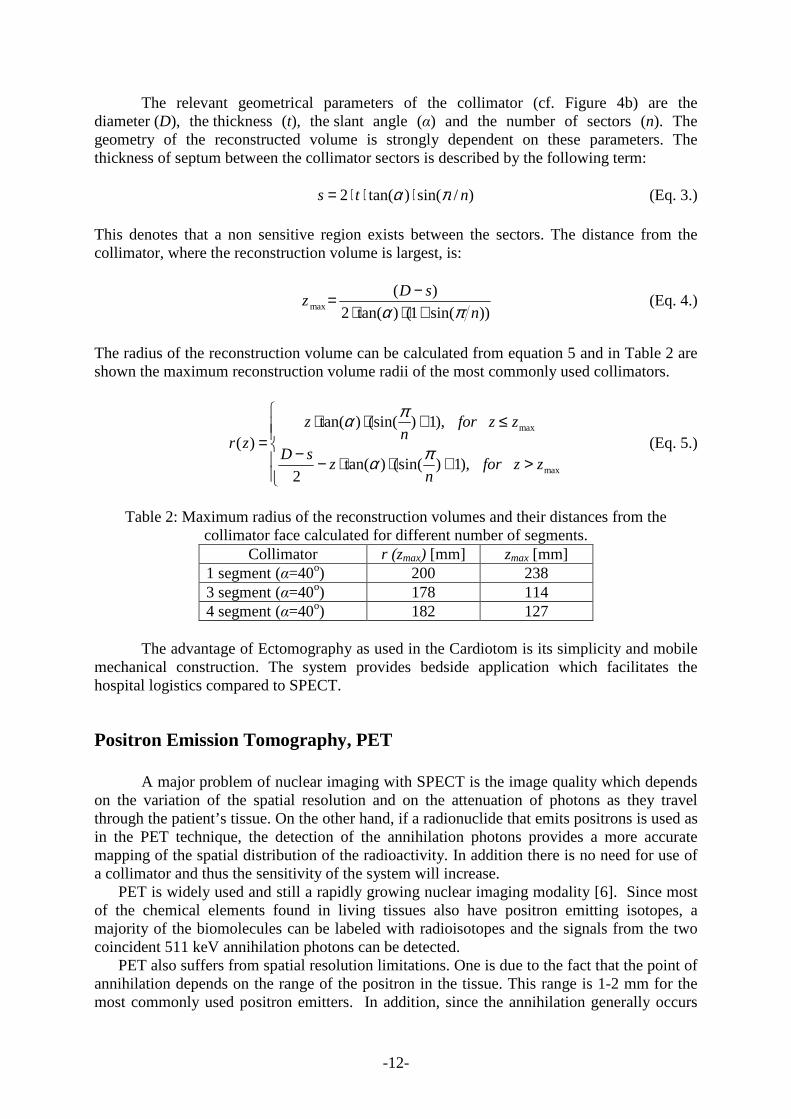
The relevant geometrical parameters of the collimator (cf. Figure 4b) are the diameter (D), the thickness (t), the slant angle (α) and the number of sectors (n). The geometry of the reconstructed volume is strongly dependent on these parameters. The thickness of septum between the collimator sectors is described by the following term:
)/sin()tan(2 nts πα ⋅⋅⋅= (Eq. 3.)
This denotes that a non sensitive region exists between the sectors. The distance from the collimator, where the reconstruction volume is largest, is:
))sin(1()tan(2
)(max n
sDz
πα +⋅⋅−= (Eq. 4.)
The radius of the reconstruction volume can be calculated from equation 5 and in Table 2 are shown the maximum reconstruction volume radii of the most commonly used collimators.
>+⋅⋅−−
≤+⋅⋅=
max
max
),1)(sin()tan(2
),1)(sin()tan()(
zzforn
zsD
zzforn
zzr
πα
πα (Eq. 5.)
Table 2: Maximum radius of the reconstruction volumes and their distances from the
collimator face calculated for different number of segments. Collimator r (zmax) [mm] zmax [mm]
1 segment (α=40o) 200 238 3 segment (α=40o) 178 114 4 segment (α=40o) 182 127
The advantage of Ectomography as used in the Cardiotom is its simplicity and mobile
mechanical construction. The system provides bedside application which facilitates the hospital logistics compared to SPECT.
Positron Emission Tomography, PET
A major problem of nuclear imaging with SPECT is the image quality which depends on the variation of the spatial resolution and on the attenuation of photons as they travel through the patient’s tissue. On the other hand, if a radionuclide that emits positrons is used as in the PET technique, the detection of the annihilation photons provides a more accurate mapping of the spatial distribution of the radioactivity. In addition there is no need for use of a collimator and thus the sensitivity of the system will increase.
PET is widely used and still a rapidly growing nuclear imaging modality [6]. Since most of the chemical elements found in living tissues also have positron emitting isotopes, a majority of the biomolecules can be labeled with radioisotopes and the signals from the two coincident 511 keV annihilation photons can be detected.
PET also suffers from spatial resolution limitations. One is due to the fact that the point of annihilation depends on the range of the positron in the tissue. This range is 1-2 mm for the most commonly used positron emitters. In addition, since the annihilation generally occurs
-13-
before the positron has reached a state of rest the direction of the two emitted photons will slightly deviate from 1800. The range of positrons might be a problem for small animal PET systems where high spatial resolution is required. The derivation for 180o for the two photons is on the other hands of no concern for small animal PET systems.
PET cameras consist of a ring of scintillation crystals. The size of the crystal elements should be as small as possible to achieve a high granularity which is necessary for obtaining a good spatial resolution. In PET cameras the detectors are arranged in a circular array surrounding the object and thus no rotation of the crystals is necessary.
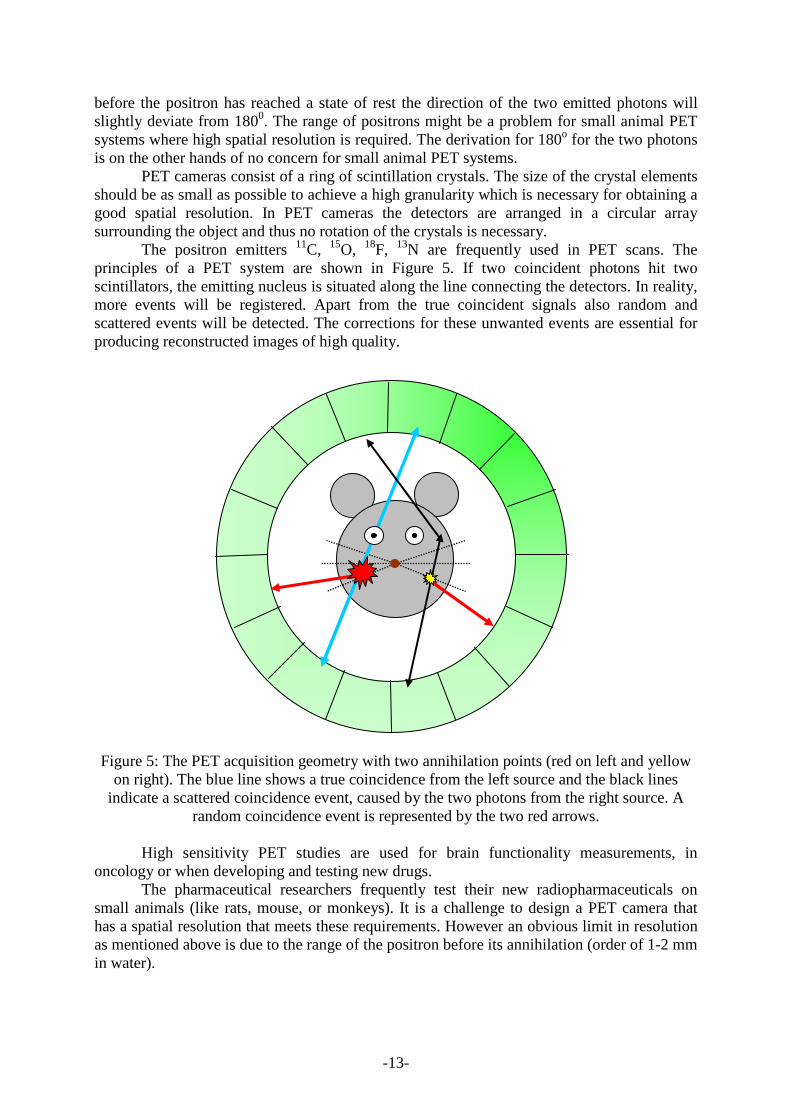
The positron emitters 11C, 15O, 18F, 13N are frequently used in PET scans. The principles of a PET system are shown in Figure 5. If two coincident photons hit two scintillators, the emitting nucleus is situated along the line connecting the detectors. In reality, more events will be registered. Apart from the true coincident signals also random and scattered events will be detected. The corrections for these unwanted events are essential for producing reconstructed images of high quality.
Figure 5: The PET acquisition geometry with two annihilation points (red on left and yellow
on right). The blue line shows a true coincidence from the left source and the black lines indicate a scattered coincidence event, caused by the two photons from the right source. A
random coincidence event is represented by the two red arrows.
High sensitivity PET studies are used for brain functionality measurements, in oncology or when developing and testing new drugs.
The pharmaceutical researchers frequently test their new radiopharmaceuticals on small animals (like rats, mouse, or monkeys). It is a challenge to design a PET camera that has a spatial resolution that meets these requirements. However an obvious limit in resolution as mentioned above is due to the range of the positron before its annihilation (order of 1-2 mm in water).
-14-
Image reconstruction in nuclear medicine Filtered Backprojection
Image reconstruction follows the same principals for SPECT and PET. The first and
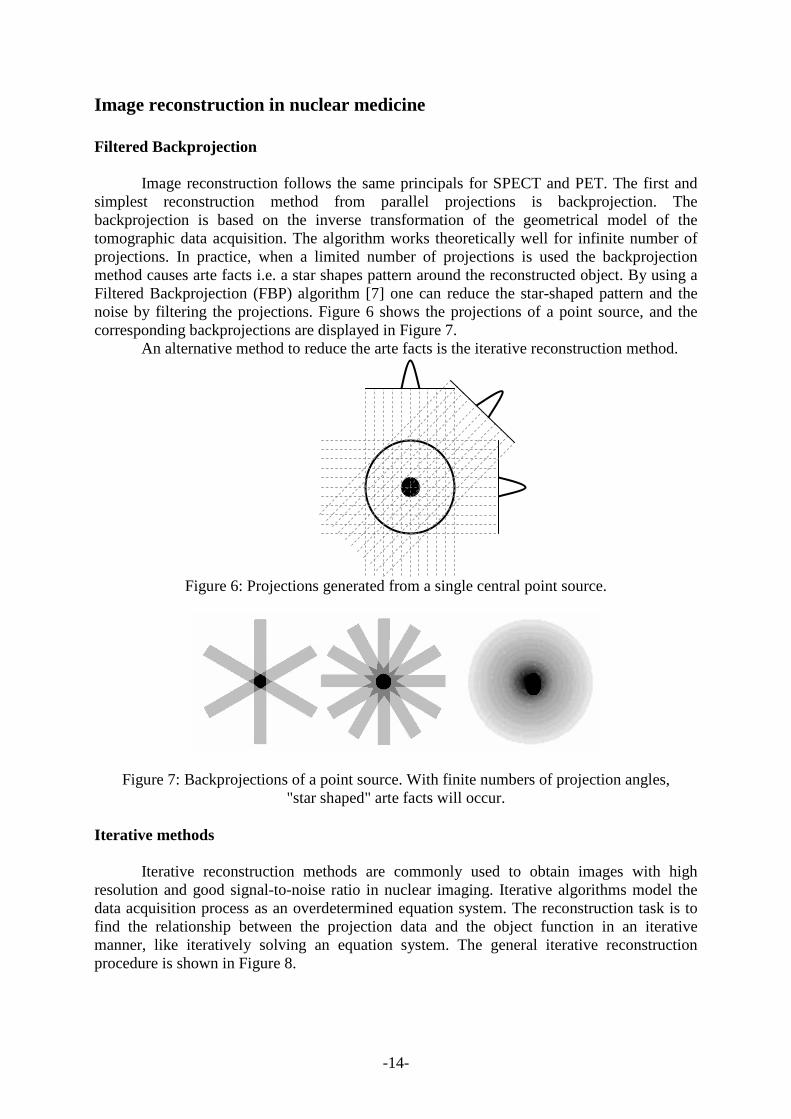
simplest reconstruction method from parallel projections is backprojection. The backprojection is based on the inverse transformation of the geometrical model of the tomographic data acquisition. The algorithm works theoretically well for infinite number of projections. In practice, when a limited number of projections is used the backprojection method causes arte facts i.e. a star shapes pattern around the reconstructed object. By using a Filtered Backprojection (FBP) algorithm [7] one can reduce the star-shaped pattern and the noise by filtering the projections. Figure 6 shows the projections of a point source, and the corresponding backprojections are displayed in Figure 7.
An alternative method to reduce the arte facts is the iterative reconstruction method.
Figure 6: Projections generated from a single central point source.
Figure 7: Backprojections of a point source. With finite numbers of projection angles, "star shaped" arte facts will occur.
Iterative methods
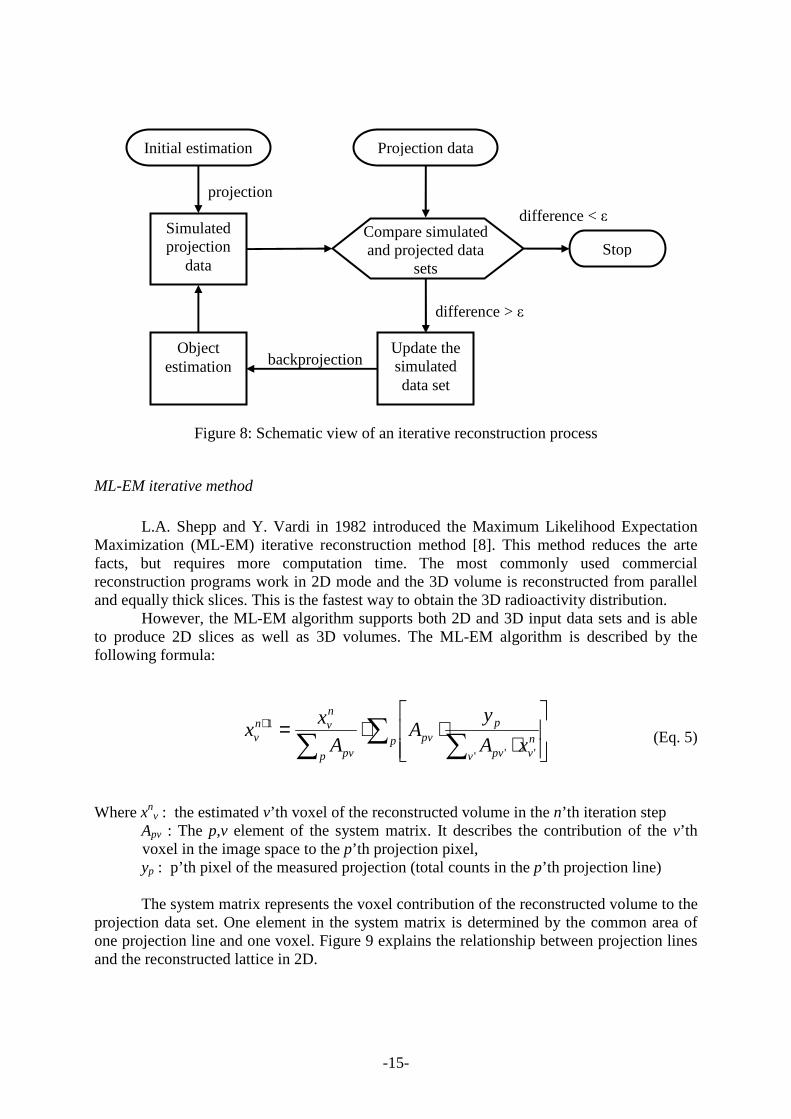
Iterative reconstruction methods are commonly used to obtain images with high resolution and good signal-to-noise ratio in nuclear imaging. Iterative algorithms model the data acquisition process as an overdetermined equation system. The reconstruction task is to find the relationship between the projection data and the object function in an iterative manner, like iteratively solving an equation system. The general iterative reconstruction procedure is shown in Figure 8.
-15-
Figure 8: Schematic view of an iterative reconstruction process
ML-EM iterative method
L.A. Shepp and Y. Vardi in 1982 introduced the Maximum Likelihood Expectation
Maximization (ML-EM) iterative reconstruction method [8]. This method reduces the arte facts, but requires more computation time. The most commonly used commercial reconstruction programs work in 2D mode and the 3D volume is reconstructed from parallel and equally thick slices. This is the fastest way to obtain the 3D radioactivity distribution.
However, the ML-EM algorithm supports both 2D and 3D input data sets and is able to produce 2D slices as well as 3D volumes. The ML-EM algorithm is described by the following formula:
∑∑∑
⋅⋅⋅=+
pv
nvpv
ppv
p pv
nvn
v xA
yA
A
xx
' ''
1 (Eq. 5)
Where xnv : the estimated v’th voxel of the reconstructed volume in the n’th iteration step
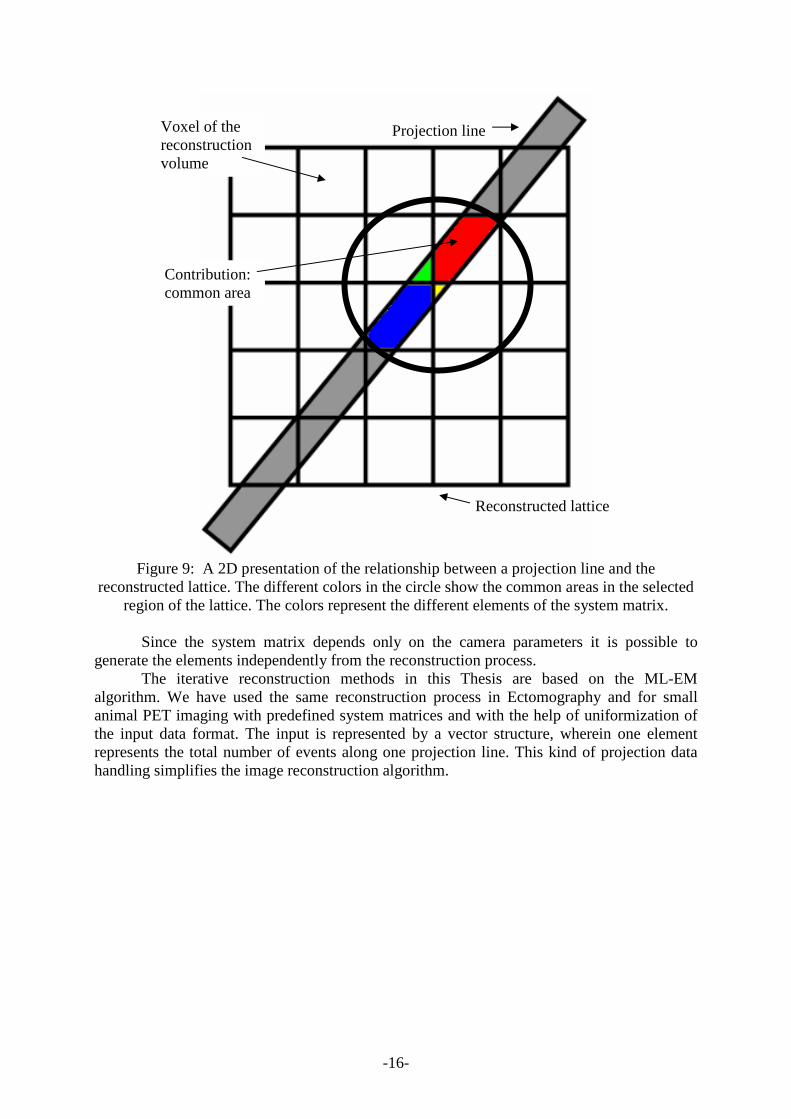
Apv : The p,v element of the system matrix. It describes the contribution of the v’th voxel in the image space to the p’th projection pixel, yp : p’th pixel of the measured projection (total counts in the p’th projection line) The system matrix represents the voxel contribution of the reconstructed volume to the
projection data set. One element in the system matrix is determined by the common area of one projection line and one voxel. Figure 9 explains the relationship between projection lines and the reconstructed lattice in 2D.
Object estimation
Update the simulated data set
Stop
Initial estimation Projection data
Simulated projection
data
Compare simulated and projected data
sets
projection
difference > ε
backprojection
difference < ε
-16-
Figure 9: A 2D presentation of the relationship between a projection line and the
reconstructed lattice. The different colors in the circle show the common areas in the selected region of the lattice. The colors represent the different elements of the system matrix.
Since the system matrix depends only on the camera parameters it is possible to
generate the elements independently from the reconstruction process. The iterative reconstruction methods in this Thesis are based on the ML-EM
algorithm. We have used the same reconstruction process in Ectomography and for small animal PET imaging with predefined system matrices and with the help of uniformization of the input data format. The input is represented by a vector structure, wherein one element represents the total number of events along one projection line. This kind of projection data handling simplifies the image reconstruction algorithm.
Reconstructed lattice
Projection line Voxel of the reconstruction volume
Contribution: common area
-17-
Results - devices and methods in nuclear imaging
Paper I. A Gamma camera demonstrator for medical imaging and design of a SPECT phantom
To get an insight to the different imaging modalities, laboratory exercises are an important part of a university course in medical imaging and are necessary for understanding the principles of complex systems. Demonstrators [3][9] and [10] are developed for some of the major modalities of medical imaging at the Physics department of KTH with the primary goal to provide transparency for understanding the physical processes and at the same time allow collection of data for image reconstruction.
To illustrate the most commonly used imaging modality for functionality studies in clinical situations a gamma camera has been converted to serve as a demonstrator in an medical imaging course. An old camera of type Starcam Mobile 300 A/M manufactured by General Electric Medical Systems was donated to the medical imaging courses at KTH by Danderyd Hospital, Nuclear Medicine Department [11]. The conversion and upgrade of this camera to become a 3D SPECT demonstrator add a new laboratory exercise to the course of Medical Imaging.
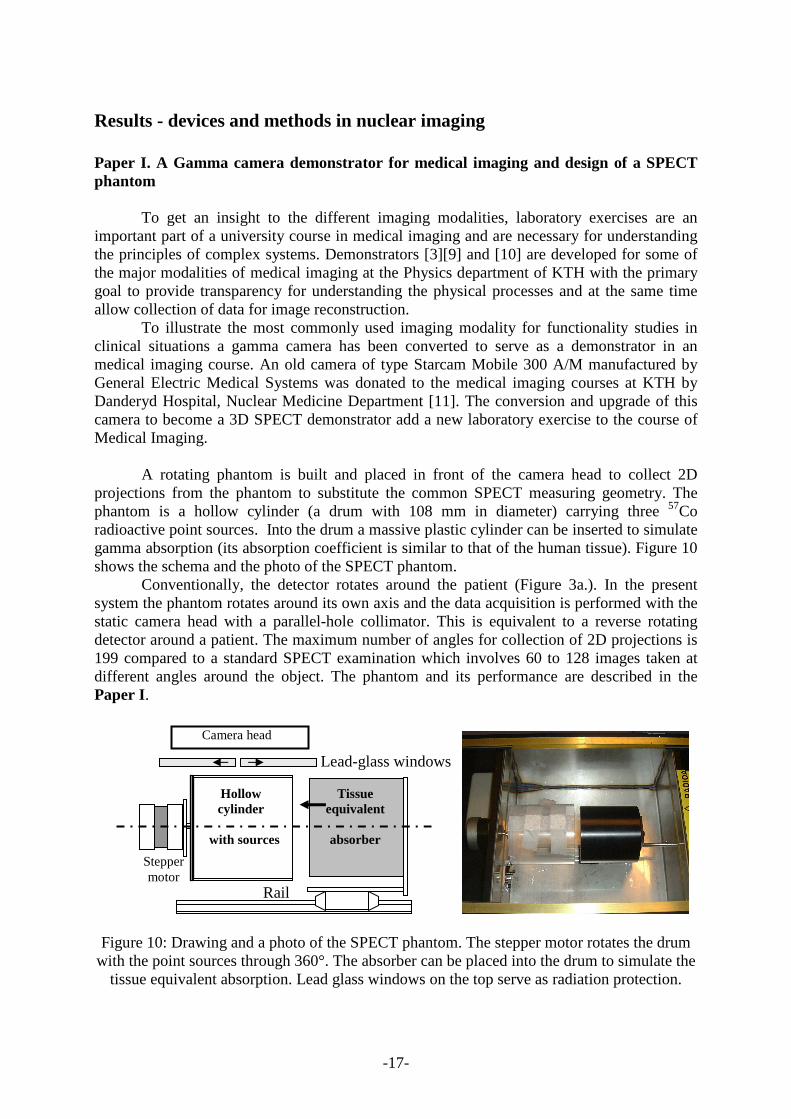
A rotating phantom is built and placed in front of the camera head to collect 2D projections from the phantom to substitute the common SPECT measuring geometry. The phantom is a hollow cylinder (a drum with 108 mm in diameter) carrying three 57Co radioactive point sources. Into the drum a massive plastic cylinder can be inserted to simulate gamma absorption (its absorption coefficient is similar to that of the human tissue). Figure 10 shows the schema and the photo of the SPECT phantom.
Conventionally, the detector rotates around the patient (Figure 3a.). In the present system the phantom rotates around its own axis and the data acquisition is performed with the static camera head with a parallel-hole collimator. This is equivalent to a reverse rotating detector around a patient. The maximum number of angles for collection of 2D projections is 199 compared to a standard SPECT examination which involves 60 to 128 images taken at different angles around the object. The phantom and its performance are described in the Paper I.
Figure 10: Drawing and a photo of the SPECT phantom. The stepper motor rotates the drum with the point sources through 360°. The absorber can be placed into the drum to simulate the
tissue equivalent absorption. Lead glass windows on the top serve as radiation protection.
Camera head
Stepper motor
Tissue equivalent
absorber
Rail
Lead-glass windows
Hollow cylinder
with sources
-18-
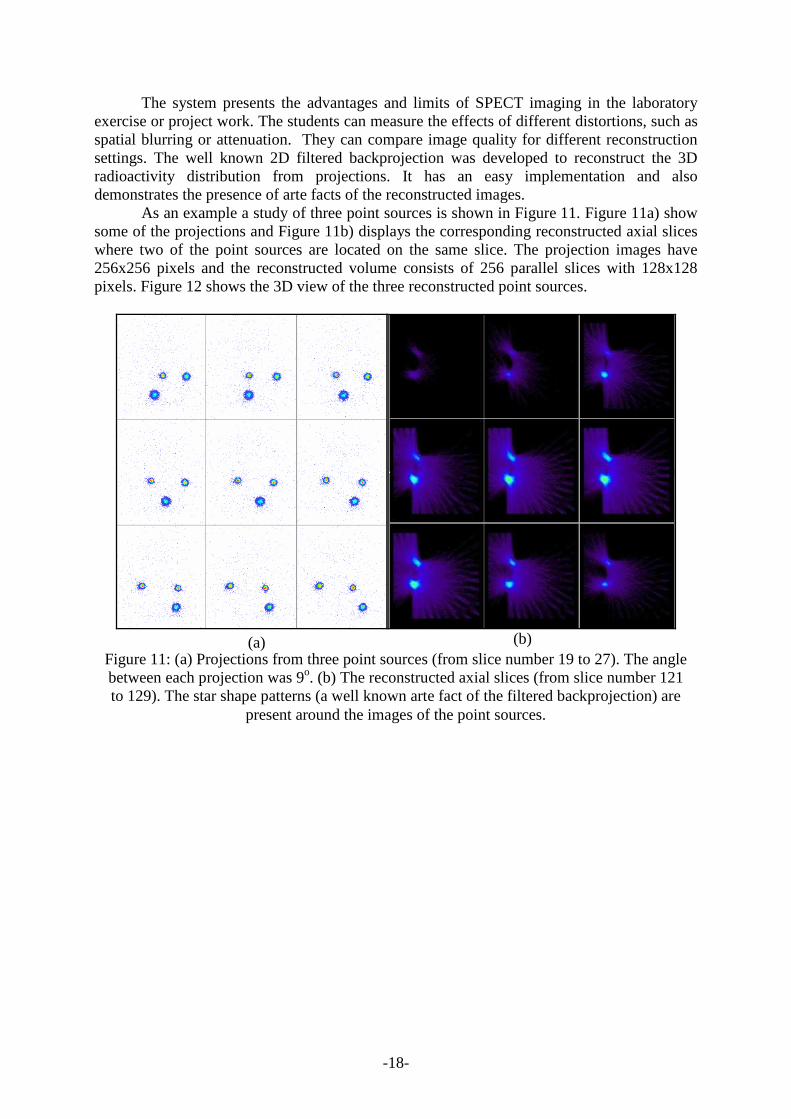
The system presents the advantages and limits of SPECT imaging in the laboratory exercise or project work. The students can measure the effects of different distortions, such as spatial blurring or attenuation. They can compare image quality for different reconstruction settings. The well known 2D filtered backprojection was developed to reconstruct the 3D radioactivity distribution from projections. It has an easy implementation and also demonstrates the presence of arte facts of the reconstructed images.
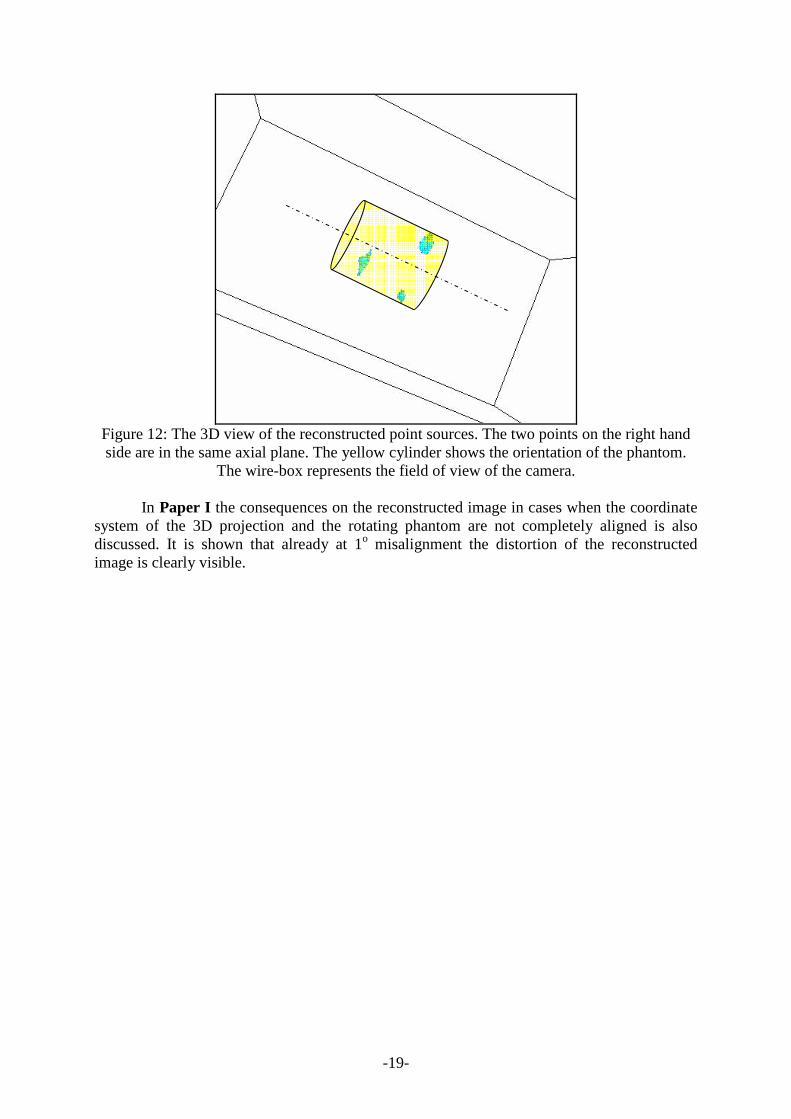
As an example a study of three point sources is shown in Figure 11. Figure 11a) show some of the projections and Figure 11b) displays the corresponding reconstructed axial slices where two of the point sources are located on the same slice. The projection images have 256x256 pixels and the reconstructed volume consists of 256 parallel slices with 128x128 pixels. Figure 12 shows the 3D view of the three reconstructed point sources.
(a) (b) Figure 11: (a) Projections from three point sources (from slice number 19 to 27). The angle between each projection was 9o. (b) The reconstructed axial slices (from slice number 121 to 129). The star shape patterns (a well known arte fact of the filtered backprojection) are
present around the images of the point sources.
-19-
Figure 12: The 3D view of the reconstructed point sources. The two points on the right hand side are in the same axial plane. The yellow cylinder shows the orientation of the phantom.
The wire-box represents the field of view of the camera.
In Paper I the consequences on the reconstructed image in cases when the coordinate system of the 3D projection and the rotating phantom are not completely aligned is also discussed. It is shown that already at 1o misalignment the distortion of the reconstructed image is clearly visible.
-20-
Papers II and III: The miniPET: a small animal PET camera Small animal PET imaging is one of the most suitable methods of testing newly
developed PET radiopharmaceuticals or studying the characteristics of several tumor diseases. Small animal PET scanners require good spatial resolution and high sensitivity over a field-of-view that suits the size of the object being imaged. A small animal PET device, the miniPET, is presented in Papers II and III in this Thesis and in references [12] and [13]. It is designed and built at the Institute of Nuclear Research of the Hungarian Academy of Sciences (ATOMKI), Debrecen, Hungary. Other collaborators of the miniPET project were the PET Center of the University of Debrecen, Mediso Ltd, Budapest and the Royal Institute of Technology, Stockholm.
The project is completed and the miniPET serves today as a test bench for technologies in design of a full size camera for small animal PET imaging.
The miniPET hardware
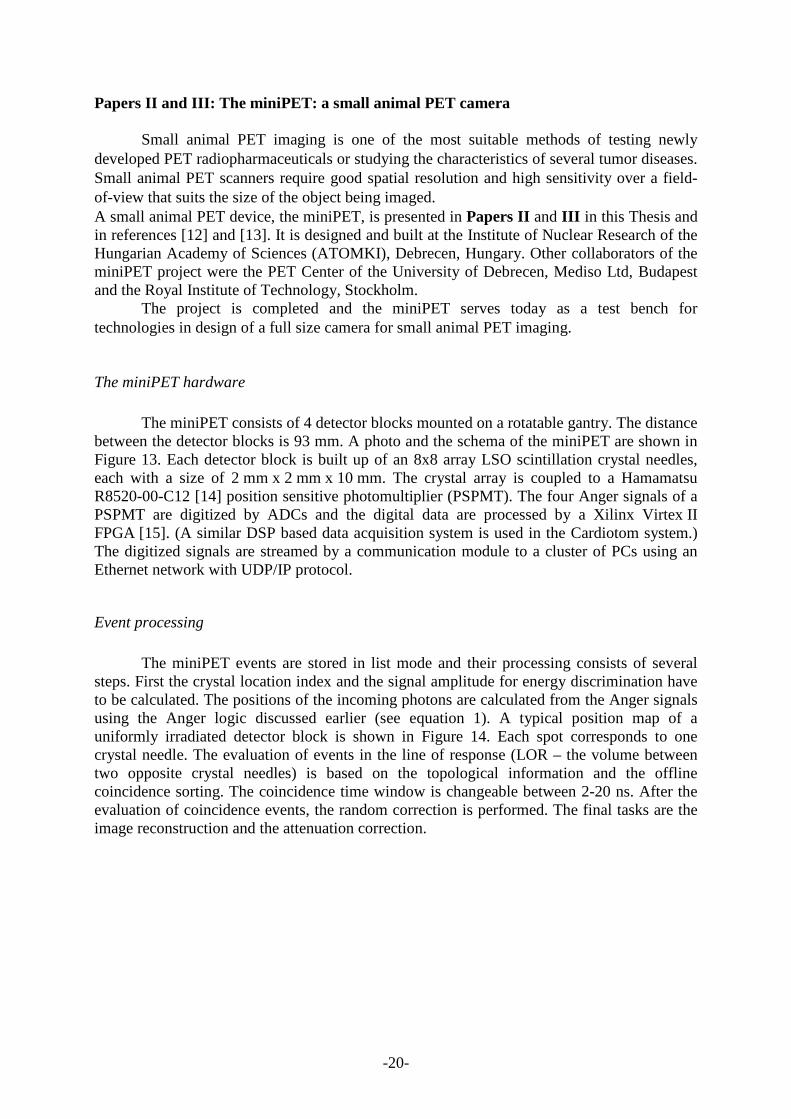
The miniPET consists of 4 detector blocks mounted on a rotatable gantry. The distance
between the detector blocks is 93 mm. A photo and the schema of the miniPET are shown in Figure 13. Each detector block is built up of an 8x8 array LSO scintillation crystal needles, each with a size of 2 mm x 2 mm x 10 mm. The crystal array is coupled to a Hamamatsu R8520-00-C12 [14] position sensitive photomultiplier (PSPMT). The four Anger signals of a PSPMT are digitized by ADCs and the digital data are processed by a Xilinx Virtex II FPGA [15]. (A similar DSP based data acquisition system is used in the Cardiotom system.) The digitized signals are streamed by a communication module to a cluster of PCs using an Ethernet network with UDP/IP protocol.
Event processing
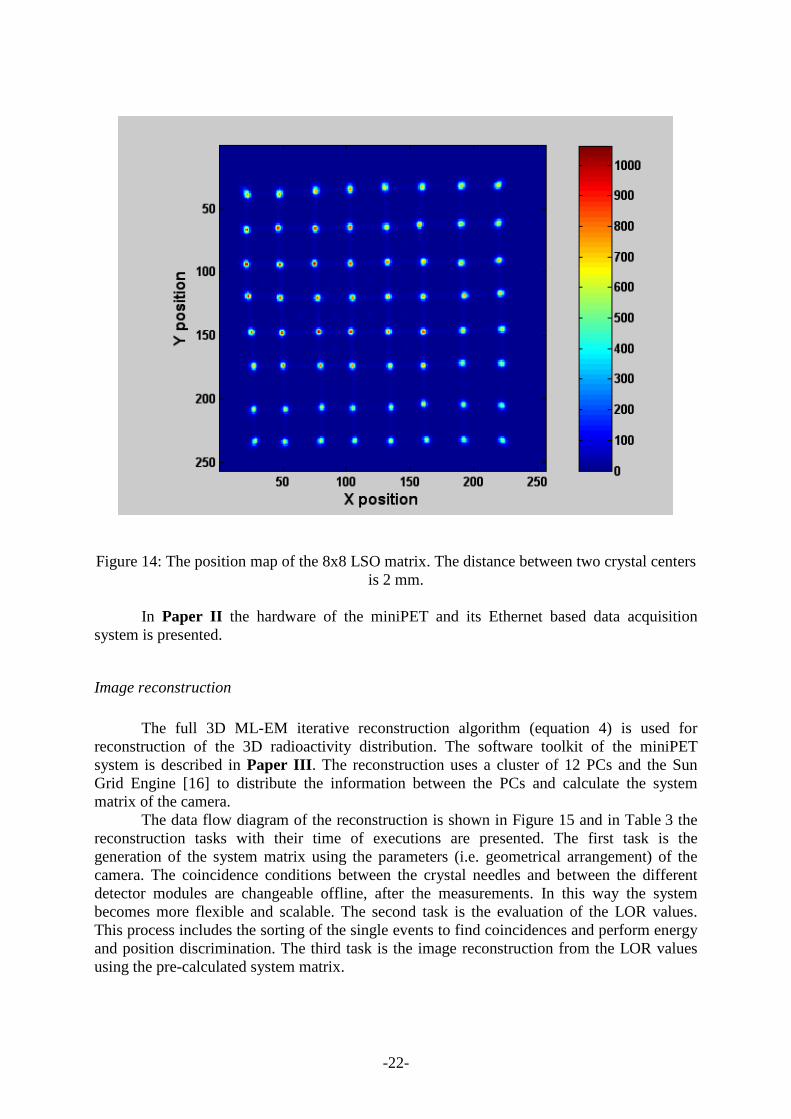
The miniPET events are stored in list mode and their processing consists of several steps. First the crystal location index and the signal amplitude for energy discrimination have to be calculated. The positions of the incoming photons are calculated from the Anger signals using the Anger logic discussed earlier (see equation 1). A typical position map of a uniformly irradiated detector block is shown in Figure 14. Each spot corresponds to one crystal needle. The evaluation of events in the line of response (LOR – the volume between two opposite crystal needles) is based on the topological information and the offline coincidence sorting. The coincidence time window is changeable between 2-20 ns. After the evaluation of coincidence events, the random correction is performed. The final tasks are the image reconstruction and the attenuation correction.
-21-
Figure 13: The photo of the miniPET with the 4 detector modules (labeled 1-4) and the
drawing indicating the applied coordinate system.
X
Y
Z
+
-22-
Figure 14: The position map of the 8x8 LSO matrix. The distance between two crystal centers is 2 mm.
In Paper II the hardware of the miniPET and its Ethernet based data acquisition
system is presented.
Image reconstruction
The full 3D ML-EM iterative reconstruction algorithm (equation 4) is used for
reconstruction of the 3D radioactivity distribution. The software toolkit of the miniPET system is described in Paper III. The reconstruction uses a cluster of 12 PCs and the Sun Grid Engine [16] to distribute the information between the PCs and calculate the system matrix of the camera.
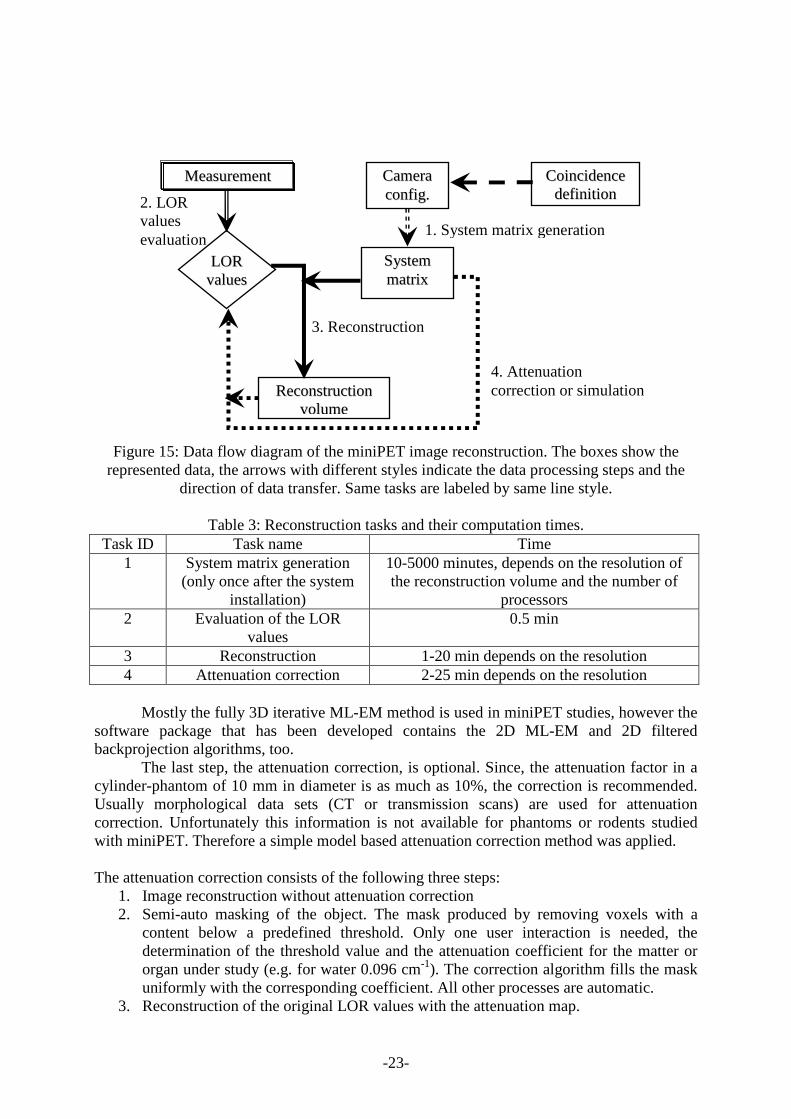
The data flow diagram of the reconstruction is shown in Figure 15 and in Table 3 the reconstruction tasks with their time of executions are presented. The first task is the generation of the system matrix using the parameters (i.e. geometrical arrangement) of the camera. The coincidence conditions between the crystal needles and between the different detector modules are changeable offline, after the measurements. In this way the system becomes more flexible and scalable. The second task is the evaluation of the LOR values. This process includes the sorting of the single events to find coincidences and perform energy and position discrimination. The third task is the image reconstruction from the LOR values using the pre-calculated system matrix.
-23-
Figure 15: Data flow diagram of the miniPET image reconstruction. The boxes show the represented data, the arrows with different styles indicate the data processing steps and the
direction of data transfer. Same tasks are labeled by same line style.
Table 3: Reconstruction tasks and their computation times. Task ID Task name Time
1 System matrix generation (only once after the system
installation)
10-5000 minutes, depends on the resolution of the reconstruction volume and the number of
processors 2 Evaluation of the LOR
values 0.5 min
3 Reconstruction 1-20 min depends on the resolution 4 Attenuation correction 2-25 min depends on the resolution
Mostly the fully 3D iterative ML-EM method is used in miniPET studies, however the
software package that has been developed contains the 2D ML-EM and 2D filtered backprojection algorithms, too.
The last step, the attenuation correction, is optional. Since, the attenuation factor in a cylinder-phantom of 10 mm in diameter is as much as 10%, the correction is recommended. Usually morphological data sets (CT or transmission scans) are used for attenuation correction. Unfortunately this information is not available for phantoms or rodents studied with miniPET. Therefore a simple model based attenuation correction method was applied.
The attenuation correction consists of the following three steps:
1. Image reconstruction without attenuation correction 2. Semi-auto masking of the object. The mask produced by removing voxels with a
content below a predefined threshold. Only one user interaction is needed, the determination of the threshold value and the attenuation coefficient for the matter or organ under study (e.g. for water 0.096 cm-1). The correction algorithm fills the mask uniformly with the corresponding coefficient. All other processes are automatic.
3. Reconstruction of the original LOR values with the attenuation map.
4. Attenuation correction or simulation
3. Reconstruction
CCaammeerraa ccoonnff iigg..
SSyysstteemm mmaattrriixx
1. System matrix generation
MMeeaassuurreemmeenntt
LLOORR vvaalluueess
CCooiinncciiddeennccee ddeeff iinnii ttiioonn 2. LOR
values evaluation
RReeccoonnssttrruuccttiioonn vvoolluummee
-24-
Test and performance measurements
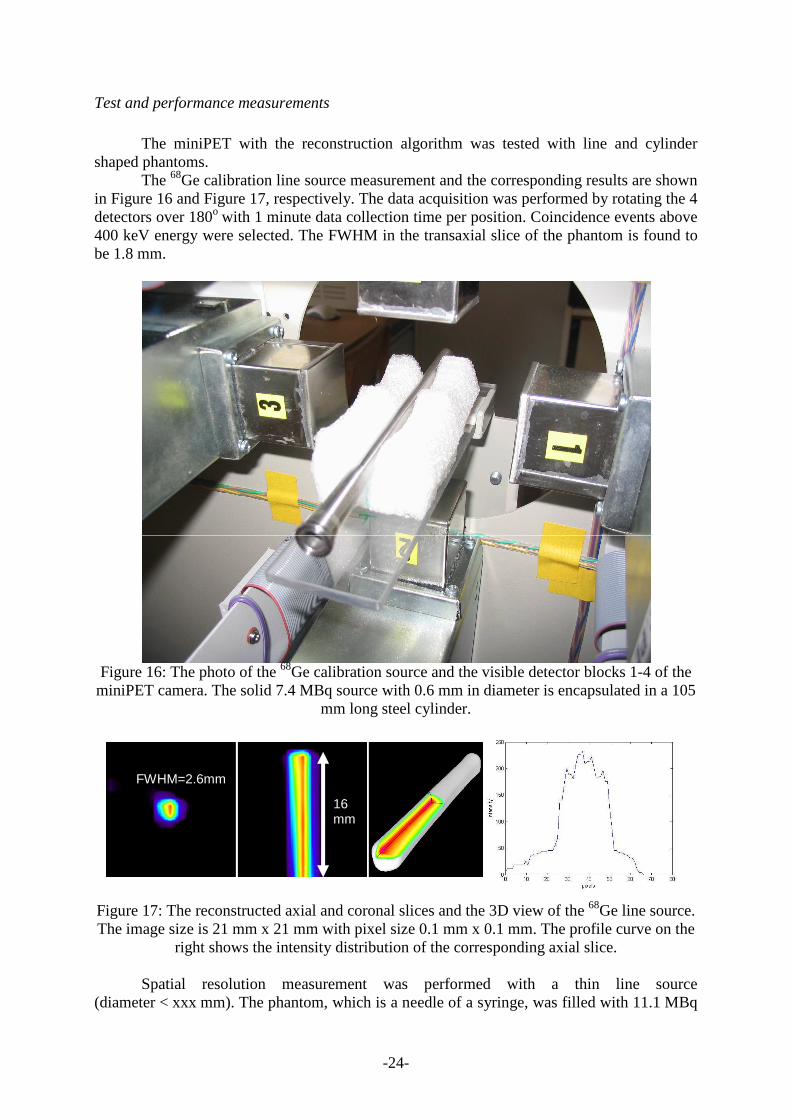
The miniPET with the reconstruction algorithm was tested with line and cylinder
shaped phantoms. The 68Ge calibration line source measurement and the corresponding results are shown
in Figure 16 and Figure 17, respectively. The data acquisition was performed by rotating the 4 detectors over 180o with 1 minute data collection time per position. Coincidence events above 400 keV energy were selected. The FWHM in the transaxial slice of the phantom is found to be 1.8 mm.
Figure 16: The photo of the 68Ge calibration source and the visible detector blocks 1-4 of the miniPET camera. The solid 7.4 MBq source with 0.6 mm in diameter is encapsulated in a 105
mm long steel cylinder.
Figure 17: The reconstructed axial and coronal slices and the 3D view of the 68Ge line source. The image size is 21 mm x 21 mm with pixel size 0.1 mm x 0.1 mm. The profile curve on the
right shows the intensity distribution of the corresponding axial slice.
Spatial resolution measurement was performed with a thin line source (diameter < xxx mm). The phantom, which is a needle of a syringe, was filled with 11.1 MBq
FWHM=2.6mm
16 mm
-25-
0
0,5
1
1,5
2
2,5
0 1 2 3 4 5 6 7
Distance from the center of FOV (mm)
Sp
atia
l res
olu
tio
n (
mm
)
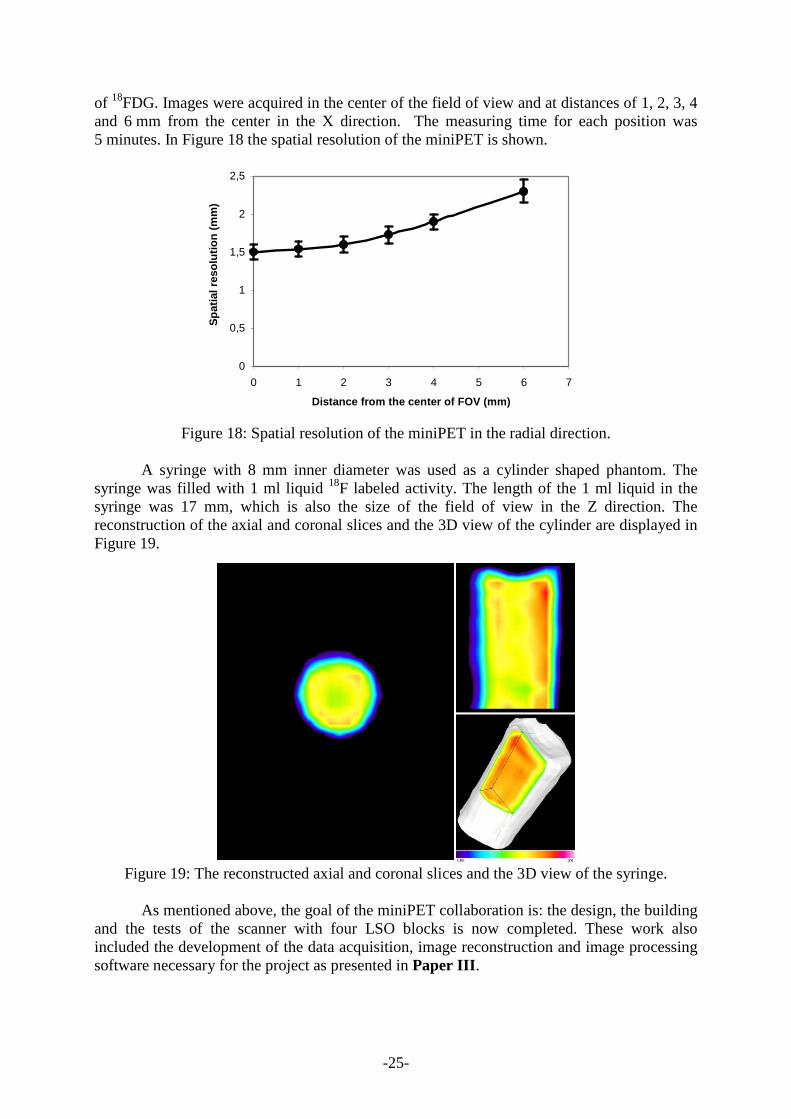
of 18FDG. Images were acquired in the center of the field of view and at distances of 1, 2, 3, 4 and 6 mm from the center in the X direction. The measuring time for each position was 5 minutes. In Figure 18 the spatial resolution of the miniPET is shown.
Figure 18: Spatial resolution of the miniPET in the radial direction.
A syringe with 8 mm inner diameter was used as a cylinder shaped phantom. The
syringe was filled with 1 ml liquid 18F labeled activity. The length of the 1 ml liquid in the syringe was 17 mm, which is also the size of the field of view in the Z direction. The reconstruction of the axial and coronal slices and the 3D view of the cylinder are displayed in Figure 19.
Figure 19: The reconstructed axial and coronal slices and the 3D view of the syringe.
As mentioned above, the goal of the miniPET collaboration is: the design, the building and the tests of the scanner with four LSO blocks is now completed. These work also included the development of the data acquisition, image reconstruction and image processing software necessary for the project as presented in Paper III.
-26-
Paper IV: Cardiotom, a dedicated gamma camera for myocardial heart studies
The Cardiotom system [17] has been introduced earlier, but its performance was lacking in the areas of data acquisition speed and image reconstruction capabilities. The aim of the present work was to replace the Cardiotom hardware with high performance fast electronics and develop new dedicated software for data acquisition and image reconstruction.
The Cardiotom system is a mobile gamma camera for 3D imaging. It is based on Ectomography, which is an alternative method to SPECT. Ectomography [4][18], has been developed and implemented in the Cardiotom systems at the Medical Engineering Division of the Karolinska Institute. The system has been designed to provide a tomographic unit that can be used bedside, when it is not possible to move a patient to the department equipped with standard SPECT. Indeed, the Cardiotom suits the emergency environment thanks to its relative small size and simplicity compared to SPECT systems. The device is designed for early diagnosis of myocardial and cerebral infarction studies in the emergency room [19].
The Cardiotom uses the limited view-angle technique of Ectomography and a slant hole rotating collimator [20] to perform tomographic imaging (earlier shown in Figure 3b). In SPECT, the direction of the collimator holes is perpendicular to the axis of rotation, whereas in ectomography, this angle is less than 90 degree. Hence, the camera can be positioned very close to the patient (approximately 10 mm).
Ectomography, however, is a limited view angle tomography technique and the common volume in all projections will therefore constitute a double cone under the collimator (cf. Figure 4b). This implies that a part of the volume (which is outside the double cone) will not be covered by all the projections. The missing data will cause some arte facts in the reconstructed volume. The drawing of a typical myocardial imaging device with a rotating slant hole collimator is shown in Figure 3b in comparison with the traditional SPECT in Figure 3a.
Two versions of Cardiotom systems were built in the end of 1990s. In the present project, as mentioned above, the camera hardware is replaced. The original mechanics with the rotating collimator, the camera head with the PMTs and the crystal were the only part of the old systems that remained untouched.
Segmented collimators
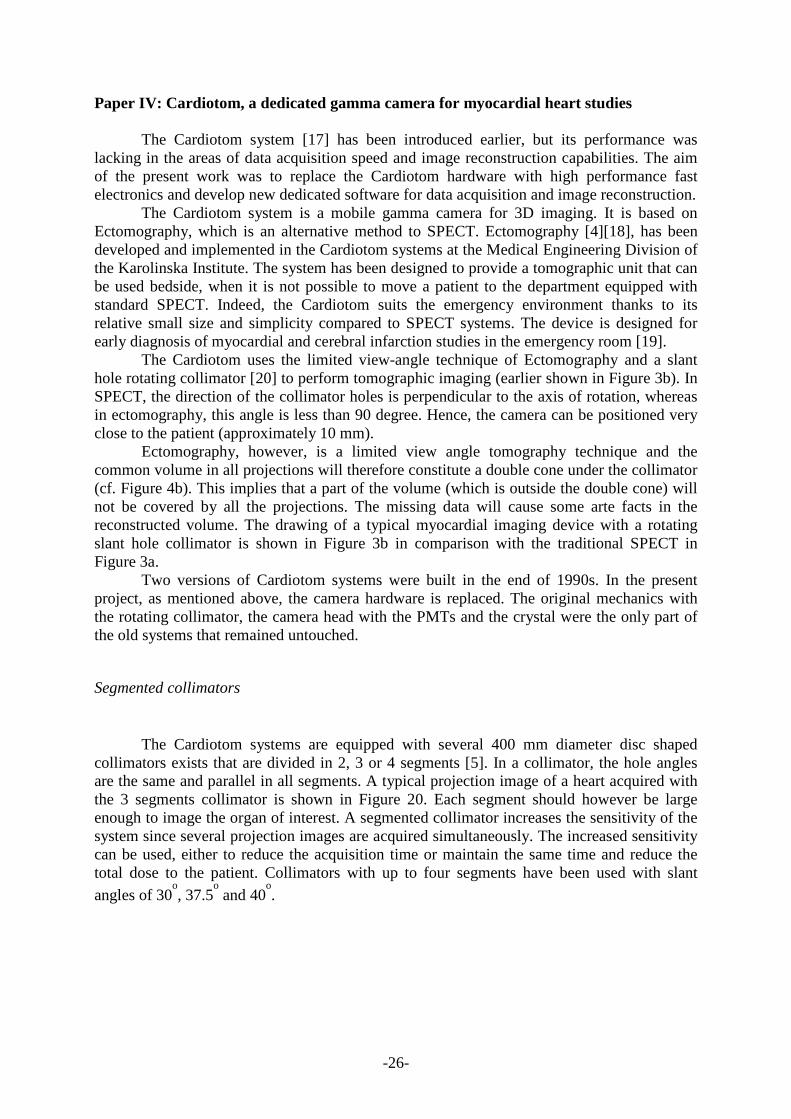
The Cardiotom systems are equipped with several 400 mm diameter disc shaped collimators exists that are divided in 2, 3 or 4 segments [5]. In a collimator, the hole angles are the same and parallel in all segments. A typical projection image of a heart acquired with the 3 segments collimator is shown in Figure 20. Each segment should however be large enough to image the organ of interest. A segmented collimator increases the sensitivity of the system since several projection images are acquired simultaneously. The increased sensitivity can be used, either to reduce the acquisition time or maintain the same time and reduce the total dose to the patient. Collimators with up to four segments have been used with slant
angles of 30o, 37.5
o and 40
o.
-27-
Figure 20: A typical projection image of the heart using the three segments collimator. The
heart is located in the center of each segment.
The new hardware
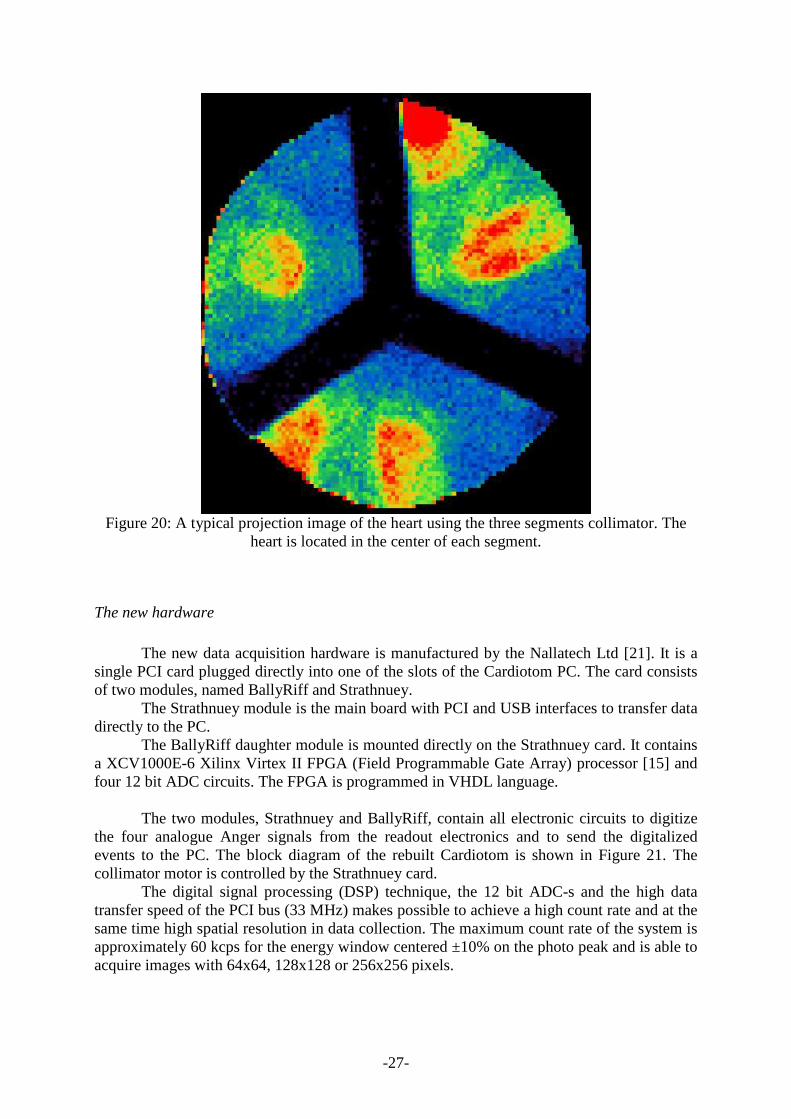
The new data acquisition hardware is manufactured by the Nallatech Ltd [21]. It is a
single PCI card plugged directly into one of the slots of the Cardiotom PC. The card consists of two modules, named BallyRiff and Strathnuey.
The Strathnuey module is the main board with PCI and USB interfaces to transfer data directly to the PC.
The BallyRiff daughter module is mounted directly on the Strathnuey card. It contains a XCV1000E-6 Xilinx Virtex II FPGA (Field Programmable Gate Array) processor [15] and four 12 bit ADC circuits. The FPGA is programmed in VHDL language.
The two modules, Strathnuey and BallyRiff, contain all electronic circuits to digitize
the four analogue Anger signals from the readout electronics and to send the digitalized events to the PC. The block diagram of the rebuilt Cardiotom is shown in Figure 21. The collimator motor is controlled by the Strathnuey card.
The digital signal processing (DSP) technique, the 12 bit ADC-s and the high data transfer speed of the PCI bus (33 MHz) makes possible to achieve a high count rate and at the same time high spatial resolution in data collection. The maximum count rate of the system is approximately 60 kcps for the energy window centered ±10% on the photo peak and is able to acquire images with 64x64, 128x128 or 256x256 pixels.
-28-
Figure 21: The block schema of the rebuilt Cardiotom. The entire signal processing
electronics is plugged directly into the PC. The high voltage power supply and the collimator control units are located outside the computer. The camera head contains only the scintillation crystal, the PMTs and the analogue Anger logic. The four Anger signals are connected to the
ADC inputs of the Nallatech card.
The data acquisition and reconstruction software
In addition to fast data acquisition it is equally necessary to have a fast and reliable image reconstruction. The newly developed fully 3D iterative ML-EM method (see Paper III) is able to reconstruct the 3D volume from the usually acquired 12-20 projections (128x128 pixels) in less than 5 minutes. The time of data acquisition is proportional to the number of collimator positions. The total process from the start of the data collection to the display of the reconstructed 3D volume takes about 10 minutes with 20 angles and 30 seconds per frame. The new data acquisition and reconstruction software runs on a 3.4 GHz PC. The software is implemented in C++, which merges the support of high computation performance, code optimizations and easy visualization toolkits.
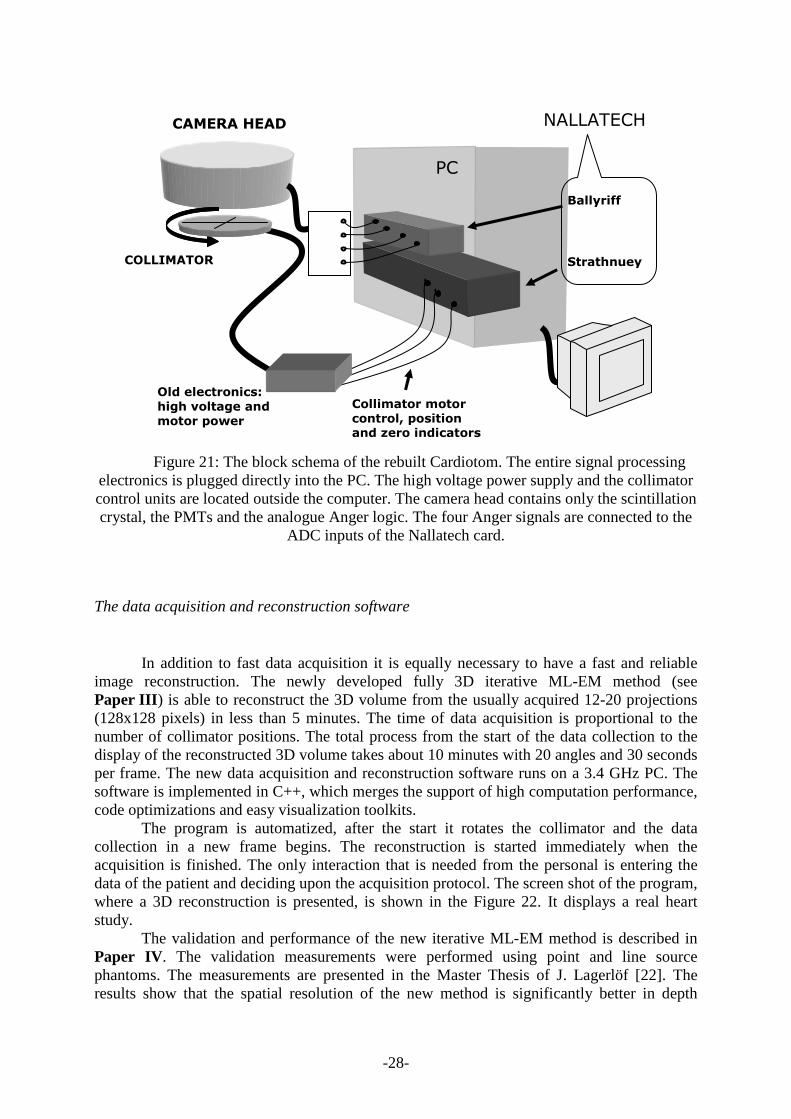
The program is automatized, after the start it rotates the collimator and the data collection in a new frame begins. The reconstruction is started immediately when the acquisition is finished. The only interaction that is needed from the personal is entering the data of the patient and deciding upon the acquisition protocol. The screen shot of the program, where a 3D reconstruction is presented, is shown in the Figure 22. It displays a real heart study.
The validation and performance of the new iterative ML-EM method is described in Paper IV. The validation measurements were performed using point and line source phantoms. The measurements are presented in the Master Thesis of J. Lagerlöf [22]. The results show that the spatial resolution of the new method is significantly better in depth
Collimator motor
control, position and zero indicators
Old electronics:
high voltage and
motor power
CAMERA HEAD
COLLIMATOR
PC
NALLATECH
Ballyriff
Strathnuey
-29-
resolution and is equally in the in-slice resolution compared to the formerly used filtered backprojection.
Figure 22: The main window of the data acquisition and reconstruction program of the
Cardiotom. It shows the reconstructed heart of a real patient. Axial slice, vertical long axis (VLA) and horizontal long axis (HLA) of the heart are displayed.
Two available Cardiotom systems were modernized and new software is installed.
More than twenty patients were participating in a Cardiotom vs. SPECT comparative study using the new system. The data is still in the phase of analysis but the results obtained so far are promising. The performance measurements and the installation of a 3D heart phantom are in progress.
Further plans are to include software tools to facilitate positioning and also synchronize ECG signals to the Cardiotom system for performing dynamic and gated data acquisition measurements.
-30-
Description of my own contribution to the papers included in this Licenciate Thesis Paper I KTH gamma camera
The gamma camera is the latest imaging system that has been added to the KTH laboratory for courses in medical imaging. The camera is also used to demonstrate 3D, SPECT, imaging by collecting 2D projections from a rotatable cylindrical phantom.
I have developed the data acquisition and image reconstruction software based on Filtered Backprojection written in C++, using the QT library for GUI development.
Papers II and III The miniPET
The miniPET project is now completed. My work in the part of the project, presented in Paper III, was the development and implementation of the fully 3D iterative ML-EM algorithm for image reconstruction. I have participated in the test measurements and in the validation and interpretation of the reconstructed images. I assisted during the whole software development of the miniPET, such as GUI design and implementation of the presentation program and algorithm implementation for image processing (e.g. image transformation, interpolation).
Paper II describes the hardware of the miniPET camera, wherein I helped in the phantom measurements, reconstruction and interpretation of the reconstructed images.
The miniPET camera is in use at the PET Center of Debrecen and serves as a test bench for phantom measurements. Paper IV Cardiotom
The Cardiotom with the present development of hardware and software is sufficiently
fast imaging device for acute heart studies. The high performance data acquisition with the DSP technique and the fast fully 3D iterative image reconstruction method improved the spatial resolution and sensitivity of the system. Image arte facts and noise are reduced, too.
My contribution to the revival of the Cardiotom project was the development of the data acquisition, reconstruction and presentation software. I have invented a new reconstruction method based on the fully 3D ML-EM algorithm and installed this software in the Cardiotom system.
The system as it works to-day can provide images for interpretation within 15 minutes from the start of the examination.
-31-
References
[1] H.O. Anger: Use of a Gamma-Ray Camera for in vivo Studies. Nature, August 2, 1952
[2] H.O. Anger: Scintillation Camera, The review of Scientific Instruments. Vol. 29,
No.1, January, 1958
[3] T. Back, J. Cederkall, B. Cederwall, A. Johnson, A. Kerek, W. Klamra, J. van der Marel, J. Molnar, D. Novak, D. Sohler, M. Steen, P. Uhlen: An educational tool for demonstrating the TOF-PET technique. Nuclear Instruments and Methods in Physics Research A471 (2001) 200–204
[4] S. Dale: ECTOMOGRAPHY - Theory and Implementation in Gamma Camera
Imaging Department of Medical Engineering, Karolinska Institute and Department of Clinical Physiology, Thoracic Clinics, Karolinska Hospital; 1989
[5] C. Lindström, D. Bone, S. Dale, L. Jorfeldt, H. Elmqvist: Collimator design for
myocardial perfusion studies with ectomography. J Nucl. Med. 1996;37:208P.
[6] J. Humm et al, Eu. Journal of Nuclear Med. and Mol. Imag, 30 (2003) 1576 [7] A.C. Kak, M. Slaney: Principles of Computerized Tomographic Imaging.
Philadelphia, Society for Industrial and Applied Mathematics; 2001 [8] L. Shepp and Y. Vardi: Maximum Likelihood Reconstruction in Positron Emission
Tomography. IEEE Trans. Med. Imaging 1 (1982), 113-122
[9] X-ray Imaging with Wire Chamber: KTH Particle Physics laboratory exercise, 2006
[10] T. Claesson, A. Kerek, D. Novák, J. Molnár: A CT demonstrator based on a CZT solid state detector. Nuclear and Instruments and Methods A487 (2002) 202-208
[11] T. Jonasson: Revival of a Gamma Camera. Master of Science Thesis, Royal Institute
of Technology, Stockholm 2003
[12] Development of an FPGA-based data acquisition module for small animal PET scanner, Gy. Hegyesi, J. Imrek, G. Kalinka, J. Molnár, D. Novák, J. Végh, L. Balkay, M. Emri, G. Molnár, L. Trón, I. Bagaméry, T. Bükki, S. Rózsa, Zs. Szabó, A. Kerek, IEEE Trans. Nucl. Sci., accepted for publication.
[13] S.A. Kis, I. Valastyan, Gy. Hegyesi, J. Imrek, G. Kalinka, J. Molnar, D. Novak, J.
Vegh, L. Balkay, M. Emri, G. Molnar, I. Bagamery, T. Bukki, S. Rozsa, Zs. Szabo, A. Kerek, L. Tron: Performance Characteristics of a miniPET Scanner Dedicated to Small Animal Imaging. IEEE NSS-MIC Conference, 23-29 Oct. 2005, Puerto Rico
[14] Hamamatsu Ltd.: http://www.hamamatsu.com
[15] http://www.xilinx.com/products/logicore/alliance/4i2i/4i2i_JPEG_Decoder.pdf
-32-
[16] http://gridengine.sunsource.net [17] M. Persson: Development of a Mobile Tomographic Gamma Camera Based on
Ectomography – Cardiotom. Department of Medical Laboratory Sciences and Technology, Division of Medical Engineering, Karolinska Institute; 2001
[18] S. Dale, P.E. Edholm, L.G. Hellstrom, S. Larsson: Ectomography - a tomographic
method for gamma camera imaging. Phys. Med. Biol., 1985, Vol. 30, No. 11, 1237-1249.
[19] S. Dale, M. Holmberg, H. Larsson, M. Persson, T. Ribbe, H. Elmqvist, D. Bone, L-Å
Brodin, C. Lindström, L. Jorfeldt: A mobile tomographic gamma camera system for acute studies. IEEE Trans. Nucl. Sci. 1997;44:199-203.
[20] S. Dale, D. Bone: Tomography using a rotating slant hole collimator and a large
number of projections. J. Nucl. Med. 1990, 31, 1675-1681. [21] Nallatech Ltd.: www.nallatech.com
[22] J. Lagerlöf: Validation of a new iterative reconstruction algorithm for the Cardiotom,
Master Thesis, Karolinska Institute, 2006

-33-
Acknowledgment
I wish to express my gratitude to everyone who made this thesis possible. I would like to express my deep gratitude to my nice supervisor Professor Andras Kerek at the Department of Nuclear Physics, KTH, who guided me in the research. I am very grateful to him for great help, fruitful discussions and ideas contributing this work and to my knowledge. Sincere thanks also to Dianna Bone and Hakan Elmquist at the Karolinska Institute who have been supporting and helping the Cardiotom project. I am also grateful to Arne Johnson, the head of the Nuclear Physics group, for reading my thesis and also for the staff who creating a friendly atmosphere.
Many thanks to my nice boss, József Molnár, to my colleague, Dezsı Novák, and all of my colleagues in the Electronics Department at the ATOMKI in Debrecen, Hungary for the designing the new electronics of the Gamma Camera, the miniPET, the Cardiotom and for the support of this thesis.
A special thanks to all of my family, especially my wife and my parents.


